Embed Size (px)
Citation preview
KHATIB ET AL . VOL. 9 ’ NO. 8 ’ 7968–7975 ’ 2015
www.acsnano.org
7968
July 30, 2015
C 2015 American Chemical Society
Graphene-Based Platform for InfraredNear-Field Nanospectroscopy ofWaterand Biological Materials in an AqueousEnvironmentOmar Khatib,*,†,‡ Joshua D. Wood,z,§, ),^ Alexander S. McLeod,† Michael D. Goldflam,† Martin Wagner,†
Gregory L. Damhorst,^,# Justin C. Koepke,§, ),^ Gregory P. Doidge,§, ),^ Aniruddh Rangarajan,§, ),^
Rashid Bashir,§,^,# Eric Pop,0 Joseph W. Lyding,§, ),^ Mark H. Thiemens,4 Fritz Keilmann,r and D. N. Basov†
†Department of Physics and 4Department of Chemistry and Biochemistry, University of California, San Diego, La Jolla, California 92093, United States, ‡Departmentof Physics, Department of Chemistry, and JILA, University of Colorado, Boulder, Colorado 80309, United States, zDepartment of Materials Science and Engineering,Northwestern University, Evanston, Illinois 60208, United States, §Department of Electrical and Computer Engineering, )Beckman Institute for Advanced Science andTechnology, ^Micro and Nanotechnology Laboratory, and #Department of Bioengineering, University of Illinois at Urbana�Champaign, Urbana, Illinois 61801,United States, 0Department of Electrical Engineering, Stanford University, Stanford, California 94305, United States, and rLudwig-Maximilians-Universität andCenter for Nanoscience, 80539 München, Germany
In biological and life sciences, Fouriertransform infrared (FTIR) spectroscopyserves as a ubiquitous noninvasive probe
of vibrational fingerprints used to identifychemical compounds andmolecular species.1
This information is the basis for nonpertur-bative and label-free analysis of cell func-tionality.2 For example, small changes infrequencies and line shapes of IR absorptionbands due to specific proteins or proteinconformations can be used to characterizecells and tissues linked to diseases such asAlzheimer's3 and cancer.1,4 Detailed data-bases documentmolecular absorption bandsof biologically relevant systems,1 whereaselaborate data processing schemes striveto minimize confounding effects associatedwith the exploration of realistic biologicalmaterials.2 Despite the widespread use of
FTIR spectroscopy and microscopy in bio-logical sciences, these experimental methodssuffer from a number of fundamental short-comings. With a typical IR absorption co-efficient for molecules of ca. 1000 cm�1,aggregates of ∼1 μm depth are needed toassess the spectral features of biologicalsystems.5 Further, in vivo studies of thesesystems require characterization in an aqu-eous environment. However, the strongabsorption from the vibrational and rota-tional modes of liquid water presents a largeundesirable background, alleviated in somecases by substitution of deuterium oxideand/or specially prepared buffers.6 Lastly, thelong wavelength of IR light represents a limitto spatial resolution imposed by diffractionand thusdoesnot allow for characterizationofany subcellular components individually.
* Address correspondence [email protected].
Received for review February 21, 2015and accepted July 29, 2015.
Published online10.1021/acsnano.5b01184
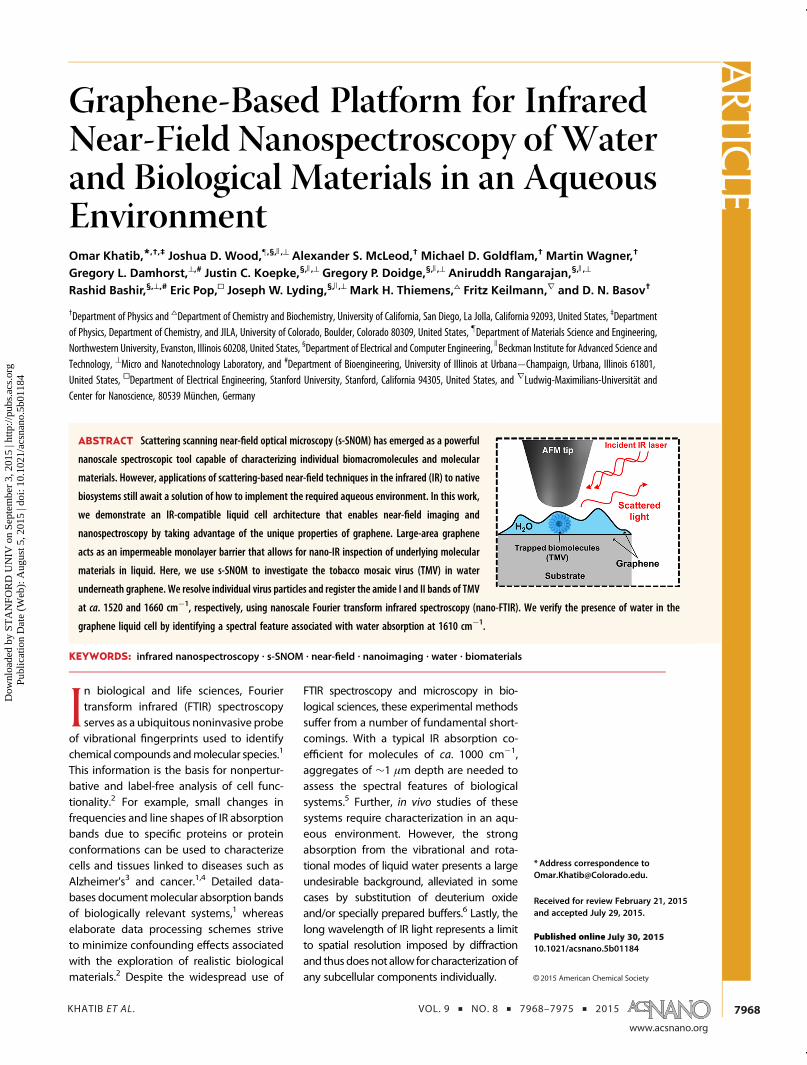
ABSTRACT Scattering scanning near-field optical microscopy (s-SNOM) has emerged as a powerful
nanoscale spectroscopic tool capable of characterizing individual biomacromolecules and molecular
materials. However, applications of scattering-based near-field techniques in the infrared (IR) to native
biosystems still await a solution of how to implement the required aqueous environment. In this work,
we demonstrate an IR-compatible liquid cell architecture that enables near-field imaging and
nanospectroscopy by taking advantage of the unique properties of graphene. Large-area graphene
acts as an impermeable monolayer barrier that allows for nano-IR inspection of underlying molecular
materials in liquid. Here, we use s-SNOM to investigate the tobacco mosaic virus (TMV) in water
underneath graphene. We resolve individual virus particles and register the amide I and II bands of TMV
at ca. 1520 and 1660 cm�1, respectively, using nanoscale Fourier transform infrared spectroscopy (nano-FTIR). We verify the presence of water in the
graphene liquid cell by identifying a spectral feature associated with water absorption at 1610 cm�1.
KEYWORDS: infrared nanospectroscopy . s-SNOM . near-field . nanoimaging . water . biomaterials
ARTIC
LE
Dow
nloa
ded
by S
TA
NFO
RD
UN
IV o
n Se
ptem
ber
3, 2
015
| http
://pu
bs.a
cs.o
rg
Pub
licat
ion
Dat
e (W
eb):
Aug
ust 5
, 201
5 | d
oi: 1
0.10
21/a
csna
no.5
b011
84
KHATIB ET AL . VOL. 9 ’ NO. 8 ’ 7968–7975 ’ 2015
www.acsnano.org
7969
Scattering scanning near-field optical microscopy(s-SNOM) allows for the collection of IR spectra frompixels as small as 10 � 10 nm2, irrespective of theinfrared wavelength involved.7 In an s-SNOM appara-tus, the diffraction limit is circumvented by combiningthe use of an atomic force microscope (AFM) with IRlasers enabling near-field imaging.8�10 Incident lightilluminates the sharp conducting tip in the vicinity ofa sample. Scattered light from the coupled tip�samplesystem is detected in the far field and carries dielectricinformation from the local near-field interaction.The incident field is highly confined to the tip apex,resulting in an IR or optical probe with spatial resolu-tion limited only by the tip diameter and not by thewavelength. Couplingmonochromatic light to s-SNOMallows acquisition of single-frequency near-field images,while use of a broadband coherent source11 enablesnanoscale Fourier-transform IR spectroscopy (nano-FTIR).12�14
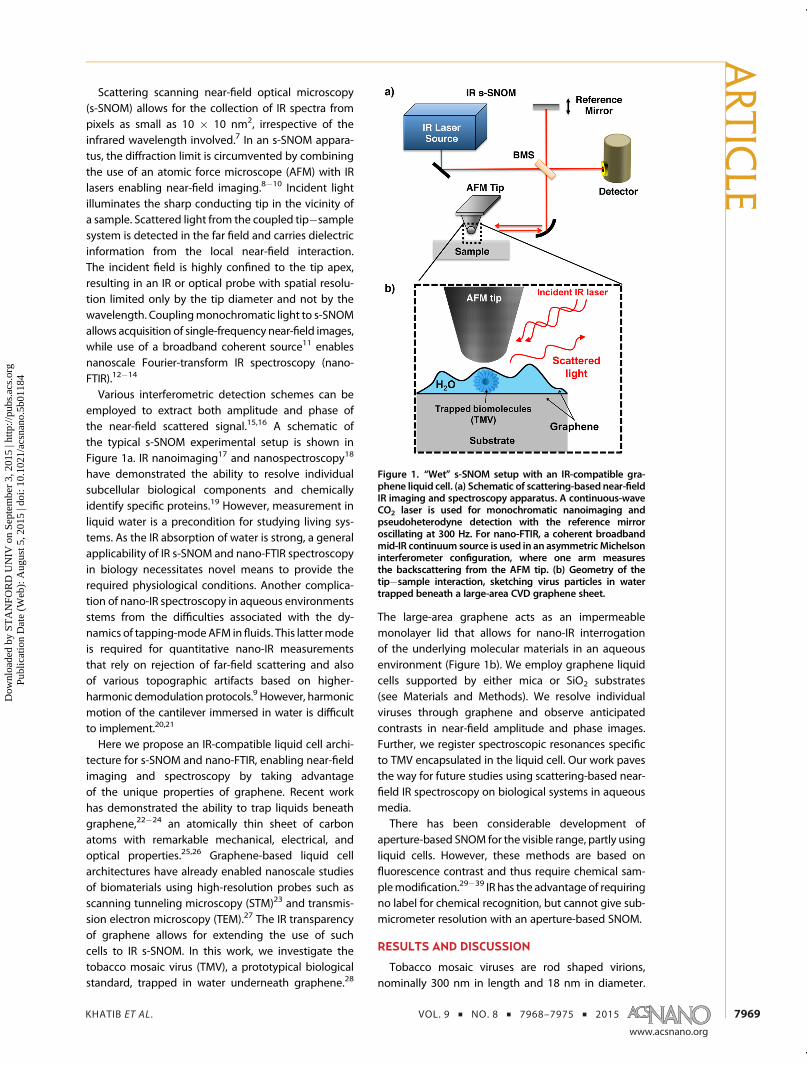
Various interferometric detection schemes can beemployed to extract both amplitude and phase ofthe near-field scattered signal.15,16 A schematic ofthe typical s-SNOM experimental setup is shown inFigure 1a. IR nanoimaging17 and nanospectroscopy18
have demonstrated the ability to resolve individualsubcellular biological components and chemicallyidentify specific proteins.19 However, measurement inliquid water is a precondition for studying living sys-tems. As the IR absorption of water is strong, a generalapplicability of IR s-SNOM and nano-FTIR spectroscopyin biology necessitates novel means to provide therequired physiological conditions. Another complica-tion of nano-IR spectroscopy in aqueous environmentsstems from the difficulties associated with the dy-namics of tapping-modeAFM in fluids. This lattermodeis required for quantitative nano-IR measurementsthat rely on rejection of far-field scattering and alsoof various topographic artifacts based on higher-harmonic demodulation protocols.9 However, harmonicmotion of the cantilever immersed in water is difficultto implement.20,21
Here we propose an IR-compatible liquid cell archi-tecture for s-SNOM and nano-FTIR, enabling near-fieldimaging and spectroscopy by taking advantageof the unique properties of graphene. Recent workhas demonstrated the ability to trap liquids beneathgraphene,22�24 an atomically thin sheet of carbonatoms with remarkable mechanical, electrical, andoptical properties.25,26 Graphene-based liquid cellarchitectures have already enabled nanoscale studiesof biomaterials using high-resolution probes such asscanning tunneling microscopy (STM)23 and transmis-sion electron microscopy (TEM).27 The IR transparencyof graphene allows for extending the use of suchcells to IR s-SNOM. In this work, we investigate thetobacco mosaic virus (TMV), a prototypical biologicalstandard, trapped in water underneath graphene.28
The large-area graphene acts as an impermeablemonolayer lid that allows for nano-IR interrogationof the underlying molecular materials in an aqueousenvironment (Figure 1b). We employ graphene liquidcells supported by either mica or SiO2 substrates(see Materials and Methods). We resolve individualviruses through graphene and observe anticipatedcontrasts in near-field amplitude and phase images.Further, we register spectroscopic resonances specificto TMV encapsulated in the liquid cell. Our work pavesthe way for future studies using scattering-based near-field IR spectroscopy on biological systems in aqueousmedia.There has been considerable development of
aperture-based SNOM for the visible range, partly usingliquid cells. However, these methods are based onfluorescence contrast and thus require chemical sam-plemodification.29�39 IR has the advantage of requiringno label for chemical recognition, but cannot give sub-micrometer resolution with an aperture-based SNOM.
RESULTS AND DISCUSSION
Tobacco mosaic viruses are rod shaped virions,nominally 300 nm in length and 18 nm in diameter.
Figure 1. “Wet” s-SNOM setup with an IR-compatible gra-phene liquid cell. (a) Schematic of scattering-based near-fieldIR imaging and spectroscopy apparatus. A continuous-waveCO2 laser is used for monochromatic nanoimaging andpseudoheterodyne detection with the reference mirroroscillating at 300 Hz. For nano-FTIR, a coherent broadbandmid-IR continuum source is used in an asymmetric Michelsoninterferometer configuration, where one arm measuresthe backscattering from the AFM tip. (b) Geometry of thetip�sample interaction, sketching virus particles in watertrapped beneath a large-area CVD graphene sheet.
ARTIC
LE
Dow
nloa
ded
by S
TA
NFO
RD
UN
IV o
n Se
ptem
ber
3, 2
015
| http
://pu
bs.a
cs.o
rg
Pub
licat
ion
Dat
e (W
eb):
Aug
ust 5
, 201
5 | d
oi: 1
0.10
21/a
csna
no.5
b011
84
KHATIB ET AL . VOL. 9 ’ NO. 8 ’ 7968–7975 ’ 2015
www.acsnano.org
7970
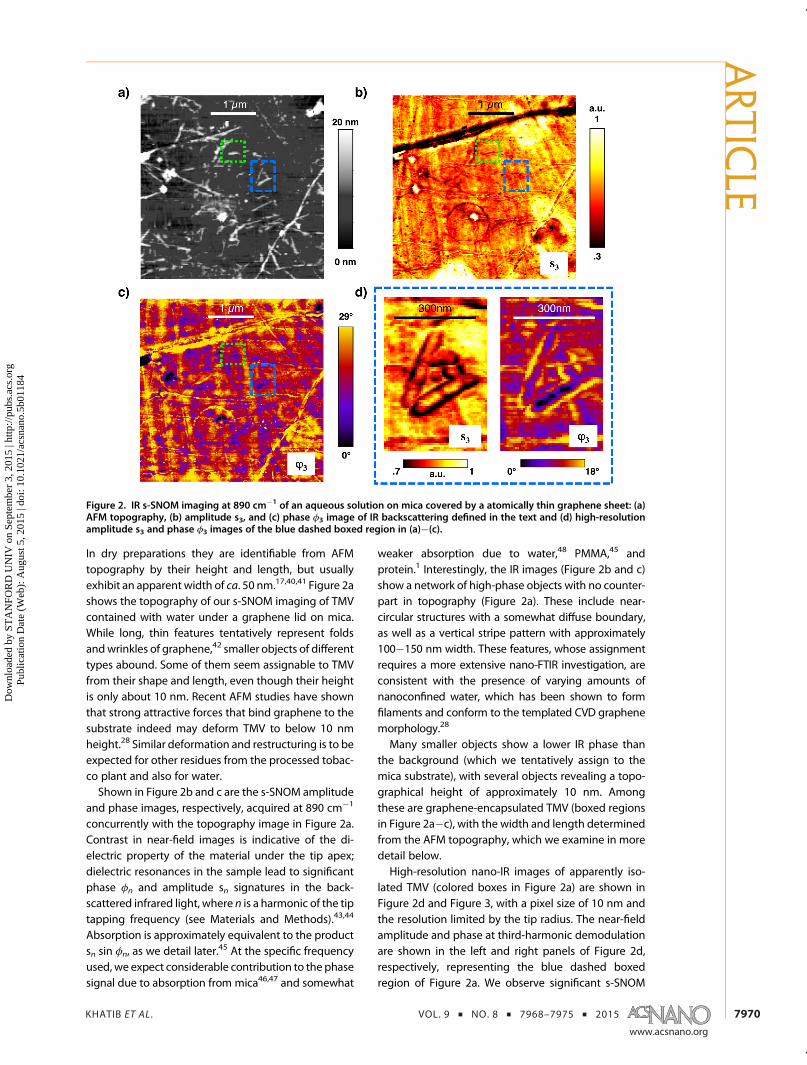
In dry preparations they are identifiable from AFMtopography by their height and length, but usuallyexhibit an apparent width of ca. 50 nm.17,40,41 Figure 2ashows the topography of our s-SNOM imaging of TMVcontained with water under a graphene lid on mica.While long, thin features tentatively represent foldsandwrinkles of graphene,42 smaller objects of differenttypes abound. Some of them seem assignable to TMVfrom their shape and length, even though their heightis only about 10 nm. Recent AFM studies have shownthat strong attractive forces that bind graphene to thesubstrate indeed may deform TMV to below 10 nmheight.28 Similar deformation and restructuring is to beexpected for other residues from the processed tobac-co plant and also for water.Shown in Figure 2b and c are the s-SNOM amplitude
and phase images, respectively, acquired at 890 cm�1
concurrently with the topography image in Figure 2a.Contrast in near-field images is indicative of the di-electric property of the material under the tip apex;dielectric resonances in the sample lead to significantphase φn and amplitude sn signatures in the back-scattered infrared light, where n is a harmonic of the tiptapping frequency (see Materials and Methods).43,44
Absorption is approximately equivalent to the productsn sin φn, as we detail later.45 At the specific frequencyused, we expect considerable contribution to the phasesignal due to absorption from mica46,47 and somewhat
weaker absorption due to water,48 PMMA,45 andprotein.1 Interestingly, the IR images (Figure 2b and c)show a network of high-phase objects with no counter-part in topography (Figure 2a). These include near-circular structures with a somewhat diffuse boundary,as well as a vertical stripe pattern with approximately100�150 nm width. These features, whose assignmentrequires a more extensive nano-FTIR investigation, areconsistent with the presence of varying amounts ofnanoconfined water, which has been shown to formfilaments and conform to the templated CVD graphenemorphology.28
Many smaller objects show a lower IR phase thanthe background (which we tentatively assign to themica substrate), with several objects revealing a topo-graphical height of approximately 10 nm. Amongthese are graphene-encapsulated TMV (boxed regionsin Figure 2a�c), with the width and length determinedfrom the AFM topography, which we examine in moredetail below.High-resolution nano-IR images of apparently iso-
lated TMV (colored boxes in Figure 2a) are shown inFigure 2d and Figure 3, with a pixel size of 10 nm andthe resolution limited by the tip radius. The near-fieldamplitude and phase at third-harmonic demodulationare shown in the left and right panels of Figure 2d,respectively, representing the blue dashed boxedregion of Figure 2a. We observe significant s-SNOM
Figure 2. IR s-SNOM imaging at 890 cm�1 of an aqueous solution on mica covered by a atomically thin graphene sheet: (a)AFM topography, (b) amplitude s3, and (c) phase φ3 image of IR backscattering defined in the text and (d) high-resolutionamplitude s3 and phase φ3 images of the blue dashed boxed region in (a)�(c).
ARTIC
LE
Dow
nloa
ded
by S
TA
NFO
RD
UN
IV o
n Se
ptem
ber
3, 2
015
| http
://pu
bs.a
cs.o
rg
Pub
licat
ion
Dat
e (W
eb):
Aug
ust 5
, 201
5 | d
oi: 1
0.10
21/a
csna
no.5
b011
84
KHATIB ET AL . VOL. 9 ’ NO. 8 ’ 7968–7975 ’ 2015
www.acsnano.org
7971
contrast in regions with TMV. While optical contrast inthe near-field scattering amplitude images can some-times be highly correlated with the surface topogra-phy, phase shifts are less susceptible to such effectsand in principle more sensitive to electronic reso-nances and vibrational absorptions.45 In addition, high-er-harmonic signal components are progressively lesssensitive to topographic artifacts, as a consequence ofthe highly nonlinear tip�sample near-field interaction.9
Interestingly, we also observe large contrast in theimmediate regions bordering TMV in both amplitudeand phase, indicating a variation in either the quantityor property of the water adjacent to the encapsulatedviruses. The lower phase values over the TMV suggestthat the dominant contribution to the near-field phasesignal originates from themica substrate or possibly thewater layer. We further discuss the origin of the near-field contrast surrounding the TMV later.Figure 3 shows several high-resolution s-SNOM
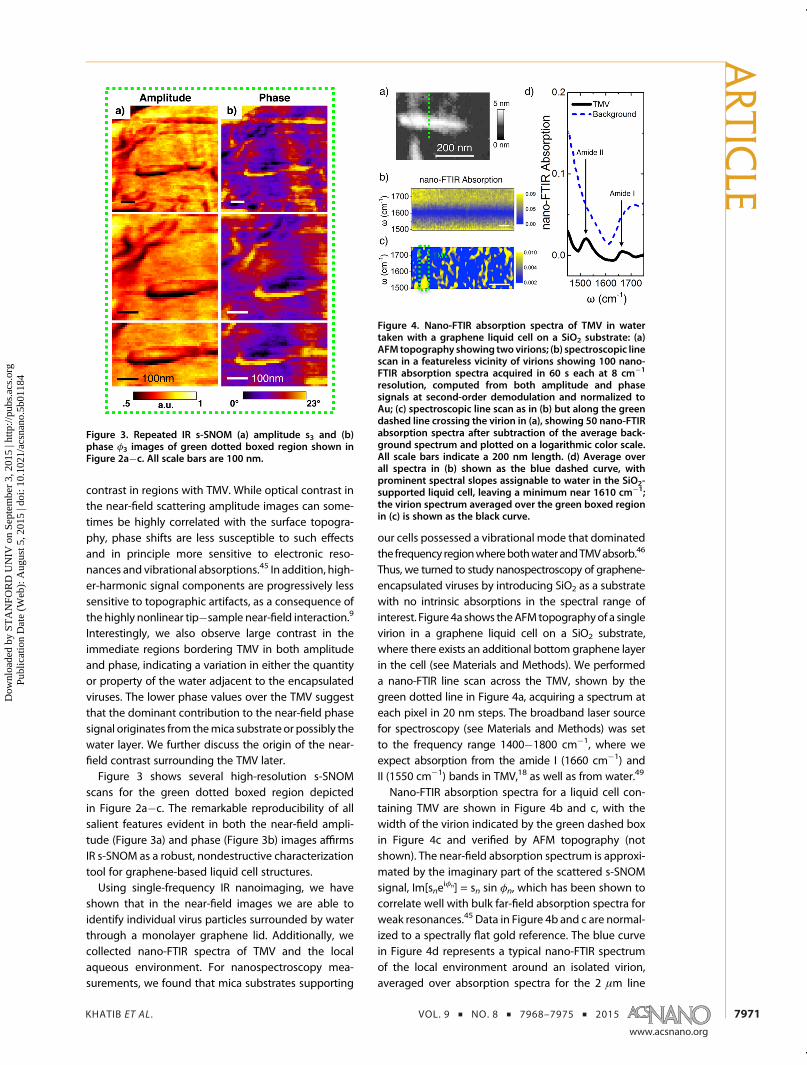
scans for the green dotted boxed region depictedin Figure 2a�c. The remarkable reproducibility of allsalient features evident in both the near-field ampli-tude (Figure 3a) and phase (Figure 3b) images affirmsIR s-SNOM as a robust, nondestructive characterizationtool for graphene-based liquid cell structures.Using single-frequency IR nanoimaging, we have
shown that in the near-field images we are able toidentify individual virus particles surrounded by waterthrough a monolayer graphene lid. Additionally, wecollected nano-FTIR spectra of TMV and the localaqueous environment. For nanospectroscopy mea-surements, we found that mica substrates supporting
our cells possessed a vibrational mode that dominatedthe frequency regionwherebothwater andTMVabsorb.46
Thus, we turned to study nanospectroscopy of graphene-encapsulated viruses by introducing SiO2 as a substratewith no intrinsic absorptions in the spectral range ofinterest. Figure 4a shows theAFMtopographyof a singlevirion in a graphene liquid cell on a SiO2 substrate,where there exists an additional bottom graphene layerin the cell (see Materials and Methods). We performeda nano-FTIR line scan across the TMV, shown by thegreen dotted line in Figure 4a, acquiring a spectrum ateach pixel in 20 nm steps. The broadband laser sourcefor spectroscopy (see Materials and Methods) was setto the frequency range 1400�1800 cm�1, where weexpect absorption from the amide I (1660 cm�1) andII (1550 cm�1) bands in TMV,18 as well as from water.49
Nano-FTIR absorption spectra for a liquid cell con-taining TMV are shown in Figure 4b and c, with thewidth of the virion indicated by the green dashed boxin Figure 4c and verified by AFM topography (notshown). The near-field absorption spectrum is approxi-mated by the imaginary part of the scattered s-SNOMsignal, Im[sne
iφn] = sn sin φn, which has been shown tocorrelate well with bulk far-field absorption spectra forweak resonances.45 Data in Figure 4b and c are normal-ized to a spectrally flat gold reference. The blue curvein Figure 4d represents a typical nano-FTIR spectrumof the local environment around an isolated virion,averaged over absorption spectra for the 2 μm line
Figure 3. Repeated IR s-SNOM (a) amplitude s3 and (b)phase φ3 images of green dotted boxed region shown inFigure 2a�c. All scale bars are 100 nm.
Figure 4. Nano-FTIR absorption spectra of TMV in watertaken with a graphene liquid cell on a SiO2 substrate: (a)AFM topography showing two virions; (b) spectroscopic linescan in a featureless vicinity of virions showing 100 nano-FTIR absorption spectra acquired in 60 s each at 8 cm�1
resolution, computed from both amplitude and phasesignals at second-order demodulation and normalized toAu; (c) spectroscopic line scan as in (b) but along the greendashed line crossing the virion in (a), showing 50 nano-FTIRabsorption spectra after subtraction of the average back-ground spectrum and plotted on a logarithmic color scale.All scale bars indicate a 200 nm length. (d) Average overall spectra in (b) shown as the blue dashed curve, withprominent spectral slopes assignable to water in the SiO2-supported liquid cell, leaving a minimum near 1610 cm�1;the virion spectrum averaged over the green boxed regionin (c) is shown as the black curve.
ARTIC
LE
Dow
nloa
ded
by S
TA
NFO
RD
UN
IV o
n Se
ptem
ber
3, 2
015
| http
://pu
bs.a
cs.o
rg
Pub
licat
ion
Dat
e (W
eb):
Aug
ust 5
, 201
5 | d
oi: 1
0.10
21/a
csna
no.5
b011
84
KHATIB ET AL . VOL. 9 ’ NO. 8 ’ 7968–7975 ’ 2015
www.acsnano.org
7972
scan shown in Figure 4b. An important feature of theliquid cell nano-FTIR absorption spectra is a minimumin the data near 1610 cm�1, whose origin we discussbelow. To clearly distinguish the response of the TMV,we plot the background-corrected nano-FTIR absorp-tion, subtracting the average response from the sur-rounding liquid cell in the line scan shown in Figure 4c.The black curve in Figure 4d shows the resulting nano-FTIR spectrum for TMV, averaged over the green boxedregion in Figure 4c. We observe two small spectralfeatures at 1520 and 1660 cm�1, coinciding with theexpected amide resonances from the virus proteins.Line scan data shown in Figure 4c are plotted on alogarithmic color scale to emphasize the spectral peaksfrom the TMV.
DISCUSSION
In order to elucidate the nanoimaging and spectros-copy results, it is instructive to more closely examinethe microscopic tip�sample interaction specific to ourcell and specimens. Contrast in s-SNOM images resultsfrom the dielectric properties of a small volume under-neath theAFM tip. The evanescent fields of the probingtip can penetrate well beneath the sample surface. Inpractice, the depth of s-SNOM sensitivity is effectivelyseveral tens of nanometers.9,50,51 This means that inthe case of our liquid cell the tip�sample interactioninvolves one or two graphene layers, biological matterin water, and the substrate. Thus, there are manysources for forming infrared near-field contrast andalso contrast variations due to lateral as well as verticalinhomogeneities in individual layers, including vari-able amounts of trapped water. Further, unintentionaldoping of graphene can be nonuniform throughouta single large-area CVD sheet.42 During the growthprocess graphene becomes doped from atmosphericadsorbates or PMMA residue. Although intrinsicallyIR-transparent, free carriers in graphene interact withphonons in the underlying SiO2 substrate by plas-mon�phonon coupling,52 leading to enhancementand broadening of the near-field response even faraway from the optical phonon of SiO2 at 1128 cm�1.Experimental nano-FTIR spectra in Figure 4b of
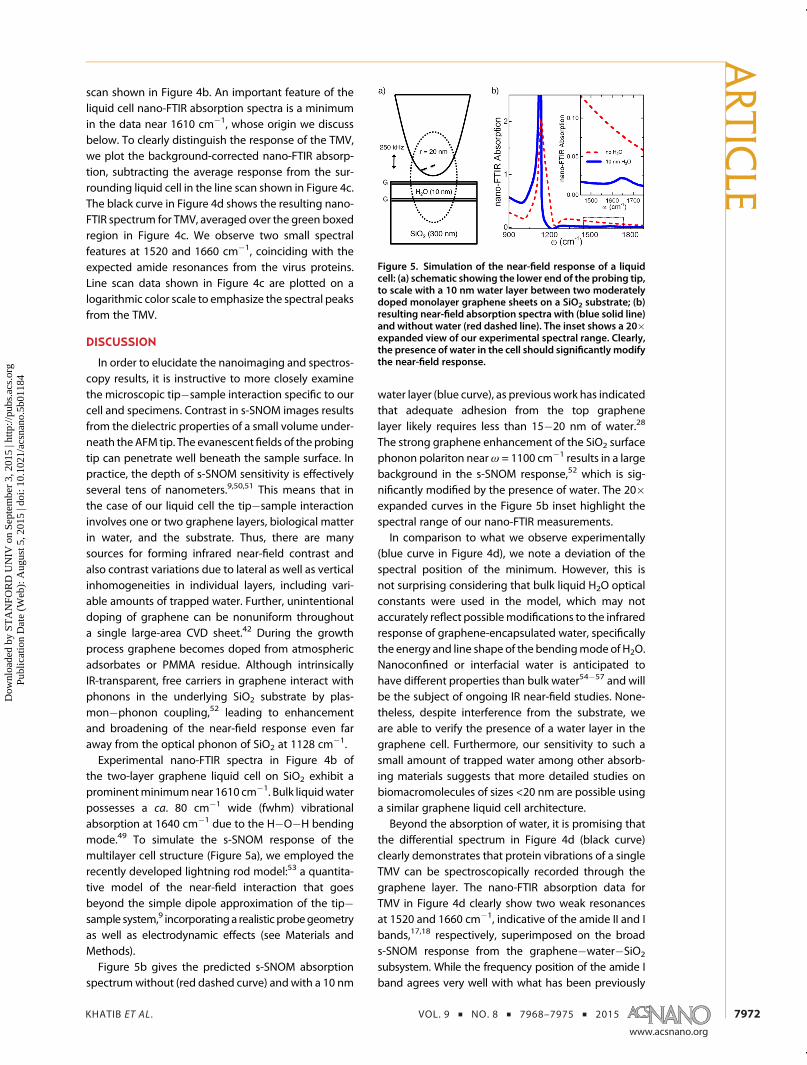
the two-layer graphene liquid cell on SiO2 exhibit aprominentminimumnear 1610 cm�1. Bulk liquidwaterpossesses a ca. 80 cm�1 wide (fwhm) vibrationalabsorption at 1640 cm�1 due to the H�O�H bendingmode.49 To simulate the s-SNOM response of themultilayer cell structure (Figure 5a), we employed therecently developed lightning rod model:53 a quantita-tive model of the near-field interaction that goesbeyond the simple dipole approximation of the tip�sample system,9 incorporatinga realistic probegeometryas well as electrodynamic effects (see Materials andMethods).Figure 5b gives the predicted s-SNOM absorption
spectrumwithout (red dashed curve) andwith a 10 nm
water layer (blue curve), as previouswork has indicatedthat adequate adhesion from the top graphenelayer likely requires less than 15�20 nm of water.28
The strong graphene enhancement of the SiO2 surfacephonon polariton nearω = 1100 cm�1 results in a largebackground in the s-SNOM response,52 which is sig-nificantly modified by the presence of water. The 20�expanded curves in the Figure 5b inset highlight thespectral range of our nano-FTIR measurements.In comparison to what we observe experimentally
(blue curve in Figure 4d), we note a deviation of thespectral position of the minimum. However, this isnot surprising considering that bulk liquid H2O opticalconstants were used in the model, which may notaccurately reflect possiblemodifications to the infraredresponse of graphene-encapsulated water, specificallythe energy and line shape of the bendingmode of H2O.Nanoconfined or interfacial water is anticipated tohave different properties than bulk water54�57 and willbe the subject of ongoing IR near-field studies. None-theless, despite interference from the substrate, weare able to verify the presence of a water layer in thegraphene cell. Furthermore, our sensitivity to such asmall amount of trapped water among other absorb-ing materials suggests that more detailed studies onbiomacromolecules of sizes <20 nm are possible usinga similar graphene liquid cell architecture.Beyond the absorption of water, it is promising that
the differential spectrum in Figure 4d (black curve)clearly demonstrates that protein vibrations of a singleTMV can be spectroscopically recorded through thegraphene layer. The nano-FTIR absorption data forTMV in Figure 4d clearly show two weak resonancesat 1520 and 1660 cm�1, indicative of the amide II and Ibands,17,18 respectively, superimposed on the broads-SNOM response from the graphene�water�SiO2
subsystem. While the frequency position of the amide Iband agrees very well with what has been previously
Figure 5. Simulation of the near-field response of a liquidcell: (a) schematic showing the lower end of the probing tip,to scale with a 10 nm water layer between two moderatelydoped monolayer graphene sheets on a SiO2 substrate; (b)resulting near-field absorption spectra with (blue solid line)and without water (red dashed line). The inset shows a 20�expanded view of our experimental spectral range. Clearly,the presence of water in the cell should significantly modifythe near-field response.
ARTIC
LE
Dow
nloa
ded
by S
TA
NFO
RD
UN
IV o
n Se
ptem
ber
3, 2
015
| http
://pu
bs.a
cs.o
rg
Pub
licat
ion
Dat
e (W
eb):
Aug
ust 5
, 201
5 | d
oi: 1
0.10
21/a
csna
no.5
b011
84
KHATIB ET AL . VOL. 9 ’ NO. 8 ’ 7968–7975 ’ 2015
www.acsnano.org
7973
observed in nano-FTIR,18 the amide II absorption is red-shifted from the expected resonance near 1550 cm�1.At these lower energies there is a stronger s-SNOMcontribution from the SiO2 phonon and doped gra-phene, which could lead to spectral shifts of the muchweaker absorption mode in the TMV. Lastly, in sucha nanoconfined environment with a small amount ofwater, there is considerable hydrostatic pressure im-posed by the graphene adhesion to the substrate. Highenough local pressure would deform the viral capsidand might in this way change the vibrational spectrumand possibly the conformations of the proteins.28
The large hydrostatic pressure from the grapheneconfinement can be tuned, by controlling the amountof excess water driven out during sample fabrication(see Supporting Information), to achieve more realisticbiological environments in future structures.Mica substrates were used for nano-IR imaging
experiments because of plasmonic interference effectsobserved in doped graphene on SiO2 with a CO2
laser.58 Conversely, sandwiched TMV samples on SiO2
were more suitable for nanospectroscopy measure-ments due to the lack of vibrational absorptions asso-ciated with the substrate in the frequency range ofinterest. To realize the full potential of s-SNOM imagingand spectroscopy for quantitative characterization ofbiological materials in aqueous media, the liquid cellarchitecture can be optimized by selecting spectrallyflat substrates such as Si or Au59 or by using free-standing graphene nanosandwich cells transferred toTEM grids.27 Additionally, future iterations of suchgraphene-based liquid cells could employ other iso-topes of water to shift the bending mode vibration outof the protein frequency region.49 Other 2D materials
besides graphene can also be explored for use as ananofluidic lid enabling s-SNOM investigation, such asBN,60 transition metal dichalcogenides (TMDs),61 orphosphorene.62,63 BNmight be an especially attractivealternative by virtue of its hyperbolic dispersion andability for subdiffractional focusing in the mid-infrared.64 Finally, while we have demonstrated thegeneral concept of near-field nanoimaging and spec-troscopy through an ultrathin barrier, the underlyingliquid cell structure can in principle be more sophisti-cated, utilizing advanced design principles from thefields of micro- and nanofluidics.
CONCLUSION
Wehaveperformed s-SNOMonTMV trapped togetherwith water underneath large-area monolayer graphene.We were able to image individual virions through thisgraphene “lid”, registering significant contrast in bothamplitude and phase of the scattered near-field signal.We observed in the near-field response spectral featuresassociated with trapped water, superimposed on a back-ground contribution from the underlying SiO2 substrate.Further we measured, on a single virion inside thegraphene liquid cell, an absorption spectrum due tothe amide I and II vibrational bands of virus proteins.Therefore, our nanospectroscopic probe was able toregister nanometer quantities of water, suggesting stud-ies of other macromolecular materials using a similarsample architecture. We have demonstrated that scatter-ing-based near-field techniques are applicable to biolo-gical samples in aqueous media. Our work sets the stagefor further nano-FTIR studies of biological and molecularmaterials, utilizing optimized liquid cells employing ultra-thin lids made of graphene and other 2D nanomaterials.
MATERIALS AND METHODSGraphene Liquid Cell Sample Preparation. Large-area graphene
is grown from chemical vapor deposition (CVD) atop Cu foils. Alower methane-to-hydrogen ratio is used to give higher mono-layer coverage. The method for trapping water with virusesbeneath graphene is a wet transfer similar to what has beenestablished previously for water alone.23,28 The graphene istransferred with poly(methyl methacrylate) (PMMA) onto eithermica or SiO2/Si substrates. Successive deionized water bathsclean the graphene films from residual etchant contaminationafter the transfer process. There is some remaining water fromthe wet transfer process that is trapped between the grapheneoverlayer and the underlying substrate surface. The PMMAtransfer scaffold is dissolved by overnight soaking in chloro-form. For SiO2/Si substrates, an additional bottom layer ofgraphene was used to prevent water from escaping throughthe oxide, creating a graphene “nanosandwich”. Both mica andSiO2-based substrates function as suitable s-SNOM-compatibleliquid cells employing a graphene lid, as shown in Figure 1b.Further details about graphene liquid cell sample preparationcan be found in the Supporting Information.
s-SNOM Measurements. For s-SNOM imaging and nano-FTIRmeasurements, we used a commercial near-field microscope(Neaspec GmbH) based on an AFM operating in tappingmode at a frequency of ∼250 kHz, with PtIr-coated cantilevers
of nominal tip radius 20�30 nm (Arrow NCPt, NanoWorld AG)(Figure 1a). The single-frequency IR nanoimaging results wereobtained by illuminating the tip with a CO2 laser beam (AccessLaser Co.). The scattered light from the tip is focused onto aHgCdTe detector (Kolmar Technologies). The s-SNOM detectorsignal comprises a far-field background and the local near-fieldinteraction, the latter being modulated by the oscillating AFMtip. The far-field background is strongly suppressed by demo-dulating the s-SNOM signal at harmonics of the tip tappingfrequency.9 Pseudoheterodyne detection65 with the referencemirror oscillating at 300 Hz is used to recover both amplitude snand phase φn, where n is the harmonic order, typically 2 or 3.
For nano-FTIR experiments, we used a broadband coherentsource (Lasnix, Germany) based on difference-frequencygeneration.11,12 The mid-infrared beam is generated by thenonlinear mixing of a train of near-IR Er-based fiber laser pulseswith synchronous frequency-offset IR supercontinuum pulses(Toptica Photonics, Germany) inside a GaSe crystal.66 Thegenerated mid-IR spectrum spans 250�300 cm�1 and is tun-able between 650 and 2200 cm�1. The asymmetric Michelsoninterferometer (Figure 1a) was used to record the s-SNOMsignal, by scanning the reference mirror over up to a 1500 μmtravel range.12 Nano-FTIR spectra are typically collected in60 s at 8 cm�1 resolution and normalized to those from aAu reference. Nano-FTIR absorption is computed as Im[sne
iφn] =sn sin φn.
45
ARTIC
LE
Dow
nloa
ded
by S
TA
NFO
RD
UN
IV o
n Se
ptem
ber
3, 2
015
| http
://pu
bs.a
cs.o
rg
Pub
licat
ion
Dat
e (W
eb):
Aug
ust 5
, 201
5 | d
oi: 1
0.10
21/a
csna
no.5
b011
84
KHATIB ET AL . VOL. 9 ’ NO. 8 ’ 7968–7975 ’ 2015
www.acsnano.org
7974
s-SNOM Response Simulations. Near-field scattering amplitudeswere calculated using the lightning rod model.53 The model(Figure 5a) assumes a hyperboloid to approximate the conicalstructure of the AFM tip with apex radius r = 20 nm and taperangle ∼20�. For the simulations, we used tabulated H2O andSiO2 optical constants taken from the literature.48,67 For the topand bottom graphene layers, we assume a moderate dopinglevel denoted by a chemical potential, μ= 2000 cm�1, and applya form for the optical conductivity calculatedwithin the randomphase approximation.52
Conflict of Interest: The authors declare the following com-peting financial interest(s): F. Keilmann is co-founder of Neaspecand Lasnix, producers of the s-SNOM and infrared source usedin this study. The remaining authors declare no competingfinancial interests.
Acknowledgment. Research at UCSD is supported by ONR.Development of nanospectroscopy instrumentation at UCSD issupported by DOE-BES. D. N. B. is the Moore Investigator inQuantumMaterials Grant GBMF-4533. The authors would like toacknowledge E. A. Carrion for providing graphene, J.-W. Do forassistance during graphene annealing, and Y. Chen for AFMassistance during sample preparation.
Supporting Information Available: The Supporting Informa-tion is available free of charge on the ACS Publications websiteat DOI: 10.1021/acsnano.5b01184.
Details of sample growth and preparation; SEM and AFMcharacterization (PDF)
REFERENCES AND NOTES1. Movasaghi, Z.; Rehman, S.; ur Rehman, D. I. Fourier Trans-
form Infrared (FTIR) Spectroscopy of Biological Tissues.Appl. Spectrosc. Rev. 2008, 43, 134–179.
2. Baker,M. J.; Trevisan, J.; Bassan, P.; Bhargava, R.; Butler, H. J.;Dorling, K. M.; Fielden, P. R.; Fogarty, S. W.; Fullwood, N. J.;Heys, K. A.; et al. Using Fourier Transform IR Spectroscopyto Analyze Biological Materials. Nat. Protoc. 2014, 9, 1771–1791.
3. Juszczyk, P.; Kolodziejczyk, A. S.; Grzonka, Z. FTIR Spectro-scopic Studies on Aggregation Process of the β-Amyloid11�28 Fragment and Its Variants. J. Pept. Sci. 2009, 15,23–29.
4. Ami, D.; Mereghetti, P.; Maria Doglia, S. In MultivariateAnalysis in Management, Engineering and the Sciences;Freitas, L., Ed.; InTech, 2013; Chapter 10, pp 189�220.
5. Gucciardi, P. G. In Applied Scanning Probe Methods XII;Bhushan, B., Fuchs, H., Eds.; Springer Berlin: Heidelberg,2009; Chapter 11, pp 49�68.
6. Haris, P. I.; Chapman, D. InMicroscopy, Optical Spectroscopy,and Macroscopic Techniques, 1st ed.; Jones, C., Mulloy, B.,Thomas, A. H., Eds.; Methods inMolecular Biology; HumanaPress, 1994; Vol. 22, Chapter 14, pp 183�202.
7. Hillenbrand, R.; Keilmann, F. Material-Specific Mapping ofMetal/semiconductor/dielectric Nanosystems at 10 NmResolution by Backscattering Near-Field Optical Micro-scopy. Appl. Phys. Lett. 2002, 80, 25–27.
8. Hillenbrand, R.; Knoll, B.; Keilmann, F. Pure Optical Contrastin Scattering-Type Scanning Near-Field Microscopy. J.Microsc. 2001, 202, 77–83.
9. Keilmann, F.; Hillenbrand, R. Near-Field Microscopy byElastic Light Scattering from a Tip. Philos. Trans. R. Soc., A2004, 362, 787–805.
10. Atkin, J. M.; Berweger, S.; Jones, A. C.; Raschke, M. B.Nano-Optical Imaging and Spectroscopy of Order, Phases,and Domains in Complex Solids. Adv. Phys. 2012, 61,745–842.
11. Keilmann, F.; Amarie, S. Mid-Infrared Frequency CombSpanning an Octave Based on an Er Fiber Laser andDifference-Frequency Generation. J. Infrared, Millimeter,Terahertz Waves 2012, 33, 479–484.
12. Amarie, S.; Ganz, T.; Keilmann, F. Mid-Infrared Near-FieldSpectroscopy. Opt. Express 2009, 17, 21794–21801.
13. Huth, F.; Schnell, M.; Wittborn, J.; Ocelic, N.; Hillenbrand, R.Infrared-Spectroscopic Nanoimagingwith a Thermal Source.Nat. Mater. 2011, 10, 352–356.
14. Dai, S.; Fei, Z.; Ma, Q.; Rodin, A. S.; Wagner, M.; McLeod, A. S.;Liu, M. K.; Gannett, W.; Regan, W.; Watanabe, K.; et al.Tunable Phonon Polaritons in Atomically Thin Van DerWaals Crystals of Boron Nitride. Science 2014, 343, 1125–1129.
15. Schnell, M.; Carney, P. S.; Hillenbrand, R. Synthetic OpticalHolography for Rapid Nanoimaging. Nat. Commun. 2014,5, 3499–3508.
16. Gucciardi, P. G.; Bachelier, G.; Stranick, S. J.; Allegrini, M. InApplied Scanning ProbeMethods VIII; Bhushan, B., Fuchs, H.,Tomitori, M., Eds.; Nano Science and Technolgy; Springer-Verlag: Berlin Heidelberg, 2008; Chapter 1, pp 1�29.
17. Brehm, M.; Taubner, T.; Hillenbrand, R.; Keilmann, F.Infrared Spectroscopic Mapping of Single Nanoparticlesand Viruses at Nanoscale Resolution. Nano Lett. 2006, 6,1307–1310.
18. Amenabar, I.; Poly, S.; Nuansing, W.; Hubrich, E. H.;Govyadinov, A. A.; Huth, F.; Krutokhvostov, R.; Zhang, L.;Knez, M.; Heberle, J.; et al. Structural Analysis andMappingof Individual Protein Complexes by Infrared Nanospectro-scopy. Nat. Commun. 2013, 4, 1–9.
19. Berweger, S.; Nguyen, D. M.; Muller, E. A.; Bechtel, H. A.;Perkins, T. T.; Raschke, M. B. Nano-Chemical InfraredImaging of Membrane Proteins in Lipid Bilayers. J. Am.Chem. Soc. 2013, 135, 18292–18295.
20. Legleiter, J.; Kowalewski, T. Insights into Fluid Tapping-Mode Atomic Force Microscopy Provided by NumericalSimulations. Appl. Phys. Lett. 2005, 87, 163120.
21. Preiner, J.; Tang, J.; Pastushenko, V.; Hinterdorfer, P. HigherHarmonic Atomic Force Microscopy: Imaging of BiologicalMembranes in Liquid. Phys. Rev. Lett. 2007, 99, 046102.
22. Xu, K.; Cao, P.; Heath, J. R. Graphene Visualizes the FirstWater Adlayers on Mica at Ambient Conditions. Science2010, 329, 1188–1191.
23. He, K. T.; Wood, J. D.; Doidge, G. P.; Pop, E.; Lyding, J. W.Scanning Tunneling Microscopy Study and Nanomanipu-lation of Graphene-Coated Water on Mica. Nano Lett.2012, 12, 2665–2672.
24. Wood, J. D.; Schmucker, S. W.; Haasch, R. T.; Doidge, G. P.;Nienhaus, L.; Damhorst, G. L.; Lyons, A. S.; Gruebele, M.;Bashir, R.; Pop, E.; et al. Improved Graphene Growthand Fluorination on Cu with Clean Transfer to Surfaces.IEEE Conference on Nanotechnology (IEEE-NANO); 2012;pp 1�4.
25. Novoselov, K. S.; Fal'ko, V. I.; Colombo, L.; Gellert, P. R.;Schwab, M. G.; Kim, K. A Roadmap for Graphene. Nature2012, 490, 192–200.
26. Basov, D. N.; Fogler, M.; Lanzara, A.; Wang, F.; Zhang, Y.Colloquium: Graphene Spectroscopy. Rev.Mod. Phys.2014,86, 959–994.
27. Wang, C.; Qiao, Q.; Shokuhfar, T.; Klie, R. F. High-ResolutionElectron Microscopy and Spectroscopy of Ferritin inBiocompatible Graphene Liquid Cells and GrapheneSandwiches. Adv. Mater. 2014, 26, 3410–3414.
28. Wood, J. D. Large-Scale Growth, Fluorination, Clean Trans-fer, and Layering of Graphene and Related Nanomaterials.Ph.D. thesis, University of Illinois at Urbana�Champaign,2013.
29. Zhong, L.; Zeng, G.; Lu, X.; Wang, R. C.; Gong, G.; Yan, L.;Huang, D.; Chen, Z. W. NSOM/QD-Based Direct Visualiza-tion of CD3-Induced and CD28-Enhanced NanospatialCoclustering of TCR and Coreceptor in Nanodomains inT Cell Activation. PLoS One 2009, 4, e5945–-.
30. Hu, M.; Chen, J.; Wang, J.; Wang, X.; Ma, S.; Cai, J.; Chen, C. Y.;Chen, Z. W. AFM- and NSOM-Based Force Spectroscopyand Distribution Analysis of CD69 Molecules on HumanCD4þ T Cell Membrane. J. Mol. Recognit. 2009, 22, 516–520.
31. Dickenson, N. E.; Armendariz, K. P.; Huckabay, H. A.;Livanec, P. W.; Dunn, R. C. Near-Field Scanning OpticalMicroscopy: A Tool for Nanometric Exploration of BiologicalMembranes. Anal. Bioanal. Chem. 2010, 396, 31–43.
ARTIC
LE
Dow
nloa
ded
by S
TA
NFO
RD
UN
IV o
n Se
ptem
ber
3, 2
015
| http
://pu
bs.a
cs.o
rg
Pub
licat
ion
Dat
e (W
eb):
Aug
ust 5
, 201
5 | d
oi: 1
0.10
21/a
csna
no.5
b011
84
KHATIB ET AL . VOL. 9 ’ NO. 8 ’ 7968–7975 ’ 2015
www.acsnano.org
7975
32. Lewis, A.; Radko, A.; Ben Ami, N.; Palanker, D.; Lieberman, K.Near-Field Scanning Optical Microscopy in Cell Biology.Trends Cell Biol. 1999, 9, 70–73.
33. Edidin, M. Near-Field Scanning Optical Microscopy, a SirenCall to Biology. Traffic 2001, 2, 797–803.
34. de Lange, F.; Cambi, A.; Huijbens, R.; de Bakker, B.; Rensen,W.; Garcia-Parajo, M.; van Hulst, N.; Figdor, C. G. CellBiology Beyond the Diffraction Limit: Near-Field ScanningOptical Microscopy. J. Cell Sci. 2001, 114, 4153–4160.
35. Hinterdorfer, P.; Garcia-Parajo, M. F.; Dufrene, Y. F. Single-Molecule Imaging of Cell Surfaces Using Near-Field Nano-scopy. Acc. Chem. Res. 2012, 45, 327–336.
36. Kapkiai, L. K.; Moore-Nichols, D.; Carnell, J.; Krogmeier, J. R.;Dunn, R. C. Hybrid Near-Field ScanningOpticalMicroscopyTips for Live Cell Measurements. Appl. Phys. Lett. 2004, 84,3750–3752.
37. van Zanten, T. S.; Cambi, A.; Garcia-Parajo, M. F. A Nano-meter Scale Optical View on the Compartmentalization ofCell Membranes. Biochim. Biophys. Acta, Biomembr. 2010,1798, 777–787.
38. Dunn, R. C. Near-Field ScanningOptical Microscopy. Chem.Rev. 1999, 99, 2891–2928.
39. Herrmann, M.; Neuberth, N.; Wissler, J.; Pérez, J.; Gradl, D.;Naber,A.Near-FieldOptical StudyofProteinTransportKineticsat a Single Nuclear Pore. Nano Lett. 2009, 9, 3330–3336.
40. Trinh, M.-H.; Odorico, M.; Bellanger, L.; Jacquemond, M.;Parot, P.; Pellequer, J.-L. Tobacco Mosaic Virus As an AFMTip Calibrator. J. Mol. Recognit. 2011, 24, 503–510.
41. Alonso, J. M.; Górzny, M. L.; Bittner, A. M. The Physicsof Tobacco Mosaic Virus and Virus-Based Devices inBiotechnology. Trends Biotechnol. 2013, 31, 530–538.
42. Fei, Z.; Rodin, A. S.; Gannett, W.; Dai, S.; Regan, W.; Wagner,M.; Liu, M. K.; McLeod, A. S.; Dominguez, G.; Thiemens, M.;et al. Electronic and Plasmonic Phenomena at GrapheneGrain Boundaries. Nat. Nanotechnol. 2013, 8, 821–825.
43. Hillenbrand, R.; Taubner, T.; Keilmann, F. Phonon-EnhancedLight-Matter Interaction at the Nanometre Scale. Nature2002, 418, 159–162.
44. Taubner, T.; Hillenbrand, R.; Keilmann, F. NanoscalePolymer Recognition by Spectral Signature in ScatteringInfrared Near-Field Microscopy. Appl. Phys. Lett. 2004, 85,5064–5066.
45. Huth, F.; Govyadinov, A.; Amarie, S.; Nuansing, W.;Keilmann, F.; Hillenbrand, R. Nano-FTIR Absorption Spec-troscopy of Molecular Fingerprints at 20 nm Spatial Re-solution. Nano Lett. 2012, 12, 3973–3978.
46. Liang, J.-J.; Hawthorne, F. C.; Swainson, I. P. TriclinicMuscovite: X-Ray Diffraction, Neutron Diffraction andPhoto-Acoustic FTIR Spectroscopy. Can. Mineral. 1998, 36,1017–1027.
47. Vedder, W. Correlations between Infrared Spectrum andChemical Composition of Mica. Am. Mineral. 1964, 49,736–768.
48. Hale, G. M.; Querry, M. R. Optical Constants of Water in the200-Nm to 200μ-M Wavelength Region. Appl. Opt. 1973,12, 555–563.
49. Bertie, J. E.; Ahmed, M. K.; Eysel, H. H. Infrared Intensities ofLiquids. 5. Optical and Dielectric Constants, IntegratedIntensities, and Dipole Moment Derivatives of Water andWater-D2 at 22.degree.C. J. Phys. Chem. 1989, 93, 2210–2218.
50. Zhang, L. M.; Andreev, G. O.; Fei, Z.; McLeod, A. S.;Dominguez, G.; Thiemens, M.; Castro-Neto, A. H.; Basov,D. N.; Fogler, M. M. Near-Field Spectroscopy of SiliconDioxide Thin Films. Phys. Rev. B: Condens. Matter Mater.Phys. 2012, 85, 075419.
51. Govyadinov, A. A.; Mastel, S.; Golmar, F.; Chuvilin, A.;Carney, P. S.; Hillenbrand, R. Recovery of Permittivity andDepth from Near-Field Data as a Step Toward InfraredNanotomography. ACS Nano 2014, 8, 6911–6921.
52. Fei, Z.; Andreev, G. O.; Bao, W.; Zhang, L. M.; McLeod,A. S.; Wang, C.; Stewart, M. K.; Zhao, Z.; Dominguez, G.;Thiemens, M.; et al. Infrared Nanoscopy of Dirac Plasmonsat the Graphene/SiO2 Interface. Nano Lett. 2011, 11, 4701–4705.
53. McLeod, A. S.; Kelly, P.; Goldflam, M. D.; Gainsforth, Z.;Westphal, A. J.; Dominguez, G.; Thiemens, M. H.; Fogler,M. M.; Basov, D. N. Model for Quantitative Tip-EnhancedSpectroscopy and the Extraction of Nanoscale-ResolvedOptical Constants. Phys. Rev. B: Condens. Matter Mater.Phys. 2014, 90, 085136.
54. Gorshunov, B. P.; Zhukova, E. S.; Torgashev, V. I.; Lebedev,V. V.; Shakurov, G. S.; Kremer, R. K.; Pestrjakov, E. V.; Thomas,V. G.; Fursenko, D. A.; Dressel, M. Quantum Behavior ofWater Molecules Confined to Nanocavities in Gemstones.J. Phys. Chem. Lett. 2013, 4, 2015–2020.
55. Mante, P.-A.; Chen, C.-C.; Wen, Y.-C.; Chen, H.-Y.; Yang, S.-C.;Huang, Y.-R.; Ju Chen, I.; Chen, Y.-W.; Gusev, V.; Chen, M.-J.;et al. Probing Hydrophilic Interface of Solid/Liquid-Waterby Nanoultrasonics. Sci. Rep. 2014, 4, 6249.
56. Sechler, T. D.; DelSole, E. M.; Deák, J. C. Measuring Proper-ties of Interfacial and Bulk Water Regions in a ReverseMicelle with IR Spectroscopy: A Volumetric Analysis of theInhomogeneously BroadenedOH Band. J. Colloid InterfaceSci. 2010, 346, 391–397.
57. Algara-Siller, G.; Lehtinen, O.; Wang, F. C.; Nair, R. R.; Kaiser,U.; Wu, H. A.; Geim, A. K.; Grigorieva, I. V. Square Ice inGraphene Nanocapillaries. Nature 2015, 519, 443–445.
58. Fei, Z.; Rodin, A. S.; Andreev, G. O.; Bao, W.; McLeod,A. S.; Wagner, M.; Zhang, L. M.; Zhao, Z.; Thiemens, M.;Dominguez, G.; et al. Gate-Tuning of Graphene PlasmonsRevealed by Infrared Nano-Imaging. Nature 2012, 487,82–85.
59. Mastel, S.; Govyadinov, A. A.; de Oliveira, T. V. A. G.;Amenabar, I.; Hillenbrand, R. Nanoscale-Resolved Chemi-cal Identification of Thin Organic Films Using InfraredNear-Field Spectroscopy and Standard Fourier TransformInfrared References. Appl. Phys. Lett. 2015, 106, 023113.
60. Zhou, Z.; Hu, Y.; Wang, H.; Xu, Z.; Wang, W.; Bai, X.; Shan, X.;Lu, X. DNA Translocation Through Hydrophilic Nanoporein Hexagonal Boron Nitride. Sci. Rep. 2013, 3, 3287.
61. Jariwala, D.; Sangwan, V. K.; Lauhon, L. J.; Marks, T. J.;Hersam, M. C. Emerging Device Applications for Semicon-ducting Two-Dimensional TransitionMetalDichalcogenides.ACS Nano 2014, 8, 1102–1120.
62. Li, L.; Yu, Y.; Ye, G. J.; Ge, Q.; Ou, X.; Wu, H.; Feng, D.; Chen,X. H.; Zhang, Y. Black Phosphorus Field-Effect Transistors.Nat. Nanotechnol. 2014, 9, 372–377.
63. Wood, J. D.; Wells, S. A.; Jariwala, D.; Chen, K.-S.; Sangwan,V. K.; Liu, X.; Lauhon, L. J.; Marks, T. J.; Hersam,M. C. EffectivePassivation of Exfoliated Black Phosphorus Transistorsagainst Ambient Degradation. Nano Letters 2014, 14,6964.
64. Dai, S.; Ma, Q.; Andersen, T.; Mcleod, A. S.; Fei, Z.; Liu, M. K.;Wagner, M.; Watanabe, K.; Taniguchi, T.; Thiemens, M.;et al. Subdiffractional Focusing and Guiding of PolaritonicRays in a Natural Hyperbolic Material. Nat. Commun. 2015,6, 6963.
65. Ocelic, N.; Huber, A.; Hillenbrand, R. PseudoheterodyneDetection for Background-Free Near-Field Spectroscopy.Appl. Phys. Lett. 2006, 89, 101124.
66. Gambetta, A.; Ramponi, R.; Marangoni, M. Mid-InfraredOptical Combs from a Compact Amplified Er-Doped FiberOscillator. Opt. Lett. 2008, 33, 2671–2673.
67. Herzinger, C. M.; Johs, B.; McGahan, W. A.; Woollam,J. A.; Paulson, W. Ellipsometric Determination of OpticalConstants for Silicon and Thermally Grown Silicon Dioxidevia a Multi-Sample, Multi-Wavelength, Multi-Angle Inves-tigation. J. Appl. Phys. 1998, 83, 3323–3336.
ARTIC
LE
Dow
nloa
ded
by S
TA
NFO
RD
UN
IV o
n Se
ptem
ber
3, 2
015
| http
://pu
bs.a
cs.o
rg
Pub
licat
ion
Dat
e (W
eb):
Aug
ust 5
, 201
5 | d
oi: 1
0.10
21/a
csna
no.5
b011
84