Embed Size (px)
Citation preview
IPOL
EGOV
DIRECTORATE-GENERAL FOR INTERNAL POLICIES
ECONOMIC GOVERNANCE SUPPORT UNIT
5 April 2016 Contact: [email protected] PE 574.404
Authors: J. Angerer, M. Hradiský, M. Ciucci, B. Mesnard, J. Vega Bordell and A. Zoppé.
IN-DE P T H AN AL YS IS
Greece's financial assistance programme (March 2016)
This briefing gives an overview if the economic situation in Greece and the main elements of the third financial
assistance programme. This briefing is regularly updated. It served also as a background document for the
delegation of the Financial Assistance Working Group to Athens end of March 2016. The previous update was
made in view of an Economic Dialogue on 2 March 2016 with Mr Euclid Tsakalotos, Minister of Finance of
the Hellenic Republic, in the competent Committee of the European Parliament.
1. Latest economic developments
After returning to growth in 2014 and showing unexpected resilience during the first half of
2015, Greece's economy has contracted, though less than initially expected, in the second half
of 2015. This contraction reflects sharp deterioration in confidence and renewed stress within the
banking system during summer 2015 that ultimately led to imposition of capital controls1 in June
2015. Uncertainty stemming from prolonged negotiations in the context of Greece programme
review also weighed on output developments. However, this contraction appears to be less
pronounced than initially expected as evidenced by an upward revision in the latest Eurostat GDP
estimates for 2015 (from 8 March 2016). In particular, the Greek economy had contracted by 1.2%
(q-o-q) in Q3 2015, before posting a marginal growth of 0.1% (q-o-q) in Q4 2015. This revised data
would bring real GDP growth for 2015 as a whole to -0.3%, as compared to -0.7% based on the
preliminary Eurostat GDP estimates (published on 12 February 2016). Note that the Commission
(COM) expected in its winter 2016 forecast2 (released on 4 February 2016) a real GDP growth of
0.0% for 2015. Looking ahead, the COM foresees negative carryover effects from 2015 to weigh on
output dynamics in 2016 (-0.7%) before a progressive rebound in confidence, along the 'expected
easing of capital controls and compliance with the conditionality of the new ESM assistance
programme', helps the Greek economy return to growth in 2017 (+2.7 %). Note that between 2007
and 2015 (provisional data), the size of the Greek economy shrank by around 26%.
Inflation, as measured by headline Harmonised Index of Consumer Prices (HICP), remained
negative in 2015 for a third year in a row at -1.1%. This price decline reflects the negative
effects of weak demand and lower energy prices which more than offset the impact of VAT
increases implemented in summer 2015. For 20163 and 2017, the COM projects HICP inflation to
1 On 29 June 2015, the Greek Government imposed capital controls to avert a collapse of its banking system. While it is still unclear
for how long these controls will remain in place, they were somewhat eased in mid-August 2015. 2 In its October 2015 World Economic Outlook, the IMF expects Greece real GDP to drop by 2.3% in 2015 and 1.3% in 2016. The
updated January 2016 World Economic Outlook only shows projections for the euro area as a whole and its major economies, but not
Greece. As to the OECD, its November 2051 World Economic Outlook projections pointed to real GDP growth of -1.4% in 2015 and
-1.2% in 2016. The 2016 GDP estimate has been subsequently revised to -0.1% in the OECD Economic Survey for Greece released
on 10 March 2016. For the sake of comparison, in the autumn 2015 forecast, the COM awaited real GDP growth of -1.4% in 2015
and -1.3% in 2016. To sum up, while all the institutions underestimated real GDP growth for 2015, the IMF was the most
pessimistic, and by a wide margin, about the 2015 growth outlook (as of autumn 2015). 3 According to the latest Eurostat data, annual HICP inflation declined from 0.4% in December 2015 to -0.1% in January 2016.
PE 574.404 2
return to the positive territory, 0.5% and 0.8% respectively, as Greece's economy is expected to
gradually return to growth. The latest available monthly HICP data show that headline inflation was
Current account deficit has probably narrowed to 1.8% of GDP in 2015 reflecting
predominantly a sharp contraction in imports. Moreover, the COM foresees further improvements
in Greece's current account for 2016 and 2017, with deficit declining to 1.4% and 0.9% of GDP
respectively, as 'past and ongoing structural reforms improve external competitiveness'.
Unemployment is expected to further decline from very high levels over the period 2015-2017,
mirroring output developments with a lag. According to the latest COM projections, the
unemployment rate is to decline to 25.1% in 2015, 24.0% in 2016 and 22.8% in 2017. As to
monthly data, after peaking at 27.9 % in September 2013, the unemployment rate stood at 24.6 % in
November 20154. The youth unemployment rate declined from a record high of 60.5 % in February
2013 to 48.0 % in November 2015. Indeed, as shown in a recent EP study "Employment and social
developments in Greece", 'unemployment and poverty mostly hit younger people for whom a system
focused on pensions offers no help'. At the same time, this study concludes that actions agreed
under the third economic adjustment programme aim at completing the unfinished reform agenda
since 2010, while addressing criticism against earlier programmes.
Government deficit is estimated to have widened to 7.6 % of GDP in 2015, according to the
COM winter 2016 forecast, reflecting the negative impact of uncertainty and economic downturn on
public finances as well as the effect of one-off recapitalisation measure of the banking sector com-
pleted in late 2015 (provisionally estimated at 3.3% of GDP). Going forward, the headline deficit is
projected to narrow to 3.4% of GDP in 2016 and 2.1 % of GDP in 2017, assuming that primary
balance targets set under the ESM programme (see section 2) are met.
The COM estimates in its winter forecast from January 2016 that the primary budget balance was
-3.5% in 2015 (which falls significantly short of the target of -0.25% of GDP), while the latest
published IMF figures on Greece (Fiscal Monitor of October 2015) estimated a primary budget
balance of -0.5% for 2015 (which is also a shortfall compared to the target).
The COM expects general government gross debt to stand at 179% of GDP in 2015, before
peaking at 185% of GDP in 20165. This is much below the 199.7% of GDP projected in the COM
autumn 2015 forecast as the cost of banks' recapitalisation turned out to be lower than expected.
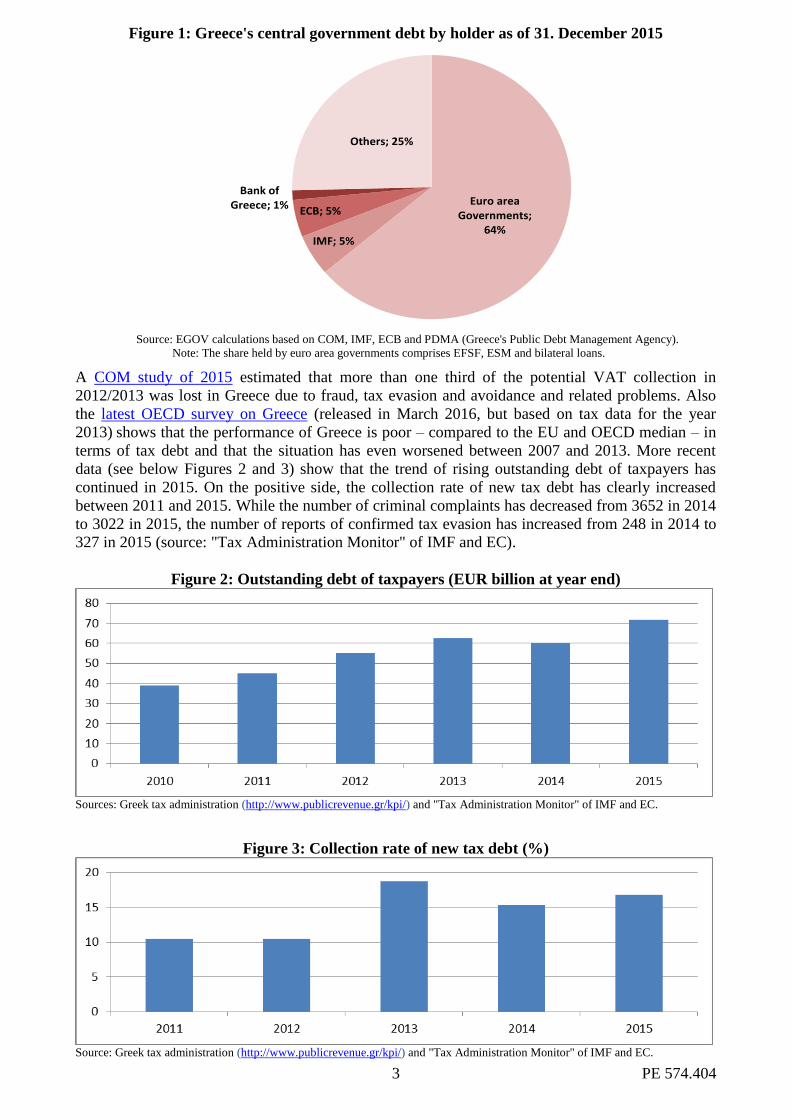
The distribution of the outstanding debt across different categories of bondholders is depicted in
Figure 1. Note that, in absence of consolidated 2015 general government gross debt data as yet,
cash data for central government is used as a proxy (EUR 321.3 billion as of 31 December 201567
).
The figure shows that the share of Greece's debt held by the Euro area governments (including
EFSF and ESM) stood at around 64 percent as of December 2015 (+ 4 percentage points compared
to end 2014) as new funds were transferred under the third adjustment programme. At the same
time, the shares of debt held by the IMF and the ECB stood at 5% each (namely 1.5 and 2
percentage points lower compared to end 2014 respectively) as bonds/loans coming to maturity
during 2015 were reimbursed.
4 The latest available Eurostat data for unemployment as of 16 March 2016. 5 This compares with 201% of GDP assumed for 2016 in the European institutions Debt Sustainability Analysis (DSA) of July 2015. 6 For example, the outstanding central government debt at the end of 2014 amounted to EUR 324.1 billion, while the consolidated
general government debt was EUR 317.7 billion at the end of 2014. 7 According to a Reuters article of 8 October 2015, "two thirds of Greek debt is now held by euro-zone governments that extended
loans to Athens with an average maturity of 31-32 years and an interest rate of around 1 percent".
3 PE 574.404
Figure 1: Greece's central government debt by holder as of 31. December 2015
Euro area Governments;
64%IMF; 5%
ECB; 5%
Bank of Greece; 1%
Others; 25%
Source: EGOV calculations based on COM, IMF, ECB and PDMA (Greece's Public Debt Management Agency).
Note: The share held by euro area governments comprises EFSF, ESM and bilateral loans.
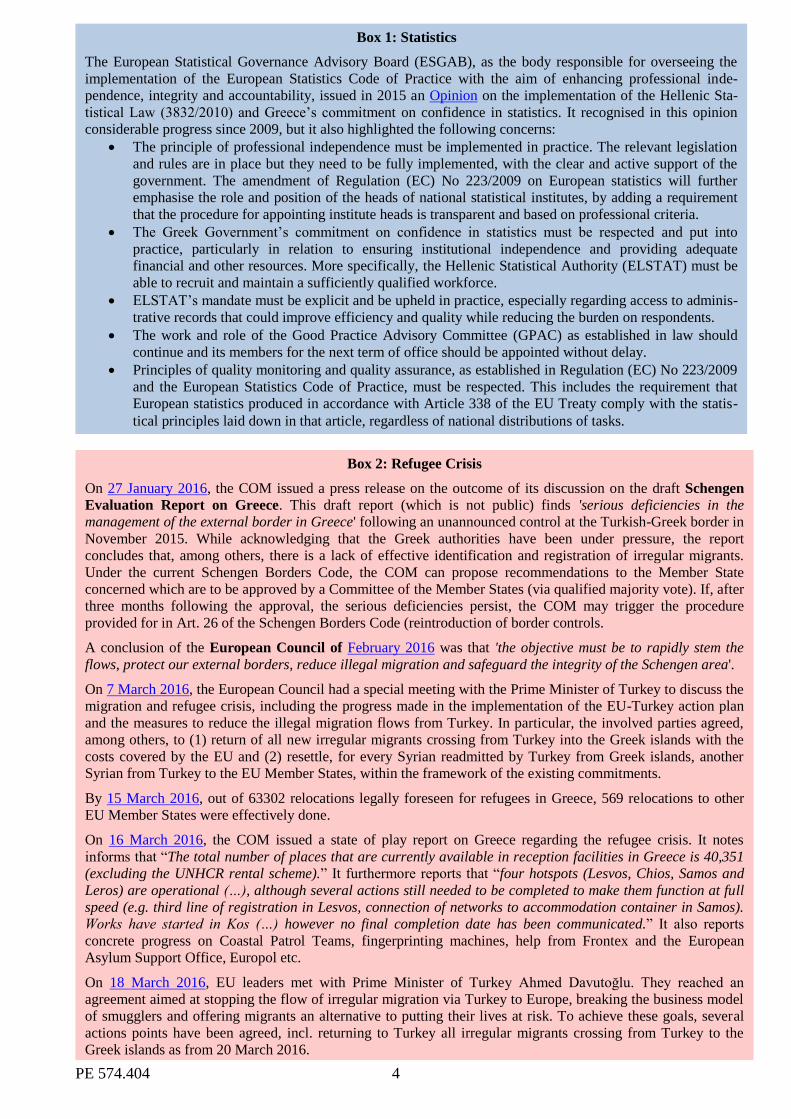
A COM study of 2015 estimated that more than one third of the potential VAT collection in
2012/2013 was lost in Greece due to fraud, tax evasion and avoidance and related problems. Also
the latest OECD survey on Greece (released in March 2016, but based on tax data for the year
2013) shows that the performance of Greece is poor – compared to the EU and OECD median – in
terms of tax debt and that the situation has even worsened between 2007 and 2013. More recent
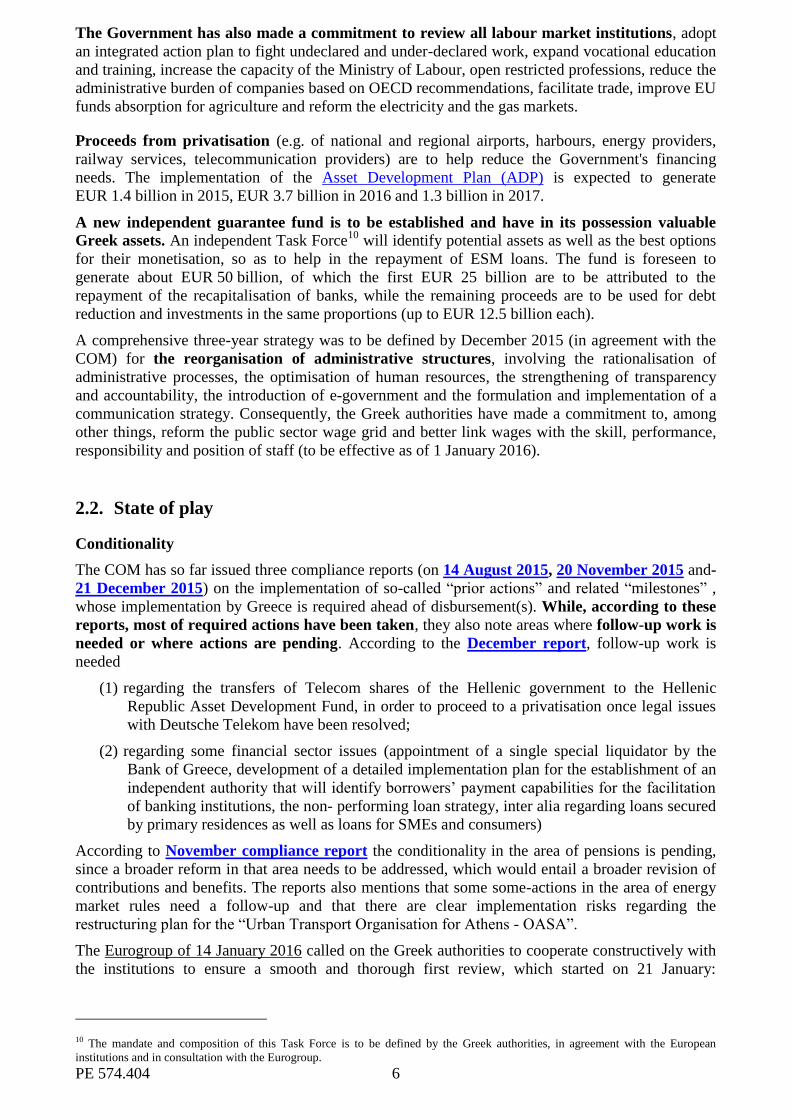
data (see below Figures 2 and 3) show that the trend of rising outstanding debt of taxpayers has
continued in 2015. On the positive side, the collection rate of new tax debt has clearly increased
between 2011 and 2015. While the number of criminal complaints has decreased from 3652 in 2014
to 3022 in 2015, the number of reports of confirmed tax evasion has increased from 248 in 2014 to
327 in 2015 (source: "Tax Administration Monitor" of IMF and EC).
Figure 2: Outstanding debt of taxpayers (EUR billion at year end)
Sources: Greek tax administration (http://www.publicrevenue.gr/kpi/) and "Tax Administration Monitor" of IMF and EC.
Figure 3: Collection rate of new tax debt (%)
Source: Greek tax administration (http://www.publicrevenue.gr/kpi/) and "Tax Administration Monitor" of IMF and EC.
PE 574.404 4
Box 1: Statistics
The European Statistical Governance Advisory Board (ESGAB), as the body responsible for overseeing the
implementation of the European Statistics Code of Practice with the aim of enhancing professional inde-
pendence, integrity and accountability, issued in 2015 an Opinion on the implementation of the Hellenic Sta-
tistical Law (3832/2010) and Greece’s commitment on confidence in statistics. It recognised in this opinion
considerable progress since 2009, but it also highlighted the following concerns:
The principle of professional independence must be implemented in practice. The relevant legislation
and rules are in place but they need to be fully implemented, with the clear and active support of the
government. The amendment of Regulation (EC) No 223/2009 on European statistics will further
emphasise the role and position of the heads of national statistical institutes, by adding a requirement
that the procedure for appointing institute heads is transparent and based on professional criteria.
The Greek Government’s commitment on confidence in statistics must be respected and put into
practice, particularly in relation to ensuring institutional independence and providing adequate
financial and other resources. More specifically, the Hellenic Statistical Authority (ELSTAT) must be
able to recruit and maintain a sufficiently qualified workforce.
ELSTAT’s mandate must be explicit and be upheld in practice, especially regarding access to adminis-
trative records that could improve efficiency and quality while reducing the burden on respondents.
The work and role of the Good Practice Advisory Committee (GPAC) as established in law should
continue and its members for the next term of office should be appointed without delay.
Principles of quality monitoring and quality assurance, as established in Regulation (EC) No 223/2009
and the European Statistics Code of Practice, must be respected. This includes the requirement that
European statistics produced in accordance with Article 338 of the EU Treaty comply with the statis-
tical principles laid down in that article, regardless of national distributions of tasks.
Box 2: Refugee Crisis
On 27 January 2016, the COM issued a press release on the outcome of its discussion on the draft Schengen
Evaluation Report on Greece. This draft report (which is not public) finds 'serious deficiencies in the
management of the external border in Greece' following an unannounced control at the Turkish-Greek border in
November 2015. While acknowledging that the Greek authorities have been under pressure, the report
concludes that, among others, there is a lack of effective identification and registration of irregular migrants.
Under the current Schengen Borders Code, the COM can propose recommendations to the Member State
concerned which are to be approved by a Committee of the Member States (via qualified majority vote). If, after
three months following the approval, the serious deficiencies persist, the COM may trigger the procedure
provided for in Art. 26 of the Schengen Borders Code (reintroduction of border controls.
A conclusion of the European Council of February 2016 was that 'the objective must be to rapidly stem the
flows, protect our external borders, reduce illegal migration and safeguard the integrity of the Schengen area'.
On 7 March 2016, the European Council had a special meeting with the Prime Minister of Turkey to discuss the
migration and refugee crisis, including the progress made in the implementation of the EU-Turkey action plan
and the measures to reduce the illegal migration flows from Turkey. In particular, the involved parties agreed,
among others, to (1) return of all new irregular migrants crossing from Turkey into the Greek islands with the
costs covered by the EU and (2) resettle, for every Syrian readmitted by Turkey from Greek islands, another
Syrian from Turkey to the EU Member States, within the framework of the existing commitments.
By 15 March 2016, out of 63302 relocations legally foreseen for refugees in Greece, 569 relocations to other
EU Member States were effectively done.
On 16 March 2016, the COM issued a state of play report on Greece regarding the refugee crisis. It notes
informs that “The total number of places that are currently available in reception facilities in Greece is 40,351
(excluding the UNHCR rental scheme).” It furthermore reports that “four hotspots (Lesvos, Chios, Samos and
Leros) are operational (…), although several actions still needed to be completed to make them function at full
speed (e.g. third line of registration in Lesvos, connection of networks to accommodation container in Samos).
Works have started in Kos (…) however no final completion date has been communicated.” It also reports
concrete progress on Coastal Patrol Teams, fingerprinting machines, help from Frontex and the European
Asylum Support Office, Europol etc.
On 18 March 2016, EU leaders met with Prime Minister of Turkey Ahmed Davutoğlu. They reached an
agreement aimed at stopping the flow of irregular migration via Turkey to Europe, breaking the business model
of smugglers and offering migrants an alternative to putting their lives at risk. To achieve these goals, several
actions points have been agreed, incl. returning to Turkey all irregular migrants crossing from Turkey to the
Greek islands as from 20 March 2016.

5 PE 574.404
2. Third financial assistance programme: Main elements and state of play
2.1. Main elements
Following Greece's request for further financial assistance of 9 July 2015, the COM signed on 19
August 20158 (on behalf of the members of the euro area) a Memorandum of Understanding
(MoU) with Greece for a third economic adjustment programme of up to EUR 86 billion for
the period 2015-18 9 (Article 13 of the ESM Treaty). In particular, it outlines a reform agenda in
the following areas: (1) fiscal sustainability; (2) safeguarding financial stability; (3) growth,
competitiveness, investment; and (4) modern state and public administration structure. Greece is to
coordinate with the COM's Structural Reform Support Service to demonstrate its commitment.
The Greek authorities have made a commitment to achieve a primary surplus (revenues less
expenses without interests payments) over the medium-term of 3.5 % of GDP, so as to
progressively strengthen the sustainability of public finances (see Table 1 below).
Table 1: Primary surplus targets and GDP growth path underpinning the third financial
assistance programme to Greece
Year Primary surplus
target (MoU)
GDP growth
(EU eligibility analysis
for ESM programme)
2015 -0.25% -2.3%
2016 +0.5% -1.3%
2017 +1.75% +2.7%
2018 +3.5% +3.1%
Sources: MoU and EU Debt Sustainability Analysis
In accordance with the MoU, the primary surplus targets are to be achieved by:
Pension savings of around 0.25 % of GDP in 2015 and 1.0 % of GDP by 2016 (see pp. 13-14
of the MoU);
Health care sector: various measures (see pp. 15-16 of the MoU);
Tax, revenue, and financial management reforms, including various measures against tax
fraud and evasion. A minimum VAT income of EUR 2.65 billion is to be ensured. Property tax
rates will be aligned with market prices from 2017 and zonal property values are to be revised.
The authorities are to improve the collection of tax debt, introduce independent agencies and
make the Fiscal Council independent and operational. Many other tax related reform measures
are included in the MoU (see pp. 6-11 of the MoU).
In addition, Greece was requested to enact, by October 2015, structural measures expected to
yield at least 0.75 % of GDP coming into effect in 2017 and 0.25 % of GDP in 2018, so as to
help achieve medium-term budgetary targets. The measures would include, inter alia, defence
expenditure savings, personal income tax reform and the freezing of public spending.
The Greek authorities have made a commitment to finalise a strategy for the monitoring of the
financial system, aimed at (i) normalising liquidity and payment conditions, (ii) recapitalising the
banks, (iii) enhancing governance and (iv) addressing non-performing loans (NPL). All banks are
required to submit quarterly funding plans to the Bank of Greece (BoG), and a buffer of up to
EUR 25 billion was set aside to address potential recapitalisation needs and resolution of banks.
8 On 19 August, the Greek Prime Minister also sent a letter to the European Parliament requesting its stronger involvement in the
regular review process in implementing the programme. A day later, he resigned, triggering the sixth general elections in eight years
on 20 September 2015. Following his re-election, PM Tsipras (Syriza) has renewed his party’s coalition with the nationalist
Independent Greeks (Anel), the junior partner in his previous government. 9 According to Article 7.2 of Regulation (EU) No 472/2013, the Council shall, on a proposal by the Commission, approve the
macroeconomic adjustment programme prepared by the Member State requesting financial assistance.
PE 574.404 6
The Government has also made a commitment to review all labour market institutions, adopt
an integrated action plan to fight undeclared and under-declared work, expand vocational education
and training, increase the capacity of the Ministry of Labour, open restricted professions, reduce the
administrative burden of companies based on OECD recommendations, facilitate trade, improve EU
funds absorption for agriculture and reform the electricity and the gas markets.
Proceeds from privatisation (e.g. of national and regional airports, harbours, energy providers,
railway services, telecommunication providers) are to help reduce the Government's financing
needs. The implementation of the Asset Development Plan (ADP) is expected to generate
EUR 1.4 billion in 2015, EUR 3.7 billion in 2016 and 1.3 billion in 2017.
A new independent guarantee fund is to be established and have in its possession valuable
Greek assets. An independent Task Force10
will identify potential assets as well as the best options
for their monetisation, so as to help in the repayment of ESM loans. The fund is foreseen to
generate about EUR 50 billion, of which the first EUR 25 billion are to be attributed to the
repayment of the recapitalisation of banks, while the remaining proceeds are to be used for debt
reduction and investments in the same proportions (up to EUR 12.5 billion each).
A comprehensive three-year strategy was to be defined by December 2015 (in agreement with the
COM) for the reorganisation of administrative structures, involving the rationalisation of
administrative processes, the optimisation of human resources, the strengthening of transparency
and accountability, the introduction of e-government and the formulation and implementation of a
communication strategy. Consequently, the Greek authorities have made a commitment to, among
other things, reform the public sector wage grid and better link wages with the skill, performance,
responsibility and position of staff (to be effective as of 1 January 2016).
2.2. State of play
Conditionality
The COM has so far issued three compliance reports (on 14 August 2015, 20 November 2015 and-
21 December 2015) on the implementation of so-called “prior actions” and related “milestones” ,
whose implementation by Greece is required ahead of disbursement(s). While, according to these
reports, most of required actions have been taken, they also note areas where follow-up work is
needed or where actions are pending. According to the December report, follow-up work is
needed
(1) regarding the transfers of Telecom shares of the Hellenic government to the Hellenic
Republic Asset Development Fund, in order to proceed to a privatisation once legal issues
with Deutsche Telekom have been resolved;
(2) regarding some financial sector issues (appointment of a single special liquidator by the
Bank of Greece, development of a detailed implementation plan for the establishment of an
independent authority that will identify borrowers’ payment capabilities for the facilitation
of banking institutions, the non- performing loan strategy, inter alia regarding loans secured
by primary residences as well as loans for SMEs and consumers)
According to November compliance report the conditionality in the area of pensions is pending,
since a broader reform in that area needs to be addressed, which would entail a broader revision of
contributions and benefits. The reports also mentions that some some-actions in the area of energy
market rules need a follow-up and that there are clear implementation risks regarding the
restructuring plan for the “Urban Transport Organisation for Athens - OASA”.
The Eurogroup of 14 January 2016 called on the Greek authorities to cooperate constructively with
the institutions to ensure a smooth and thorough first review, which started on 21 January:
10 The mandate and composition of this Task Force is to be defined by the Greek authorities, in agreement with the European
institutions and in consultation with the Eurogroup.
7 PE 574.404
“Successful completion of this exercise would pave the way for decisions on possible debt relief
measures and an IMF programme, as agreed by the heads of state or government in July 2015.”
Teams from the COM, ECB, ESM and IMF were in February and March 2016 in Athens to
assess the Greek authorities' progress on the reforms agreed, including plans to reach their
ambitious medium term fiscal targets. Syriza has so far resisted pressure from creditors to impose
pension cuts by March (Financial Times). The pension reform has become an urgent priority as
"Greece’s pension system is unaffordable. As it stands the contributions are not sufficient to finance
the generous level of benefits requiring transfers of the state of close to 10 percent of GDP each
year. Addressing the imbalance in the system through pension reform is essential to the
sustainability of public finances" the IMF said.
On 11 February 2016, the Eurogroup called on the Greek authorities and the mission staff to con-
tinue their constructive cooperation and to work towards the rapid finalisation of the review, which
covers issues such as pension reform, fiscal strategy and making the privatisation fund operational.
On 7 March 2016, the Eurogroup stressed that more effort needs to be put in for a successful
completion of the review. There are still fiscal gaps to be filled and some of the reforms will have to
be deepened. The review covers issues such as pension reform, fiscal strategy and making the
privatisation fund operational.
On 20 March 2016, the Eurogroup President stated that significant progress has been made on
outstanding issues as income tax and pension reforms. He also stated that the mission chiefs of the
institutions will return on 2 April to Athens to resume discussions.
Disbursements
The first sub-tranche of EUR 16 billion has been disbursed in several payments between August
and December 2015 and is expected to be used by the government for debt service, budget
financing, and co-financing projects funded by EU structural funds:
A first disbursement of EUR 13 billion was made immediately on 20 August 2015 given that
some of the called prior actions had already been implemented (see the COM's report of
14 August 2015 on Greece's compliance with the draft MoU commitments and the
commitments in the Euro Summit statement of 12 July 2015);
The remaining disbursements were made on 24 November 2015 (EUR 2 billion) and on
23 December 2015 (EUR 1 billion) as a follow-up to the following reforms:
(a) On 16 October 2015, the Greek government legislated up to 30% of the prior actions
(16 out of 49), among which penalties on early retirement and an increase in property
taxes (ESM, EU Observer and Ekathimerini).
(b) In November 2015, the Greek Parliament approved a bill which builds on previous le-
gislation for the calculation of pensions, addresses compliance with EU energy efficien-
cy rules, lifts obstacles for the sale of Greece's largest port and scraps tax breaks for
farmers (Reuters).
(c) Measures to stimulate competition in the energy sector as well as a new law to help
banks manage their exposure to non-performing assets (i.e. legislation on non-
performing loans and household insolvency) which is supposed to help the
recapitalisation process (see Eurogroup statement of 23 November).
Table 2: Overview of disbursements
Date Amount (EUR) Maturity Cumulative amount (EUR)
20/08/2015 13 bn Amortization from 2034 to 2059 13 bn
24/11/2015 2 bn Amortization from 2034 to 2059 15 bn
01/12/2015 2.7 bn Interim maturity coinciding with maturity of ESM notesa)
17.7 bn
08/12/2015 2.7 bn Interim maturity coinciding with maturity of ESM notesa)
20.4 bn
23/12/2015 1 bn Amortization from 2034 to 2059 21.4 bn
Source: ESM. a) The final maturity will be in line with the maximum weighted average loan maturity of 32.5 years.
PE 574.404 8
The second sub-tranche of up to EUR 10 billion was earmarked to cover recapitalization and
resolution costs of the Greek banking sector. Since the the country has cleared important hurdle
by securing sufficient interest for the recapitalisation exercise among private investors, the four
systemic banks in Greece are considered by the creditor institutions to stand on their own feet again,
albeit two banks had to rely on public support to complement their recapitalisations (the concerned
banks were Piraeus and National Bank of Greece). Therefore, the Eurogroup and subsequently the
ESM Board of Directors authorised the transfer of two tranches of EUR 2.7 billion each on
1 December and 8 December 2015 respectively to the Hellenic Financial Stability Funds (HFSF).
The transfers followed the COM’s approval of additional state aid based on the bank’s amended
restructuring plan. EUR 4.6 billion remain available from the original EUR 10 billion designated
for the Greek banking sector. These funds are held in a segregated account at the ESM. Future
releases of funds to the HFSF will be decided by the ESM on a case-by-case basis.
The Eurogroup of 7 December 2015 was informed by the institutions and the Greek Minister for
Finance that the recapitalisation of the Greek banking sector will not require more than the amount
of up to EUR 10 billion currently available under the programme for this purpose. This is
significantly lower than the envelope of up to EUR 25 billion earmarked for bank recapitalisation at
the beginning of the Greece programme.
Since end of December 2015, the total disbursed amount of ESM financial assistance for Greece
has remained at EUR 21.4 billion, which is around 25% of the maximum amount of assistance
foreseen in the programme (EUR 86 billion).
The timeline of the debt repayments to the institutions, treasury bill holders and private investors is
provided on a database of the Wall Street Journal. The outstanding loans of Greece to the creditors
of the three programmes is around EUR 220 bn, out of which around EUR 205 bn are due to euro
area Member States, EFSF and ESM (see separate EGOV table on financial assistance).
3. Debt Sustainability Analyses and related statements
Article 13.1 of the ESM Treaty, as well as Article 6 of Regulation (EU) No 472/2013 on
surveillance of Member States with serious difficulties with respect to financial stability, requires
the COM to assess whether the public debt of a Member State requesting financial assistance is
sustainable, where appropriate with the IMF. Similarly, Article V.3 of the IMF agreements sets the
conditions governing the use of IMF resources, including the capacity of the receiving country to
repay its debt to IMF.
Box 3: The EP’s role in adjustment programmes as specified in Regulation 472/2013
Article 7(1) and 7(4): COM shall orally inform the Chair and Vice-Chairs of the competent committee of
the EP of 1) the progress made in the preparation of the macroeconomic adjustment programme and 2) the
conclusions drawn from its monitoring. That information shall be treated as confidential.
Article 7(10): The competent committee of the EP may offer the opportunity to the Member State
concerned and to COM to participate in an exchange of views on the progress made in the implementation
of the macroeconomic adjustment programme.
Article 18: The EP may invite representatives of the Council and of COM to enter into a dialogue on the
application of this Regulation.
9 PE 574.404
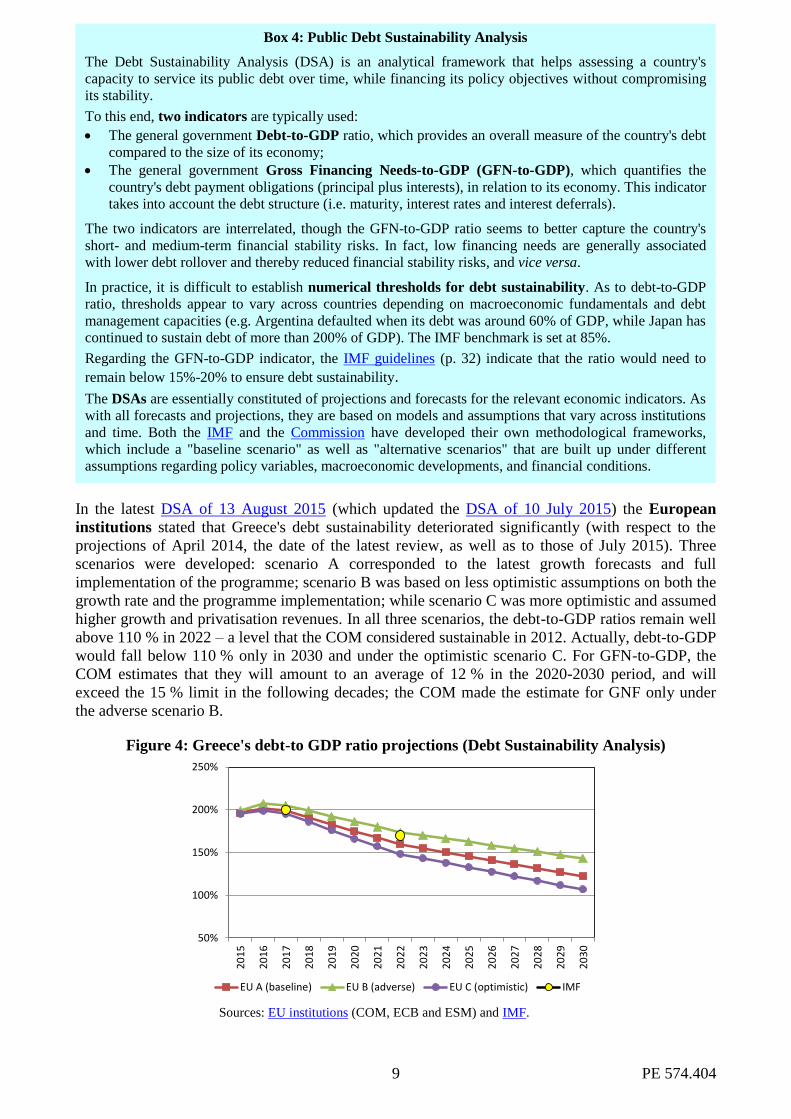
In the latest DSA of 13 August 2015 (which updated the DSA of 10 July 2015) the European
institutions stated that Greece's debt sustainability deteriorated significantly (with respect to the
projections of April 2014, the date of the latest review, as well as to those of July 2015). Three
scenarios were developed: scenario A corresponded to the latest growth forecasts and full
implementation of the programme; scenario B was based on less optimistic assumptions on both the
growth rate and the programme implementation; while scenario C was more optimistic and assumed
higher growth and privatisation revenues. In all three scenarios, the debt-to-GDP ratios remain well
above 110 % in 2022 – a level that the COM considered sustainable in 2012. Actually, debt-to-GDP
would fall below 110 % only in 2030 and under the optimistic scenario C. For GFN-to-GDP, the
COM estimates that they will amount to an average of 12 % in the 2020-2030 period, and will
exceed the 15 % limit in the following decades; the COM made the estimate for GNF only under
the adverse scenario B.
Figure 4: Greece's debt-to GDP ratio projections (Debt Sustainability Analysis)
50%
100%
150%
200%
250%
20
15
20
16
20
17
20
18
20
19
20
20
20
21
20
22
20
23
20
24
20
25
20
26
20
27
20
28
20
29
20
30
EU A (baseline) EU B (adverse) EU C (optimistic) IMF
Sources: EU institutions (COM, ECB and ESM) and IMF.
Box 4: Public Debt Sustainability Analysis
The Debt Sustainability Analysis (DSA) is an analytical framework that helps assessing a country's
capacity to service its public debt over time, while financing its policy objectives without compromising
its stability.
To this end, two indicators are typically used:
The general government Debt-to-GDP ratio, which provides an overall measure of the country's debt
compared to the size of its economy;
The general government Gross Financing Needs-to-GDP (GFN-to-GDP), which quantifies the
country's debt payment obligations (principal plus interests), in relation to its economy. This indicator
takes into account the debt structure (i.e. maturity, interest rates and interest deferrals).
The two indicators are interrelated, though the GFN-to-GDP ratio seems to better capture the country's
short- and medium-term financial stability risks. In fact, low financing needs are generally associated
with lower debt rollover and thereby reduced financial stability risks, and vice versa.
In practice, it is difficult to establish numerical thresholds for debt sustainability. As to debt-to-GDP
ratio, thresholds appear to vary across countries depending on macroeconomic fundamentals and debt
management capacities (e.g. Argentina defaulted when its debt was around 60% of GDP, while Japan has
continued to sustain debt of more than 200% of GDP). The IMF benchmark is set at 85%.
Regarding the GFN-to-GDP indicator, the IMF guidelines (p. 32) indicate that the ratio would need to
remain below 15%-20% to ensure debt sustainability.
The DSAs are essentially constituted of projections and forecasts for the relevant economic indicators. As
with all forecasts and projections, they are based on models and assumptions that vary across institutions
and time. Both the IMF and the Commission have developed their own methodological frameworks,
which include a "baseline scenario" as well as "alternative scenarios" that are built up under different
assumptions regarding policy variables, macroeconomic developments, and financial conditions.
PE 574.404 10
In July 2015, the IMF updated its detailed preliminary debt sustainability analysis of 26 June 2015:
due to the deterioration in the economic situation as a result of the closing of the banking system,
Greece's public debt was projected to peak at 200 % of GDP in 2017, before declining to about
170 % of GDP in 2022. GFN-to-GDP, already now above the 15 % threshold that is deemed safe,
continues to rise in the long term. Therefore, "The dramatic deterioration in debt sustainability
points to the need for debt relief on a scale that would need to go well beyond what has been under
consideration to date—and what has been proposed by the ESM. There are several options. If
Europe prefers to again provide debt relief through maturity extension, there would have to be a
very dramatic extension with grace periods of, say, 30 years on the entire stock of European debt,
including new assistance. This reflects the basic premise that debt cannot be assumed to migrate
back onto the balance sheet of the private sector at interest rates close to the current AAA rates
before debt levels have been brought to much lower levels; borrowing at anything but AAA rates in
the near term will bring about an unsustainable debt dynamic for the next several decades. Other
options include explicit annual transfers to the Greek budget or deep upfront haircuts. The choice
between the various options is for Greece and its European partners to decide. (See also a
transcript of a press briefing of 3 September 2015).
The Eurogroup, according to its statement on the ESM Programme of 14 August 2015:
Stands ready to consider, if necessary, possible additional measures (possible longer grace and
repayment periods) aiming at ensuring that Greece's gross financing needs remain at a
sustainable level. These measures will be conditional upon full implementation of the measures
agreed in the ESM programme and will be considered after the first positive completion of a
programme review;
Reiterates that nominal haircuts on official debt cannot be undertaken;
Considers the continued programme involvement of the IMF as indispensable and welcomes the
intention of the IMF management to recommend to the Fund's Executive Board to consider
further financial support for Greece once the full specification of fiscal, structural and financial
sector reforms has been completed, and once the need for additional measures has been
considered and an agreement on possible debt relief to ensure debt sustainability has been
reached. Resulting policy conditionality will be a shared one as the policy conditionality
underlying the ESM macroeconomic adjustment programme is developed in parallel to the one
of the IMF. Once approved, the full re-engagement of the IMF is expected to reduce the ESM
financing envelope accordingly;
Welcomes the positive assessment of IMF staff of the policy conditionality contained in the
MoU as confirmed by the IMF Managing Director and looks forward to an IMF programme
based on the latter.
Christine Lagarde, the IMF’s managing director, told Swiss newspaper Le Temps in an interview
in August 2015 regarding Greece's debt restructuring that: "We are talking about extending
maturities, reducing rates, [making] exemptions for a certain period of time. We are not speaking
about cancelling debt." Also, she is reported to state on 22 January 2016 that "the IMF stands ready
to continue to support Greece in achieving robust economic growth and sustainable public finances
through a credible and comprehensive medium-term economic program. Such a program would
require strong economic policies, not least pension reforms as well as significant debt relief from
Greece’s European partners to ensure that debt is on a sustainable downward trajectory.” More
recently, on 4 February 2015, Ms. Lagarde said, "I have always said that the Greek program has to
work on two legs, one leg is of significant reforms, and the other one is debt relief. We would
proceed on that view, significant reform, debt relief. If the pension reform cannot be as significant,
substantially, deeply reformed as needed, it will mean more debt relief on the other side."
Alexis Tsipras, the Greek Prime Minister, mentioned during the presentation the budget to
Parliament on 7 October 2015 that Greece will "propose an extension of the loan maturities and a
reduction of interest rates" on the official loans, as well as a growth clause (linking interest
payments to economic expansion) and a longer grace period on interest payments.
11 PE 574.404
Jeroen Dijsselbloem, the President of the Eurogroup, commented in an interview with Reuters of
8 October 2015 on the IMF statement that, while capping annual debt servicing costs at 15 percent
of GDP was a standard that worked for most economies, Greece might need more generous terms
with annual costs limited to 10 percent of GDP. "My understanding was that the IMF always works
on the 15 percent standard, but if they say that this is too high for Greece, then this is one of the
issues we will have to discuss with them".
Following the Eurogroup meeting of 7 March 2016, Mr. Dijsselbloem stated that "On their
(authorities currently in Athens) return, which of course we don't know when that will be, we will
have to take a political decision which also concerns the issue of debt and debt management, debt
relief. As you know, we have a longstanding promise that if the Greek government fulfils its
commitments in the programme and delivers a primary surplus, we will do what is necessary to
make the annual debt surplus manageable, and that today also in Eurogroup we have realised and
made explicit that that discussion is going to be on our table in the near future. So we will seriously
try to bring those work strands together in the coming months. So that's where we are on Greece
and work will continue. We have a joint interest to do it as quickly as possible."
4. Banking sector and financial stability: Latest developments
The banks' financial positions deteriorated steadily in 2015
In 2014, the four largest Greek banks completed major achievements towards re-establishing
profitability: after successfully raising significant amount of capital from private investors
(EUR 8.3 billion), they continued to restructure their businesses and improved their interest margins
while the deterioration in asset quality stabilised in the last quarter of the year. A robust increase in
deposits, coupled with a renewed access to capital markets (all four banks issued bonds in the first
half of 2014), enabled banks to repay the costly emergency liquidity assistance (ELA) provided by
the Bank of Greece since the large deposit outflows of 2012. On the basis of the restructuring plans
approved by the COM in 2014, the comprehensive assessment carried out by the ECB did not
unveil additional capital needs on top of the capital raised from April to July 2014. At the end of
2014, the four banks were thereby able to report comfortable Common Equity Tier 1 capital ratios
(from 12.4 % to 15.2 %).
The financial positions of the Greek banks have deteriorated steadily since the announcement
of new elections in mid-December 2014. Significant and continuous deposit outflows strongly
weakened their liquidity positions: from mid-December 2014 to end-June 2015, more than 25% of
total deposits were withdrawn. Since Greek banks (and Greece itself) had lost access to money
markets, they had to rely on central bank refinancing. In February 2015, the ECB lifted the waiver
granted to Greek government bonds, which then became ineligible for regular refinancing
operations. In the meantime, it allowed Greek banks to rely on ELA, and successively increased the
ceiling in order to accommodate the rising needs of the Greek banking system. But the deteriorated
economic environment and the political uncertainty had a detrimental impact on the quality of loans
portfolio, with a new acceleration in non-performing loans. The impact of ELA on the funding
costs, as well as the worsening asset quality, casted doubts as to the resilience of Greek banks.

PE 574.404 12
In the end of June 2015, following the failure of negotiations on the closure of the second
programme, the ECB decided to maintain the ELA facility but stopped raising the overall cap,
which triggered the need for capital controls. The banks remained closed for three weeks and a
limit of EUR 60 per day per bank card was imposed, while transfers abroad would need government
approval. On 12 July 2015, the Euro Summit agreement paved the way for an additional lift in the
ELA ceiling and the subsequent reopening of Greek banks. However, the imposition of capital
controls is likely to have long-lasting effects on their asset quality. As a result, the MoU provided
that the ECB would carry-out a comprehensive assessment of the four Greek banks by end of 2015.
The recapitalisation process is completed
On 31 October 2015, the ECB unveiled the results of the 2015 comprehensive assessment. The
four main Greek banks reported capital shortfalls of EUR 4.4 billion in the baseline scenario and
EUR 14.4 billion in the adverse scenario. The outcome was better than initially expected, since an
envelope of EUR 25 billion had been reserved for that purpose in the third economic adjustment
programme. The Greek Parliament approved the new recapitalisation law on the same day
(31 October 2015). Banks were requested to raise private capital through share capital increases,
bond swaps or asset sales.
The capital raising exercise confirmed some investors were willing to invest again in the
Greek banking sector, albeit most of the money injected in 2014 had been lost. Indeed, all four
large Greek banks managed to raise significant amounts of capital (see table 3), and thereby escaped
resolution:
Both Alpha Bank and Eurobank managed to raise the full amount of capital required from
private investors or through the conversion of creditors into equity;
NBG and Piraeus Bank managed to raise from private investors or through conversion of
creditors the amount of capital requested under the baseline scenario, that is to say those two
injections of capital by the Greek authorities were considered precautionary in the meaning of
article 32.4 of the BRRD and therefore did not trigger resolution. In line with State aid rules and
with the Eurogroup statement of 14 August 2015, all subordinated and senior bondholders were
bailed-in in those two banks through the conversion of their notes into new equity, thereby
reducing the amount of State aid needed. The preference shares issued by NBG, which were
held by the Hellenic Republic, were also converted into equity.
The HFSF subscribed two categories of instruments: ordinary shares (25% of the total amount
injected by the HFSF in NBG and Piraeus Bank) and contingent convertible instruments. Those
Box 5: The 2015 comprehensive assessment of the four largest Greek banks
The comprehensive assessment consisted of an asset quality review and a stress test under two
macroeconomic scenarios. The two macroeconomic scenarios were relatively severe (growth of -3.3%,
-3.9% and +0.3% respectively in 2015, 2016 and 2017 in the adverse scenario), as were the thresholds
used to calculate the capital shortfalls (9.5% of CET1 under the AQR and baseline scenario, 8% under the
adverse scenario), notably when compared to the previous EU-wide exercise (8% and 5.5% respectively).
However Greek government exposures bear a 0% risk-weight, in line with the EU regulatory framework.
Table: Results of the 2015 comprehensive assessment
threshold NBG Eurobank Alpha Piraeus Total
CET1 capital amount in EUR as of 30/06/2015 7.412 5.389 6.792 6.189 25.781
Risk Weighted Assets in EUR as of 30/06/2015 63.870 39.218 53.516 57.113 213.716
CET1 capital ratio as of 30/06/2015 11,6% 13,7% 12,7% 10,8% 12,1%
in % post AQR 9,50% 8,1% 8,6% 9,6% 5,5% 7,9%
in the baseline scenario 9,50% 6,8% 8,7% 9,0% 5,2% 7,6%
in the adverse scenario 8,00% -0,2% 1,3% 2,1% -2,3% 0,1%
Capital shortfall(-) / buffer(+) post AQR 9,50% 831- 339- 73 2.188- 3.285-
in EUR in the baseline scenario 9,50% 1.576- 339- 263- 2.213- 4.391-
in the adverse scenario 8,00% 4.602- 2.122- 2.743- 4.933- 14.401-
Source: ECB.
13 PE 574.404
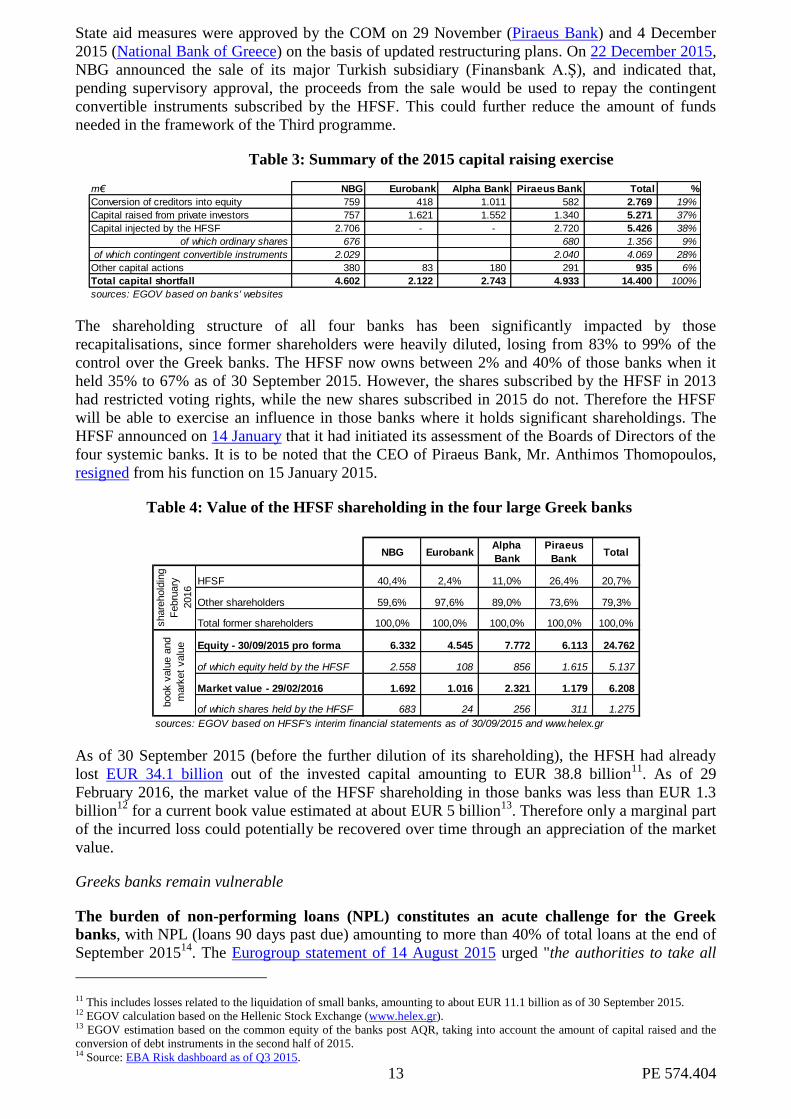
State aid measures were approved by the COM on 29 November (Piraeus Bank) and 4 December
2015 (National Bank of Greece) on the basis of updated restructuring plans. On 22 December 2015,
NBG announced the sale of its major Turkish subsidiary (Finansbank A.Ş), and indicated that,
pending supervisory approval, the proceeds from the sale would be used to repay the contingent
convertible instruments subscribed by the HFSF. This could further reduce the amount of funds
needed in the framework of the Third programme.
Table 3: Summary of the 2015 capital raising exercise
m€ NBG Eurobank Alpha Bank Piraeus Bank Total %
Conversion of creditors into equity 759 418 1.011 582 2.769 19%
Capital raised from private investors 757 1.621 1.552 1.340 5.271 37%
Capital injected by the HFSF 2.706 - - 2.720 5.426 38%
of which ordinary shares 676 680 1.356 9%
of which contingent convertible instruments 2.029 2.040 4.069 28%
Other capital actions 380 83 180 291 935 6%
Total capital shortfall 4.602 2.122 2.743 4.933 14.400 100%
sources: EGOV based on banks' websites
The shareholding structure of all four banks has been significantly impacted by those
recapitalisations, since former shareholders were heavily diluted, losing from 83% to 99% of the
control over the Greek banks. The HFSF now owns between 2% and 40% of those banks when it
held 35% to 67% as of 30 September 2015. However, the shares subscribed by the HFSF in 2013
had restricted voting rights, while the new shares subscribed in 2015 do not. Therefore the HFSF
will be able to exercise an influence in those banks where it holds significant shareholdings. The
HFSF announced on 14 January that it had initiated its assessment of the Boards of Directors of the
four systemic banks. It is to be noted that the CEO of Piraeus Bank, Mr. Anthimos Thomopoulos,
resigned from his function on 15 January 2015.
Table 4: Value of the HFSF shareholding in the four large Greek banks
NBG EurobankAlpha
Bank
Piraeus
BankTotal
HFSF 40,4% 2,4% 11,0% 26,4% 20,7%
Other shareholders 59,6% 97,6% 89,0% 73,6% 79,3%
Total former shareholders 100,0% 100,0% 100,0% 100,0% 100,0%
Equity - 30/09/2015 pro forma 6.332 4.545 7.772 6.113 24.762
of which equity held by the HFSF 2.558 108 856 1.615 5.137
Market value - 29/02/2016 1.692 1.016 2.321 1.179 6.208
of which shares held by the HFSF 683 24 256 311 1.275
sources: EGOV based on HFSF's interim financial statements as of 30/09/2015 and www.helex.gr
share
hold
ing
Febru
ary
2016
book v
alu
e a
nd
mark
et
valu
e
As of 30 September 2015 (before the further dilution of its shareholding), the HFSH had already
lost EUR 34.1 billion out of the invested capital amounting to EUR 38.8 billion11
. As of 29
February 2016, the market value of the HFSF shareholding in those banks was less than EUR 1.3
billion12
for a current book value estimated at about EUR 5 billion13
. Therefore only a marginal part
of the incurred loss could potentially be recovered over time through an appreciation of the market
value.
Greeks banks remain vulnerable
The burden of non-performing loans (NPL) constitutes an acute challenge for the Greek
banks, with NPL (loans 90 days past due) amounting to more than 40% of total loans at the end of
September 201514
. The Eurogroup statement of 14 August 2015 urged "the authorities to take all
11 This includes losses related to the liquidation of small banks, amounting to about EUR 11.1 billion as of 30 September 2015. 12 EGOV calculation based on the Hellenic Stock Exchange (www.helex.gr). 13 EGOV estimation based on the common equity of the banks post AQR, taking into account the amount of capital raised and the
conversion of debt instruments in the second half of 2015. 14 Source: EBA Risk dashboard as of Q3 2015.
PE 574.404 14
necessary steps (...) including opening the market for NPL servicing (...) and exploring the
possibility of a bad bank". A number of measures were therefore committed to that end in the MoU
of 19 August 2015, albeit it did not mention any concrete step toward the creation of a bad bank,
beyond an assessment by the Bank of Greece of the banks' capacity to deal with each NPL segment.
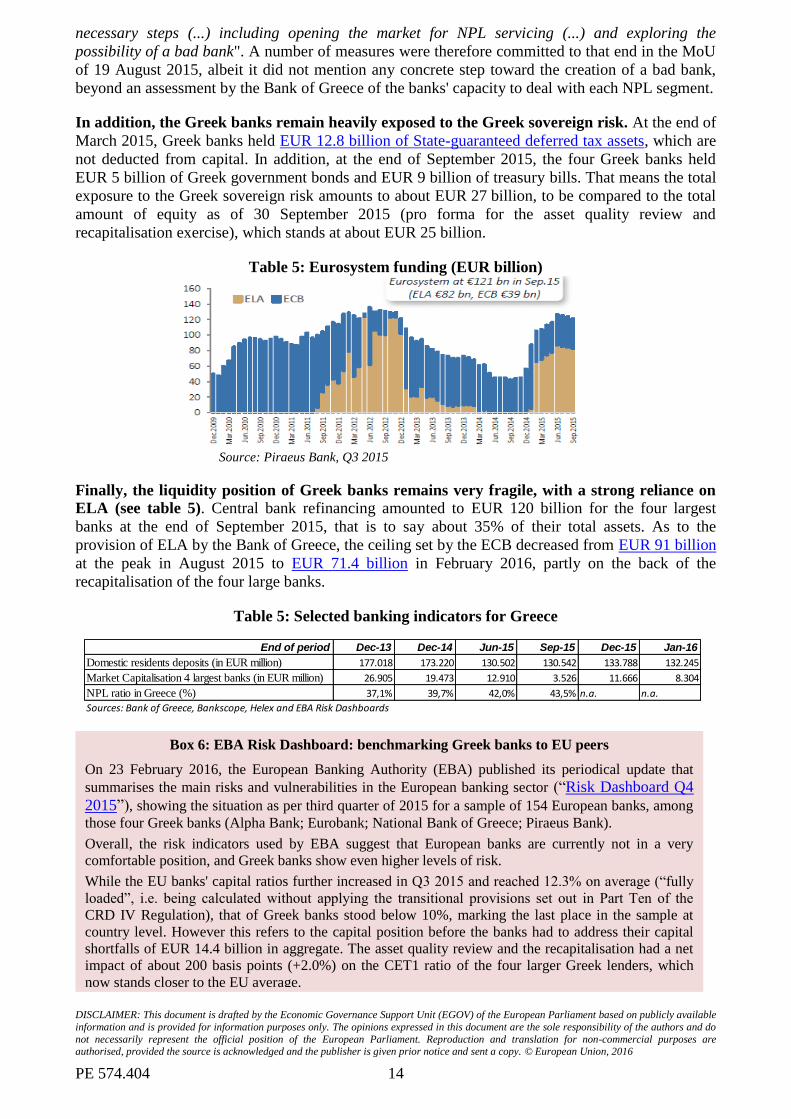
In addition, the Greek banks remain heavily exposed to the Greek sovereign risk. At the end of
March 2015, Greek banks held EUR 12.8 billion of State-guaranteed deferred tax assets, which are
not deducted from capital. In addition, at the end of September 2015, the four Greek banks held
EUR 5 billion of Greek government bonds and EUR 9 billion of treasury bills. That means the total
exposure to the Greek sovereign risk amounts to about EUR 27 billion, to be compared to the total
amount of equity as of 30 September 2015 (pro forma for the asset quality review and
recapitalisation exercise), which stands at about EUR 25 billion.
Table 5: Eurosystem funding (EUR billion)
Source: Piraeus Bank, Q3 2015
Finally, the liquidity position of Greek banks remains very fragile, with a strong reliance on
ELA (see table 5). Central bank refinancing amounted to EUR 120 billion for the four largest
banks at the end of September 2015, that is to say about 35% of their total assets. As to the
provision of ELA by the Bank of Greece, the ceiling set by the ECB decreased from EUR 91 billion
at the peak in August 2015 to EUR 71.4 billion in February 2016, partly on the back of the
recapitalisation of the four large banks.
Table 5: Selected banking indicators for Greece
End of period Dec-13 Dec-14 Jun-15 Sep-15 Dec-15 Jan-16
Domestic residents deposits (in EUR million) 177.018 173.220 130.502 130.542 133.788 132.245
Market Capitalisation 4 largest banks (in EUR million) 26.905 19.473 12.910 3.526 11.666 8.304
NPL ratio in Greece (%) 37,1% 39,7% 42,0% 43,5% n.a. n.a.
Sources: Bank of Greece, Bankscope, Helex and EBA Risk Dashboards
DISCLAIMER: This document is drafted by the Economic Governance Support Unit (EGOV) of the European Parliament based on publicly available
information and is provided for information purposes only. The opinions expressed in this document are the sole responsibility of the authors and do
not necessarily represent the official position of the European Parliament. Reproduction and translation for non-commercial purposes are authorised, provided the source is acknowledged and the publisher is given prior notice and sent a copy. © European Union, 2016
Box 6: EBA Risk Dashboard: benchmarking Greek banks to EU peers
On 23 February 2016, the European Banking Authority (EBA) published its periodical update that
summarises the main risks and vulnerabilities in the European banking sector (“Risk Dashboard Q4
2015”), showing the situation as per third quarter of 2015 for a sample of 154 European banks, among
those four Greek banks (Alpha Bank; Eurobank; National Bank of Greece; Piraeus Bank).
Overall, the risk indicators used by EBA suggest that European banks are currently not in a very
comfortable position, and Greek banks show even higher levels of risk.
While the EU banks' capital ratios further increased in Q3 2015 and reached 12.3% on average (“fully
loaded”, i.e. being calculated without applying the transitional provisions set out in Part Ten of the
CRD IV Regulation), that of Greek banks stood below 10%, marking the last place in the sample at
country level. However this refers to the capital position before the banks had to address their capital
shortfalls of EUR 14.4 billion in aggregate. The asset quality review and the recapitalisation had a net
impact of about 200 basis points (+2.0%) on the CET1 ratio of the four larger Greek lenders, which
now stands closer to the EU average.
In general, the quality of banks’ loan portfolios improved, though remaining a concern. For Greek
banks, however, the level of non-performing loans certainly represents the most challenging burden, as
the average ratio of non-performing loans well exceeded 40% in the third quarter 2015; in comparison,
that ratio stood at only 5.9% at EU level.
Profitability of European banks is in general still low. The average Return-on-Equity decreased in the
third quarter 2015 to 6.4%; Greek banks performed even much worse in this respect, as credit losses
resulted in negative Return-on-Equity rates exceeding minus 20% on average. On the other hand, the
net operating profits (2.9%) and the cost-to-income ratio of Greek banks (about 55%) are better than
PE 574.404 15
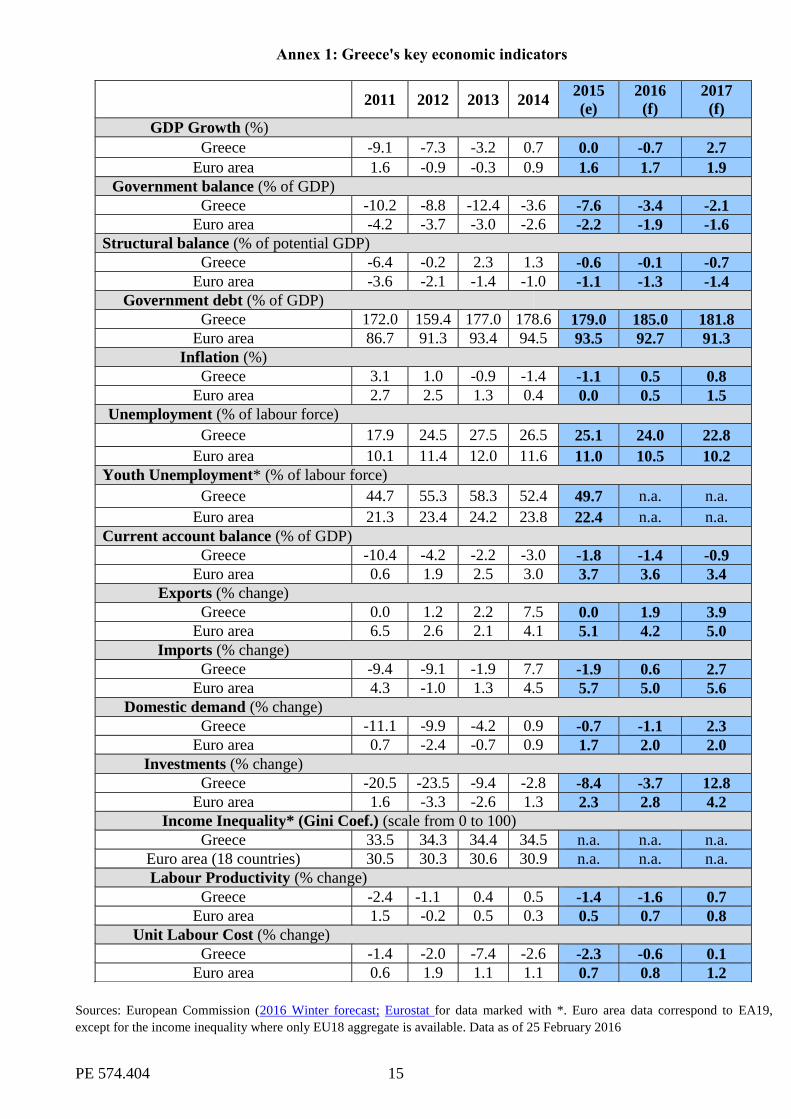
Annex 1: Greece's key economic indicators
2011 2012 2013 2014 2015
(e)
2016
(f)
2017
(f)
GDP Growth (%)
Greece -9.1 -7.3 -3.2 0.7 0.0 -0.7 2.7
Euro area 1.6 -0.9 -0.3 0.9 1.6 1.7 1.9
Government balance (% of GDP)
Greece -10.2 -8.8 -12.4 -3.6 -7.6 -3.4 -2.1
Euro area -4.2 -3.7 -3.0 -2.6 -2.2 -1.9 -1.6
Structural balance (% of potential GDP)
Greece -6.4 -0.2 2.3 1.3 -0.6 -0.1 -0.7
Euro area -3.6 -2.1 -1.4 -1.0 -1.1 -1.3 -1.4
Government debt (% of GDP)
Greece 172.0 159.4 177.0 178.6 179.0 185.0 181.8
Euro area 86.7 91.3 93.4 94.5 93.5 92.7 91.3
Inflation (%)
Greece 3.1 1.0 -0.9 -1.4 -1.1 0.5 0.8
Euro area 2.7 2.5 1.3 0.4 0.0 0.5 1.5
Unemployment (% of labour force)
Greece 17.9 24.5 27.5 26.5 25.1 24.0 22.8
Euro area 10.1 11.4 12.0 11.6 11.0 10.5 10.2
Youth Unemployment* (% of labour force)
Greece 44.7 55.3 58.3 52.4 49.7 n.a. n.a.
Euro area 21.3 23.4 24.2 23.8 22.4 n.a. n.a.
Current account balance (% of GDP)
Greece -10.4 -4.2 -2.2 -3.0 -1.8 -1.4 -0.9
Euro area 0.6 1.9 2.5 3.0 3.7 3.6 3.4
Exports (% change)
Greece 0.0 1.2 2.2 7.5 0.0 1.9 3.9
Euro area 6.5 2.6 2.1 4.1 5.1 4.2 5.0
Imports (% change)
Greece -9.4 -9.1 -1.9 7.7 -1.9 0.6 2.7
Euro area 4.3 -1.0 1.3 4.5 5.7 5.0 5.6
Domestic demand (% change)
Greece -11.1 -9.9 -4.2 0.9 -0.7 -1.1 2.3
Euro area 0.7 -2.4 -0.7 0.9 1.7 2.0 2.0
Investments (% change)
Greece -20.5 -23.5 -9.4 -2.8 -8.4 -3.7 12.8
Euro area 1.6 -3.3 -2.6 1.3 2.3 2.8 4.2
Income Inequality* (Gini Coef.) (scale from 0 to 100)
Greece 33.5 34.3 34.4 34.5 n.a. n.a. n.a.
Euro area (18 countries) 30.5 30.3 30.6 30.9 n.a. n.a. n.a.
Labour Productivity (% change)
Greece -2.4 -1.1 0.4 0.5 -1.4 -1.6 0.7
Euro area 1.5 -0.2 0.5 0.3 0.5 0.7 0.8
Unit Labour Cost (% change)
Greece -1.4 -2.0 -7.4 -2.6 -2.3 -0.6 0.1
Euro area 0.6 1.9 1.1 1.1 0.7 0.8 1.2
Sources: European Commission (2016 Winter forecast; Eurostat for data marked with *. Euro area data correspond to EA19,
except for the income inequality where only EU18 aggregate is available. Data as of 25 February 2016
PE 574.404 16
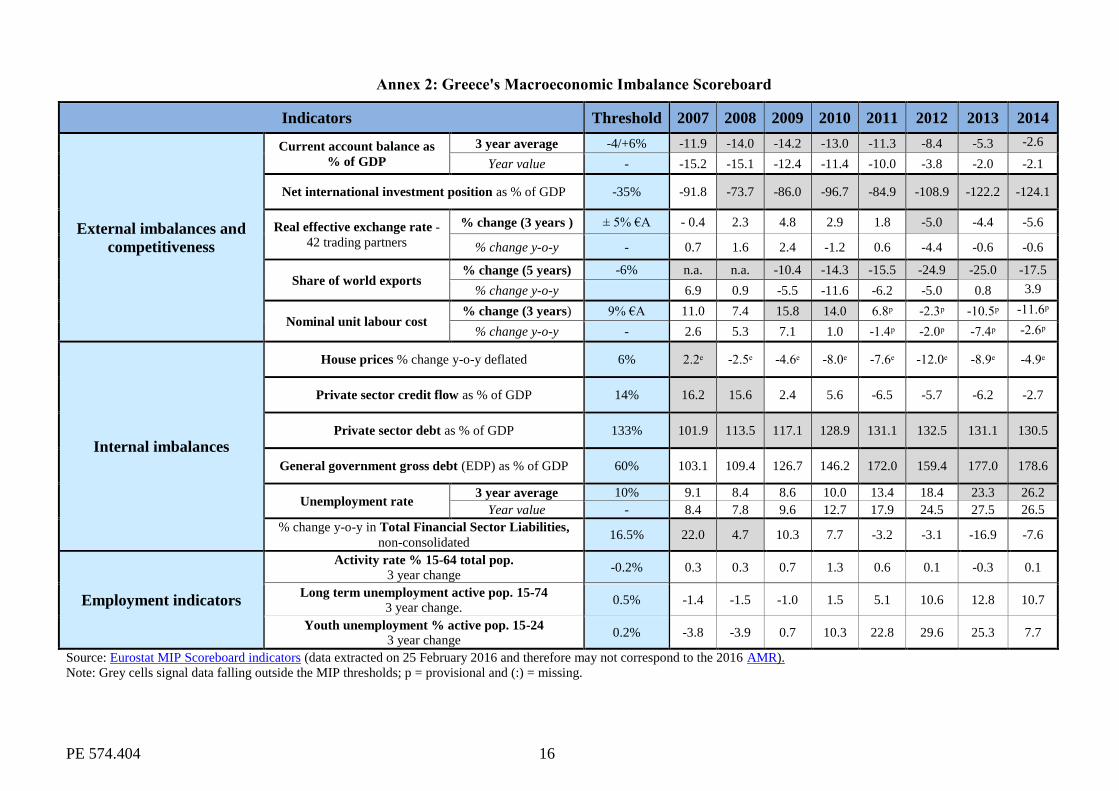
Annex 2: Greece's Macroeconomic Imbalance Scoreboard
Indicators Threshold 2007 2008 2009 2010 2011 2012 2013 2014
External imbalances and
competitiveness
Current account balance as
% of GDP
3 year average -4/+6% -11.9 -14.0 -14.2 -13.0 -11.3 -8.4 -5.3 -2.6
Year value - -15.2 -15.1 -12.4 -11.4 -10.0 -3.8 -2.0 -2.1
Net international investment position as % of GDP -35% -91.8 -73.7 -86.0 -96.7 -84.9 -108.9 -122.2 -124.1
Real effective exchange rate -
42 trading partners
% change (3 years ) ± 5% €A - 0.4 2.3 4.8 2.9 1.8 -5.0 -4.4 -5.6
% change y-o-y - 0.7 1.6 2.4 -1.2 0.6 -4.4 -0.6 -0.6
Share of world exports % change (5 years) -6% n.a. n.a. -10.4 -14.3 -15.5 -24.9 -25.0 -17.5
% change y-o-y 6.9 0.9 -5.5 -11.6 -6.2 -5.0 0.8 3.9
Nominal unit labour cost % change (3 years) 9% €A 11.0 7.4 15.8 14.0 6.8ᵖ -2.3ᵖ -10.5ᵖ -11.6ᵖ
% change y-o-y - 2.6 5.3 7.1 1.0 -1.4ᵖ -2.0ᵖ -7.4ᵖ -2.6ᵖ
Internal imbalances
House prices % change y-o-y deflated 6% 2.2ᵉ -2.5ᵉ -4.6ᵉ -8.0ᵉ -7.6ᵉ -12.0ᵉ -8.9ᵉ -4.9ᵉ
Private sector credit flow as % of GDP 14% 16.2 15.6 2.4 5.6 -6.5 -5.7 -6.2 -2.7
Private sector debt as % of GDP 133% 101.9 113.5 117.1 128.9 131.1 132.5 131.1 130.5
General government gross debt (EDP) as % of GDP 60% 103.1 109.4 126.7 146.2 172.0 159.4 177.0 178.6
Unemployment rate 3 year average 10% 9.1 8.4 8.6 10.0 13.4 18.4 23.3 26.2
Year value - 8.4 7.8 9.6 12.7 17.9 24.5 27.5 26.5
% change y-o-y in Total Financial Sector Liabilities,
non-consolidated 16.5% 22.0 4.7 10.3 7.7 -3.2 -3.1 -16.9 -7.6
Employment indicators
Activity rate % 15-64 total pop. 3 year change
-0.2% 0.3 0.3 0.7 1.3 0.6 0.1 -0.3 0.1
Long term unemployment active pop. 15-74 3 year change.
0.5% -1.4 -1.5 -1.0 1.5 5.1 10.6 12.8 10.7
Youth unemployment % active pop. 15-24 3 year change
0.2% -3.8 -3.9 0.7 10.3 22.8 29.6 25.3 7.7
Source: Eurostat MIP Scoreboard indicators (data extracted on 25 February 2016 and therefore may not correspond to the 2016 AMR).
Note: Grey cells signal data falling outside the MIP thresholds; p = provisional and (:) = missing.
PE 574.404 17
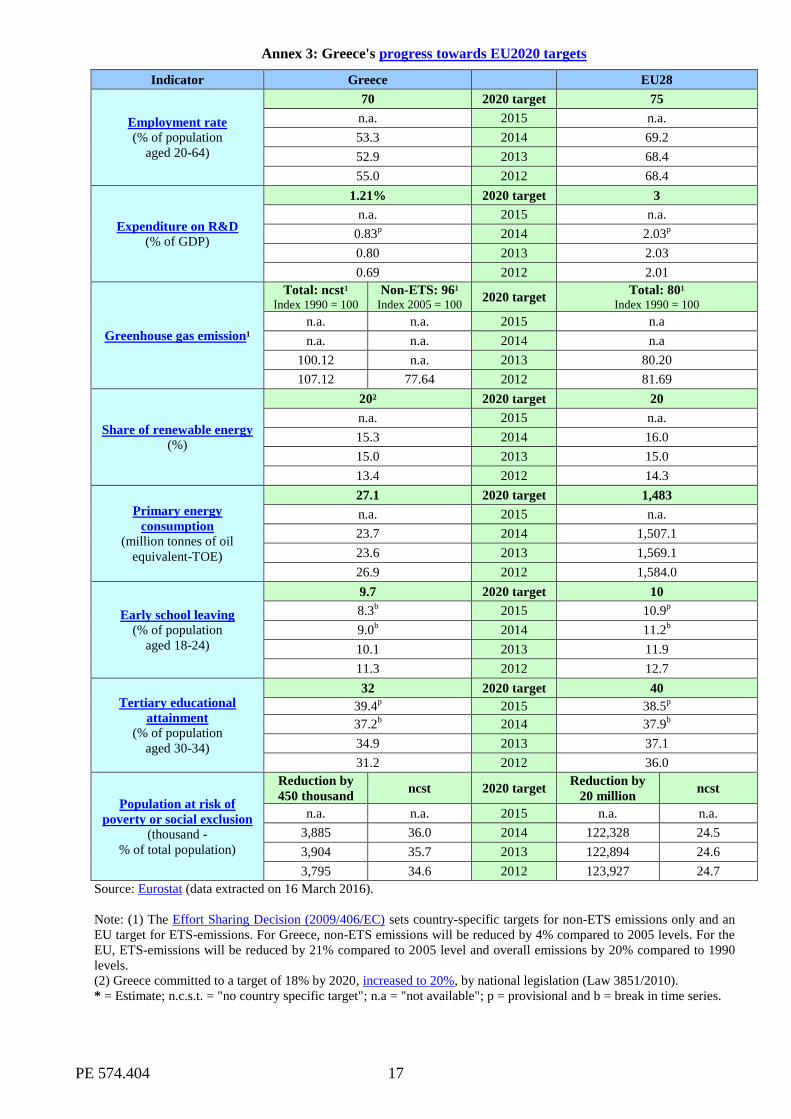
Annex 3: Greece's progress towards EU2020 targets
Indicator Greece EU28
Employment rate
(% of population
aged 20-64)
70 2020 target 75
n.a. 2015 n.a.
53.3 2014 69.2
52.9 2013 68.4
55.0 2012 68.4
Expenditure on R&D
(% of GDP)
1.21% 2020 target 3
n.a. 2015 n.a.
0.83p 2014 2.03
p
0.80 2013 2.03
0.69 2012 2.01
Greenhouse gas emission¹
Total: ncst¹ Index 1990 = 100
Non-ETS: 96¹ Index 2005 = 100
2020 target Total: 80¹
Index 1990 = 100
n.a. n.a. 2015 n.a
n.a. n.a. 2014 n.a
100.12 n.a. 2013 80.20
107.12 77.64 2012 81.69
Share of renewable energy
(%)
20² 2020 target 20
n.a. 2015 n.a.
15.3 2014 16.0
15.0 2013 15.0
13.4 2012 14.3
Primary energy
consumption
(million tonnes of oil
equivalent-TOE)
27.1 2020 target 1,483
n.a. 2015 n.a.
23.7 2014 1,507.1
23.6 2013 1,569.1
26.9 2012 1,584.0
Early school leaving
(% of population
aged 18-24)
9.7 2020 target 10
8.3b 2015 10.9
p
9.0b 2014 11.2
b
10.1 2013 11.9
11.3 2012 12.7
Tertiary educational
attainment
(% of population
aged 30-34)
32 2020 target 40
39.4p 2015 38.5
p
37.2b 2014 37.9
b
34.9 2013 37.1
31.2 2012 36.0
Population at risk of
poverty or social exclusion
(thousand -
% of total population)
Reduction by
450 thousand ncst 2020 target
Reduction by
20 million ncst
n.a. n.a. 2015 n.a. n.a.
3,885 36.0 2014 122,328 24.5
3,904 35.7 2013 122,894 24.6
3,795 34.6 2012 123,927 24.7
Source: Eurostat (data extracted on 16 March 2016).
Note: (1) The Effort Sharing Decision (2009/406/EC) sets country-specific targets for non-ETS emissions only and an
EU target for ETS-emissions. For Greece, non-ETS emissions will be reduced by 4% compared to 2005 levels. For the
EU, ETS-emissions will be reduced by 21% compared to 2005 level and overall emissions by 20% compared to 1990
levels.
(2) Greece committed to a target of 18% by 2020, increased to 20%, by national legislation (Law 3851/2010).
* = Estimate; n.c.s.t. = "no country specific target"; n.a = "not available"; p = provisional and b = break in time series.


![eGov-Oct-2011-[6]-eGov Subscription](https://img.pdfslide.net/doc/110x75/568c3b901a28ab0235aaa1ac/egov-oct-2011-6-egov-subscription.jpg)


![eGov-Aug-2010-[7]-eGov Innovations](https://img.pdfslide.net/doc/110x75/568c49e51a28ab491695febc/egov-aug-2010-7-egov-innovations.jpg)