Embed Size (px)
Citation preview
Gre
en G
row
thEW
EA
53520-1203-1010
www.ewea.org
The impact of wind energy on jobs and the economy
A report by the European Wind Energy Association - April 2012
Green GrowthAbout EWEAEWEA is the voice of the wind industry, actively promoting wind power in Europe and worldwide. It has over 700 members from almost 60 countries, including wind turbine manufacturers with a leading share of the world wind power market, plus component suppliers, research institutes, national wind and renewables associations, developers, contractors, electricity providers, fi nance and insurance companies, and consultants. This combined strength makes EWEA the world’s largest and most powerful wind energy network.
Rue d’Arlon 80 | B-1040 BrusselsTel: +32 2 213 18 11 - Fax: +32 2 213 18 90E-mail: [email protected]
ISBN 978 - 2 - 930670 - 00 - 3
23799_EWEA_2012 Cover_corrections2.indd 1 28/03/12 15:57
Green GrowthThe impact of wind energy on jobs and the economy
a report by the European Wind Energy Association
Text and analysis: Athanasia Arapogianni, Jacopo Moccia (European Wind Energy Association)
Data collection and data analysis: Deloitte
Contributing author: Justin Wilkes (European Wind Energy Association)
Revision and editing: Sarah Azau (European Wind Energy Association)
Design coordination: Raffaella Bianchin (European Wind Energy Association)
Cover photo: LM Glasfi ber
Design: www.devisu.com
Print: www.artoos.be
EWEA has joined a climate neutral printing programme. It makes choices as to what it prints and how, based
on environmental criteria. The CO2 emissions of the printing process are then calculated and compensated by
green emission allowances purchased from a sustainable project.
Published in March 2012
ISBN: 978-2-930670-00-3
23799_EWEA_2012.indd 123799_EWEA_2012.indd 1 28/03/12 17:2528/03/12 17:25
2 Green Growth – The impact of wind energy on jobs and the economy
“Wind energy is a pivotal element in the necessary transition to a green growth
economy. The way I see it, decarbonisation is a prerequisite to growth. Investments
in energy system transformation will drive growth and employment in a wide range of
sectors. Every euro spent on the green transition is an investment in European jobs.”
Danish Energy and Climate Minister Martin Lidegaard in Wind Directions magazine,
April 2012
23799_EWEA_2012.indd 223799_EWEA_2012.indd 2 28/03/12 17:2528/03/12 17:25
Green Growth – The impact of wind energy on jobs and the economy 3
ContentExecutive summary .......................................................................................................................4
1. Introduction ............................................................................................................................ 10
2. Current status of wind energy and growth forecasts ......................................................... 12
3. Direct impact of wind energy sector on EU economy ........................................................ 16
3.1 Direct contribution to GDP ......................................................................................................... 17
3.2 Wind industry sub-sectors’ contribution to direct GDP ..................................................................... 21
3.3 Wind energy sector exports and imports ....................................................................................... 31
3.4 Direct impact on employment ....................................................................................................... 34
3.5 Tax balance ................................................................................................................................ 37
3.6 Avoided fuel costs ....................................................................................................................... 38
4. Indirect impact of the wind energy sector on the EU economy ........................................ 40
4.1 Indirect contribution to GDP .......................................................................................................... 41
4.2 Indirect employment .................................................................................................................... 43
5. Overall impact of the wind energy sector on the EU economy ......................................... 44
5.1 Total impact on GDP .................................................................................................................... 45
5.2 Total employment ........................................................................................................................ 48
6. Economic effort in R&D ........................................................................................................ 50
7. Forecast to 2020 and 2030 ................................................................................................. 54
7.1 Total contribution to GDP .............................................................................................................. 55
7.2 Employment ................................................................................................................................ 58
8. EU wind energy sector – the global leader .......................................................................... 60
8.1 Activity of European energy players in non-EU countries .................................................................. 61
9. Annexes .................................................................................................................................. 64
Annexe I. Methodology ...................................................................................................................... 65
Annexe II. Calculating the wind energy sector’s direct contribution to GDP .............................................. 66
Annexe III. Calculating the wind energy sector’s indirect contribution to GDP ........................................... 69
Annexe IV. Activity of European wind energy players in third countries ..................................................... 73
Annexe V. Contribution to GDP and employment by MW/MWh ................................................................ 91
23799_EWEA_2012.indd 323799_EWEA_2012.indd 3 28/03/12 17:2528/03/12 17:25
EXECUTIVE SUMMARY
Photo
: Sie
menns
23799_EWEA_2012.indd 423799_EWEA_2012.indd 4 28/03/12 17:2528/03/12 17:25
Green Growth – The impact of wind energy on jobs and the economy 5
The wind energy industry: a driver for economic
growth
The wind energy industry is a proven recession-
busting industry and investment in the wind power
sector should be seen as a way to restore Europe’s
economy to health. Putting in place stable legislative
frameworks which encourage the building, installing
and operating of wind turbines has resulted in eco-
nomic growth since the fi nancial and economic crisis,
and will continue to lead to economic growth.
Governments and the European Commission should
therefore see wind energy as not only a solution to
climate change and a way to improve energy security,
but also a way to boost economic growth and com-
petitiveness. As such, investment in the wind indus-
try should be seen as a strategy to deliver economic
growth, and stable legislative frameworks to promote
the development of the wind industry should be main-
tained and enhanced, even in times of austerity.
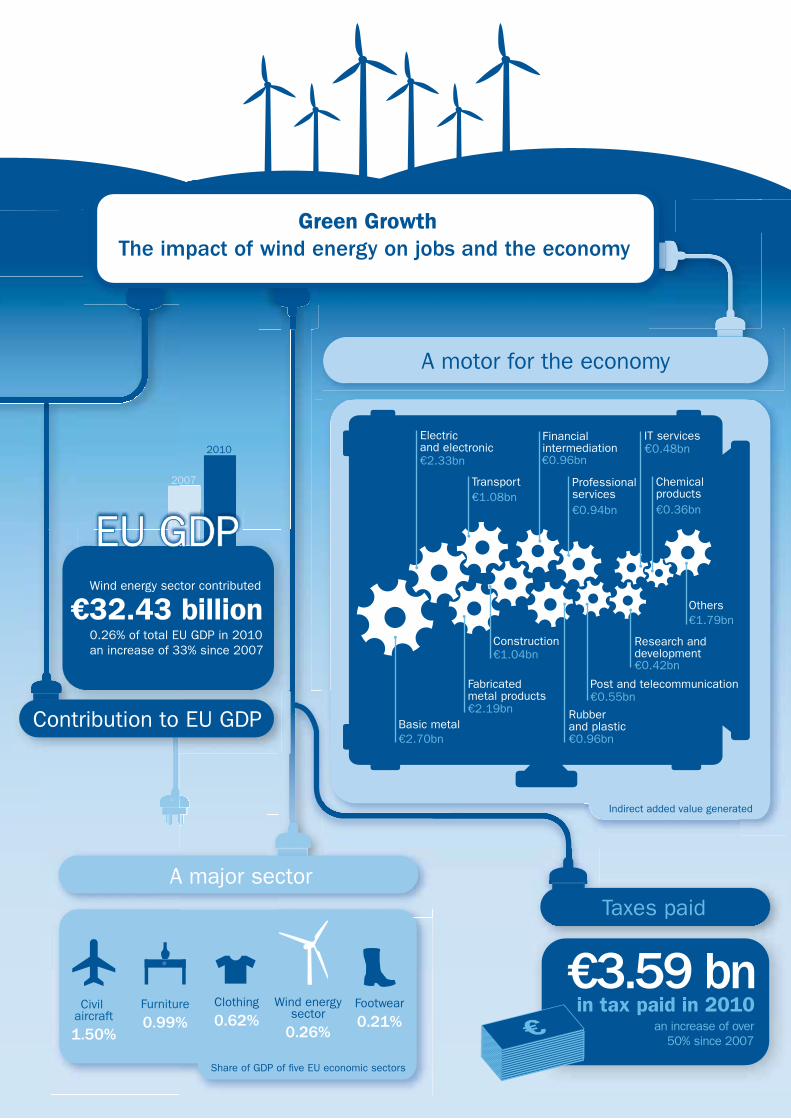
In 2010 the wind energy sector – both directly and
indirectly – contributed €32.43 billion (bn) to the EU’s
GDP, 0.26% of the EU’s total GDP for that year. The
contribution of the wind energy sector is higher than
the contribution of the footwear industry (0.21%).
Wind energy’s contribution can also be compared to
the furniture sector, which contributed 0.99% of EU
GDP in 2010, to the civil aviation sector, which con-
tributed 1.5% of EU GDP in 2010, to the automotive
industry at 6.5% and to construction at 9.9%.
In 2010 the increase in the wind industry’s contri-
bution to GDP, at 4.1%, was twice as high as the
growth of GDP itself. Between 2007 and 2010 the
wind energy sector increased its contribution to GDP
by 33%. The wind industry is growing faster than the
EU’s economy as a whole and this will remain the
case over the next two decades.
As such the wind industry will continue to be a driver
for economic growth over the next twenty years. In
10 years’ time the wind industry’s contribution to
GDP will increase almost three-fold, with the sector
expected to generate 0.59% of the EU’s GDP whilst
having doubled employment. In twenty years’ time the
wind industry’s contribution to GDP will increase fi ve-
fold to reach €174 bn, almost 1% of total EU GDP, and
employment will have increased by a factor of three.
The wind energy industry: a major industrial
exporter
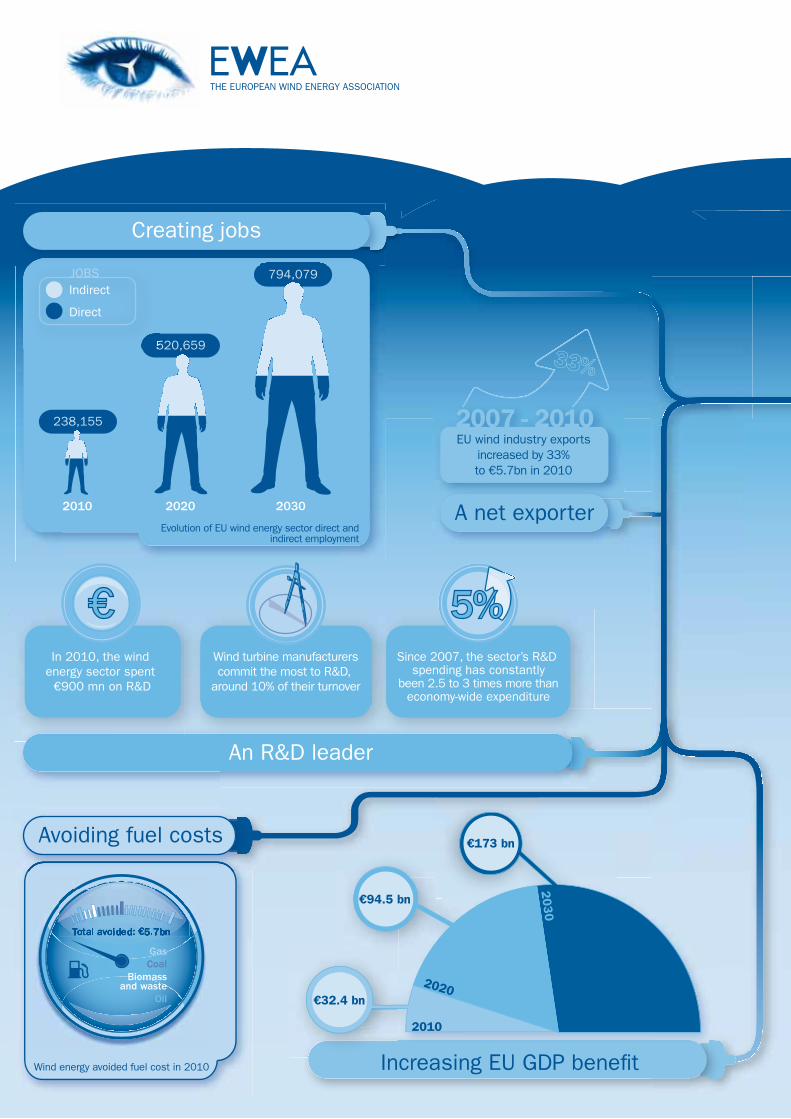
€8.8 bn worth of products and services were exported
by the European wind industry in 2010, up 4.2% on
the previous year and up 33% since 2007. In con-
trast, the sector imported €3.2 bn worth of products
and services in 2010, making it a net exporter of €5.7
bn worth of products and services1.
The wind energy industry: contributing taxes
Tax payments from companies in the wind energy sec-
tor amounted to €3.59 bn in 2010, mostly corporate
and income taxes but also regional and local taxes,
and property taxes. Taxes paid by the wind industry
have increased by over 50% since 2007.
The wind energy industry: avoiding fuel costs
Wind energy displaces electricity generated by fos-
sil fuels, which not only reduces electricity prices
and CO2 emissions, but also avoids the cost of buy-
ing those fuels. In 2010 avoided fuel costs (for coal,
oil, gas, biomass, waste) from wind power production
was €5.71 bn. For the 2007 to 2010 period, wind
energy avoided fuel costs totalling €20.18 bn.
The wind energy sector: a motor for other
European economic sectors
The wind industry buys and sells products and ser-
vices from and to other economic sectors. This
1 €8.831 billion of exports minus €3.171 billion of imports comes to €5.66 billion, rounded up to €5.7 billion.
23799_EWEA_2012.indd 523799_EWEA_2012.indd 5 28/03/12 17:2528/03/12 17:25
6 Green Growth – The impact of wind energy on jobs and the economy
Executive summary
offshore, as well as increased R&D.
Binding 2030 renewable energy target
European leadership of the wind industry is a result
of successful European policy frameworks for renew-
ables, centred on renewable energy targets. These
were initiated with the 1997 European Commission
White Paper on Renewable Sources of Energy and fol-
lowed up with legislation and targets for 2010 and
2020. EWEA believes that the most effective way
to maintain and expand Europe’s leadership in wind
energy would be a continuation of those policies in
the form of a binding 2030 renewable energy target,
together with effective national implementation of the
existing Renewable Energy Directive.
EU fi nancial commitment to R&D
The EU has already made a political commitment
to develop renewable energy and to increase public
spending for technological R&D. Now it is crucial for
the EU to take action and commit to fi nancing the
€6 bn 10 year wind energy R&D programme of the
European Wind Initiative (under the EU’s SET-Plan).
Industry has already committed to contributing 50%
of the fi nancing, with research focused on new tur-
bines and components, offshore technology, grid
integration, and resource assessment.
Removal of trade and investment barriers
The European Union should take the lead in pursu-
ing an international trade agreement on environmen-
tal goods and services (EGSA), focused on renewable
energy technologies in order to ensure the removal of
all trade barriers, both tariff and non-tariff barriers,
including local content requirements. The EU should
also give high priority to improving market access for
the wind industry in relation to FTA negotiations with
the EU’s main trading partners.
Development of electricity infrastructure, sys-
tem operation and markets
The European Commission should continue its devel-
opment of an interconnected European power sys-
tem. European wind turbine manufacturers have
interdependence between sectors means that the
wind industry is a driving force for many other indus-
tries – including metals, electric and electronic
equipment, IT, construction, transport, and fi nan-
cial services. As a result the growing wind industry
has helped other industrial and economic sectors
weather the economic crisis.
The wind energy sector: creating jobs in Europe
Employment in the wind energy sector stood at
238,1542. Between 2007 and 2010, the number
of jobs in the sector grew by nearly 30%, whilst EU
unemployment rose by 9.6%3.
The wind energy sector: maintaining global
technology leadership through R&D
The wind industry spent more than 5% of its total
turnover on research and development (R&D) in
2010. Since 2007, R&D spending has consistently
represented over 5% of the sector’s turnover, almost
three times higher than the economy-wide average,
and well above the EU’s objective of 3% of GDP being
invested in R&D. Wind turbine manufacturers commit
the most to R&D – around 10% of their total turnover
– highlighting how well placed European wind power
companies are to take on the challenge emerging
from China, the US, India, South Korea and Japan.
The wind energy sector: a global leader
Over 48% of European wind energy companies also
work outside the EU, employing some 20,000 EU
professionals in non-EU countries. Of the 10 biggest
wind turbine manufacturers in the world, four are
EU-based. Of the ten biggest wind energy developers
in the world, fi ve are EU-based.
Policy recommendations
Key elements of maintaining the growth of the
European wind power sector and European leader-
ship of the sector are technology development and
policies to support the expansion of a European wind
industry, that is, policies to promote the continued
development of European markets, both onshore and
2 The word ”jobs” is used in this report refers to ”full time equivalents” or ”FTEs” – that is, the number of full-time posts the total
number of hours worked represents. It may not correspond exactly to the total number of people employed due to some people
working part-time.3 August 2011. Source: Eurostat.
23799_EWEA_2012.indd 623799_EWEA_2012.indd 6 28/03/12 17:2528/03/12 17:25
Green Growth – The impact of wind energy on jobs and the economy 7
mastered the technical challenges associated with
increasing penetration levels of wind energy by equip-
ping turbines with highly sophisticated grid integra-
tion features. Europe is a global leader in R&D on
grid infrastructure technologies, including the con-
cept of the offshore super node linking together off-
shore wind farms, and High Voltage Direct Current
(HVDC) power transmission projects, such as those
being developed and operated by European compa-
nies in China and India (although interestingly not yet
in Europe).
Ambitious climate targets
An EU target of 30% domestic greenhouse gas (GHG)
reductions by 2020 is crucial to direct investments
towards a sector which delivers emissions reduc-
tions in Europe. By 2020 wind energy can deliver
domestically 31% of the EU’s 20% emissions reduc-
tion target, or 20% of a potential 30% emissions
reduction target.
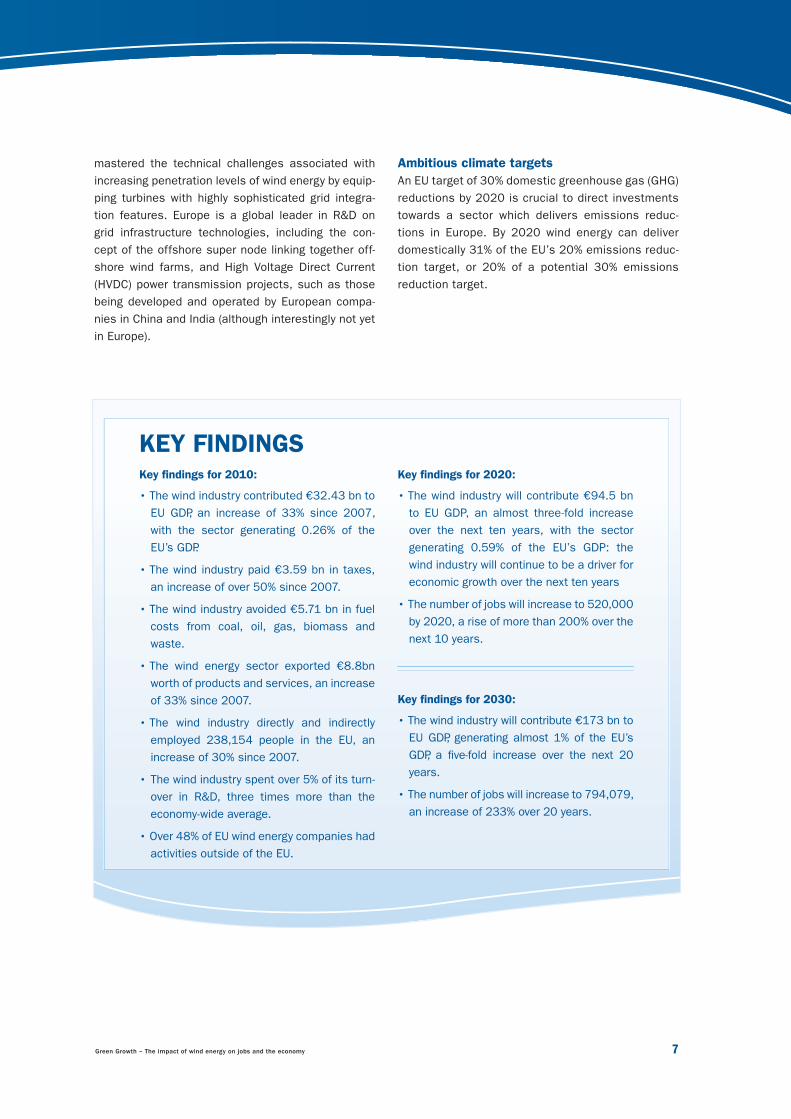
Key fi ndings for 2010:
• The wind industry contributed €32.43 bn to
EU GDP, an increase of 33% since 2007,
with the sector generating 0.26% of the
EU’s GDP.
• The wind industry paid €3.59 bn in taxes,
an increase of over 50% since 2007.
• The wind industry avoided €5.71 bn in fuel
costs from coal, oil, gas, biomass and
waste.
• The wind energy sector exported €8.8bn
worth of products and services, an increase
of 33% since 2007.
• The wind industry directly and indirectly
employed 238,154 people in the EU, an
increase of 30% since 2007.
• The wind industry spent over 5% of its turn-
over in R&D, three times more than the
economy-wide average.
• Over 48% of EU wind energy companies had
activities outside of the EU.
Key fi ndings for 2020:
• The wind industry will contribute €94.5 bn
to EU GDP, an almost three-fold increase
over the next ten years, with the sector
generating 0.59% of the EU’s GDP: the
wind industry will continue to be a driver for
economic growth over the next ten years
• The number of jobs will increase to 520,000
by 2020, a rise of more than 200% over the
next 10 years.
Key fi ndings for 2030:
• The wind industry will contribute €173 bn to
EU GDP, generating almost 1% of the EU’s
GDP, a fi ve-fold increase over the next 20
years.
• The number of jobs will increase to 794,079,
an increase of 233% over 20 years.
KEY FINDINGS
23799_EWEA_2012.indd 723799_EWEA_2012.indd 7 28/03/12 17:2528/03/12 17:25
23799_EWEA_2012.indd 823799_EWEA_2012.indd 8 28/03/12 17:2528/03/12 17:25
23799_EWEA_2012.indd 923799_EWEA_2012.indd 9 28/03/12 17:2528/03/12 17:25
Chapter 1: Introduction
10 Green Growth – The impact of wind energy on jobs and the economy
T1 INTRODUCTION1
Photo
: Fein
date
23799_EWEA_2012.indd 1023799_EWEA_2012.indd 10 28/03/12 17:2528/03/12 17:25
Green Growth – The impact of wind energy on jobs and the economy 11
The wind power industry has grown considerably
over the past 15 years. In 1997, when the European
Commission published its White Paper with a target
of 40 GW wind power by 2010, there were 4.8 GW of
installed wind power capacity in the EU. By the end of
2011 this fi gure had risen to 94 GW, able to produce
204 TWh of electricity and meet 6.3% of the EU’s
total electricity demand.
Wind energy makes a signifi cant contribution to the
EU’s energy and climate objectives, competitive-
ness, and energy security. Over the next 20 years,
wind energy’s growth will continue. The European
Wind Energy Association (EWEA) expects 230 GW of
installed capacity in 2020 and 400 GW by 2030. Wind
power is gearing up to become the main power tech-
nology in the EU. The European Commission, in its
Energy Roadmap 20504, expects wind energy to be
the key technology by 2050, supplying more electric-
ity than any other technology and meeting between
31.6% and 48.7% of Europe’s electricity production.
Consequently, as an industrial sector, the wind indus-
try has an increasingly important role in Europe’s
economy, contributing to the creation of value, to
gross domestic product (GDP) and job creation, and
to the development of other economic sectors5.
This report evaluates the impact of the wind energy
industry on the European economy between 2007 and
the end of 2010. Between September and December
2011, 350 companies working in wind energy in
the EU were surveyed by Deloitte. Their impact on
Europe’s economy was evaluated by analysing eight
indicators.
• The direct contribution of the sector and its sub-
sectors to the EU’s GDP: wind energy developers,
wind turbine manufacturers, manufacturers of ded-
icated equipment and components, and service
providers.
• Specifi cation of the wind industry’s main turnover
components: internal demand, external demand, to-
tal revenues, expenses, employee compensation,
business cash fl ow, and so on.
• Contribution to job creation in the different
sub-sectors.
• Indirect contribution to other GDP sectors: metallur-
gy, electronic equipment providers, fi nancial services,
professional services, etc.
• Indirect contribution to job creation in other economic
sectors.
• Tax balance assessment: corporate tax, local and re-
gional taxes.
• Impact on balance of trade: exports and imports
fi gures.
• Comparison of the wind energy sector’s contribution
to GDP with that of other economic sectors.
Furthermore, based on the projected growth of wind
power over the coming 20 years, the report also cal-
culates the impact the sector will have in 2020 and
2030.
• Direct and indirect contribution to GDP of the sector.
• Direct and indirect contribution to job creation.
Finally, the report evaluates the global importance of
the European wind industry.
• Number of European companies among the world-
wide leaders.
• Volume of exports.
• Existence of complementary industries and service
providers (percentage of supplies from European
companies).
4 http://ec.europa.eu/energy/energy2020/roadmap/index_en.htm5 Gross domestic product (GDP) is defi ned as the market value of all fi nal goods and services produced in a country during a time
period. GDP is the sum of fi nal consumption expenditure, gross capital formation (GCF), and net exports (exports minus imports).
23799_EWEA_2012.indd 1123799_EWEA_2012.indd 11 28/03/12 17:2528/03/12 17:25
Chapter 2: Current status of wind energy and growth forecasts
12 Green Growth – The impact of wind energy on jobs and the economy
CURRENT STATUS OF WIND ENERGY AND GROWTH FORECASTS2
Photo
: Em
erc
on
23799_EWEA_2012.indd 1223799_EWEA_2012.indd 12 28/03/12 17:2528/03/12 17:25

Green Growth – The impact of wind energy on jobs and the economy 13
In 2010 installed wind energy capacity increased by
9.3 GW to reach a total of 84.3 GW in the EU, a 12.4%
increase on the previous year. The largest share of
new capacity was installed in Spain (1,516 MW), fol-
lowed by Germany (1,493 MW), France (1,086 MW),
United Kingdom (962 MW) and Italy (948 MW).
Germany and Spain each installed 16% of the EU’s
total new capacity in 2010. Moreover, Germany has
32% and Spain 25% of all installed wind capacity in
the EU.
TABLE 2.1 2010 ANNUAL AND CUMULATIVE INSTALLED WIND POWER CAPACITY IN EU MEMBER STATES
Annual (MW) 2010 Total (MW) 2010 % of total EU capacity
Austria 16 1,011 1.2%
Belgium 350 911 1.1%
Bulgaria 198 375 0.4%
Cyprus 82 82 0.1%
Czech Republic 23 215 0.3%
Denmark 364 3,798 4.5%
Estonia 7 149 0.2%
Finland 52 197 0.2%
France 1,086 5,660 6.7%
Germany 1,493 27,214 32.3%
Greece 123 1,208 1.4%
Hungary 94 295 0.3%
Ireland 118 1,428 1.7%
Italy 948 5,797 6.9%
Latvia 2 31 0%
Lithuania 63 154 0.2%
Luxembourg 7 42 0%
Malta 0 0 0%
Netherlands 32 2,245 2.7%
Poland 382 1,107 1.3%
Portugal 363 3,898 4.6%
Romania 448 462 0.5%
Slovakia 0 3 0%
Slovenia 0 0 0%
Spain 1,516 20,676 24.5%
Sweden 604 2,163 2.6%
United Kingdom 962 5,204 6.2%
European Union 9,332 84,324
23799_EWEA_2012.indd 1323799_EWEA_2012.indd 13 28/03/12 17:2528/03/12 17:25
Chapter 2: Current status of wind energy and growth forecasts
14 Green Growth – The impact of wind energy on jobs and the economy
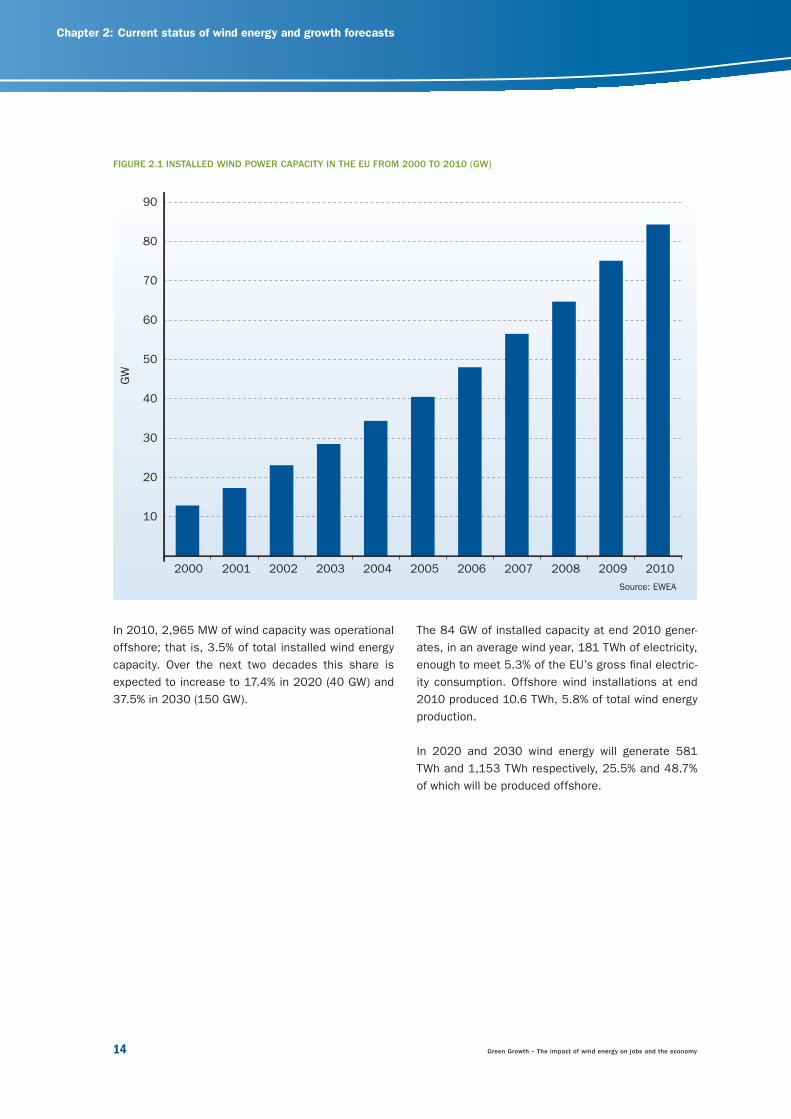
In 2010, 2,965 MW of wind capacity was operational
offshore; that is, 3.5% of total installed wind energy
capacity. Over the next two decades this share is
expected to increase to 17.4% in 2020 (40 GW) and
37.5% in 2030 (150 GW).
FIGURE 2.1 INSTALLED WIND POWER CAPACITY IN THE EU FROM 2000 TO 2010 (GW)
10
20
30
40
50
60
70
80
90
2000 2001 2002 2003 2004 2005 2006 2007 2008 2009 2010
GW
The 84 GW of installed capacity at end 2010 gener-
ates, in an average wind year, 181 TWh of electricity,
enough to meet 5.3% of the EU’s gross fi nal electric-
ity consumption. Offshore wind installations at end
2010 produced 10.6 TWh, 5.8% of total wind energy
production.
In 2020 and 2030 wind energy will generate 581
TWh and 1,153 TWh respectively, 25.5% and 48.7%
of which will be produced offshore.
Source: EWEA
23799_EWEA_2012.indd 1423799_EWEA_2012.indd 14 28/03/12 17:2528/03/12 17:25
Green Growth – The impact of wind energy on jobs and the economy 15
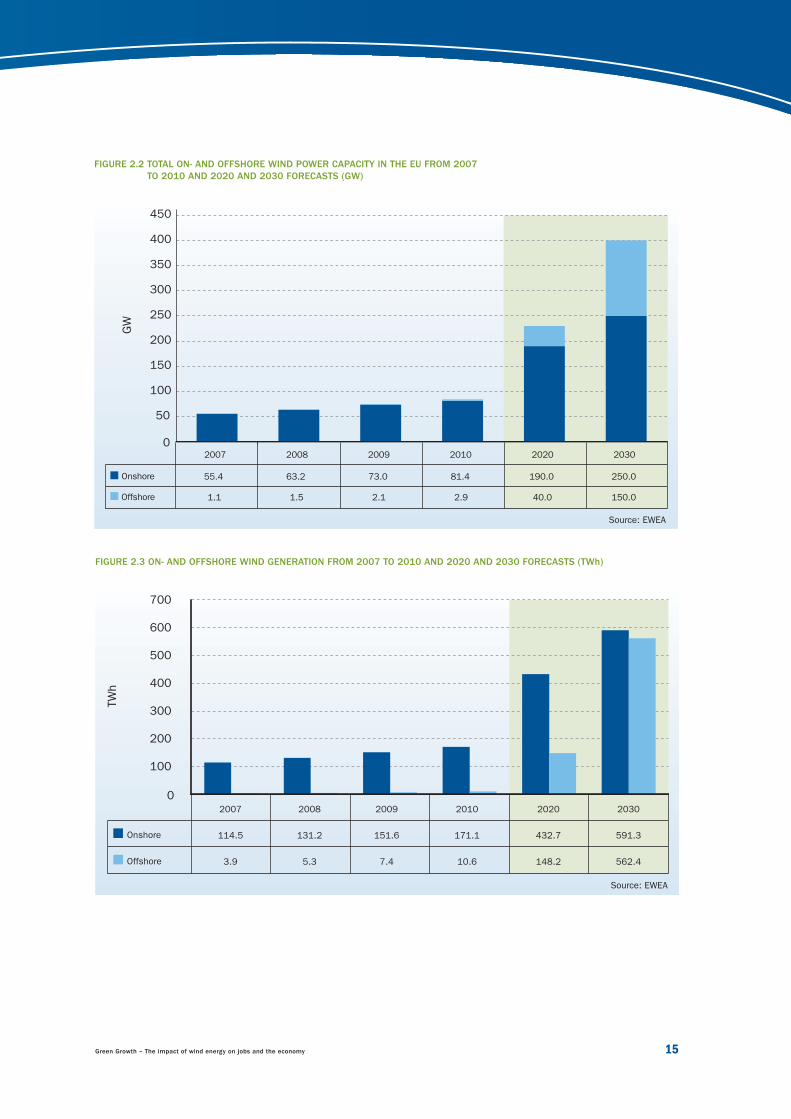
FIGURE 2.2 TOTAL ON- AND OFFSHORE WIND POWER CAPACITY IN THE EU FROM 2007
TO 2010 AND 2020 AND 2030 FORECASTS (GW)
50
100
150
200
250
300
350
400
450
2007 2008 2009 2010 2020 2030
GW
Offshore 1.1 1.5 2.1 2.9 40.0 150.0
Onshore 55.4 63.2 73.0 81.4 190.0 250.0
0
Onshore
Offshore
2007
114.5
3.9
2008
131.2
5.3
2009
151.6
7.4
2010
171.1
10.6
2020
432.7
148.2
2030
591.3
562.4
0
100
200
300
400
500
600
700
TW
h
FIGURE 2.3 ON- AND OFFSHORE WIND GENERATION FROM 2007 TO 2010 AND 2020 AND 2030 FORECASTS (TWh)
Source: EWEA
Source: EWEA
23799_EWEA_2012.indd 1523799_EWEA_2012.indd 15 28/03/12 17:2528/03/12 17:25
Chapter 3: Direct impact of wind energy sector on EU economy
16 Green Growth – The Impact of Wind Energy on Jobs and The Economy
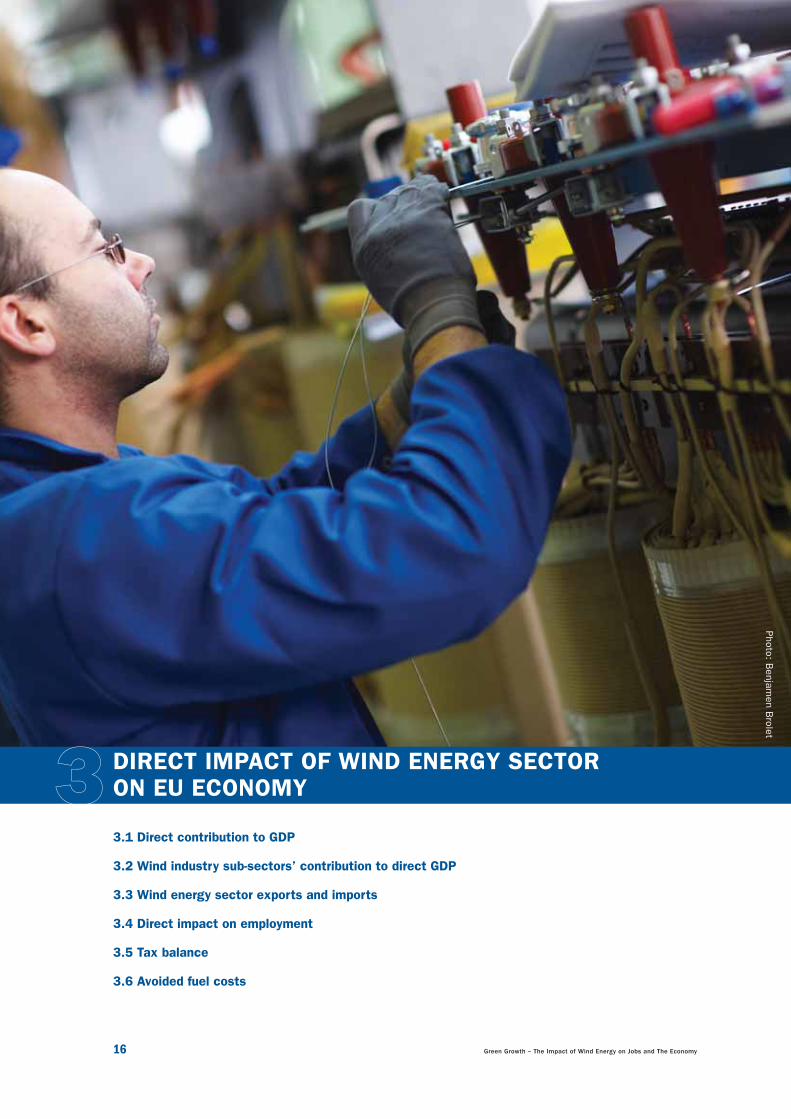
DIRECT IMPACT OF WIND ENERGY SECTOR ON EU ECONOMY33.1 Direct contribution to GDP
3.2 Wind industry sub-sectors’ contribution to direct GDP
3.3 Wind energy sector exports and imports
3.4 Direct impact on employment
3.5 Tax balance
3.6 Avoided fuel costs
Photo
: Benja
men B
role
t
23799_EWEA_2012.indd 1623799_EWEA_2012.indd 16 28/03/12 17:2528/03/12 17:25
Green Growth – The impact of wind energy on jobs and the economy 17
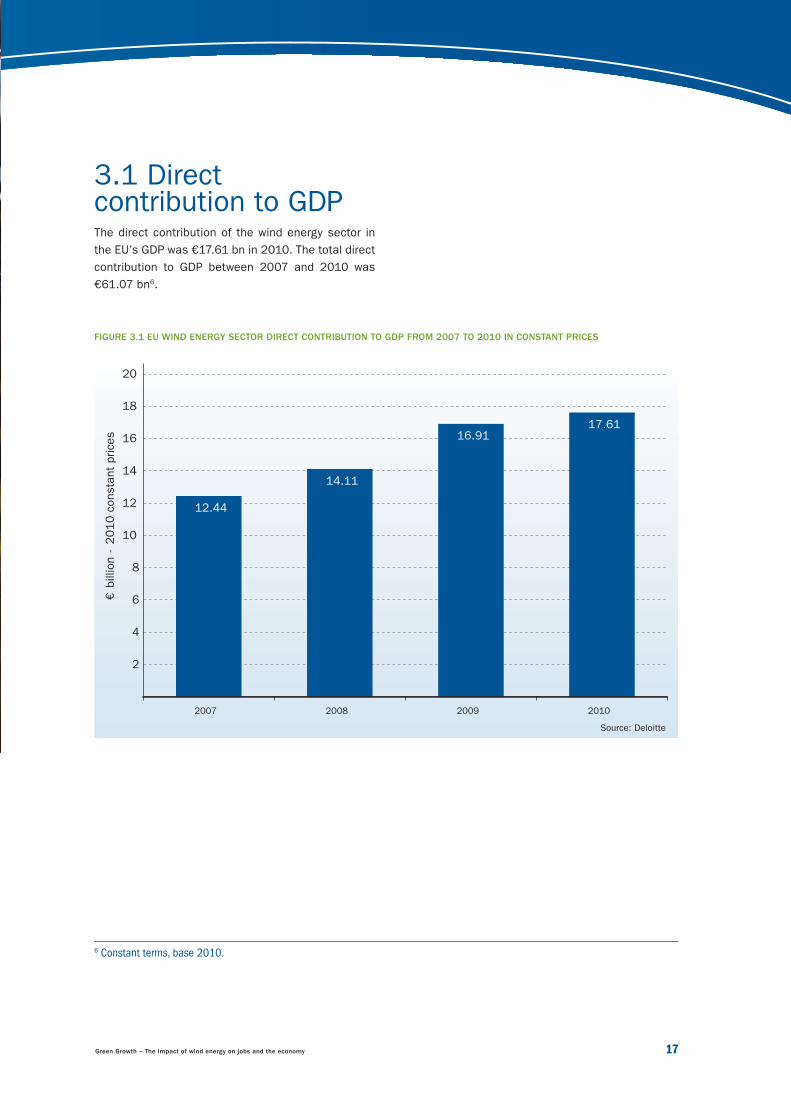
3.1 Direct contribution to GDPThe direct contribution of the wind energy sector in
the EU’s GDP was €17.61 bn in 2010. The total direct
contribution to GDP between 2007 and 2010 was
€61.07 bn6.
FIGURE 3.1 EU WIND ENERGY SECTOR DIRECT CONTRIBUTION TO GDP FROM 2007 TO 2010 IN CONSTANT PRICES
12.44
14.11
16.9117.61
2
4
6
8
10
12
14
16
18
20
2007 2008 2009 2010
€billion -
2010 c
onsta
nt
prices
6 Constant terms, base 2010.
Source: Deloitte
23799_EWEA_2012.indd 1723799_EWEA_2012.indd 17 28/03/12 17:2528/03/12 17:25
Chapter 3: Direct impact of wind energy sector on EU economy
18 Green Growth – The Impact of Wind Energy on Jobs and The Economy
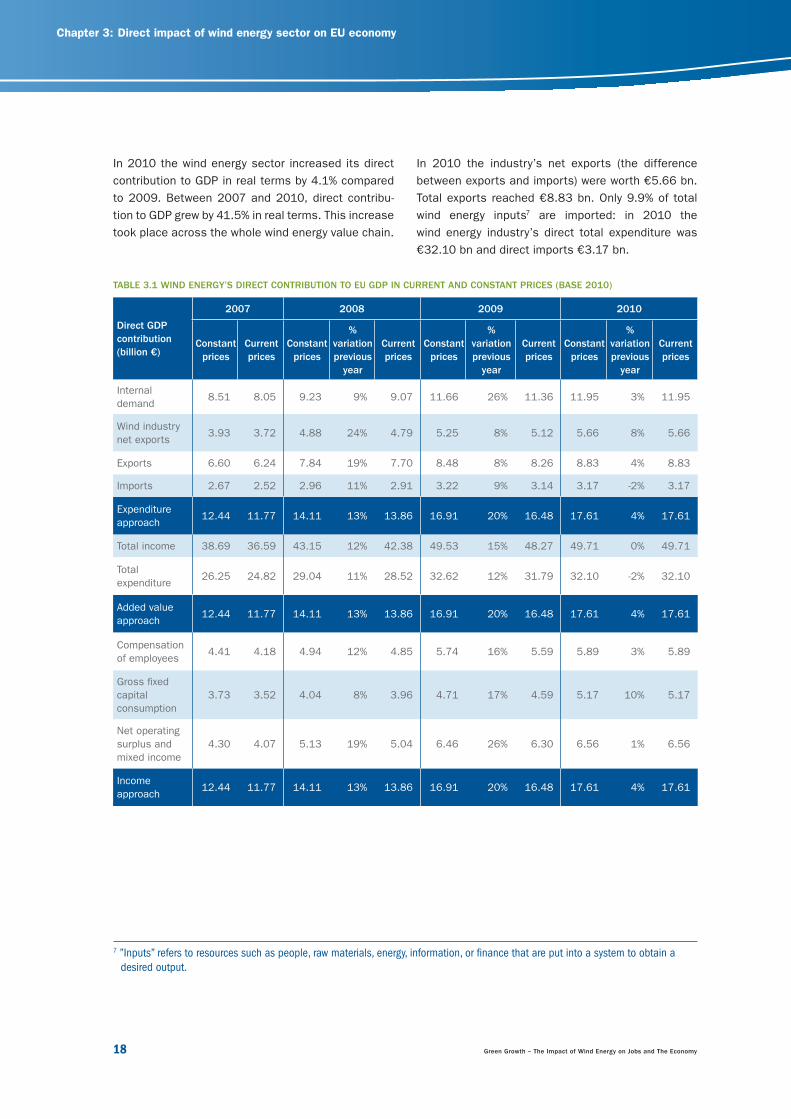
TABLE 3.1 WIND ENERGY’S DIRECT CONTRIBUTION TO EU GDP IN CURRENT AND CONSTANT PRICES (BASE 2010)
Direct GDP
contribution
(billion €)
2007 2008 2009 2010
Constant
prices
Current
prices
Constant
prices
%
variation
previous
year
Current
prices
Constant
prices
%
variation
previous
year
Current
prices
Constant
prices
%
variation
previous
year
Current
prices
Internal
demand8.51 8.05 9.23 9% 9.07 11.66 26% 11.36 11.95 3% 11.95
Wind industry
net exports3.93 3.72 4.88 24% 4.79 5.25 8% 5.12 5.66 8% 5.66
Exports 6.60 6.24 7.84 19% 7.70 8.48 8% 8.26 8.83 4% 8.83
Imports 2.67 2.52 2.96 11% 2.91 3.22 9% 3.14 3.17 -2% 3.17
Expenditure
approach12.44 11.77 14.11 13% 13.86 16.91 20% 16.48 17.61 4% 17.61
Total income 38.69 36.59 43.15 12% 42.38 49.53 15% 48.27 49.71 0% 49.71
Total
expenditure26.25 24.82 29.04 11% 28.52 32.62 12% 31.79 32.10 -2% 32.10
Added value
approach12.44 11.77 14.11 13% 13.86 16.91 20% 16.48 17.61 4% 17.61
Compensation
of employees4.41 4.18 4.94 12% 4.85 5.74 16% 5.59 5.89 3% 5.89
Gross fi xed
capital
consumption
3.73 3.52 4.04 8% 3.96 4.71 17% 4.59 5.17 10% 5.17
Net operating
surplus and
mixed income
4.30 4.07 5.13 19% 5.04 6.46 26% 6.30 6.56 1% 6.56
Income
approach12.44 11.77 14.11 13% 13.86 16.91 20% 16.48 17.61 4% 17.61
In 2010 the wind energy sector increased its direct
contribution to GDP in real terms by 4.1% compared
to 2009. Between 2007 and 2010, direct contribu-
tion to GDP grew by 41.5% in real terms. This increase
took place across the whole wind energy value chain.
In 2010 the industry’s net exports (the difference
between exports and imports) were worth €5.66 bn.
Total exports reached €8.83 bn. Only 9.9% of total
wind energy inputs7 are imported: in 2010 the
wind energy industry’s direct total expenditure was
€32.10 bn and direct imports €3.17 bn.
7 ”Inputs” refers to resources such as people, raw materials, energy, information, or fi nance that are put into a system to obtain a
desired output.
23799_EWEA_2012.indd 1823799_EWEA_2012.indd 18 28/03/12 17:2528/03/12 17:25

Green Growth – The Impact of Wind Energy on Jobs and The Economy 19
FIGURE 3.2 GROWTH OF WIND ENERGY SECTOR DIRECT CONTRIBUTION TO EU GDP
0
5
10
15
20
25
13.4%
2008
19.8%
2009
4.1%
2010
Annual gro
wth
(%
)
0.094%
0.111%
0.132%0.141%
0
0.02
0.04
0.06
0.08
0.10
0.12
0.14
0.16
2007 2008 2009 2010
Annual gro
wth
(%
)
FIGURE 3.3 WIND ENERGY SECTOR’S SHARE OF OVERALL EU GDP
In 2010, the wind industry’s direct contribution to
GDP was more than 0.14% of the EU’s total GDP,
while in 2007 it was less than 0.1%.
The growth of the wind industry’s contribution to the
EU’s GDP is greater, over the four year period from
2007 to 2010, than the overall growth of the EU’s
GDP. The sector, thus, made an important economic
contribution to the EU’s GDP during this period of
slow growth (including a year of economic recession):
in 2010 the increase in wind industry’s contribution
to GDP, at 4.1%, was twice as high as the growth of
GDP itself.
8 Sources of information: International Monetary Fund for GDP, European Central Bank for exchange rates for countries that are not
part of the Eurozone.
Source: Deloitte
Source: Deloitte
23799_EWEA_2012.indd 1923799_EWEA_2012.indd 19 28/03/12 17:2528/03/12 17:25
Chapter 3: Direct impact of wind energy sector on EU economy
20 Green Growth – The impact of wind energy on jobs and the economy
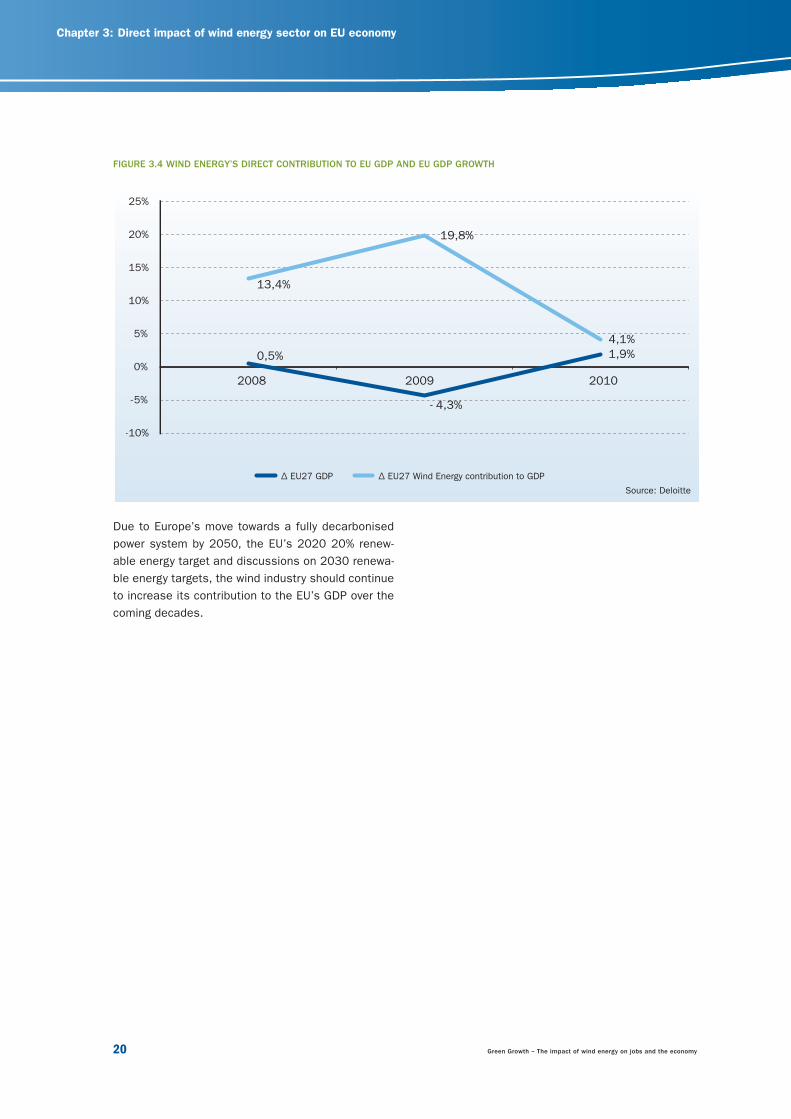
Due to Europe’s move towards a fully decarbonised
power system by 2050, the EU’s 2020 20% renew-
able energy target and discussions on 2030 renewa-
ble energy targets, the wind industry should continue
to increase its contribution to the EU’s GDP over the
coming decades.
FIGURE 3.4 WIND ENERGY’S DIRECT CONTRIBUTION TO EU GDP AND EU GDP GROWTH
0,5%
2008 2009 2010
- 4,3%
1,9%
13,4%
19,8%
4,1%
-10%
-5%
0%
5%
10%
15%
20%
25%
∆ EU27 GDP ∆ EU27 Wind Energy contribution to GDP
Source: Deloitte
23799_EWEA_2012.indd 2023799_EWEA_2012.indd 20 28/03/12 17:2528/03/12 17:25
Green Growth – The impact of wind energy on jobs and the economy 21
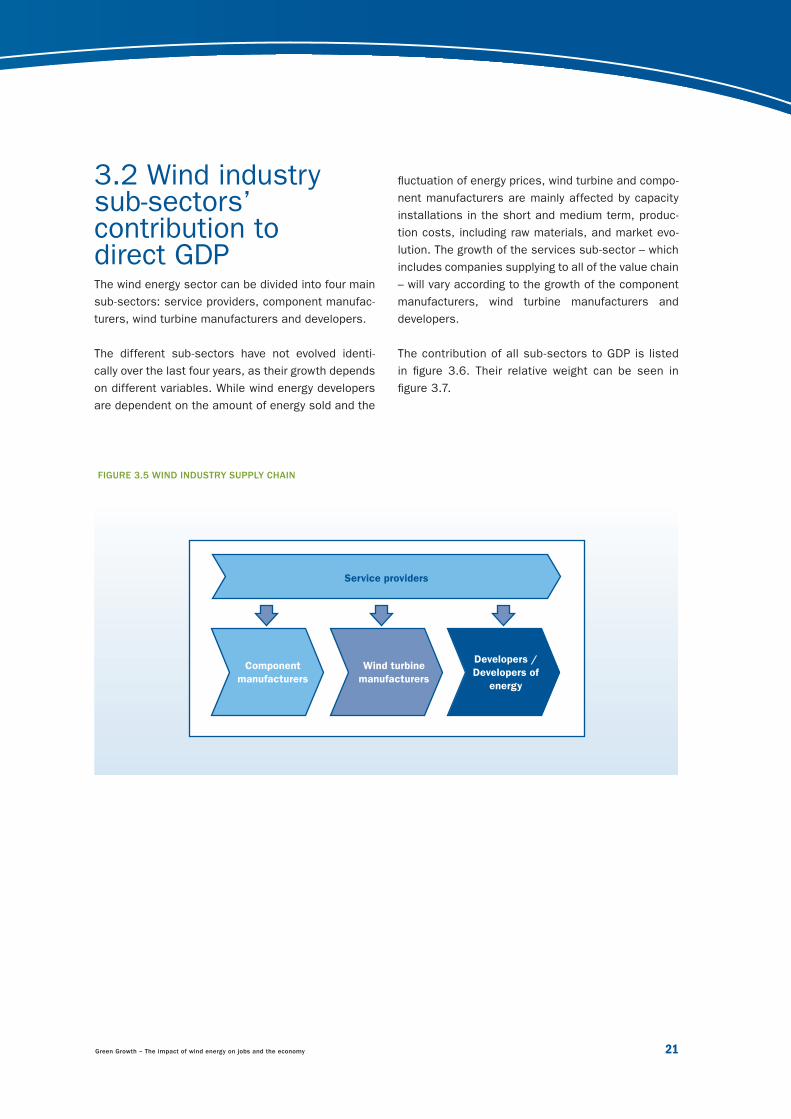
3.2 Wind industry sub-sectors’ contribution to direct GDPThe wind energy sector can be divided into four main
sub-sectors: service providers, component manufac-
turers, wind turbine manufacturers and developers.
The different sub-sectors have not evolved identi-
cally over the last four years, as their growth depends
on different variables. While wind energy developers
are dependent on the amount of energy sold and the
FIGURE 3.5 WIND INDUSTRY SUPPLY CHAIN
Service providers
Component
manufacturers
Wind turbine
manufacturers
Developers /
Developers of
energy
fl uctuation of energy prices, wind turbine and compo-
nent manufacturers are mainly affected by capacity
installations in the short and medium term, produc-
tion costs, including raw materials, and market evo-
lution. The growth of the services sub-sector – which
includes companies supplying to all of the value chain
– will vary according to the growth of the component
manufacturers, wind turbine manufacturers and
developers.
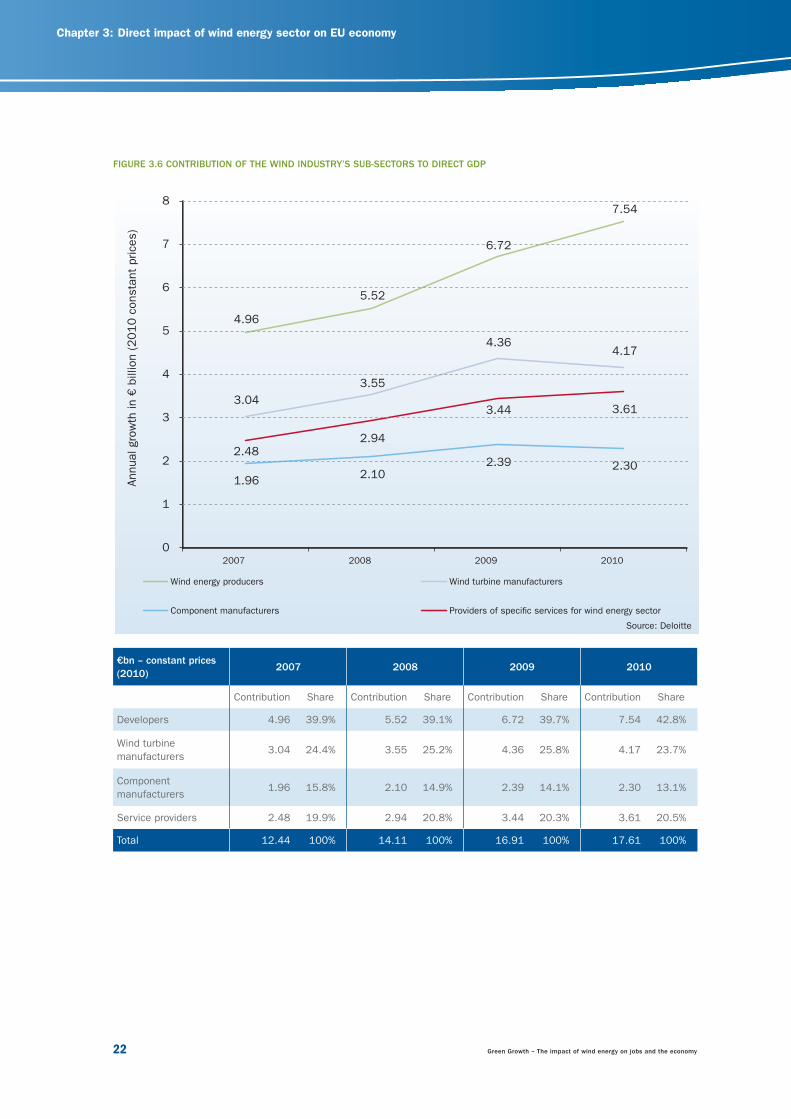
The contribution of all sub-sectors to GDP is listed
in fi gure 3.6. Their relative weight can be seen in
fi gure 3.7.
23799_EWEA_2012.indd 2123799_EWEA_2012.indd 21 28/03/12 17:2528/03/12 17:25
Chapter 3: Direct impact of wind energy sector on EU economy
22 Green Growth – The impact of wind energy on jobs and the economy
€bn – constant prices
(2010)2007 2008 2009 2010
Contribution Share Contribution Share Contribution Share Contribution Share
Developers 4.96 39.9% 5.52 39.1% 6.72 39.7% 7.54 42.8%
Wind turbine
manufacturers3.04 24.4% 3.55 25.2% 4.36 25.8% 4.17 23.7%
Component
manufacturers1.96 15.8% 2.10 14.9% 2.39 14.1% 2.30 13.1%
Service providers 2.48 19.9% 2.94 20.8% 3.44 20.3% 3.61 20.5%
Total 12.44 100% 14.11 100% 16.91 100% 17.61 100%
FIGURE 3.6 CONTRIBUTION OF THE WIND INDUSTRY’S SUB-SECTORS TO DIRECT GDP
4.96
5.52
7.54
3.04
3.55
4.364.17
1.962.10
2.39 2.302.48
2.94
3.44 3.61
0
1
2
3
4
5
6
7
8
2007 2008 2009 2010
Annual gro
wth
in €
billion (2010 c
onsta
nt
prices)
Wind energy producers Wind turbine manufacturers
Component manufacturers
6.72
Source: Deloitte
23799_EWEA_2012.indd 2223799_EWEA_2012.indd 22 28/03/12 17:2528/03/12 17:25
Green Growth – The impact of wind energy on jobs and the economy 23
FIGURE 3.7 RELATIVE WEIGHT OF THE WIND INDUSTRY’S SUB-SECTORS IN TERMS OF DIRECT GDP
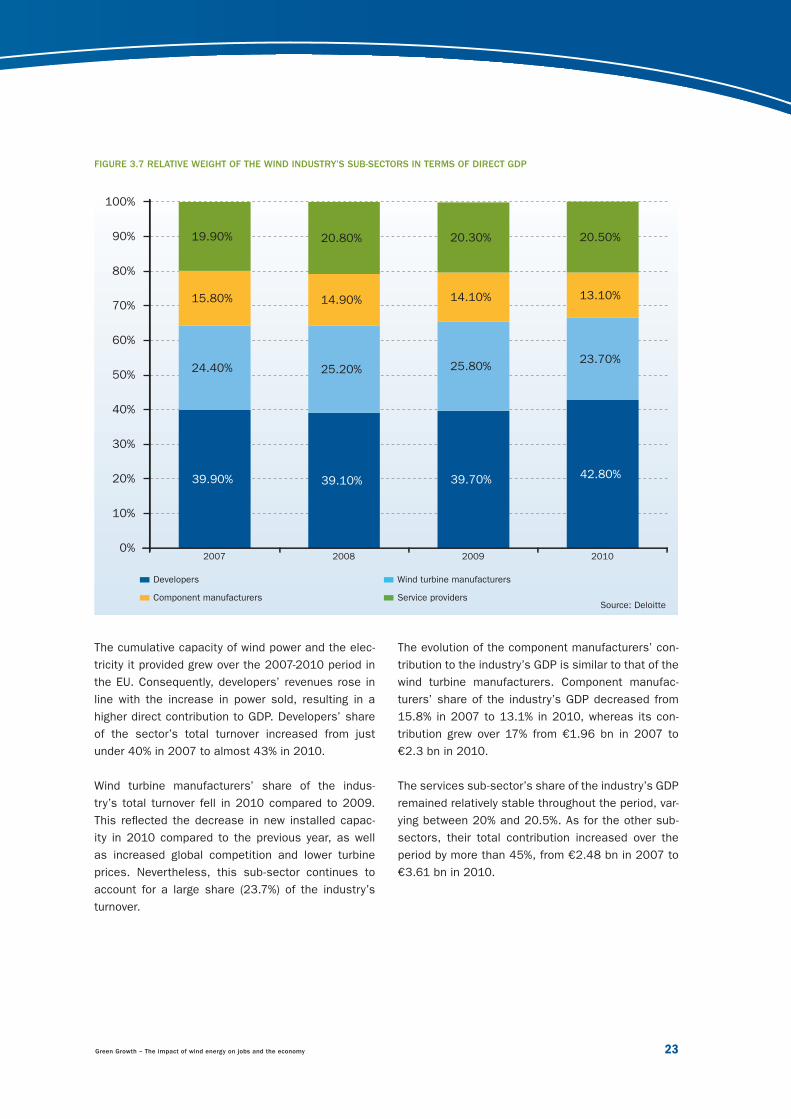
The cumulative capacity of wind power and the elec-
tricity it provided grew over the 2007-2010 period in
the EU. Consequently, developers’ revenues rose in
line with the increase in power sold, resulting in a
higher direct contribution to GDP. Developers’ share
of the sector’s total turnover increased from just
under 40% in 2007 to almost 43% in 2010.
Wind turbine manufacturers’ share of the indus-
try’s total turnover fell in 2010 compared to 2009.
This refl ected the decrease in new installed capac-
ity in 2010 compared to the previous year, as well
as increased global competition and lower turbine
prices. Nevertheless, this sub-sector continues to
account for a large share (23.7%) of the industry’s
turnover.
39.90% 39.10% 39.70% 42.80%
24.40% 25.20% 25.80% 23.70%
15.80% 14.90% 14.10% 13.10%
19.90% 20.80% 20.30% 20.50%
0%
10%
20%
30%
40%
50%
60%
70%
80%
90%
100%
2007 2008 2009 2010
Developers Wind turbine manufacturers
Component manufacturers Service providers
The evolution of the component manufacturers’ con-
tribution to the industry’s GDP is similar to that of the
wind turbine manufacturers. Component manufac-
turers’ share of the industry’s GDP decreased from
15.8% in 2007 to 13.1% in 2010, whereas its con-
tribution grew over 17% from €1.96 bn in 2007 to
€2.3 bn in 2010.
The services sub-sector’s share of the industry’s GDP
remained relatively stable throughout the period, var-
ying between 20% and 20.5%. As for the other sub-
sectors, their total contribution increased over the
period by more than 45%, from €2.48 bn in 2007 to
€3.61 bn in 2010.
Source: Deloitte
23799_EWEA_2012.indd 2323799_EWEA_2012.indd 23 28/03/12 17:2528/03/12 17:25
Chapter 3: Direct impact of wind energy sector on EU economy
24 Green Growth – The impact of wind energy on jobs and the economy
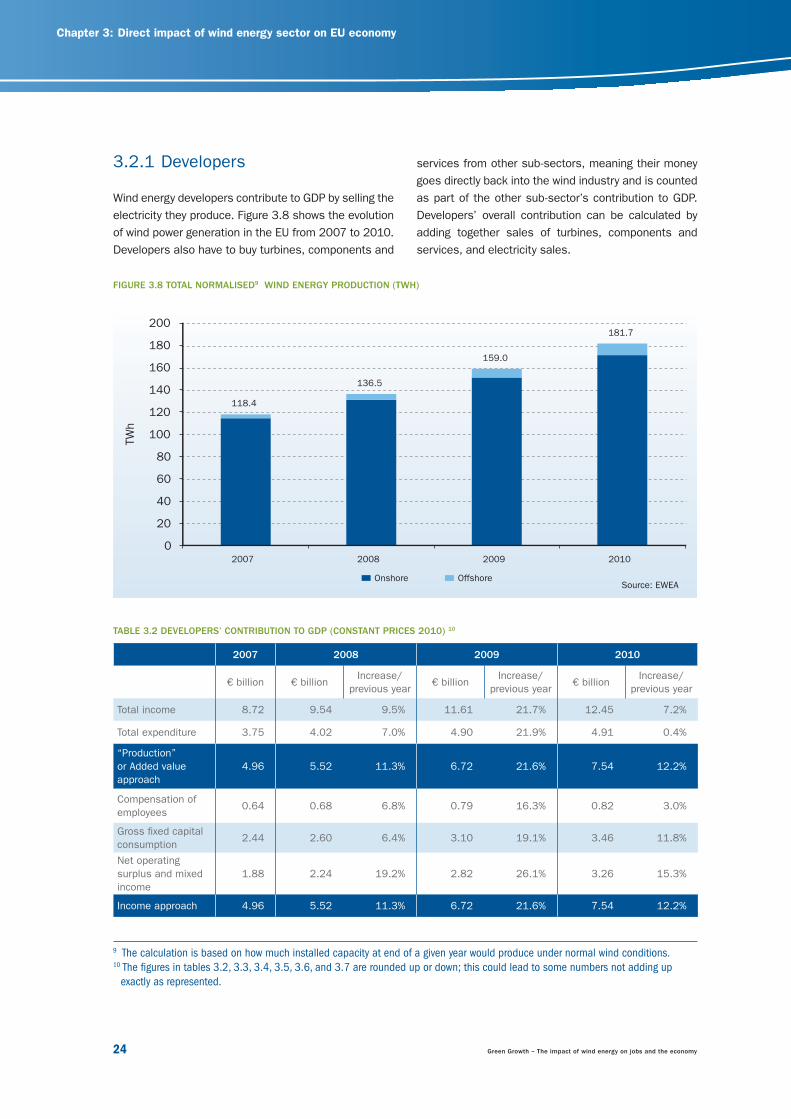
services from other sub-sectors, meaning their money
goes directly back into the wind industry and is counted
as part of the other sub-sector’s contribution to GDP.
Developers’ overall contribution can be calculated by
adding together sales of turbines, components and
services, and electricity sales.
3.2.1 Developers
Wind energy developers contribute to GDP by selling the
electricity they produce. Figure 3.8 shows the evolution
of wind power generation in the EU from 2007 to 2010.
Developers also have to buy turbines, components and
FIGURE 3.8 TOTAL NORMALISED9 WIND ENERGY PRODUCTION (TWH)
118.4
136.5
159.0
181.7
0
20
40
60
80
100
120
140
160
180
200
2007 2008 2009 2010
TW
h
Onshore Offshore
TABLE 3.2 DEVELOPERS’ CONTRIBUTION TO GDP (CONSTANT PRICES 2010) 10
2007 2008 2009 2010
€ billion € billionIncrease/
previous year€ billion
Increase/
previous year€ billion
Increase/
previous year
Total income 8.72 9.54 9.5% 11.61 21.7% 12.45 7.2%
Total expenditure 3.75 4.02 7.0% 4.90 21.9% 4.91 0.4%
“Production”
or Added value
approach
4.96 5.52 11.3% 6.72 21.6% 7.54 12.2%
Compensation of
employees0.64 0.68 6.8% 0.79 16.3% 0.82 3.0%
Gross fi xed capital
consumption2.44 2.60 6.4% 3.10 19.1% 3.46 11.8%
Net operating
surplus and mixed
income
1.88 2.24 19.2% 2.82 26.1% 3.26 15.3%
Income approach 4.96 5.52 11.3% 6.72 21.6% 7.54 12.2%
Source: EWEA
9 The calculation is based on how much installed capacity at end of a given year would produce under normal wind conditions.10 The fi gures in tables 3.2, 3.3, 3.4, 3.5, 3.6, and 3.7 are rounded up or down; this could lead to some numbers not adding up
exactly as represented.
23799_EWEA_2012.indd 2423799_EWEA_2012.indd 24 28/03/12 17:2528/03/12 17:25
Green Growth – The impact of wind energy on jobs and the economy 25
Table 3.2 shows how much developers contributed to
GDP between 2007 and 2010. The increase is in the
order of 52%, bringing the actual contribution to GDP
to €7.54 bn in 2010.
Revenue per MWh has remained stable during the
last three years, but the increase in generating capac-
ity over the period has meant that more energy was
produced and sold, increasing developers’ overall
revenue.
Expenses related to employees are lower than in the
other sectors. A signifi cant share of wind industry
jobs are in manufacturing turbines and components
and wind farm construction.
Nevertheless, as installed capacity grows, there is a
progressive increase in operation and maintenance
jobs. This is highlighted by the growth of expenditure
related to employees from €0.64 bn in 2007 to €0.82
bn in 2010.
The wind industry is characterised by high invest-
ment costs, low operation costs and no fuel costs.
Consequently, a fair portion of wind generated elec-
tricity’s price is known in advance, reducing volatility
in the electricity market.
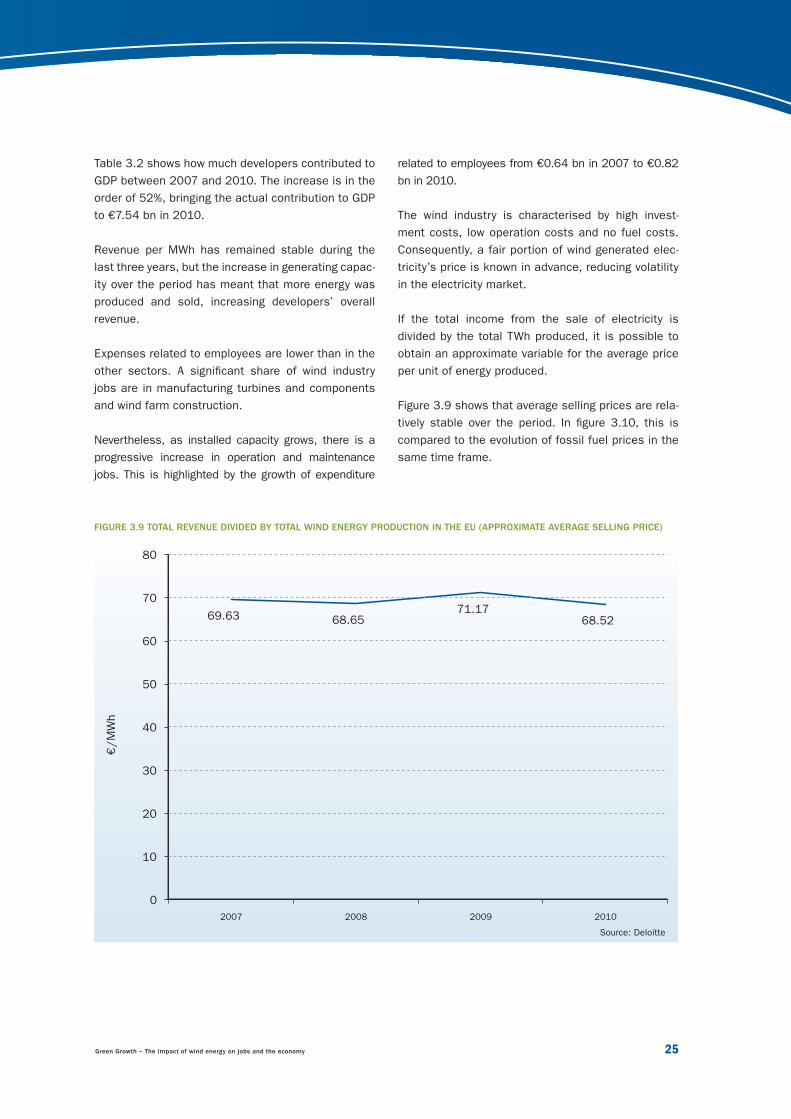
If the total income from the sale of electricity is
divided by the total TWh produced, it is possible to
obtain an approximate variable for the average price
per unit of energy produced.
Figure 3.9 shows that average selling prices are rela-
tively stable over the period. In fi gure 3.10, this is
compared to the evolution of fossil fuel prices in the
same time frame.
FIGURE 3.9 TOTAL REVENUE DIVIDED BY TOTAL WIND ENERGY PRODUCTION IN THE EU (APPROXIMATE AVERAGE SELLING PRICE)
69.63 68.6571.17
68.52
0
10
20
30
40
50
60
70
80
2007 2008 2009 2010
€/M
Wh
Source: Deloitte
23799_EWEA_2012.indd 2523799_EWEA_2012.indd 25 28/03/12 17:2528/03/12 17:25
Chapter 3: Direct impact of wind energy sector on EU economy
26 Green Growth – The impact of wind energy on jobs and the economy
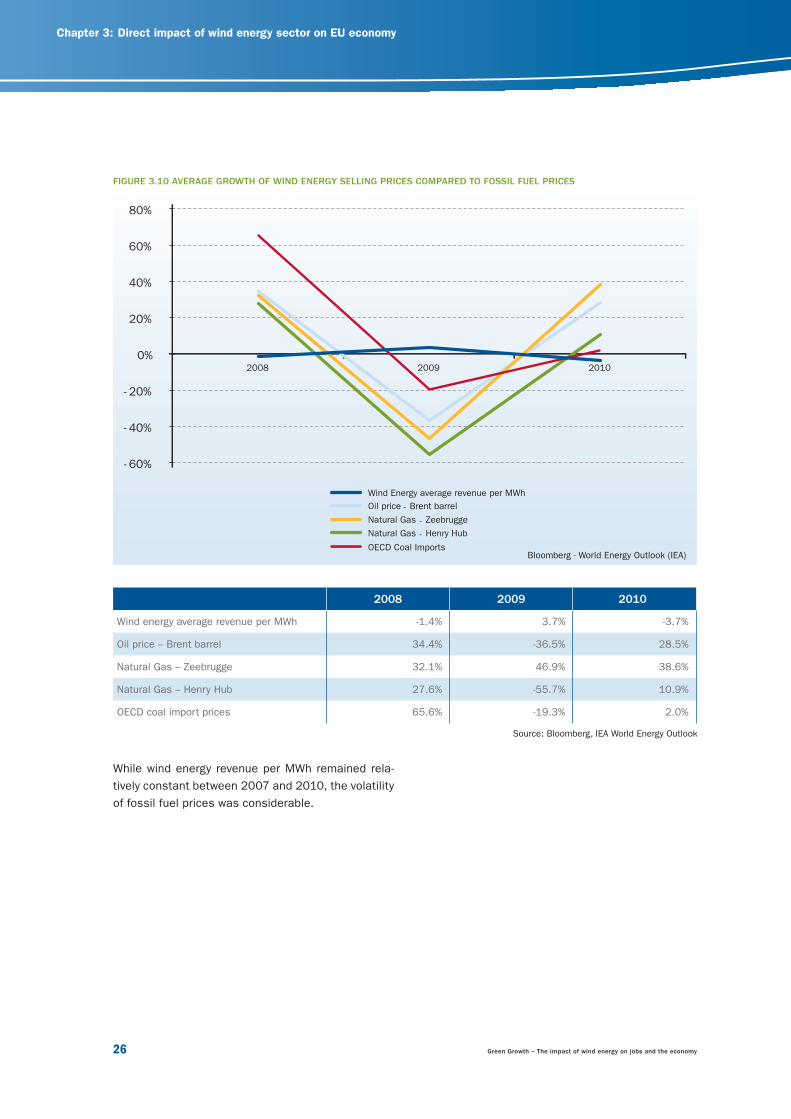
While wind energy revenue per MWh remained rela-
tively constant between 2007 and 2010, the volatility
of fossil fuel prices was considerable.
FIGURE 3.10 AVERAGE GROWTH OF WIND ENERGY SELLING PRICES COMPARED TO FOSSIL FUEL PRICES
2008 2009 2010
Wind energy average revenue per MWh -1.4% 3.7% -3.7%
Oil price – Brent barrel 34.4% -36.5% 28.5%
Natural Gas – Zeebrugge 32.1% 46.9% 38.6%
Natural Gas – Henry Hub 27.6% -55.7% 10.9%
OECD coal import prices 65.6% -19.3% 2.0%
Source: Bloomberg, IEA World Energy Outlook
- 60%
- 40%
- 20%
0%
20%
40%
60%
80%
2008 2009 2010
Wind Energy average revenue per MWh
Oil price Brent barrel-
Natural Gas Zeebrugge-
Natural Gas - Henry Hub
OECD Coal ImportsBloomberg - World Energy Outlook (IEA)
23799_EWEA_2012.indd 2623799_EWEA_2012.indd 26 28/03/12 17:2528/03/12 17:25
Green Growth – The impact of wind energy on jobs and the economy 27
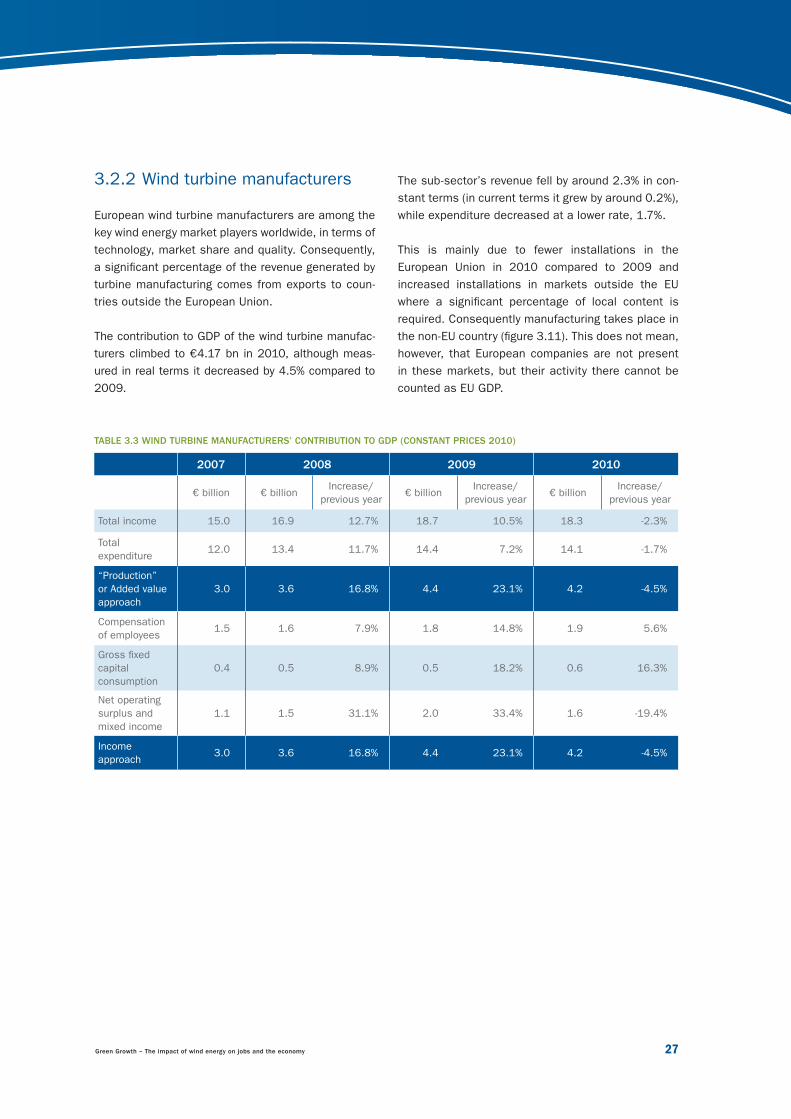
TABLE 3.3 WIND TURBINE MANUFACTURERS’ CONTRIBUTION TO GDP (CONSTANT PRICES 2010)
2007 2008 2009 2010
€ billion € billionIncrease/
previous year€ billion
Increase/
previous year€ billion
Increase/
previous year
Total income 15.0 16.9 12.7% 18.7 10.5% 18.3 -2.3%
Total
expenditure12.0 13.4 11.7% 14.4 7.2% 14.1 -1.7%
“Production”
or Added value
approach
3.0 3.6 16.8% 4.4 23.1% 4.2 -4.5%
Compensation
of employees1.5 1.6 7.9% 1.8 14.8% 1.9 5.6%
Gross fi xed
capital
consumption
0.4 0.5 8.9% 0.5 18.2% 0.6 16.3%
Net operating
surplus and
mixed income
1.1 1.5 31.1% 2.0 33.4% 1.6 -19.4%
Income
approach3.0 3.6 16.8% 4.4 23.1% 4.2 -4.5%
3.2.2 Wind turbine manufacturers
European wind turbine manufacturers are among the
key wind energy market players worldwide, in terms of
technology, market share and quality. Consequently,
a signifi cant percentage of the revenue generated by
turbine manufacturing comes from exports to coun-
tries outside the European Union.
The contribution to GDP of the wind turbine manufac-
turers climbed to €4.17 bn in 2010, although meas-
ured in real terms it decreased by 4.5% compared to
2009.
The sub-sector’s revenue fell by around 2.3% in con-
stant terms (in current terms it grew by around 0.2%),
while expenditure decreased at a lower rate, 1.7%.
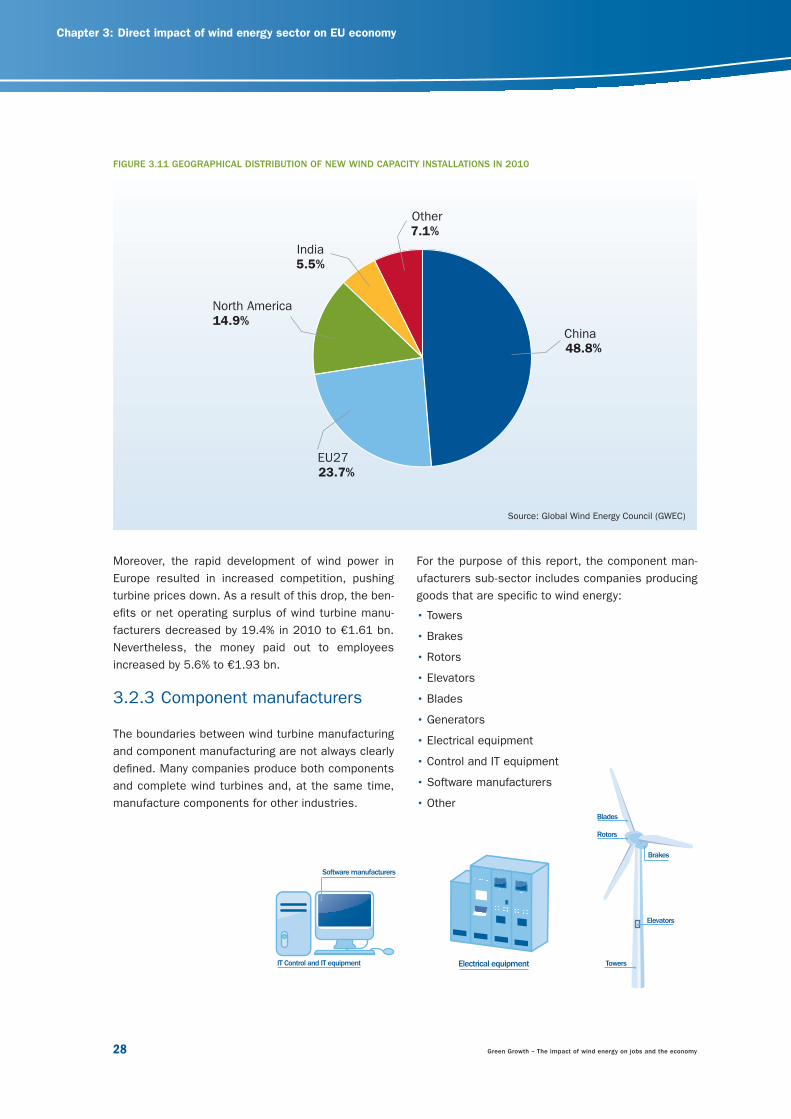
This is mainly due to fewer installations in the
European Union in 2010 compared to 2009 and
increased installations in markets outside the EU
where a signifi cant percentage of local content is
required. Consequently manufacturing takes place in
the non-EU country (fi gure 3.11). This does not mean,
however, that European companies are not present
in these markets, but their activity there cannot be
counted as EU GDP.
23799_EWEA_2012.indd 2723799_EWEA_2012.indd 27 28/03/12 17:2528/03/12 17:25
Chapter 3: Direct impact of wind energy sector on EU economy
28 Green Growth – The impact of wind energy on jobs and the economy
For the purpose of this report, the component man-
ufacturers sub-sector includes companies producing
goods that are specifi c to wind energy:
• Towers
• Brakes
• Rotors
• Elevators
• Blades
• Generators
• Electrical equipment
• Control and IT equipment
• Software manufacturers
• Other
Moreover, the rapid development of wind power in
Europe resulted in increased competition, pushing
turbine prices down. As a result of this drop, the ben-
efi ts or net operating surplus of wind turbine manu-
facturers decreased by 19.4% in 2010 to €1.61 bn.
Nevertheless, the money paid out to employees
increased by 5.6% to €1.93 bn.
3.2.3 Component manufacturers
The boundaries between wind turbine manufacturing
and component manufacturing are not always clearly
defi ned. Many companies produce both components
and complete wind turbines and, at the same time,
manufacture components for other industries.
China 48.8%
India5.5%
EU2723.7%
North America14.9%
Other7.1%
FIGURE 3.11 GEOGRAPHICAL DISTRIBUTION OF NEW WIND CAPACITY INSTALLATIONS IN 2010
Source: Global Wind Energy Council (GWEC)
Software manufacturers
IT Control and IT equipment
Elevators
Towers
Blades
Rotors
Brakes
Electrical equipment
23799_EWEA_2012.indd 2823799_EWEA_2012.indd 28 28/03/12 17:2528/03/12 17:25
Green Growth – The impact of wind energy on jobs and the economy 29
TABLE 3.4 COMPONENT MANUFACTURERS’ CONTRIBUTION TO GDP (CONSTANT PRICES 2010)
2007 2008 2009 2010
€ billion € billionIncrease/
previous year€ billion
Increase/
previous year€ billion
Increase/
previous year
Total income 10.0 11.0 10.3% 12.4 12.1% 11.9 -3.5%
Total
expenditure8.0 8.9 11.0% 9.9 10.9% 9.6 -2.8%
“Production”
or Added value
approach
2.0 2.1 7.4% 2.5 17.1% 2.3 -6.6%
Compensation
of employees1.1 1.2 11.2% 1.4 14.9% 1.4 -1.6%
Gross fi xed
capital
consumption
0.5 0.6 11.0% 0.6 4.8% 0.6 -2.1%
Net operating
surplus and
mixed income
0.4 0.33 -9.3% 0.4 23.0% 0.4 -12.3%
Income
approach2.0 2.1 7.4% 2.5 17.1% 2.3 -6.6%
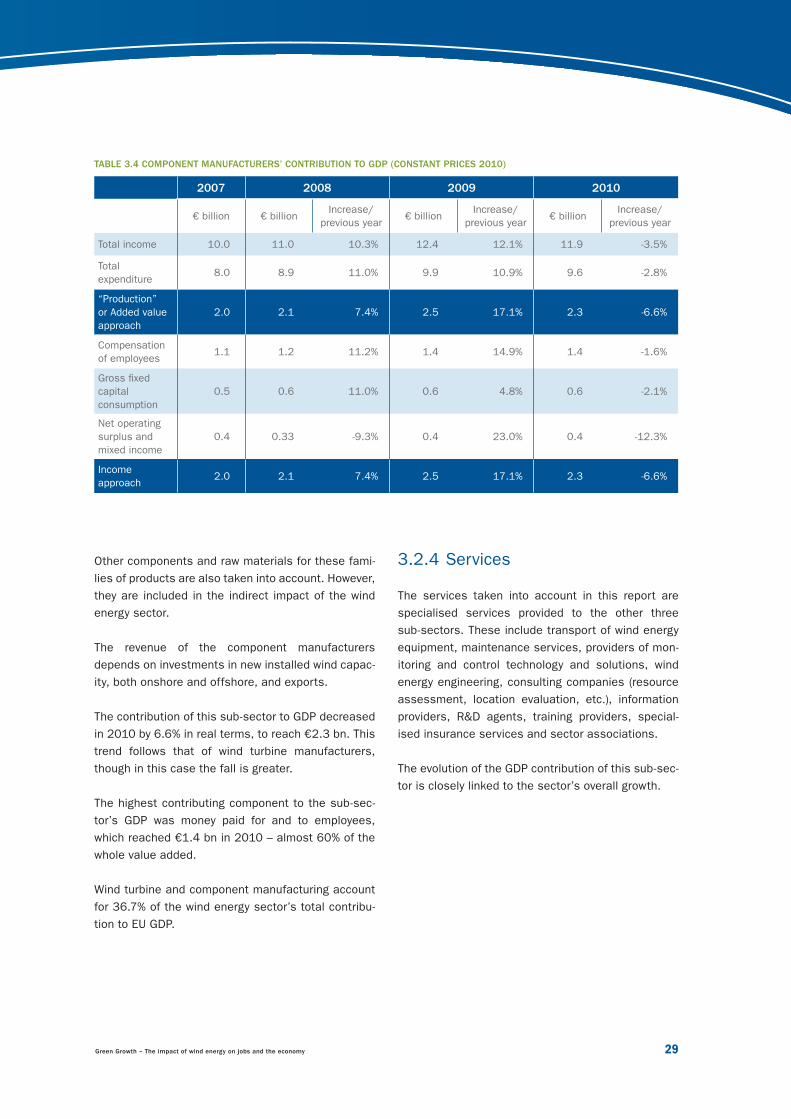
Other components and raw materials for these fami-
lies of products are also taken into account. However,
they are included in the indirect impact of the wind
energy sector.
The revenue of the component manufacturers
depends on investments in new installed wind capac-
ity, both onshore and offshore, and exports.
The contribution of this sub-sector to GDP decreased
in 2010 by 6.6% in real terms, to reach €2.3 bn. This
trend follows that of wind turbine manufacturers,
though in this case the fall is greater.
The highest contributing component to the sub-sec-
tor’s GDP was money paid for and to employees,
which reached €1.4 bn in 2010 – almost 60% of the
whole value added.
Wind turbine and component manufacturing account
for 36.7% of the wind energy sector’s total contribu-
tion to EU GDP.
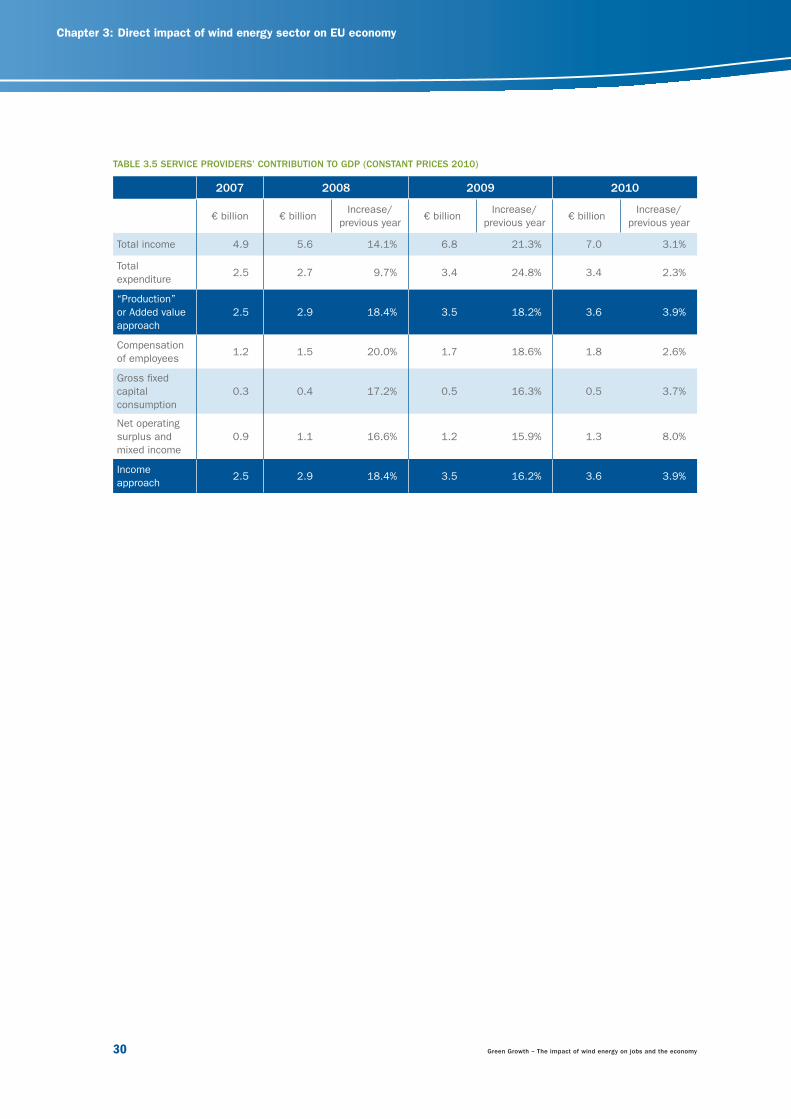
3.2.4 Services
The services taken into account in this report are
specialised services provided to the other three
sub-sectors. These include transport of wind energy
equipment, maintenance services, providers of mon-
itoring and control technology and solutions, wind
energy engineering, consulting companies (resource
assessment, location evaluation, etc.), information
providers, R&D agents, training providers, special-
ised insurance services and sector associations.
The evolution of the GDP contribution of this sub-sec-
tor is closely linked to the sector’s overall growth.
23799_EWEA_2012.indd 2923799_EWEA_2012.indd 29 28/03/12 17:2528/03/12 17:25
Chapter 3: Direct impact of wind energy sector on EU economy
30 Green Growth – The impact of wind energy on jobs and the economy
TABLE 3.5 SERVICE PROVIDERS’ CONTRIBUTION TO GDP (CONSTANT PRICES 2010)
2007 2008 2009 2010
€ billion € billionIncrease/
previous year€ billion
Increase/
previous year€ billion
Increase/
previous year
Total income 4.9 5.6 14.1% 6.8 21.3% 7.0 3.1%
Total
expenditure2.5 2.7 9.7% 3.4 24.8% 3.4 2.3%
“Production”
or Added value
approach
2.5 2.9 18.4% 3.5 18.2% 3.6 3.9%
Compensation
of employees1.2 1.5 20.0% 1.7 18.6% 1.8 2.6%
Gross fi xed
capital
consumption
0.3 0.4 17.2% 0.5 16.3% 0.5 3.7%
Net operating
surplus and
mixed income
0.9 1.1 16.6% 1.2 15.9% 1.3 8.0%
Income
approach2.5 2.9 18.4% 3.5 16.2% 3.6 3.9%
23799_EWEA_2012.indd 3023799_EWEA_2012.indd 30 28/03/12 17:2528/03/12 17:25
Green Growth – The impact of wind energy on jobs and the economy 31
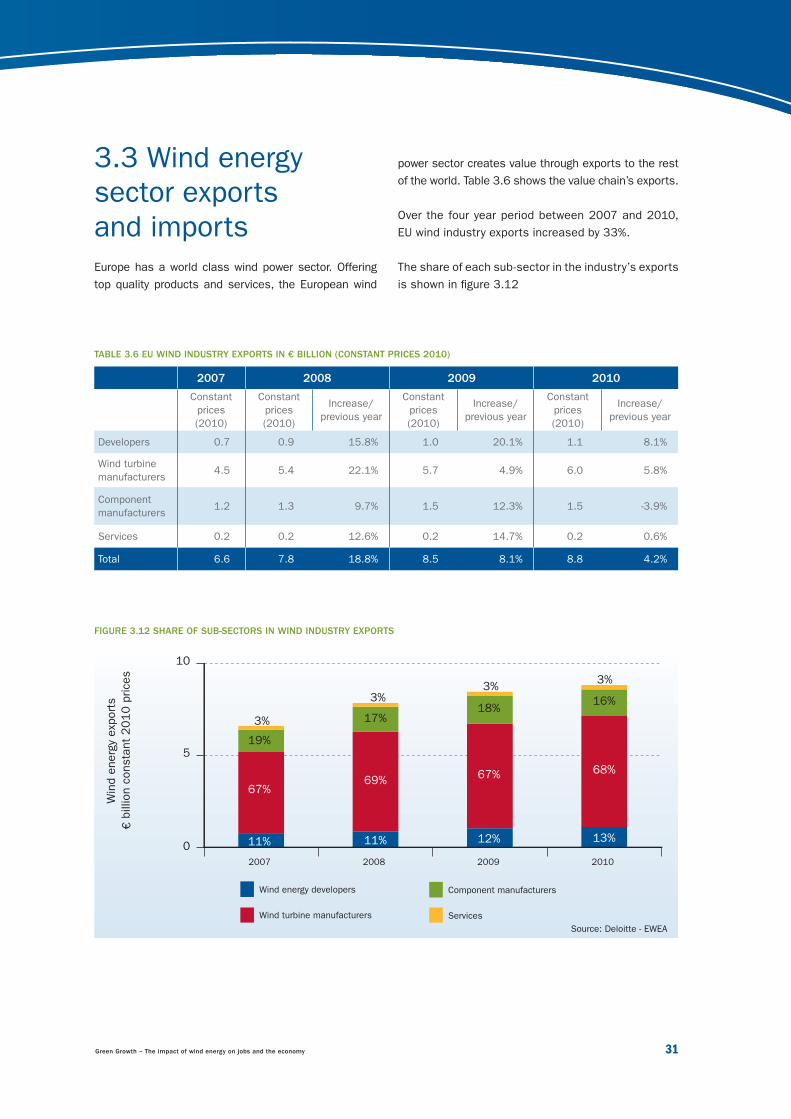
FIGURE 3.12 SHARE OF SUB-SECTORS IN WIND INDUSTRY EXPORTS
TABLE 3.6 EU WIND INDUSTRY EXPORTS IN € BILLION (CONSTANT PRICES 2010)
2007 2008 2009 2010
Constant
prices
(2010)
Constant
prices
(2010)
Increase/
previous year
Constant
prices
(2010)
Increase/
previous year
Constant
prices
(2010)
Increase/
previous year
Developers 0.7 0.9 15.8% 1.0 20.1% 1.1 8.1%
Wind turbine
manufacturers4.5 5.4 22.1% 5.7 4.9% 6.0 5.8%
Component
manufacturers1.2 1.3 9.7% 1.5 12.3% 1.5 -3.9%
Services 0.2 0.2 12.6% 0.2 14.7% 0.2 0.6%
Total 6.6 7.8 18.8% 8.5 8.1% 8.8 4.2%
11% 11% 12% 13%
67%69%
67% 68%
19%
17%18%
16%
3%
3%3%
3%
0
5
10
2007 2008 2009 2010
Win
d e
nerg
y exp
ort
s
€billion c
onsta
nt
2010 p
rices
Wind energy developers
Wind turbine manufacturers
Component manufacturers
Services
Source: Deloitte - EWEA
power sector creates value through exports to the rest
of the world. Table 3.6 shows the value chain’s exports.
Over the four year period between 2007 and 2010,
EU wind industry exports increased by 33%.
The share of each sub-sector in the industry’s exports
is shown in fi gure 3.12
3.3 Wind energy sector exports and imports Europe has a world class wind power sector. Offering
top quality products and services, the European wind
23799_EWEA_2012.indd 3123799_EWEA_2012.indd 31 28/03/12 17:2528/03/12 17:25
Chapter 3: Direct impact of wind energy sector on EU economy
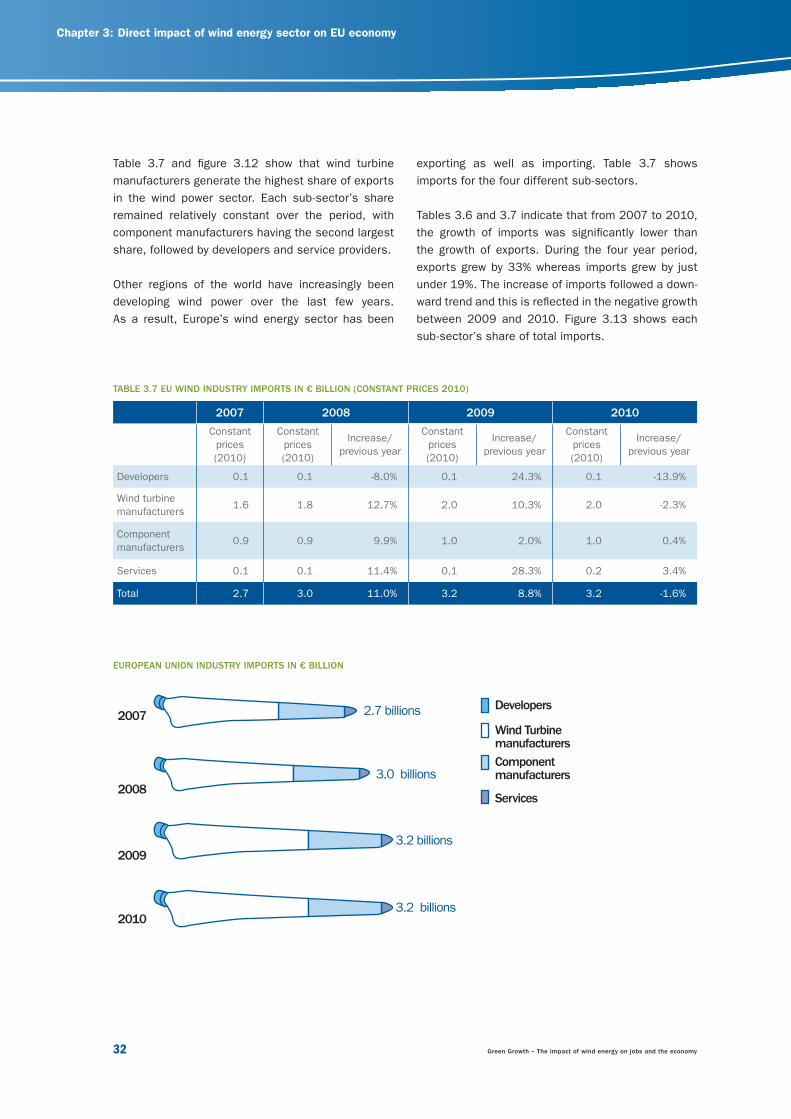
32 Green Growth – The impact of wind energy on jobs and the economy
exporting as well as importing. Table 3.7 shows
imports for the four different sub-sectors.
Tables 3.6 and 3.7 indicate that from 2007 to 2010,
the growth of imports was signifi cantly lower than
the growth of exports. During the four year period,
exports grew by 33% whereas imports grew by just
under 19%. The increase of imports followed a down-
ward trend and this is refl ected in the negative growth
between 2009 and 2010. Figure 3.13 shows each
sub-sector’s share of total imports.
TABLE 3.7 EU WIND INDUSTRY IMPORTS IN € BILLION (CONSTANT PRICES 2010)
2007 2008 2009 2010
Constant
prices
(2010)
Constant
prices
(2010)
Increase/
previous year
Constant
prices
(2010)
Increase/
previous year
Constant
prices
(2010)
Increase/
previous year
Developers 0.1 0.1 -8.0% 0.1 24.3% 0.1 -13.9%
Wind turbine
manufacturers1.6 1.8 12.7% 2.0 10.3% 2.0 -2.3%
Component
manufacturers0.9 0.9 9.9% 1.0 2.0% 1.0 0.4%
Services 0.1 0.1 11.4% 0.1 28.3% 0.2 3.4%
Total 2.7 3.0 11.0% 3.2 8.8% 3.2 -1.6%
Wind Turbine manufacturers
Component manufacturers
Services
Developers2007 2.7 billions
20083.0 billions
20093.2 billions
20103.2 billions
Table 3.7 and fi gure 3.12 show that wind turbine
manufacturers generate the highest share of exports
in the wind power sector. Each sub-sector’s share
remained relatively constant over the period, with
component manufacturers having the second largest
share, followed by developers and service providers.
Other regions of the world have increasingly been
developing wind power over the last few years.
As a result, Europe’s wind energy sector has been
EUROPEAN UNION INDUSTRY IMPORTS IN € BILLION
23799_EWEA_2012.indd 3223799_EWEA_2012.indd 32 28/03/12 17:2528/03/12 17:25
Green Growth – The impact of wind energy on jobs and the economy 33
2007 2008 2009 2010
3% 3% 3% 3%
61%62%
62% 62%
32%
32%30% 30%
4%
4%
5% 5%
0
0.5
1.0
1.5
2.0
2.5
3.0
3.5
Win
d e
nerg
y secto
r im
port
s
-
€billion c
onsta
nt
20
10
prices
Wind energy developers
Wind turbine manufacturers
Component manufacturers
Services
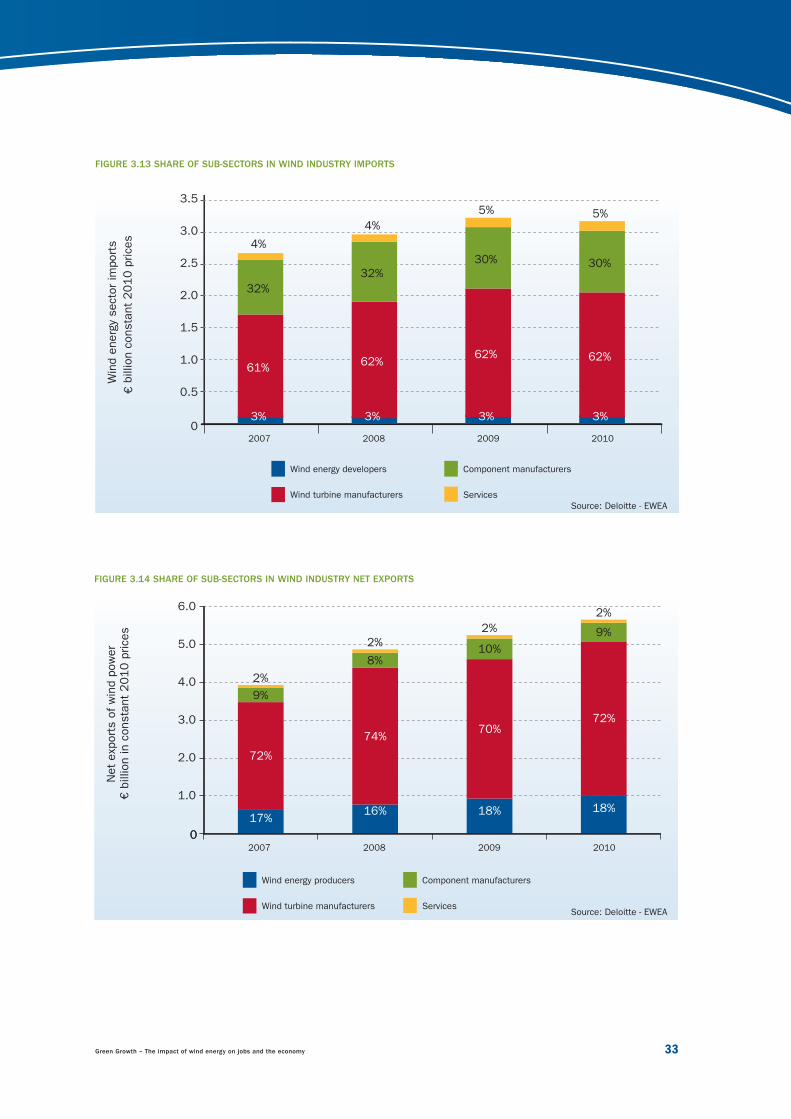
FIGURE 3.13 SHARE OF SUB-SECTORS IN WIND INDUSTRY IMPORTS
Source: Deloitte - EWEA
2007 2008 2009 2010
17%16% 18% 18%
72%
74%70%
72%
9%
8%10%
9%
2%
2%2%
2%
00
1.0
2.0
3.0
4.0
5.0
6.0
Net
exp
ort
s o
f w
ind p
ow
er
€ b
illion in c
onsta
nt
2010 p
rices
Wind energy producers
Wind turbine manufacturers
Component manufacturers
ServicesSource: Deloitte - EWEA
FIGURE 3.14 SHARE OF SUB-SECTORS IN WIND INDUSTRY NET EXPORTS
23799_EWEA_2012.indd 3323799_EWEA_2012.indd 33 28/03/12 17:2528/03/12 17:25
Chapter 3: Direct impact of wind energy sector on EU economy
34 Green Growth – The impact of wind energy on jobs and the economy
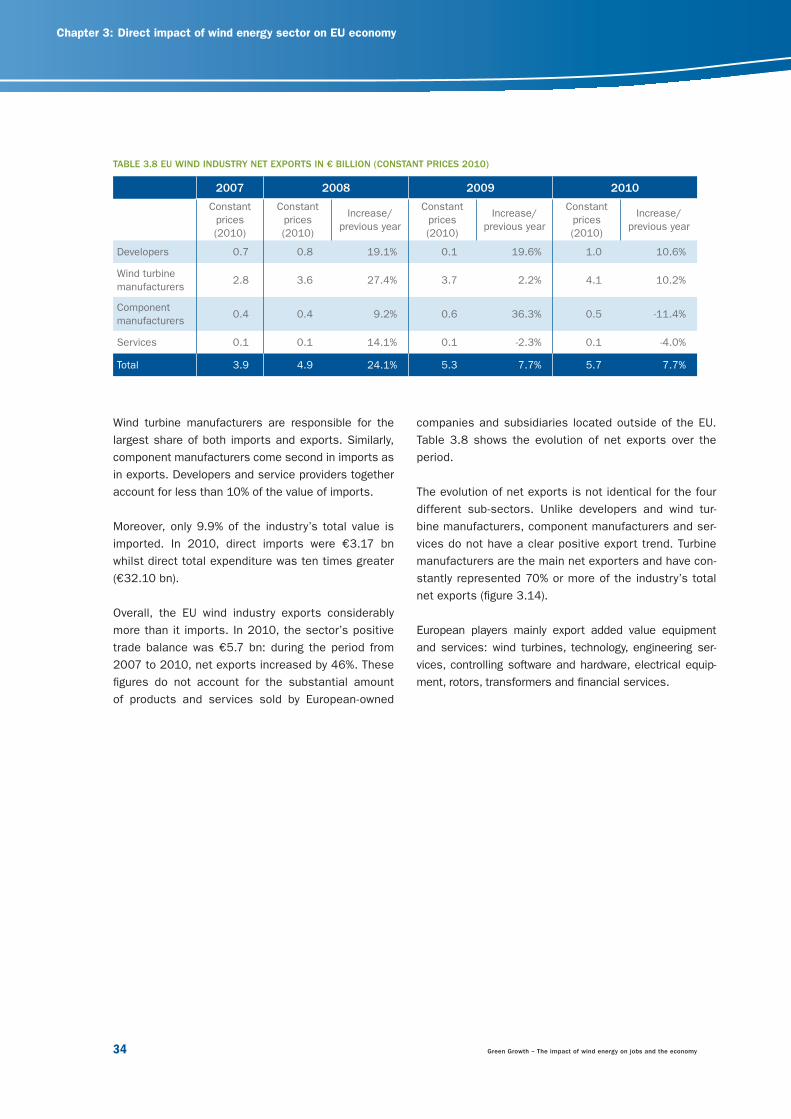
TABLE 3.8 EU WIND INDUSTRY NET EXPORTS IN € BILLION (CONSTANT PRICES 2010)
2007 2008 2009 2010
Constant
prices
(2010)
Constant
prices
(2010)
Increase/
previous year
Constant
prices
(2010)
Increase/
previous year
Constant
prices
(2010)
Increase/
previous year
Developers 0.7 0.8 19.1% 0.1 19.6% 1.0 10.6%
Wind turbine
manufacturers2.8 3.6 27.4% 3.7 2.2% 4.1 10.2%
Component
manufacturers0.4 0.4 9.2% 0.6 36.3% 0.5 -11.4%
Services 0.1 0.1 14.1% 0.1 -2.3% 0.1 -4.0%
Total 3.9 4.9 24.1% 5.3 7.7% 5.7 7.7%
Wind turbine manufacturers are responsible for the
largest share of both imports and exports. Similarly,
component manufacturers come second in imports as
in exports. Developers and service providers together
account for less than 10% of the value of imports.
Moreover, only 9.9% of the industry’s total value is
imported. In 2010, direct imports were €3.17 bn
whilst direct total expenditure was ten times greater
(€32.10 bn).
Overall, the EU wind industry exports considerably
more than it imports. In 2010, the sector’s positive
trade balance was €5.7 bn: during the period from
2007 to 2010, net exports increased by 46%. These
fi gures do not account for the substantial amount
of products and services sold by European-owned
companies and subsidiaries located outside of the EU.
Table 3.8 shows the evolution of net exports over the
period.
The evolution of net exports is not identical for the four
different sub-sectors. Unlike developers and wind tur-
bine manufacturers, component manufacturers and ser-
vices do not have a clear positive export trend. Turbine
manufacturers are the main net exporters and have con-
stantly represented 70% or more of the industry’s total
net exports (fi gure 3.14).
European players mainly export added value equipment
and services: wind turbines, technology, engineering ser-
vices, controlling software and hardware, electrical equip-
ment, rotors, transformers and fi nancial services.
23799_EWEA_2012.indd 3423799_EWEA_2012.indd 34 28/03/12 17:2528/03/12 17:25
Green Growth – The impact of wind energy on jobs and the economy 35
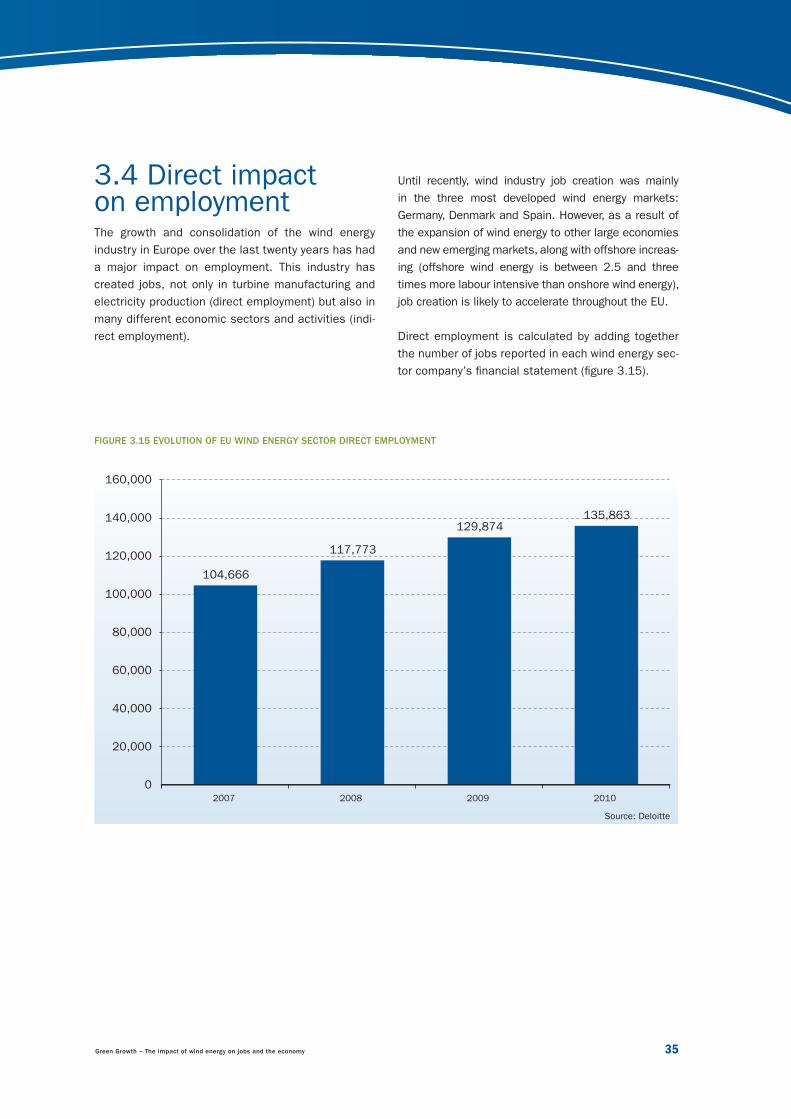
3.4 Direct impact on employmentThe growth and consolidation of the wind energy
industry in Europe over the last twenty years has had
a major impact on employment. This industry has
created jobs, not only in turbine manufacturing and
electricity production (direct employment) but also in
many different economic sectors and activities (indi-
rect employment).
FIGURE 3.15 EVOLUTION OF EU WIND ENERGY SECTOR DIRECT EMPLOYMENT
104,666
117,773
129,874 135,863
0
20,000
40,000
60,000
80,000
100,000
120,000
140,000
160,000
2007 2008 2009 2010
Source: Deloitte
Until recently, wind industry job creation was mainly
in the three most developed wind energy markets:
Germany, Denmark and Spain. However, as a result of
the expansion of wind energy to other large economies
and new emerging markets, along with offshore increas-
ing (offshore wind energy is between 2.5 and three
times more labour intensive than onshore wind energy),
job creation is likely to accelerate throughout the EU.
Direct employment is calculated by adding together
the number of jobs reported in each wind energy sec-
tor company’s fi nancial statement (fi gure 3.15).
23799_EWEA_2012.indd 3523799_EWEA_2012.indd 35 28/03/12 17:2528/03/12 17:25
Chapter 3: Direct impact of wind energy sector on EU economy
36 Green Growth – The impact of wind energy on jobs and the economy
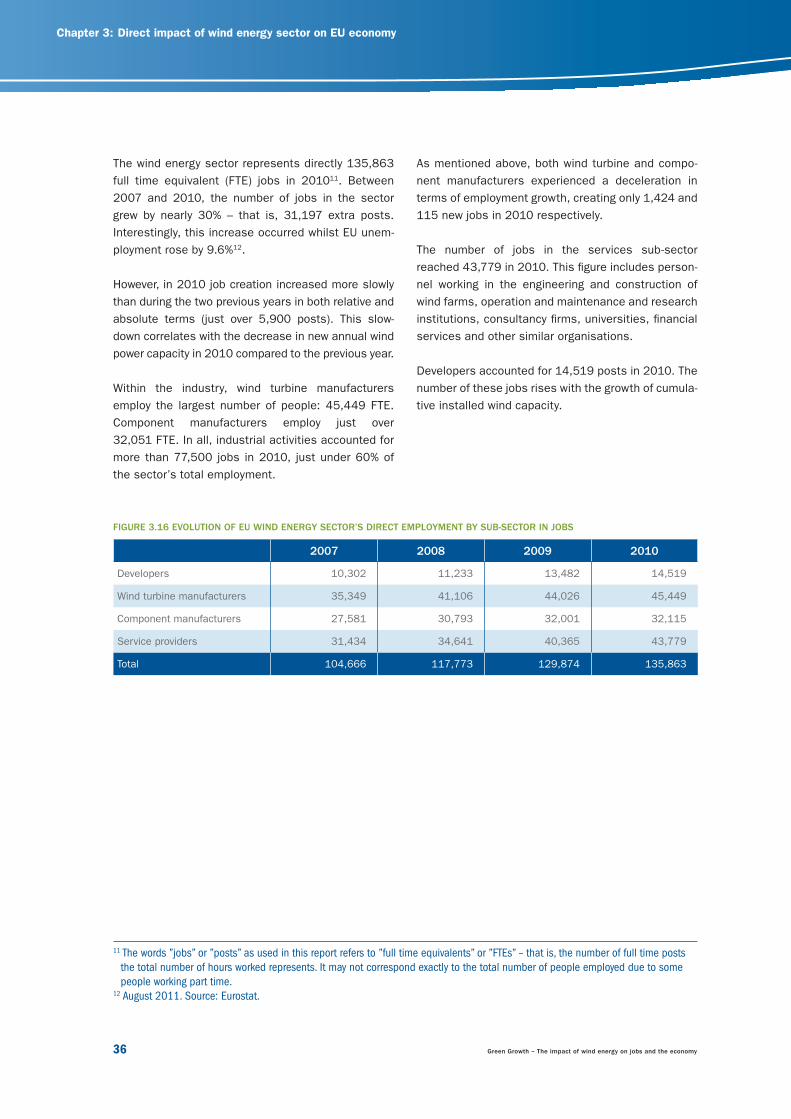
The wind energy sector represents directly 135,863
full time equivalent (FTE) jobs in 201011. Between
2007 and 2010, the number of jobs in the sector
grew by nearly 30% – that is, 31,197 extra posts.
Interestingly, this increase occurred whilst EU unem-
ployment rose by 9.6%12.
However, in 2010 job creation increased more slowly
than during the two previous years in both relative and
absolute terms (just over 5,900 posts). This slow-
down correlates with the decrease in new annual wind
power capacity in 2010 compared to the previous year.
Within the industry, wind turbine manufacturers
employ the largest number of people: 45,449 FTE.
Component manufacturers employ just over
32,051 FTE. In all, industrial activities accounted for
more than 77,500 jobs in 2010, just under 60% of
the sector’s total employment.
As mentioned above, both wind turbine and compo-
nent manufacturers experienced a deceleration in
terms of employment growth, creating only 1,424 and
115 new jobs in 2010 respectively.
The number of jobs in the services sub-sector
reached 43,779 in 2010. This fi gure includes person-
nel working in the engineering and construction of
wind farms, operation and maintenance and research
institutions, consultancy fi rms, universities, fi nancial
services and other similar organisations.
Developers accounted for 14,519 posts in 2010. The
number of these jobs rises with the growth of cumula-
tive installed wind capacity.
11 The words ”jobs” or ”posts” as used in this report refers to ”full time equivalents” or ”FTEs” – that is, the number of full time posts
the total number of hours worked represents. It may not correspond exactly to the total number of people employed due to some
people working part time.12 August 2011. Source: Eurostat.
FIGURE 3.16 EVOLUTION OF EU WIND ENERGY SECTOR’S DIRECT EMPLOYMENT BY SUB-SECTOR IN JOBS
2007 2008 2009 2010
Developers 10,302 11,233 13,482 14,519
Wind turbine manufacturers 35,349 41,106 44,026 45,449
Component manufacturers 27,581 30,793 32,001 32,115
Service providers 31,434 34,641 40,365 43,779
Total 104,666 117,773 129,874 135,863
23799_EWEA_2012.indd 3623799_EWEA_2012.indd 36 28/03/12 17:2528/03/12 17:25
Green Growth – The impact of wind energy on jobs and the economy 37
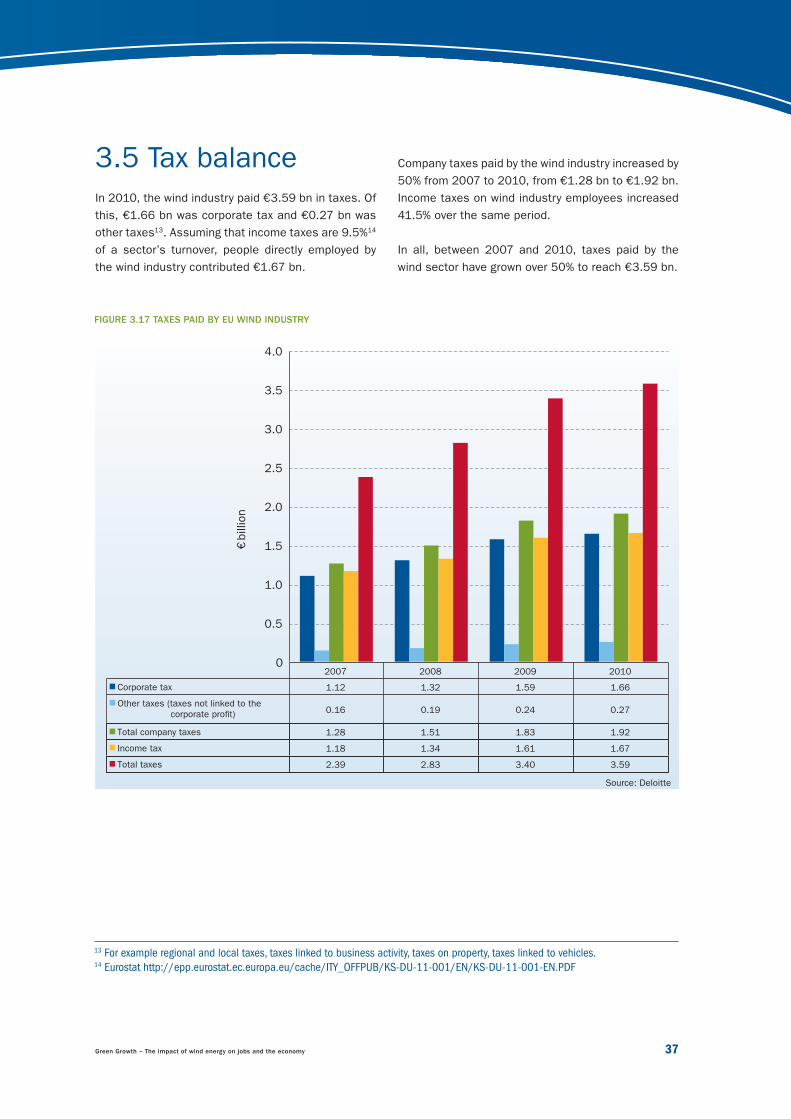
3.5 Tax balanceIn 2010, the wind industry paid €3.59 bn in taxes. Of
this, €1.66 bn was corporate tax and €0.27 bn was
other taxes13. Assuming that income taxes are 9.5%14
of a sector’s turnover, people directly employed by
the wind industry contributed €1.67 bn.
Company taxes paid by the wind industry increased by
50% from 2007 to 2010, from €1.28 bn to €1.92 bn.
Income taxes on wind industry employees increased
41.5% over the same period.
In all, between 2007 and 2010, taxes paid by the
wind sector have grown over 50% to reach €3.59 bn.
2007 2008 2009 2010
Corporate tax 1.12 1.32 1.59 1.66
Other taxes (taxes not linked to the 0.16 0.19 0.24 0.27
Total company taxes 1.28 1.51 1.83 1.92
Income tax 1.18 1.34 1.61 1.67
Total taxes 2.39 2.83 3.40 3.59
0
0.5
1.0
1.5
2.0
2.5
3.0
3.5
4.0
€billion
13 For example regional and local taxes, taxes linked to business activity, taxes on property, taxes linked to vehicles.14 Eurostat http://epp.eurostat.ec.europa.eu/cache/ITY_OFFPUB/KS-DU-11-001/EN/KS-DU-11-001-EN.PDF
FIGURE 3.17 TAXES PAID BY EU WIND INDUSTRY
Source: Deloitte
23799_EWEA_2012.indd 3723799_EWEA_2012.indd 37 28/03/12 17:2528/03/12 17:25
Chapter 3: Direct impact of wind energy sector on EU economy
38 Green Growth – The impact of wind energy on jobs and the economy
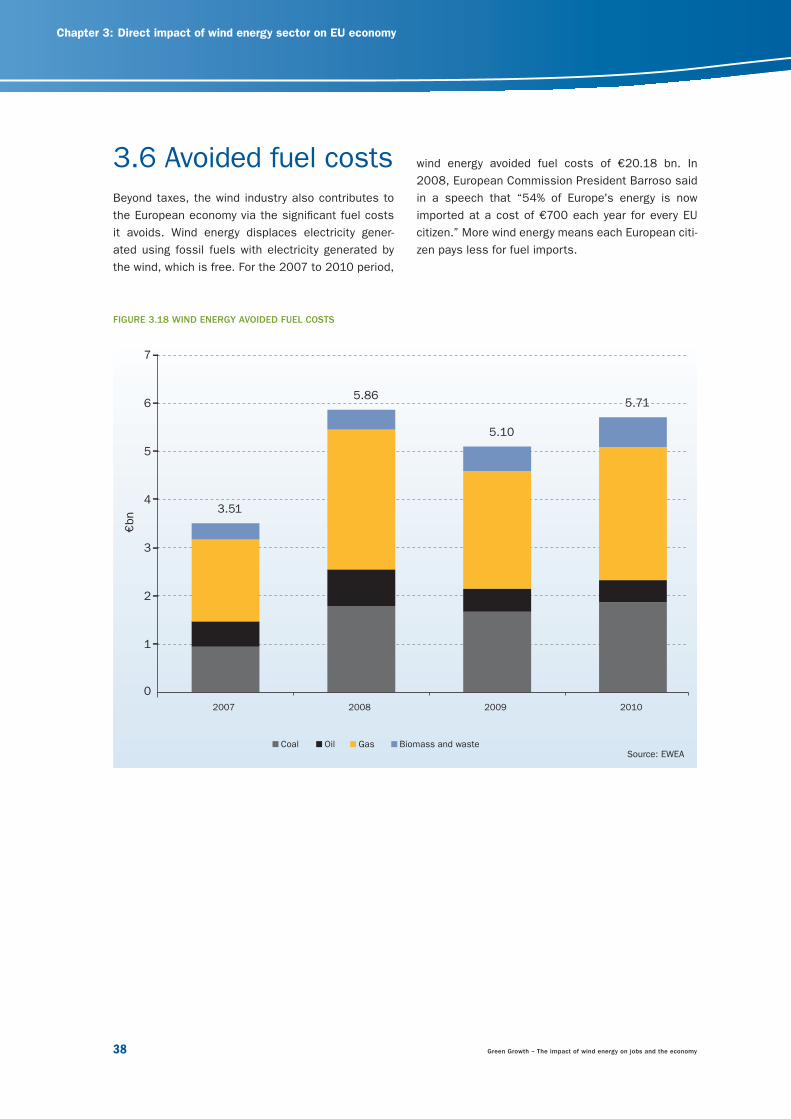
3.6 Avoided fuel costsBeyond taxes, the wind industry also contributes to
the European economy via the signifi cant fuel costs
it avoids. Wind energy displaces electricity gener-
ated using fossil fuels with electricity generated by
the wind, which is free. For the 2007 to 2010 period,
FIGURE 3.18 WIND ENERGY AVOIDED FUEL COSTS
3.51
5.86
5.10
5.71
1
0
2
3
4
5
6
7
2007 2008 2009 2010
Coal Oil Gas Biomass and waste
€ bn
Source: EWEA
wind energy avoided fuel costs of €20.18 bn. In
2008, European Commission President Barroso said
in a speech that “54% of Europe's energy is now
imported at a cost of €700 each year for every EU
citizen.” More wind energy means each European citi-
zen pays less for fuel imports.
23799_EWEA_2012.indd 3823799_EWEA_2012.indd 38 28/03/12 17:2528/03/12 17:25
Green Growth – The impact of wind energy on jobs and the economy 39
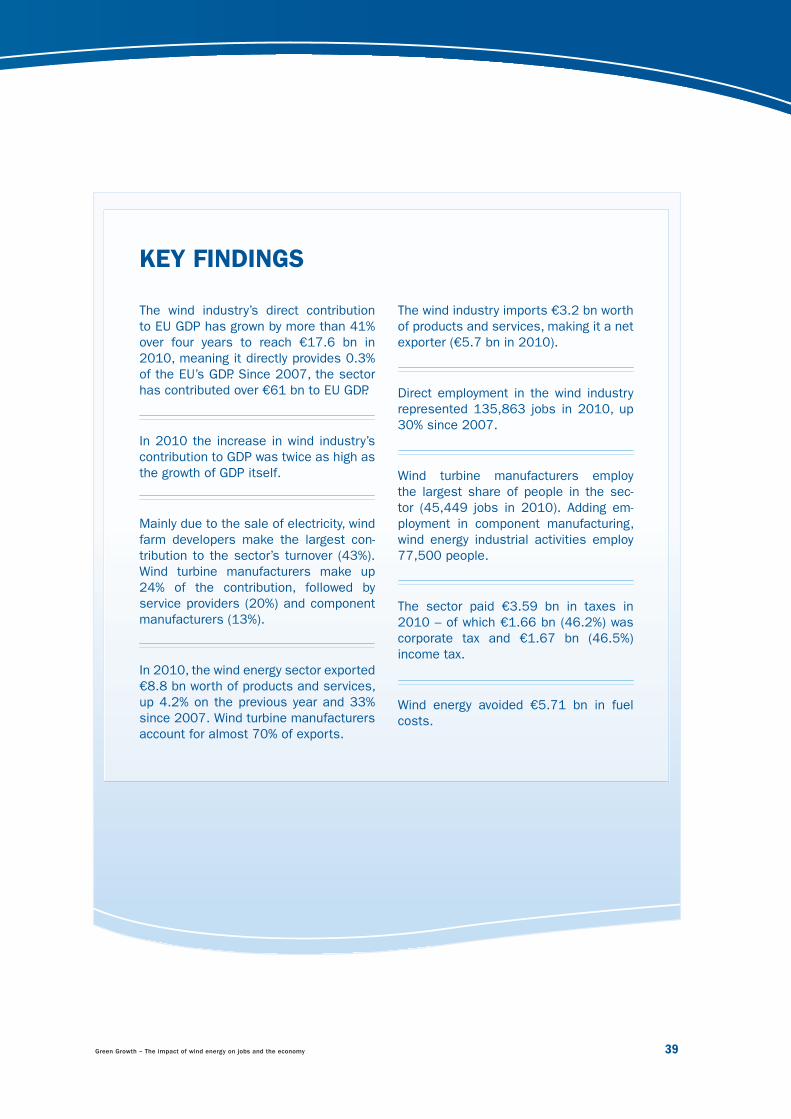
The wind industry’s direct contribution
to EU GDP has grown by more than 41%
over four years to reach €17.6 bn in
2010, meaning it directly provides 0.3%
of the EU’s GDP. Since 2007, the sector
has contributed over €61 bn to EU GDP.
In 2010 the increase in wind industry’s
contribution to GDP was twice as high as
the growth of GDP itself.
Mainly due to the sale of electricity, wind
farm developers make the largest con-
tribution to the sector’s turnover (43%).
Wind turbine manufacturers make up
24% of the contribution, followed by
service providers (20%) and component
manufacturers (13%).
In 2010, the wind energy sector exported
€8.8 bn worth of products and services,
up 4.2% on the previous year and 33%
since 2007. Wind turbine manufacturers
account for almost 70% of exports.
KEY FINDINGS
The wind industry imports €3.2 bn worth
of products and services, making it a net
exporter (€5.7 bn in 2010).
Direct employment in the wind industry
represented 135,863 jobs in 2010, up
30% since 2007.
Wind turbine manufacturers employ
the largest share of people in the sec-
tor (45,449 jobs in 2010). Adding em-
ployment in component manufacturing,
wind energy industrial activities employ
77,500 people.
The sector paid €3.59 bn in taxes in
2010 – of which €1.66 bn (46.2%) was
corporate tax and €1.67 bn (46.5%)
income tax.
Wind energy avoided €5.71 bn in fuel
costs.
23799_EWEA_2012.indd 3923799_EWEA_2012.indd 39 28/03/12 17:2528/03/12 17:25
Chapter 4: Indirect impact of the wind energy sector on the EU economy
40 Green Growth – The impact of wind energy on jobs and the economy
INDIRECT IMPACT OF THE WIND ENERGY SECTOR ON THE EU ECONOMY44.1 Indirect contribution to GDP
4.2 Indirect employment
Photo
: Stiftu
ng O
ffshore
Win
denerg
ie
23799_EWEA_2012.indd 4023799_EWEA_2012.indd 40 28/03/12 17:2528/03/12 17:25
Green Growth – The impact of wind energy on jobs and the economy 41
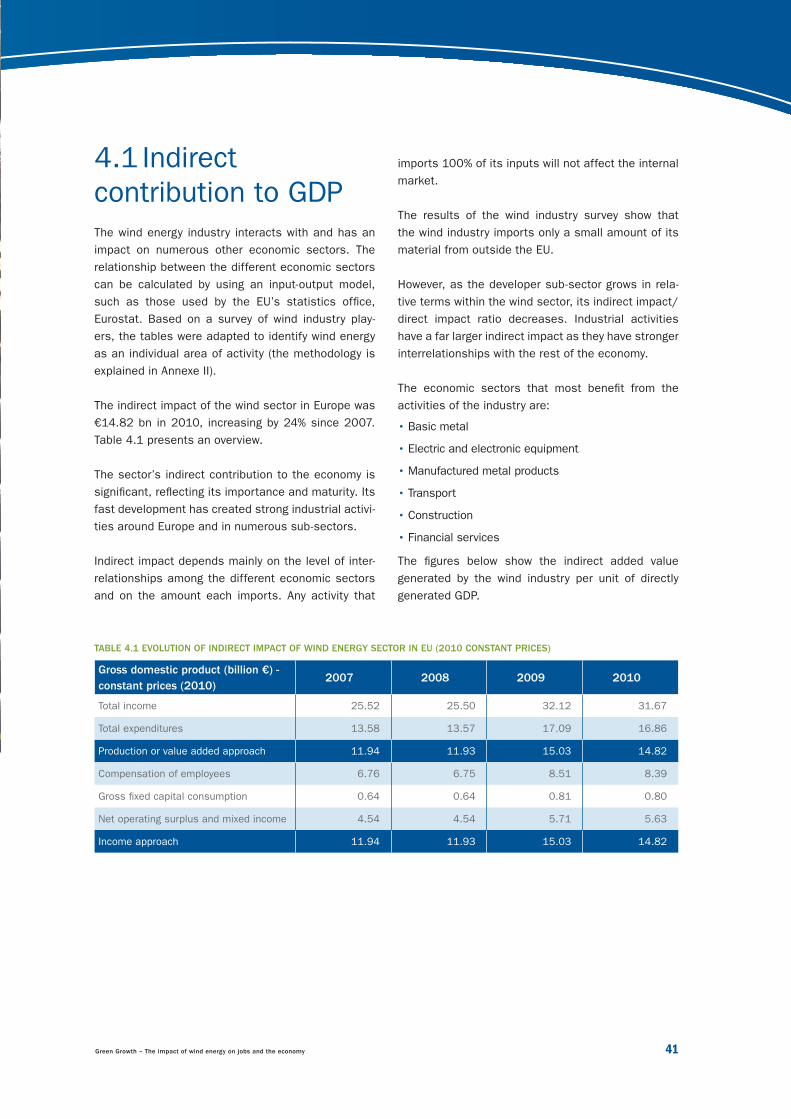
TABLE 4.1 EVOLUTION OF INDIRECT IMPACT OF WIND ENERGY SECTOR IN EU (2010 CONSTANT PRICES)
Gross domestic product (billion €) -
constant prices (2010)2007 2008 2009 2010
Total income 25.52 25.50 32.12 31.67
Total expenditures 13.58 13.57 17.09 16.86
Production or value added approach 11.94 11.93 15.03 14.82
Compensation of employees 6.76 6.75 8.51 8.39
Gross fi xed capital consumption 0.64 0.64 0.81 0.80
Net operating surplus and mixed income 4.54 4.54 5.71 5.63
Income approach 11.94 11.93 15.03 14.82
4.1 Indirectcontribution to GDP The wind energy industry interacts with and has an
impact on numerous other economic sectors. The
relationship between the different economic sectors
can be calculated by using an input-output model,
such as those used by the EU’s statistics offi ce,
Eurostat. Based on a survey of wind industry play-
ers, the tables were adapted to identify wind energy
as an individual area of activity (the methodology is
explained in Annexe II).
The indirect impact of the wind sector in Europe was
€14.82 bn in 2010, increasing by 24% since 2007.
Table 4.1 presents an overview.
The sector’s indirect contribution to the economy is
signifi cant, refl ecting its importance and maturity. Its
fast development has created strong industrial activi-
ties around Europe and in numerous sub-sectors.
Indirect impact depends mainly on the level of inter-
relationships among the different economic sectors
and on the amount each imports. Any activity that
imports 100% of its inputs will not affect the internal
market.
The results of the wind industry survey show that
the wind industry imports only a small amount of its
material from outside the EU.
However, as the developer sub-sector grows in rela-
tive terms within the wind sector, its indirect impact/
direct impact ratio decreases. Industrial activities
have a far larger indirect impact as they have stronger
interrelationships with the rest of the economy.
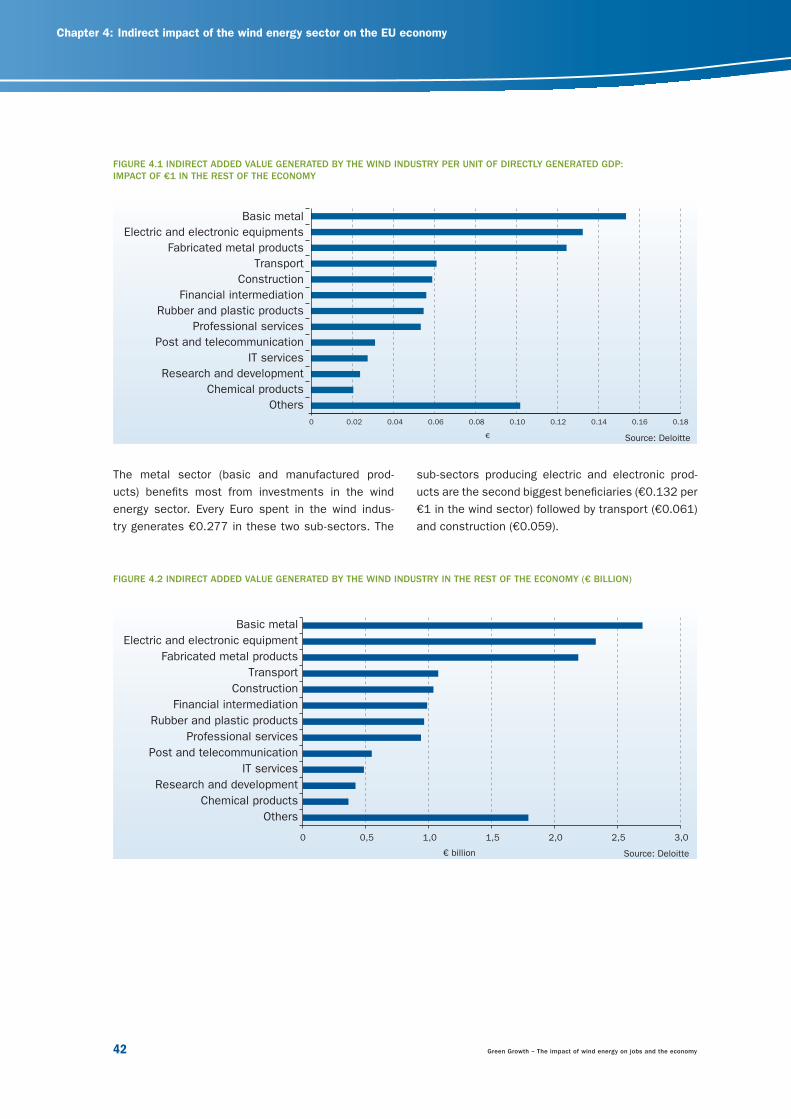
The economic sectors that most benefi t from the
activities of the industry are:
• Basic metal
• Electric and electronic equipment
• Manufactured metal products
• Transport
• Construction
• Financial services
The fi gures below show the indirect added value
generated by the wind industry per unit of directly
generated GDP.
23799_EWEA_2012.indd 4123799_EWEA_2012.indd 41 28/03/12 17:2528/03/12 17:25
Chapter 4: Indirect impact of the wind energy sector on the EU economy
42 Green Growth – The impact of wind energy on jobs and the economy
The metal sector (basic and manufactured prod-
ucts) benefi ts most from investments in the wind
energy sector. Every Euro spent in the wind indus-
try generates €0.277 in these two sub-sectors. The
FIGURE 4.1 INDIRECT ADDED VALUE GENERATED BY THE WIND INDUSTRY PER UNIT OF DIRECTLY GENERATED GDP:
IMPACT OF €1 IN THE REST OF THE ECONOMY
sub-sectors producing electric and electronic prod-
ucts are the second biggest benefi ciaries (€0.132 per
€1 in the wind sector) followed by transport (€0.061)
and construction (€0.059).
0 0.02
€
0.04 0.06 0.08 0.10 0.12 0.14 0.16 0.18
Basic metal
Electric and electronic equipments
Fabricated metal products
Transport
Construction
Financial intermediation
Rubber and plastic products
Professional services
Post and telecommunication
IT services
Research and development
Chemical products
Others
0 0,5
€ billion
1,0 1,5 2,0 2,5 3,0
Others
Chemical products
Research and development
IT services
Post and telecommunication
Professional services
Rubber and plastic products
Financial intermediation
Construction
Transport
Fabricated metal products
Electric and electronic equipment
Basic metal
FIGURE 4.2 INDIRECT ADDED VALUE GENERATED BY THE WIND INDUSTRY IN THE REST OF THE ECONOMY (€ BILLION)
Source: Deloitte
Source: Deloitte
23799_EWEA_2012.indd 4223799_EWEA_2012.indd 42 28/03/12 17:2528/03/12 17:25
Green Growth – The impact of wind energy on jobs and the economy 43
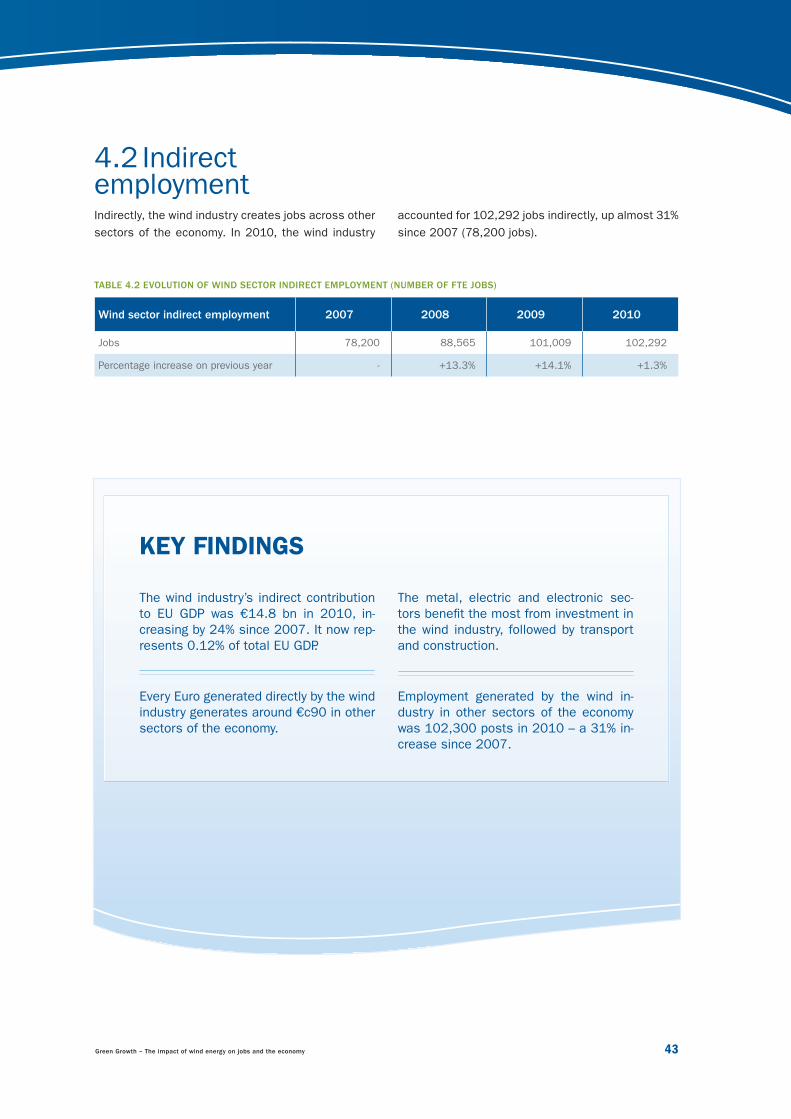
4.2 Indirect employmentIndirectly, the wind industry creates jobs across other
sectors of the economy. In 2010, the wind industry
TABLE 4.2 EVOLUTION OF WIND SECTOR INDIRECT EMPLOYMENT (NUMBER OF FTE JOBS)
Wind sector indirect employment 2007 2008 2009 2010
Jobs 78,200 88,565 101,009 102,292
Percentage increase on previous year - +13.3% +14.1% +1.3%
accounted for 102,292 jobs indirectly, up almost 31%
since 2007 (78,200 jobs).
The wind industry’s indirect contribution
to EU GDP was €14.8 bn in 2010, in-
creasing by 24% since 2007. It now rep-
resents 0.12% of total EU GDP.
Every Euro generated directly by the wind
industry generates around €c90 in other
sectors of the economy.
KEY FINDINGS
The metal, electric and electronic sec-
tors benefi t the most from investment in
the wind industry, followed by transport
and construction.
Employment generated by the wind in-
dustry in other sectors of the economy
was 102,300 posts in 2010 – a 31% in-
crease since 2007.
23799_EWEA_2012.indd 4323799_EWEA_2012.indd 43 28/03/12 17:2528/03/12 17:25
Chapter 5: Overall impact of the wind energy sector on the EU economy
44 Green Growth – The impact of wind energy on jobs and the economy
OVERALL IMPACT OF THE WIND ENERGY SECTOR ON THE EU ECONOMY55.1 Total impact on GDP
5.2 Total employment
Photo
: vesta
s
23799_EWEA_2012.indd 4423799_EWEA_2012.indd 44 28/03/12 17:2528/03/12 17:25
Green Growth – The impact of wind energy on jobs and the economy 45
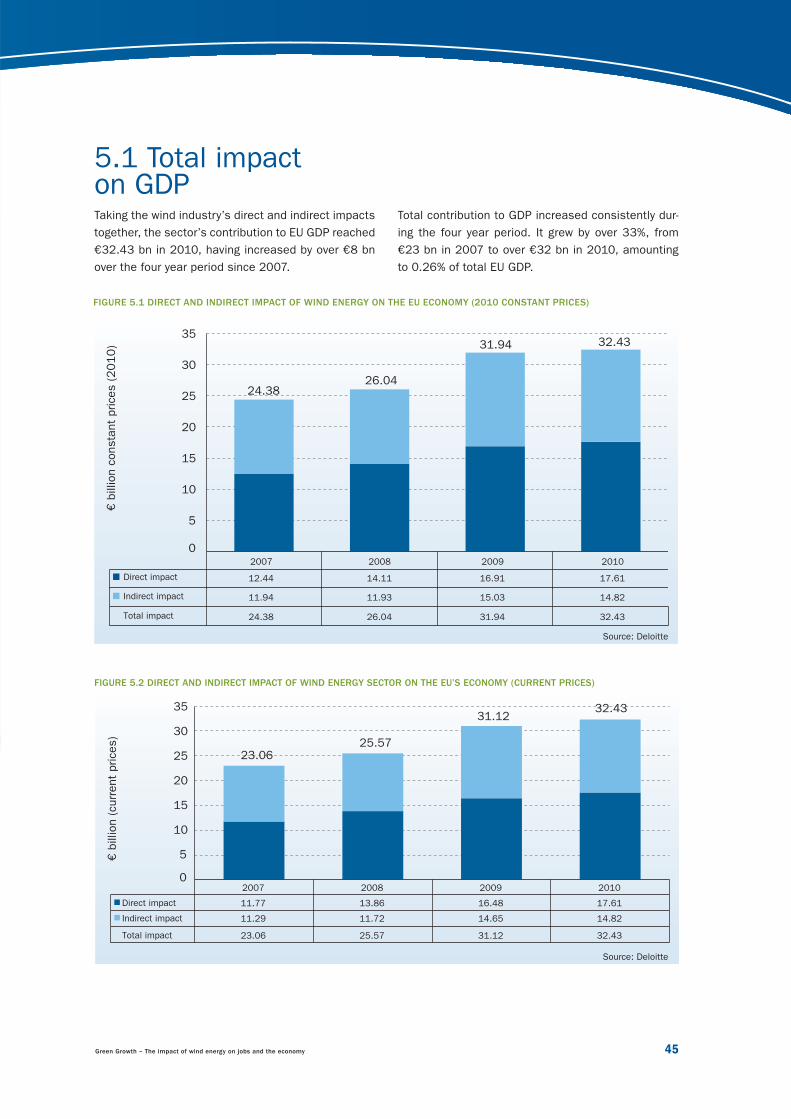
5.1 Total impact on GDP Taking the wind industry’s direct and indirect impacts
together, the sector’s contribution to EU GDP reached
€32.43 bn in 2010, having increased by over €8 bn
over the four year period since 2007.
Total contribution to GDP increased consistently dur-
ing the four year period. It grew by over 33%, from
€23 bn in 2007 to over €32 bn in 2010, amounting
to 0.26% of total EU GDP.
FIGURE 5.1 DIRECT AND INDIRECT IMPACT OF WIND ENERGY ON THE EU ECONOMY (2010 CONSTANT PRICES)
2007 2008 2009 2010
Indirect impact 11.94 11.93 15.03 14.82
Direct impact 12.44 14.11 16.91 17.61
Total impact 24.38 26.04 31.94 32.43
5
0
10
15
20
25
30
35
€ b
illion c
onsta
nt
prices (
20
10
)
24.3826.04
31.94 32.43
2007 2008 2009 2010
23.0625.57
31.1232.43
Indirect impact 11.29 11.72 14.65 14.82
Direct impact 11.77 13.86 16.48 17.61
Total impact 23.06 25.57 31.12 32.43
5
0
10
15
20
25
30
35
€ b
illion (curr
ent
prices)
FIGURE 5.2 DIRECT AND INDIRECT IMPACT OF WIND ENERGY SECTOR ON THE EU’S ECONOMY (CURRENT PRICES)
Source: Deloitte
Source: Deloitte
23799_EWEA_2012.indd 4523799_EWEA_2012.indd 45 28/03/12 17:2628/03/12 17:26
Chapter 5: Overall impact of the wind energy sector on the EU economy
46 Green Growth – The impact of wind energy on jobs and the economy
FIGURE 5.3 WIND ENERGY SECTOR’S SHARE OF TOTAL EU GDP
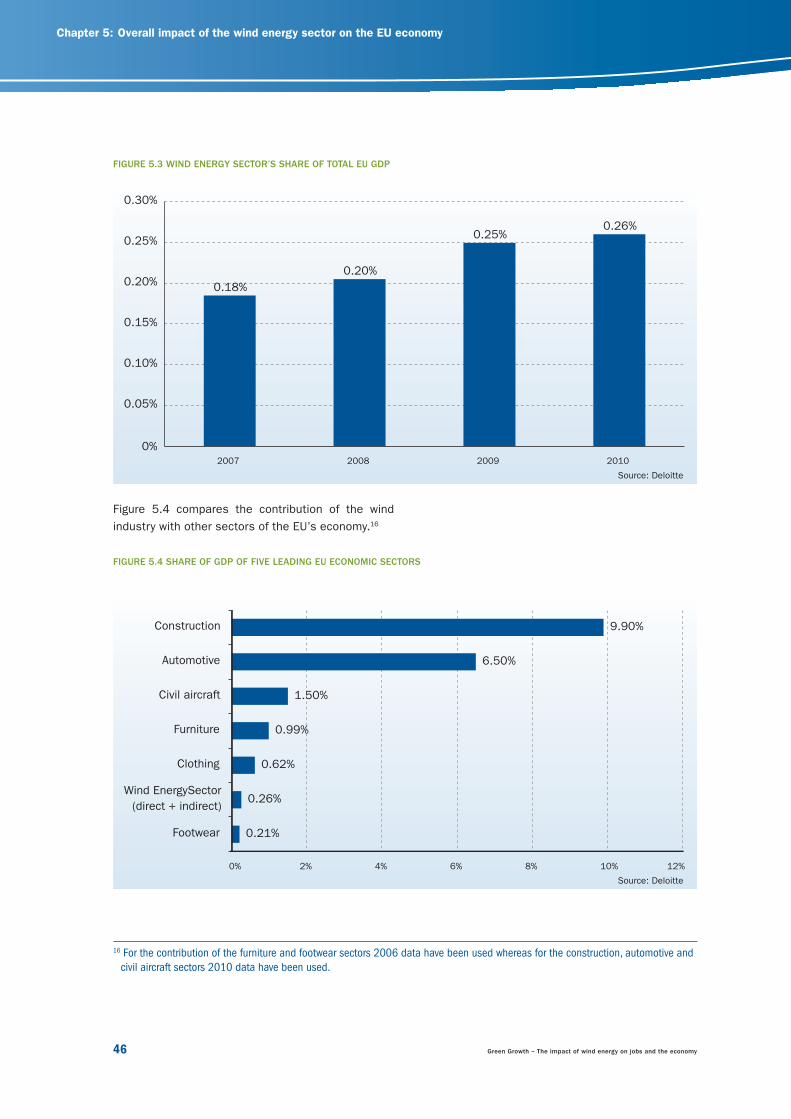
Figure 5.4 compares the contribution of the wind
industry with other sectors of the EU’s economy.16
0.18%
0.20%
0.25%0.26%
0%
0.05%
0.10%
0.15%
0.20%
0.25%
0.30%
2007 2008 2009 2010
0.21%
0.26%
0.62%
0.99%
1.50%
6.50%
9.90%
2%0% 4% 6% 8% 10% 12%
Footwear
Wind EnergySector
(direct + indirect)
Clothing
Furniture
Civil aircraft
Automotive
Construction
16 For the contribution of the furniture and footwear sectors 2006 data have been used whereas for the construction, automotive and
civil aircraft sectors 2010 data have been used.
FIGURE 5.4 SHARE OF GDP OF FIVE LEADING EU ECONOMIC SECTORS
Source: Deloitte
Source: Deloitte
23799_EWEA_2012.indd 4623799_EWEA_2012.indd 46 28/03/12 17:2628/03/12 17:26
Green Growth – The impact of wind energy on jobs and the economy 47
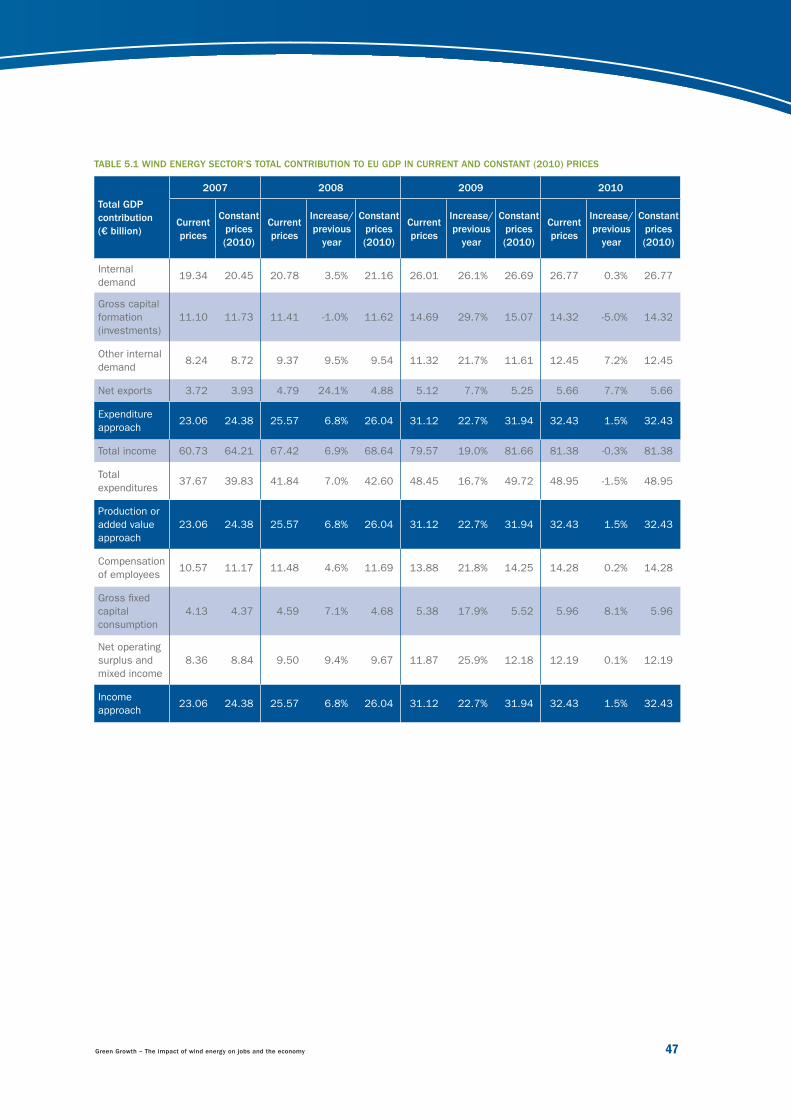
TABLE 5.1 WIND ENERGY SECTOR’S TOTAL CONTRIBUTION TO EU GDP IN CURRENT AND CONSTANT (2010) PRICES
Total GDP
contribution
(€ billion)
2007 2008 2009 2010
Current
prices
Constant
prices
(2010)
Current
prices
Increase/
previous
year
Constant
prices
(2010)
Current
prices
Increase/
previous
year
Constant
prices
(2010)
Current
prices
Increase/
previous
year
Constant
prices
(2010)
Internal
demand19.34 20.45 20.78 3.5% 21.16 26.01 26.1% 26.69 26.77 0.3% 26.77
Gross capital
formation
(investments)
11.10 11.73 11.41 -1.0% 11.62 14.69 29.7% 15.07 14.32 -5.0% 14.32
Other internal
demand8.24 8.72 9.37 9.5% 9.54 11.32 21.7% 11.61 12.45 7.2% 12.45
Net exports 3.72 3.93 4.79 24.1% 4.88 5.12 7.7% 5.25 5.66 7.7% 5.66
Expenditure
approach23.06 24.38 25.57 6.8% 26.04 31.12 22.7% 31.94 32.43 1.5% 32.43
Total income 60.73 64.21 67.42 6.9% 68.64 79.57 19.0% 81.66 81.38 -0.3% 81.38
Total
expenditures37.67 39.83 41.84 7.0% 42.60 48.45 16.7% 49.72 48.95 -1.5% 48.95
Production or
added value
approach
23.06 24.38 25.57 6.8% 26.04 31.12 22.7% 31.94 32.43 1.5% 32.43
Compensation
of employees10.57 11.17 11.48 4.6% 11.69 13.88 21.8% 14.25 14.28 0.2% 14.28
Gross fi xed
capital
consumption
4.13 4.37 4.59 7.1% 4.68 5.38 17.9% 5.52 5.96 8.1% 5.96
Net operating
surplus and
mixed income
8.36 8.84 9.50 9.4% 9.67 11.87 25.9% 12.18 12.19 0.1% 12.19
Income
approach23.06 24.38 25.57 6.8% 26.04 31.12 22.7% 31.94 32.43 1.5% 32.43
23799_EWEA_2012.indd 4723799_EWEA_2012.indd 47 28/03/12 17:2628/03/12 17:26
Chapter 5: Overall impact of the wind energy sector on the EU economy
48 Green Growth – The impact of wind energy on jobs and the economy
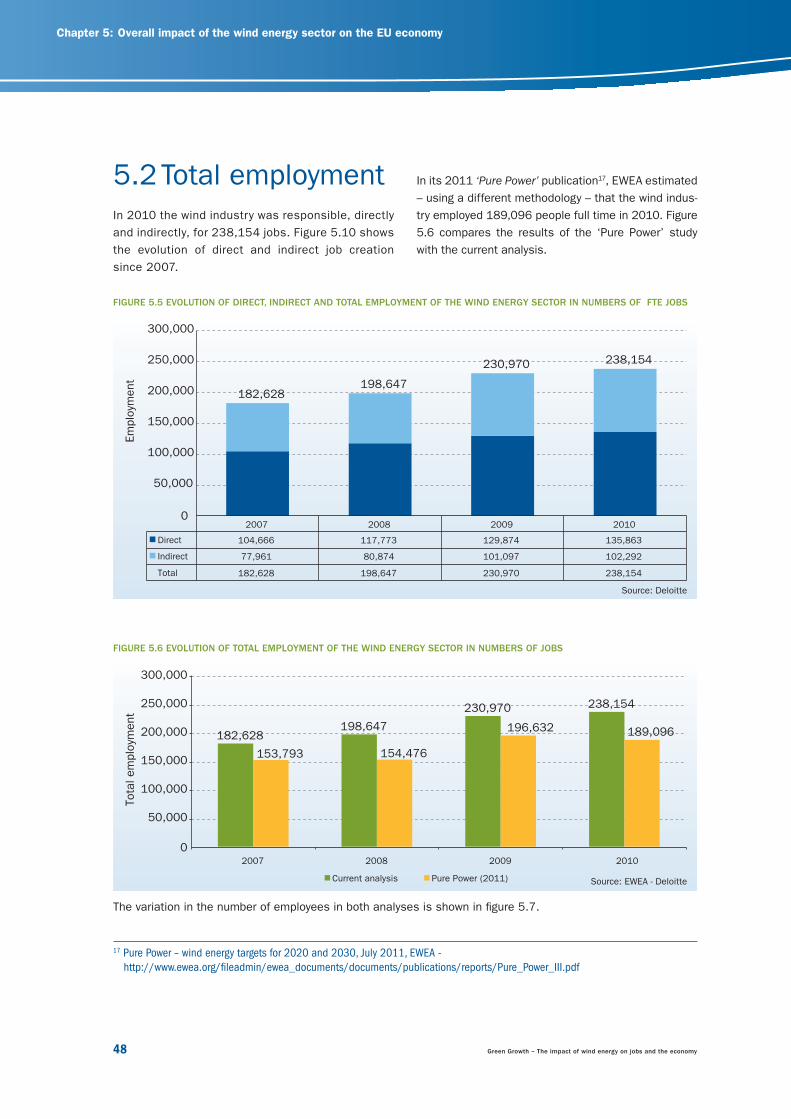
FIGURE 5.5 EVOLUTION OF DIRECT, INDIRECT AND TOTAL EMPLOYMENT OF THE WIND ENERGY SECTOR IN NUMBERS OF FTE JOBS
5.2 Total employmentIn 2010 the wind industry was responsible, directly
and indirectly, for 238,154 jobs. Figure 5.10 shows
the evolution of direct and indirect job creation
since 2007.
FIGURE 5.6 EVOLUTION OF TOTAL EMPLOYMENT OF THE WIND ENERGY SECTOR IN NUMBERS OF JOBS
2007 2008 2009 2010
Indirect 77,961 80,874 101,097 102,292
Direct 104,666 117,773 129,874 135,863
Total 182,628 198,647 230,970 238,154
182,628198,647
230,970 238,154
0
50,000
100,000
150,000
200,000
250,000
300,000
Em
plo
yment
182,628198,647
230,970 238,154
153,793 154,476
196,632 189,096
0
50,000
100,000
150,000
200,000
250,000
300,000
2007 2008 2009 2010
Current analysis
Tota
l em
plo
yment
Pure Power (2011)
In its 2011 ‘Pure Power’ publication17, EWEA estimated
– using a different methodology – that the wind indus-
try employed 189,096 people full time in 2010. Figure
5.6 compares the results of the ‘Pure Power’ study
with the current analysis.
The variation in the number of employees in both analyses is shown in fi gure 5.7.
17 Pure Power – wind energy targets for 2020 and 2030, July 2011, EWEA -
http://www.ewea.org/fi leadmin/ewea_documents/documents/publications/reports/Pure_Power_III.pdf
Source: Deloitte
Source: EWEA - Deloitte
23799_EWEA_2012.indd 4823799_EWEA_2012.indd 48 28/03/12 17:2628/03/12 17:26
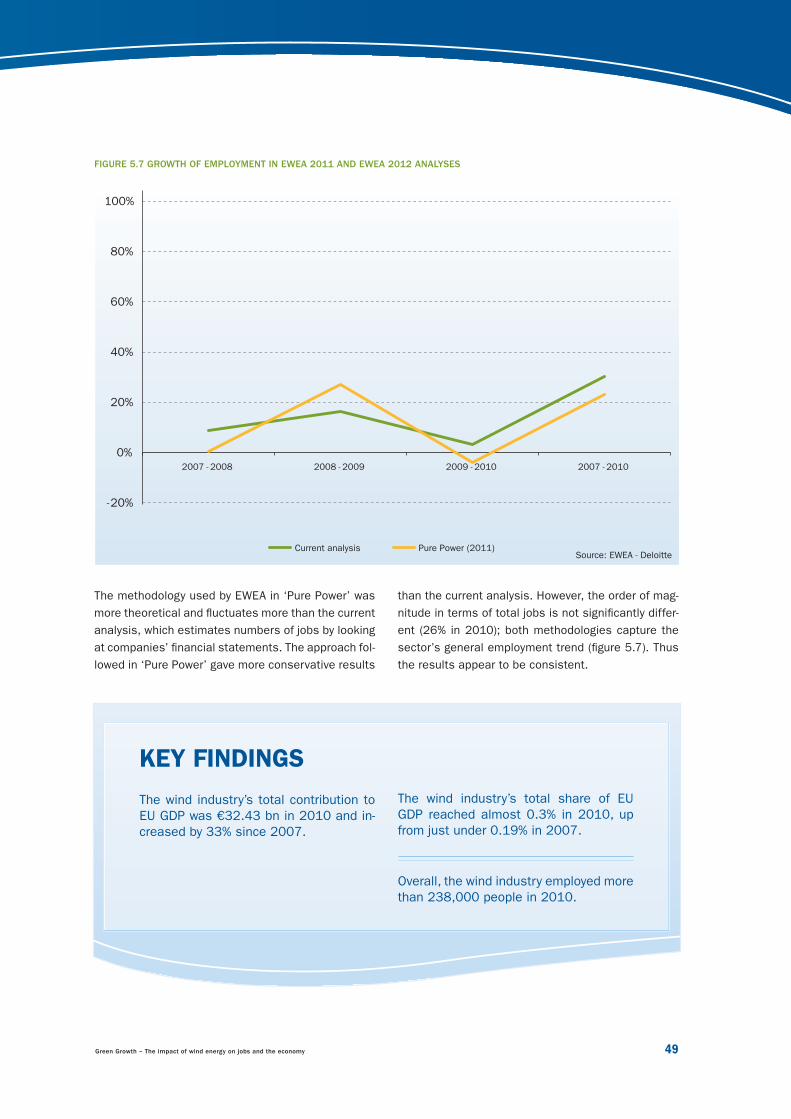
Green Growth – The impact of wind energy on jobs and the economy 49
FIGURE 5.7 GROWTH OF EMPLOYMENT IN EWEA 2011 AND EWEA 2012 ANALYSES
-20%
0%
20%
40%
60%
80%
100%
2007 - 2008 2008 - 2009 2009 - 2010 2007 - 2010
Current analysis Pure Power (2011) Source: EWEA - Deloitte
The wind industry’s total contribution to
EU GDP was €32.43 bn in 2010 and in-
creased by 33% since 2007.
KEY FINDINGS
The wind industry’s total share of EU
GDP reached almost 0.3% in 2010, up
from just under 0.19% in 2007.
Overall, the wind industry employed more
than 238,000 people in 2010.
The methodology used by EWEA in ‘Pure Power’ was
more theoretical and fl uctuates more than the current
analysis, which estimates numbers of jobs by looking
at companies’ fi nancial statements. The approach fol-
lowed in ‘Pure Power’ gave more conservative results
than the current analysis. However, the order of mag-
nitude in terms of total jobs is not signifi cantly differ-
ent (26% in 2010); both methodologies capture the
sector’s general employment trend (fi gure 5.7). Thus
the results appear to be consistent.
23799_EWEA_2012.indd 4923799_EWEA_2012.indd 49 28/03/12 17:2628/03/12 17:26
Chapter 6: Economic effort in R&D
50 Green Growth – The impact of wind energy on jobs and the economy
ECONOMIC EFFORT IN R&D6
Photo
: Vesta
s
23799_EWEA_2012.indd 5023799_EWEA_2012.indd 50 28/03/12 17:2628/03/12 17:26
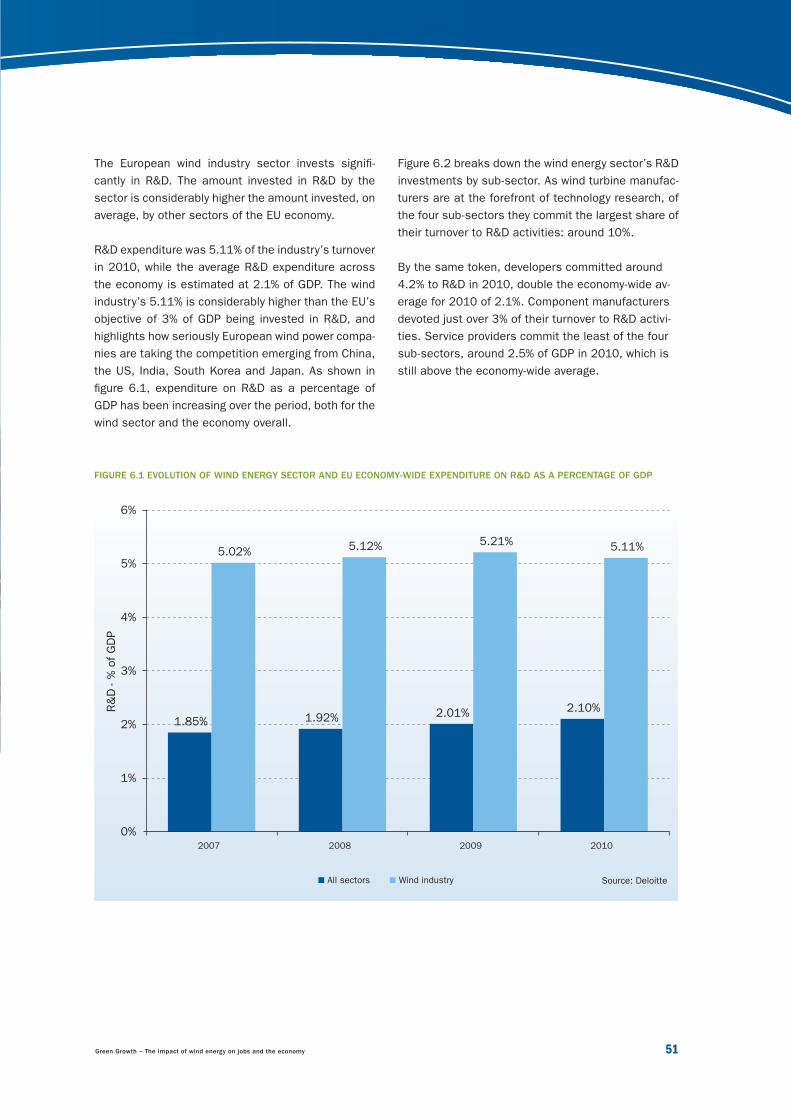
Green Growth – The impact of wind energy on jobs and the economy 51
The European wind industry sector invests signifi -
cantly in R&D. The amount invested in R&D by the
sector is considerably higher the amount invested, on
average, by other sectors of the EU economy.
R&D expenditure was 5.11% of the industry’s turnover
in 2010, while the average R&D expenditure across
the economy is estimated at 2.1% of GDP. The wind
industry’s 5.11% is considerably higher than the EU’s
objective of 3% of GDP being invested in R&D, and
highlights how seriously European wind power compa-
nies are taking the competition emerging from China,
the US, India, South Korea and Japan. As shown in
fi gure 6.1, expenditure on R&D as a percentage of
GDP has been increasing over the period, both for the
wind sector and the economy overall.
Figure 6.2 breaks down the wind energy sector’s R&D
investments by sub-sector. As wind turbine manufac-
turers are at the forefront of technology research, of
the four sub-sectors they commit the largest share of
their turnover to R&D activities: around 10%.
By the same token, developers committed around
4.2% to R&D in 2010, double the economy-wide av-
erage for 2010 of 2.1%. Component manufacturers
devoted just over 3% of their turnover to R&D activi-
ties. Service providers commit the least of the four
sub-sectors, around 2.5% of GDP in 2010, which is
still above the economy-wide average.
FIGURE 6.1 EVOLUTION OF WIND ENERGY SECTOR AND EU ECONOMY-WIDE EXPENDITURE ON R&D AS A PERCENTAGE OF GDP
1.85% 1.92% 2.01% 2.10%
5.02% 5.12% 5.21% 5.11%
0%
1%
2%
3%
4%
5%
6%
2007 2008 2009 2010
R&
D - %
of G
DP
All sectors Wind industry Source: Deloitte
23799_EWEA_2012.indd 5123799_EWEA_2012.indd 51 28/03/12 17:2628/03/12 17:26
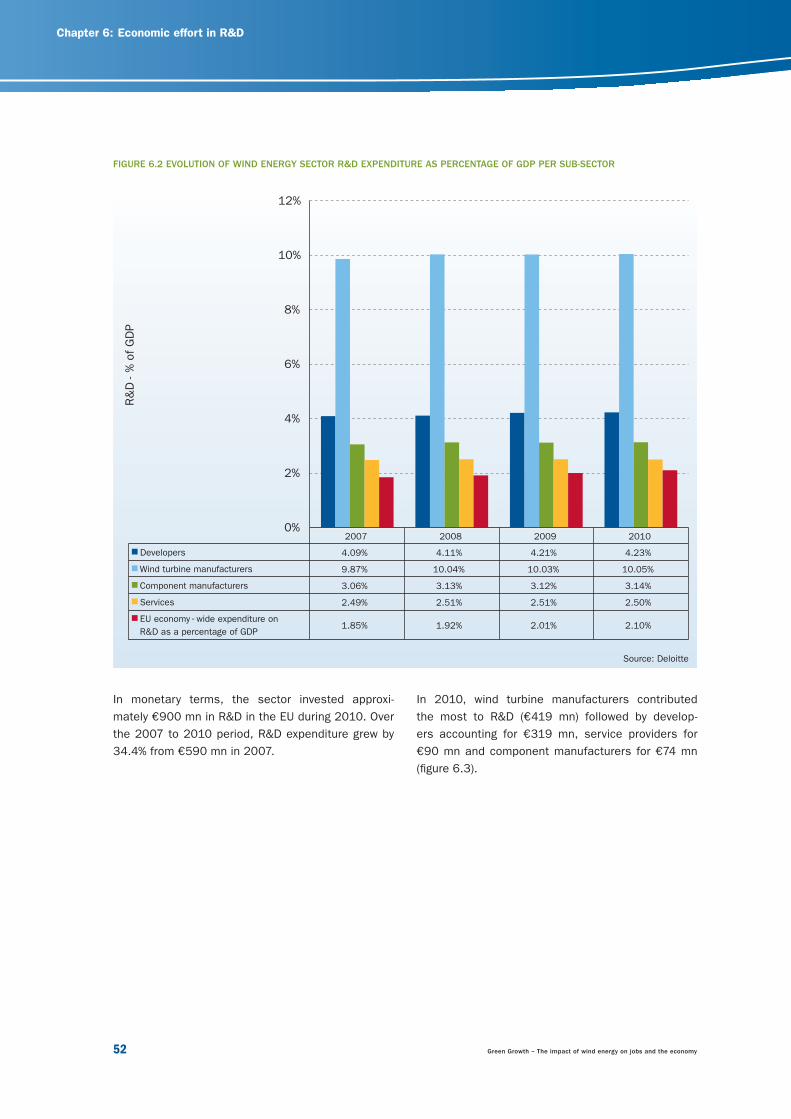
Chapter 6: Economic effort in R&D
52 Green Growth – The impact of wind energy on jobs and the economy
In monetary terms, the sector invested approxi-
mately €900 mn in R&D in the EU during 2010. Over
the 2007 to 2010 period, R&D expenditure grew by
34.4% from €590 mn in 2007.
FIGURE 6.2 EVOLUTION OF WIND ENERGY SECTOR R&D EXPENDITURE AS PERCENTAGE OF GDP PER SUB-SECTOR
2007 2008 2009 2010
Developers 4.09% 4.11% 4.21% 4.23%
Wind turbine manufacturers 9.87% 10.04% 10.03% 10.05%
Component manufacturers 3.06% 3.13% 3.12% 3.14%
Services 2.49% 2.51% 2.51% 2.50%
EU economy - wide expenditure on
R&D as a percentage of GDP1.85% 1.92% 2.01% 2.10%
0%
2%
4%
6%
8%
10%
12%
R&
D -
% o
f G
DP
In 2010, wind turbine manufacturers contributed
the most to R&D (€419 mn) followed by develop-
ers accounting for €319 mn, service providers for
€90 mn and component manufacturers for €74 mn
(fi gure 6.3).
Source: Deloitte
23799_EWEA_2012.indd 5223799_EWEA_2012.indd 52 28/03/12 17:2628/03/12 17:26
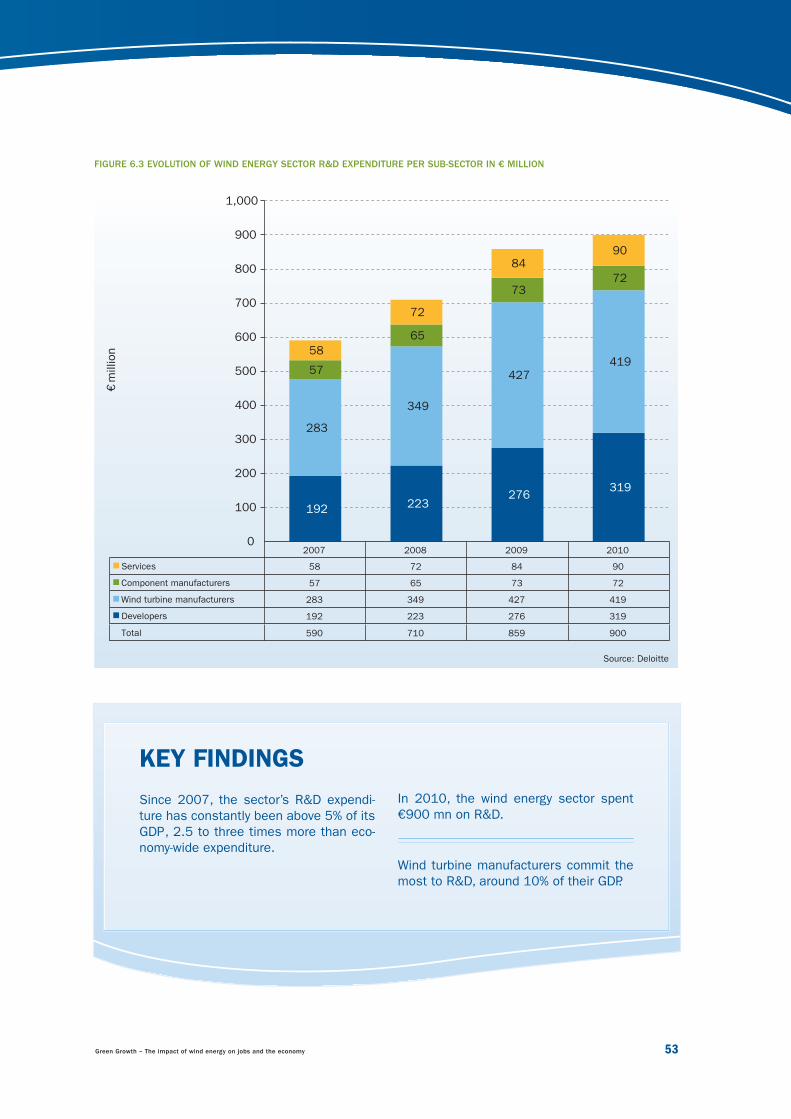
Green Growth – The impact of wind energy on jobs and the economy 53
FIGURE 6.3 EVOLUTION OF WIND ENERGY SECTOR R&D EXPENDITURE PER SUB-SECTOR IN € MILLION
2007 2008 2009 2010
Services 58 72 84 90
Component manufacturers 57 65 73 72
Wind turbine manufacturers 283 349 427 419
Developers 192 223 276 319
Total 590 710 859 900
192 223 276
319
283
349
427 419
57
65
73 72
58
72
84 90
0
100
200
300
400
500
600
700
800
900
1,000
€ m
illion
Source: Deloitte
Since 2007, the sector’s R&D expendi-
ture has constantly been above 5% of its
GDP , 2.5 to three times more than eco-
nomy-wide expenditure.
KEY FINDINGS
In 2010, the wind energy sector spent
€900 mn on R&D.
Wind turbine manufacturers commit the
most to R&D, around 10% of their GDP.
23799_EWEA_2012.indd 5323799_EWEA_2012.indd 53 28/03/12 17:2628/03/12 17:26
Chapter 7: Forecast to 2020 and 2030
54 Green Growth – The impact of wind energy on jobs and the economy
7.1 Total contribution to GDP
7.2 Employment
FORECAST TO 2020 AND 20307
Photo
: Dre
am
stim
e
23799_EWEA_2012.indd 5423799_EWEA_2012.indd 54 28/03/12 17:2628/03/12 17:26
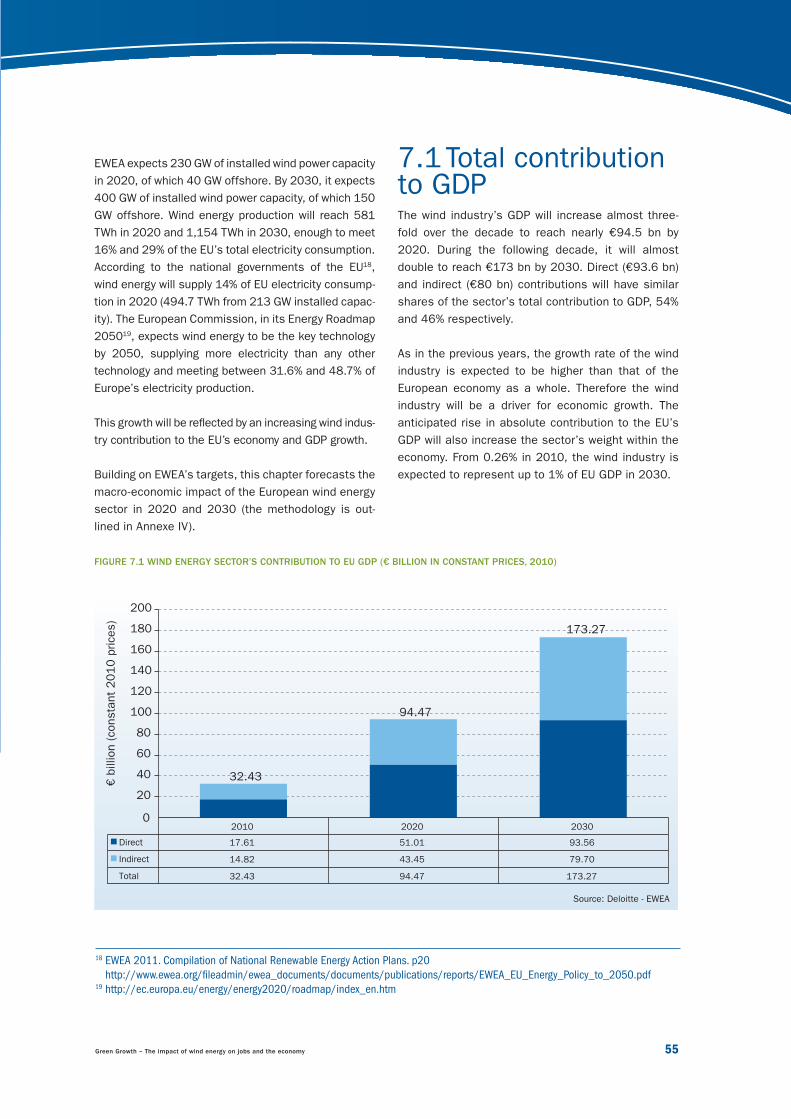
Green Growth – The impact of wind energy on jobs and the economy 55
EWEA expects 230 GW of installed wind power capacity
in 2020, of which 40 GW offshore. By 2030, it expects
400 GW of installed wind power capacity, of which 150
GW offshore. Wind energy production will reach 581
TWh in 2020 and 1,154 TWh in 2030, enough to meet
16% and 29% of the EU’s total electricity consumption.
According to the national governments of the EU18,
wind energy will supply 14% of EU electricity consump-
tion in 2020 (494.7 TWh from 213 GW installed capac-
ity). The European Commission, in its Energy Roadmap
205019, expects wind energy to be the key technology
by 2050, supplying more electricity than any other
technology and meeting between 31.6% and 48.7% of
Europe’s electricity production.
This growth will be refl ected by an increasing wind indus-
try contribution to the EU’s economy and GDP growth.
Building on EWEA’s targets, this chapter forecasts the
macro-economic impact of the European wind energy
sector in 2020 and 2030 (the methodology is out-
lined in Annexe IV).
7.1 Total contribution to GDPThe wind industry’s GDP will increase almost three-
fold over the decade to reach nearly €94.5 bn by
2020. During the following decade, it will almost
double to reach €173 bn by 2030. Direct (€93.6 bn)
and indirect (€80 bn) contributions will have similar
shares of the sector’s total contribution to GDP, 54%
and 46% respectively.
As in the previous years, the growth rate of the wind
industry is expected to be higher than that of the
European economy as a whole. Therefore the wind
industry will be a driver for economic growth. The
anticipated rise in absolute contribution to the EU’s
GDP will also increase the sector’s weight within the
economy. From 0.26% in 2010, the wind industry is
expected to represent up to 1% of EU GDP in 2030.
FIGURE 7.1 WIND ENERGY SECTOR’S CONTRIBUTION TO EU GDP (€ BILLION IN CONSTANT PRICES, 2010)
2010 2020 2030
Indirect 14.82 43.45 79.70
Direct 17.61 51.01 93.56
Total 32.43
32.43
94.47
94.47
173.27
173.27
0
20
40
60
80
100
120
140
160
180
200
€ b
illion (
consta
nt
2010 p
rices)
18 EWEA 2011. Compilation of National Renewable Energy Action Plans. p20
http://www.ewea.org/fi leadmin/ewea_documents/documents/publications/reports/EWEA_EU_Energy_Policy_to_2050.pdf 19 http://ec.europa.eu/energy/energy2020/roadmap/index_en.htm
Source: Deloitte - EWEA
23799_EWEA_2012.indd 5523799_EWEA_2012.indd 55 28/03/12 17:2628/03/12 17:26
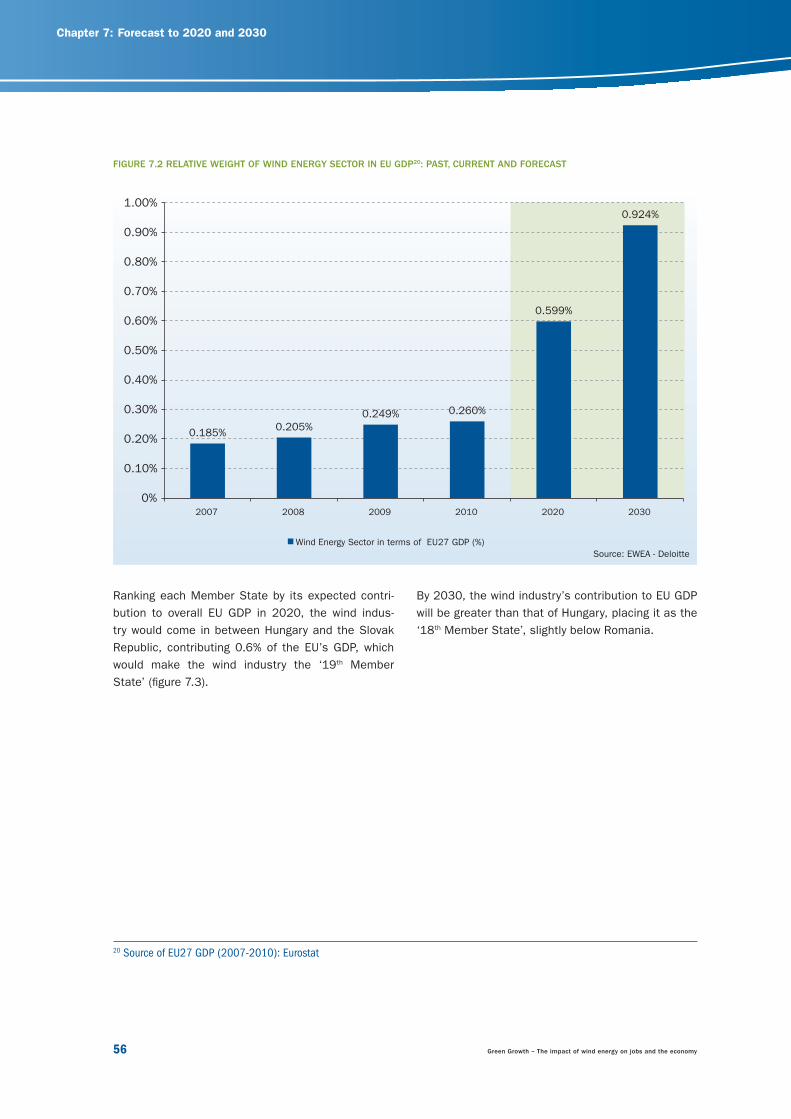
Chapter 7: Forecast to 2020 and 2030
56 Green Growth – The impact of wind energy on jobs and the economy
0.185% 0.205%
0.249% 0.260%
0.599%
0.924%
0%
0.10%
0.20%
0.30%
0.40%
0.50%
0.60%
0.70%
0.80%
0.90%
1.00%
2007 2008 2009 2010 2020 2030
Wind Energy Sector in terms of EU27 GDP (%)
Ranking each Member State by its expected contri-
bution to overall EU GDP in 2020, the wind indus-
try would come in between Hungary and the Slovak
Republic, contributing 0.6% of the EU’s GDP, which
would make the wind industry the ‘19th Member
State’ (fi gure 7.3).
FIGURE 7.2 RELATIVE WEIGHT OF WIND ENERGY SECTOR IN EU GDP20: PAST, CURRENT AND FORECAST
Source: EWEA - Deloitte
By 2030, the wind industry’s contribution to EU GDP
will be greater than that of Hungary, placing it as the
‘18th Member State’, slightly below Romania.
20 Source of EU27 GDP (2007-2010): Eurostat
23799_EWEA_2012.indd 5623799_EWEA_2012.indd 56 28/03/12 17:2628/03/12 17:26
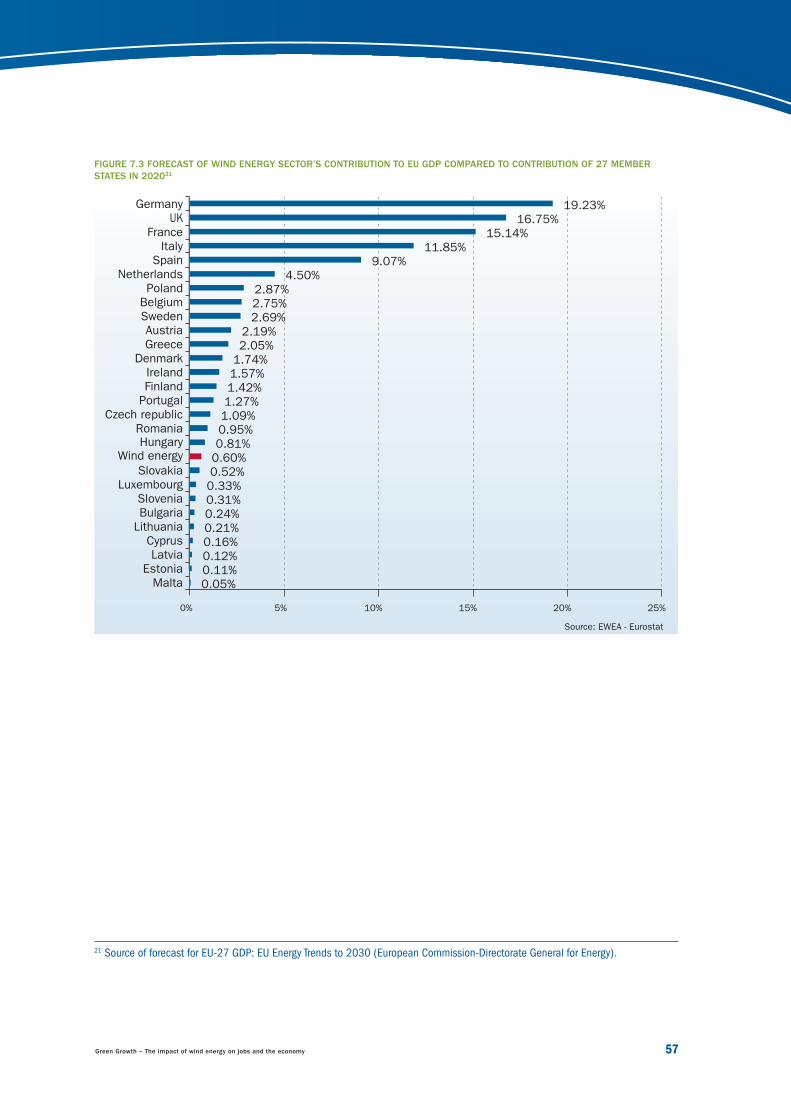
Green Growth – The impact of wind energy on jobs and the economy 57
FIGURE 7.3 FORECAST OF WIND ENERGY SECTOR’S CONTRIBUTION TO EU GDP COMPARED TO CONTRIBUTION OF 27 MEMBER
STATES IN 202021
MaltaEstonia
LatviaCyprus
LithuaniaBulgariaSlovenia
LuxembourgSlovakia
HungaryWind energy
RomaniaCzech republic
PortugalFinlandIreland
DenmarkGreeceAustria
SwedenBelgiumPoland
NetherlandsSpain
ItalyFrance
UKGermany
0.05%0.11%0.12%0.16%0.21%0.24%0.31%0.33%0.52%0.60%0.81%0.95%1.09%1.27%1.42%1.57%1.74%2.05%2.19%
2.69%2.75%2.87%
4.50%9.07%
11.85%15.14%
16.75%19.23%
0% 5% 10% 15% 20% 25%
21 Source of forecast for EU-27 GDP: EU Energy Trends to 2030 (European Commission-Directorate General for Energy).
Source: EWEA - Eurostat
23799_EWEA_2012.indd 5723799_EWEA_2012.indd 57 28/03/12 17:2628/03/12 17:26
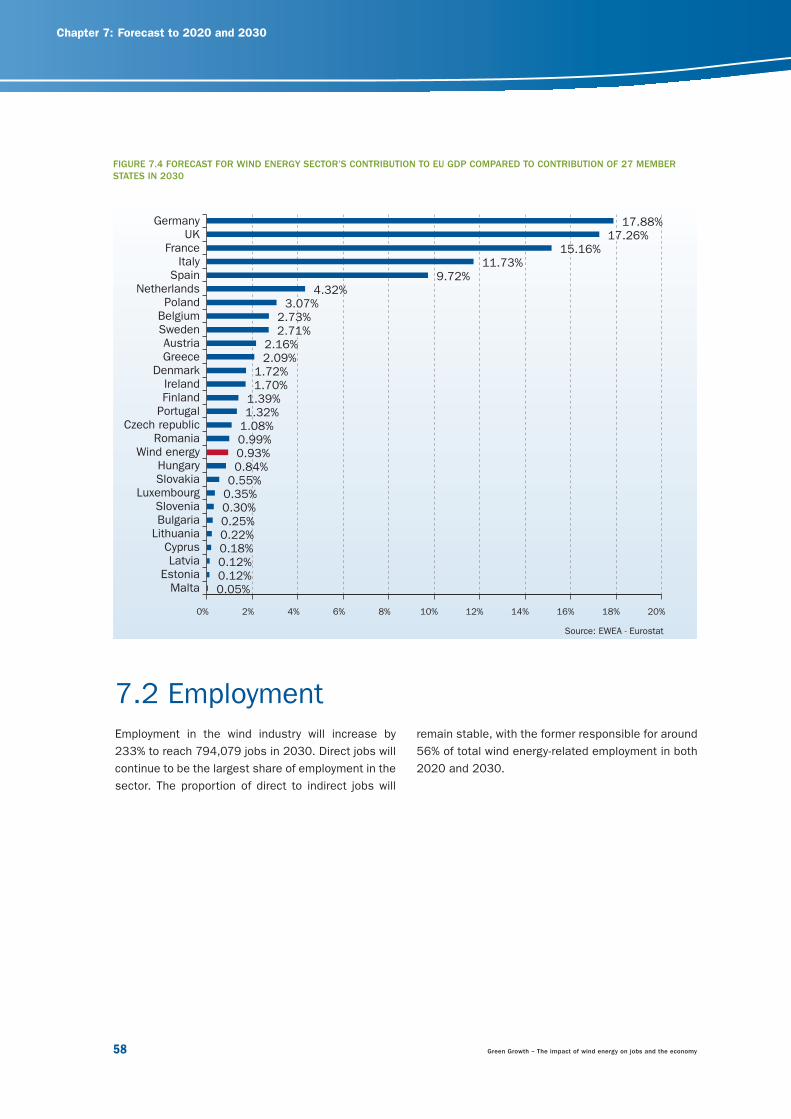
Chapter 7: Forecast to 2020 and 2030
58 Green Growth – The impact of wind energy on jobs and the economy
FIGURE 7.4 FORECAST FOR WIND ENERGY SECTOR’S CONTRIBUTION TO EU GDP COMPARED TO CONTRIBUTION OF 27 MEMBER
STATES IN 2030
7.2 EmploymentEmployment in the wind industry will increase by
233% to reach 794,079 jobs in 2030. Direct jobs will
continue to be the largest share of employment in the
sector. The proportion of direct to indirect jobs will
MaltaEstonia
LatviaCyprus
LithuaniaBulgariaSlovenia
LuxembourgSlovakiaHungary
Wind energyRomania
Czech republicPortugalFinlandIreland
DenmarkGreeceAustria
SwedenBelgiumPoland
NetherlandsSpain
ItalyFrance
UKGermany
0.05%0.12%0.12%0.18%0.22%0.25%0.30%0.35%0.55%0.84%0.93%0.99%1.08%1.32%1.39%1.70%1.72%
2.09%2.16%
2.71%2.73%
3.07%4.32%
9.72%11.73%
15.16%17.26%
17.88%
0% 2% 4% 6% 8% 10% 12% 14% 16% 18% 20%
Source: EWEA - Eurostat
remain stable, with the former responsible for around
56% of total wind energy-related employment in both
2020 and 2030.
23799_EWEA_2012.indd 5823799_EWEA_2012.indd 58 28/03/12 17:2628/03/12 17:26
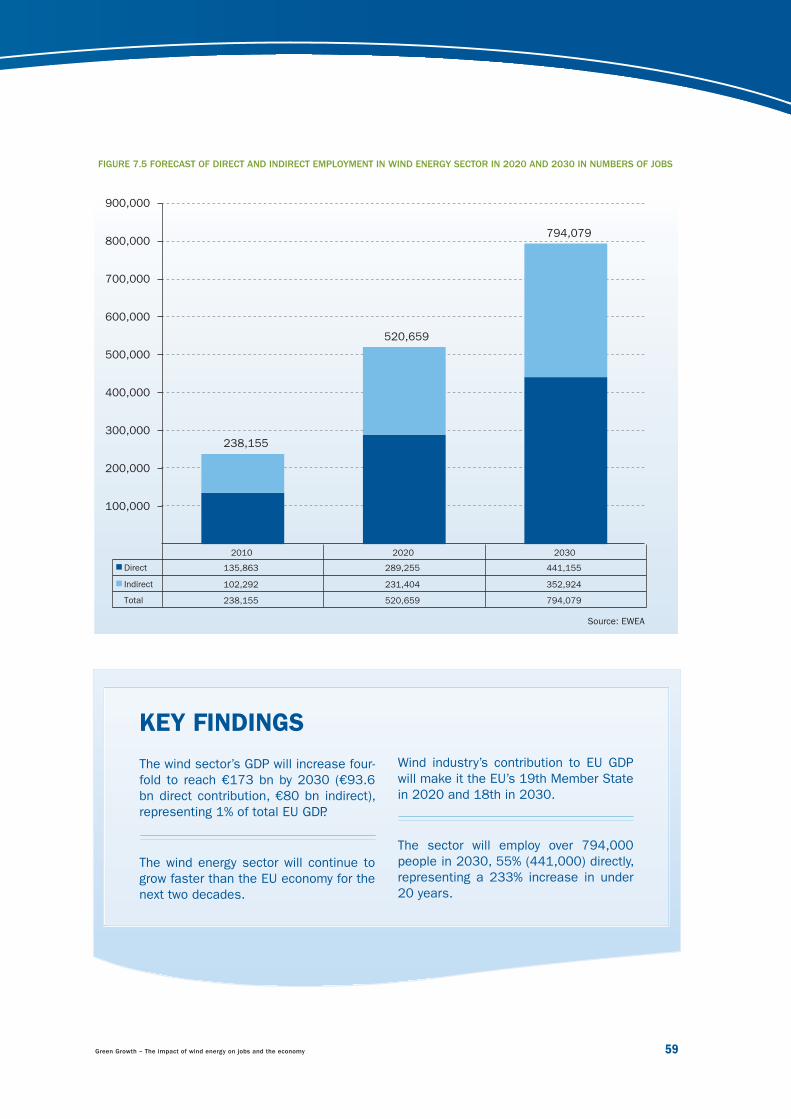
Green Growth – The impact of wind energy on jobs and the economy 59
FIGURE 7.5 FORECAST OF DIRECT AND INDIRECT EMPLOYMENT IN WIND ENERGY SECTOR IN 2020 AND 2030 IN NUMBERS OF JOBS
2010 2020 2030
Indirect 102,292 231,404 352,924
Direct 135,863 289,255 441,155
Total 238,155
238,155
520,659
520,659
794,079
794,079
100,000
200,000
300,000
400,000
500,000
600,000
700,000
800,000
900,000
Source: EWEA
The wind sector’s GDP will increase four-
fold to reach €173 bn by 2030 (€93.6
bn direct contribution, €80 bn indirect),
representing 1% of total EU GDP.
The wind energy sector will continue to
grow faster than the EU economy for the
next two decades.
KEY FINDINGS
Wind industry’s contribution to EU GDP
will make it the EU’s 19th Member State
in 2020 and 18th in 2030.
The sector will employ over 794,000
people in 2030, 55% (441,000) directly,
representing a 233% increase in under
20 years.
23799_EWEA_2012.indd 5923799_EWEA_2012.indd 59 28/03/12 17:2628/03/12 17:26
Chapter 8: EU wind energy sector – the global leader
60 Green Growth – The impact of wind energy on jobs and the economy
EU WIND ENERGY SECTOR – THE GLOBAL LEADER88.1 Activity of European energy players in non-EU countries
Photo
: LM
Gla
sfi b
er
23799_EWEA_2012.indd 6023799_EWEA_2012.indd 60 28/03/12 17:2628/03/12 17:26
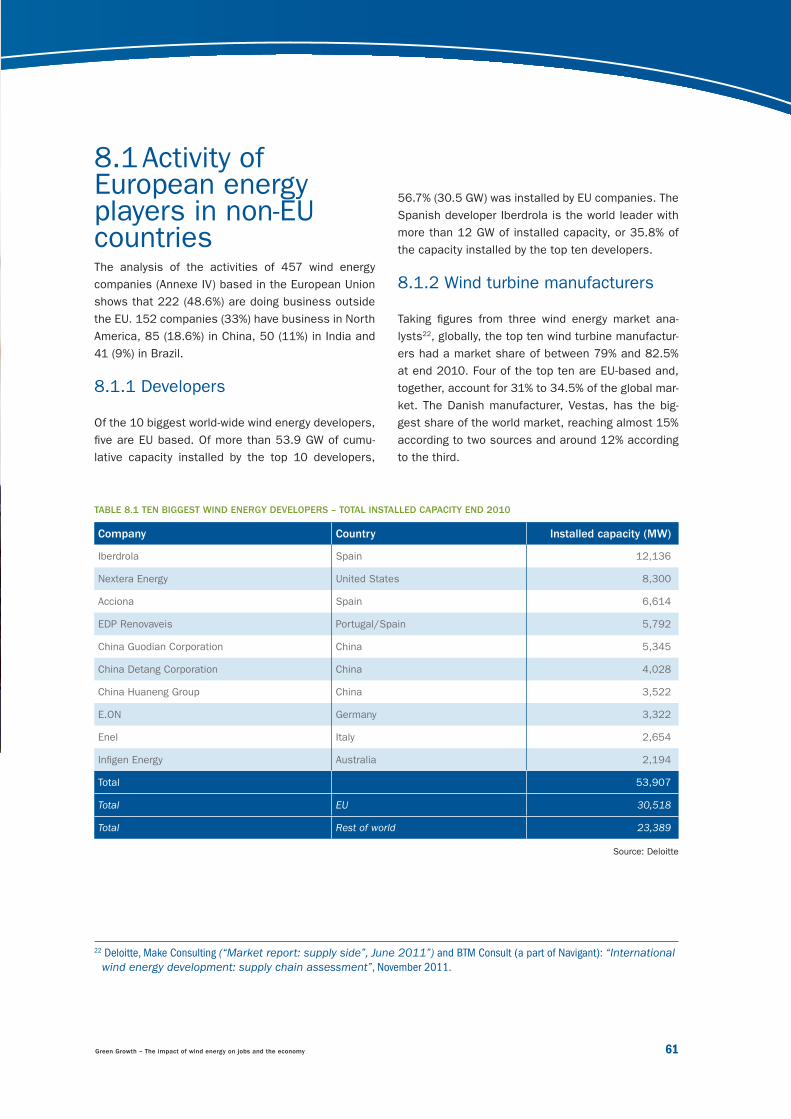
Green Growth – The impact of wind energy on jobs and the economy 61
8.1 Activity of European energy players in non-EU countriesThe analysis of the activities of 457 wind energy
companies (Annexe IV) based in the European Union
shows that 222 (48.6%) are doing business outside
the EU. 152 companies (33%) have business in North
America, 85 (18.6%) in China, 50 (11%) in India and
41 (9%) in Brazil.
8.1.1 Developers
Of the 10 biggest world-wide wind energy developers,
fi ve are EU based. Of more than 53.9 GW of cumu-
lative capacity installed by the top 10 developers,
56.7% (30.5 GW) was installed by EU companies. The
Spanish developer Iberdrola is the world leader with
more than 12 GW of installed capacity, or 35.8% of
the capacity installed by the top ten developers.
8.1.2 Wind turbine manufacturers
Taking fi gures from three wind energy market ana-
lysts22, globally, the top ten wind turbine manufactur-
ers had a market share of between 79% and 82.5%
at end 2010. Four of the top ten are EU-based and,
together, account for 31% to 34.5% of the global mar-
ket. The Danish manufacturer, Vestas, has the big-
gest share of the world market, reaching almost 15%
according to two sources and around 12% according
to the third.
TABLE 8.1 TEN BIGGEST WIND ENERGY DEVELOPERS – TOTAL INSTALLED CAPACITY END 2010
Company Country Installed capacity (MW)
Iberdrola Spain 12,136
Nextera Energy United States 8,300
Acciona Spain 6,614
EDP Renovaveis Portugal/Spain 5,792
China Guodian Corporation China 5,345
China Detang Corporation China 4,028
China Huaneng Group China 3,522
E.ON Germany 3,322
Enel Italy 2,654
Infi gen Energy Australia 2,194
Total 53,907
Total EU 30,518
Total Rest of world 23,389
Source: Deloitte
22 Deloitte, Make Consulting (“Market report: supply side”, June 2011”) and BTM Consult (a part of Navigant): “International
wind energy development: supply chain assessment”, November 2011.
23799_EWEA_2012.indd 6123799_EWEA_2012.indd 61 28/03/12 17:2628/03/12 17:26
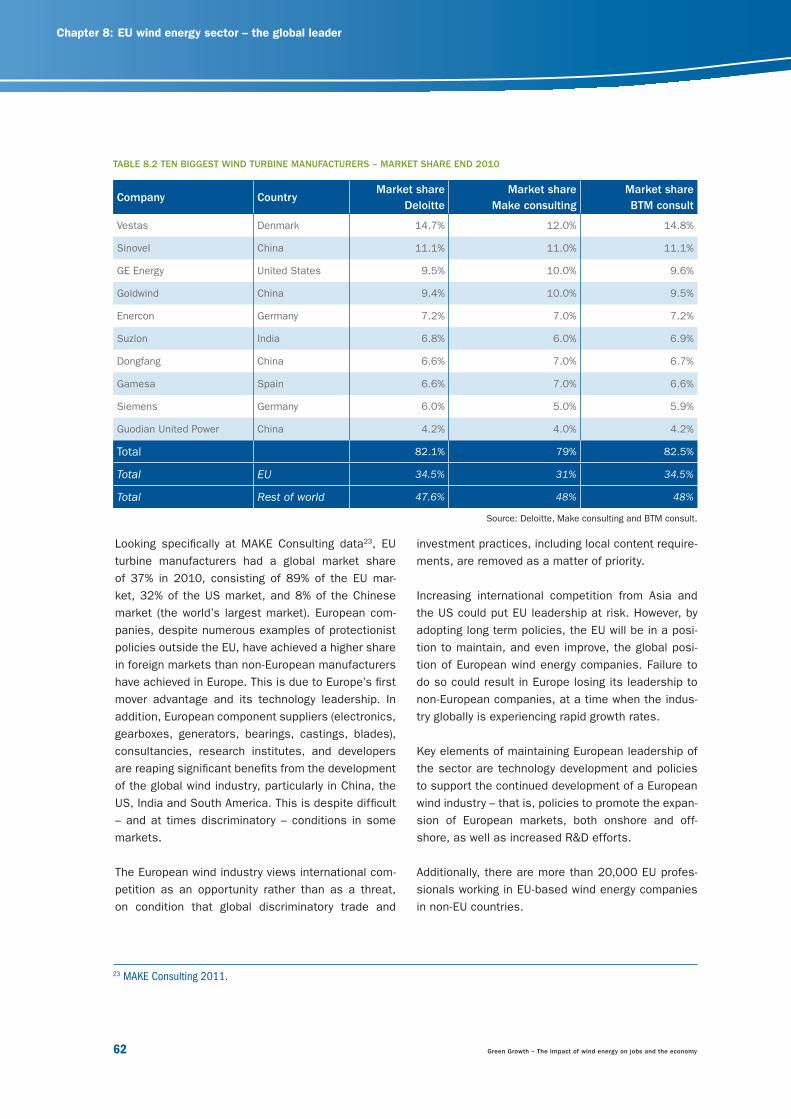
Chapter 8: EU wind energy sector – the global leader
62 Green Growth – The impact of wind energy on jobs and the economy
Looking specifi cally at MAKE Consulting data23, EU
turbine manufacturers had a global market share
of 37% in 2010, consisting of 89% of the EU mar-
ket, 32% of the US market, and 8% of the Chinese
market (the world’s largest market). European com-
panies, despite numerous examples of protectionist
policies outside the EU, have achieved a higher share
in foreign markets than non-European manufacturers
have achieved in Europe. This is due to Europe’s fi rst
mover advantage and its technology leadership. In
addition, European component suppliers (electronics,
gearboxes, generators, bearings, castings, blades),
consultancies, research institutes, and developers
are reaping signifi cant benefi ts from the development
of the global wind industry, particularly in China, the
US, India and South America. This is despite diffi cult
– and at times discriminatory – conditions in some
markets.
The European wind industry views international com-
petition as an opportunity rather than as a threat,
on condition that global discriminatory trade and
TABLE 8.2 TEN BIGGEST WIND TURBINE MANUFACTURERS – MARKET SHARE END 2010
Company CountryMarket share
Deloitte
Market share
Make consulting
Market share
BTM consult
Vestas Denmark 14.7% 12.0% 14.8%
Sinovel China 11.1% 11.0% 11.1%
GE Energy United States 9.5% 10.0% 9.6%
Goldwind China 9.4% 10.0% 9.5%
Enercon Germany 7.2% 7.0% 7.2%
Suzlon India 6.8% 6.0% 6.9%
Dongfang China 6.6% 7.0% 6.7%
Gamesa Spain 6.6% 7.0% 6.6%
Siemens Germany 6.0% 5.0% 5.9%
Guodian United Power China 4.2% 4.0% 4.2%
Total 82.1% 79% 82.5%
Total EU 34.5% 31% 34.5%
Total Rest of world 47.6% 48% 48%
Source: Deloitte, Make consulting and BTM consult.
investment practices, including local content require-
ments, are removed as a matter of priority.
Increasing international competition from Asia and
the US could put EU leadership at risk. However, by
adopting long term policies, the EU will be in a posi-
tion to maintain, and even improve, the global posi-
tion of European wind energy companies. Failure to
do so could result in Europe losing its leadership to
non-European companies, at a time when the indus-
try globally is experiencing rapid growth rates.
Key elements of maintaining European leadership of
the sector are technology development and policies
to support the continued development of a European
wind industry – that is, policies to promote the expan-
sion of European markets, both onshore and off-
shore, as well as increased R&D efforts.
Additionally, there are more than 20,000 EU profes-
sionals working in EU-based wind energy companies
in non-EU countries.
23 MAKE Consulting 2011.
23799_EWEA_2012.indd 6223799_EWEA_2012.indd 62 28/03/12 17:2628/03/12 17:26
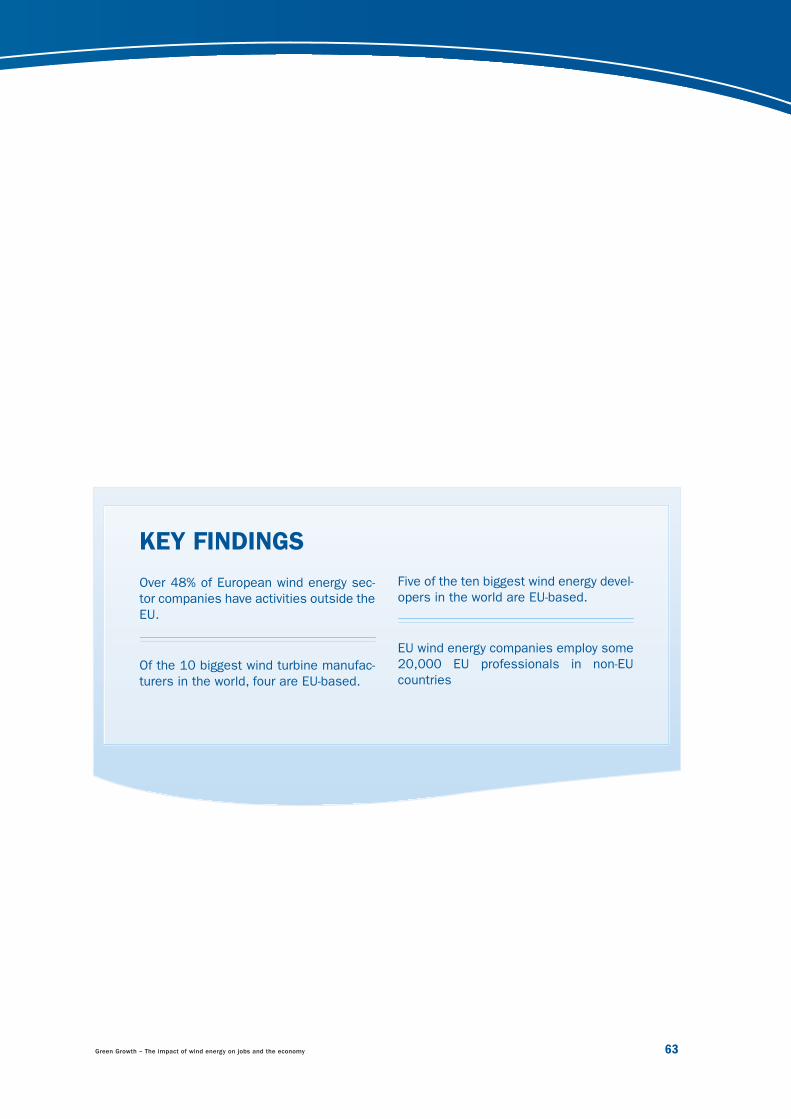
Green Growth – The impact of wind energy on jobs and the economy 63
Over 48% of European wind energy sec-
tor companies have activities outside the
EU.
Of the 10 biggest wind turbine manufac-
turers in the world, four are EU-based.
KEY FINDINGS
Five of the ten biggest wind energy devel-
opers in the world are EU-based.
EU wind energy companies employ some
20,000 EU professionals in non-EU
countries
23799_EWEA_2012.indd 6323799_EWEA_2012.indd 63 28/03/12 17:2628/03/12 17:26
Chapter 8: Annexes
64 Green Growth – The impact of wind energy on jobs and the economy
Annexe I. Methodology
Annexe II. Calculating the wind energy sector’s direct contribution to GDP
Annexe III. Calculating the wind energy sector’s indirect contribution to GDP
Annexe IV. Activity of European energy players in third countries
Annexe V. Contribution to GDP and employment by MW/MWh
Annexe VI. Assumptions for wind energy sector’s economic impact in 2020 and 2030
ANNEXES
Photo
: Vatte
nfa
ll - Ben B
ard
en
23799_EWEA_2012.indd 6423799_EWEA_2012.indd 64 28/03/12 17:2628/03/12 17:26
Green Growth – The impact of wind energy on jobs and the economy 65
Annexe I. Methodology
I.i Direct contribution to GDP
To calculate the wind energy sector’s contribution to
EU GDP, three equivalent approaches – recognised
by the European System of National and Regional
Accounts (ESNRA)24 were used: expenditure, added
value and income.
The wind energy sector is made up of companies
that carry out a wide range of different activities inte-
grated in the value chain of the industry. Therefore,
the sector was divided into four sub-sectors:
• wind farm developers and wind energy developers
• wind turbine manufacturers
• component manufacturers
• providers of specifi c services for the wind energy
sector
350 EU companies active in wind energy were identi-
fi ed and their fi nancial statements analysed for the
period between 2007 and 2010.
The value added and income approaches were used
to estimate the sector’s contribution to GDP, using
the information companies disclose in their fi nancial
statements. Additional information, such as tax bal-
ance and R&D expenditure, was gathered by survey-
ing wind industry players. Combining these two data
sets, it was possible to calculate the total direct
impact on GDP.
I.ii Indirect contribution to GDP
The different sub-sectors of the wind energy industry
purchase from, and provide services to, other sectors
of the economy. This has an indirect impact on GDP.
This impact is quantifi ed using input-output models
from the EU25. However, these tables do not consider
the wind energy sector as a separate industry. It was,
therefore, necessary to add the information of this
sector to the evaluation scheme. To do this the infor-
mation was completed with sectoral data collected
directly from relevant industry players.
Based on this input-output table, income multipliers
containing information on the wind energy sector’s
impact on the rest of the economy were calculated.
For full details of the methodology, please refer to
Annexe II.
24 Defi nitions as given by Eurostat: http://epp.eurostat.ec.europa.eu/statistics_explained/index.php/National_
accounts_%E2%80%93_GDP 25 An input-output model is a quantitative economic technique that captures the correlations between different branches of an
economy or among branches of different and even competing economies.
23799_EWEA_2012.indd 6523799_EWEA_2012.indd 65 28/03/12 17:2628/03/12 17:26
Chapter 8: Annexes
66 Green Growth – The impact of wind energy on jobs and the economy
Annexes
intermediate consumption at purchasers' prices.
Taxes minus subsidies on products have to be add-
ed to value added to obtain GDP at market prices.
3. Income approach: includes salaries and other mon-
ey spent on employees, net taxes on production
and imports, gross operating surplus and mixed in-
come. The income approach shows how GDP is dis-
tributed between different participants in the pro-
duction process, as the total of:
• compensation of employees: the total remuneration,
in cash or in kind, payable by an employer to an
employee in return for work done by the latter dur-
ing the accounting period; the compensation of em-
ployees is broken down into: wages (in cash and in
kind); employers' social contributions (actual social
contributions and imputed social contributions)
• gross operating surplus: the surplus (or defi cit) on
production activities before account has been taken
of the interest, rents or charges paid or received for
the use of assets
• mixed income: this is the remuneration for the work
carried out by the owner (or by members of his/her
family) of an “unincorporated” company28; this is re-
ferred to as “mixed income” since it cannot be distin-
guished from the entrepreneurial profi t of the owner
• Taxes on production and imports minus subsidies:
these consist of compulsory (in the case of taxes)
payments to or from general government or institu-
tions of the EU on production or import of goods and
services, the employment of labour, and the owner-
ship or use of land, buildings or other assets used
in production.
The wind energy sector is made up of companies
that carry out a wide range of different activities inte-
grated in the value chain of the industry.
Three equivalent approaches, recognised by the
European System of National and Regional Accounts
(ESNRA)26, can be used to calculate an economic sec-
tor’s contribution to GDP:
1. Expenditure approach: GDP is defi ned as what in-
dividuals spend on fi nal consumption, plus what
the government spends on fi nal consumption, plus
gross capital formation, plus exports and minus
imports. In the system of national accounts, only
households, non-profi t institutions serving house-
holds (NPISH)27 and governments have fi nal con-
sumption, whereas corporations have intermediate
consumption. Private fi nal consumption expendi-
ture is defi ned as expenditure on goods and serv-
ices for the direct satisfaction of individual needs,
whereas government consumption expenditure in-
cludes goods and services produced by the govern-
ment, as well as the purchase of goods and serv-
ices by the government to supply households as
social transfers in kind. Gross capital formation is
the sum of gross fi xed capital formation and the
change in inventories (stocks). The external bal-
ance is the difference between exports and imports
of goods and services. Depending on the size of ex-
ports and imports, it can be positive (a surplus) or
negative (a defi cit).
2. Value added approach: the gross value added of
various sectors, plus taxes, minus subsidies on
products. The output of the economy is measured
using gross value added. Gross value added is de-
fi ned as the value of all newly generated goods and
services minus the value of all goods and servic-
es consumed in their creation; the depreciation
of fi xed assets is not included. When calculating
value added, output is valued at basic prices and
26 Defi nitions as given by Eurostat: http://epp.eurostat.ec.europa.eu/statistics_explained/index.php/National_
accounts_%E2%80%93_GDP27 Eurostat defi nition: non-profi t institutions are not mainly fi nanced or controlled by governments and they provide goods or services
to households for free or at prices that are not economically signifi cant. Examples include churches and religious societies, sports
and other clubs, trade unions and political parties.28 These are companies for which it is not possible to separate profi ts and salaries.
Annexe II. Calculating the wind energy sector’s direct contribution to GDP
23799_EWEA_2012.indd 6623799_EWEA_2012.indd 66 28/03/12 17:2628/03/12 17:26
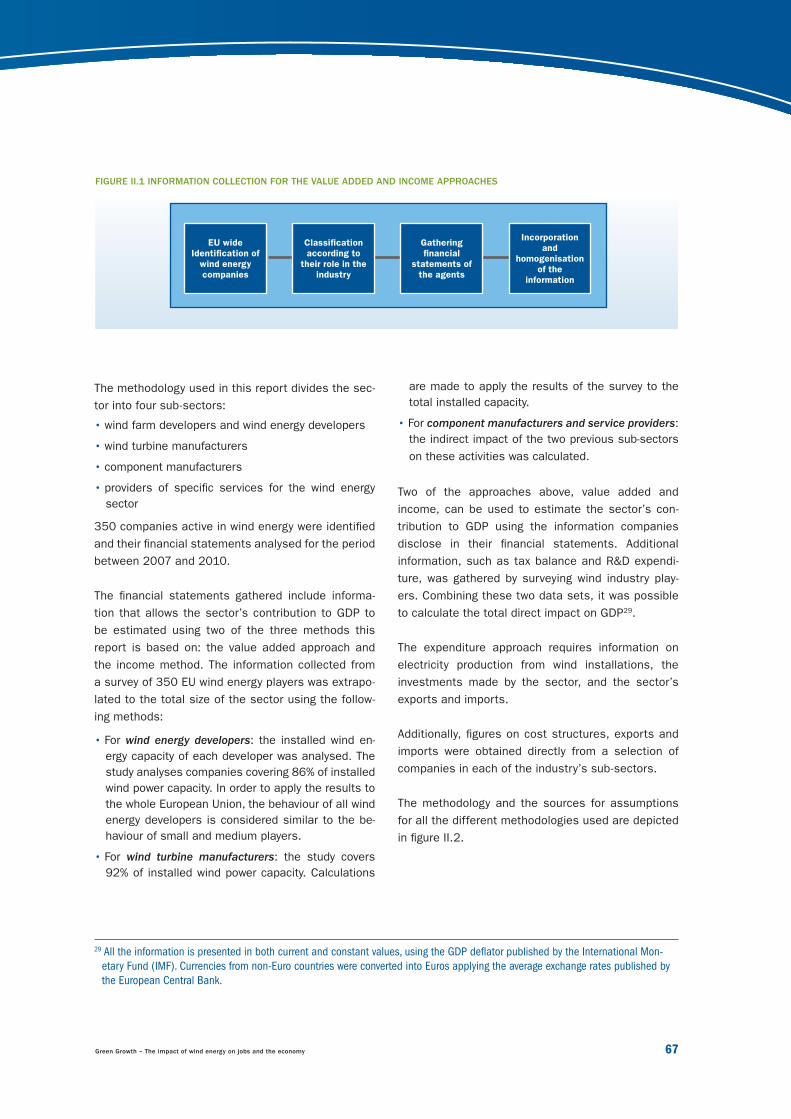
Green Growth – The impact of wind energy on jobs and the economy 67
are made to apply the results of the survey to the
total installed capacity.
• For component manufacturers and service providers:
the indirect impact of the two previous sub-sectors
on these activities was calculated.
Two of the approaches above, value added and
income, can be used to estimate the sector’s con-
tribution to GDP using the information companies
disclose in their fi nancial statements. Additional
information, such as tax balance and R&D expendi-
ture, was gathered by surveying wind industry play-
ers. Combining these two data sets, it was possible
to calculate the total direct impact on GDP29.
The expenditure approach requires information on
electricity production from wind installations, the
investments made by the sector, and the sector’s
exports and imports.
Additionally, fi gures on cost structures, exports and
imports were obtained directly from a selection of
companies in each of the industry’s sub-sectors.
The methodology and the sources for assumptions
for all the different methodologies used are depicted
in fi gure II.2.
FIGURE II.1 INFORMATION COLLECTION FOR THE VALUE ADDED AND INCOME APPROACHES
The methodology used in this report divides the sec-
tor into four sub-sectors:
• wind farm developers and wind energy developers
• wind turbine manufacturers
• component manufacturers
• providers of specifi c services for the wind energy
sector
350 companies active in wind energy were identifi ed
and their fi nancial statements analysed for the period
between 2007 and 2010.
The fi nancial statements gathered include informa-
tion that allows the sector’s contribution to GDP to
be estimated using two of the three methods this
report is based on: the value added approach and
the income method. The information collected from
a survey of 350 EU wind energy players was extrapo-
lated to the total size of the sector using the follow-
ing methods:
• For wind energy developers: the installed wind en-
ergy capacity of each developer was analysed. The
study analyses companies covering 86% of installed
wind power capacity. In order to apply the results to
the whole European Union, the behaviour of all wind
energy developers is considered similar to the be-
haviour of small and medium players.
• For wind turbine manufacturers: the study covers
92% of installed wind power capacity. Calculations
29 All the information is presented in both current and constant values, using the GDP defl ator published by the International Mon-
etary Fund (IMF). Currencies from non-Euro countries were converted into Euros applying the average exchange rates published by
the European Central Bank.
EU wideIdentifi cation of
wind energycompanies
Classifi cationaccording to
their role in theindustry
Gatheringfi nancial
statements ofthe agents
Incorporationand
homogenisationof the
information
23799_EWEA_2012.indd 6723799_EWEA_2012.indd 67 28/03/12 17:2628/03/12 17:26
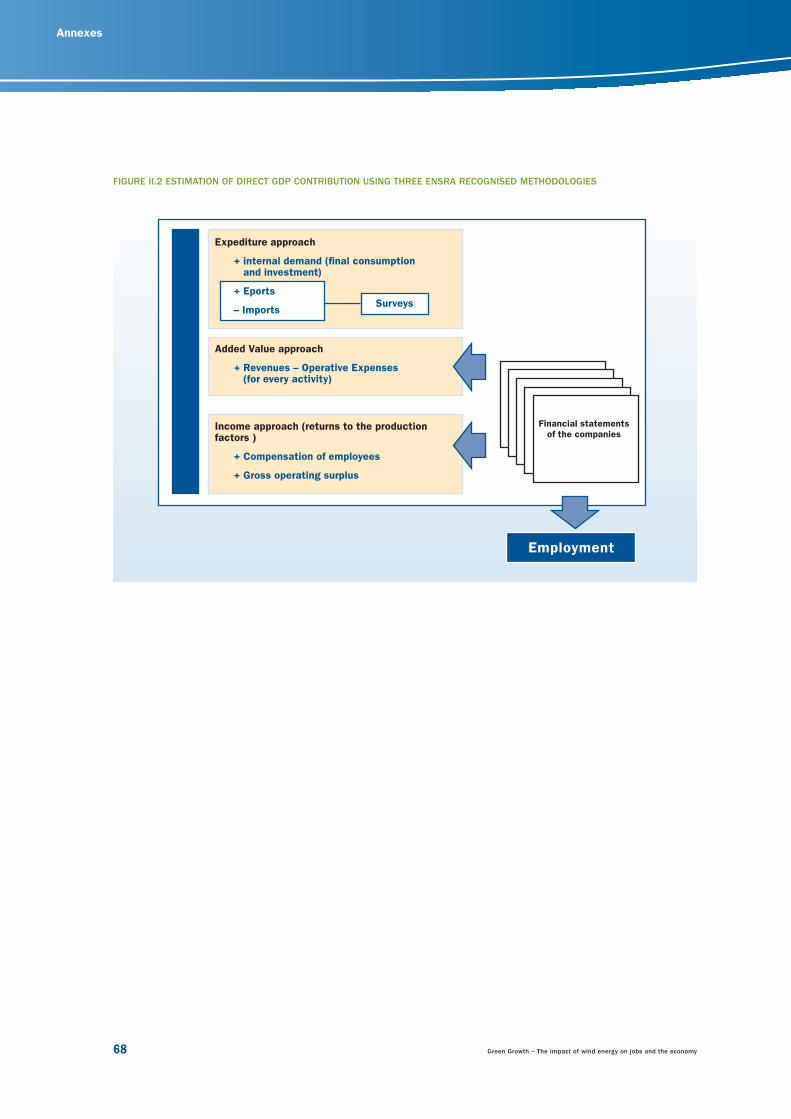
Chapter 8: Annexes
68 Green Growth – The impact of wind energy on jobs and the economy
Annexes
FIGURE II.2 ESTIMATION OF DIRECT GDP CONTRIBUTION USING THREE ENSRA RECOGNISED METHODOLOGIES
Added Value approach
+ Revenues – Operative Expenses(for every activity)
Income approach (returns to the production factors )
+ Compensation of employees
+ Gross operating surplus
Employment
Expediture approach
+ internal demand (fi nal consumption and investment)
+ Eports
– Imports Surveys
Financial statementsof the companies
23799_EWEA_2012.indd 6823799_EWEA_2012.indd 68 28/03/12 17:2628/03/12 17:26
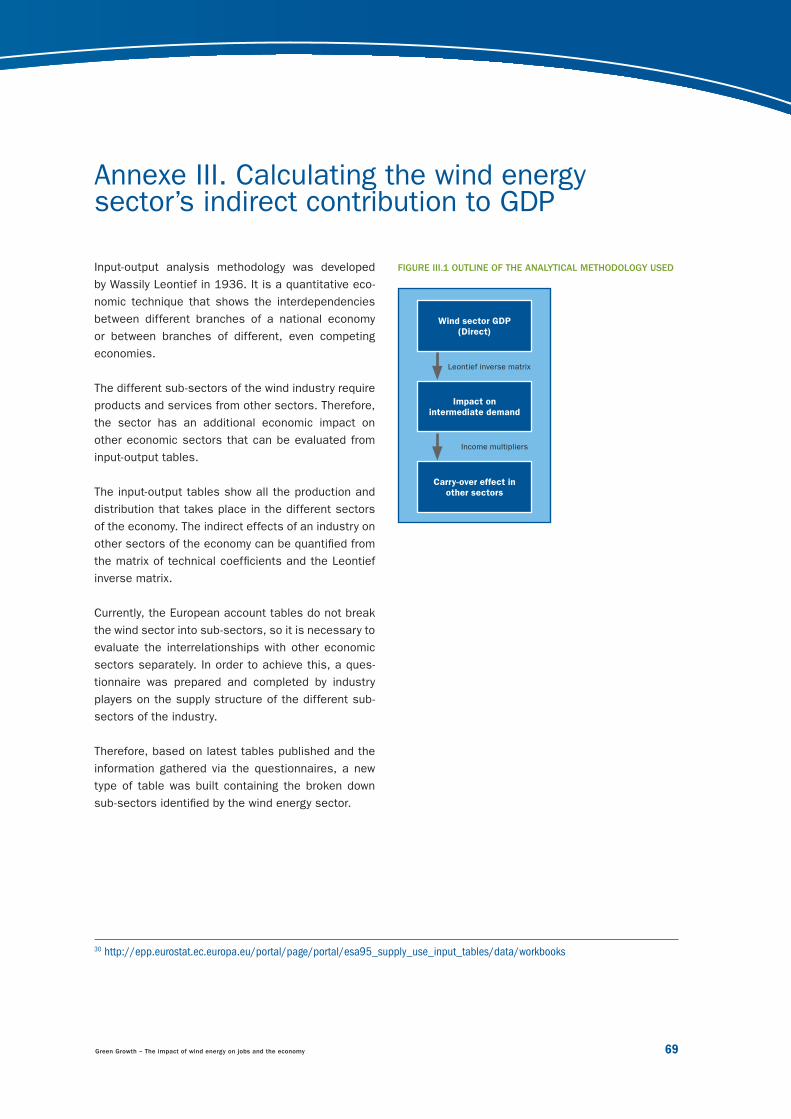
Green Growth – The impact of wind energy on jobs and the economy 69
Input-output analysis methodology was developed
by Wassily Leontief in 1936. It is a quantitative eco-
nomic technique that shows the interdependencies
between different branches of a national economy
or between branches of different, even competing
economies.
The different sub-sectors of the wind industry require
products and services from other sectors. Therefore,
the sector has an additional economic impact on
other economic sectors that can be evaluated from
input-output tables.
The input-output tables show all the production and
distribution that takes place in the different sectors
of the economy. The indirect effects of an industry on
other sectors of the economy can be quantifi ed from
the matrix of technical coeffi cients and the Leontief
inverse matrix.
Currently, the European account tables do not break
the wind sector into sub-sectors, so it is necessary to
evaluate the interrelationships with other economic
sectors separately. In order to achieve this, a ques-
tionnaire was prepared and completed by industry
players on the supply structure of the different sub-
sectors of the industry.
Therefore, based on latest tables published and the
information gathered via the questionnaires, a new
type of table was built containing the broken down
sub-sectors identifi ed by the wind energy sector.
Annexe III. Calculating the wind energy sector’s indirect contribution to GDP
FIGURE III.1 OUTLINE OF THE ANALYTICAL METHODOLOGY USED
30 http://epp.eurostat.ec.europa.eu/portal/page/portal/esa95_supply_use_input_tables/data/workbooks
Wind sector GDP(Direct)
Impact onintermediate demand
Carry-over effect inother sectors
Leontief inverse matrix
Income multipliers
23799_EWEA_2012.indd 6923799_EWEA_2012.indd 69 28/03/12 17:2628/03/12 17:26
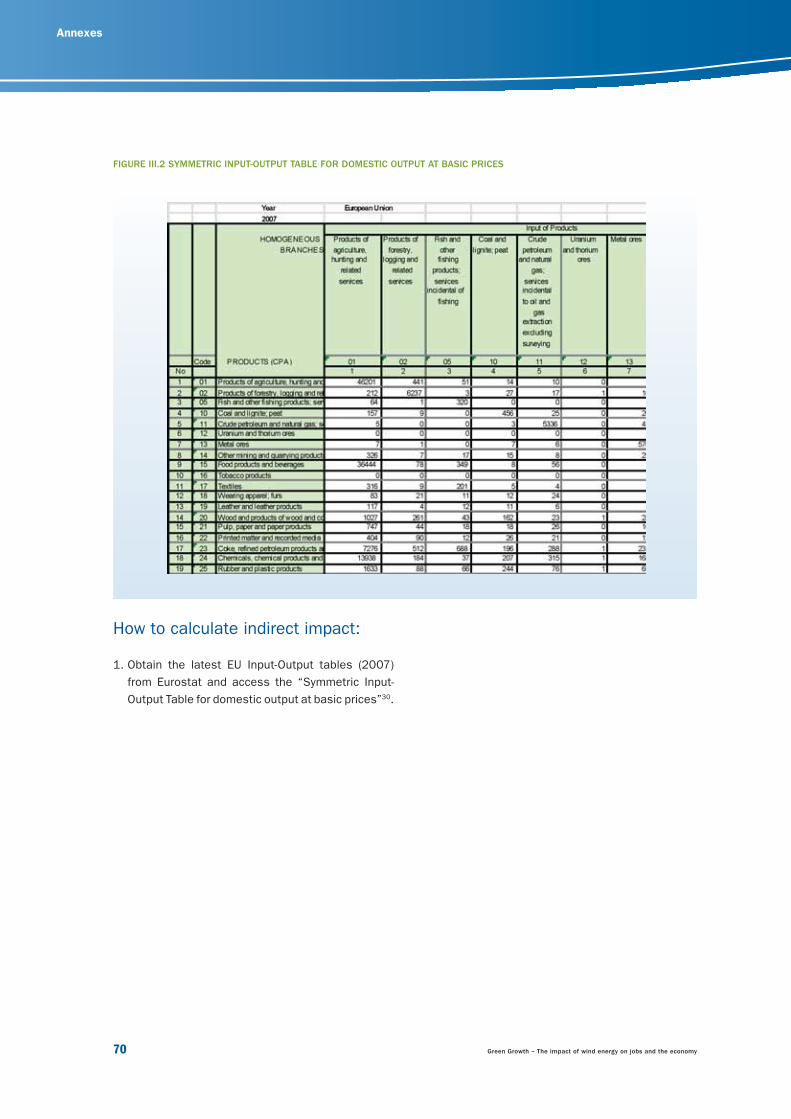
Chapter 8: Annexes
70 Green Growth – The impact of wind energy on jobs and the economy
Annexes
FIGURE III.2 SYMMETRIC INPUT-OUTPUT TABLE FOR DOMESTIC OUTPUT AT BASIC PRICES
How to calculate indirect impact:
1. Obtain the latest EU Input-Output tables (2007)
from Eurostat and access the “Symmetric Input-
Output Table for domestic output at basic prices”30.
23799_EWEA_2012.indd 7023799_EWEA_2012.indd 70 28/03/12 17:2628/03/12 17:26
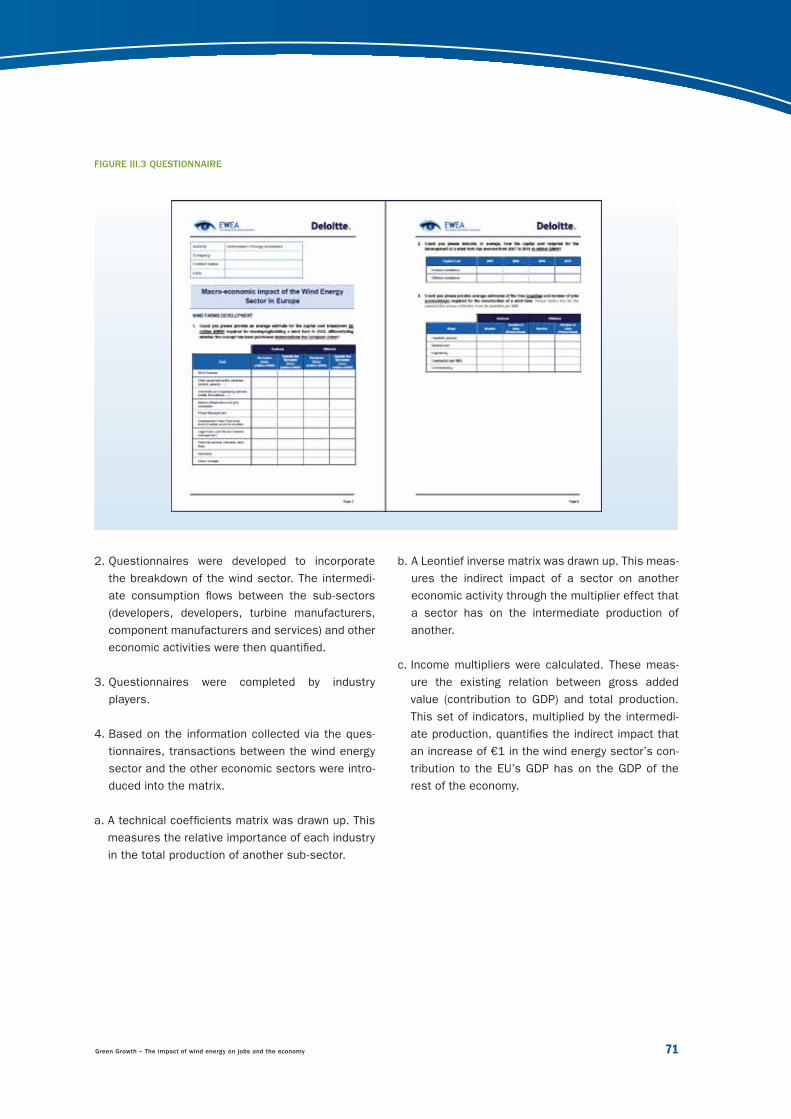
Green Growth – The impact of wind energy on jobs and the economy 71
2. Questionnaires were developed to incorporate
the breakdown of the wind sector. The intermedi-
ate consumption fl ows between the sub-sectors
(developers, developers, turbine manufacturers,
component manufacturers and services) and other
economic activities were then quantifi ed.
3. Questionnaires were completed by industry
players.
4. Based on the information collected via the ques-
tionnaires, transactions between the wind energy
sector and the other economic sectors were intro-
duced into the matrix.
a. A technical coeffi cients matrix was drawn up. This
measures the relative importance of each industry
in the total production of another sub-sector.
FIGURE III.3 QUESTIONNAIRE
b. A Leontief inverse matrix was drawn up. This meas-
ures the indirect impact of a sector on another
economic activity through the multiplier effect that
a sector has on the intermediate production of
another.
c. Income multipliers were calculated. These meas-
ure the existing relation between gross added
value (contribution to GDP) and total production.
This set of indicators, multiplied by the intermedi-
ate production, quantifi es the indirect impact that
an increase of €1 in the wind energy sector’s con-
tribution to the EU’s GDP has on the GDP of the
rest of the economy.
23799_EWEA_2012.indd 7123799_EWEA_2012.indd 71 28/03/12 17:2628/03/12 17:26
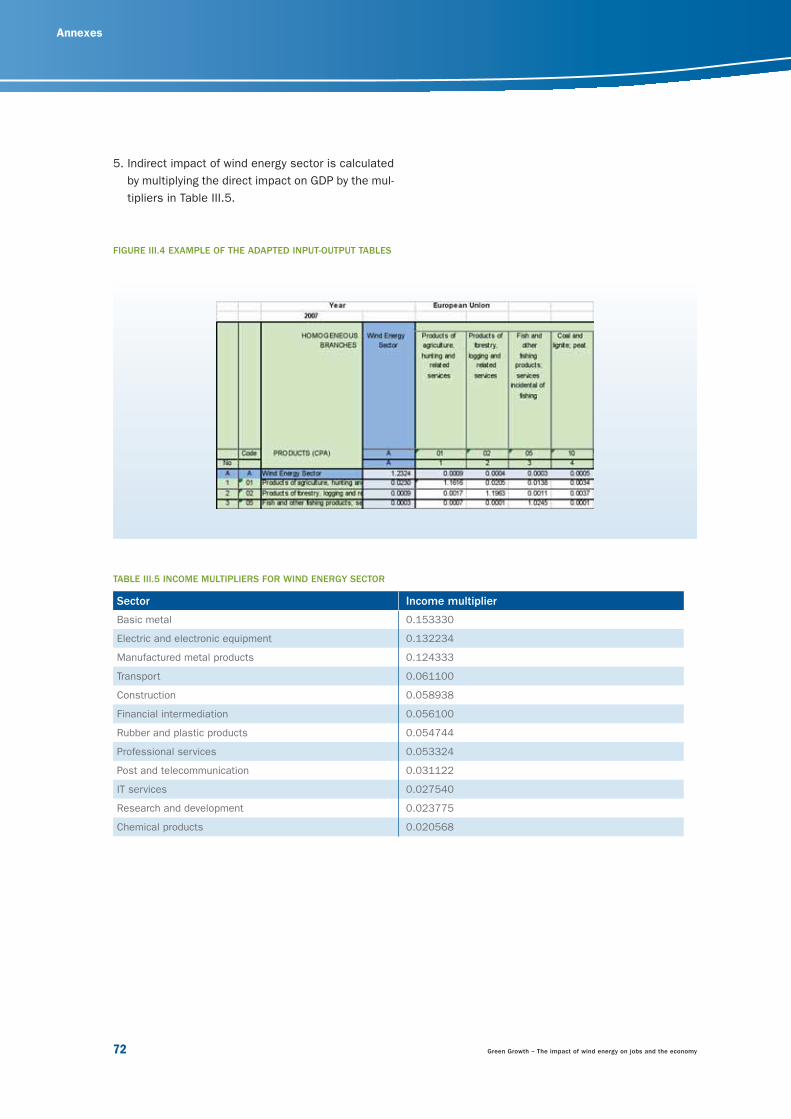
Chapter 8: Annexes
72 Green Growth – The impact of wind energy on jobs and the economy
Annexes
TABLE III.5 INCOME MULTIPLIERS FOR WIND ENERGY SECTOR
Sector Income multiplier
Basic metal 0.153330
Electric and electronic equipment 0.132234
Manufactured metal products 0.124333
Transport 0.061100
Construction 0.058938
Financial intermediation 0.056100
Rubber and plastic products 0.054744
Professional services 0.053324
Post and telecommunication 0.031122
IT services 0.027540
Research and development 0.023775
Chemical products 0.020568
5. Indirect impact of wind energy sector is calculated
by multiplying the direct impact on GDP by the mul-
tipliers in Table III.5.
FIGURE III.4 EXAMPLE OF THE ADAPTED INPUT-OUTPUT TABLES
23799_EWEA_2012.indd 7223799_EWEA_2012.indd 72 28/03/12 17:2628/03/12 17:26
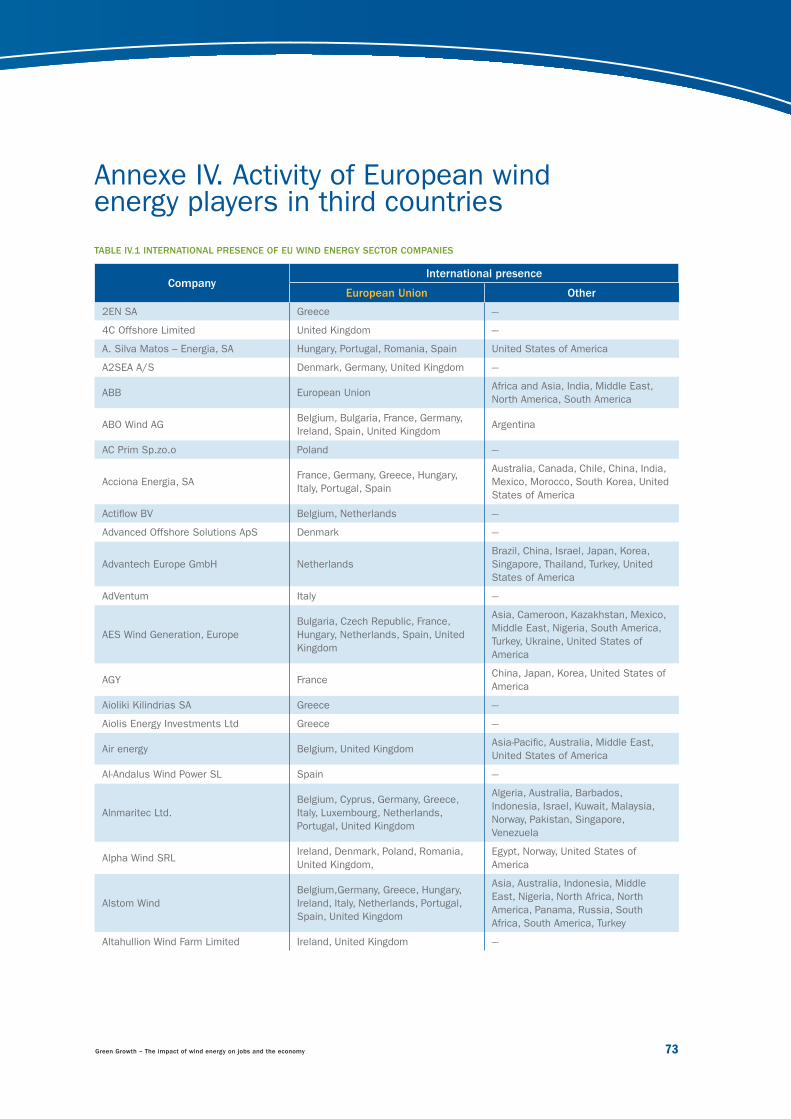
Green Growth – The impact of wind energy on jobs and the economy 73
Annexe IV. Activity of European wind energy players in third countries
TABLE IV.1 INTERNATIONAL PRESENCE OF EU WIND ENERGY SECTOR COMPANIES
CompanyInternational presence
European Union Other
2EN SA Greece ---
4C Offshore Limited United Kingdom ---
A. Silva Matos – Energia, SA Hungary, Portugal, Romania, Spain United States of America
A2SEA A/S Denmark, Germany, United Kingdom ---
ABB European UnionAfrica and Asia, India, Middle East,
North America, South America
ABO Wind AGBelgium, Bulgaria, France, Germany,
Ireland, Spain, United KingdomArgentina
AC Prim Sp.zo.o Poland ---
Acciona Energia, SAFrance, Germany, Greece, Hungary,
Italy, Portugal, Spain
Australia, Canada, Chile, China, India,
Mexico, Morocco, South Korea, United
States of America
Actifl ow BV Belgium, Netherlands ---
Advanced Offshore Solutions ApS Denmark ---
Advantech Europe GmbH Netherlands
Brazil, China, Israel, Japan, Korea,
Singapore, Thailand, Turkey, United
States of America
AdVentum Italy ---
AES Wind Generation, Europe
Bulgaria, Czech Republic, France,
Hungary, Netherlands, Spain, United
Kingdom
Asia, Cameroon, Kazakhstan, Mexico,
Middle East, Nigeria, South America,
Turkey, Ukraine, United States of
America
AGY FranceChina, Japan, Korea, United States of
America
Aioliki Kilindrias SA Greece ---
Aiolis Energy Investments Ltd Greece ---
Air energy Belgium, United KingdomAsia-Pacifi c, Australia, Middle East,
United States of America
Al-Andalus Wind Power SL Spain ---
Alnmaritec Ltd.
Belgium, Cyprus, Germany, Greece,
Italy, Luxembourg, Netherlands,
Portugal, United Kingdom
Algeria, Australia, Barbados,
Indonesia, Israel, Kuwait, Malaysia,
Norway, Pakistan, Singapore,
Venezuela
Alpha Wind SRLIreland, Denmark, Poland, Romania,
United Kingdom,
Egypt, Norway, United States of
America
Alstom Wind
Belgium,Germany, Greece, Hungary,
Ireland, Italy, Netherlands, Portugal,
Spain, United Kingdom
Asia, Australia, Indonesia, Middle
East, Nigeria, North Africa, North
America, Panama, Russia, South
Africa, South America, Turkey
Altahullion Wind Farm Limited Ireland, United Kingdom ---
23799_EWEA_2012.indd 7323799_EWEA_2012.indd 73 28/03/12 17:2628/03/12 17:26
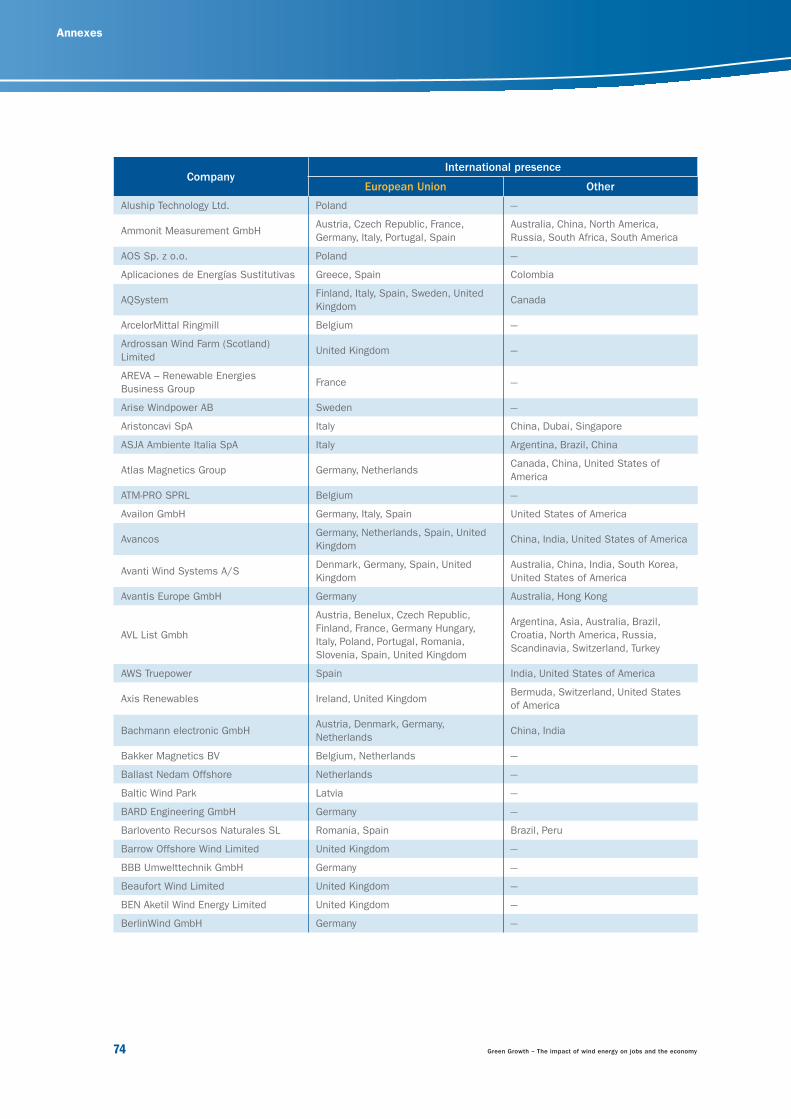
Chapter 8: Annexes
74 Green Growth – The impact of wind energy on jobs and the economy
Annexes
CompanyInternational presence
European Union Other
Aluship Technology Ltd. Poland ---
Ammonit Measurement GmbHAustria, Czech Republic, France,
Germany, Italy, Portugal, Spain
Australia, China, North America,
Russia, South Africa, South America
AOS Sp. z o.o. Poland ---
Aplicaciones de Energías Sustitutivas Greece, Spain Colombia
AQSystemFinland, Italy, Spain, Sweden, United
KingdomCanada
ArcelorMittal Ringmill Belgium ---
Ardrossan Wind Farm (Scotland)
LimitedUnited Kingdom ---
AREVA – Renewable Energies
Business GroupFrance ---
Arise Windpower AB Sweden ---
Aristoncavi SpA Italy China, Dubai, Singapore
ASJA Ambiente Italia SpA Italy Argentina, Brazil, China
Atlas Magnetics Group Germany, NetherlandsCanada, China, United States of
America
ATM-PRO SPRL Belgium ---
Availon GmbH Germany, Italy, Spain United States of America
AvancosGermany, Netherlands, Spain, United
KingdomChina, India, United States of America
Avanti Wind Systems A/SDenmark, Germany, Spain, United
Kingdom
Australia, China, India, South Korea,
United States of America
Avantis Europe GmbH Germany Australia, Hong Kong
AVL List Gmbh
Austria, Benelux, Czech Republic,
Finland, France, Germany Hungary,
Italy, Poland, Portugal, Romania,
Slovenia, Spain, United Kingdom
Argentina, Asia, Australia, Brazil,
Croatia, North America, Russia,
Scandinavia, Switzerland, Turkey
AWS Truepower Spain India, United States of America
Axis Renewables Ireland, United KingdomBermuda, Switzerland, United States
of America
Bachmann electronic GmbHAustria, Denmark, Germany,
NetherlandsChina, India
Bakker Magnetics BV Belgium, Netherlands ---
Ballast Nedam Offshore Netherlands ---
Baltic Wind Park Latvia ---
BARD Engineering GmbH Germany ---
Barlovento Recursos Naturales SL Romania, Spain Brazil, Peru
Barrow Offshore Wind Limited United Kingdom ---
BBB Umwelttechnik GmbH Germany ---
Beaufort Wind Limited United Kingdom ---
BEN Aketil Wind Energy Limited United Kingdom ---
BerlinWind GmbH Germany ---
23799_EWEA_2012.indd 7423799_EWEA_2012.indd 74 28/03/12 17:2628/03/12 17:26
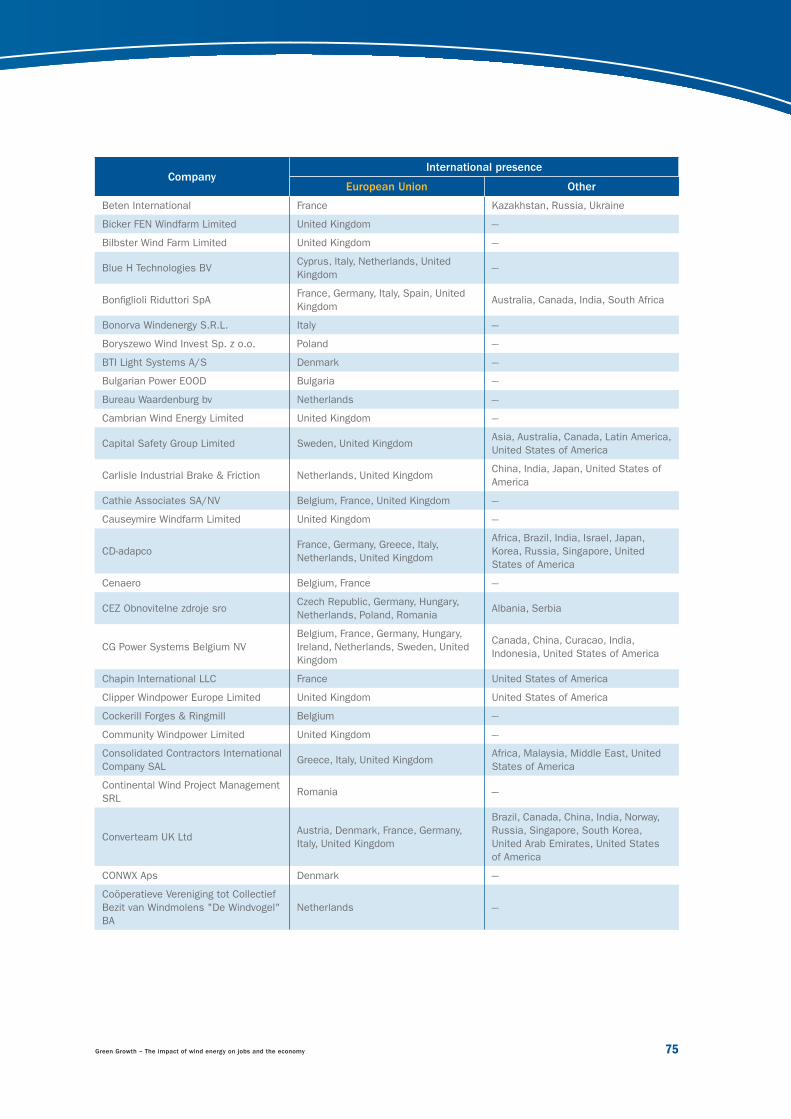
Green Growth – The impact of wind energy on jobs and the economy 75
CompanyInternational presence
European Union Other
Beten International France Kazakhstan, Russia, Ukraine
Bicker FEN Windfarm Limited United Kingdom ---
Bilbster Wind Farm Limited United Kingdom ---
Blue H Technologies BVCyprus, Italy, Netherlands, United
Kingdom---
Bonfi glioli Riduttori SpAFrance, Germany, Italy, Spain, United
KingdomAustralia, Canada, India, South Africa
Bonorva Windenergy S.R.L. Italy ---
Boryszewo Wind Invest Sp. z o.o. Poland ---
BTI Light Systems A/S Denmark ---
Bulgarian Power EOOD Bulgaria ---
Bureau Waardenburg bv Netherlands ---
Cambrian Wind Energy Limited United Kingdom ---
Capital Safety Group Limited Sweden, United KingdomAsia, Australia, Canada, Latin America,
United States of America
Carlisle Industrial Brake & Friction Netherlands, United KingdomChina, India, Japan, United States of
America
Cathie Associates SA/NV Belgium, France, United Kingdom ---
Causeymire Windfarm Limited United Kingdom ---
CD-adapcoFrance, Germany, Greece, Italy,
Netherlands, United Kingdom
Africa, Brazil, India, Israel, Japan,
Korea, Russia, Singapore, United
States of America
Cenaero Belgium, France ---
CEZ Obnovitelne zdroje sroCzech Republic, Germany, Hungary,
Netherlands, Poland, RomaniaAlbania, Serbia
CG Power Systems Belgium NV
Belgium, France, Germany, Hungary,
Ireland, Netherlands, Sweden, United
Kingdom
Canada, China, Curacao, India,
Indonesia, United States of America
Chapin International LLC France United States of America
Clipper Windpower Europe Limited United Kingdom United States of America
Cockerill Forges & Ringmill Belgium ---
Community Windpower Limited United Kingdom ---
Consolidated Contractors International
Company SALGreece, Italy, United Kingdom
Africa, Malaysia, Middle East, United
States of America
Continental Wind Project Management
SRLRomania ---
Converteam UK LtdAustria, Denmark, France, Germany,
Italy, United Kingdom
Brazil, Canada, China, India, Norway,
Russia, Singapore, South Korea,
United Arab Emirates, United States
of America
CONWX Aps Denmark ---
Coöperatieve Vereniging tot Collectief
Bezit van Windmolens "De Windvogel"
BA
Netherlands ---
23799_EWEA_2012.indd 7523799_EWEA_2012.indd 75 28/03/12 17:2628/03/12 17:26
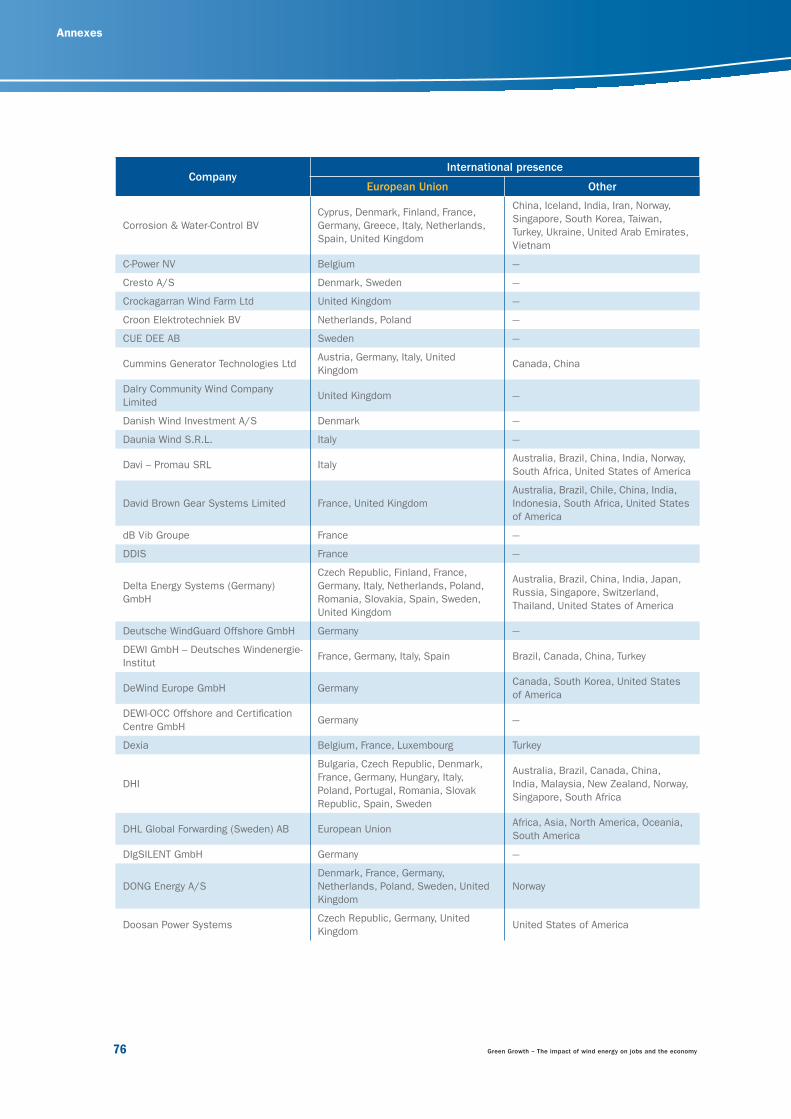
Chapter 8: Annexes
76 Green Growth – The impact of wind energy on jobs and the economy
Annexes
CompanyInternational presence
European Union Other
Corrosion & Water-Control BV
Cyprus, Denmark, Finland, France,
Germany, Greece, Italy, Netherlands,
Spain, United Kingdom
China, Iceland, India, Iran, Norway,
Singapore, South Korea, Taiwan,
Turkey, Ukraine, United Arab Emirates,
Vietnam
C-Power NV Belgium ---
Cresto A/S Denmark, Sweden ---
Crockagarran Wind Farm Ltd United Kingdom ---
Croon Elektrotechniek BV Netherlands, Poland ---
CUE DEE AB Sweden ---
Cummins Generator Technologies LtdAustria, Germany, Italy, United
KingdomCanada, China
Dalry Community Wind Company
LimitedUnited Kingdom ---
Danish Wind Investment A/S Denmark ---
Daunia Wind S.R.L. Italy ---
Davi – Promau SRL ItalyAustralia, Brazil, China, India, Norway,
South Africa, United States of America
David Brown Gear Systems Limited France, United Kingdom
Australia, Brazil, Chile, China, India,
Indonesia, South Africa, United States
of America
dB Vib Groupe France ---
DDIS France ---
Delta Energy Systems (Germany)
GmbH
Czech Republic, Finland, France,
Germany, Italy, Netherlands, Poland,
Romania, Slovakia, Spain, Sweden,
United Kingdom
Australia, Brazil, China, India, Japan,
Russia, Singapore, Switzerland,
Thailand, United States of America
Deutsche WindGuard Offshore GmbH Germany ---
DEWI GmbH – Deutsches Windenergie-
InstitutFrance, Germany, Italy, Spain Brazil, Canada, China, Turkey
DeWind Europe GmbH GermanyCanada, South Korea, United States
of America
DEWI-OCC Offshore and Certifi cation
Centre GmbHGermany ---
Dexia Belgium, France, Luxembourg Turkey
DHI
Bulgaria, Czech Republic, Denmark,
France, Germany, Hungary, Italy,
Poland, Portugal, Romania, Slovak
Republic, Spain, Sweden
Australia, Brazil, Canada, China,
India, Malaysia, New Zealand, Norway,
Singapore, South Africa
DHL Global Forwarding (Sweden) AB European UnionAfrica, Asia, North America, Oceania,
South America
DIgSILENT GmbH Germany ---
DONG Energy A/S
Denmark, France, Germany,
Netherlands, Poland, Sweden, United
Kingdom
Norway
Doosan Power SystemsCzech Republic, Germany, United
KingdomUnited States of America
23799_EWEA_2012.indd 7623799_EWEA_2012.indd 76 28/03/12 17:2628/03/12 17:26
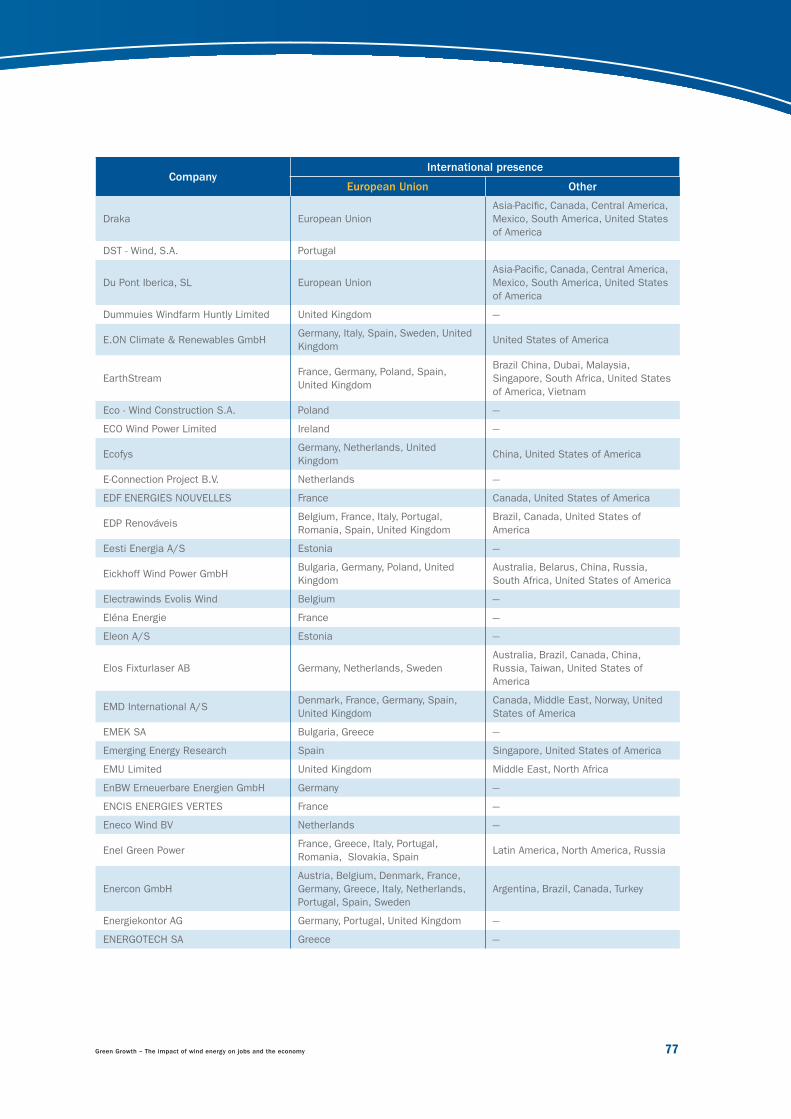
Green Growth – The impact of wind energy on jobs and the economy 77
CompanyInternational presence
European Union Other
Draka European Union
Asia-Pacifi c, Canada, Central America,
Mexico, South America, United States
of America
DST - Wind, S.A. Portugal
Du Pont Iberica, SL European Union
Asia-Pacifi c, Canada, Central America,
Mexico, South America, United States
of America
Dummuies Windfarm Huntly Limited United Kingdom ---
E.ON Climate & Renewables GmbHGermany, Italy, Spain, Sweden, United
KingdomUnited States of America
EarthStreamFrance, Germany, Poland, Spain,
United Kingdom
Brazil China, Dubai, Malaysia,
Singapore, South Africa, United States
of America, Vietnam
Eco - Wind Construction S.A. Poland ---
ECO Wind Power Limited Ireland ---
EcofysGermany, Netherlands, United
KingdomChina, United States of America
E-Connection Project B.V. Netherlands ---
EDF ENERGIES NOUVELLES France Canada, United States of America
EDP RenováveisBelgium, France, Italy, Portugal,
Romania, Spain, United Kingdom
Brazil, Canada, United States of
America
Eesti Energia A/S Estonia ---
Eickhoff Wind Power GmbHBulgaria, Germany, Poland, United
Kingdom
Australia, Belarus, China, Russia,
South Africa, United States of America
Electrawinds Evolis Wind Belgium ---
Eléna Energie France ---
Eleon A/S Estonia ---
Elos Fixturlaser AB Germany, Netherlands, Sweden
Australia, Brazil, Canada, China,
Russia, Taiwan, United States of
America
EMD International A/SDenmark, France, Germany, Spain,
United Kingdom
Canada, Middle East, Norway, United
States of America
EMEK SA Bulgaria, Greece ---
Emerging Energy Research Spain Singapore, United States of America
EMU Limited United Kingdom Middle East, North Africa
EnBW Erneuerbare Energien GmbH Germany ---
ENCIS ENERGIES VERTES France ---
Eneco Wind BV Netherlands ---
Enel Green PowerFrance, Greece, Italy, Portugal,
Romania, Slovakia, SpainLatin America, North America, Russia
Enercon GmbH
Austria, Belgium, Denmark, France,
Germany, Greece, Italy, Netherlands,
Portugal, Spain, Sweden
Argentina, Brazil, Canada, Turkey
Energiekontor AG Germany, Portugal, United Kingdom ---
ENERGOTECH SA Greece ---
23799_EWEA_2012.indd 7723799_EWEA_2012.indd 77 28/03/12 17:2628/03/12 17:26
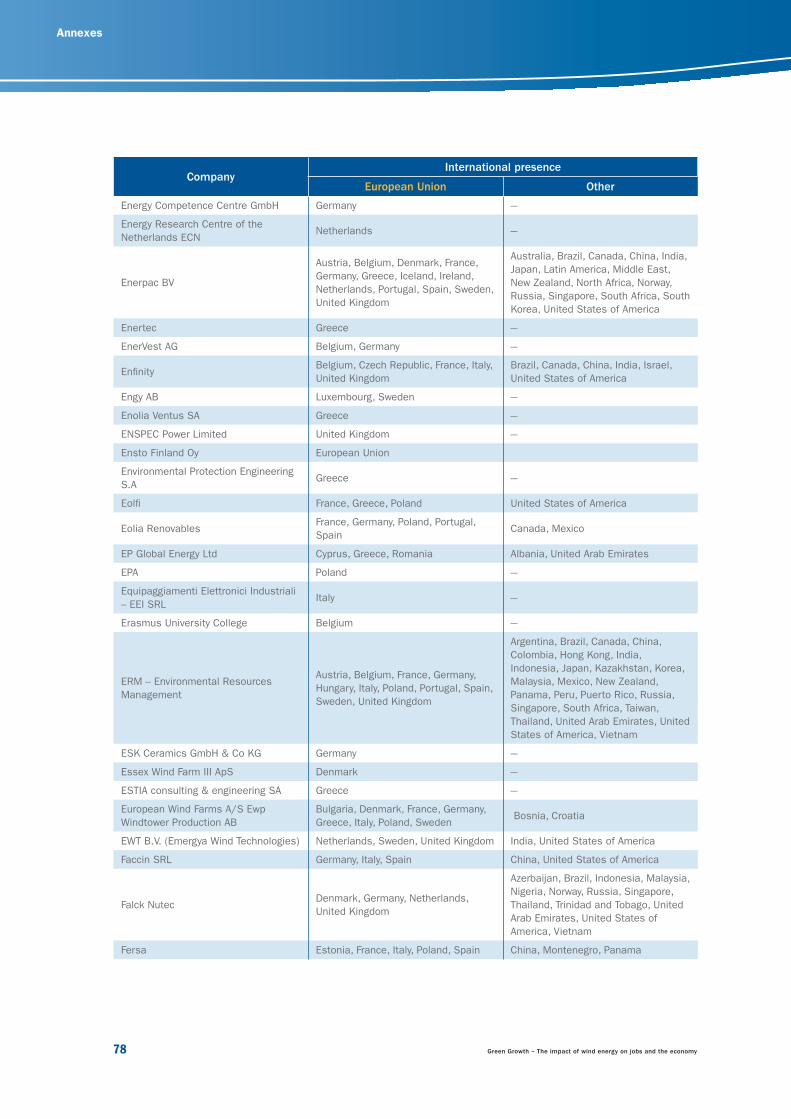
Chapter 8: Annexes
78 Green Growth – The impact of wind energy on jobs and the economy
Annexes
CompanyInternational presence
European Union Other
Energy Competence Centre GmbH Germany ---
Energy Research Centre of the
Netherlands ECNNetherlands ---
Enerpac BV
Austria, Belgium, Denmark, France,
Germany, Greece, Iceland, Ireland,
Netherlands, Portugal, Spain, Sweden,
United Kingdom
Australia, Brazil, Canada, China, India,
Japan, Latin America, Middle East,
New Zealand, North Africa, Norway,
Russia, Singapore, South Africa, South
Korea, United States of America
Enertec Greece ---
EnerVest AG Belgium, Germany ---
Enfi nityBelgium, Czech Republic, France, Italy,
United Kingdom
Brazil, Canada, China, India, Israel,
United States of America
Engy AB Luxembourg, Sweden ---
Enolia Ventus SA Greece ---
ENSPEC Power Limited United Kingdom ---
Ensto Finland Oy European Union
Environmental Protection Engineering
S.AGreece ---
Eolfi France, Greece, Poland United States of America
Eolia RenovablesFrance, Germany, Poland, Portugal,
SpainCanada, Mexico
EP Global Energy Ltd Cyprus, Greece, Romania Albania, United Arab Emirates
EPA Poland ---
Equipaggiamenti Elettronici Industriali
– EEI SRLItaly ---
Erasmus University College Belgium ---
ERM – Environmental Resources
Management
Austria, Belgium, France, Germany,
Hungary, Italy, Poland, Portugal, Spain,
Sweden, United Kingdom
Argentina, Brazil, Canada, China,
Colombia, Hong Kong, India,
Indonesia, Japan, Kazakhstan, Korea,
Malaysia, Mexico, New Zealand,
Panama, Peru, Puerto Rico, Russia,
Singapore, South Africa, Taiwan,
Thailand, United Arab Emirates, United
States of America, Vietnam
ESK Ceramics GmbH & Co KG Germany ---
Essex Wind Farm III ApS Denmark ---
ESTIA consulting & engineering SA Greece ---
European Wind Farms A/S Ewp
Windtower Production AB
Bulgaria, Denmark, France, Germany,
Greece, Italy, Poland, Sweden Bosnia, Croatia
EWT B.V. (Emergya Wind Technologies) Netherlands, Sweden, United Kingdom India, United States of America
Faccin SRL Germany, Italy, Spain China, United States of America
Falck NutecDenmark, Germany, Netherlands,
United Kingdom
Azerbaijan, Brazil, Indonesia, Malaysia,
Nigeria, Norway, Russia, Singapore,
Thailand, Trinidad and Tobago, United
Arab Emirates, United States of
America, Vietnam
Fersa Estonia, France, Italy, Poland, Spain China, Montenegro, Panama
23799_EWEA_2012.indd 7823799_EWEA_2012.indd 78 28/03/12 17:2628/03/12 17:26
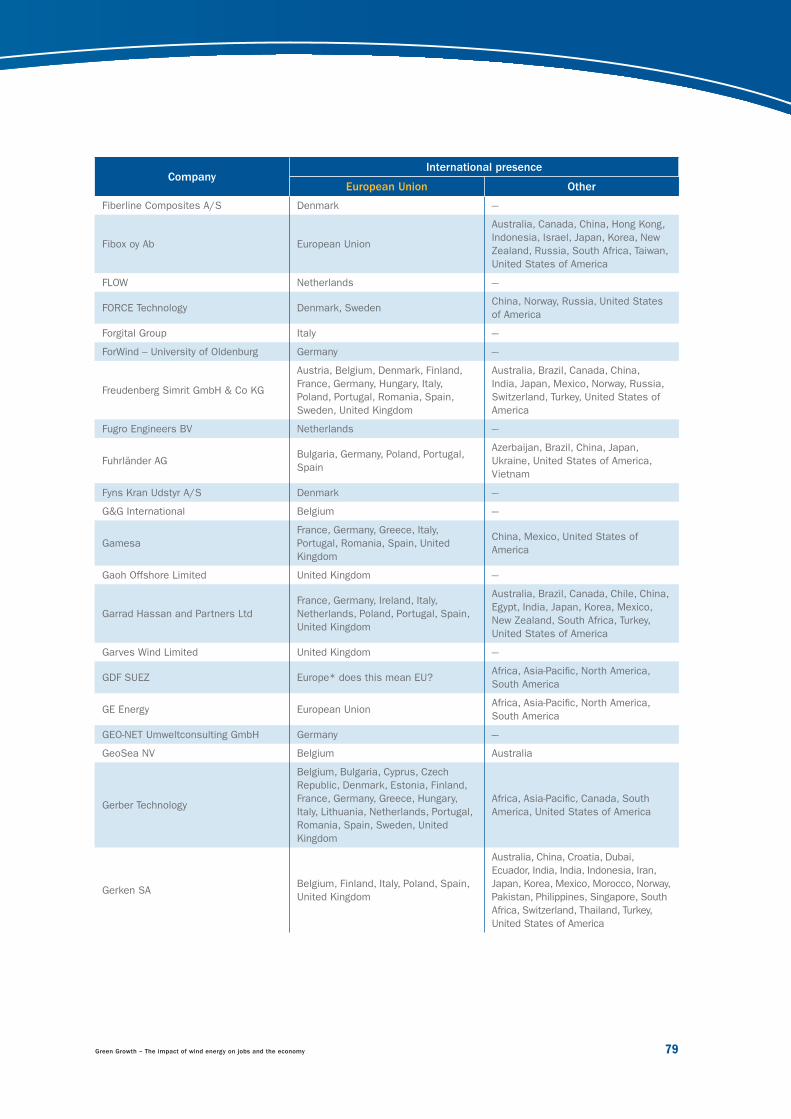
Green Growth – The impact of wind energy on jobs and the economy 79
CompanyInternational presence
European Union Other
Fiberline Composites A/S Denmark ---
Fibox oy Ab European Union
Australia, Canada, China, Hong Kong,
Indonesia, Israel, Japan, Korea, New
Zealand, Russia, South Africa, Taiwan,
United States of America
FLOW Netherlands ---
FORCE Technology Denmark, SwedenChina, Norway, Russia, United States
of America
Forgital Group Italy ---
ForWind – University of Oldenburg Germany ---
Freudenberg Simrit GmbH & Co KG
Austria, Belgium, Denmark, Finland,
France, Germany, Hungary, Italy,
Poland, Portugal, Romania, Spain,
Sweden, United Kingdom
Australia, Brazil, Canada, China,
India, Japan, Mexico, Norway, Russia,
Switzerland, Turkey, United States of
America
Fugro Engineers BV Netherlands ---
Fuhrländer AGBulgaria, Germany, Poland, Portugal,
Spain
Azerbaijan, Brazil, China, Japan,
Ukraine, United States of America,
Vietnam
Fyns Kran Udstyr A/S Denmark ---
G&G International Belgium ---
Gamesa
France, Germany, Greece, Italy,
Portugal, Romania, Spain, United
Kingdom
China, Mexico, United States of
America
Gaoh Offshore Limited United Kingdom ---
Garrad Hassan and Partners Ltd
France, Germany, Ireland, Italy,
Netherlands, Poland, Portugal, Spain,
United Kingdom
Australia, Brazil, Canada, Chile, China,
Egypt, India, Japan, Korea, Mexico,
New Zealand, South Africa, Turkey,
United States of America
Garves Wind Limited United Kingdom ---
GDF SUEZ Europe* does this mean EU?Africa, Asia-Pacifi c, North America,
South America
GE Energy European UnionAfrica, Asia-Pacifi c, North America,
South America
GEO-NET Umweltconsulting GmbH Germany ---
GeoSea NV Belgium Australia
Gerber Technology
Belgium, Bulgaria, Cyprus, Czech
Republic, Denmark, Estonia, Finland,
France, Germany, Greece, Hungary,
Italy, Lithuania, Netherlands, Portugal,
Romania, Spain, Sweden, United
Kingdom
Africa, Asia-Pacifi c, Canada, South
America, United States of America
Gerken SABelgium, Finland, Italy, Poland, Spain,
United Kingdom
Australia, China, Croatia, Dubai,
Ecuador, India, India, Indonesia, Iran,
Japan, Korea, Mexico, Morocco, Norway,
Pakistan, Philippines, Singapore, South
Africa, Switzerland, Thailand, Turkey,
United States of America
23799_EWEA_2012.indd 7923799_EWEA_2012.indd 79 28/03/12 17:2628/03/12 17:26
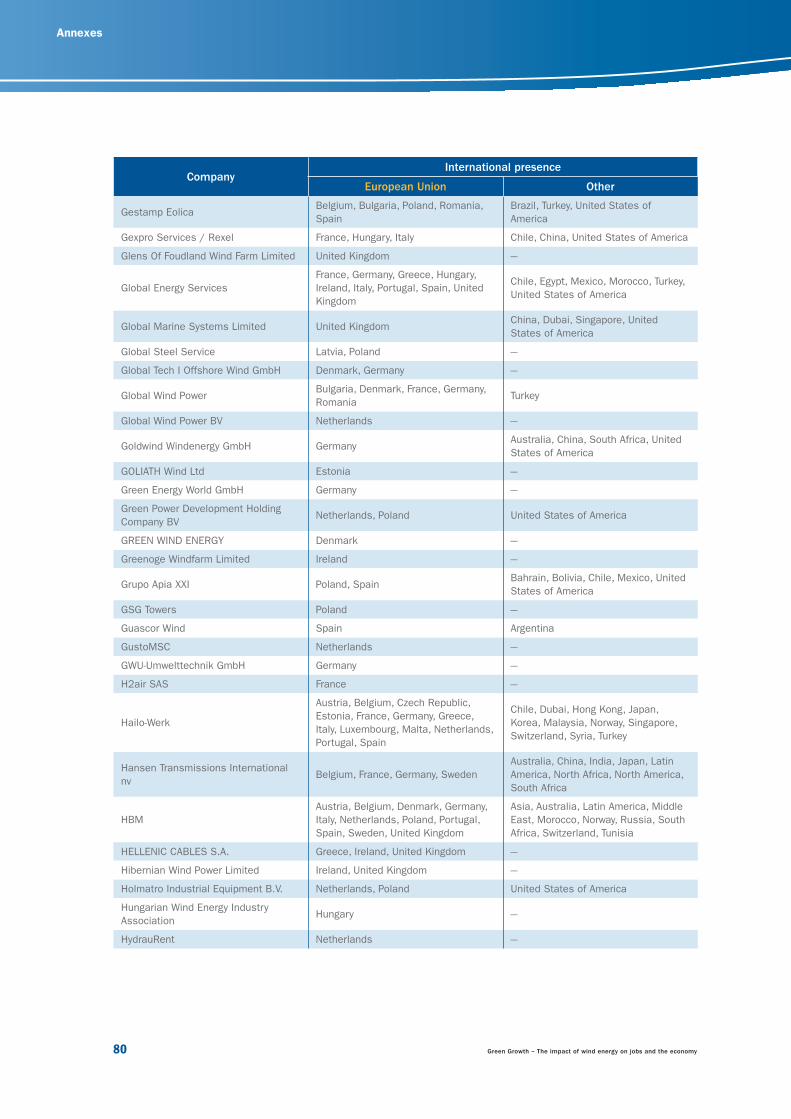
Chapter 8: Annexes
80 Green Growth – The impact of wind energy on jobs and the economy
Annexes
CompanyInternational presence
European Union Other
Gestamp EolicaBelgium, Bulgaria, Poland, Romania,
Spain
Brazil, Turkey, United States of
America
Gexpro Services / Rexel France, Hungary, Italy Chile, China, United States of America
Glens Of Foudland Wind Farm Limited United Kingdom ---
Global Energy Services
France, Germany, Greece, Hungary,
Ireland, Italy, Portugal, Spain, United
Kingdom
Chile, Egypt, Mexico, Morocco, Turkey,
United States of America
Global Marine Systems Limited United KingdomChina, Dubai, Singapore, United
States of America
Global Steel Service Latvia, Poland ---
Global Tech I Offshore Wind GmbH Denmark, Germany ---
Global Wind Power Bulgaria, Denmark, France, Germany,
RomaniaTurkey
Global Wind Power BV Netherlands ---
Goldwind Windenergy GmbH GermanyAustralia, China, South Africa, United
States of America
GOLIATH Wind Ltd Estonia ---
Green Energy World GmbH Germany ---
Green Power Development Holding
Company BVNetherlands, Poland United States of America
GREEN WIND ENERGY Denmark ---
Greenoge Windfarm Limited Ireland ---
Grupo Apia XXI Poland, SpainBahrain, Bolivia, Chile, Mexico, United
States of America
GSG Towers Poland ---
Guascor Wind Spain Argentina
GustoMSC Netherlands ---
GWU-Umwelttechnik GmbH Germany ---
H2air SAS France ---
Hailo-Werk
Austria, Belgium, Czech Republic,
Estonia, France, Germany, Greece,
Italy, Luxembourg, Malta, Netherlands,
Portugal, Spain
Chile, Dubai, Hong Kong, Japan,
Korea, Malaysia, Norway, Singapore,
Switzerland, Syria, Turkey
Hansen Transmissions International
nvBelgium, France, Germany, Sweden
Australia, China, India, Japan, Latin
America, North Africa, North America,
South Africa
HBM
Austria, Belgium, Denmark, Germany,
Italy, Netherlands, Poland, Portugal,
Spain, Sweden, United Kingdom
Asia, Australia, Latin America, Middle
East, Morocco, Norway, Russia, South
Africa, Switzerland, Tunisia
HELLENIC CABLES S.A. Greece, Ireland, United Kingdom ---
Hibernian Wind Power Limited Ireland, United Kingdom ---
Holmatro Industrial Equipment B.V. Netherlands, Poland United States of America
Hungarian Wind Energy Industry
AssociationHungary ---
HydrauRent Netherlands ---
23799_EWEA_2012.indd 8023799_EWEA_2012.indd 80 28/03/12 17:2628/03/12 17:26
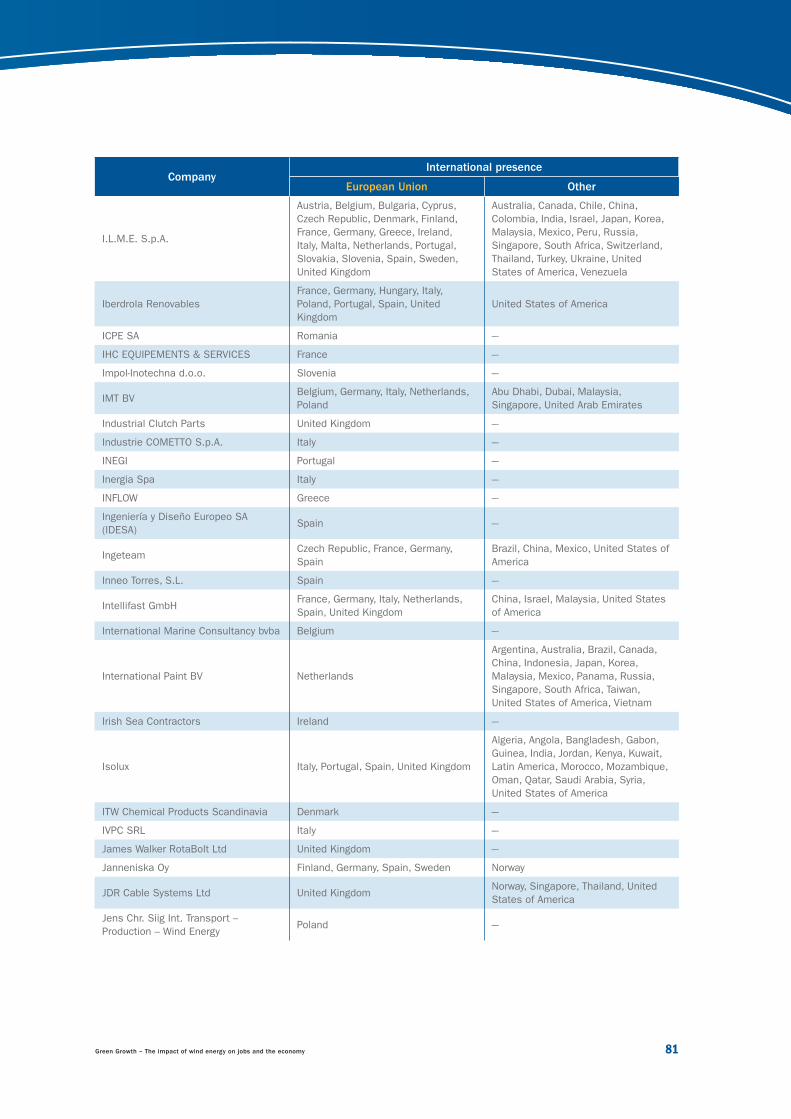
Green Growth – The impact of wind energy on jobs and the economy 81
CompanyInternational presence
European Union Other
I.L.M.E. S.p.A.
Austria, Belgium, Bulgaria, Cyprus,
Czech Republic, Denmark, Finland,
France, Germany, Greece, Ireland,
Italy, Malta, Netherlands, Portugal,
Slovakia, Slovenia, Spain, Sweden,
United Kingdom
Australia, Canada, Chile, China,
Colombia, India, Israel, Japan, Korea,
Malaysia, Mexico, Peru, Russia,
Singapore, South Africa, Switzerland,
Thailand, Turkey, Ukraine, United
States of America, Venezuela
Iberdrola Renovables
France, Germany, Hungary, Italy,
Poland, Portugal, Spain, United
Kingdom
United States of America
ICPE SA Romania ---
IHC EQUIPEMENTS & SERVICES France ---
Impol-Inotechna d.o.o. Slovenia ---
IMT BVBelgium, Germany, Italy, Netherlands,
Poland
Abu Dhabi, Dubai, Malaysia,
Singapore, United Arab Emirates
Industrial Clutch Parts United Kingdom ---
Industrie COMETTO S.p.A. Italy ---
INEGI Portugal ---
Inergia Spa Italy ---
INFLOW Greece ---
Ingeniería y Diseño Europeo SA
(IDESA)Spain ---
IngeteamCzech Republic, France, Germany,
Spain
Brazil, China, Mexico, United States of
America
Inneo Torres, S.L. Spain ---
Intellifast GmbHFrance, Germany, Italy, Netherlands,
Spain, United Kingdom
China, Israel, Malaysia, United States
of America
International Marine Consultancy bvba Belgium ---
International Paint BV Netherlands
Argentina, Australia, Brazil, Canada,
China, Indonesia, Japan, Korea,
Malaysia, Mexico, Panama, Russia,
Singapore, South Africa, Taiwan,
United States of America, Vietnam
Irish Sea Contractors Ireland ---
Isolux Italy, Portugal, Spain, United Kingdom
Algeria, Angola, Bangladesh, Gabon,
Guinea, India, Jordan, Kenya, Kuwait,
Latin America, Morocco, Mozambique,
Oman, Qatar, Saudi Arabia, Syria,
United States of America
ITW Chemical Products Scandinavia Denmark ---
IVPC SRL Italy ---
James Walker RotaBolt Ltd United Kingdom ---
Janneniska Oy Finland, Germany, Spain, Sweden Norway
JDR Cable Systems Ltd United KingdomNorway, Singapore, Thailand, United
States of America
Jens Chr. Siig Int. Transport –
Production – Wind EnergyPoland ---
23799_EWEA_2012.indd 8123799_EWEA_2012.indd 81 28/03/12 17:2628/03/12 17:26
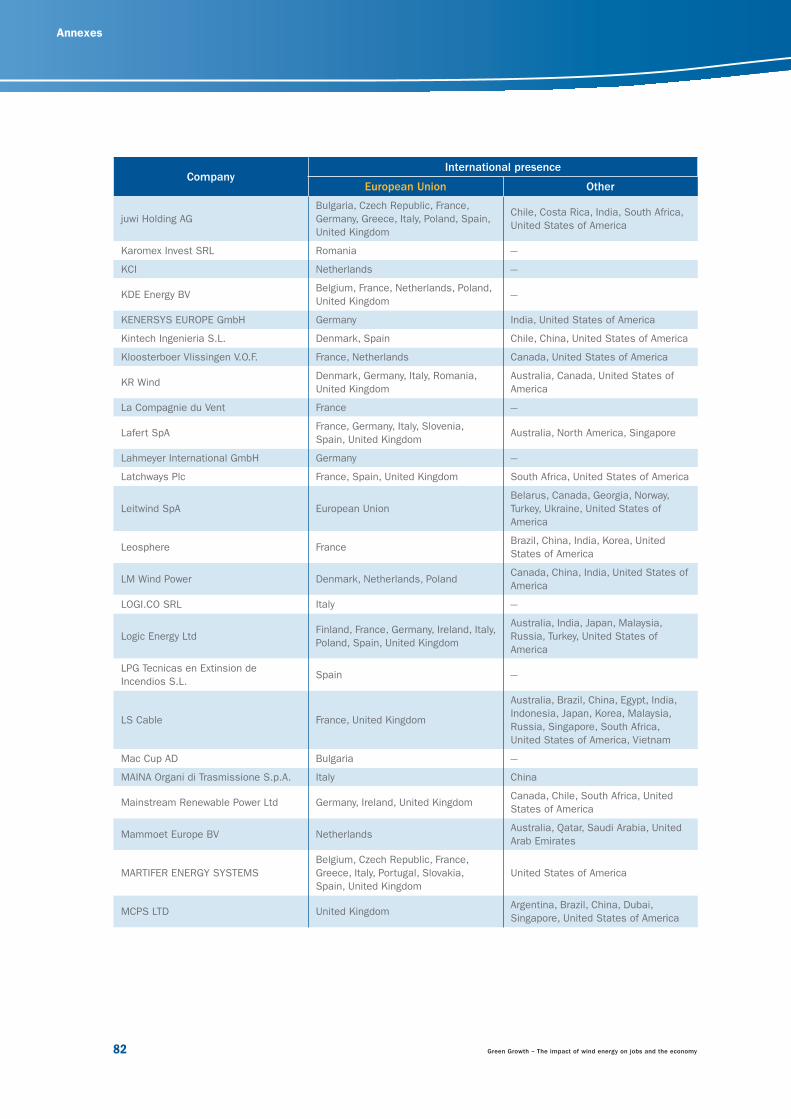
Chapter 8: Annexes
82 Green Growth – The impact of wind energy on jobs and the economy
Annexes
CompanyInternational presence
European Union Other
juwi Holding AG
Bulgaria, Czech Republic, France,
Germany, Greece, Italy, Poland, Spain,
United Kingdom
Chile, Costa Rica, India, South Africa,
United States of America
Karomex Invest SRL Romania ---
KCI Netherlands ---
KDE Energy BVBelgium, France, Netherlands, Poland,
United Kingdom---
KENERSYS EUROPE GmbH Germany India, United States of America
Kintech Ingenieria S.L. Denmark, Spain Chile, China, United States of America
Kloosterboer Vlissingen V.O.F. France, Netherlands Canada, United States of America
KR WindDenmark, Germany, Italy, Romania,
United Kingdom
Australia, Canada, United States of
America
La Compagnie du Vent France ---
Lafert SpAFrance, Germany, Italy, Slovenia,
Spain, United KingdomAustralia, North America, Singapore
Lahmeyer International GmbH Germany ---
Latchways Plc France, Spain, United Kingdom South Africa, United States of America
Leitwind SpA European Union
Belarus, Canada, Georgia, Norway,
Turkey, Ukraine, United States of
America
Leosphere FranceBrazil, China, India, Korea, United
States of America
LM Wind Power Denmark, Netherlands, PolandCanada, China, India, United States of
America
LOGI.CO SRL Italy ---
Logic Energy LtdFinland, France, Germany, Ireland, Italy,
Poland, Spain, United Kingdom
Australia, India, Japan, Malaysia,
Russia, Turkey, United States of
America
LPG Tecnicas en Extinsion de
Incendios S.L.Spain ---
LS Cable France, United Kingdom
Australia, Brazil, China, Egypt, India,
Indonesia, Japan, Korea, Malaysia,
Russia, Singapore, South Africa,
United States of America, Vietnam
Mac Cup AD Bulgaria ---
MAINA Organi di Trasmissione S.p.A. Italy China
Mainstream Renewable Power Ltd Germany, Ireland, United KingdomCanada, Chile, South Africa, United
States of America
Mammoet Europe BV NetherlandsAustralia, Qatar, Saudi Arabia, United
Arab Emirates
MARTIFER ENERGY SYSTEMS
Belgium, Czech Republic, France,
Greece, Italy, Portugal, Slovakia,
Spain, United Kingdom
United States of America
MCPS LTD United KingdomArgentina, Brazil, China, Dubai,
Singapore, United States of America
23799_EWEA_2012.indd 8223799_EWEA_2012.indd 82 28/03/12 17:2628/03/12 17:26
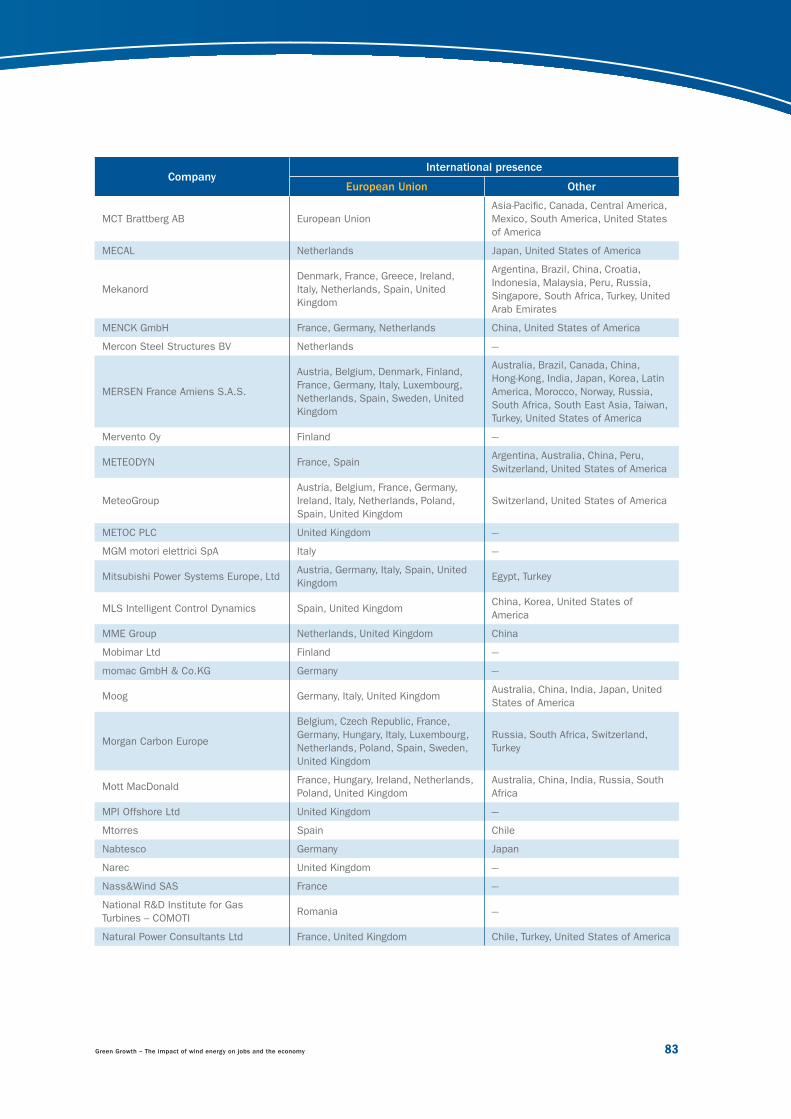
Green Growth – The impact of wind energy on jobs and the economy 83
CompanyInternational presence
European Union Other
MCT Brattberg AB European Union
Asia-Pacifi c, Canada, Central America,
Mexico, South America, United States
of America
MECAL Netherlands Japan, United States of America
Mekanord
Denmark, France, Greece, Ireland,
Italy, Netherlands, Spain, United
Kingdom
Argentina, Brazil, China, Croatia,
Indonesia, Malaysia, Peru, Russia,
Singapore, South Africa, Turkey, United
Arab Emirates
MENCK GmbH France, Germany, Netherlands China, United States of America
Mercon Steel Structures BV Netherlands ---
MERSEN France Amiens S.A.S.
Austria, Belgium, Denmark, Finland,
France, Germany, Italy, Luxembourg,
Netherlands, Spain, Sweden, United
Kingdom
Australia, Brazil, Canada, China,
Hong-Kong, India, Japan, Korea, Latin
America, Morocco, Norway, Russia,
South Africa, South East Asia, Taiwan,
Turkey, United States of America
Mervento Oy Finland ---
METEODYN France, SpainArgentina, Australia, China, Peru,
Switzerland, United States of America
MeteoGroup
Austria, Belgium, France, Germany,
Ireland, Italy, Netherlands, Poland,
Spain, United Kingdom
Switzerland, United States of America
METOC PLC United Kingdom ---
MGM motori elettrici SpA Italy ---
Mitsubishi Power Systems Europe, LtdAustria, Germany, Italy, Spain, United
KingdomEgypt, Turkey
MLS Intelligent Control Dynamics Spain, United KingdomChina, Korea, United States of
America
MME Group Netherlands, United Kingdom China
Mobimar Ltd Finland ---
momac GmbH & Co.KG Germany ---
Moog Germany, Italy, United KingdomAustralia, China, India, Japan, United
States of America
Morgan Carbon Europe
Belgium, Czech Republic, France,
Germany, Hungary, Italy, Luxembourg,
Netherlands, Poland, Spain, Sweden,
United Kingdom
Russia, South Africa, Switzerland,
Turkey
Mott MacDonaldFrance, Hungary, Ireland, Netherlands,
Poland, United Kingdom
Australia, China, India, Russia, South
Africa
MPI Offshore Ltd United Kingdom ---
Mtorres Spain Chile
Nabtesco Germany Japan
Narec United Kingdom ---
Nass&Wind SAS France ---
National R&D Institute for Gas
Turbines – COMOTIRomania ---
Natural Power Consultants Ltd France, United Kingdom Chile, Turkey, United States of America
23799_EWEA_2012.indd 8323799_EWEA_2012.indd 83 28/03/12 17:2628/03/12 17:26
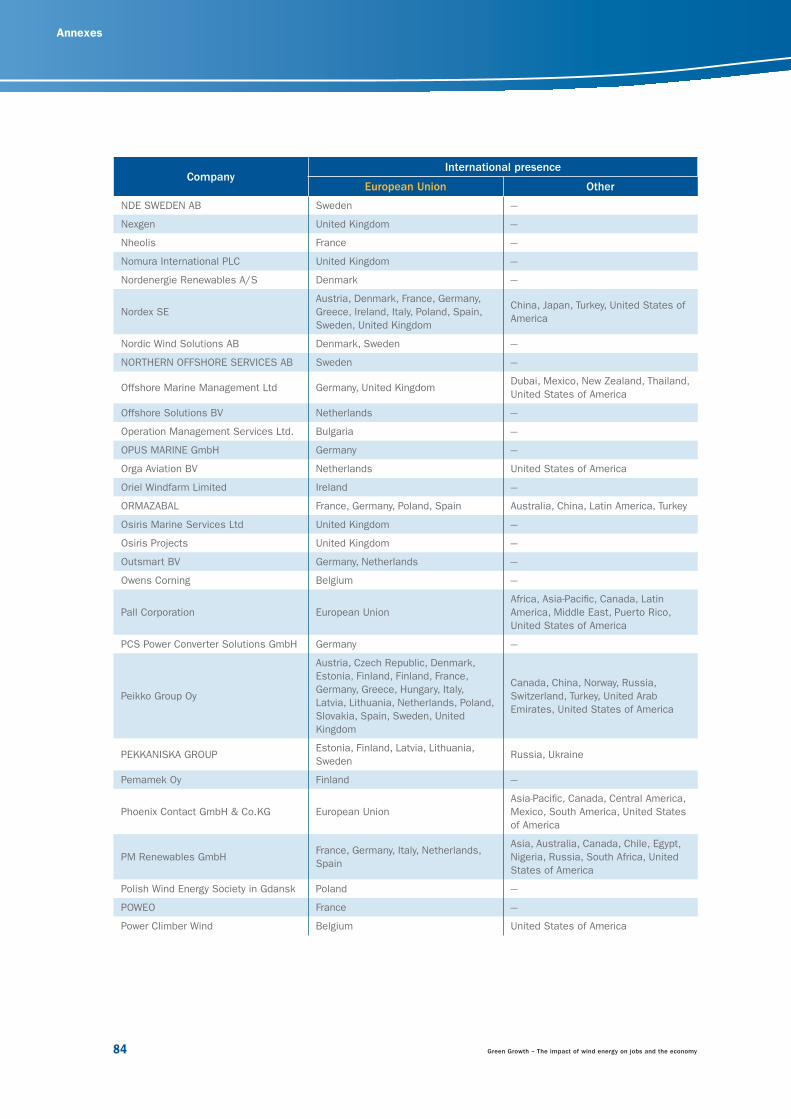
Chapter 8: Annexes
84 Green Growth – The impact of wind energy on jobs and the economy
Annexes
CompanyInternational presence
European Union Other
NDE SWEDEN AB Sweden ---
Nexgen United Kingdom ---
Nheolis France ---
Nomura International PLC United Kingdom ---
Nordenergie Renewables A/S Denmark ---
Nordex SE
Austria, Denmark, France, Germany,
Greece, Ireland, Italy, Poland, Spain,
Sweden, United Kingdom
China, Japan, Turkey, United States of
America
Nordic Wind Solutions AB Denmark, Sweden ---
NORTHERN OFFSHORE SERVICES AB Sweden ---
Offshore Marine Management Ltd Germany, United KingdomDubai, Mexico, New Zealand, Thailand,
United States of America
Offshore Solutions BV Netherlands ---
Operation Management Services Ltd. Bulgaria ---
OPUS MARINE GmbH Germany ---
Orga Aviation BV Netherlands United States of America
Oriel Windfarm Limited Ireland ---
ORMAZABAL France, Germany, Poland, Spain Australia, China, Latin America, Turkey
Osiris Marine Services Ltd United Kingdom ---
Osiris Projects United Kingdom ---
Outsmart BV Germany, Netherlands ---
Owens Corning Belgium ---
Pall Corporation European Union
Africa, Asia-Pacifi c, Canada, Latin
America, Middle East, Puerto Rico,
United States of America
PCS Power Converter Solutions GmbH Germany ---
Peikko Group Oy
Austria, Czech Republic, Denmark,
Estonia, Finland, Finland, France,
Germany, Greece, Hungary, Italy,
Latvia, Lithuania, Netherlands, Poland,
Slovakia, Spain, Sweden, United
Kingdom
Canada, China, Norway, Russia,
Switzerland, Turkey, United Arab
Emirates, United States of America
PEKKANISKA GROUPEstonia, Finland, Latvia, Lithuania,
SwedenRussia, Ukraine
Pemamek Oy Finland ---
Phoenix Contact GmbH & Co.KG European Union
Asia-Pacifi c, Canada, Central America,
Mexico, South America, United States
of America
PM Renewables GmbHFrance, Germany, Italy, Netherlands,
Spain
Asia, Australia, Canada, Chile, Egypt,
Nigeria, Russia, South Africa, United
States of America
Polish Wind Energy Society in Gdansk Poland ---
POWEO France ---
Power Climber Wind Belgium United States of America
23799_EWEA_2012.indd 8423799_EWEA_2012.indd 84 28/03/12 17:2628/03/12 17:26
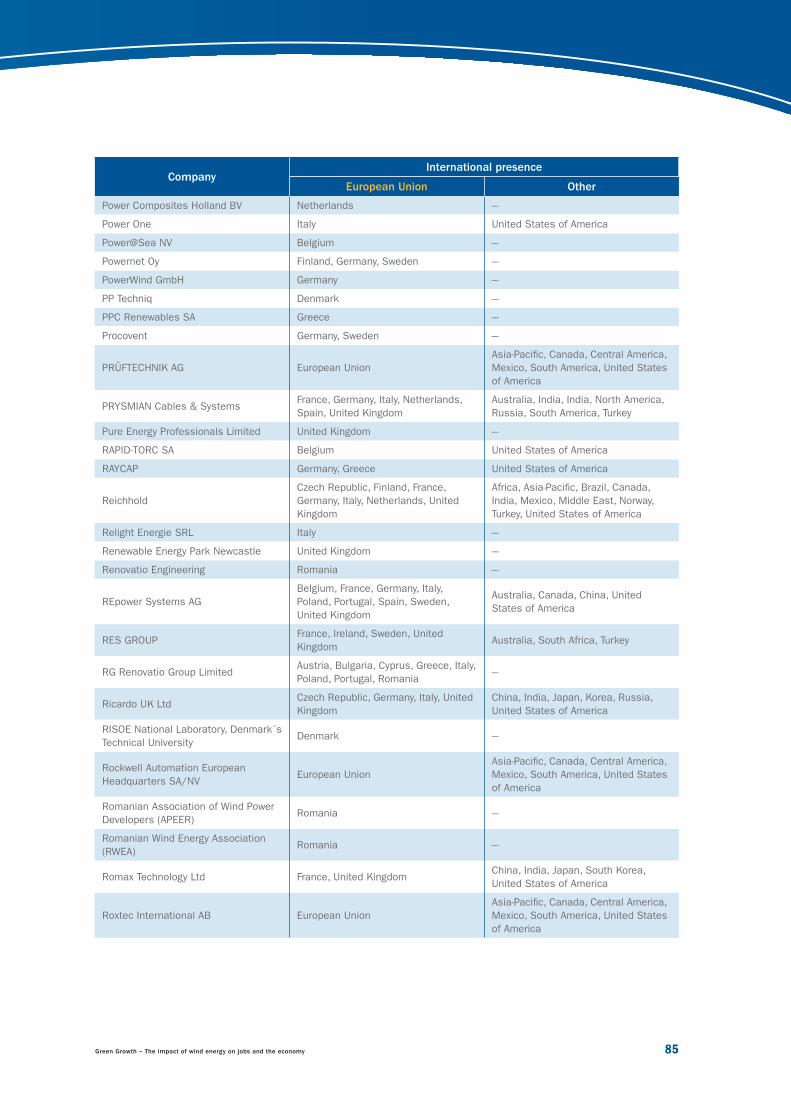
Green Growth – The impact of wind energy on jobs and the economy 85
CompanyInternational presence
European Union Other
Power Composites Holland BV Netherlands ---
Power One Italy United States of America
Power@Sea NV Belgium ---
Powernet Oy Finland, Germany, Sweden ---
PowerWind GmbH Germany ---
PP Techniq Denmark ---
PPC Renewables SA Greece ---
Procovent Germany, Sweden ---
PRÜFTECHNIK AG European Union
Asia-Pacifi c, Canada, Central America,
Mexico, South America, United States
of America
PRYSMIAN Cables & SystemsFrance, Germany, Italy, Netherlands,
Spain, United Kingdom
Australia, India, India, North America,
Russia, South America, Turkey
Pure Energy Professionals Limited United Kingdom ---
RAPID-TORC SA Belgium United States of America
RAYCAP Germany, Greece United States of America
Reichhold
Czech Republic, Finland, France,
Germany, Italy, Netherlands, United
Kingdom
Africa, Asia-Pacifi c, Brazil, Canada,
India, Mexico, Middle East, Norway,
Turkey, United States of America
Relight Energie SRL Italy ---
Renewable Energy Park Newcastle United Kingdom ---
Renovatio Engineering Romania ---
REpower Systems AG
Belgium, France, Germany, Italy,
Poland, Portugal, Spain, Sweden,
United Kingdom
Australia, Canada, China, United
States of America
RES GROUPFrance, Ireland, Sweden, United
KingdomAustralia, South Africa, Turkey
RG Renovatio Group LimitedAustria, Bulgaria, Cyprus, Greece, Italy,
Poland, Portugal, Romania---
Ricardo UK LtdCzech Republic, Germany, Italy, United
Kingdom
China, India, Japan, Korea, Russia,
United States of America
RISOE National Laboratory, Denmark´s
Technical UniversityDenmark ---
Rockwell Automation European
Headquarters SA/NVEuropean Union
Asia-Pacifi c, Canada, Central America,
Mexico, South America, United States
of America
Romanian Association of Wind Power
Developers (APEER)Romania ---
Romanian Wind Energy Association
(RWEA)Romania ---
Romax Technology Ltd France, United KingdomChina, India, Japan, South Korea,
United States of America
Roxtec International AB European Union
Asia-Pacifi c, Canada, Central America,
Mexico, South America, United States
of America
23799_EWEA_2012.indd 8523799_EWEA_2012.indd 85 28/03/12 17:2628/03/12 17:26
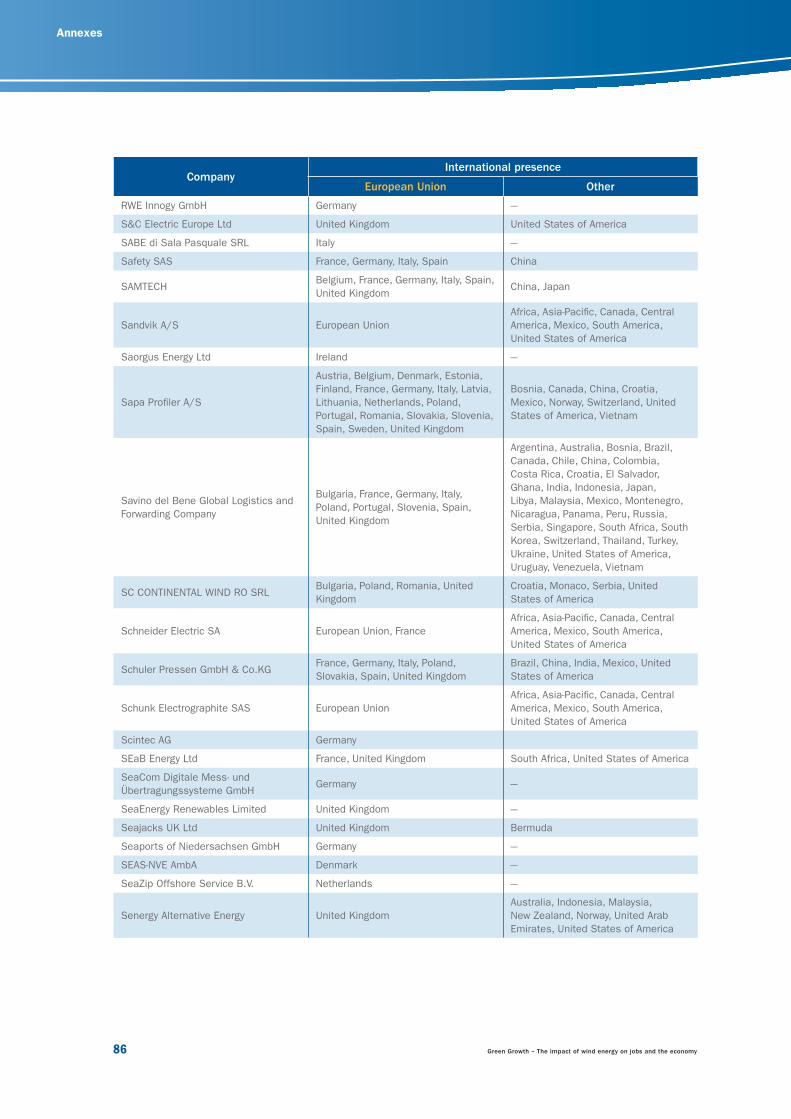
Chapter 8: Annexes
86 Green Growth – The impact of wind energy on jobs and the economy
Annexes
CompanyInternational presence
European Union Other
RWE Innogy GmbH Germany ---
S&C Electric Europe Ltd United Kingdom United States of America
SABE di Sala Pasquale SRL Italy ---
Safety SAS France, Germany, Italy, Spain China
SAMTECHBelgium, France, Germany, Italy, Spain,
United KingdomChina, Japan
Sandvik A/S European Union
Africa, Asia-Pacifi c, Canada, Central
America, Mexico, South America,
United States of America
Saorgus Energy Ltd Ireland ---
Sapa Profi ler A/S
Austria, Belgium, Denmark, Estonia,
Finland, France, Germany, Italy, Latvia,
Lithuania, Netherlands, Poland,
Portugal, Romania, Slovakia, Slovenia,
Spain, Sweden, United Kingdom
Bosnia, Canada, China, Croatia,
Mexico, Norway, Switzerland, United
States of America, Vietnam
Savino del Bene Global Logistics and
Forwarding Company
Bulgaria, France, Germany, Italy,
Poland, Portugal, Slovenia, Spain,
United Kingdom
Argentina, Australia, Bosnia, Brazil,
Canada, Chile, China, Colombia,
Costa Rica, Croatia, El Salvador,
Ghana, India, Indonesia, Japan,
Libya, Malaysia, Mexico, Montenegro,
Nicaragua, Panama, Peru, Russia,
Serbia, Singapore, South Africa, South
Korea, Switzerland, Thailand, Turkey,
Ukraine, United States of America,
Uruguay, Venezuela, Vietnam
SC CONTINENTAL WIND RO SRLBulgaria, Poland, Romania, United
Kingdom
Croatia, Monaco, Serbia, United
States of America
Schneider Electric SA European Union, France
Africa, Asia-Pacifi c, Canada, Central
America, Mexico, South America,
United States of America
Schuler Pressen GmbH & Co.KGFrance, Germany, Italy, Poland,
Slovakia, Spain, United Kingdom
Brazil, China, India, Mexico, United
States of America
Schunk Electrographite SAS European Union
Africa, Asia-Pacifi c, Canada, Central
America, Mexico, South America,
United States of America
Scintec AG Germany
SEaB Energy Ltd France, United Kingdom South Africa, United States of America
SeaCom Digitale Mess- und
Übertragungssysteme GmbHGermany ---
SeaEnergy Renewables Limited United Kingdom ---
Seajacks UK Ltd United Kingdom Bermuda
Seaports of Niedersachsen GmbH Germany ---
SEAS-NVE AmbA Denmark ---
SeaZip Offshore Service B.V. Netherlands ---
Senergy Alternative Energy United Kingdom
Australia, Indonesia, Malaysia,
New Zealand, Norway, United Arab
Emirates, United States of America
23799_EWEA_2012.indd 8623799_EWEA_2012.indd 86 28/03/12 17:2628/03/12 17:26
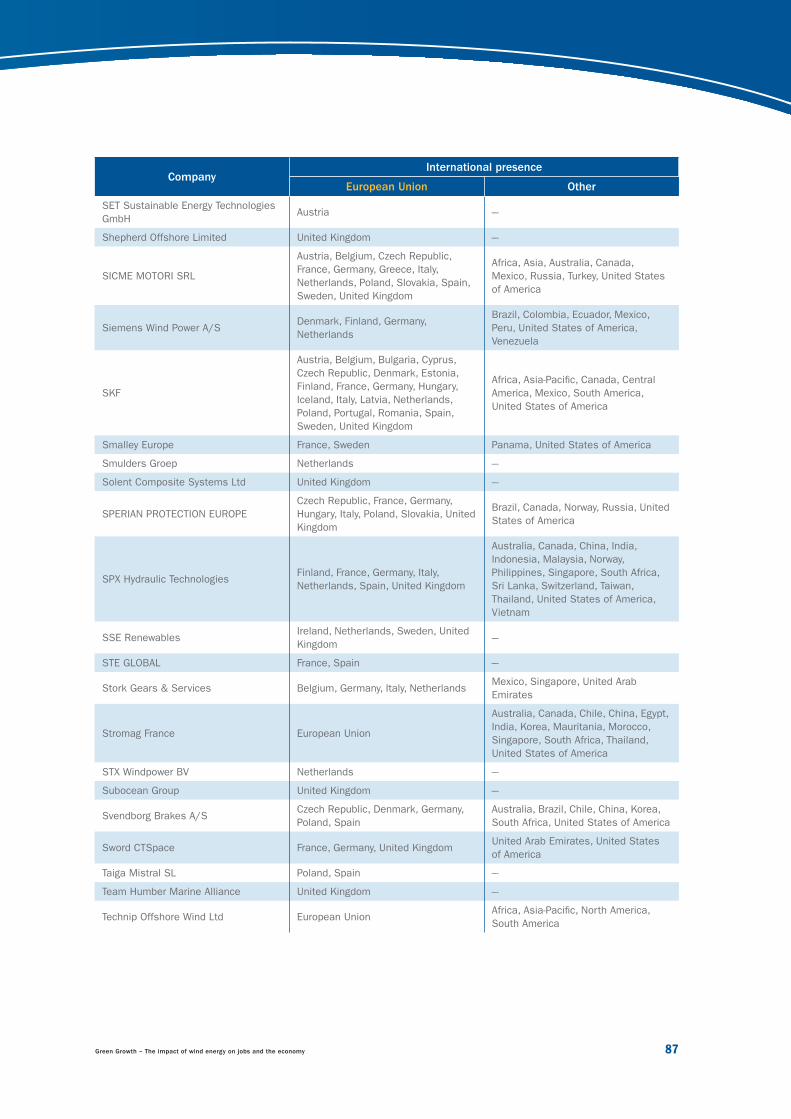
Green Growth – The impact of wind energy on jobs and the economy 87
CompanyInternational presence
European Union Other
SET Sustainable Energy Technologies
GmbHAustria ---
Shepherd Offshore Limited United Kingdom ---
SICME MOTORI SRL
Austria, Belgium, Czech Republic,
France, Germany, Greece, Italy,
Netherlands, Poland, Slovakia, Spain,
Sweden, United Kingdom
Africa, Asia, Australia, Canada,
Mexico, Russia, Turkey, United States
of America
Siemens Wind Power A/SDenmark, Finland, Germany,
Netherlands
Brazil, Colombia, Ecuador, Mexico,
Peru, United States of America,
Venezuela
SKF
Austria, Belgium, Bulgaria, Cyprus,
Czech Republic, Denmark, Estonia,
Finland, France, Germany, Hungary,
Iceland, Italy, Latvia, Netherlands,
Poland, Portugal, Romania, Spain,
Sweden, United Kingdom
Africa, Asia-Pacifi c, Canada, Central
America, Mexico, South America,
United States of America
Smalley Europe France, Sweden Panama, United States of America
Smulders Groep Netherlands ---
Solent Composite Systems Ltd United Kingdom ---
SPERIAN PROTECTION EUROPE
Czech Republic, France, Germany,
Hungary, Italy, Poland, Slovakia, United
Kingdom
Brazil, Canada, Norway, Russia, United
States of America
SPX Hydraulic TechnologiesFinland, France, Germany, Italy,
Netherlands, Spain, United Kingdom
Australia, Canada, China, India,
Indonesia, Malaysia, Norway,
Philippines, Singapore, South Africa,
Sri Lanka, Switzerland, Taiwan,
Thailand, United States of America,
Vietnam
SSE RenewablesIreland, Netherlands, Sweden, United
Kingdom---
STE GLOBAL France, Spain ---
Stork Gears & Services Belgium, Germany, Italy, NetherlandsMexico, Singapore, United Arab
Emirates
Stromag France European Union
Australia, Canada, Chile, China, Egypt,
India, Korea, Mauritania, Morocco,
Singapore, South Africa, Thailand,
United States of America
STX Windpower BV Netherlands ---
Subocean Group United Kingdom ---
Svendborg Brakes A/SCzech Republic, Denmark, Germany,
Poland, Spain
Australia, Brazil, Chile, China, Korea,
South Africa, United States of America
Sword CTSpace France, Germany, United KingdomUnited Arab Emirates, United States
of America
Taiga Mistral SL Poland, Spain ---
Team Humber Marine Alliance United Kingdom ---
Technip Offshore Wind Ltd European UnionAfrica, Asia-Pacifi c, North America,
South America
23799_EWEA_2012.indd 8723799_EWEA_2012.indd 87 28/03/12 17:2628/03/12 17:26
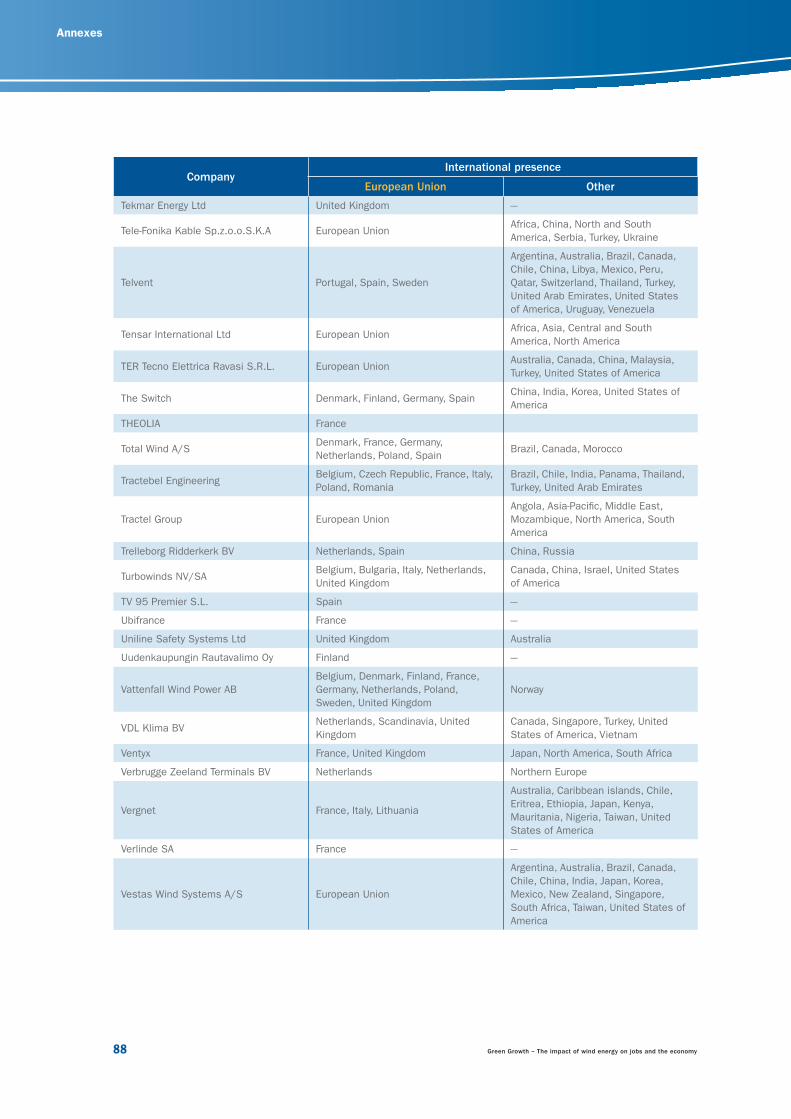
Chapter 8: Annexes
88 Green Growth – The impact of wind energy on jobs and the economy
Annexes
CompanyInternational presence
European Union Other
Tekmar Energy Ltd United Kingdom ---
Tele-Fonika Kable Sp.z.o.o.S.K.A European UnionAfrica, China, North and South
America, Serbia, Turkey, Ukraine
Telvent Portugal, Spain, Sweden
Argentina, Australia, Brazil, Canada,
Chile, China, Libya, Mexico, Peru,
Qatar, Switzerland, Thailand, Turkey,
United Arab Emirates, United States
of America, Uruguay, Venezuela
Tensar International Ltd European UnionAfrica, Asia, Central and South
America, North America
TER Tecno Elettrica Ravasi S.R.L. European UnionAustralia, Canada, China, Malaysia,
Turkey, United States of America
The Switch Denmark, Finland, Germany, SpainChina, India, Korea, United States of
America
THEOLIA France
Total Wind A/SDenmark, France, Germany,
Netherlands, Poland, SpainBrazil, Canada, Morocco
Tractebel EngineeringBelgium, Czech Republic, France, Italy,
Poland, Romania
Brazil, Chile, India, Panama, Thailand,
Turkey, United Arab Emirates
Tractel Group European Union
Angola, Asia-Pacifi c, Middle East,
Mozambique, North America, South
America
Trelleborg Ridderkerk BV Netherlands, Spain China, Russia
Turbowinds NV/SABelgium, Bulgaria, Italy, Netherlands,
United Kingdom
Canada, China, Israel, United States
of America
TV 95 Premier S.L. Spain ---
Ubifrance France ---
Uniline Safety Systems Ltd United Kingdom Australia
Uudenkaupungin Rautavalimo Oy Finland ---
Vattenfall Wind Power AB
Belgium, Denmark, Finland, France,
Germany, Netherlands, Poland,
Sweden, United Kingdom
Norway
VDL Klima BVNetherlands, Scandinavia, United
Kingdom
Canada, Singapore, Turkey, United
States of America, Vietnam
Ventyx France, United Kingdom Japan, North America, South Africa
Verbrugge Zeeland Terminals BV Netherlands Northern Europe
Vergnet France, Italy, Lithuania
Australia, Caribbean islands, Chile,
Eritrea, Ethiopia, Japan, Kenya,
Mauritania, Nigeria, Taiwan, United
States of America
Verlinde SA France ---
Vestas Wind Systems A/S European Union
Argentina, Australia, Brazil, Canada,
Chile, China, India, Japan, Korea,
Mexico, New Zealand, Singapore,
South Africa, Taiwan, United States of
America
23799_EWEA_2012.indd 8823799_EWEA_2012.indd 88 28/03/12 17:2628/03/12 17:26
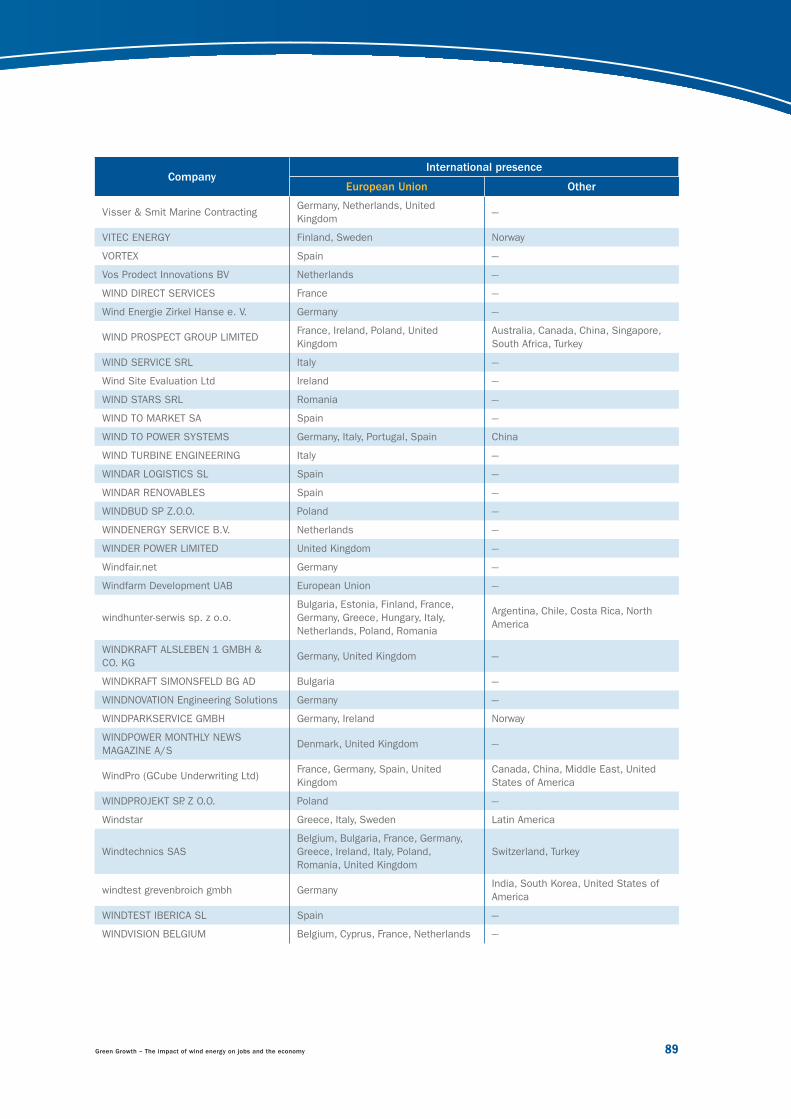
Green Growth – The impact of wind energy on jobs and the economy 89
CompanyInternational presence
European Union Other
Visser & Smit Marine ContractingGermany, Netherlands, United
Kingdom---
VITEC ENERGY Finland, Sweden Norway
VORTEX Spain ---
Vos Prodect Innovations BV Netherlands ---
WIND DIRECT SERVICES France ---
Wind Energie Zirkel Hanse e. V. Germany ---
WIND PROSPECT GROUP LIMITEDFrance, Ireland, Poland, United
Kingdom
Australia, Canada, China, Singapore,
South Africa, Turkey
WIND SERVICE SRL Italy ---
Wind Site Evaluation Ltd Ireland ---
WIND STARS SRL Romania ---
WIND TO MARKET SA Spain ---
WIND TO POWER SYSTEMS Germany, Italy, Portugal, Spain China
WIND TURBINE ENGINEERING Italy ---
WINDAR LOGISTICS SL Spain ---
WINDAR RENOVABLES Spain ---
WINDBUD SP Z.O.O. Poland ---
WINDENERGY SERVICE B.V. Netherlands ---
WINDER POWER LIMITED United Kingdom ---
Windfair.net Germany ---
Windfarm Development UAB European Union ---
windhunter-serwis sp. z o.o.
Bulgaria, Estonia, Finland, France,
Germany, Greece, Hungary, Italy,
Netherlands, Poland, Romania
Argentina, Chile, Costa Rica, North
America
WINDKRAFT ALSLEBEN 1 GMBH &
CO. KGGermany, United Kingdom ---
WINDKRAFT SIMONSFELD BG AD Bulgaria ---
WINDNOVATION Engineering Solutions Germany ---
WINDPARKSERVICE GMBH Germany, Ireland Norway
WINDPOWER MONTHLY NEWS
MAGAZINE A/SDenmark, United Kingdom ---
WindPro (GCube Underwriting Ltd)France, Germany, Spain, United
Kingdom
Canada, China, Middle East, United
States of America
WINDPROJEKT SP. Z O.O. Poland ---
Windstar Greece, Italy, Sweden Latin America
Windtechnics SAS
Belgium, Bulgaria, France, Germany,
Greece, Ireland, Italy, Poland,
Romania, United Kingdom
Switzerland, Turkey
windtest grevenbroich gmbh GermanyIndia, South Korea, United States of
America
WINDTEST IBERICA SL Spain ---
WINDVISION BELGIUM Belgium, Cyprus, France, Netherlands ---
23799_EWEA_2012.indd 8923799_EWEA_2012.indd 89 28/03/12 17:2628/03/12 17:26
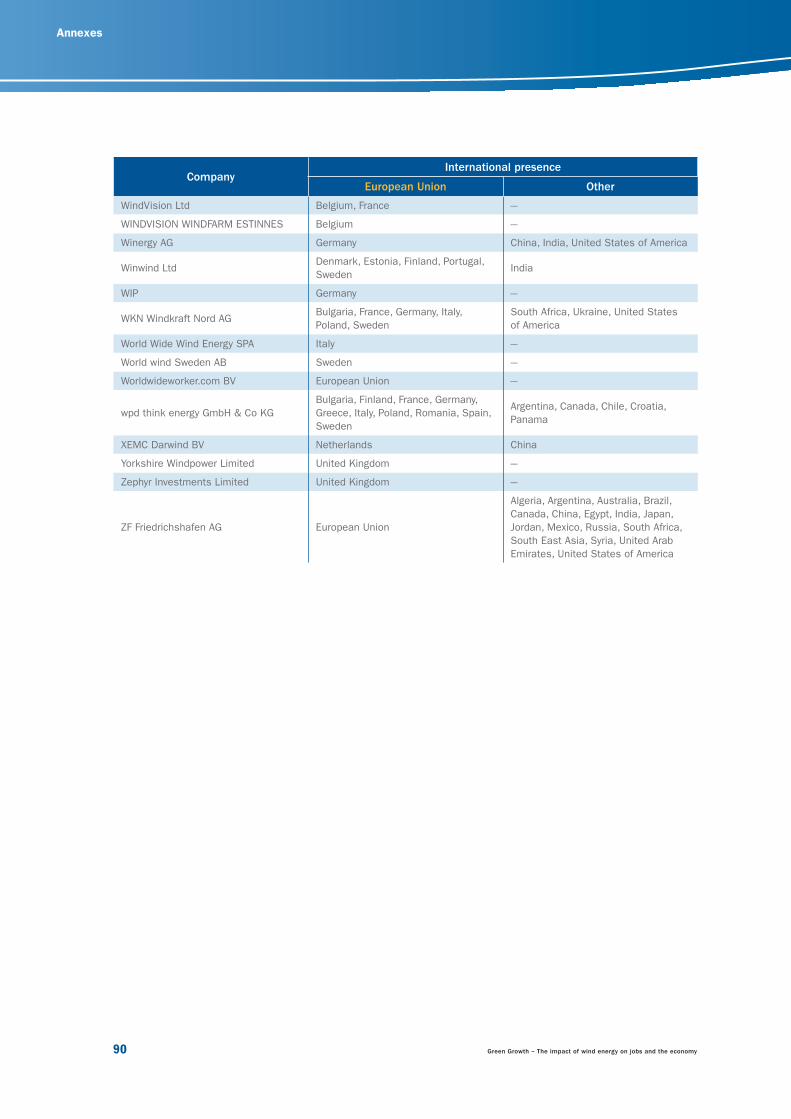
Chapter 8: Annexes
90 Green Growth – The impact of wind energy on jobs and the economy
Annexes
CompanyInternational presence
European Union Other
WindVision Ltd Belgium, France ---
WINDVISION WINDFARM ESTINNES Belgium ---
Winergy AG Germany China, India, United States of America
Winwind LtdDenmark, Estonia, Finland, Portugal,
SwedenIndia
WIP Germany ---
WKN Windkraft Nord AGBulgaria, France, Germany, Italy,
Poland, Sweden
South Africa, Ukraine, United States
of America
World Wide Wind Energy SPA Italy ---
World wind Sweden AB Sweden ---
Worldwideworker.com BV European Union ---
wpd think energy GmbH & Co KG
Bulgaria, Finland, France, Germany,
Greece, Italy, Poland, Romania, Spain,
Sweden
Argentina, Canada, Chile, Croatia,
Panama
XEMC Darwind BV Netherlands China
Yorkshire Windpower Limited United Kingdom ---
Zephyr Investments Limited United Kingdom ---
ZF Friedrichshafen AG European Union
Algeria, Argentina, Australia, Brazil,
Canada, China, Egypt, India, Japan,
Jordan, Mexico, Russia, South Africa,
South East Asia, Syria, United Arab
Emirates, United States of America
23799_EWEA_2012.indd 9023799_EWEA_2012.indd 90 28/03/12 17:2628/03/12 17:26
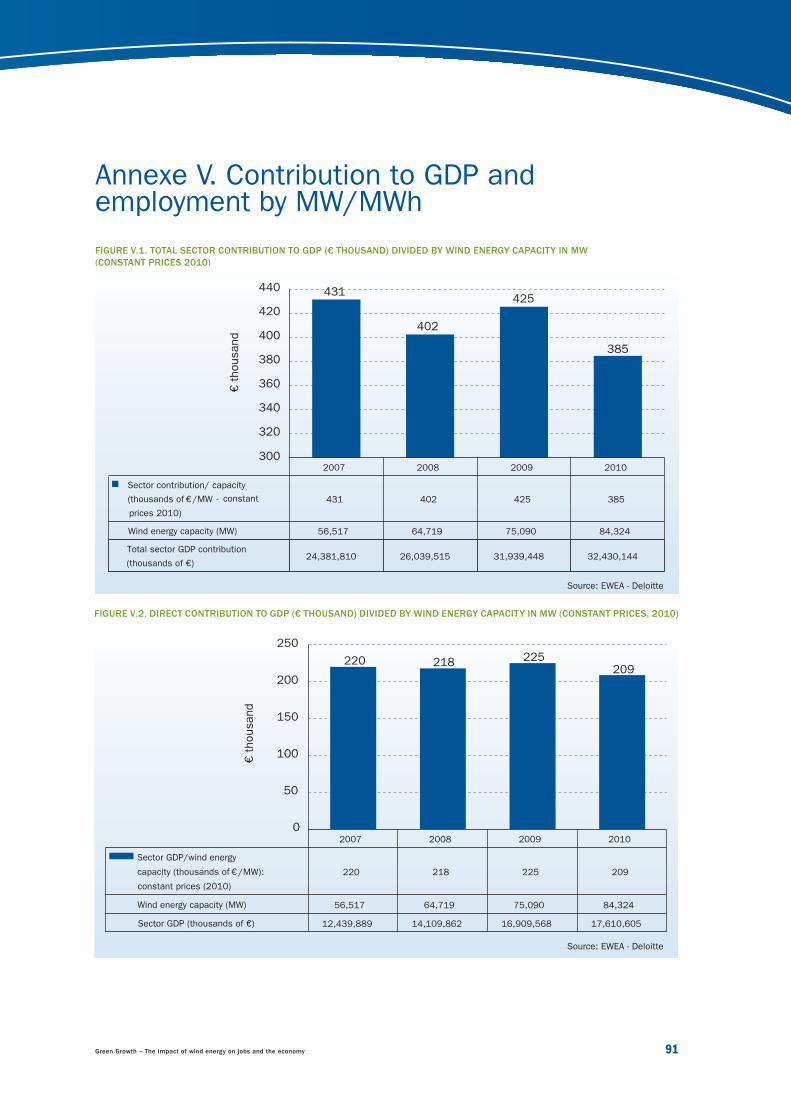
Green Growth – The impact of wind energy on jobs and the economy 91
Annexe V. Contribution to GDP and employment by MW/MWh
FIGURE V.1. TOTAL SECTOR CONTRIBUTION TO GDP (€ THOUSAND) DIVIDED BY WIND ENERGY CAPACITY IN MW
(CONSTANT PRICES 2010)
2007 2008 2009 2010
Sector contribution/ capacity
(thousands of €/MW - constant
prices 2010)
431 402 425 385
Wind energy capacity (MW) 56,517 64,719 75,090 84,324
Total sector GDP contribution
(thousands of €) 24,381,810 26,039,515 31,939,448 32,430,144
300
320
340
360
380
400
420
440 431
402
425
385
€ t
housand
FIGURE V.2. DIRECT CONTRIBUTION TO GDP (€ THOUSAND) DIVIDED BY WIND ENERGY CAPACITY IN MW (CONSTANT PRICES, 2010)
2007 2008 2009 2010
Sector GDP/wind energy
capacity (thousands of €/MW):
constant prices (2010)
220 218 225 209
Wind energy capacity (MW) 56,517 64,719 75,090 84,324
Sector GDP (thousands of €) 12,439,889 14,109,862 16,909,568 17,610,605
50
0
100
150
200
250
220 218 225209
€ t
housand
Source: EWEA - Deloitte
Source: EWEA - Deloitte
23799_EWEA_2012.indd 9123799_EWEA_2012.indd 91 28/03/12 17:2628/03/12 17:26
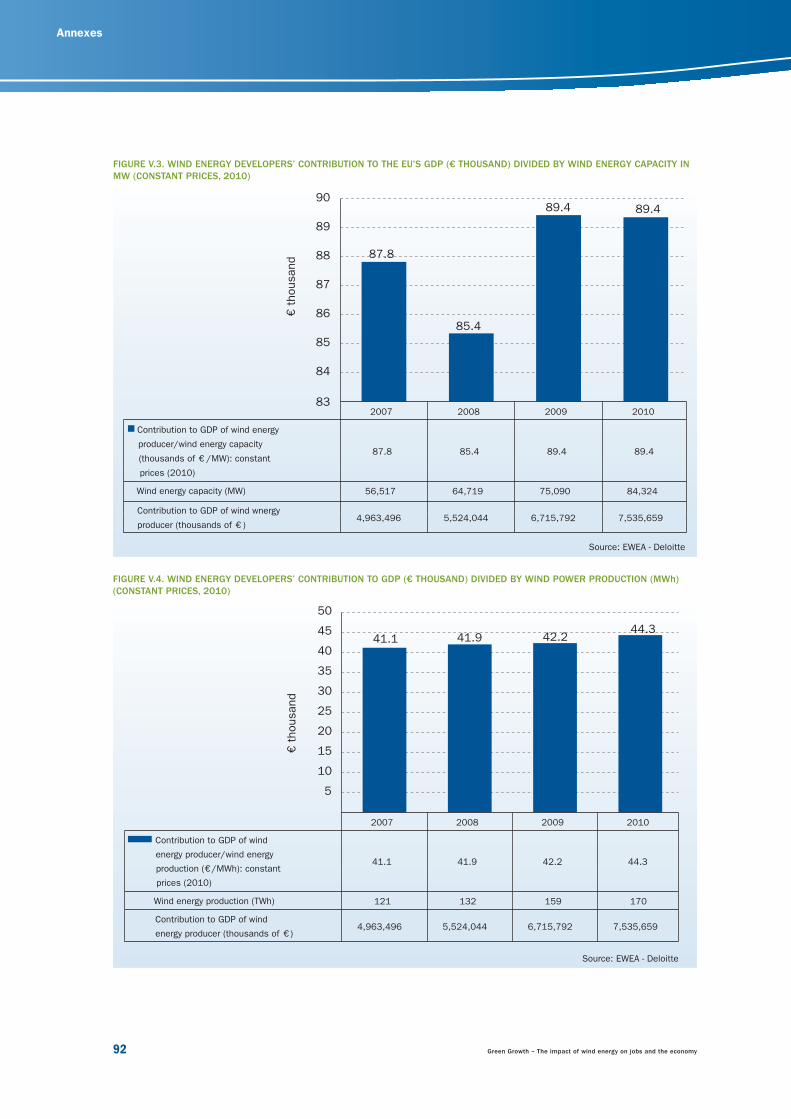
Chapter 8: Annexes
92 Green Growth – The impact of wind energy on jobs and the economy
Annexes
87.8
85.4
89.4 89.4
2007 2008 2009 2010
Contribution to GDP of wind energy
producer/wind energy capacity
(thousands of € /MW): constant
prices (2010)
87.8 85.4 89.4 89.4
Contribution to GDP of wind wnergy
producer (thousands of € )4,963,496 5,524,044 6,715,792 7,535,659
Wind energy capacity (MW) 56,517 64,719 75,090 84,324
83
84
85
86
87
88
89
90
€ t
housand
2007
41.1 41.9 42.244.3
2008 2009 2010
Contribution to GDP of wind
energy producer/wind energy
production (€/MWh): constant
prices (2010)
41.1 41.9 42.2 44.3
Wind energy production (TWh) 121 132 159 170
Contribution to GDP of wind
energy producer (thousands of € )4,963,496 5,524,044 6,715,792 7,535,659
5
10
15
20
25
30
35
40
45
50
€ t
housand
FIGURE V.3. WIND ENERGY DEVELOPERS’ CONTRIBUTION TO THE EU’S GDP (€ THOUSAND) DIVIDED BY WIND ENERGY CAPACITY IN
MW (CONSTANT PRICES, 2010)
FIGURE V.4. WIND ENERGY DEVELOPERS’ CONTRIBUTION TO GDP (€ THOUSAND) DIVIDED BY WIND POWER PRODUCTION (MWh)
(CONSTANT PRICES, 2010)
Source: EWEA - Deloitte
Source: EWEA - Deloitte
23799_EWEA_2012.indd 9223799_EWEA_2012.indd 92 28/03/12 17:2628/03/12 17:26
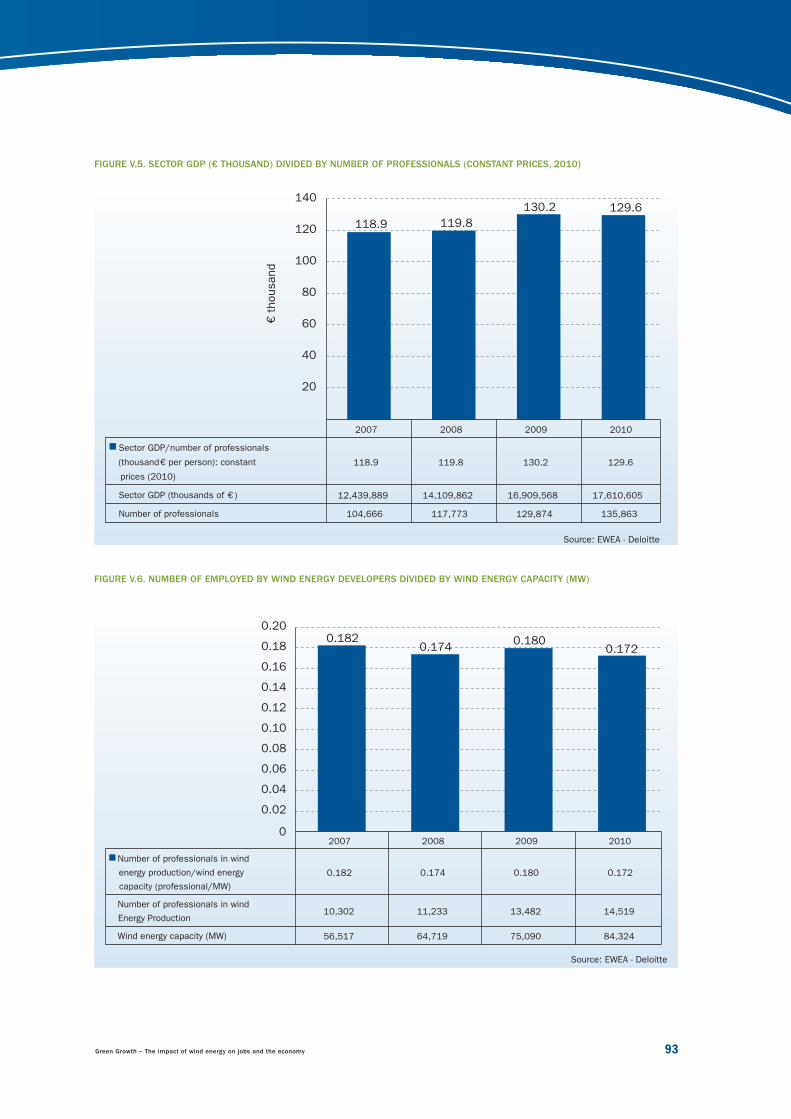
Green Growth – The impact of wind energy on jobs and the economy 93
2007 2008 2009 2010
Sector GDP/number of professionals
(thousand € per person): constant
prices (2010)
118.9 119.8 130.2 129.6
Sector GDP (thousands of € ) 12,439,889 14,109,862 16,909,568 17,610,605
Number of professionals 104,666 117,773 129,874 135,863
20
40
60
80
100
120
140
118.9 119.8
130.2 129.6
€ t
housand
2007 2008 2009 2010
Number of professionals in wind
energy production/wind energy
capacity (professional/MW)
0.182 0.174 0.180 0.172
Number of professionals in wind
Energy Production10,302 11,233 13,482 14,519
Wind energy capacity (MW) 56,517 64,719 75,090 84,324
0
0.02
0.04
0.06
0.08
0.10
0.12
0.14
0.16
0.18
0.200.182
0.1740.180
0.172
FIGURE V.5. SECTOR GDP (€ THOUSAND) DIVIDED BY NUMBER OF PROFESSIONALS (CONSTANT PRICES, 2010)
FIGURE V.6. NUMBER OF EMPLOYED BY WIND ENERGY DEVELOPERS DIVIDED BY WIND ENERGY CAPACITY (MW)
Source: EWEA - Deloitte
Source: EWEA - Deloitte
23799_EWEA_2012.indd 9323799_EWEA_2012.indd 93 28/03/12 17:2628/03/12 17:26
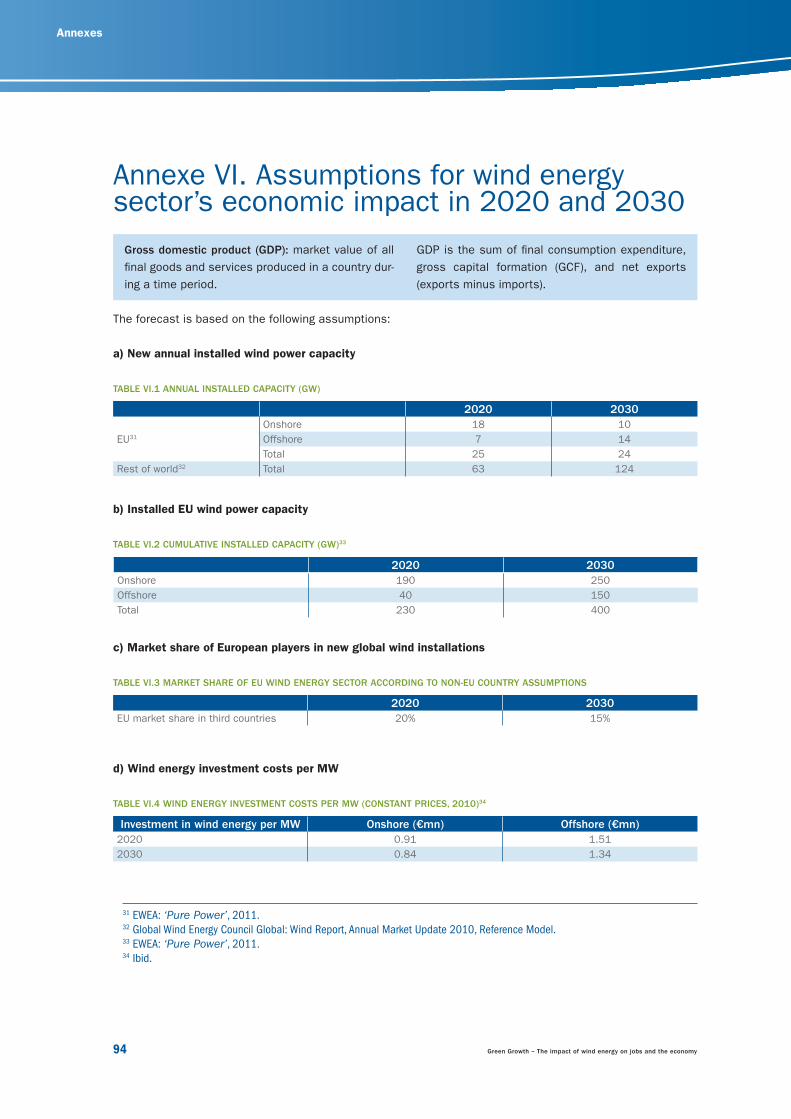
Chapter 8: Annexes
94 Green Growth – The impact of wind energy on jobs and the economy
Annexes
Gross domestic product (GDP): market value of all
fi nal goods and services produced in a country dur-
ing a time period.
Annexe VI. Assumptions for wind energy sector’s economic impact in 2020 and 2030
GDP is the sum of fi nal consumption expenditure,
gross capital formation (GCF), and net exports
(exports minus imports).
The forecast is based on the following assumptions:
a) New annual installed wind power capacity
TABLE VI.1 ANNUAL INSTALLED CAPACITY (GW)
2020 2030
Onshore 18 10
EU31 Offshore 7 14
Total 25 24
Rest of world32 Total 63 124
b) Installed EU wind power capacity
TABLE VI.2 CUMULATIVE INSTALLED CAPACITY (GW)33
2020 2030
Onshore 190 250
Offshore 40 150
Total 230 400
c) Market share of European players in new global wind installations
TABLE VI.3 MARKET SHARE OF EU WIND ENERGY SECTOR ACCORDING TO NON-EU COUNTRY ASSUMPTIONS
2020 2030
EU market share in third countries 20% 15%
d) Wind energy investment costs per MW
TABLE VI.4 WIND ENERGY INVESTMENT COSTS PER MW (CONSTANT PRICES, 2010)34
Investment in wind energy per MW Onshore (€mn) Offshore (€mn)
2020 0.91 1.51
2030 0.84 1.34
31 EWEA: ‘Pure Power’, 2011. 32 Global Wind Energy Council Global: Wind Report, Annual Market Update 2010, Reference Model.33 EWEA: ‘Pure Power’, 2011.34 Ibid.
23799_EWEA_2012.indd 9423799_EWEA_2012.indd 94 28/03/12 17:2628/03/12 17:26
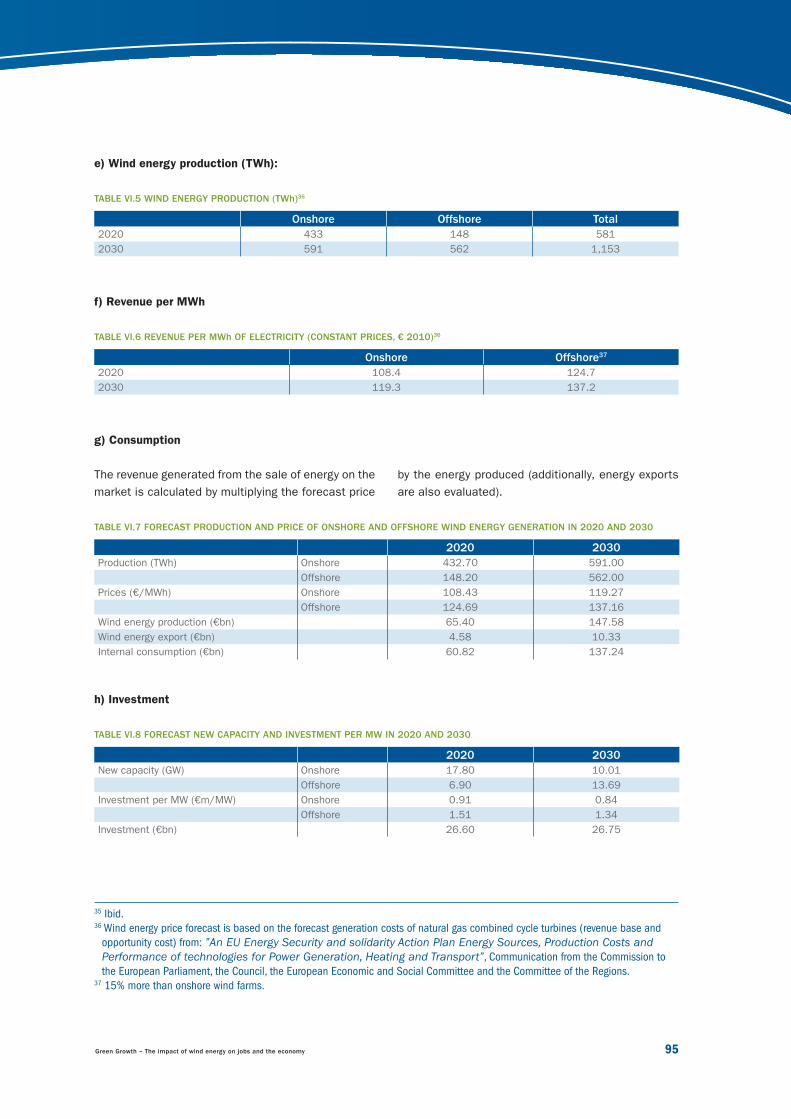
Green Growth – The impact of wind energy on jobs and the economy 95
e) Wind energy production (TWh):
TABLE VI.5 WIND ENERGY PRODUCTION (TWh)35
Onshore Offshore Total
2020 433 148 581
2030 591 562 1,153
f) Revenue per MWh
TABLE VI.6 REVENUE PER MWh OF ELECTRICITY (CONSTANT PRICES, € 2010)36
Onshore Offshore37
2020 108.4 124.7
2030 119.3 137.2
g) Consumption
The revenue generated from the sale of energy on the
market is calculated by multiplying the forecast price
by the energy produced (additionally, energy exports
are also evaluated).
TABLE VI.7 FORECAST PRODUCTION AND PRICE OF ONSHORE AND OFFSHORE WIND ENERGY GENERATION IN 2020 AND 2030
2020 2030
Production (TWh) Onshore 432.70 591.00
Offshore 148.20 562.00
Prices (€/MWh) Onshore 108.43 119.27
Offshore 124.69 137.16
Wind energy production (€bn) 65.40 147.58
Wind energy export (€bn) 4.58 10.33
Internal consumption (€bn) 60.82 137.24
h) Investment
TABLE VI.8 FORECAST NEW CAPACITY AND INVESTMENT PER MW IN 2020 AND 2030
2020 2030
New capacity (GW) Onshore 17.80 10.01
Offshore 6.90 13.69
Investment per MW (€m/MW) Onshore 0.91 0.84
Offshore 1.51 1.34
Investment (€bn) 26.60 26.75
35 Ibid. 36 Wind energy price forecast is based on the forecast generation costs of natural gas combined cycle turbines (revenue base and
opportunity cost) from: ”An EU Energy Security and solidarity Action Plan Energy Sources, Production Costs and
Performance of technologies for Power Generation, Heating and Transport”, Communication from the Commission to
the European Parliament, the Council, the European Economic and Social Committee and the Committee of the Regions.37 15% more than onshore wind farms.
23799_EWEA_2012.indd 9523799_EWEA_2012.indd 95 28/03/12 17:2628/03/12 17:26
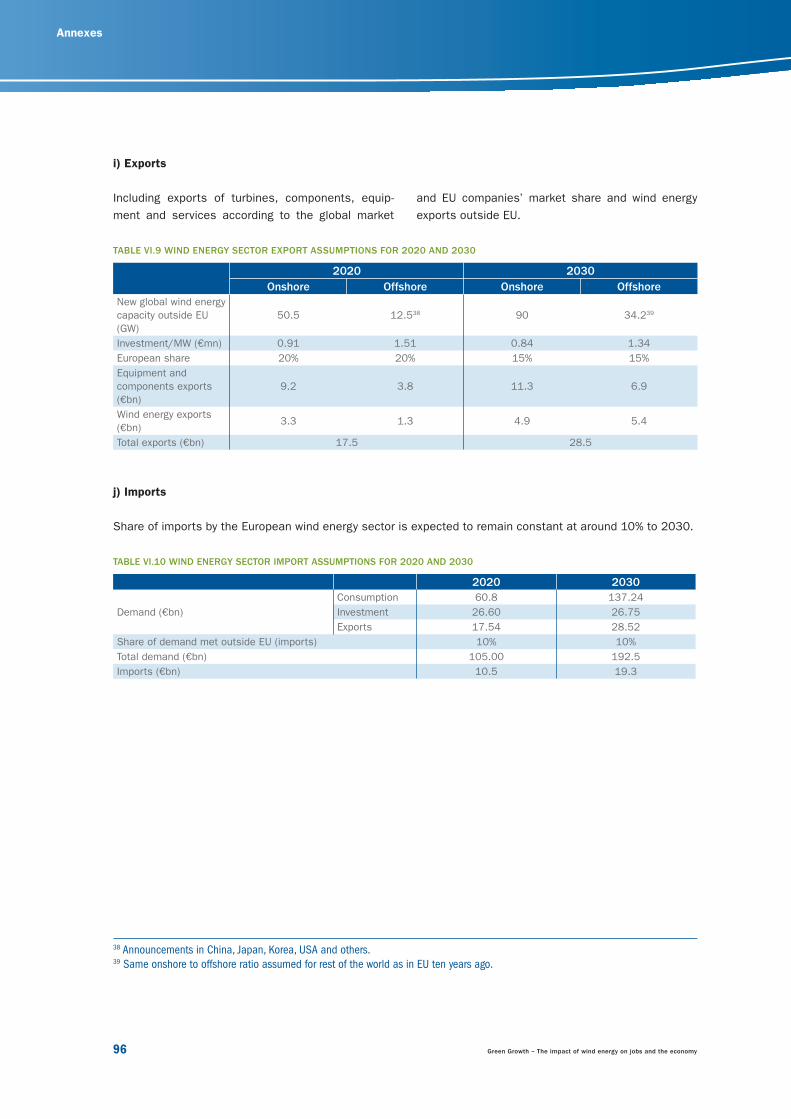
Chapter 8: Annexes
96 Green Growth – The impact of wind energy on jobs and the economy
Annexes
i) Exports
Including exports of turbines, components, equip-
ment and services according to the global market
and EU companies’ market share and wind energy
exports outside EU.
TABLE VI.9 WIND ENERGY SECTOR EXPORT ASSUMPTIONS FOR 2020 AND 2030
2020 2030
Onshore Offshore Onshore Offshore
New global wind energy
capacity outside EU
(GW)
50.5 12.538 90 34.239
Investment/MW (€mn) 0.91 1.51 0.84 1.34
European share 20% 20% 15% 15%
Equipment and
components exports
(€bn)
9.2 3.8 11.3 6.9
Wind energy exports
(€bn)3.3 1.3 4.9 5.4
Total exports (€bn) 17.5 28.5
j) Imports
Share of imports by the European wind energy sector is expected to remain constant at around 10% to 2030.
TABLE VI.10 WIND ENERGY SECTOR IMPORT ASSUMPTIONS FOR 2020 AND 2030
2020 2030
Demand (€bn)
Consumption 60.8 137.24
Investment 26.60 26.75
Exports 17.54 28.52
Share of demand met outside EU (imports) 10% 10%
Total demand (€bn) 105.00 192.5
Imports (€bn) 10.5 19.3
38 Announcements in China, Japan, Korea, USA and others.39 Same onshore to offshore ratio assumed for rest of the world as in EU ten years ago.
23799_EWEA_2012.indd 9623799_EWEA_2012.indd 96 28/03/12 17:2628/03/12 17:26
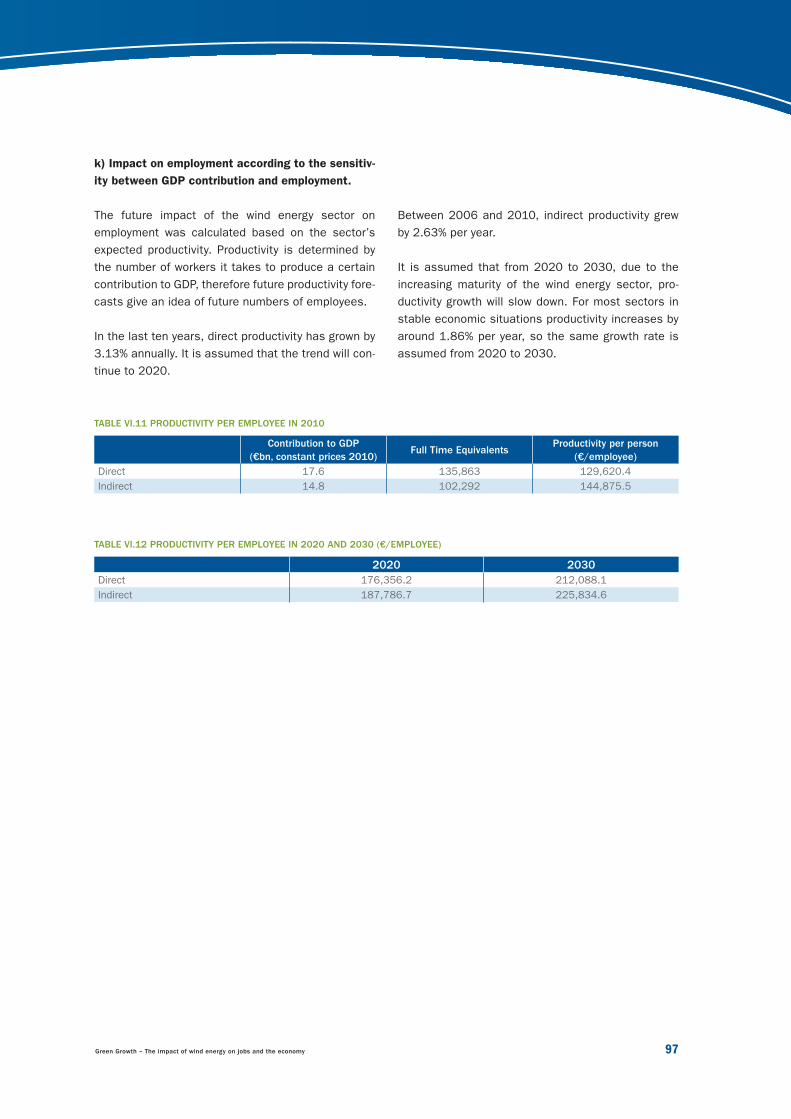
Green Growth – The impact of wind energy on jobs and the economy 97
k) Impact on employment according to the sensitiv-
ity between GDP contribution and employment.
The future impact of the wind energy sector on
employment was calculated based on the sector’s
expected productivity. Productivity is determined by
the number of workers it takes to produce a certain
contribution to GDP, therefore future productivity fore-
casts give an idea of future numbers of employees.
In the last ten years, direct productivity has grown by
3.13% annually. It is assumed that the trend will con-
tinue to 2020.
Between 2006 and 2010, indirect productivity grew
by 2.63% per year.
It is assumed that from 2020 to 2030, due to the
increasing maturity of the wind energy sector, pro-
ductivity growth will slow down. For most sectors in
stable economic situations productivity increases by
around 1.86% per year, so the same growth rate is
assumed from 2020 to 2030.
TABLE VI.11 PRODUCTIVITY PER EMPLOYEE IN 2010
Contribution to GDP
(€bn, constant prices 2010)Full Time Equivalents
Productivity per person
(€/employee)
Direct 17.6 135,863 129,620.4
Indirect 14.8 102,292 144,875.5
TABLE VI.12 PRODUCTIVITY PER EMPLOYEE IN 2020 AND 2030 (€/EMPLOYEE)
2020 2030
Direct 176,356.2 212,088.1
Indirect 187,786.7 225,834.6
23799_EWEA_2012.indd 9723799_EWEA_2012.indd 97 28/03/12 17:2628/03/12 17:26
Chapter 8: Annexes
98 Green Growth – The impact of wind energy on jobs and the economy
Annexes
For more information about Deloitte, please visit www.deloitte.es
Deloitte provides audit, tax and legal advisory, consulting and corporate transaction services to companies
operating in a wide range of industries. The fi rm contributes its experience and outstanding professionalism
in helping clients to achieve their business goals anywhere in the world. To achieve this it has the support of a
worldwide network of member fi rms present in more than 140 countries and with more than 168,000 profes-
sionals committed to being a model of excellence.
Deloitte’s professionals share a common culture of cooperation based on mutual commitment, integrity, and
the contribution of value to the market and the fi rm’s clients, based on the richness intrinsic to this cultural
diversity and the ongoing learning process generated by new experiences and challenges, which in turn con-
tribute to the development of their professional career. Deloitte’s professionals help to comply with the fi rm’s
responsibilities, inspiring market confi dence and making a positive impact on its stakeholders.
Deloitte refers to one or more of Deloitte Touche Tohmatsu, a Swiss Verein, and its network of member fi rms,
each of which is a legally separate and independent entity. Please see www.deloitte.com/about for a detailed
description of the legal structure of Deloitte Touche Tohmatsu and its member fi rms.
This document has been drawn up from spread information, available to the general public and methodologies
generally accepted. Deloitte accepts no responsibility or liability towards the European Wind Energy Association
(EWEA) or any third party that would have access to the present document and consequently could take harmful
decisions or actions without Deloitte s knowledge.
© 2011 Deloitte S.L. Member of Deloitte Touche Tohmatsu.
23799_EWEA_2012.indd 9823799_EWEA_2012.indd 98 28/03/12 17:2628/03/12 17:26
Gre
en G
row
thEW
EA
53520-1203-1010
www.ewea.org
The impact of wind energy on jobs and the economy
A report by the European Wind Energy Association - April 2012
Green GrowthAbout EWEAEWEA is the voice of the wind industry, actively promoting wind power in Europe and worldwide. It has over 700 members from almost 60 countries, including wind turbine manufacturers with a leading share of the world wind power market, plus component suppliers, research institutes, national wind and renewables associations, developers, contractors, electricity providers, fi nance and insurance companies, and consultants. This combined strength makes EWEA the world’s largest and most powerful wind energy network.
Rue d’Arlon 80 | B-1040 BrusselsTel: +32 2 213 18 11 - Fax: +32 2 213 18 90E-mail: [email protected]
ISBN 978 - 2 - 930670 - 00 - 3
23799_EWEA_2012 Cover_corrections2.indd 1 28/03/12 15:57