Embed Size (px)
Citation preview
12 13
06 07 08
09 10
11Green growth in the Netherlands
Green growth in the Netherlands
Explanation of symbols
. data not available* provisional figure** revised provisional figurex publication prohibited (confidential figure)– nil or less than half of unit concerned– (between two figures) inclusive0 (0,0) less than half of unit concernedniets (blank) not applicable2009–2010 2009 to 2010 inclusive2009/2010 average of 2009 up and including 20102009/’10 crop year, financial year, school year etc. beginning in 2009 and ending in 20101999/’00– 2009/’10 crop year, financial year, etc. 1999/’00 to 2009/’10 inclusive
As a result of rounding, some totals may not correspond with the sum of the separate figures.
Colofon
PublisherStatistics Netherlands Henri Faasdreef 312 2492 JP The Hague
PrepressStatistics Netherlands Grafimedia
Printed byOBT bv, The Hague
CoverTelDesign, Rotterdam
InformationTelephone +31 88 570 70 70 Telefax +31 70 337 59 94 Via contact form: www.cbs.nl/infoservice
Where to orderE-mail: [email protected] Telefax +31 45 570 62 68
Internet www.cbs.nl
Price: € 15.10 (excluding postage) ISBN: 978-90-357-2030-5 Print run: 100 copies
© Statistics Netherlands, The Hague/Heerlen, 2011. Reproduction is permitted. ‘Statistics Netherlands’ must be quoted as source.
60227 201101 P-44
Green growth in the Netherlands 3
ForewordIn industrialised societies, economic growth has had a substantial impact on the environment and on stocks of natural resources. In acknowledgement of this, in 2009 the Ministerial Council Meeting of the Organisation for Economic Co-operation and Development (OECD) committed itself to a green growth strategy. It aims to provide a policy strategy to implement this economic transformation, as well as a monitoring framework of relevant indicators.
In this report, Statistics Netherlands gives an overview of green growth in the Netherlands. It presents the available data for twenty of the thirty indicators proposed by the OECD, and may serve as a benchmark, as well as a starting point for further discussion.
The main conclusion of the report is that the environmental efficiency of production in the Netherlands has improved. For example, water use intensity has fallen by 46 percent since 1990; nitrogen and phosphorus surpluses in agriculture have decreased by 53 and 77 percent since 1970. And although greenhouse gas emissions and consumption of materials for produc-tion have increased, they have done so at a slower rate than economic growth.
The indicators on stocks of natural resources, policy responses and economic opportunities show a contradictory picture. On the one hand, stocks of natural gas have declined, but on the other the volume of standing timber has increased. And while green jobs and green patents account for a larger share of the labour market and innovations, investments in green capital goods are below the level of the mid-1990s.
The report is the result of our participation in a working group aimed at translating the OECD framework to the Dutch situation, and at providing feedback on the international strategy. Under the direction of the Ministry of Infrastructure and the Environment, the working group further consists of representatives from the Ministries of Finance and of Economic Affairs, Agriculture and Innovation, the Netherlands Environmental Assessment Agency, the Dutch Permanent Representation at the OECD and Statistics Netherlands. We would like to thank our partners from the Dutch working group on green growth for their support in the preparation of this report.
Director General of Statistics NetherlandsG. van der Veen, May 2011
Heerlen/The Hague

Green growth in the Netherlands 5
SummaryIn 2009 the Ministerial Council Meeting of the Organisation for Economic Co-operation and Development (OECD) committed itself to a green growth strategy. Such a strategy fosters economic growth and development while ensuring that natural resources can continue to provide the ecosystem services on which our well-being relies. It also endorses investment, competition and innovation which will underpin sustained growth and give rise to new economic opportunities (OECD, 2011c). Green growth provides both a policy strategy for implementing this economic transformation and a monitoring framework with a proposed set of indicators.
This report presents an overview of the state of green growth in the Netherlands. It should be regarded as a benchmark for a more thorough and comprehensive assessment of green growth in the future. It is based on the set of indicators proposed by the OECD in their intermediate report of February 2011. Data relevant to the Dutch situation are presented for twenty of these indicators, illustrating the observed trends.
The indicators are grouped in four themes. For the first theme, environmental efficiency of production, on the whole the indicators show increased efficiency. However, indicators such as greenhouse gas intensity, energy efficiency and material intensity show only relative decoupling, which on its own is not enough to ensure green growth. In addition, the increase in environmental efficiency is partly explained by substitution of imports for domestic produc-tion, which is not conducive to green growth on a global scale: the efficiency gains in domestic production, for example, are offset by increases in foreign greenhouse gas emissions. Water use and agricultural nutrient surpluses are the only indicators where absolute decoupling has occur red.
The second theme contains indicators regarding the natural assets base. This group of indica-tors provides a mixed picture. Natural gas reserves are decreasing and the overall level of threat to animal species has increased. On the other hand, forests (standing timber) have increased.
For the third theme, environmental quality of life, more indicators need to be developed. The only available indicator is the one on pollution induced health problems, which shows a slightly positive trend.
The number of green patents, green jobs, and the share of green taxes are all increasing. We note, however, that it is difficult to interpret the relevance of these indicators on policy responses and economic opportunities in relation to green growth, which constitute the fourth theme of our report.

Green growth in the Netherlands 7
Contents
Foreword 3 Summary 5
1. Anintroductiontogreengrowth 11
2. Indicatorsofenvironmentalefficiency 19 2.1 Production-basedgreenhousegasintensity 20 2.2 Consumption-basedgreenhousegasemissions 21 2.3 Energyefficiency 22 2.4 Renewableenergy 23 2.5 Nutrientsurpluses 24 2.6 Materialintensity 25 2.7 Wateruseintensity 26 2.8 Wastetreatment 27
3. Indicatorsofthenaturalassetbase 31 3.1 Stocksoftimber 32 3.2 Fishinputs 33 3.3 Naturalgasreserves 34 3.4 Landconversionintobuilt-upland 35 3.5 Threatstobiodiversity 36
4. Indicatorsofenvironmentalqualityoflife 39 4.1 Pollutioninducedhealthproblems 40
5. Indicatorsofpolicyresponsesandeconomicopportunities 43 5.1 Greenpatents 44 5.2 Shareofgreentaxes 45 5.3 Energyprices 46 5.4 Carbonemissiontrading 47 5.5 Environmentalinvestment 48 5.6 Greenjobs 49
References 51 Contributorstothispublication 53


Green growth in the Netherlands 9
An introduction to green growth
1
Green growth in the Netherlands 11
Anintroductiontogreengrowth
1.1 Whygreengrowth?• Greengrowthandsustainabledevelopment• Monitoringgreengrowth• Selectingtheindicators• Presentationandpreliminaryscores
12 Statistics Netherlands
1.1 Why green growth?
Most economies have grown in the past decades. In addition to the benefits this has brought, economic growth has also had harmful side effects. On the one hand, fossil fuels and other natural resources that enable economic growth are becoming increasingly scarce, which might hamper future growth. On the other hand, there is substantial scientific evidence (Rockström et al., 2009; IPCC, 2007) that global critical boundaries such as climate change, water pollution and biodiversity losses have been exceeded. This has led to increasing international acknowledgement that urgent action is required.
It is also recognised that the cost of environmental change has long been disregarded. There have been recent efforts to express environmental change in monetary units (Stern Review, 2006). Also, the notion that our current measurement apparatus with its focus on GDP is too limited, and that GDP can no longer be taken as the single indicator of welfare, is leading to the conclusion that our measurement frame needs to be broadened (Stiglitz et al., 2007; European Commission, 2009). Especially since the recent economic, financial and food crises, many people have been rising to the challenge to change our “brown” economic model into a “green” one (UNEP, 2008; UNEP, 2010; OECD, 2008). “Green growth” provides in both a policy strategy for implementing this economic transformation as well as a monitoring framework with a proposed set of indicators.
In 2009 the Ministerial Council Meeting of the Organisation for Economic Co-operation and Development (OECD) committed itself to a green growth strategy. The primary outcome of this strategy will be specific tools and recommendations for governments to shift towards greener growth. The reports on green growth will be presented at the OECD Ministerial Coun-cil Meeting in May 2011, and will include sets of new tools and recommendations.
The present report presents an overview of the state of green growth in the Netherlands, using the set of indicators proposed by the OECD in February 2011. It gives a first impression of the data available for twenty of the thirty OECD indicators. It should be regarded as a point of departure for a more thorough and comprehensive assessment of green growth. The indica-tors are scored with respect to their trend towards green growth.
Greengrowthandsustainabledevelopment
According to the OECD green growth: “foster[s] economic growth and development while ensuring that the quality and quantity of natural assets can continue to provide the environ-mental services on which our well-being relies. It is also about fostering investment, competi-tion and innovation which will underpin sustained growth and give rise to new economic opportunities (OECD, 2011c).
Although the concepts of green growth and sustainable development interrelate, there are also clear differences. Within the umbrella concept of sustainable development, green growth focuses primarily on the economy-ecology nexus, and excludes the social domain. Whereas sustainable development has a long-term perspective for society, green growth has a shorter-
Green growth in the Netherlands 13
term orientation with a focus on analysing complementarities and policy instruments. Green growth aspires to provide a policy framework with concrete tools and recommendations to help the transformation into a more sustainable world.
Monitoringgreengrowth
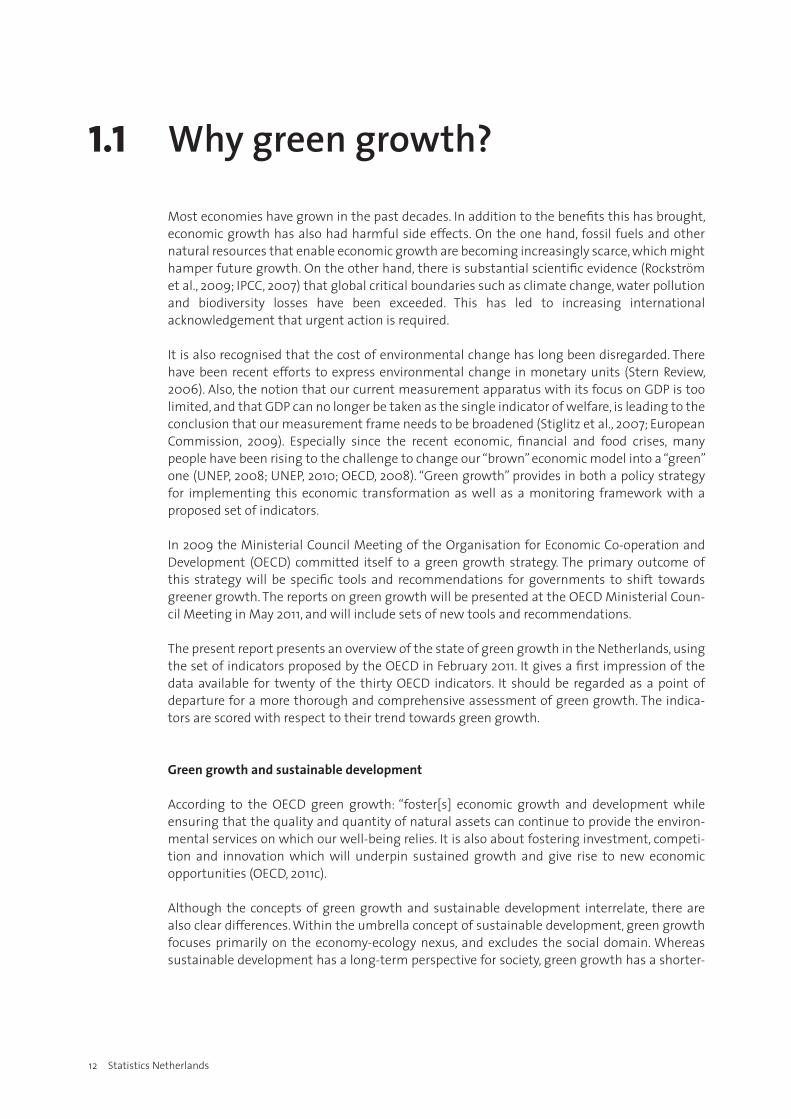
To keep track of the development of economies towards green growth, the OECD has developed a framework of four interrelated groups of indicators (OECD, 2011a):
i. indicators reflecting the environmental efficiency of production;ii. indicators of the natural asset base;iii. indicators monitoring the environmental quality of life;iv. indicators describing policy responses and economic opportunities.
Figure 1.1.1 shows how these groups of indicators interrelate. Economic production and growth depend on the environment for inputs of natural resources such as energy, water and basic materials, but also use it as a sink for outputs in the form of waste and emissions. Therefore, environmental efficiency and its evolution over time are central measures of green growth. En-vironmental efficiency is defined as the pressure caused by an economic activity (for example CO2 emissions) divided by the economic value added of that activity (for example GDP). Efficiency increases may coincide with displacement effects, for example if domestic produc-tion is replaced by imports. In view of globalising supply chains as well as the non-local nature of the problems at stake – global warming, worldwide biodiversity losses – it is essential to also include a ‘footprint’ type indicator here that estimates worldwide environmental pressure as a result of national consumption requirements.
1.1.1 Conceptual scheme of green growth indicators
Ecosystem services
Consumers:–households–governments
ii. Natural asset base
i. Efficiency of production and consumption
iii. Environmental quality of life (local and global)
iv. Policy responses and creating economic opportunities:–taxes–subsidies–innovation–investment
Ecosystem services
Natural resources
Pollutants, waste
Production:–industries–services
Source: Statistics Netherlands.
14 Statistics Netherlands
In addition to monitoring the relationship between environmental burden and economic growth, it is equally important to ensure that the burden does not exceed nature’s carrying capacity, to prevent irreversible quality losses of natural assets. It is in the interest of an econ-omy’s long-term stability to ensure it retains a healthy balance with its natural resource base. The natural asset base is monitored by way of stocks of renewable assets, like timber, and non-renewable assets such as fossil energy reserves, preferably in terms of quantity and quality.
As well as being a provider of resources and an absorber of pollution, the environment also provides ecosystem services such as recreation. Also, a less polluted local environment leads to a healthier population. There is thus a direct link between the environment and the popula-tion’s quality of life, which is captured in the third set of indicators.
A shift to green growth not only requires policy responses, it also opens up new opportunities. Governments can choose between several policy instruments such as taxes, subsidies and regulation to steer development in a preferred direction. Monitoring the extent and effects of these instruments is of great interest to policymakers. On the other hand, these measures will also create new opportunities for economic activities that may generate new jobs and stimu-late economic growth.
Selectingtheindicators
The OECD has identified thirty indicators to monitor green growth (OECD, 2011b)1). The present report has selected twenty of these based on relevance for the Dutch situation and availability. For instance, the OECD indicator access to sewage treatment and sanitation is not relevant for the Netherlands, as all households have access to these amenities, while two new relevant in-dicators are included: carbon emission trading and environmental investment. In addition, the definitions of the selected indicators may differ slightly from the OECD definitions, for the sake of statistical consistency and robustness. Most indicators are derived from the Dutch System of Environmental-Economic Accounting (SEEA) which provides a good measurement framework for green growth, as it integrates economic and environmental statistics. Other indicators come from a variety of sources.Each indicator is presented as a graph through time, accompanied by a number of main conclusions, and an explanation of the indicator’s relevance for green growth.
Presentationandpreliminaryscores
The selected indicators are assigned two scores: one with respect to the trend in greening growth, and one for identified policy targets.
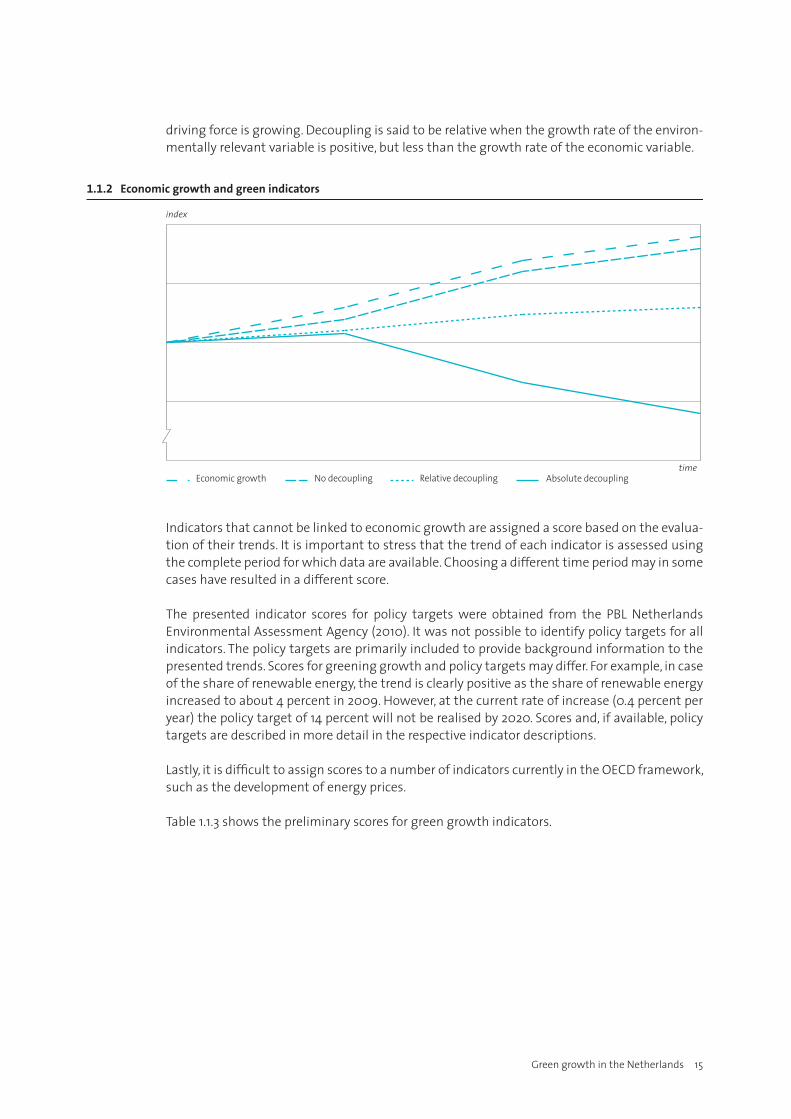
The first score is assigned according to the following criteria. The scores for environmental efficiency indicators are based on decoupling. Decoupling occurs when the growth rate of an indicator of environmental pressure is lower than the rate of economic growth in a given period. Decoupling can be either absolute or relative (see graph 1.1.2). Absolute decoupling occurs when the environmentally relevant variable is stable or decreasing, while the economic
1) TheindicatorsarebasedonthedraftreportMonitoringProgresstowardsGreenGrowthOECDindicators,disseminatedinFebruary2011(OECD2011b).
Green growth in the Netherlands 15
driving force is growing. Decoupling is said to be relative when the growth rate of the environ-mentally relevant variable is positive, but less than the growth rate of the economic variable.
Indicators that cannot be linked to economic growth are assigned a score based on the evalua-tion of their trends. It is important to stress that the trend of each indicator is assessed using the complete period for which data are available. Choosing a different time period may in some cases have resulted in a different score.
The presented indicator scores for policy targets were obtained from the PBL Netherlands Environmental Assessment Agency (2010). It was not possible to identify policy targets for all indicators. The policy targets are primarily included to provide background information to the presented trends. Scores for greening growth and policy targets may differ. For example, in case of the share of renewable energy, the trend is clearly positive as the share of renewable energy increased to about 4 percent in 2009. However, at the current rate of increase (0.4 percent per year) the policy target of 14 percent will not be realised by 2020. Scores and, if available, policy targets are described in more detail in the respective indicator descriptions.
Lastly, it is difficult to assign scores to a number of indicators currently in the OECD framework, such as the development of energy prices.
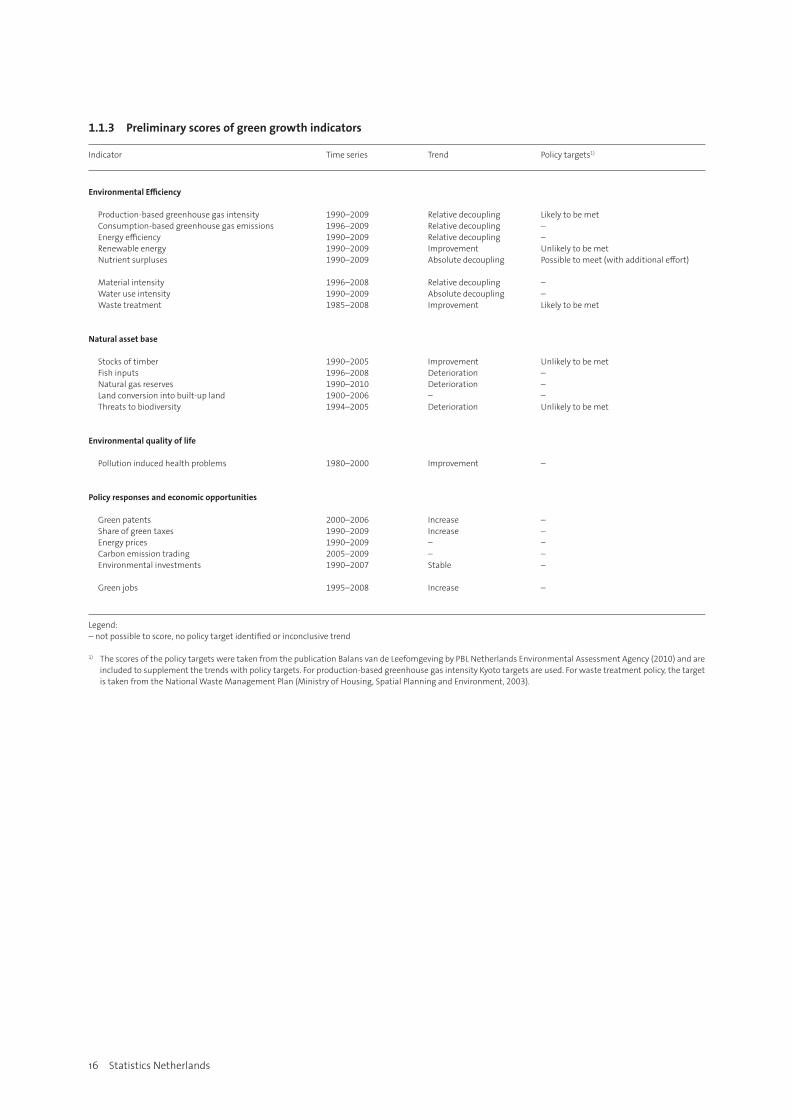
Table 1.1.3 shows the preliminary scores for green growth indicators.
1.1.2 Economic growth and green indicators
Absolute decouplingRelative decouplingNo decouplingEconomic growth
index
time
16 Statistics Netherlands
1.1.3 Preliminary scores of green growth indicators Indicator Timeseries Trend Policytargets1)
Environmental Efficiency
Production-basedgreenhousegasintensity 1990–2009 Relativedecoupling Likelytobemet Consumption-basedgreenhousegasemissions 1996–2009 Relativedecoupling – Energyefficiency 1990–2009 Relativedecoupling – Renewableenergy 1990–2009 Improvement Unlikelytobemet Nutrientsurpluses 1990–2009 Absolutedecoupling Possibletomeet(withadditionaleffort)
Materialintensity 1996–2008 Relativedecoupling – Wateruseintensity 1990–2009 Absolutedecoupling – Wastetreatment 1985–2008 Improvement Likelytobemet
Natural asset base
Stocksoftimber 1990–2005 Improvement Unlikelytobemet Fishinputs 1996–2008 Deterioration – Naturalgasreserves 1990–2010 Deterioration – Landconversionintobuilt-upland 1900–2006 – – Threatstobiodiversity 1994–2005 Deterioration Unlikelytobemet
Environmental quality of life
Pollutioninducedhealthproblems 1980–2000 Improvement –
Policy responses and economic opportunities
Greenpatents 2000–2006 Increase – Shareofgreentaxes 1990–2009 Increase – Energyprices 1990–2009 – – Carbonemissiontrading 2005–2009 – – Environmentalinvestments 1990–2007 Stable –
Greenjobs 1995–2008 Increase –
Legend:–notpossibletoscore,nopolicytargetidentifiedorinconclusivetrend
1) ThescoresofthepolicytargetsweretakenfromthepublicationBalansvandeLeefomgevingbyPBLNetherlandsEnvironmentalAssessmentAgency(2010)andareincludedtosupplementthetrendswithpolicytargets.Forproduction-basedgreenhousegasintensityKyototargetsareused.Forwastetreatmentpolicy,thetargetistakenfromtheNationalWasteManagementPlan(MinistryofHousing,SpatialPlanningandEnvironment,2003).
Green growth in the Netherlands 17
Indicators of environmental efficiency
2
Green growth in the Netherlands 19
Indicatorsofenvironmentalefficiency
2.1 Production-basedgreenhousegasintensity• Greenhousegasemissionintensityofproductionfalling
2.2 Consumption-basedgreenhousegasemissions• Dutchcarbonfootprintstable
2.3 Energyefficiency• Energyefficiencyupinagricultureandmanufacturing
2.4 Renewableenergy• Shareofrenewableenergyincreasing
2.5 Nutrientsurpluses• Smallersurplusesonnutrientsbalancesheet
2.6 Materialintensity• Materialintensitydecreases
2.7 Wateruseintensity• Industriesusetapwatermoreefficiently
2.8 Wastetreatment• Morewasterecoveredandrecycled
20 Statistics Netherlands
2.1 Production-based greenhouse gas intensity
Greenhousegasemissionintensityofproductionfalling
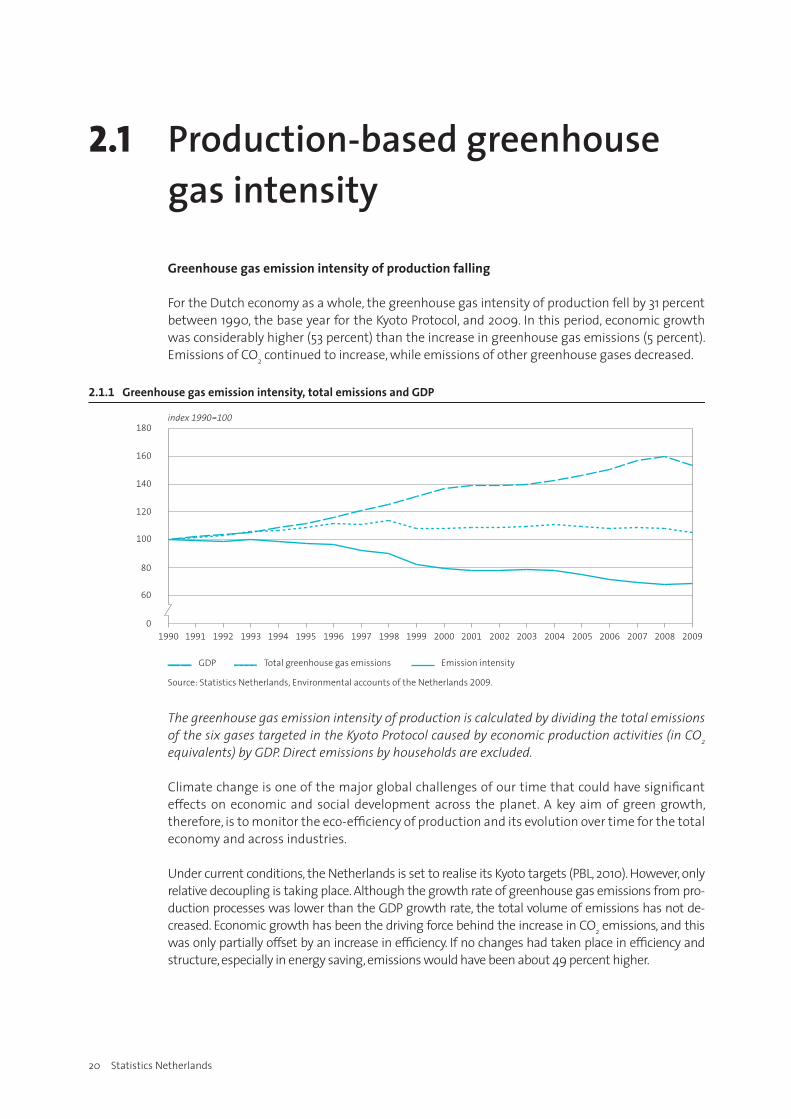
For the Dutch economy as a whole, the greenhouse gas intensity of production fell by 31 percent between 1990, the base year for the Kyoto Protocol, and 2009. In this period, economic growth was considerably higher (53 percent) than the increase in greenhouse gas emissions (5 percent). Emissions of CO2 continued to increase, while emissions of other greenhouse gases decreased.
The greenhouse gas emission intensity of production is calculated by dividing the total emissions of the six gases targeted in the Kyoto Protocol caused by economic production activities (in CO2 equivalents) by GDP. Direct emissions by households are excluded.
Climate change is one of the major global challenges of our time that could have significant effects on economic and social development across the planet. A key aim of green growth, therefore, is to monitor the eco-efficiency of production and its evolution over time for the total economy and across industries.
Under current conditions, the Netherlands is set to realise its Kyoto targets (PBL, 2010). However, only relative decoupling is taking place. Although the growth rate of greenhouse gas emissions from pro-duction processes was lower than the GDP growth rate, the total volume of emissions has not de-creased. Economic growth has been the driving force behind the increase in CO2 emissions, and this was only partially offset by an increase in efficiency. If no changes had taken place in efficiency and structure, especially in energy saving, emissions would have been about 49 percent higher.
2.1.1 Greenhouse gas emission intensity, total emissions and GDP
Source: Statistics Netherlands, Environmental accounts of the Netherlands 2009.
20092008200720062005200420032002200120001999199819971996199519941993199219911990
index 1990=100
0
60
80
100
120
140
160
180
Emission intensityTotal greenhouse gas emissionsGDP
Green growth in the Netherlands 21
2.2 Consumption-based greenhouse gas emissions
Dutchcarbonfootprintstable
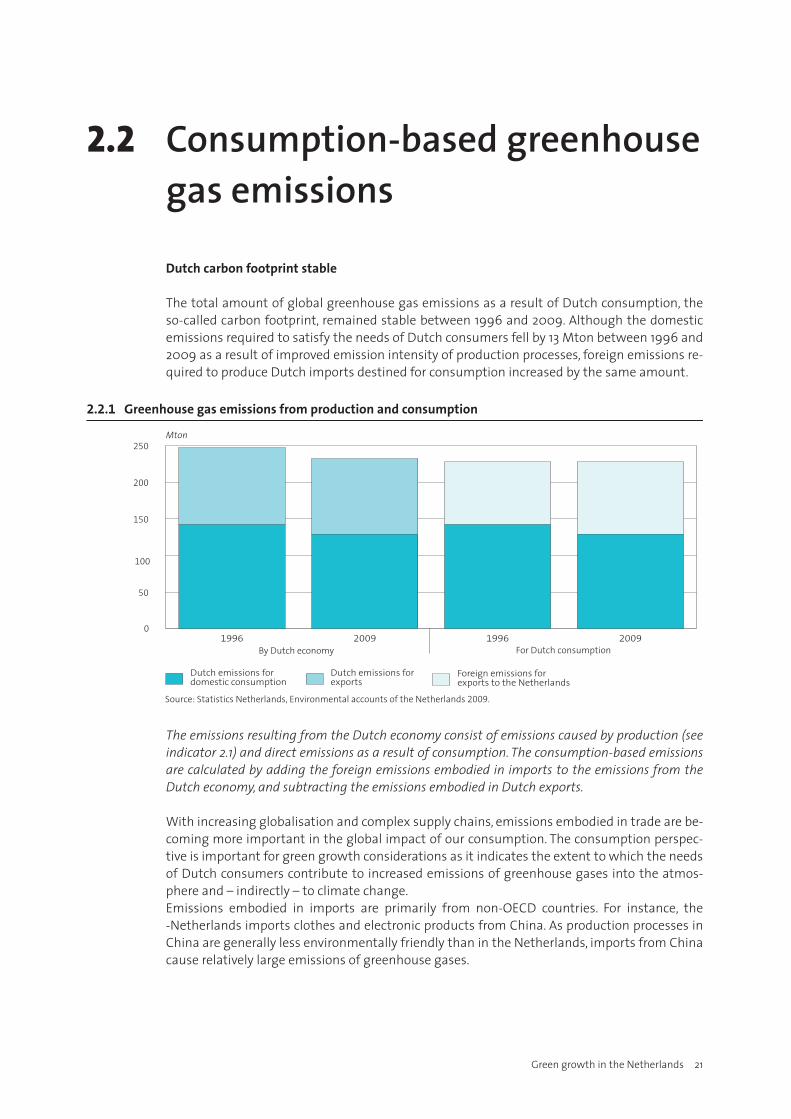
The total amount of global greenhouse gas emissions as a result of Dutch consumption, the so-called carbon footprint, remained stable between 1996 and 2009. Although the domestic emissions required to satisfy the needs of Dutch consumers fell by 13 Mton between 1996 and 2009 as a result of improved emission intensity of production processes, foreign emissions re-quired to produce Dutch imports destined for consumption increased by the same amount.
The emissions resulting from the Dutch economy consist of emissions caused by production (see indicator 2.1) and direct emissions as a result of consumption. The consumption-based emissions are calculated by adding the foreign emissions embodied in imports to the emissions from the Dutch economy, and subtracting the emissions embodied in Dutch exports.
With increasing globalisation and complex supply chains, emissions embodied in trade are be-coming more important in the global impact of our consumption. The consumption perspec-tive is important for green growth considerations as it indicates the extent to which the needs of Dutch consumers contribute to increased emissions of greenhouse gases into the atmos-phere and – indirectly – to climate change.Emissions embodied in imports are primarily from non-OECD countries. For instance, the -Netherlands imports clothes and electronic products from China. As production processes in China are generally less environmentally friendly than in the Netherlands, imports from China cause relatively large emissions of greenhouse gases.
2.2.1 Greenhouse gas emissions from production and consumption
Source: Statistics Netherlands, Environmental accounts of the Netherlands 2009.
By Dutch economy For Dutch consumption
Dutch emissions forexports
Foreign emissions for exports to the Netherlands
Dutch emissions for domestic consumption
Mton
0
50
100
150
200
250
2009199620091996
22 Statistics Netherlands
2.3 Energy efficiency
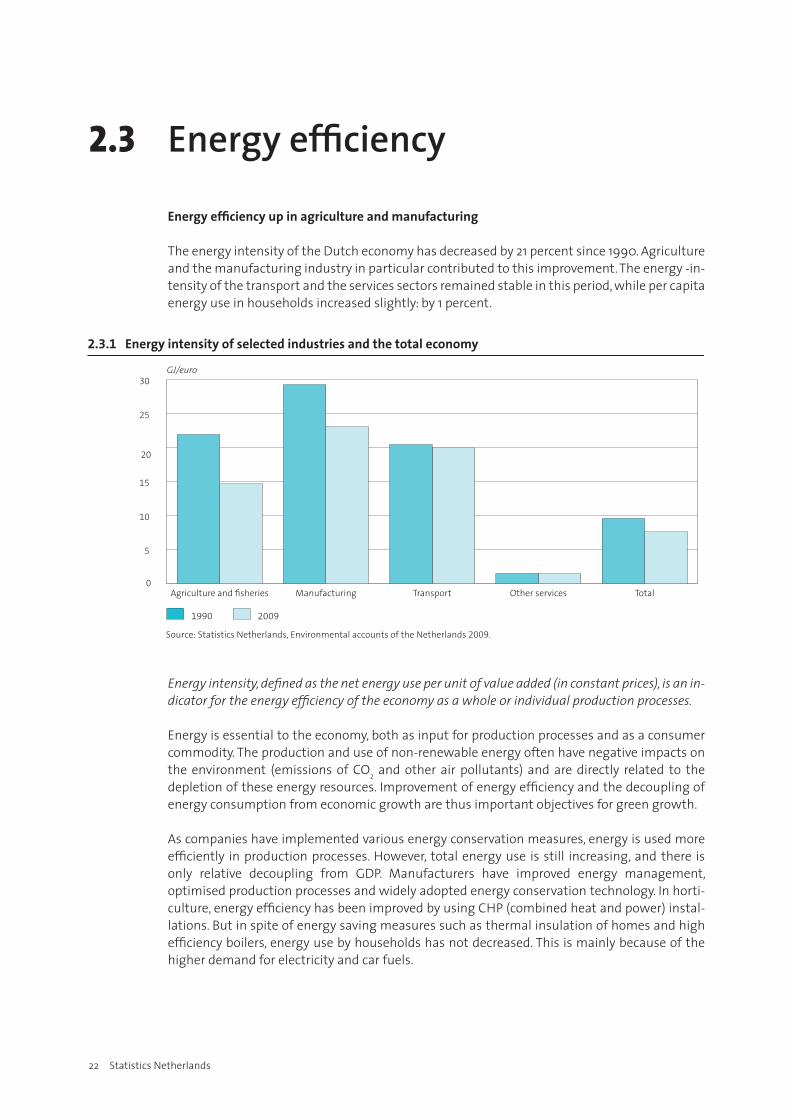
Energyefficiencyupinagricultureandmanufacturing
The energy intensity of the Dutch economy has decreased by 21 percent since 1990. Agriculture and the manufacturing industry in particular contributed to this improvement. The energy -in-tensity of the transport and the services sectors remained stable in this period, while per capita energy use in households increased slightly: by 1 percent.
Energy intensity, defined as the net energy use per unit of value added (in constant prices), is an in-dicator for the energy efficiency of the economy as a whole or individual production processes.
Energy is essential to the economy, both as input for production processes and as a consumer commodity. The production and use of non-renewable energy often have negative impacts on the environment (emissions of CO2 and other air pollutants) and are directly related to the depletion of these energy resources. Improvement of energy efficiency and the decoupling of energy consumption from economic growth are thus important objectives for green growth.
As companies have implemented various energy conservation measures, energy is used more efficiently in production processes. However, total energy use is still increasing, and there is only relative decoupling from GDP. Manufacturers have improved energy management, optimised production processes and widely adopted energy conservation technology. In horti-culture, energy efficiency has been improved by using CHP (combined heat and power) instal-lations. But in spite of energy saving measures such as thermal insulation of homes and high efficiency boilers, energy use by households has not decreased. This is mainly because of the higher demand for electricity and car fuels.
2.3.1 Energy intensity of selected industries and the total economy
Source: Statistics Netherlands, Environmental accounts of the Netherlands 2009.
20091990
GJ/euro
0
5
10
15
20
25
30
TotalOther servicesTransportManufacturingAgriculture and �sheries
Green growth in the Netherlands 23
2.4 Renewable energy
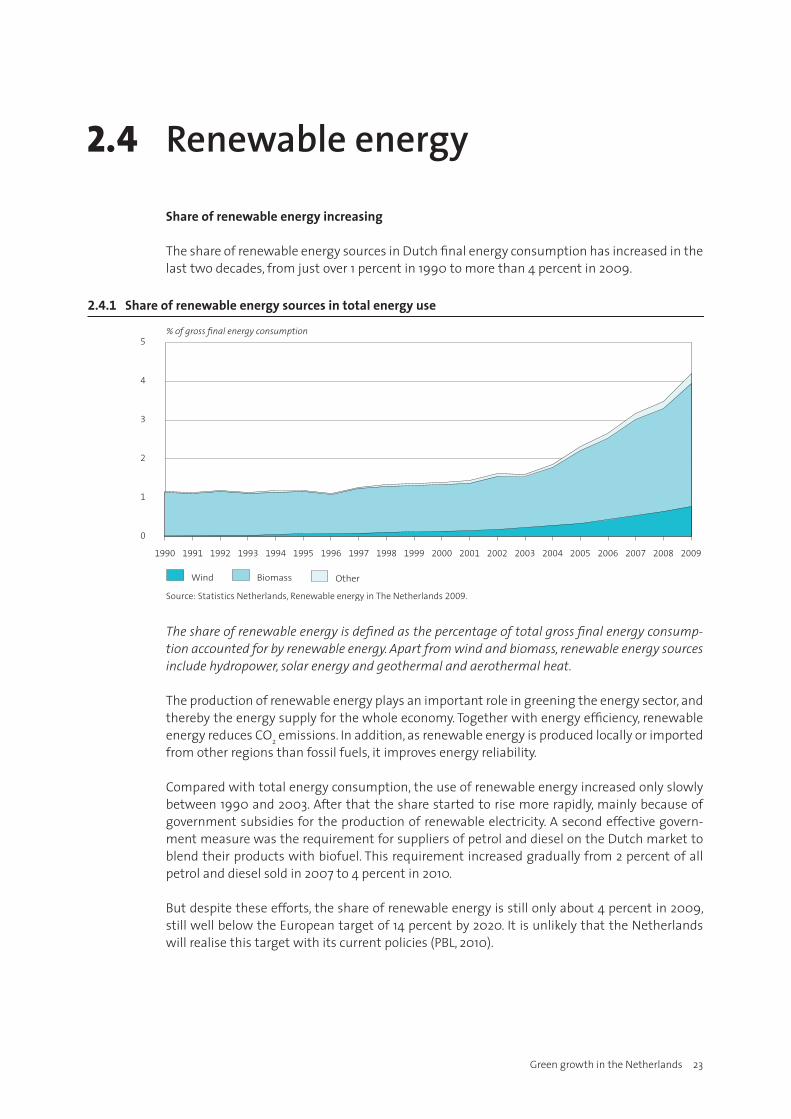
Shareofrenewableenergyincreasing
The share of renewable energy sources in Dutch final energy consumption has increased in the last two decades, from just over 1 percent in 1990 to more than 4 percent in 2009.
The share of renewable energy is defined as the percentage of total gross final energy consump-tion accounted for by renewable energy. Apart from wind and biomass, renewable energy sources include hydropower, solar energy and geothermal and aerothermal heat.
The production of renewable energy plays an important role in greening the energy sector, and thereby the energy supply for the whole economy. Together with energy efficiency, renewable energy reduces CO2 emissions. In addition, as renewable energy is produced locally or imported from other regions than fossil fuels, it improves energy reliability.
Compared with total energy consumption, the use of renewable energy increased only slowly between 1990 and 2003. After that the share started to rise more rapidly, mainly because of government subsidies for the production of renewable electricity. A second effective govern-ment measure was the requirement for suppliers of petrol and diesel on the Dutch market to blend their products with biofuel. This requirement increased gradually from 2 percent of all petrol and diesel sold in 2007 to 4 percent in 2010.
But despite these efforts, the share of renewable energy is still only about 4 percent in 2009, still well below the European target of 14 percent by 2020. It is unlikely that the Netherlands will realise this target with its current policies (PBL, 2010).
2.4.1 Share of renewable energy sources in total energy use
Source: Statistics Netherlands, Renewable energy in The Netherlands 2009.
Wind Biomass Other
0
1
2
3
4
5% of gross �nal energy consumption
20092008200720062005200420032002200120001999199819971996199519941993199219911990
24 Statistics Netherlands
2.5 Nutrient surpluses
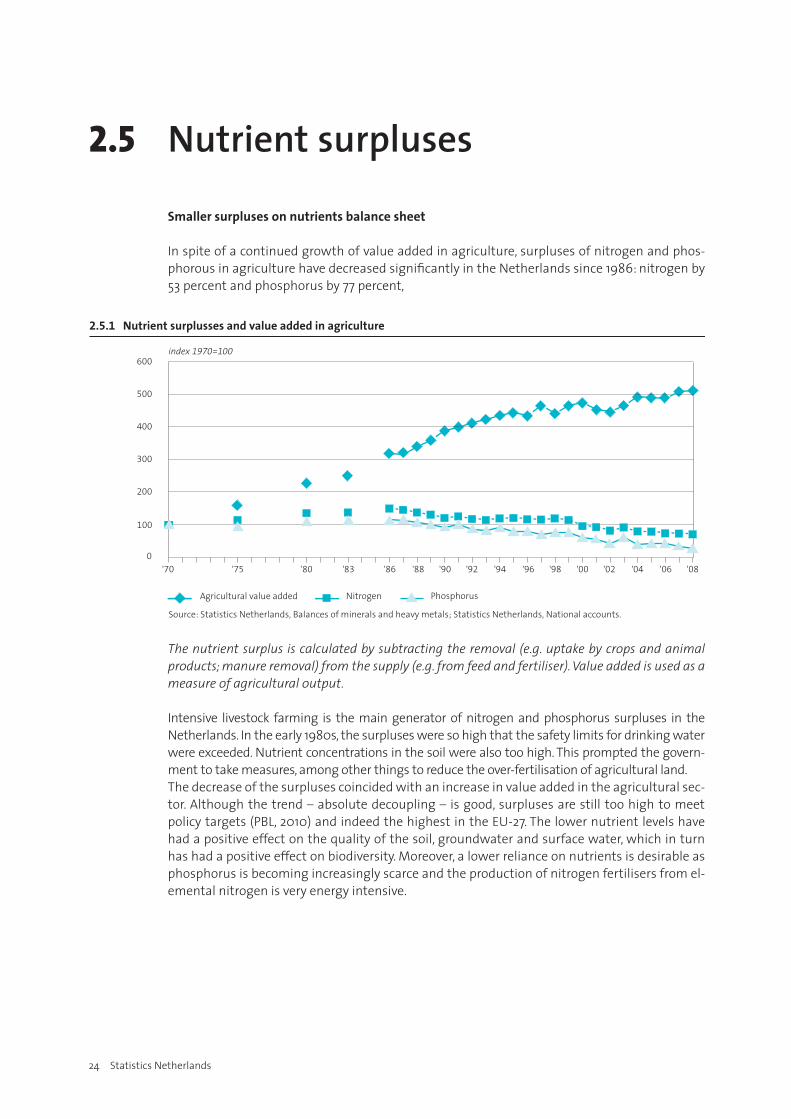
Smallersurplusesonnutrientsbalancesheet
In spite of a continued growth of value added in agriculture, surpluses of nitrogen and phos-phorous in agriculture have decreased significantly in the Netherlands since 1986: nitrogen by 53 percent and phosphorus by 77 percent,
The nutrient surplus is calculated by subtracting the removal (e.g. uptake by crops and animal products; manure removal) from the supply (e.g. from feed and fertiliser). Value added is used as a measure of agricultural output.
Intensive livestock farming is the main generator of nitrogen and phosphorus surpluses in the Netherlands. In the early 1980s, the surpluses were so high that the safety limits for drinking water were exceeded. Nutrient concentrations in the soil were also too high. This prompted the govern-ment to take measures, among other things to reduce the over-fertilisation of agricultural land. The decrease of the surpluses coincided with an increase in value added in the agricultural sec-tor. Although the trend – absolute decoupling – is good, surpluses are still too high to meet policy targets (PBL, 2010) and indeed the highest in the EU-27. The lower nutrient levels have had a positive effect on the quality of the soil, groundwater and surface water, which in turn has had a positive effect on biodiversity. Moreover, a lower reliance on nutrients is desirable as phosphorus is becoming increasingly scarce and the production of nitrogen fertilisers from el-emental nitrogen is very energy intensive.
2.5.1 Nutrient surplusses and value added in agriculture
Source: Statistics Netherlands, Balances of minerals and heavy metals; Statistics Netherlands, National accounts.
index 1970=100
0
100
200
300
400
500
600
PhosphorusNitrogenAgricultural value added
'08'06'04'02'00'98'96'94'92'90'88'86'83'80'75'70
Green growth in the Netherlands 25
2.6 Material intensity
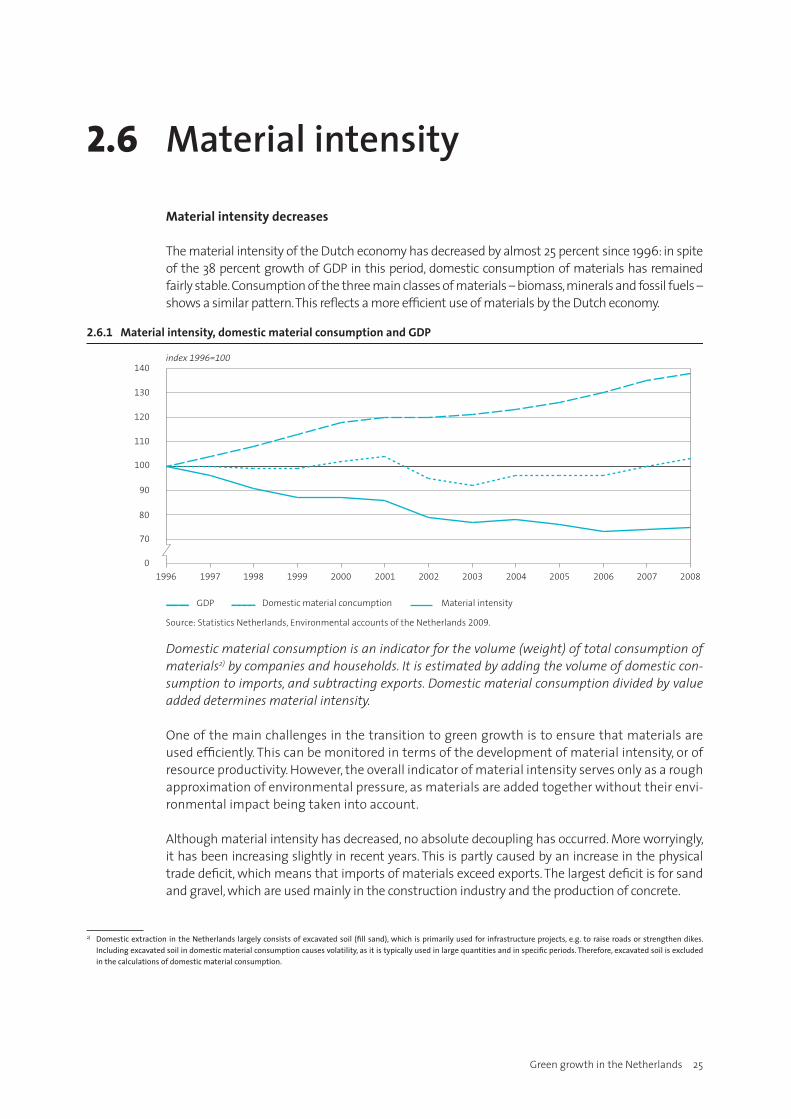
Materialintensitydecreases
The material intensity of the Dutch economy has decreased by almost 25 percent since 1996: in spite of the 38 percent growth of GDP in this period, domestic consumption of materials has remained fairly stable. Consumption of the three main classes of materials – biomass, minerals and fossil fuels – shows a similar pattern. This reflects a more efficient use of materials by the Dutch economy.
Domestic material consumption is an indicator for the volume (weight) of total consumption of materials2) by companies and households. It is estimated by adding the volume of domestic con-sumption to imports, and subtracting exports. Domestic material consumption divided by value added determines material intensity.
One of the main challenges in the transition to green growth is to ensure that materials are used efficiently. This can be monitored in terms of the development of material intensity, or of resource productivity. However, the overall indicator of material intensity serves only as a rough approximation of environmental pressure, as materials are added together without their envi-ronmental impact being taken into account.
Although material intensity has decreased, no absolute decoupling has occurred. More worryingly, it has been increasing slightly in recent years. This is partly caused by an increase in the physical trade deficit, which means that imports of materials exceed exports. The largest deficit is for sand and gravel, which are used mainly in the construction industry and the production of concrete.
2) DomesticextractionintheNetherlandslargelyconsistsofexcavatedsoil (fillsand),whichisprimarilyusedfor infrastructureprojects,e.g. toraiseroadsorstrengthendikes.Includingexcavatedsoilindomesticmaterialconsumptioncausesvolatility,asitistypicallyusedinlargequantitiesandinspecificperiods.Therefore,excavatedsoilisexcludedinthecalculationsofdomesticmaterialconsumption.
2.6.1 Material intensity, domestic material consumption and GDP
Source: Statistics Netherlands, Environmental accounts of the Netherlands 2009.
index 1996=100
0
70
80
90
100
110
120
130
140
Material intensityDomestic material concumption
2008200720062005200420032002200120001999199819971996
GDP
26 Statistics Netherlands
2.7 Water use intensity
Industriesusetapwatermoreefficiently
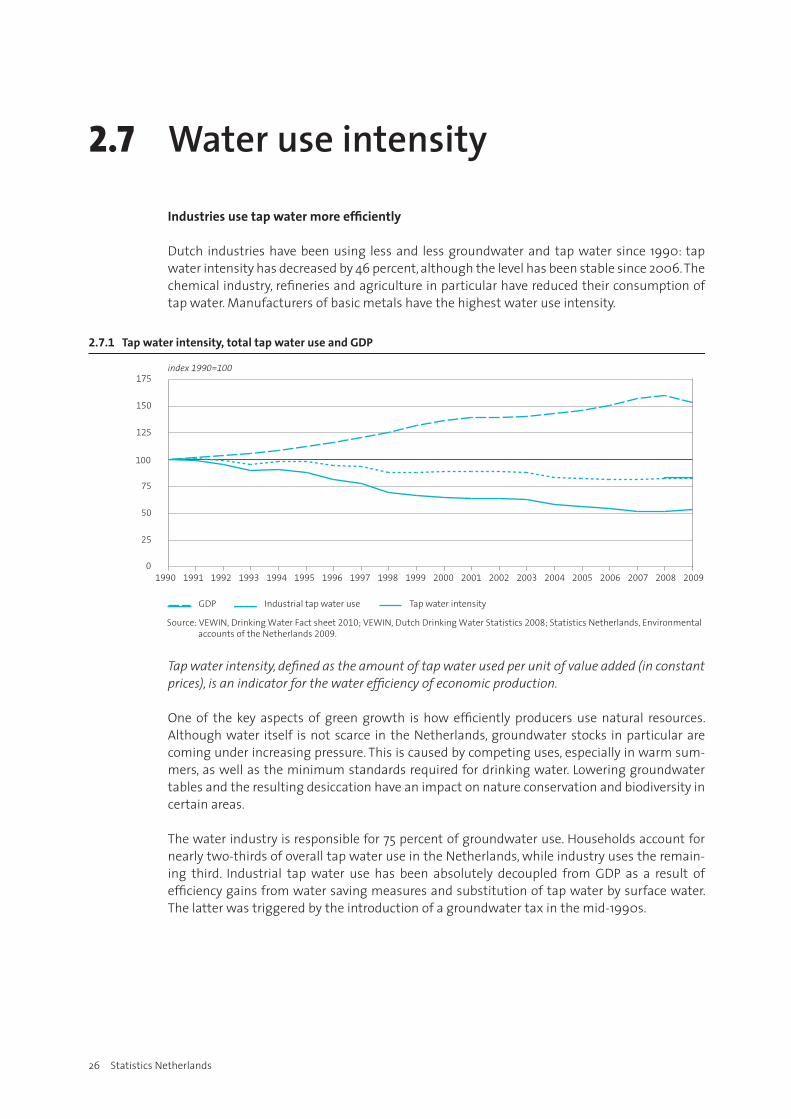
Dutch industries have been using less and less groundwater and tap water since 1990: tap water intensity has decreased by 46 percent, although the level has been stable since 2006. The chemical industry, refineries and agriculture in particular have reduced their consumption of tap water. Manufacturers of basic metals have the highest water use intensity.
Tap water intensity, defined as the amount of tap water used per unit of value added (in constant prices), is an indicator for the water efficiency of economic production.
One of the key aspects of green growth is how efficiently producers use natural resources. Although water itself is not scarce in the Netherlands, groundwater stocks in particular are coming under increasing pressure. This is caused by competing uses, especially in warm sum-mers, as well as the minimum standards required for drinking water. Lowering groundwater tables and the resulting desiccation have an impact on nature conservation and biodiversity in certain areas.
The water industry is responsible for 75 percent of groundwater use. Households account for nearly two-thirds of overall tap water use in the Netherlands, while industry uses the remain-ing third. Industrial tap water use has been absolutely decoupled from GDP as a result of efficiency gains from water saving measures and substitution of tap water by surface water. The latter was triggered by the introduction of a groundwater tax in the mid-1990s.
2.7.1 Tap water intensity, total tap water use and GDP
Source: VEWIN, Drinking Water Fact sheet 2010; VEWIN, Dutch Drinking Water Statistics 2008; Statistics Netherlands, EnvironmentalSourcesaccounts of the Netherlands 2009.
20092008200720062005200420032002200120001999199819971996199519941993199219911990
index 1990=100
0
25
50
75
100
125
150
175
Tap water intensityIndustrial tap water useGDP
Green growth in the Netherlands 27
2.8 Waste treatment
Morewasterecoveredandrecycled
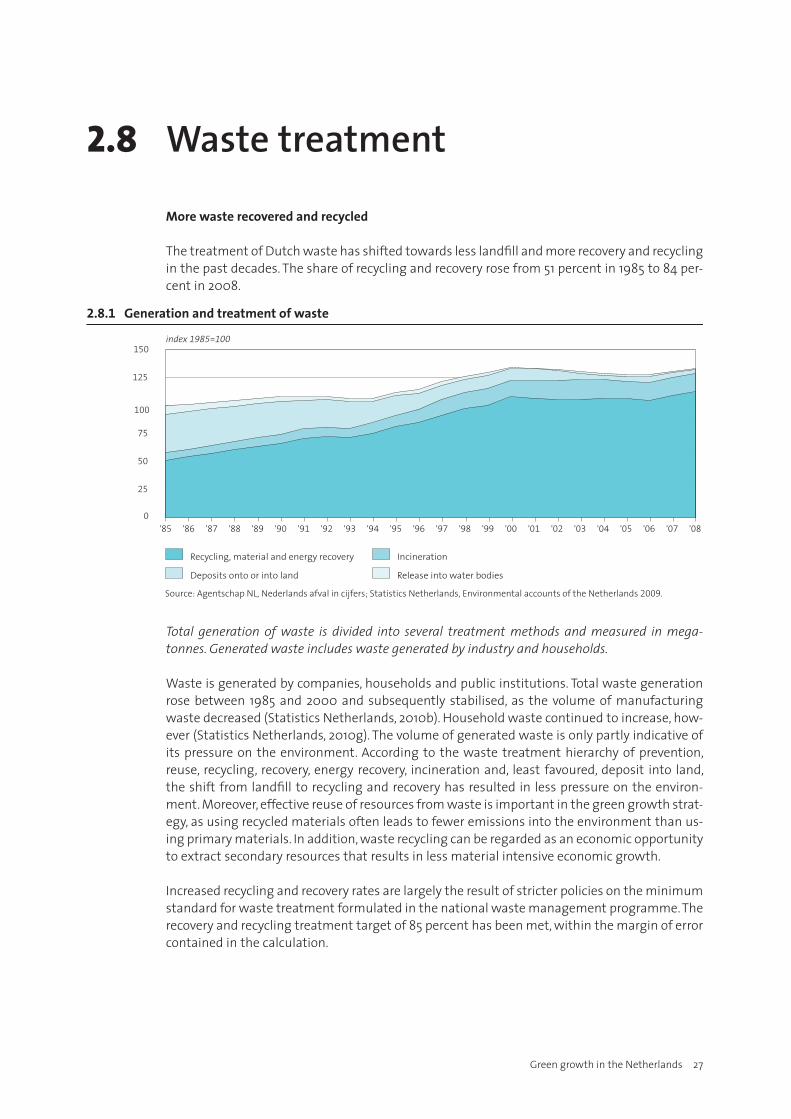
The treatment of Dutch waste has shifted towards less landfill and more recovery and recycling in the past decades. The share of recycling and recovery rose from 51 percent in 1985 to 84 per-cent in 2008.
Total generation of waste is divided into several treatment methods and measured in mega-tonnes. Generated waste includes waste generated by industry and households.
Waste is generated by companies, households and public institutions. Total waste generation rose between 1985 and 2000 and subsequently stabilised, as the volume of manufacturing waste decreased (Statistics Netherlands, 2010b). Household waste continued to increase, how-ever (Statistics Netherlands, 2010g). The volume of generated waste is only partly indicative of its pressure on the environment. According to the waste treatment hierarchy of prevention, reuse, recycling, recovery, energy recovery, incineration and, least favoured, deposit into land, the shift from landfill to recycling and recovery has resulted in less pressure on the environ-ment. Moreover, effective reuse of resources from waste is important in the green growth strat-egy, as using recycled materials often leads to fewer emissions into the environment than us-ing primary materials. In addition, waste recycling can be regarded as an economic opportunity to extract secondary resources that results in less material intensive economic growth.
Increased recycling and recovery rates are largely the result of stricter policies on the minimum standard for waste treatment formulated in the national waste management programme. The recovery and recycling treatment target of 85 percent has been met, within the margin of error contained in the calculation.
2.8.1 Generation and treatment of waste
Source: Agentschap NL, Nederlands afval in cijfers; Statistics Netherlands, Environmental accounts of the Netherlands 2009.
Recycling, material and energy recovery Incineration
Deposits onto or into land Release into water bodies
index 1985=100
'08'07'06'05'04'03'02'01'00'99'98'97'96'95'94'93'92'91'90'89'88'87'86'850
25
50
75
100
125
150

Green growth in the Netherlands 29
Indicatorsofthenaturalassetbase
Indicators of the natural asset base
3
Green growth in the Netherlands 31
Indicatorsofthenaturalassetbase
3.1 Stocksoftimber• Timberstocksup
3.2 Fishinputs• Totalfishinputsincrease
3.3 Naturalgasreserves• Naturalgasreservesdecreasing
3.4 Landconversionintobuilt-upland• Built-uplandsteadilyincreasing
3.5 Threatstobiodiversity• Increasedoverallthreatforanimalspecies

32 Statistics Netherlands
3.1 Stocks of timber
Timberstocksup
Stocks of standing timber in the Netherlands increased by 27 percent between 1990 and 2005, to 62 million m3. This is largely the result of an increase in forest area. The timber production of Dutch forests was relatively stable in this period, at around one million m3. In terms of a percentage of the annual tree growth, the harvest averaged around 60 percent, which allowed the stocks to grow.
Developments in stocks of standing timber and timber imports are expressed in million m3 of round wood equivalents (under-bark for imports; over-bark for standing timber).
The availability and quality of forests are key factors in economic activity and welfare and hence important for green growth. In economic terms, forestry is relatively small in the Neth-erlands; the main benefits derived from forests are recreation and biodiversity. Nevertheless, stocks of standing timber provide a good indicator as they also indirectly cover increases in forest areas.
Although stocks of timber have increased, imports of timber far outweigh domestic produc-tion. Therefore, most of the potential environmental pressure caused by the use of timber occurs abroad. The Netherlands imports most of its timber from within Europe. The environ-mental impact of this wood is relatively modest, as most of the forests are managed sustain-ably. Tropical timber accounts for only 4 percent of imports. Roughly 15 percent of this tropical wood is certified as sustainable by the Forest Stewardship Council. This certification rate is below formulated policy targets. It is unclear whether the remaining 85 percent of tropical wood imports has been harvested sustainably.
3.1.1 Stocks of standing timber and imports
Source: Probos, Kerngegevens bos en hout in Nederland.
mln m3
0
10
20
30
40
50
60
70
Standing volume Imports
2005200420032002200120001999199819971996199519941993199219911990
Green growth in the Netherlands 33
3.2 Fish inputs
Totalfishinputsincrease
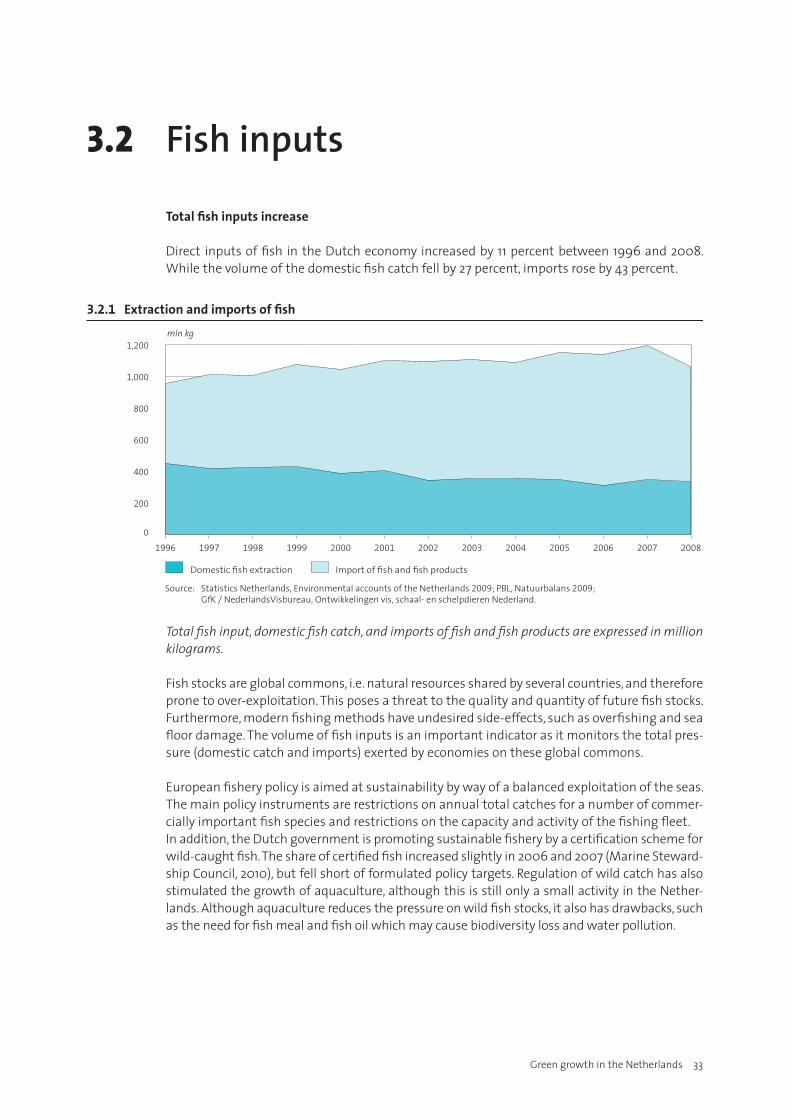
Direct inputs of fish in the Dutch economy increased by 11 percent between 1996 and 2008. While the volume of the domestic fish catch fell by 27 percent, imports rose by 43 percent.
Total fish input, domestic fish catch, and imports of fish and fish products are expressed in million kilograms.
Fish stocks are global commons, i.e. natural resources shared by several countries, and therefore prone to over-exploitation. This poses a threat to the quality and quantity of future fish stocks. Furthermore, modern fishing methods have undesired side-effects, such as overfishing and sea floor damage. The volume of fish inputs is an important indicator as it monitors the total pres-sure (domestic catch and imports) exerted by economies on these global commons.
European fishery policy is aimed at sustainability by way of a balanced exploitation of the seas. The main policy instruments are restrictions on annual total catches for a number of commer-cially important fish species and restrictions on the capacity and activity of the fishing fleet.In addition, the Dutch government is promoting sustainable fishery by a certification scheme for wild-caught fish. The share of certified fish increased slightly in 2006 and 2007 (Marine Steward-ship Council, 2010), but fell short of formulated policy targets. Regulation of wild catch has also stimulated the growth of aquaculture, although this is still only a small activity in the Nether-lands. Although aquaculture reduces the pressure on wild fish stocks, it also has drawbacks, such as the need for fish meal and fish oil which may cause biodiversity loss and water pollution.
3.2.1 Extraction and imports of �sh
Source: Statistics Netherlands, Environmental accounts of the Netherlands 2009; PBL, Natuurbalans 2009; GfK / NederlandsVisbureau, Ontwikkelingen vis, schaal- en schelpdieren Nederland.
Domestic �sh extraction Import of �sh and �sh products
0
200
400
600
800
1,000
1,200mln kg
2008200720062005200420032002200120001999199819971996

34 Statistics Netherlands
3.3 Natural gas reserves
Naturalgasreservesdecrease
Remaining reserves of natural gas in the Netherlands have decreased by 25 percent since 1990. Although a small number of new reserves have been discovered in recent years, overall the number of new discoveries has fallen. The slight increase in natural gas reserves in 2009 was primarily the result of an upward revaluation of existing reserves.
The expected reserve is the remaining volume of gas or oil based on geological surveys which is assumed to be extractable with existing technology and at current prices at a given point in time.3) Oil and gas re-serves are valued as the net present value of expected resource rents of the oil and gas industry.
Green growth aims to avoid unsustainable pressure on natural assets. However, there are different definitions of sustainability. According to the so-called weak interpretation of sustainability, even if physical reserves decrease, a policy that lets their stock value increase is deemed sustainable, as it provides possibilities for substitution. Indeed, the monetary value of the remaining Dutch natural gas reserves has risen sharply in recent years as a consequence of price increases. Green growth, on the other hand, has more in common with the so-called strong interpretation of sustainability, which emphasises the use of physical indicators to monitor whether certain resources are reaching critical levels or even exceeding thresholds.
A decreasing total stock is thus perceived as an indicator of unsustainable behaviour, as – given current extraction rates and the absence of significant discoveries and revaluations -stocks are likely to run out in a matter of decades.
3) Thefigureshowsthereservesasestimatedataspecificpointintime.Theestimatesarenotretrospectivelyadjusted.
3.3.1 Natural gas reserves
Source: Statistics Netherlands, Environmental accounts of the Netherlands 2009.
Value (left axis) Volume (right axis)
'10'09'08'07'06'05'04'03'02'01'00'99'98'97'96'95'94'93'92'91‘900
50
100
150
200
250
0
500
1,000
1,500
2,000
2,500
0
500
1,000
1,500
2,000
2,500billion euro billion Sm3
Green growth in the Netherlands 35
3.4 Land conversion into built-up land
Built-uplandsteadilyincreasing
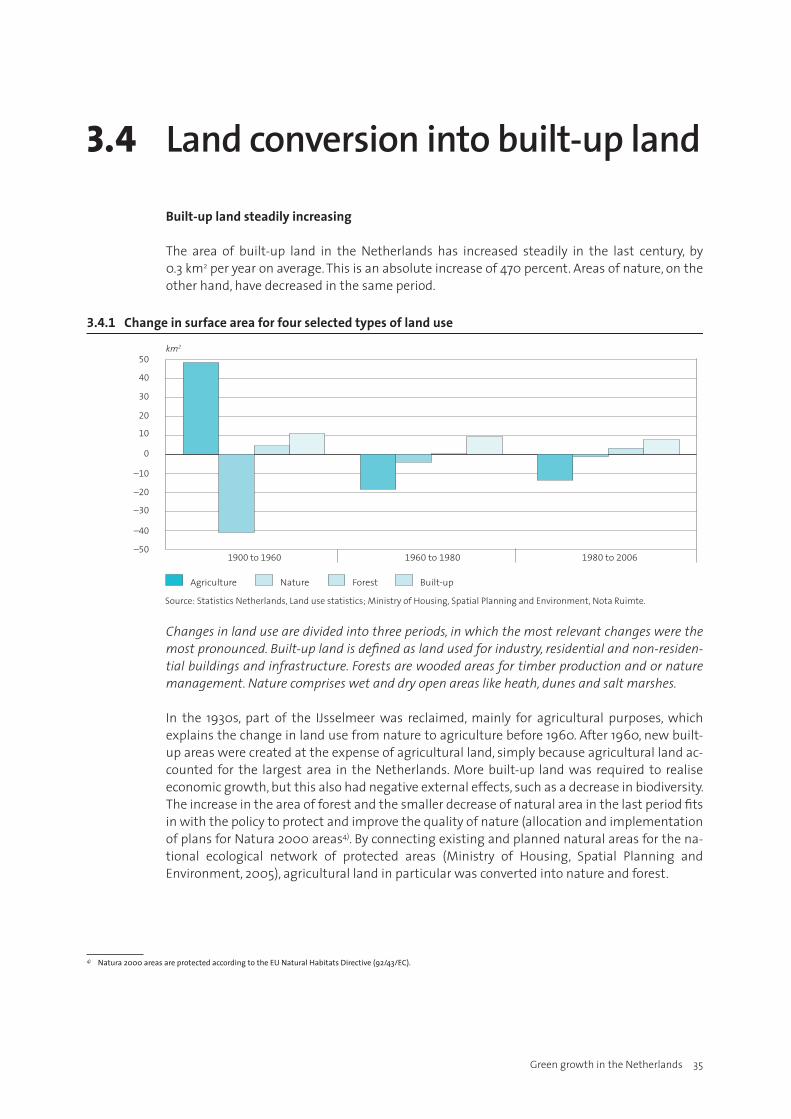
The area of built-up land in the Netherlands has increased steadily in the last century, by 0.3 km2 per year on average. This is an absolute increase of 470 percent. Areas of nature, on the other hand, have decreased in the same period.
Changes in land use are divided into three periods, in which the most relevant changes were the most pronounced. Built-up land is defined as land used for industry, residential and non-residen-tial buildings and infrastructure. Forests are wooded areas for timber production and or nature management. Nature comprises wet and dry open areas like heath, dunes and salt marshes.
In the 1930s, part of the IJsselmeer was reclaimed, mainly for agricultural purposes, which explains the change in land use from nature to agriculture before 1960. After 1960, new built-up areas were created at the expense of agricultural land, simply because agricultural land ac-counted for the largest area in the Netherlands. More built-up land was required to realise economic growth, but this also had negative external effects, such as a decrease in biodiversity. The increase in the area of forest and the smaller decrease of natural area in the last period fits in with the policy to protect and improve the quality of nature (allocation and implementation of plans for Natura 2000 areas4). By connecting existing and planned natural areas for the na-tional ecological network of protected areas (Ministry of Housing, Spatial Planning and Environment, 2005), agricultural land in particular was converted into nature and forest.
4) Natura2000areasareprotectedaccordingtotheEUNaturalHabitatsDirective(92/43/EC).
3.4.1 Change in surface area for four selected types of land use
Source: Statistics Netherlands, Land use statistics; Ministry of Housing, Spatial Planning and Environment, Nota Ruimte.
Nature Forest Built-upAgriculture
km2
–50
–40
–30
–20
–10
0
10
20
30
40
50
1980 to 20061960 to 19801900 to 1960
36 Statistics Netherlands
3.5 Threats to biodiversity
Increasedoverallthreattoanimalspecies
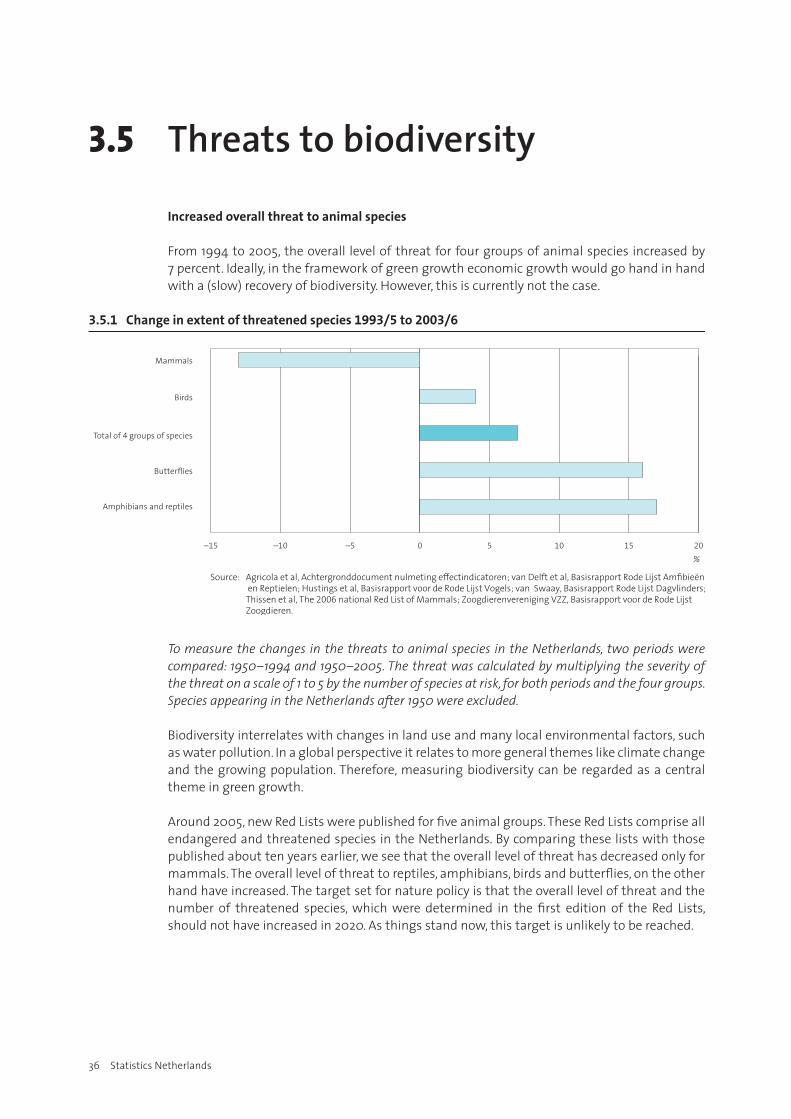
From 1994 to 2005, the overall level of threat for four groups of animal species increased by 7 percent. Ideally, in the framework of green growth economic growth would go hand in hand with a (slow) recovery of biodiversity. However, this is currently not the case.
To measure the changes in the threats to animal species in the Netherlands, two periods were compared: 1950–1994 and 1950–2005. The threat was calculated by multiplying the severity of the threat on a scale of 1 to 5 by the number of species at risk, for both periods and the four groups. Species appearing in the Netherlands after 1950 were excluded.
Biodiversity interrelates with changes in land use and many local environmental factors, such as water pollution. In a global perspective it relates to more general themes like climate change and the growing population. Therefore, measuring biodiversity can be regarded as a central theme in green growth.
Around 2005, new Red Lists were published for five animal groups. These Red Lists comprise all endangered and threatened species in the Netherlands. By comparing these lists with those published about ten years earlier, we see that the overall level of threat has decreased only for mammals. The overall level of threat to reptiles, amphibians, birds and butterflies, on the other hand have increased. The target set for nature policy is that the overall level of threat and the number of threatened species, which were determined in the first edition of the Red Lists, should not have increased in 2020. As things stand now, this target is unlikely to be reached.
3.5.1 Change in extent of threatened species 1993/5 to 2003/6
Source: Agricola et al, Achtergronddocument nulmeting effectindicatoren; van Delft et al, Basisrapport Rode Lijst Am�bieën en Reptielen; Hustings et al, Basisrapport voor de Rode Lijst Vogels; van Swaay, Basisrapport Rode Lijst Dagvlinders; Thissen et al, The 2006 national Red List of Mammals; Zoogdierenvereniging VZZ, Basisrapport voor de Rode Lijst Zoogdieren.
–15 –10 –5 0 5 10 15 20
Amphibians and reptiles
Butter�ies
Total of 4 groups of species
Birds
Mammals
%
Green growth in the Netherlands 37
4
Indicators on environmental quality of life

4
Green growth in the Netherlands 39
4.1 Pollutioninducedhealthproblems• Pollutioninducedhealthproblemsdecrease
Indicatorsonenvironmentalqualityoflife
40 Statistics Netherlands
4.1 Pollution induced health problems
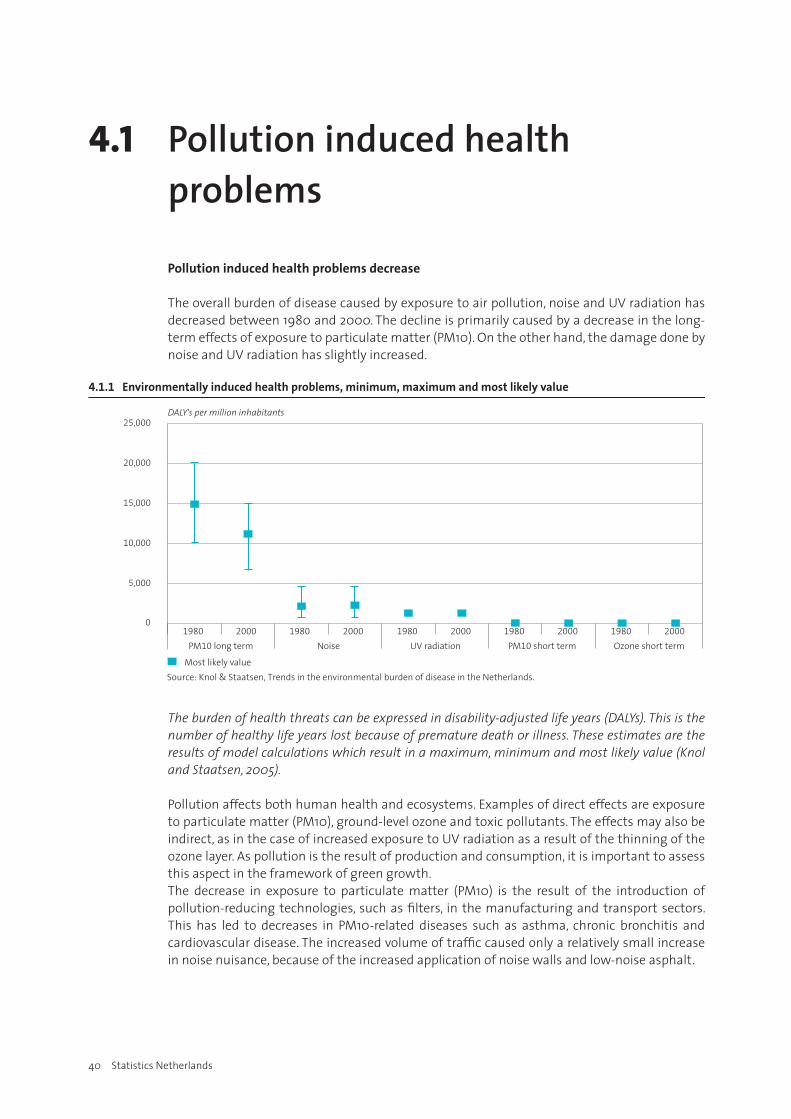
Pollutioninducedhealthproblemsdecrease
The overall burden of disease caused by exposure to air pollution, noise and UV radiation has decreased between 1980 and 2000. The decline is primarily caused by a decrease in the long-term effects of exposure to particulate matter (PM10). On the other hand, the damage done by noise and UV radiation has slightly increased.
The burden of health threats can be expressed in disability-adjusted life years (DALYs). This is the number of healthy life years lost because of premature death or illness. These estimates are the results of model calculations which result in a maximum, minimum and most likely value (Knol and Staatsen, 2005).
Pollution affects both human health and ecosystems. Examples of direct effects are exposure to particulate matter (PM10), ground-level ozone and toxic pollutants. The effects may also be indirect, as in the case of increased exposure to UV radiation as a result of the thinning of the ozone layer. As pollution is the result of production and consumption, it is important to assess this aspect in the framework of green growth.The decrease in exposure to particulate matter (PM10) is the result of the introduction of pollution-reducing technologies, such as filters, in the manufacturing and transport sectors. This has led to decreases in PM10-related diseases such as asthma, chronic bronchitis and cardiovascular disease. The increased volume of traffic caused only a relatively small increase in noise nuisance, because of the increased application of noise walls and low-noise asphalt.
4.1.1 Environmentally induced health problems, minimum, maximum and most likely value
Source: Knol & Staatsen, Trends in the environmental burden of disease in the Netherlands.
DALY's per million inhabitants
0
5,000
10,000
15,000
20,000
25,000
Most likely value
2000198020001980200019802000198020001980PM10 long term Noise UV radiation PM10 short term Ozone short term
Green growth in the Netherlands 41
Indicators on policy responses and economic opportunities
5
Green growth in the Netherlands 43
Indicatorsonpolicyresponsesandeconomicopportunities
5.1 Greenpatents• Slightlymoregreenpatentapplications
5.2 Shareofgreentaxes• Shareofenvironmentaltaxesstabilised
5.3 Energyprices• Rapidriseinenergypricesinthelasttenyears
5.4 Carbonemissiontrading• ExcessofCO2emissionpermitsinmostyears
5.5 Environmentalinvestment• Environmentalinvestmenthigher
5.6 Greenjobs• Greenemploymentgrowthhigherthanaverage
44 Statistics Netherlands
5.1 Green patents
Slightlymoregreenpatentapplications
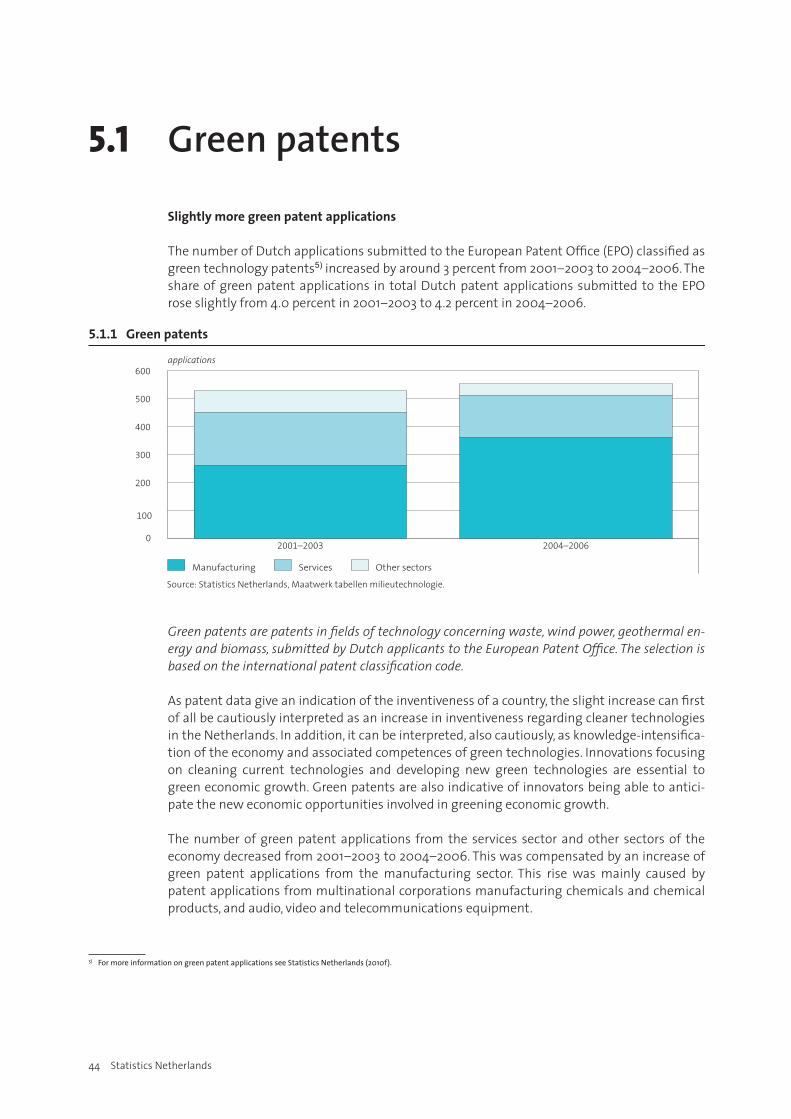
The number of Dutch applications submitted to the European Patent Office (EPO) classified as green technology patents5) increased by around 3 percent from 2001–2003 to 2004–2006. The share of green patent applications in total Dutch patent applications submitted to the EPO rose slightly from 4.0 percent in 2001–2003 to 4.2 percent in 2004–2006.
Green patents are patents in fields of technology concerning waste, wind power, geothermal en-ergy and biomass, submitted by Dutch applicants to the European Patent Office. The selection is based on the international patent classification code.
As patent data give an indication of the inventiveness of a country, the slight increase can first of all be cautiously interpreted as an increase in inventiveness regarding cleaner technologies in the Netherlands. In addition, it can be interpreted, also cautiously, as knowledge-intensifica-tion of the economy and associated competences of green technologies. Innovations focusing on cleaning current technologies and developing new green technologies are essential to green economic growth. Green patents are also indicative of innovators being able to antici-pate the new economic opportunities involved in greening economic growth.
The number of green patent applications from the services sector and other sectors of the economy decreased from 2001–2003 to 2004–2006. This was compensated by an increase of green patent applications from the manufacturing sector. This rise was mainly caused by patent applications from multinational corporations manufacturing chemicals and chemical products, and audio, video and telecommunications equipment.
5) FormoreinformationongreenpatentapplicationsseeStatisticsNetherlands(2010f).
5.1.1 Green patents
Source: Statistics Netherlands, Maatwerk tabellen milieutechnologie.
Services Other sectorsManufacturing
applications
0
100
200
300
400
500
600
2004–20062001–2003
Green growth in the Netherlands 45
5.2 Share of green taxes
Shareofenvironmentaltaxesstabilised
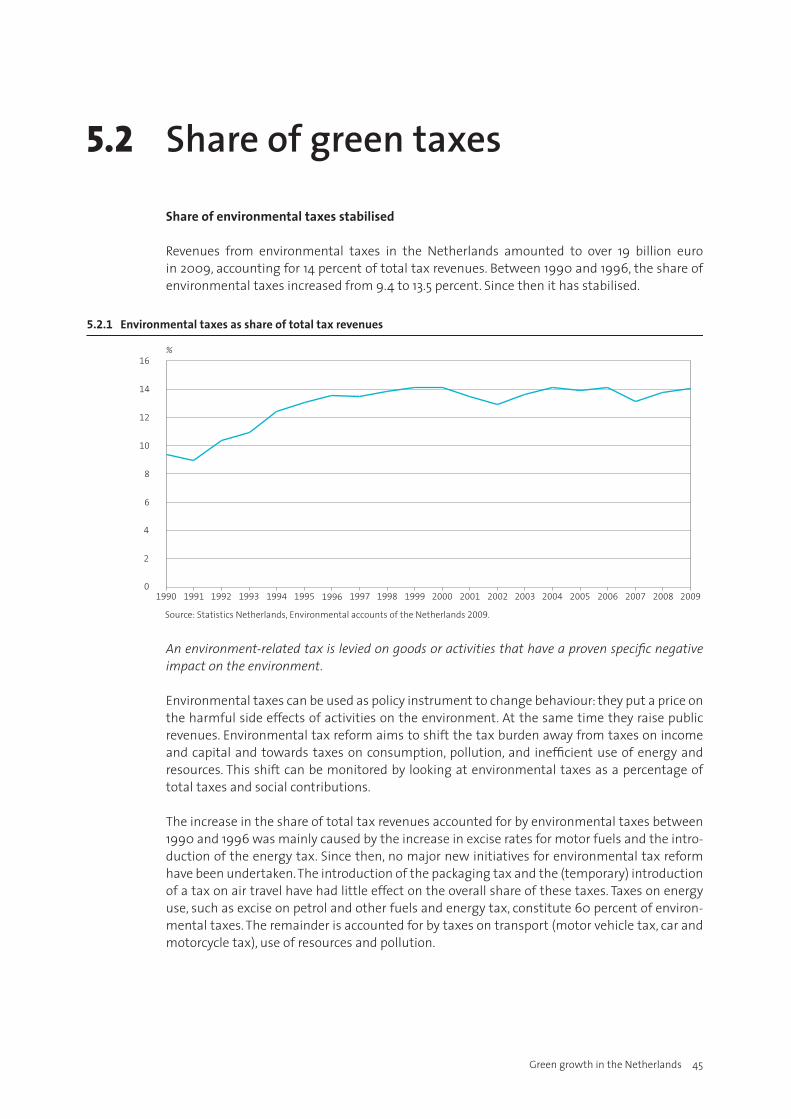
Revenues from environmental taxes in the Netherlands amounted to over 19 billion euro in 2009, accounting for 14 percent of total tax revenues. Between 1990 and 1996, the share of environmental taxes increased from 9.4 to 13.5 percent. Since then it has stabilised.
An environment-related tax is levied on goods or activities that have a proven specific negative impact on the environment.
Environmental taxes can be used as policy instrument to change behaviour: they put a price on the harmful side effects of activities on the environment. At the same time they raise public revenues. Environmental tax reform aims to shift the tax burden away from taxes on income and capital and towards taxes on consumption, pollution, and inefficient use of energy and resources. This shift can be monitored by looking at environmental taxes as a percentage of total taxes and social contributions.
The increase in the share of total tax revenues accounted for by environmental taxes between 1990 and 1996 was mainly caused by the increase in excise rates for motor fuels and the intro-duction of the energy tax. Since then, no major new initiatives for environmental tax reform have been undertaken. The introduction of the packaging tax and the (temporary) introduction of a tax on air travel have had little effect on the overall share of these taxes. Taxes on energy use, such as excise on petrol and other fuels and energy tax, constitute 60 percent of environ-mental taxes. The remainder is accounted for by taxes on transport (motor vehicle tax, car and motorcycle tax), use of resources and pollution.
5.2.1 Environmental taxes as share of total tax revenues
Source: Statistics Netherlands, Environmental accounts of the Netherlands 2009.
%
0
2
4
6
8
10
12
14
16
20092008200720062005200420032002200120001999199819971996199519941993199219911990
46 Statistics Netherlands
5.3 Energy prices
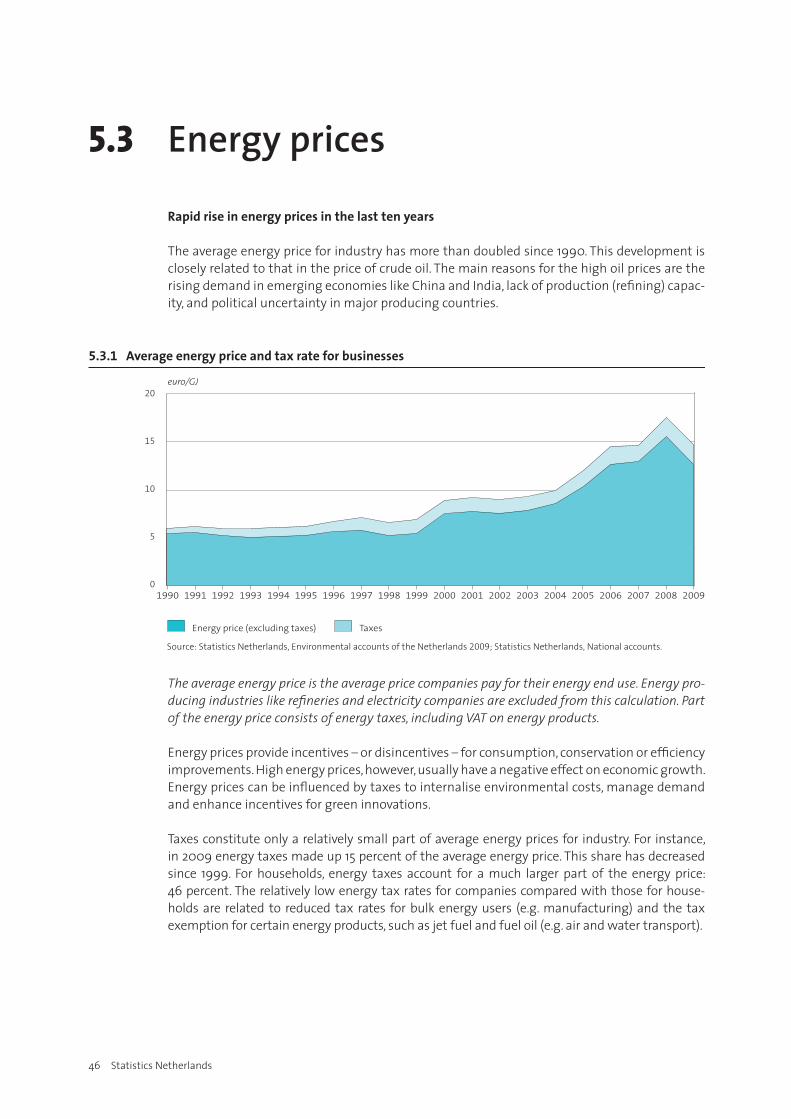
Rapidriseinenergypricesinthelasttenyears
The average energy price for industry has more than doubled since 1990. This development is closely related to that in the price of crude oil. The main reasons for the high oil prices are the rising demand in emerging economies like China and India, lack of production (refining) capac-ity, and political uncertainty in major producing countries.
The average energy price is the average price companies pay for their energy end use. Energy pro-ducing industries like refineries and electricity companies are excluded from this calculation. Part of the energy price consists of energy taxes, including VAT on energy products.
Energy prices provide incentives – or disincentives – for consumption, conservation or efficiency improvements. High energy prices, however, usually have a negative effect on economic growth. Energy prices can be influenced by taxes to internalise environmental costs, manage demand and enhance incentives for green innovations.
Taxes constitute only a relatively small part of average energy prices for industry. For instance, in 2009 energy taxes made up 15 percent of the average energy price. This share has decreased since 1999. For households, energy taxes account for a much larger part of the energy price: 46 percent. The relatively low energy tax rates for companies compared with those for house-holds are related to reduced tax rates for bulk energy users (e.g. manufacturing) and the tax exemption for certain energy products, such as jet fuel and fuel oil (e.g. air and water transport).
5.3.1 Average energy price and tax rate for businesses
Source: Statistics Netherlands, Environmental accounts of the Netherlands 2009; Statistics Netherlands, National accounts.
Energy price (excluding taxes) Taxes
euro/GJ
200920082007200620052004200320022001200019991998199719961995199419931992199119900
5
10
15
20
Green growth in the Netherlands 47
5.4 Carbon emission trading
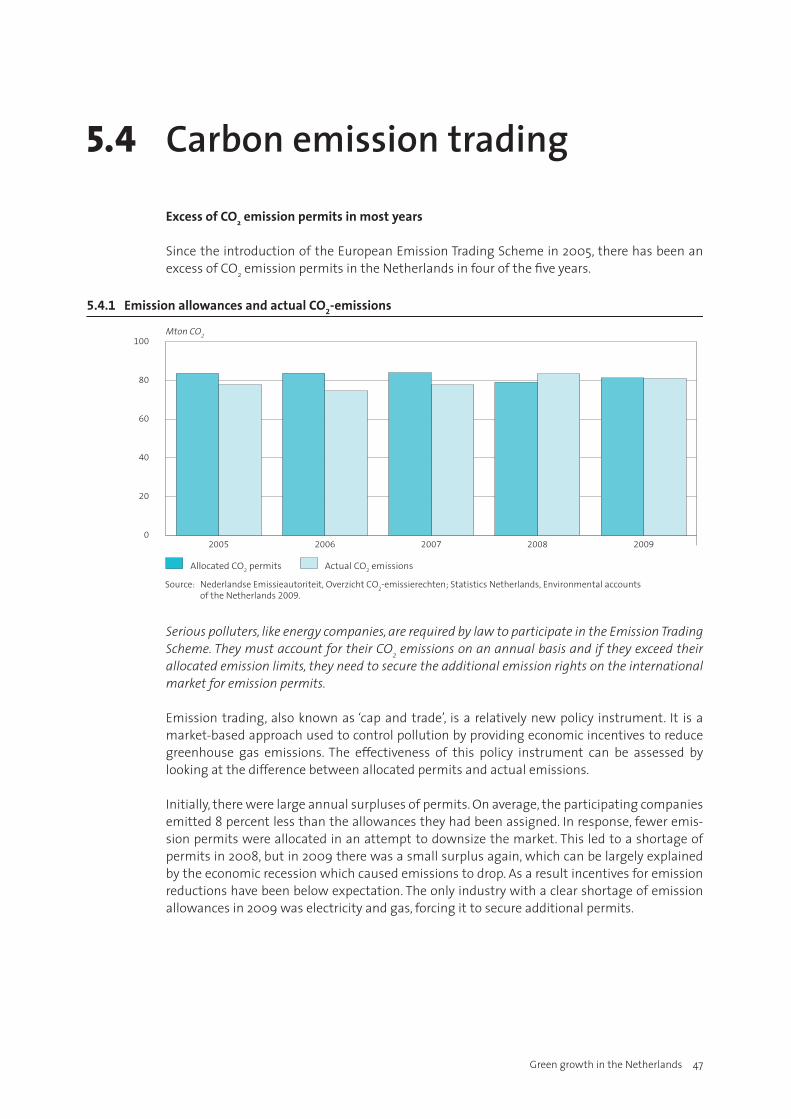
ExcessofCO2emissionpermitsinmostyears
Since the introduction of the European Emission Trading Scheme in 2005, there has been an excess of CO2 emission permits in the Netherlands in four of the five years.
Serious polluters, like energy companies, are required by law to participate in the Emission Trading Scheme. They must account for their CO2 emissions on an annual basis and if they exceed their allocated emission limits, they need to secure the additional emission rights on the international market for emission permits.
Emission trading, also known as ‘cap and trade’, is a relatively new policy instrument. It is a market-based approach used to control pollution by providing economic incentives to reduce greenhouse gas emissions. The effectiveness of this policy instrument can be assessed by looking at the difference between allocated permits and actual emissions.
Initially, there were large annual surpluses of permits. On average, the participating companies emitted 8 percent less than the allowances they had been assigned. In response, fewer emis-sion permits were allocated in an attempt to downsize the market. This led to a shortage of permits in 2008, but in 2009 there was a small surplus again, which can be largely explained by the economic recession which caused emissions to drop. As a result incentives for emission reductions have been below expectation. The only industry with a clear shortage of emission allowances in 2009 was electricity and gas, forcing it to secure additional permits.
5.4.1 Emission allowances and actual CO2-emissions
Source: Nederlandse Emissieautoriteit, Overzicht CO2-emissierechten; Statistics Netherlands, Environmental accounts of the Netherlands 2009.
Actual CO2 emissionsAllocated CO2 permits
Mton CO2
0
20
40
60
80
100
20092008200720062005
48 Statistics Netherlands
5.5 Environmental investment
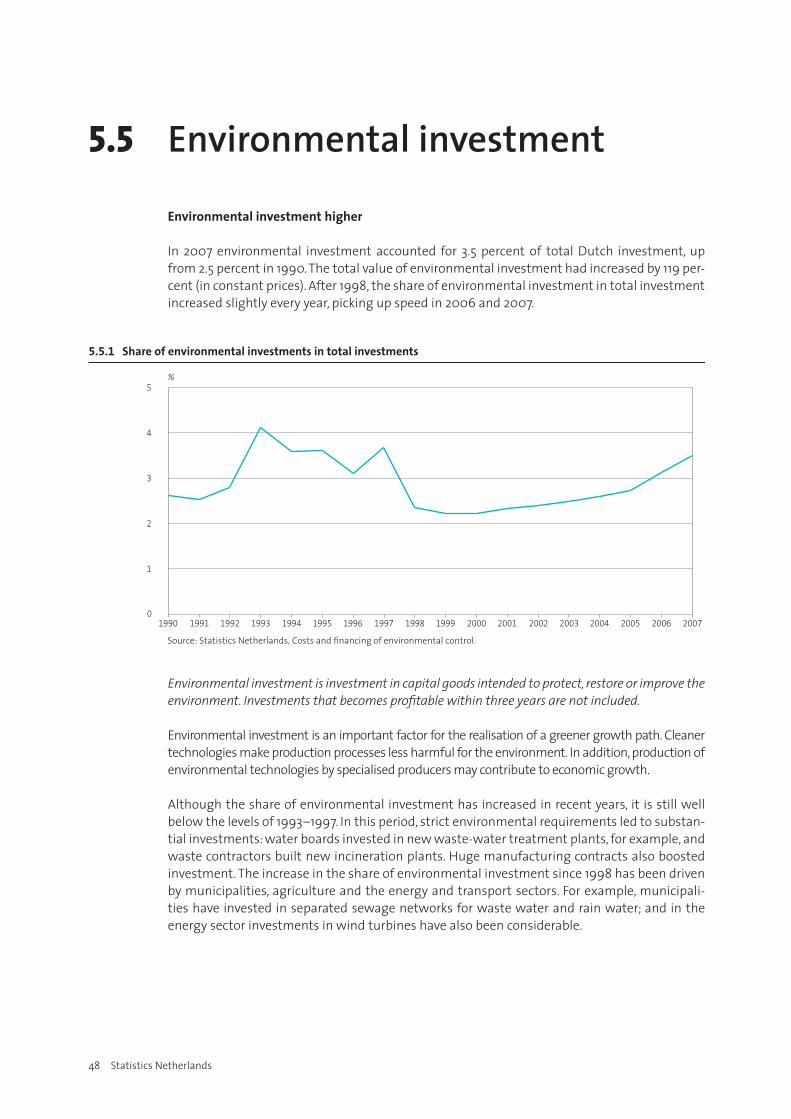
Environmentalinvestmenthigher
In 2007 environmental investment accounted for 3.5 percent of total Dutch investment, up from 2.5 percent in 1990. The total value of environmental investment had increased by 119 per-cent (in constant prices). After 1998, the share of environmental investment in total investment increased slightly every year, picking up speed in 2006 and 2007.
Environmental investment is investment in capital goods intended to protect, restore or improve the environment. Investments that becomes profitable within three years are not included.
Environmental investment is an important factor for the realisation of a greener growth path. Cleaner technologies make production processes less harmful for the environment. In addition, production of environmental technologies by specialised producers may contribute to economic growth.
Although the share of environmental investment has increased in recent years, it is still well below the levels of 1993–1997. In this period, strict environmental requirements led to substan-tial investments: water boards invested in new waste-water treatment plants, for example, and waste contractors built new incineration plants. Huge manufacturing contracts also boosted investment. The increase in the share of environmental investment since 1998 has been driven by municipalities, agriculture and the energy and transport sectors. For example, municipali-ties have invested in separated sewage networks for waste water and rain water; and in the energy sector investments in wind turbines have also been considerable.
5.5.1 Share of environmental investments in total investments
Source: Statistics Netherlands, Costs and �nancing of environmental control.
%
0
1
2
3
4
5
200720062005200420032002200120001999199819971996199519941993199219911990
Green growth in the Netherlands 49
5.6 Green jobs
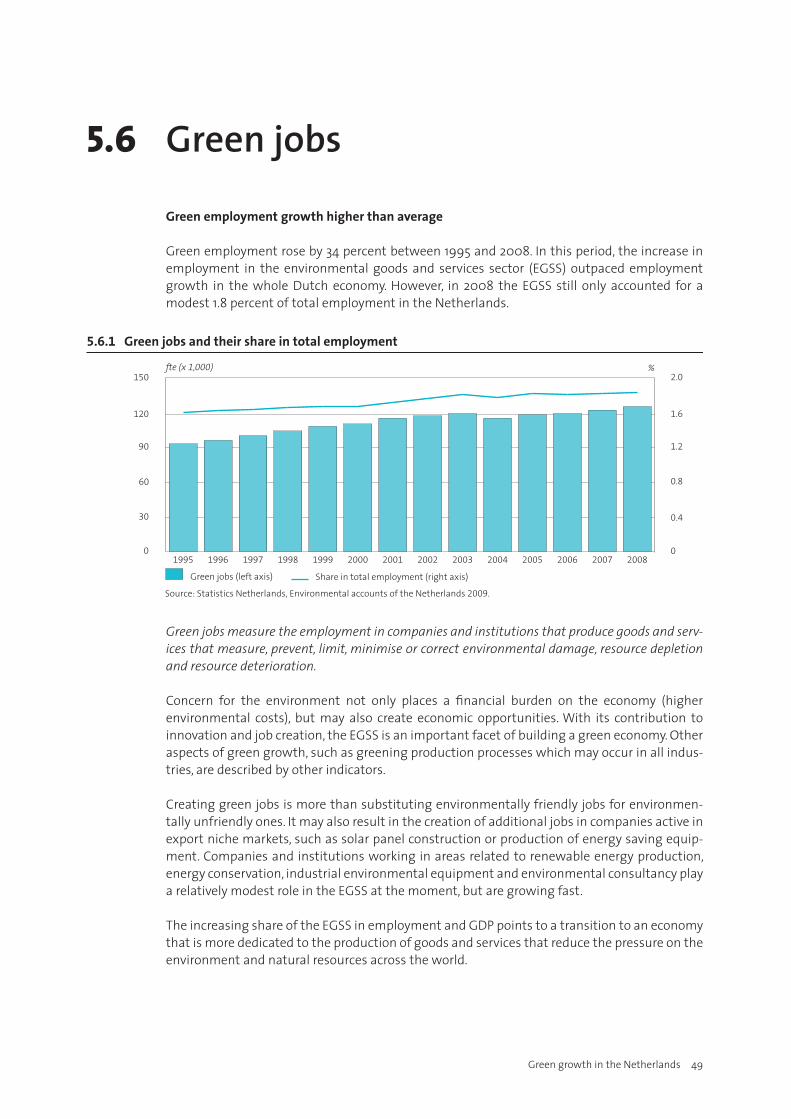
Greenemploymentgrowthhigherthanaverage
Green employment rose by 34 percent between 1995 and 2008. In this period, the increase in employment in the environmental goods and services sector (EGSS) outpaced employment growth in the whole Dutch economy. However, in 2008 the EGSS still only accounted for a modest 1.8 percent of total employment in the Netherlands.
Green jobs measure the employment in companies and institutions that produce goods and serv-ices that measure, prevent, limit, minimise or correct environmental damage, resource depletion and resource deterioration.
Concern for the environment not only places a financial burden on the economy (higher environmental costs), but may also create economic opportunities. With its contribution to innovation and job creation, the EGSS is an important facet of building a green economy. Other aspects of green growth, such as greening production processes which may occur in all indus-tries, are described by other indicators.
Creating green jobs is more than substituting environmentally friendly jobs for environmen-tally unfriendly ones. It may also result in the creation of additional jobs in companies active in export niche markets, such as solar panel construction or production of energy saving equip-ment. Companies and institutions working in areas related to renewable energy production, energy conservation, industrial environmental equipment and environmental consultancy play a relatively modest role in the EGSS at the moment, but are growing fast.
The increasing share of the EGSS in employment and GDP points to a transition to an economy that is more dedicated to the production of goods and services that reduce the pressure on the environment and natural resources across the world.
5.6.1 Green jobs and their share in total employment
Source: Statistics Netherlands, Environmental accounts of the Netherlands 2009.
Green jobs (left axis) Share in total employment (right axis)
0
30
60
90
120
150
200820072006200520042003200220012000199919981997199619950
0.4
0.8
1.2
1.6
2.0fte (x 1,000) %

Green growth in the Netherlands 51
ReferencesAgentschap NL (2010). Nederlands afval in cijfers: gegevens 2000–2008. Utrecht: Agentschap NL.
Agricola, H.J., Strien, A.J. van, Boone, J.A., Dolman, M.A., Goossen, C.M., Vries, S. de, Wulp, N.Y. van der, Groenmeijer, L.M.G., Lukey, W.F. & Til, R.J. van (2009). Achtergronddocument Nulmeting Effectindicatoren Monitor Agenda Vitaal Platteland. Werkdocument WOT Natuur & Milieu 131. Wageningen.
Delft, J.J.C.W. van, Creemers, R.C.M. & Spitzen-van der Sluijs A.M. (2007). Basisrapport Rode Lijst Amfibieën en Reptielen volgens Nederlandse en IUCN-criteria.Nijmegen: Stichting RAVON.
European Commission (2009). GDP and beyond: measuring progress in a changing world, Communication from the Commission to the Council and the European Parliament. Brussels: European Commission.
GfK / Nederlands Visbureau (2009). Ontwikkelingen vis, schaal- en schelpdieren Nederland. Presentation 16-3-2009.
Hustings, F., Borggreve, C. , Turnhout, C. van & Thissen, J. (2004). Basisrapport voor de Rode Lijst Vogels volgens Nederlandse en IUCN-criteria. Onderzoeksrapport 2004/13. Beek-Ubbergen: SOVON Vogelonderzoek Nederland.
IPCC (2007). Fourth Assessment Report, Climate Change 2007. Cambridge: Cambridge University Press.
Knol, A. & Staatsen, B.A.M. (2005). Trends in the environmental burden of disease in the Netherlands , 1980–2020. Rapport 500029001. Bilthoven: Rijksinstituut voor Volksgezondheid en Milieu.
Marine Stewardship Council (2010). http://www.msc.org.
Ministry of Housing, Spatial Planning and Environment (2003). Landelijk
Afvalbeheerplan 2002–2012. 21777/206, 21778/206. The Hague: Ministerie van VROM.
Ministry of Housing, Spatial Planning and Environment (2005). Nota Ruimte: Ruimte voor ontwikkeling. Planologische Kernbeslissing deel 4. The Hague: Ministerie van VROM.
Nederlandse Emissieautoriteit (2010). Overzicht CO2-emissierechten 2008–2012. Den Haag: NEa.
OECD (2008). The Global Project on “Measuring the Progress of Societies”. www.oecd.org/ progress.
OECD (2011a). Green Growth Strategy Synthesis Report. C(2011)29. Paris: OECD.
OECD (2011b). Monitoring Progress Towards OECD Green Growth Indicators. C(2011)30. Paris: OECD.
OECD (2011c). Draft Green Growth Synthesis Report. C(2011)29/REV1. Paris: OECD.
PBL Netherlands Environmental Assessment Agency (2009). Natuurbalans 2009. Bilthoven: PBL.
PBL Netherlands Environmental Assessment Agency (2010). Balans van de Leefomgeving. Bilthoven: PBL.
Probos (2008). Kerngegevens bos en hout in Nederland. Wageningen: Probos.
Rockström, J., Steffen, W., et al. (2009). A safe operating space for humanity. Nature, 461(7263), 472–475.
Statistics Netherlands / PBL Netherlands Environmental Assessment Agency (2009). Environmental Data Compendium. Den Haag/Bilthoven: CBS/PBL. http://www.compendiumvoordeleefomgeving.nl/indicatoren/nl1478.
Statistics Netherlands (2010a). Balances of minerals and heavy metals. The Hague/Heerlen: Statistics Netherlands.
Statistics Netherlands (2010b). Bedrijfsafval 2009. The Hague/Heerlen: Statistics Netherlands.
52 Statistics Netherlands
Statistics Netherlands (2010c). Costs and financing of environmental control. The Hague/ Heerlen: Statistics Netherlands.
Statistics Netherlands (2010d). Environmental accounts of the Netherlands 2009. The Hague/Heerlen: Statistics Netherlands.
Statistics Netherlands (2010e). Land use statistics. The Hague/Heerlen: Statistics Netherlands.
Statistics Netherlands (2010f). Maatwerktabellen milieutechnologie. http://www.cbs.nl/NR/rdonlyres/54E494DA-16A9-4AFB-B040-172C02866ACF/0/Maatwerktabellenmilieutechnologie151010.xls
Statistics Netherlands (2010g). Municipal waste in the Netherlands 2009. The Hague/Heerlen: Statistics Netherlands.
Statistics Netherlands (2010h). National accounts. The Hague/Heerlen: Statistics Netherlands.
Statistics Netherlands (2010i). Renewable energy in The Netherlands 2009. The Hague/Heerlen: Statistics Netherlands.
Stern, N., Peters, S., Bakhshi, V., Bowen, A., Cameron, C., Catovsky, S., Crane, D., Cruickshank, S., Dietz, S., Edmonson, N., Garbett, S.-L., Hamid, L., Hoffman, G., Ingram, D., Jones, B., Patmore, N., Radcliffe, H., Sathiyarajah, R., Stock, M., Taylor, C., Vernon, T., Wanjie, H., & Zenghelis, D. (2006). Stern Review: The Economics of Climate Change. London: HM Treasury.http://www.cambridge.org/gb/knowledge/isbn/item1164284/?site_locale=en_GB
Stiglitz, J.E., Sen, A. & Fitoussi, J-P. (2008). Report by the Commission on the Measurement of Economic Performance and Social Progress. www.stiglitz-sen-fitoussi.frSwaay, C.A.M. van (2006). Basisrapport Rode Lijst Dagvlinders. Rapport VS2006.002. Wageningen: De Vlinderstichting.
Thissen, J.B.M., Bal, D., Iongh, H.H. de & Strien, A.J. van (2009). The 2006 national Red List of mammals of the Netherlands and a IUCN Regional Red List. Lutra, 52(1), 23–35.
UNEP (2009). Global Green New Deal Policy Brief. http://www.unep.org/pdf/A_Global_Green_New_Deal_Policy_Brief.pdf
UNEP (2011). Towards a Green Economy: Pathways to Sustainable Development and Poverty Eradication. A synthesis Report for Policy Makers. http://www.unep.org/greeneconomy/
Vewin Association of Dutch Water Companies (2010a). Drinking Water Fact sheet 2010. Rijswijk: Vewin.
Vewin Association of Dutch Water Companies (2010b). Dutch Drinking Water Statistics 2008. The water cycle from source to tap. Report 2009/95/6259. Rijswijk: Vewin.
Zoogdierenvereniging VZZ (2007). Basisrapport voor de Rode Lijst Zoogdieren volgens Nederlandse en IUCN-criteria. Rapport 2006.027. Arnhem: VZZ.

Green growth in the Netherlands 53
Contributors to this publication
Authors
Kees BaldéAnne BoelensEllen BrinksmaBram EdensSjoerd HiethaarPaul KleinSjoerd Schenau
Editors
Lieneke HoeksmaGeert Nielander
Withthecontributionof
Roel Delahaye, Isabel van Geloof, Cor Graveland, Ron de Heij, Maarten van Rossum, Reinoud Segers and Kees Jan Wolswinkel.


![growth Perspective taiwan – netherlands business relations · 1 2011 Huygens XC Ing. Pim de Bokx BSc. [GROWTH PERSPECTIVE TAIWAN – NETHERLANDS BUSINESS RELATIONS] [How Business](https://img.pdfslide.net/doc/110x75/5e0f797b78156c2f3106fd57/growth-perspective-taiwan-a-netherlands-business-relations-1-2011-huygens-xc-ing.jpg)