Embed Size (px)
Citation preview

www.mobilevce.com © 2009 Mobile VCE
Green Radio – Towards Sustainable Wireless Networks 8th July 2010
Steve McLaughlin
University of Edinburgh

www.mobilevce.com © 2009 Mobile VCE
Presentation Overview
Why Green Radio?
Green Radio as an Enabler
Metrics and Measures: What and Where?
Green Radio Research Challenges
Conclusions

www.mobilevce.com © 2009 Mobile VCE
Why Green Radio? Operator & Manufacturer Perspective
Increasing energy costs with higher base station site density and energy price trends A typical UK mobile network consumes 40 MW
Overall this is a small % of total UK energy consumption, but efficient communications can save energy in other industries
Energy cost and grid availability limit growth in emerging markets (high costs for diesel generators)
Corporate Responsibility targets set to reduce CO2 emissions and environmental impacts of networks Vodafone1 - “Group target to reduce CO2 emissions by
50% by 2020, from 2006/07 levels”
Orange2: “Reduce our greenhouse emissions per customer by 20% between 2006 and 2020”
1. http://www.vodafone.com/etc/medialib/attachments/cr_downloads.Par.25114.File.tmp/CR%20REPORT_UK-FINAL%20ONLINE_180908_V6.pdf 2. http://www.orange.com/en_EN/tools/boxes/documents/att00005072/CSR_report_2007.pdf

www.mobilevce.com © 2009 Mobile VCE
Types of Energy
Embodied energy Energy used in raw material extraction, transport,
manufacture, assembly, installation of a product or service including disassembly, deconstruction and decomposition
Operating energy Energy expended over the operational lifetime of the
product In VLSI devices the embodied energy can be 2.5 – 3 times
the operating energy but this can be reduced for a recycled handset!

www.mobilevce.com © 2009 Mobile VCE
Where is the Energy Used3?
For the operator, 57% of electricity use is in radio access
Operating electricity is the dominant energy requirement at base stations
For mobile user devices, most of the energy is expended during manufacture
9kg CO2
4.3kg CO2
2.6kg CO2
8.1kg CO2
Mobile
CO2 emissions per subscriber per year3
Operation
Embodied energy
Base station
3. T. Edler, Green Base Stations – How to Minimize CO2 Emission in Operator Networks, Ericsson, Bath Base Station Conference 2008

www.mobilevce.com © 2009 Mobile VCE
Base Station Power Use @ 20035
5. H. Karl, “An overview of energy-efficiency techniques for mobile communication systems,” Telecommunication Networks Group, Technical University Berlin, Tech. Rep. TKN-03-XXX, September 2003. [Online]. Available: http://www-tkn.ee.tu-berlin.de/∼karl/WG7/
AG7Mobikom-EnergyEfficiency-v1.0.pdf 3.8 kW AC > 120 W RF

www.mobilevce.com © 2009 Mobile VCE
Rect- ifier 76% Base
Station 30%
LTE Base Station Efficiency
We make the following assumptions compared to the Nortel GSM model : Simple climate control – free air cooling only No feeder cable losses – mast head amplifiers Base Stn PA uses “Nujira” style power supply controller
100% Antenna
85% Efficient 40% Efficient
Under this model saving X% on Base Station PA power yields ~X% reduction in total power
Cool- ing
90%
90% Efficient
www.mobilevce.com © 2009 Mobile VCE
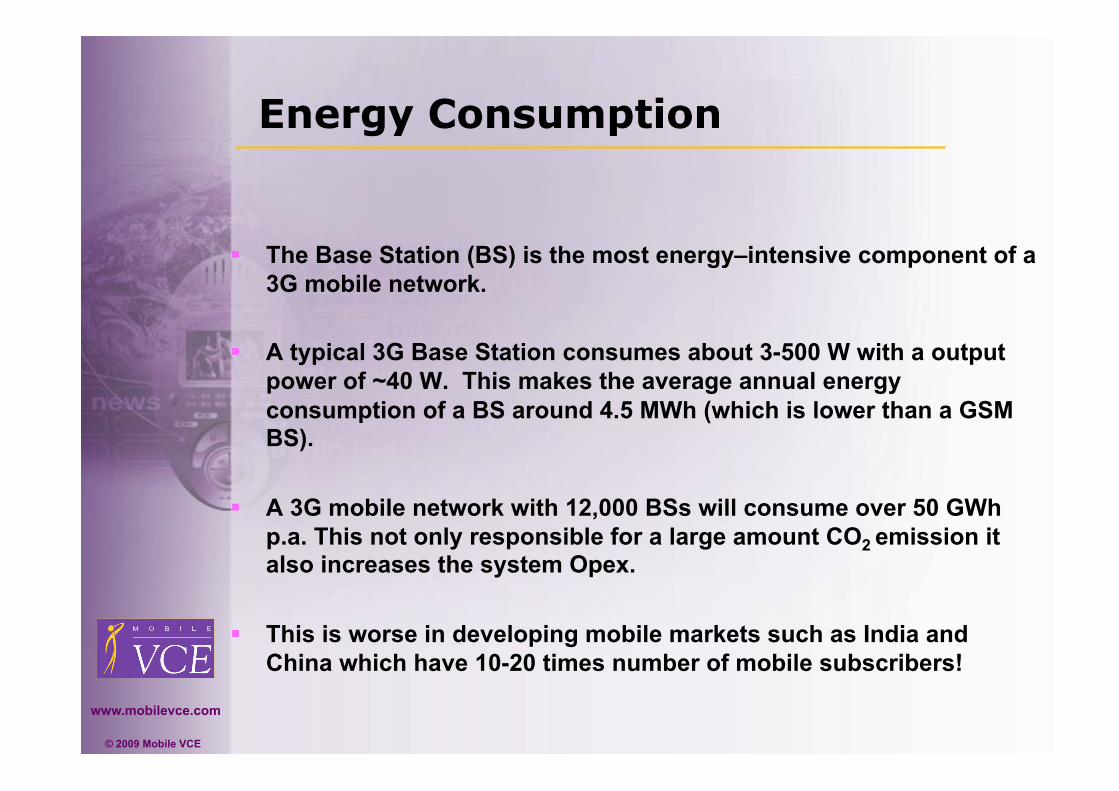
Energy Consumption
The Base Station (BS) is the most energy–intensive component of a 3G mobile network.
A typical 3G Base Station consumes about 3-500 W with a output power of ~40 W. This makes the average annual energy consumption of a BS around 4.5 MWh (which is lower than a GSM BS).
A 3G mobile network with 12,000 BSs will consume over 50 GWh p.a. This not only responsible for a large amount CO2 emission it also increases the system Opex.
This is worse in developing mobile markets such as India and China which have 10-20 times number of mobile subscribers!

www.mobilevce.com © 2009 Mobile VCE
UK Network Consumption 2004-20084
4. CR review, Vodafone UK, Corporate Responsibility 2007/08
www.mobilevce.com © 2009 Mobile VCE
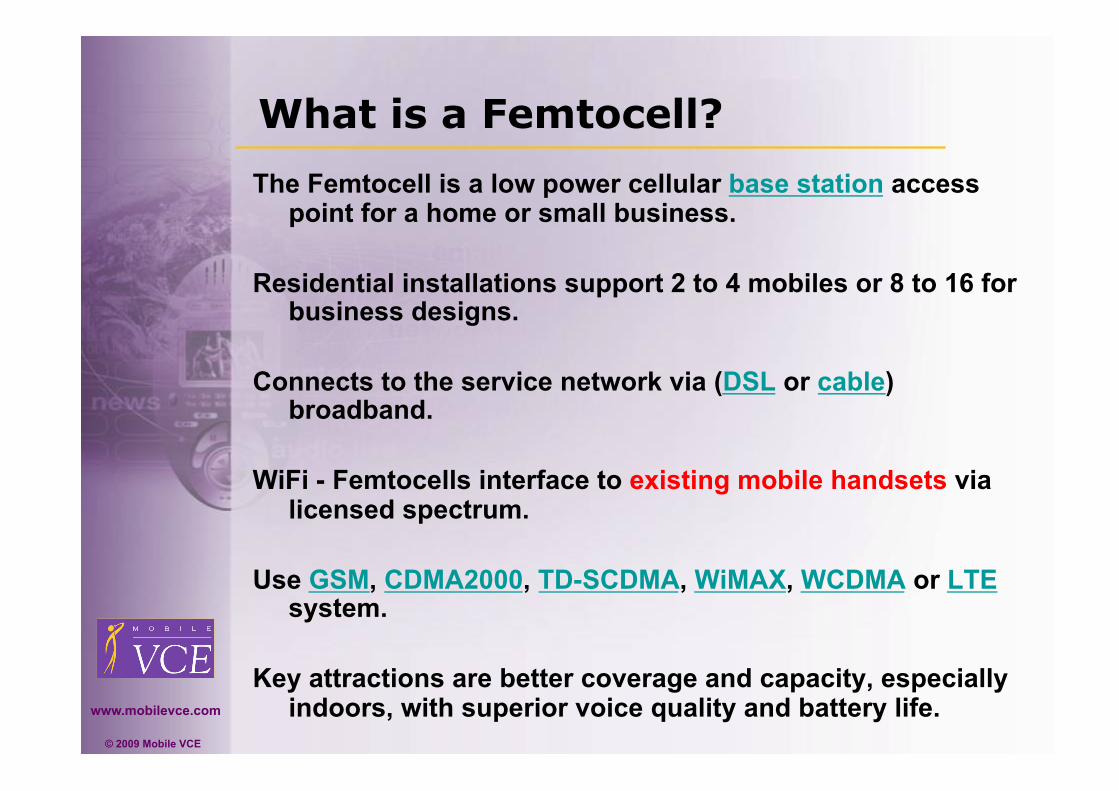
What is a Femtocell?
The Femtocell is a low power cellular base station access point for a home or small business.
Residential installations support 2 to 4 mobiles or 8 to 16 for business designs.
Connects to the service network via (DSL or cable) broadband.
WiFi - Femtocells interface to existing mobile handsets via licensed spectrum.
Use GSM, CDMA2000, TD-SCDMA, WiMAX, WCDMA or LTE system.
Key attractions are better coverage and capacity, especially indoors, with superior voice quality and battery life.

www.mobilevce.com © 2009 Mobile VCE
Femtocells – further energy reduction!

www.mobilevce.com © 2009 Mobile VCE
Low hanging fruit ..
Optimise rectifier
1800 MHz Cut-off at night-time
2G modernisation
Power Saving Features (software controlled PA bias)
Remote radio heads (RRH)
Use of free cooling systems and operate at higher thermostat settings
Improve measurements of energy usage (Automatic Meter Reading), and upgrade energy inefficient components – e.g. fans, lighting control, ..

www.mobilevce.com © 2009 Mobile VCE
Other wireless comparisons
IEEE 802.11 Wi-Fi laptop access is only 1–2% efficient when we compare radiated power to total required drive power6.
(Transmit power of 20 – 100 mW for an AC power drain of 2 – 8 W)
6. WWW.atheros.com/pt/whitepapers/atheros_power_whitepaper.pdf
www.mobilevce.com © 2009 Mobile VCE
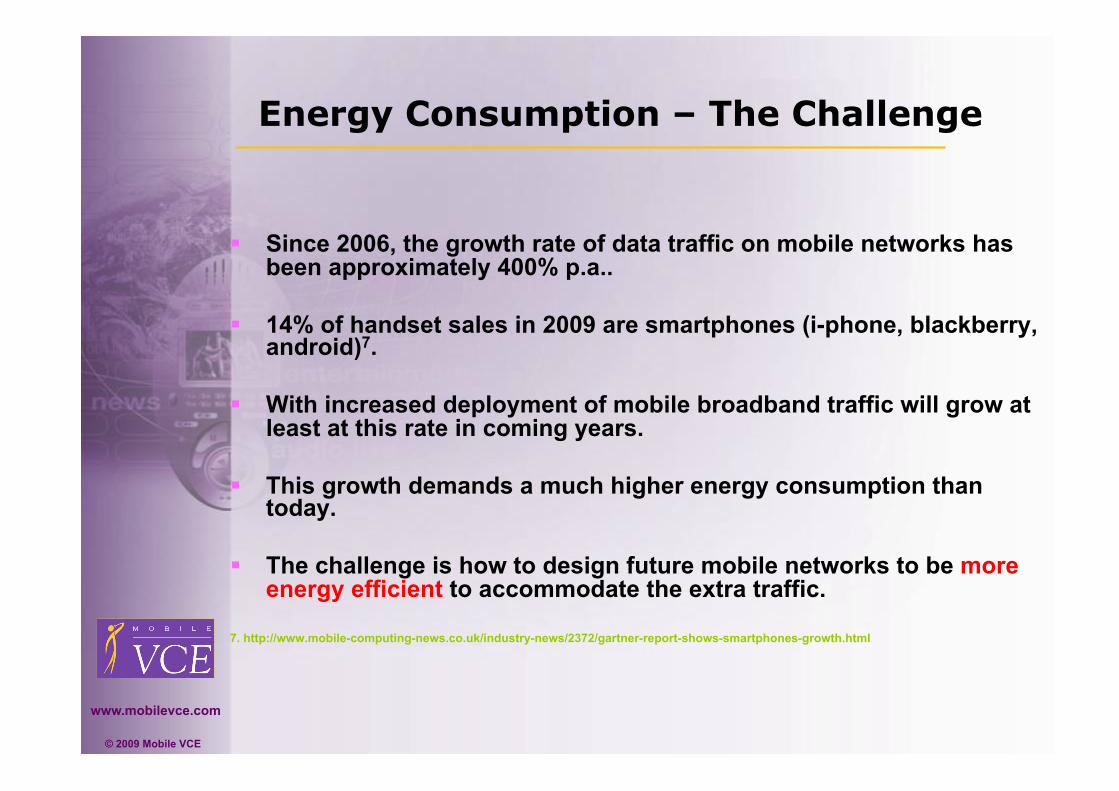
Energy Consumption – The Challenge
Since 2006, the growth rate of data traffic on mobile networks has been approximately 400% p.a..
14% of handset sales in 2009 are smartphones (i-phone, blackberry, android)7.
With increased deployment of mobile broadband traffic will grow at least at this rate in coming years.
This growth demands a much higher energy consumption than today.
The challenge is how to design future mobile networks to be more energy efficient to accommodate the extra traffic.
7. http://www.mobile-computing-news.co.uk/industry-news/2372/gartner-report-shows-smartphones-growth.html

www.mobilevce.com © 2009 Mobile VCE
Energy use cannot follow traffic growth without significant increase in energy consumption
Must reduce energy use per data bit carried Number of base stations increasing
Operating power per cell must reduce Green radio is a key enabler for cellular growth while guarding against increased environmental impact
Green Radio as an Enabler8
Cos
ts
Time
Voice Data
Revenue
Traffic Diverging expectations for traffic and revenue growth
Trends7:
Avg annual increase in data traffic is 400%
Avg annual increase in revenue is 23%
Number of base stations / area increasing for higher capacity
Revenue growth constrained and dependent on new services
8. Traffic / revenue curve from “The Mobile Broadband Vision - How to make LTE a success”, F. Meywerk, Senior Vice President Radio Networks, T-Mobile Germany, LTE World Summit, November 2008, London

www.mobilevce.com © 2009 Mobile VCE
Green Radio Scenarios Two Market Profiles: 1. Developed World
Developed Infrastructure Saturated Markets Quality of Service Key Issue Drive is to Reduce Costs
2. Emerging Markets Less Established Infrastructure Rapidly Expanding Markets Large Geographical Areas Often no mains power supply
– power consumption a major issue

www.mobilevce.com © 2009 Mobile VCE
Over a year, 1m2 solar panel produces ~400 kWh energy, or about 10% of a 3G macrocell BS requirement (in London, < 5%).
Solar panels in some locations now provide the energy requirement for a small “rural or village” BS see, e.g., the WorldGSMTM 100 W BS from VNL. 10. http://www.vnl.in/technology/sites/

www.mobilevce.com © 2009 Mobile VCE
Key Research Questions
What would be an appropriate green network architecture ? A low power wireless network & backhaul that still provides
good quality of service What are the best radio techniques?
Need to consider across all layers of the protocol stack that collectively achieve significiant (100x?) power reduction
Another issue: Given that most of the energy associated with mobiles is in the manufacture (~85%) how do we make their use sustainable?

www.mobilevce.com © 2009 Mobile VCE
Architecture: Energy Efficiency Analysis
The image cannot be displayed. Your computer may not have enough memory
The image cannot be displayed. Your computer may not have enough memory
The image cannot be displayed. Your computer may not have enough memory The image
cannot be displayed. Your computer may not have enough memory The image
cannot be displayed. Your computer may not have enough memory
The image cannot be displayed. Your computer may not have enough memory
The image cannot be
The image cannot be
The image cannot be
The image cannot be
The image cannot be
The image cannot be
Macro Micro Pico Femto
RRM
BER/FER vs Eb/No
Link Budget
Mobility/Traffic Models
Packet scheduling, handover, power and load control
Differentiated QoS, fast fading effects, UE speed, MIMO
Energy consumption is proportional to distance
User Equip (UE) movement, traffic types & mixes
Step1: Large vs. small cells applying the energy metrics
Step2: Overlay Source & Network Coding and/or Cooperative Networking
Step3: Evaluate optimum cell size from the following perspectives…….
www.mobilevce.com © 2009 Mobile VCE
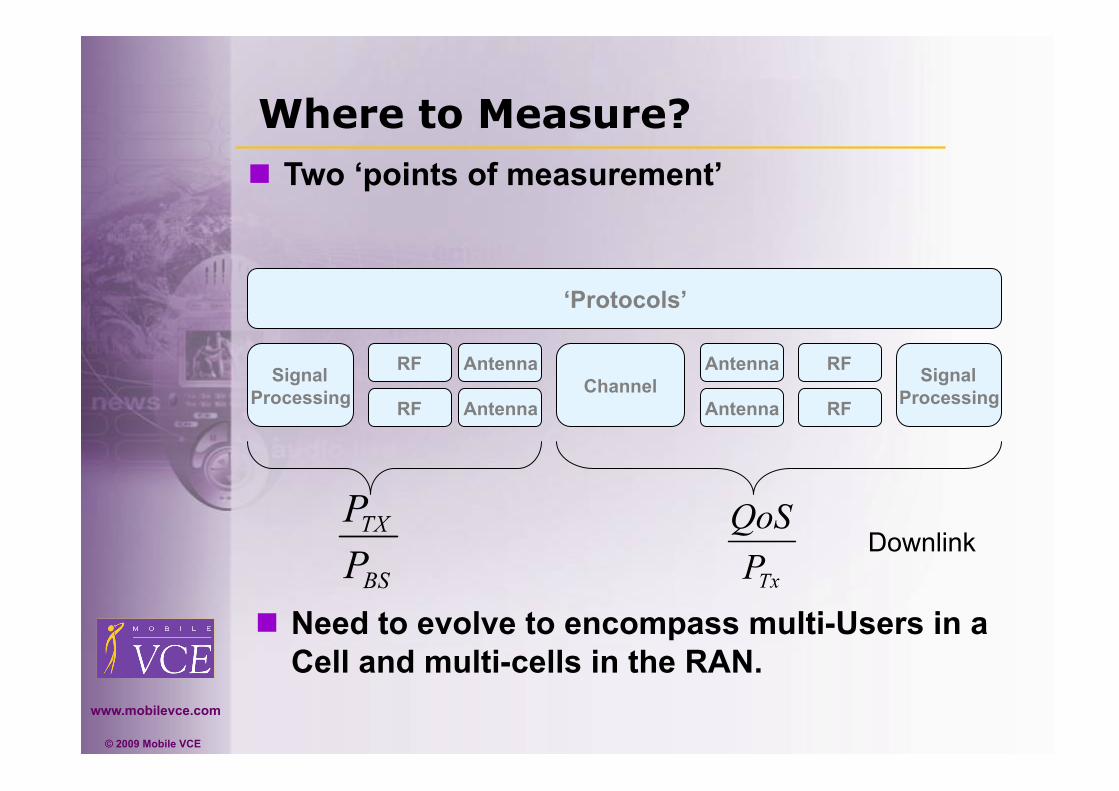
Where to Measure?
‘Protocols’
Signal Processing RF
Channel
Downlink
RF
Antenna
Antenna Signal Processing RF
RF
Antenna
Antenna
Two ‘points of measurement’
Need to evolve to encompass multi-Users in a Cell and multi-cells in the RAN.

www.mobilevce.com © 2009 Mobile VCE
BS Efficiency Model
This linear model is a good first approximation, but: Omits the antenna – not appropriate when relating total
BS power to RF radiated power Simple, linear, multiplicative model unlikely to match
reality
Total RF Power
Tota
l BS
Pow
er
Ideal
More Realistic ‘Bad News’
‘Urquhart Diagram’

www.mobilevce.com © 2009 Mobile VCE
Metrics: RAN Energy Model
RAN: Whole RAN or RAN segment of fixed geographic area ARAN with Ns cell sites and Nc cells giving variable cell density Cd
RAN of fixed Geographic area ARAN
Our energy evaluations apply to the RAN ETotal : Total energy consumed in RAN lifetime EEmbod : Embodied energy consumed in RAN lifetime EOpex : Operational energy consumed in RAN lifetime

www.mobilevce.com © 2009 Mobile VCE
Energy Performance Metrics
For operational energy, we define a RAN Energy Consumption Rate as
T1 T2
ERAN
ERAN,2
ERAN,1
T
E Energy Consumption
T1 T2
MRAN
MRAN,2
MRAN,1
T
M Data Volume
NB Linearity depicted for illustration purposes only

www.mobilevce.com © 2009 Mobile VCE
LTE Transmission Model
For downlink assume signalling overhead is approx 20-40% of the total transmission Pilot Signals and Cyclic Prefix Broadcast Channel and Synchronisation Signals User specific signalling for resource blocks
20% overhead reasonable for low load or small No of users;
Up to 40% for high load and large No of users The remaining 60-80% of resource blocks are available
for supporting data transmission
Signalling: 20-40% Data Transmission: 60-80%

www.mobilevce.com © 2009 Mobile VCE
Daily Traffic Variation12
Vertical bars show variability in cell traffic load over 24 hour period Change by factor of ~2 from lowest load at 7am to highest at 9pm Significant periods of low network utilisation Expect major load variations between cells Solid trace shows % data in overall carried traffic (3-6%) in 2009
12. H Holma and A Toskala, “LTE for UMTS - OFDMA and SC-FDMA Based Radio Access” John Wiley 2009
Midnight Midday Midnight
7am 9pm

www.mobilevce.com © 2009 Mobile VCE
Sleep Modes: Vodafone Traffic Results
Midnight Midday Midnight
7am
9pm Min is ~25% of the Max value
Significant periods of low network utilisation – corroborated by Nokia traffic data
Also expect big load variations between cells
Optimising Sleep Mode Performance: Minimise Energy (J) per frame of data Minimise Energy (J) per transmitted bit or ECR
Comparing Sleep Mode (Energy E2) with Non-Sleep Mode Systems (Energy E1):
Energy Consumption Gain (ECG) = E2/E1 Energy Reduction Gain = 1-ECG (%)
Calibrate gains in RF Energy Consumption

www.mobilevce.com © 2009 Mobile VCE
GSM Power Saving with software controlled PA bias switching
Average power saving > 10%

www.mobilevce.com © 2009 Mobile VCE
Sleep Mode Control for Power Conservation � Energy savings estimation: 1. Switch off base station/femtocell transmissions in low load conditions 2. Expect that in low load conditions, 20% of the base transmissions are
overheads that could be switched off: 3. For base stations, gating off timeslots in low load transmissions may achieve
energy savings: With close to zero traffic load with 20% signalling overhead, switch off
50% of idle time slots: Power Reduction = 0.5 or 50% If we assume this is achieved for 8 hours from 24 hours Power Reduction = 0.5*0.333 = 0.167 or 16.7% By switching off more slots, higher gains are possible 4. Femtocells: need a different power model but higher energy
reductions may be possible Future work: 1. implement sleep mode control for multi-link scenario based on OFDMA. 2. For transmit power vs delay tradeoff, define energy-efficiency metrics to find
the optimum sleep mode algorithm design
20 April 2009

www.mobilevce.com © 2009 Mobile VCE
Assumptions: 3GPP-LTE (estimated control signaling overhead 43% /PRB) SISO downlink system (20MHz bandwidth) low traffic (information data rate < 1.2 bit/s/Hz) Rayleigh fading channels (1 block length=1 TTI=1ms) Schemes: constant rate transmission: transmit R bits in each block water-filling: optimally allocate 3R bits within every 3 blocks to minimize power consumption (max delay-limit=3ms) awake 1/3: only use the best block in each 3 for transmission
Sleep Mode Control for Power Conservation �
20 April 2009

www.mobilevce.com © 2009 Mobile VCE
Relaying: Approaches from Sensor Networks Researchers have investigated network performance
including for energy constraints: Rodoplu/Meng 2007 investigated the bit per joule capacity
of sensor networks to optimise number of hops Cui/Goldsmith/Bahai 2004 investigated the most energy
efficient approach to applying MIMO/diversity techniques in sensor networks
Sankar/Kramer/Manadayan 2008 investigated energy efficiency of different relaying configurations
Youssef-Massaad/Zheng/Medard 2008 investigated transmission strategies on unit cost basis
Object is to develop these ideas and others towards wireless networks such as LTE

www.mobilevce.com © 2009 Mobile VCE
Initial Study of Energy Efficient Routing
Select multihop route to satisfy chosen routing metric, e.g: Minimum relay transmit power Minimum energy per bit Maximise residual energy for mobile relay
Build a portfolio of such metrics Approach could be extended to general network selection
Source
Relays
Destination

www.mobilevce.com © 2009 Mobile VCE
System model: Energy efficient relaying
The simple three-node configuration consists of a source node S, a relay node R and a destination D.
(a) NC – BS Transmits with constant power
(b) NFC – BS Transmits in a bursty fashion i.e. instantaneous feedback and variable power
(c) CAC – Relay assists, two phases both constant power
(d) CFC- two phases but instantaneous feedback and thus variable power

www.mobilevce.com © 2009 Mobile VCE
Results

www.mobilevce.com © 2009 Mobile VCE
Assessing Energy Efficiency
Energy reduction of relay links difficult to estimate: Wish to identify gains of energy efficient routing
approach Also interested in gains of multihop per se →
ultimately an architecture issue Need to specify correct baseline – single hop or
multihop Need to trade off energy use at source terminal (base
stn or mobile terminal) vs relay terminals What can we say about gains of relaying
75-90% power reduction on wireless links for cell edge users (30-50% of all users)
Varying macrocell/relay density gives further architectural energy reductions

www.mobilevce.com © 2009 Mobile VCE
Femtocells inside Macrocells?
Aim to develop operating curves for small vs large cell analysis. Curves: different user density, RHS all femto i.e. macro switched off. A lower user density in macrocell gives larger power saving (as energy
“overhead” is shared over smaller number of users). The trade-off (minima) points for 30, 60, 120 and 240 users/macrocell
imply 80%, 60% , 40% and 20% respectively for femtocell coverage. Corresponds to energy reduction ratio between 2.5 and 35%.
Embodied (Capex) plus operating (Opex) energy:
power consumption per user for different levels of
macrocell activity & support

www.mobilevce.com © 2009 Mobile VCE
Initial Conclusions: For femtocell and macrocell shared spectrum networks, the
performance of femtocells are seriously effected, if they are located close to a macrocell base station.
When femtocells use different spectrum allocation from macrocell, femtocell’s adaptation can improve dramatically system throughput, especially for distant users at the macrocell edge.
Simulation results examples
Examined area at the macrocell centre, 10 femtocell density scenario, femteocells use different spectral allocation from macrocell.
Examined area in the middle of a macrocell , 10 femtocell density scenario, femtocells use different spectral allocation from macrocell .

www.mobilevce.com © 2009 Mobile VCE
Spectrum Balancing
Switching off networks (or parts of networks) at one or more frequencies, or reducing sectorization in networks, and reallocating users to the frequencies still in use, when experiencing low data traffic load.
Transmission power saving by re-allocating links to a lower frequency band to improve propagation and reduce link loss, when transmission capacity is available in that band.

www.mobilevce.com © 2009 Mobile VCE
Saving by disabling and changing transmission frequencies
Switching off networks (or parts of networks) at a frequency, or reducing sectorisation in networks, by reallocating users to other frequencies at times of low load
Transmission power saving by reallocating links to a lower frequency band to improve propagation whenever capacity is available at that band
www.mobilevce.com © 2009 Mobile VCE
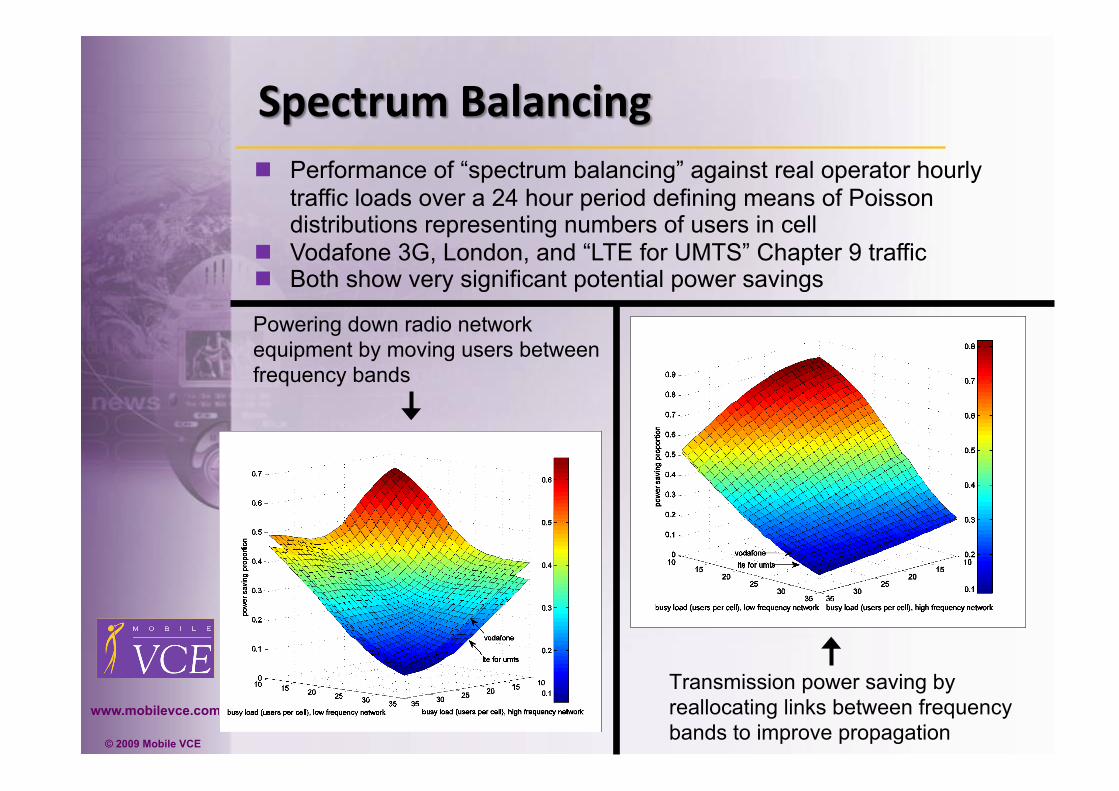
Performance of “spectrum balancing” against real operator hourly traffic loads over a 24 hour period defining means of Poisson distributions representing numbers of users in cell
Vodafone 3G, London, and “LTE for UMTS” Chapter 9 traffic Both show very significant potential power savings
Powering down radio network equipment by moving users between frequency bands
Transmission power saving by reallocating links between frequency bands to improve propagation

www.mobilevce.com © 2009 Mobile VCE
Conclusions
Growth in data transmission requirements for mobile broadband will not bring major revenue increase.
Every industry has published CO2 reduction targets and the mobile and IT communities are not exempt.
Power drain in base-station or access point is the major issue in many wireless systems.
Research challenges exist in system architecture and in techniques to deliver future, more efficient, Green Radio systems.

www.mobilevce.com © 2009 Mobile VCE
References
S. Armour, T. O’Farrell, S. Fletcher, A. Jeffries, D. Lister, S. McLaughlin, J.S. Thompson and P.M. Grant, "Green Radio: Sustainable Wireless Networks", Research brief at: http://kn.theiet.org/communications/green-radio-article.cfm, June 2009
Vodafone UK, Corporate Responsibility Review Report 2007/08
T. Edler, “Green Base Stations – How to Minimize CO2 Emission in Operator Networks”, Bath Base Station Conference 2008, kn.theiet.org/magazine/rateit/communications/Green_radio_file.cfm
H. Karl, “An overview of energy-efficiency techniques for mobile communication systems,” Technical University Berlin, Rep. TKN-03-XXX, September 2003. Online at: http://www-tkn.ee.tu-berlin.de/∼karl/WG7/AG7Mobikom-EnergyEfficiency-v1.0.pdf
F. Meywerk, Traffic / revenue curve from “The Mobile Broadband Vision - How to make LTE a success”, LTE World Summit, November 2008, London
S. Chia, “As the Internet takes to the air, do mobile revenue go sky high?,” IEEE Wireless Communications and Networking Conference, April 2008.
Ofcom Report: “Understanding the environmental impacts of communication systems.” http://www.ofcom.org.uk/research/technology/research/sectorstudies/environment/
H. Holma and A, Toskala, “LTE for UMTS - OFDMA and SC-FDMA Based Radio Access”, John Wiley, ISBN 978-0-470-99401-6, 2009

www.mobilevce.com © 2009 Mobile VCE
Relevant WWW Pages http://www.vodafone.com/etc/medialib/attachments/cr_downloads.Par.25114.File.tmp/CR
%20REPORT_UK-FINAL%20ONLINE_180908_V6.pdf
http://www.orange.com/en_EN/tools/boxes/documents/att00005072/CSR_report_2007.pdf
WWW.atheros.com/pt/whitepapers/atheros_power_whitepaper.pdf
http://www.mobile-computing-news.co.uk/industry-news/2372/gartner-report-shows-smartphones-growth.html
http://www.vnl.in/technology/sites/
http://re.jrcec.europa.eu/energyefficiency
http://www.femtoforum.com
http://www.cpri.info
http://www.nujira.com