Embed Size (px)
Citation preview
R E S E A R C H A N D A N A LYS I S
Greenhouse Gas Emission Estimatesof U.S. Dietary Choices and Food LossMartin C. Heller and Gregory A. Keoleian
Summary
Dietary behavioral choices have a strong effect on the environmental impact associatedwith the food system. Here, we consider the greenhouse gas (GHG) emissions associatedwith production of food that is lost at the retail and consumer level, as well as the potentialeffects on GHG emissions of a shift to dietary recommendations. Calculations are based onthe U.S. Department of Agriculture’s (USDA) food availability data set and literature meta-analysis of emission factors for various food types. Food losses contribute 1.4 kilograms (kg)carbon dioxide equivalents (CO2-eq) capita−1day−1 (28%) to the overall carbon footprintof the average U.S. diet; in total, this is equivalent to the emissions of 33 million averagepassenger vehicles annually. Whereas beef accounts for only 4% of the retail food supply byweight, it represents 36% of the diet-related GHG emissions. An iso-caloric shift from thecurrent average U.S. diet to USDA dietary recommendations could result in a 12% increasein diet-related GHG emissions, whereas a shift that includes a decrease in caloric intake,based on the needs of the population (assuming moderate activity), results in a small (1%)decrease in diet-related GHG emissions. These findings emphasize the need to considerenvironmental costs of food production in formulating recommended food patterns.
Keywords:
dietary recommendationsenvironmental impactfood wastegreenhouse gas (GHG) emissionsindustrial ecologylife cycle assessment (LCA)
Supporting information is availableon the JIE Web site
Introduction
Agriculture and food production are arguably the humanactivities with the largest impact on resource use and envi-ronmental sustainability, and yet we face major food secu-rity concerns, today and for a future expanded population(Foley et al. 2011). The contribution of food production toglobal warming serves as one telling example. Globally, directemissions from agriculture represent 10% to 12% of overallgreenhouse gas (GHG) emissions; when including the impactof fertilizer and chemical production, fuel use, and agricul-turally induced land-use change (which carries large uncer-tainty), the figure rises to 17% to 32% (Bellarby et al. 2008).Though opportunities to reduce these numbers exist through-out the food production chain, technological improvements inagriculture alone—enhanced yields, resource use efficiencies,
Address correspondence to: Martin Heller, Center for Sustainable Systems, University of Michigan, 430 East University, Dana Building, Ann Arbor, MI 48109-1115, USA.Email: [email protected]; Web: http://css.snre.umich.edu/
© 2014 by Yale UniversityDOI: 10.1111/jiec.12174 Editor managing review: Robert Anex
Volume 19, Number 3
and so on—will likely be insufficient to keep pace with popu-lation growth and rising demand for meat and dairy (Garnett2011). Behavioral choices, including shifting diet and minimiz-ing food waste, particularly in developed countries, can havelarge influences. Though transportation, housing, and food (inthat order) are the largest contributors to the carbon footprint(CF) of the typical U.S. household, dietary changes are amongthe most economically effective abatement options (Jones andKammen 2011). In this study, we explore in detail the GHGemissions associated with food loss and diet in the United States.
Food Losses
Recent efforts to quantify food losses have drawn attentionto the great inefficiency they represent. According to UnitedNations (UN) Food and Agriculture Organization estimates,
www.wileyonlinelibrary.com/journal/jie Journal of Industrial Ecology 391
R E S E A R C H A N D A N A LYS I S
roughly one third of the food produced for human consump-tion is lost or wasted globally: 1.3 billion tonnes per year(Gustavsson et al. 2011). Whereas definitions are not universal,here food loss represents the edible amount of food, postharvest,that is available for human consumption, but is not consumedfor any reason. Food waste is a component of food loss and oc-curs when an edible item goes unconsumed as a result of humanaction or inaction, such as food discarded by retailers as a re-sult of appearance or plate waste by consumers. The portion offood losses not considered food waste include natural shrink-age, pest infestation, mold, and other spoilage factors outsideof people’s direct control; in developed countries, where tech-nologies are readily available to prevent them, these losses are asmall fraction. Though food losses occur throughout the supplychain, from agricultural production to household consumption,more than 40% of food losses in the industrialized world oc-cur at the retail and consumer levels (Gustavsson et al. 2011).National-level studies corroborate these estimates: Food lossesin Germany have been estimated at 100 to 180 kilograms (kg)capita−1 year−1 across all stages of the food value chain exceptagricultural production, with 61% occurring at the householdlevel (Kranert et al. [2012], as cited in Beretta et al. [2013]).Beretta and colleagues (2013) estimated that 47% (energy ba-sis) of the food produced to meet the Swiss food demand is lost,with approximately 26% being avoidable; 45% of the avoid-able losses occurred at the private household level. Researchersfrom the U.S. Department of Agriculture (USDA) estimatedfood loss at the retail and consumer levels in the United Statesin 2008 to be 124 kg capita−1 year−1, with a total purchase valueof US$165.6 billion (Buzby and Hyman 2012). Such staggeringstatistics are prompting awareness raising and food waste reduc-tion efforts across the globe. In 2012, the European Commission(EC) set a target to reduce by 50% the food waste in Europe by2025 (European Parliament 2012). The USDA, along with theU.S. Environmental Production Agency (US EPA), launched,in June 2013, the U.S. Food Waste Challenge, aimed at creatinga fundamental shift in thinking and management of food andfood waste (USDA 2013). The UN Environment Programme(UNEP) highlighted food waste as the theme for 2013 WorldEnvironment Day (UNEP 2013). Reducing food loss and foodwaste is recognized as an important strategy in feeding projectedpopulation increases (Lipinski et al. 2013).
Environmental burdens accrue throughout the food life cy-cle, and the environmental impacts associated with the foodsystem have been well documented (Heller and Keoleian 2003;Garnett 2011; Foley et al. 2011). Food losses and food wastetherefore also represent an unnecessary externality cost to soci-ety and the environment. A number of studies aimed at quanti-fying the environmental impacts of food wastes exist. Hall andcolleagues (2009) estimated U.S. food waste by comparing foodsupply with consumption from a human metabolism model and,in a coarse “top-down” estimate, suggested that wasted food ac-counts for 25% of U.S. freshwater use and �4% of total U.S.oil consumption. Cuellar and Webber (2010) used 1995 food-category–specific loss estimates from the USDA as well as theirown food-category–specific estimates of the energy required to
produce, process, transport, and handle U.S. food and con-cluded that the energy embedded in food waste was 0.00214exajoules in 2007, approximately 2% of annual energy con-sumption in the United States. Kummu and colleagues (2012)estimated global food supply-chain losses at the country levelfor crop products intended for human consumption (i.e., notincluding feed and animal-based foods), as well as the resourcesneeded to produce these losses. They found that approximatelyone quarter of the produced food (on a food energy basis) islost, accounting for 24% of total freshwater resources used infood crop production, 23% of global cropland area, and 23% oftotal global fertilizer use. Food losses in North Africa and West-Central Asia account for the largest per capita use of freshwaterand cropland resources, whereas North America and Oceaniafood losses represent the largest per capita fertilizer use.
Venkat (2012) considered the GHG emissions associatedwith food waste in the United States using a life cycle assess-ment (LCA) framework. The study based food waste on the2009 USDA loss-adjusted food availability data series and useda commercial database marketed by the authors to assess theGHG emissions associated with producing individual foods.Venkat reported the total emissions from production, process-ing, packaging, distribution, retail, and disposal of the avoidablefood waste in the United States to amount to 112.9 million met-ric tonnes (MMT) carbon dioxide equivalents (CO2-eq) year−1
(368 kg CO2-eq capita−1 year−1), or approximately 2% of netU.S. GHG emissions for 2009. At 16% of the total emissions,beef represented the single largest contributor from wasted food,even though the quantity of beef wasted was less than 2% oftotal waste by weight. Whereas Venkat’s study offers a firstlook at the GHG emissions connected with food waste, therehave since been notable updates to the USDA’s consumer-levelfood loss estimates. Further, detailed documentation of Venkat’scommercial database is not publically available, making accessto sources and review difficult.
Diet
Changes in both the quantity and quality of the U.S. dietmay hold potential in affecting the CF of food production.The current obesity epidemic, in the United States as wellas other developed nations, garners broad academic, politi-cal, and media attention; the most recent statistics claim that69% of U.S. adults are overweight and 36% are obese (CDC2013). Food overconsumption and obesity contribute not onlyto human health dangers, but also translate directly and indi-rectly into increased agricultural demand, excess resource uti-lization, and concomitant environmental impacts (Blair andSobal 2006; Cafaro et al. 2006). Not only are U.S. residentsoverconsuming, but they are also not eating properly: repeatedassessments find that Americans do not meet the federal di-etary recommendations (Wells and Buzby 2008; Krebs-Smithet al. 2010). Dietary choices influence the environmental costof food consumption (Marlow et al. 2009; Carlsson-Kanyamaand Gonzalez 2009), and research from Germany (Meier andChristen 2013) and Austria (Fazeni and Steinmuller 2011)
392 Journal of Industrial Ecology
R E S E A R C H A N D A N A LYS I S
suggests that a shift from current consumption patterns toGerman Nutrition Society dietary recommendations can resultin reduced environmental impacts from the agri-food sector.Meier and Christen (2013) found an 11% reduction in GHGemissions, 15% less land use, 26% less blue water use, and 7%less primary energy use in a shift from the 2006 German dietto dietary recommendations.
In this article, we offer an updated account of the GHGemissions associated with production of U.S. food losses atthe retail/institution and consumer level using LCA dataaggregated from the literature. We also explore the GHGemission implications of a shift in the U.S. diet towardfood patterns identified in the 2010 Dietary Guidelines forAmericans.
Methods
U.S. Food Consumption and Losses
The Loss-Adjusted Food Availability (LAFA) data series(USDA ERS 2012) serves as a useful proxy for per capita foodconsumption in the United States. The food availability seriesmeasures the use of basic food commodities (e.g., wheat, beef,fruit, and vegetables) by tracking their “disappearance” in theU.S. marketplace. For most commodities, the available supplyis the sum of production, imports and beginning stocks, minusnonfood use (feed and seed, industrial uses), exports, and endingstocks for a given calendar year. In the LAFA data series, thefood availability data for over 200 commodities are modifiedby percent loss assumptions at the primary, retail/institution,and consumer levels. Retail losses include dented cans, unpur-chased holiday foods, spoilage, and the culling of blemishedor misshaped foods. Consumer losses include spoilage, cookingshrinkage, and plate waste.
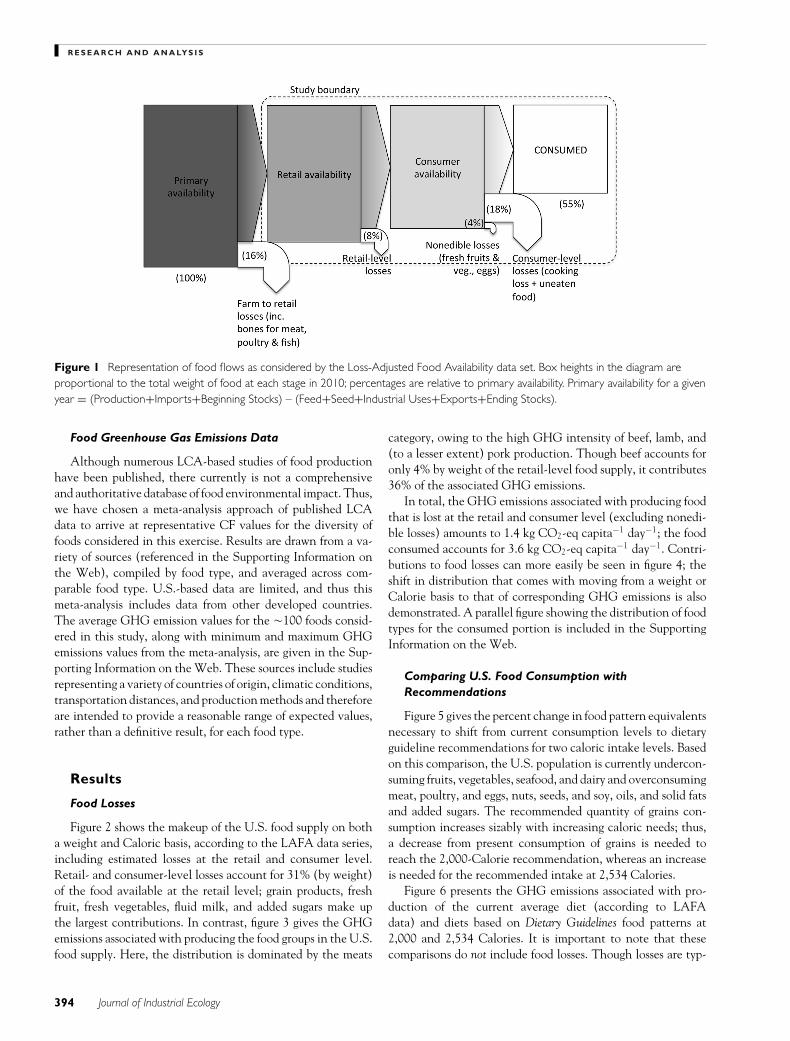
The USDA has recently undergone a process to update lossestimates (Muth et al. 2011; Buzby et al. 2009) and has incorpo-rated these updates into the data series. Nonedible loss shares(bones, peels, pits, and so on) are also accounted for in thedata series: For fresh fruits, vegetables, and eggs, the nonedibleshare is removed at the consumer level; with meat, poultry, fish,and seafood, primary (carcass) weight is converted to bonelessweight prior to the retail level. Note that USDA estimates re-port only food losses and do not differentiate between wastes(such as plate scraps) that could be avoided through behavioralchange and losses (such as moisture losses during cooking) thatare largely unavoidable. Figure 1 depicts the stages within theLAFA data series and the percentage of food losses on a massbasis.
For this study, we use 2010 LAFA data, with the retail-levelfood availability as our starting point (i.e., we do not includelosses from primary production weight to retail weight).Withinthe LAFA data set, the dominant losses occurring between theprimary and retail level are a result of the inedible portion ofmeats (bones) and trimming discards and dehydration of pro-cessed fruits and vegetables. Whereas some distribution and
processing wastes can be expected, these are not discernable inthe LAFA data set from unavoidable losses, and thus we havechosen to exclude primary-level losses from our assessment. Re-tail availability, retail-level losses, and consumer-level losseswere tracked for individual food items (data shown in the Sup-porting Information on the Web). In some food categories (fluidmilk, poultry, total tree nuts, and added sugar and sweeteners)availability and losses were tabulated at an aggregated categorylevel because of a lack of sufficient CF data to differentiate in-dividual food items. Per capita losses (weights) at the retail andconsumer level were multiplied by LCA-based CFs for individ-ual foods (see below) to arrive at GHG emissions associatedwith the production of food losses.
Food Pattern Recommendations
The 2010 Dietary Guidelines for Americans (USDA 2010)contains food pattern recommendations (Appendix 7 of USDA[2010]) that provide recommended average daily intakes of dif-ferent food groups (assumed to be in nutrient-dense forms andlean or low fat) for a range of calorie levels, depending on indi-vidual Calorie needs. We propose using these food pattern rec-ommendations as a basis for the average U.S. resident’s recom-mended intake. The Dietary Guidelines also provide estimatedcaloric needs by age, gender, and physical activity level (Ap-pendix 6 of USDA [2010]). Weighting these estimated caloricneeds with U.S. age and gender demographics from 2010 (U.S.Census Bureau 2011) suggests that the weighted average caloricneed for a moderately active U.S. population is 2,093 Calories1
(1,867 Calories and 2,361 Calories for sedentary and active,respectively; see the supporting information on the Journal’swebsite for details). For the purpose of this article, we explorerecommended food patterns at two Caloric levels: the currentCaloric intake (according to the LAFA series) of 2,534 Calories,representing an iso-Caloric diet shift, and the often-used refer-ence point of 2,000 Calories, representing a weighted averagetarget intake for the average U.S. citizen, assuming moderateactivity. Because recommended food patterns are provided ateven 200 Calorie increments, recommendations at 2,534 Calo-ries were derived by linear interpolation between the 2,400- and2,600-Calorie food pattern provided in Appendix 7 of USDAguidelines (2010). We also evaluate lacto-ovo vegetarian andvegan food pattern recommendations (at 2,000 Calories) aspresented in the 2010 Dietary Guidelines for Americans (USDA2010).
LAFA data (i.e., availability after removing retail- andconsumer-level losses), presented in food pattern equivalentunits compatible with the Dietary Guidelines, are used as a proxyfor the average U.S. per capita food consumption in makingcomparisons with dietary recommendations. Over- or under-consumption were determined by the difference between rec-ommended levels of particular food groups and 2010 consump-tion (based on LAFA data) and then evaluated in terms of theGHG emissions represented in producing the particular foodgroup.
Heller and Keoleian, GHG Emissions of U.S. Dietary Choices and Food Loss 393
R E S E A R C H A N D A N A LYS I S
Figure 1 Representation of food flows as considered by the Loss-Adjusted Food Availability data set. Box heights in the diagram areproportional to the total weight of food at each stage in 2010; percentages are relative to primary availability. Primary availability for a givenyear = (Production+Imports+Beginning Stocks) – (Feed+Seed+Industrial Uses+Exports+Ending Stocks).
Food Greenhouse Gas Emissions Data
Although numerous LCA-based studies of food productionhave been published, there currently is not a comprehensiveand authoritative database of food environmental impact. Thus,we have chosen a meta-analysis approach of published LCAdata to arrive at representative CF values for the diversity offoods considered in this exercise. Results are drawn from a va-riety of sources (referenced in the Supporting Information onthe Web), compiled by food type, and averaged across com-parable food type. U.S.-based data are limited, and thus thismeta-analysis includes data from other developed countries.The average GHG emission values for the �100 foods consid-ered in this study, along with minimum and maximum GHGemissions values from the meta-analysis, are given in the Sup-porting Information on the Web. These sources include studiesrepresenting a variety of countries of origin, climatic conditions,transportation distances, and production methods and thereforeare intended to provide a reasonable range of expected values,rather than a definitive result, for each food type.
Results
Food Losses
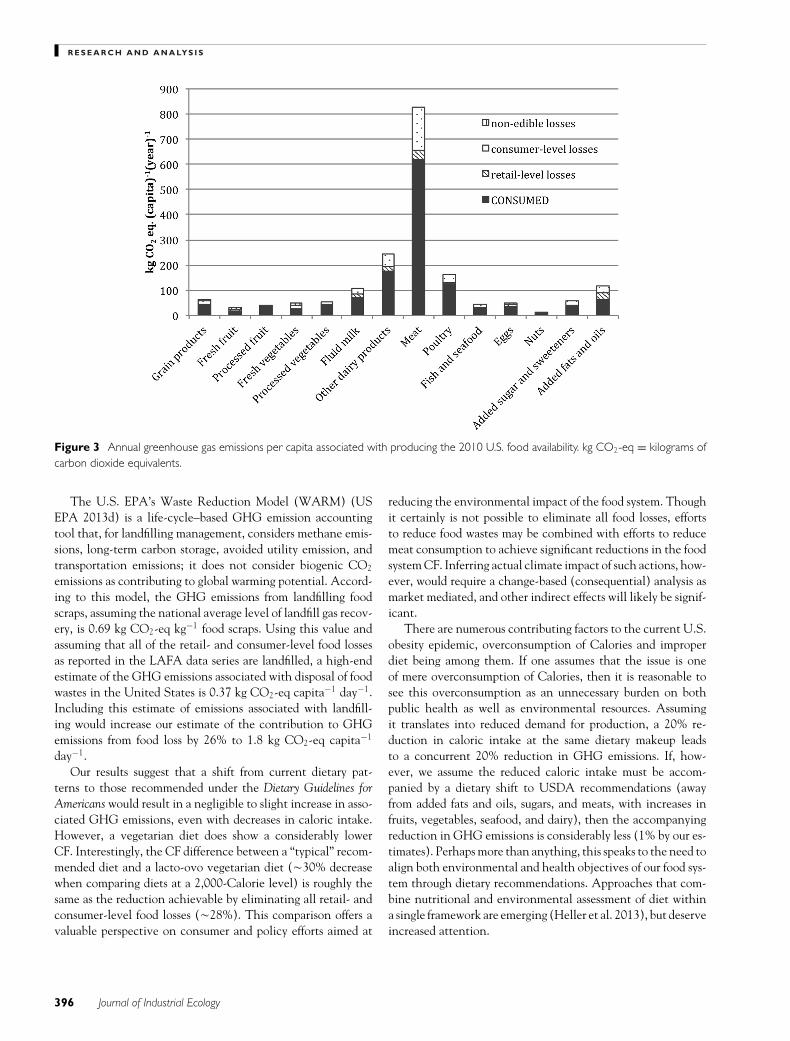
Figure 2 shows the makeup of the U.S. food supply on botha weight and Caloric basis, according to the LAFA data series,including estimated losses at the retail and consumer level.Retail- and consumer-level losses account for 31% (by weight)of the food available at the retail level; grain products, freshfruit, fresh vegetables, fluid milk, and added sugars make upthe largest contributions. In contrast, figure 3 gives the GHGemissions associated with producing the food groups in the U.S.food supply. Here, the distribution is dominated by the meats
category, owing to the high GHG intensity of beef, lamb, and(to a lesser extent) pork production. Though beef accounts foronly 4% by weight of the retail-level food supply, it contributes36% of the associated GHG emissions.
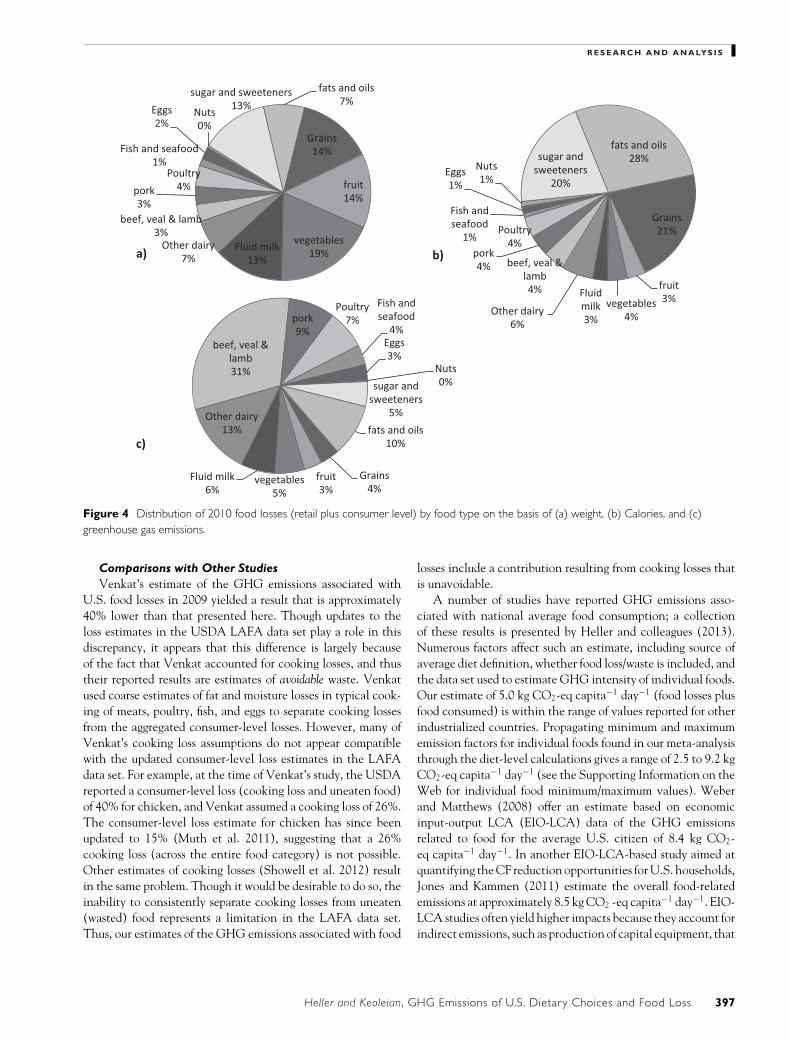
In total, the GHG emissions associated with producing foodthat is lost at the retail and consumer level (excluding nonedi-ble losses) amounts to 1.4 kg CO2-eq capita−1 day−1; the foodconsumed accounts for 3.6 kg CO2-eq capita−1 day−1. Contri-butions to food losses can more easily be seen in figure 4; theshift in distribution that comes with moving from a weight orCalorie basis to that of corresponding GHG emissions is alsodemonstrated. A parallel figure showing the distribution of foodtypes for the consumed portion is included in the SupportingInformation on the Web.
Comparing U.S. Food Consumption withRecommendations
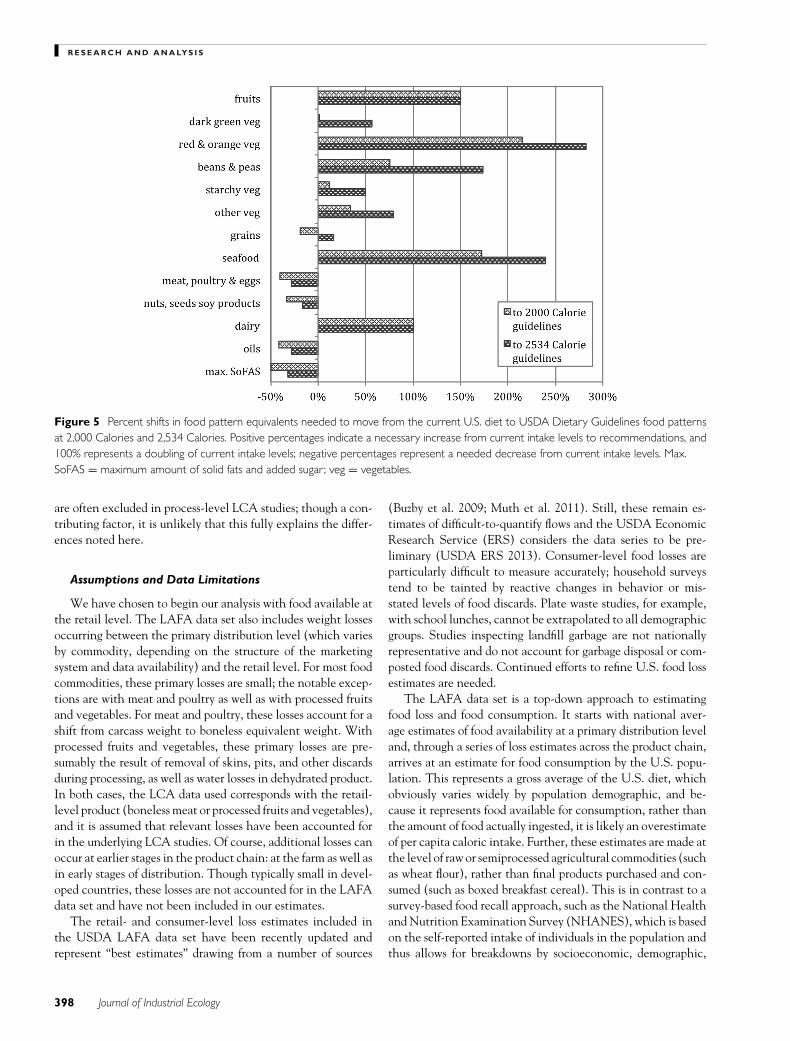
Figure 5 gives the percent change in food pattern equivalentsnecessary to shift from current consumption levels to dietaryguideline recommendations for two caloric intake levels. Basedon this comparison, the U.S. population is currently undercon-suming fruits, vegetables, seafood, and dairy and overconsumingmeat, poultry, and eggs, nuts, seeds, and soy, oils, and solid fatsand added sugars. The recommended quantity of grains con-sumption increases sizably with increasing caloric needs; thus,a decrease from present consumption of grains is needed toreach the 2,000-Calorie recommendation, whereas an increaseis needed for the recommended intake at 2,534 Calories.
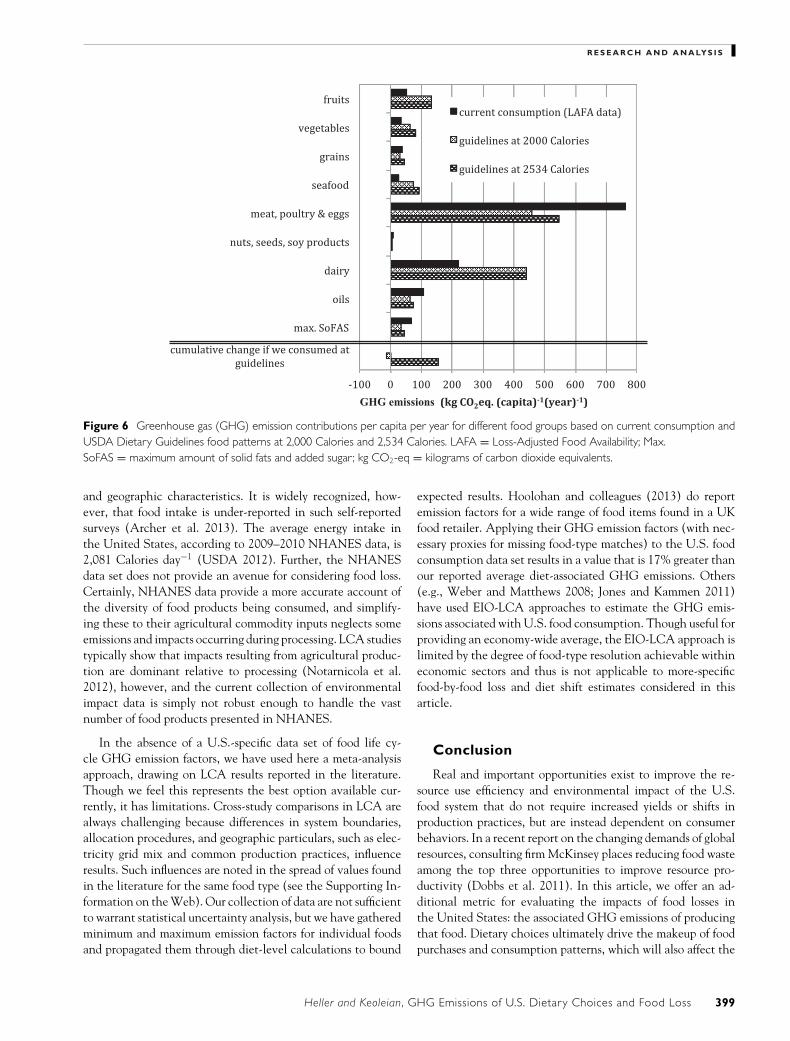
Figure 6 presents the GHG emissions associated with pro-duction of the current average diet (according to LAFAdata) and diets based on Dietary Guidelines food patterns at2,000 and 2,534 Calories. It is important to note that thesecomparisons do not include food losses. Though losses are typ-
394 Journal of Industrial Ecology

R E S E A R C H A N D A N A LYS I S
Figure 2 2010 per capita retail-level food availability in the United States, on both an annual weight and daily Caloric basis, showingestimated retail- and consumer-level food losses and quantities available for consumption. The left column of each pair shows the weight offood and refers to the left axis; the right (shaded) column gives the daily per capita Caloric value of each food group and refers to the rightaxis. Nonedible losses include fruit and vegetable peels, pits, rinds, and so on, and egg shells. kg = kilogram.
ically included in assessing the environmental impacts of diet,they are excluded here to focus on the effect of dietary shifts.The cumulative change in GHG emissions in shifting fromthe current diet to the recommended diet is also shown infigure 6: A shift to a 2,534-Calorie recommended diet wouldcause a 12% overall increase in GHG emissions, whereas a shiftto a 2,000-Calorie recommended diet would result in a 1% over-all decrease in GHG emissions. This perhaps surprising resultsuggests that even with a greater than 20% decrease in caloricintake and considerable decreases in meat consumption, a shiftto a recommended diet may not result in significant decreasesin GHG emissions. This is largely because of the interplay be-tween decreased quantities of meat, poultry, and eggs and anincreased need for dairy in the diet, combined with the factthat solid fats and added sugars represent a large portion of thecaloric decrease in the shift, but these foods represent relativelysmall GHG emissions per Calorie.
It is also informative to compare the GHG emissions as-sociated with the USDA food patterns and their lacto-ovovegetarian and vegan adaptations as presented in the Di-etary Guidelines for Americans. All food patterns are designedto meet nutritional guidelines and therefore can be consid-ered nutritionally comparable. At a 2,000-Calorie diet basis,the estimated GHG emissions from producing the standardfood pattern diet, a lacto-ovo vegetarian adaptation, and a ve-gan adaptation are 3.6, 2.4, and 1.7 kg CO2-eq capita−1 day−1,respectively.
Discussion
It has long been recognized that food waste represents asignificant inefficiency in the food system, yet food sufficiencyand economics have often diminished its importance. As theglobal community forecasts the nutritional needs and asso-ciated resource use of population growth and economic de-velopment (Odegard and Van der Voet 2014), however, theimpacts of food waste become increasingly relevant. Accord-ing to our estimates, the production of food lost at the re-tail and consumer level in the United States in 2010 con-tributed an additional 160 MMT CO2-eq of GHG emissions.This is roughly equivalent to the emissions of 33 million av-erage passenger vehicles annually, based on a U.S. weightedaverage combined fuel economy of cars and light trucks of9.14 kilometers (km) liter−1 (21.5 miles per gallon) and aver-age vehicle distance traveled of 18,496 km year−1 (11,493 milesyear−1) (US EPA 2013a). Combined with the food that is con-sumed, emissions from food production total 573 MMT CO2-eq year−1, or 8% of the total U.S. GHG emissions in 2010(US EPA 2013b).
This study does not explicitly account for GHG emissionsassociated with disposal of food wastes. Food wastes represented15% of the total municipal solid waste (MSW) generation in theUnited States in 2011; only 4% of this generated food waste wasrecovered through composting (US EPA 2013c). The majority(82%) of discarded MSW goes to landfill in the United States(US EPA 2013c).
Heller and Keoleian, GHG Emissions of U.S. Dietary Choices and Food Loss 395
R E S E A R C H A N D A N A LYS I S
Figure 3 Annual greenhouse gas emissions per capita associated with producing the 2010 U.S. food availability. kg CO2-eq = kilograms ofcarbon dioxide equivalents.
The U.S. EPA’s Waste Reduction Model (WARM) (USEPA 2013d) is a life-cycle–based GHG emission accountingtool that, for landfilling management, considers methane emis-sions, long-term carbon storage, avoided utility emission, andtransportation emissions; it does not consider biogenic CO2
emissions as contributing to global warming potential. Accord-ing to this model, the GHG emissions from landfilling foodscraps, assuming the national average level of landfill gas recov-ery, is 0.69 kg CO2-eq kg−1 food scraps. Using this value andassuming that all of the retail- and consumer-level food lossesas reported in the LAFA data series are landfilled, a high-endestimate of the GHG emissions associated with disposal of foodwastes in the United States is 0.37 kg CO2-eq capita−1 day−1.Including this estimate of emissions associated with landfill-ing would increase our estimate of the contribution to GHGemissions from food loss by 26% to 1.8 kg CO2-eq capita−1
day−1.Our results suggest that a shift from current dietary pat-
terns to those recommended under the Dietary Guidelines forAmericans would result in a negligible to slight increase in asso-ciated GHG emissions, even with decreases in caloric intake.However, a vegetarian diet does show a considerably lowerCF. Interestingly, the CF difference between a “typical” recom-mended diet and a lacto-ovo vegetarian diet (�30% decreasewhen comparing diets at a 2,000-Calorie level) is roughly thesame as the reduction achievable by eliminating all retail- andconsumer-level food losses (�28%). This comparison offers avaluable perspective on consumer and policy efforts aimed at
reducing the environmental impact of the food system. Thoughit certainly is not possible to eliminate all food losses, effortsto reduce food wastes may be combined with efforts to reducemeat consumption to achieve significant reductions in the foodsystem CF. Inferring actual climate impact of such actions, how-ever, would require a change-based (consequential) analysis asmarket mediated, and other indirect effects will likely be signif-icant.
There are numerous contributing factors to the current U.S.obesity epidemic, overconsumption of Calories and improperdiet being among them. If one assumes that the issue is oneof mere overconsumption of Calories, then it is reasonable tosee this overconsumption as an unnecessary burden on bothpublic health as well as environmental resources. Assumingit translates into reduced demand for production, a 20% re-duction in caloric intake at the same dietary makeup leadsto a concurrent 20% reduction in GHG emissions. If, how-ever, we assume the reduced caloric intake must be accom-panied by a dietary shift to USDA recommendations (awayfrom added fats and oils, sugars, and meats, with increases infruits, vegetables, seafood, and dairy), then the accompanyingreduction in GHG emissions is considerably less (1% by our es-timates). Perhaps more than anything, this speaks to the need toalign both environmental and health objectives of our food sys-tem through dietary recommendations. Approaches that com-bine nutritional and environmental assessment of diet withina single framework are emerging (Heller et al. 2013), but deserveincreased attention.
396 Journal of Industrial Ecology
R E S E A R C H A N D A N A LYS I S
Figure 4 Distribution of 2010 food losses (retail plus consumer level) by food type on the basis of (a) weight, (b) Calories, and (c)greenhouse gas emissions.
Comparisons with Other StudiesVenkat’s estimate of the GHG emissions associated with
U.S. food losses in 2009 yielded a result that is approximately40% lower than that presented here. Though updates to theloss estimates in the USDA LAFA data set play a role in thisdiscrepancy, it appears that this difference is largely becauseof the fact that Venkat accounted for cooking losses, and thustheir reported results are estimates of avoidable waste. Venkatused coarse estimates of fat and moisture losses in typical cook-ing of meats, poultry, fish, and eggs to separate cooking lossesfrom the aggregated consumer-level losses. However, many ofVenkat’s cooking loss assumptions do not appear compatiblewith the updated consumer-level loss estimates in the LAFAdata set. For example, at the time of Venkat’s study, the USDAreported a consumer-level loss (cooking loss and uneaten food)of 40% for chicken, and Venkat assumed a cooking loss of 26%.The consumer-level loss estimate for chicken has since beenupdated to 15% (Muth et al. 2011), suggesting that a 26%cooking loss (across the entire food category) is not possible.Other estimates of cooking losses (Showell et al. 2012) resultin the same problem. Though it would be desirable to do so, theinability to consistently separate cooking losses from uneaten(wasted) food represents a limitation in the LAFA data set.Thus, our estimates of the GHG emissions associated with food
losses include a contribution resulting from cooking losses thatis unavoidable.
A number of studies have reported GHG emissions asso-ciated with national average food consumption; a collectionof these results is presented by Heller and colleagues (2013).Numerous factors affect such an estimate, including source ofaverage diet definition, whether food loss/waste is included, andthe data set used to estimate GHG intensity of individual foods.Our estimate of 5.0 kg CO2-eq capita−1 day−1 (food losses plusfood consumed) is within the range of values reported for otherindustrialized countries. Propagating minimum and maximumemission factors for individual foods found in our meta-analysisthrough the diet-level calculations gives a range of 2.5 to 9.2 kgCO2-eq capita−1 day−1 (see the Supporting Information on theWeb for individual food minimum/maximum values). Weberand Matthews (2008) offer an estimate based on economicinput-output LCA (EIO-LCA) data of the GHG emissionsrelated to food for the average U.S. citizen of 8.4 kg CO2-eq capita−1 day−1. In another EIO-LCA-based study aimed atquantifying the CF reduction opportunities for U.S. households,Jones and Kammen (2011) estimate the overall food-relatedemissions at approximately 8.5 kg CO2 -eq capita−1 day−1. EIO-LCA studies often yield higher impacts because they account forindirect emissions, such as production of capital equipment, that
Heller and Keoleian, GHG Emissions of U.S. Dietary Choices and Food Loss 397
R E S E A R C H A N D A N A LYS I S
Figure 5 Percent shifts in food pattern equivalents needed to move from the current U.S. diet to USDA Dietary Guidelines food patternsat 2,000 Calories and 2,534 Calories. Positive percentages indicate a necessary increase from current intake levels to recommendations, and100% represents a doubling of current intake levels; negative percentages represent a needed decrease from current intake levels. Max.SoFAS = maximum amount of solid fats and added sugar ; veg = vegetables.
are often excluded in process-level LCA studies; though a con-tributing factor, it is unlikely that this fully explains the differ-ences noted here.
Assumptions and Data Limitations
We have chosen to begin our analysis with food available atthe retail level. The LAFA data set also includes weight lossesoccurring between the primary distribution level (which variesby commodity, depending on the structure of the marketingsystem and data availability) and the retail level. For most foodcommodities, these primary losses are small; the notable excep-tions are with meat and poultry as well as with processed fruitsand vegetables. For meat and poultry, these losses account for ashift from carcass weight to boneless equivalent weight. Withprocessed fruits and vegetables, these primary losses are pre-sumably the result of removal of skins, pits, and other discardsduring processing, as well as water losses in dehydrated product.In both cases, the LCA data used corresponds with the retail-level product (boneless meat or processed fruits and vegetables),and it is assumed that relevant losses have been accounted forin the underlying LCA studies. Of course, additional losses canoccur at earlier stages in the product chain: at the farm as well asin early stages of distribution. Though typically small in devel-oped countries, these losses are not accounted for in the LAFAdata set and have not been included in our estimates.
The retail- and consumer-level loss estimates included inthe USDA LAFA data set have been recently updated andrepresent “best estimates” drawing from a number of sources
(Buzby et al. 2009; Muth et al. 2011). Still, these remain es-timates of difficult-to-quantify flows and the USDA EconomicResearch Service (ERS) considers the data series to be pre-liminary (USDA ERS 2013). Consumer-level food losses areparticularly difficult to measure accurately; household surveystend to be tainted by reactive changes in behavior or mis-stated levels of food discards. Plate waste studies, for example,with school lunches, cannot be extrapolated to all demographicgroups. Studies inspecting landfill garbage are not nationallyrepresentative and do not account for garbage disposal or com-posted food discards. Continued efforts to refine U.S. food lossestimates are needed.
The LAFA data set is a top-down approach to estimatingfood loss and food consumption. It starts with national aver-age estimates of food availability at a primary distribution leveland, through a series of loss estimates across the product chain,arrives at an estimate for food consumption by the U.S. popu-lation. This represents a gross average of the U.S. diet, whichobviously varies widely by population demographic, and be-cause it represents food available for consumption, rather thanthe amount of food actually ingested, it is likely an overestimateof per capita caloric intake. Further, these estimates are made atthe level of raw or semiprocessed agricultural commodities (suchas wheat flour), rather than final products purchased and con-sumed (such as boxed breakfast cereal). This is in contrast to asurvey-based food recall approach, such as the National Healthand Nutrition Examination Survey (NHANES), which is basedon the self-reported intake of individuals in the population andthus allows for breakdowns by socioeconomic, demographic,
398 Journal of Industrial Ecology
R E S E A R C H A N D A N A LYS I S
GHG emissions
Figure 6 Greenhouse gas (GHG) emission contributions per capita per year for different food groups based on current consumption andUSDA Dietary Guidelines food patterns at 2,000 Calories and 2,534 Calories. LAFA = Loss-Adjusted Food Availability; Max.SoFAS = maximum amount of solid fats and added sugar ; kg CO2-eq = kilograms of carbon dioxide equivalents.
and geographic characteristics. It is widely recognized, how-ever, that food intake is under-reported in such self-reportedsurveys (Archer et al. 2013). The average energy intake inthe United States, according to 2009–2010 NHANES data, is2,081 Calories day−1 (USDA 2012). Further, the NHANESdata set does not provide an avenue for considering food loss.Certainly, NHANES data provide a more accurate account ofthe diversity of food products being consumed, and simplify-ing these to their agricultural commodity inputs neglects someemissions and impacts occurring during processing. LCA studiestypically show that impacts resulting from agricultural produc-tion are dominant relative to processing (Notarnicola et al.2012), however, and the current collection of environmentalimpact data is simply not robust enough to handle the vastnumber of food products presented in NHANES.
In the absence of a U.S.-specific data set of food life cy-cle GHG emission factors, we have used here a meta-analysisapproach, drawing on LCA results reported in the literature.Though we feel this represents the best option available cur-rently, it has limitations. Cross-study comparisons in LCA arealways challenging because differences in system boundaries,allocation procedures, and geographic particulars, such as elec-tricity grid mix and common production practices, influenceresults. Such influences are noted in the spread of values foundin the literature for the same food type (see the Supporting In-formation on the Web). Our collection of data are not sufficientto warrant statistical uncertainty analysis, but we have gatheredminimum and maximum emission factors for individual foodsand propagated them through diet-level calculations to bound
expected results. Hoolohan and colleagues (2013) do reportemission factors for a wide range of food items found in a UKfood retailer. Applying their GHG emission factors (with nec-essary proxies for missing food-type matches) to the U.S. foodconsumption data set results in a value that is 17% greater thanour reported average diet-associated GHG emissions. Others(e.g., Weber and Matthews 2008; Jones and Kammen 2011)have used EIO-LCA approaches to estimate the GHG emis-sions associated with U.S. food consumption. Though useful forproviding an economy-wide average, the EIO-LCA approach islimited by the degree of food-type resolution achievable withineconomic sectors and thus is not applicable to more-specificfood-by-food loss and diet shift estimates considered in thisarticle.
Conclusion
Real and important opportunities exist to improve the re-source use efficiency and environmental impact of the U.S.food system that do not require increased yields or shifts inproduction practices, but are instead dependent on consumerbehaviors. In a recent report on the changing demands of globalresources, consulting firm McKinsey places reducing food wasteamong the top three opportunities to improve resource pro-ductivity (Dobbs et al. 2011). In this article, we offer an ad-ditional metric for evaluating the impacts of food losses inthe United States: the associated GHG emissions of producingthat food. Dietary choices ultimately drive the makeup of foodpurchases and consumption patterns, which will also affect the
Heller and Keoleian, GHG Emissions of U.S. Dietary Choices and Food Loss 399

R E S E A R C H A N D A N A LYS I S
GHG emissions associated with food losses. Dietary choices arecomplex and influenced by a myriad of factors; dietary recom-mendations presented by governments are but one avenue toinfluence policy and consumer choices to move toward a morenutritionally healthy diet. Our study suggests that shifts fromthe current U.S. diet to the USDA recommended diet wouldnot correspond with significant reductions in diet-related GHGemissions. Whereas GHG emissions is only one of numerous en-vironmental impacts to be considered, this result speaks to theneed to incorporate the environmental costs of food produc-tion into dietary recommendations. Increasing the efficiency ofour food system by reducing food waste and improving diets isan important strategy for U.S. climate-change mitigation andrequires collaborative efforts by businesses, governments, andconsumers.
Note
1. 1 Calorie = 1 food Calorie = 1 kilocalorie = 4,186.8 joules.
References
Archer, E., G. A. Hand, and S. N. Blair. 2013. Validity of U.S. nutri-tional surveillance: National Health and Nutrition ExaminationSurvey caloric energy intake data, 1971–2010. PLoS ONE 8(10):e76632.
Bellarby, J., B. Foereid, A. Hastings, and P. Smith. 2008. Cool farming:Climate impacts of agriculture and mitigation potential. GreenpeaceInternational Amsterdam. www.greenpeace.org/international/Global/international/planet-2/report/2008/1/cool-farming-full-report.pdf. Accessed November 2013.
Beretta, C., F. Stoessel, U. Baier, and S. Hellweg. 2013. Quantifyingfood losses and the potential for reduction in Switzerland. WasteManagement 33(3): 764–773.
Blair, D. and J. Sobal. 2006. Luxus consumption: Wasting food re-sources through overeating. Agriculture and Human Values 23(1):63–74.
Buzby, J. C. and J. Hyman. 2012. Total and per capita value of foodloss in the United States. Food Policy 37(5): 561–570.
Buzby, J. C., H. F. Wells, B. Axtman, and J. Mickey. 2009. Su-permarket loss estimates for fresh fruit, vegetables, meat, poul-try, and seafood and their use in the ERS Loss-Adjusted FoodAvailability data. EIB-44. USDA Economic Research Ser-vice. www.ers.usda.gov/publications/eib-economic-information-bulletin/eib44.aspx-.UrS1AWRDveY. Accessed August 2013.
Cafaro, P. J., R. B. Primack, and R. L. Zimdahl. 2006. The fat ofthe land: Linking American food overconsumption, obesity, andbiodiversity loss. Journal of Agricultural and Environmental Ethics19(6): 541–561.
Carlsson-Kanyama, A. and A. D. Gonzalez. 2009. Potential contribu-tions of food consumption patterns to climate change. AmericanJournal of Clinical Nutrition 89(5): S1704–S1709.
CDC (Centers for Disease Control and Prevention). 2013. Health,United States, 2012: With special feature on emergency care.Hyattsville, MD, USA: U.S. Department of Health andHuman Services, Centers for Disease Control and Preven-tion. www.cdc.gov/nchs/data/hus/hus12.pdf. Accessed December2013.
Cuellar, A. D. and M. E. Webber. 2010. Wasted food, wasted energy:The embedded energy in food waste in the United States. Envi-ronmental Science & Technology 44(16): 6464–6469.
Dobbs, R., J. Oppenheim, F. Thompson, M. Brinkman, andM. Zornes. 2011. Resource revolution: Meeting the world’s energy,materials, food, and water needs. McKinsey Global Institute. www.mckinsey.com/insights/energy_resources_rmaterials/resource_revolution. Accessed February 2014.
European Parliament. 2012. Resolution on how to avoid foodwastage: Strategies for a more efficient food chain in the EU(2011/2175/(INI)). www.europarl.europa.eu/sides/getDoc.do?pubRef=-//EP//TEXT+TA+P7-TA-2012--0014+0+DOC+XML+V0//EN. Accessed December 2013.
Fazeni, K. and H. Steinmuller. 2011. Impact of changes in diet on theavailability of land, energy demand, and greenhouse gas emissionsof agriculture. Energy, Sustainability and Society 1(1): 6.
Foley, J. A., N. Ramankutty, K. A. Brauman, E. S. Cassidy, J. S. Gerber,M. Johnston, N. D. Mueller, et al. 2011. Solutions for a cultivatedplanet. Nature 478(7369): 337–342.
Garnett, T. 2011. Where are the best opportunities for reducing green-house gas emissions in the food system (including the food chain)?Food Policy 36(S1): S23–S32.
Gustavsson, J., C. Cederberg, U. Sonesson, R. V. Otterdijk, and A.Meybeck. 2011. Global food losses and food waste: Extent, causesand prevention. Rome: Food and Agriculture Organization of theUnited Nations.
Hall, K. D., J. Guo, M. Dore, and C. C. Chow. 2009. The progressiveincrease of food waste in America and its environmental impact.PLoS ONE 4(11): e7940.
Heller, M. C. and G. A. Keoleian. 2003. Assessing the sustainability ofthe US food system: A life cycle perspective. Agricultural Systems76(3): 1007–1041.
Heller, M. C., G. A. Keoleian, and W. C. Willett. 2013. Toward a lifecycle-based, diet-level framework for food environmental impactand nutritional quality assessment: A critical review. Environmen-tal Science & Technology 47(22): 12632–12647.
Hoolohan, C., M. Berners-Lee, J. McKinstry-West, and C. Hewitt.2013. Mitigating the greenhouse gas emissions embodied in foodthrough realistic consumer choices. Energy Policy 63: 1065–1074.
Jones, C. M. and D. M. Kammen. 2011. Quantifying carbon footprintreduction opportunities for US households and communities. En-vironmental Science & Technology 45(9): 4088–4095.
Kranert, M., G. Hafner, J. Barabosz, H. Schuller, D. Leverenz,A. Kolbig, F. Schneider, S. Lebersorger, and S. Scherhaufer.2012. Ermittlung der weggeworfenen Lebensmittelmengen undVorschlage zur Verminderung der Wegwerfrate bei Lebensmittelnin Deutschland [Determination of discarded food quantities andsuggestions for reducing the disposal rate of food in Germany].Institut fur Siedlungswasserbau, Wassergute-und Abfallwirtschaft.http://www.bmel.de/SharedDocs/Downloads/Ernaehrung/WvL/Studie_Lebensmittelabfaelle_Langfassung.pdf?__blob=publicationFile. Accessed February 2014.
Krebs-Smith, S. M., P. M. Guenther, A. F. Subar, S. I. Kirkpatrick,and K. W. Dodd. 2010. Americans do not meet federal dietaryrecommendations. The Journal of Nutrition 140(10): 1832–1838.
Kummu, M., H. De Moel, M. Porkka, S. Siebert, O. Varis, and P.Ward. 2012. Lost food, wasted resources: Global food supply chainlosses and their impacts on freshwater, cropland, and fertiliser use.Science of the Total Environment 438: 477–489.
Lipinski, B., C. Hanson, J. Lomax, L. Kitinoja, R. Waite, and T.Searchinger. 2013. Reducing food loss and waste. Washington,
400 Journal of Industrial Ecology
R E S E A R C H A N D A N A LYS I S
DC: World Resources Institute. http://www.wri.org/sites/default/files/reducing_food_loss_and_waste.pdf. Accessed December2013.
Marlow, H. J., W. K. Hayes, S. Soret, R. L. Carter, E. R. Schwab,and J. Sabate. 2009. Diet and the environment: Does what youeat matter? American Journal of Clinical Nutrition 89(5): S1699–S1703.
Meier, T. and O. Christen. 2013. Environmental impacts of dietaryrecommendations and dietary styles: Germany as an example.Environmental Science & Technology 47(2): 877–888.
Muth, M. K., S. A. Karns, S. J. Nielsen, J. C. Buzby, and H. F.Wells. 2011. Consumer-level food loss estimates and their use in theERS Loss-Adjusted Food Availability data. TB-1927. United StatesDepartment of Agriculture, Economic Research Service. http://www.ers.usda.gov/publications/tb-technical-bulletin/tb1927.aspx#.U80vo41dVM0. Accessed October 2013.
Notarnicola, B., G. Tassielli, and P. A. Renzulli. 2012. Modeling theagri-food industry with life cycle assessment. In Life cycle assess-ment handbook: A guide for environmentally sustainable products,edited by M. A. Curran. Salem, MA, USA: Scrivener PublishingLLC.
Odegard, I. and E. van der Voet. 2014. The future of food—Scenariosand the effect on natural resource use in agriculture in 2050.Ecological Economics 97: 51–59.
Showell, B. A., J. R. Williams, M. Duvall, J. C. Howe, K. Y. Patterson,J. M. Roseland, and J. M. Holden. 2012. USDA table of cookingyields for meat and poultry. USDA Agricultural Research Service.http://www.ars.usda.gov/SP2UserFiles/Place/12354500/Data/retn/USDA_CookingYields_MeatPoultry.pdf. Accessed March2014.
UNEP (United Nations Environment Programme). 2013. World En-vironment Day 2013. United Nations Environment Programme.www.unep.org/wed/. Accessed November 2013.
U.S. Census Bureau. 2011. Age and sex composition: 2010. C2010BR-03.U.S. Department of Commerce, Economics and Statistics Admin-istration. www.census.gov/prod/cen2010/briefs/c2010br-03.pdf.Accessed March 2014.
USDA (U.S. Department of Agriculture). 2010. Dietary guidelinesfor Americans, 2010. Washington, DC: U.S. Dept. of Agri-culture and U.S. Department of Health and Human Services.www.cnpp.usda.gov/DGAs2010-PolicyDocument.htm. AccessedOctober 2013.
USDA (U.S. Department of Agriculture). 2012. Energy intakes: Per-centages of energy from protein, carbohydrate, fat and alcohol,by gender and age. U.S. Department of Agriculture Agricul-tural Research Service. www.ars.usda.gov/ba/bhnrc/fsrg. AccessedNovember 2013.
USDA (U.S. Department of Agriculture). 2013. U.S. food waste chal-lenge. www.usda.gov/oce/foodwaste/. Accessed August 2013.
USDA ERS (U.S. Department of Agriculture Economic Re-search Service). 2012. Food availability (per capita) datasystem. www.ers.usda.gov/data-products/food-availability-(per-capita)-data-system.aspx. Accessed June 2013.
USDA ERS (U.S. Department of Agriculture Economic ResearchService). 2013. Loss-adjusted food availability documentation.USDA Economic Research Service. www.ers.usda.gov/data-products/food-availability-(per-capita)-data-system/loss-adjusted-food-availability-documentation.aspx#.UssZpmRDveY.Accessed January 2014.
US EPA (U.S. Environmental Protection Agency). 2013a. Green-house gas equivalencies calculator. U.S. EnvironmentalProtection Agency. www.epa.gov/cleanenergy/energy-resources/calculator.html. Accessed December 2013.
US EPA (U.S. Environmental Protection Agency). 2013b. Inven-tory of U.S. greenhouse gas emissions and sinks: 1990–2011.EPA 430-R-13-001. Washington, DC: U.S. EnvironmentalProtection Agency. www.epa.gov/climatechange/Downloads/ghgemissions/US-GHG-Inventory-2013-Main-Text.pdf. Ac-cessed December 2013.
US EPA (U.S. Environmental Protection Agency). 2013c. Munic-ipal solid waste generation, recycling, and disposal in the UnitedStates: Facts and figures for 2011. EPA530-F-13-001. U.S. En-vironmental Protection Agency. www.epa.gov/epawaste/nonhaz/municipal/pubs/MSWcharact-erization_508_053113_fs.pdf. Ac-cessed February 2014.
US EPA (U.S. Environmental Protection Agency). 2013d. Wastereduction model (WARM). U.S. Environmental ProtectionAgency. www.epa.gov/epawaste/conserve/tools/warm/. AccessedFebruary 2014.
Venkat, K. 2012. The climate change and economic impacts of foodwaste in the United States. International Journal on Food SystemDynamics 2(4): 431–446.
Weber, C. L. and H. S. Matthews. 2008. Food-miles and the relative cli-mate impacts of food choices in the United States. EnvironmentalScience & Technology 42(10): 3508–3513.
Wells, H. F. and J. C. Buzby. 2008. Dietary assessment of majortrends in US food consumption, 1970–2005. Washington, DC:United States Department of Agriculture, Economic ResearchService.
About the Authors
Martin Heller is a senior research specialist at the Center forSustainable Systems, University of Michigan, Ann Arbor, MI,USA. Gregory Keoleian is professor of sustainable systems inthe School of Natural Resources and Environment, professor ofcivil and environmental engineering, and director of the Centerfor Sustainable Systems, University of Michigan.
Supporting Information
Additional Supporting Information may be found in the online version of this article at the publisher’s web site:
Supporting Information S1: This supporting information provides tables that describe average U.S. consumption, dietaryrecommendations, and estimated greenhouse gas emissions from food.
Heller and Keoleian, GHG Emissions of U.S. Dietary Choices and Food Loss 401