Embed Size (px)
Citation preview

Greening Structural Steel Design, Fabrication and
Erection: A Case Study of the National Renewable
Energy Laboratory Research Support Facilities
Project
May 10, 2010
Final Report
Authors:
Angela Guggemos, Josie Plaut, Erik Bergstrom, Helene Gotthelf, Josh Haney,
Mehmet Ozbek
Project funded by:
KL&A, Paxton & Vierling Steel, LPR Construction, Haselden Construction, and
the American Institute of Steel Construction (AISC)
Department of Construction Management &
Institute for the Built Environment

ii
Executive Summary This study seeks to identify and evaluate opportunities to reduce the environmental impacts of structural
steel through case study research of the National Renewable Energy Laboratory’s (NREL) Research
Support Facility (RSF) in Golden, Colorado. The building was designed around 23 sustainability goals,
including net-zero energy usage, and the US Green Building Council’s (USGBC) Leadership in Energy
and Environmental Design (LEED™) Platinum certification.
The LEED™ Rating System, however, falls short in addressing and rewarding environmentally preferable
practices in the structural steel design, fabrication, erection, and overall delivery process. This research
identifies opportunities for reducing environmental impacts within these stages and quantifies the
associated benefits. Key stakeholders from the structural steel industry have joined to support the research
including KL&A Inc., Paxton & Vierling Steel (PVS), LPR Construction, Haselden Construction, and the
American Institute of Steel Construction (AISC).
The research is divided into two distinct but interrelated parts: (1) individual and group interviews to
identify potential contractual, relational, and environmental improvements for the structural steel delivery
process and (2) a life-cycle inventory assessment of the structural steel for the project and alternative
scenarios for additional environmental impact reductions in fabrication and erection.
Interviews
Individual interviews were conducted and a focus group discussion was held to gather input from
stakeholders. The goal was to determine the level of integration the steel stakeholders used on the project
and to allow participants to discuss any inefficiencies and opportunities for improvement for the steel
delivery process based on their experiences on the NREL RSF project. As a result of these discussions,
three primary process recommendations emerged:
Establish Direct Lines of Communication among the Structural Steel Team
The existing contractual lines of communication did not allow for communication between all
structural steel project team members, which led to inefficiencies and waste.
An alternative contractual model is presented that allows for direct lines of communication
among all structural steel project team members.
Ensure Early Involvement of the Erector and Fabricator in the Steel Design Process
The focus group revealed that early involvement of the fabricator and erector would be beneficial
to the overall efficiency of the structural steel design and delivery process.
Early involvement and an integrated process would be null, however, if the exchange of
information between phases are not smooth.
Utilize Appropriate Technology
Building information modeling has the ability to track several project components including
scheduling, sequencing, deliveries, and the erection progress. Utilizing a 3D model also allows
for initial problem detection virtually rather than on site.
One strong recommendation that came from KL&A and PVS was for the team to hold a
technology planning meeting early in the project. A dedicated planning effort is the key to
successful collaboration.
iii
Life Cycle Inventory Assessment
In addition to conducting interviews, the research team performed life-cycle inventory assessments
(LCIA) on seventeen scenarios to identify practical opportunities for energy and emissions reductions
throughout the structural steel delivery process. The direct and supply chain environmental impacts of
steel production, fabrication, erection, and transportation were estimated for all the structural steel used in
the NREL project. The research methodology used captures all direct, indirect, and upstream supply chain
impacts.
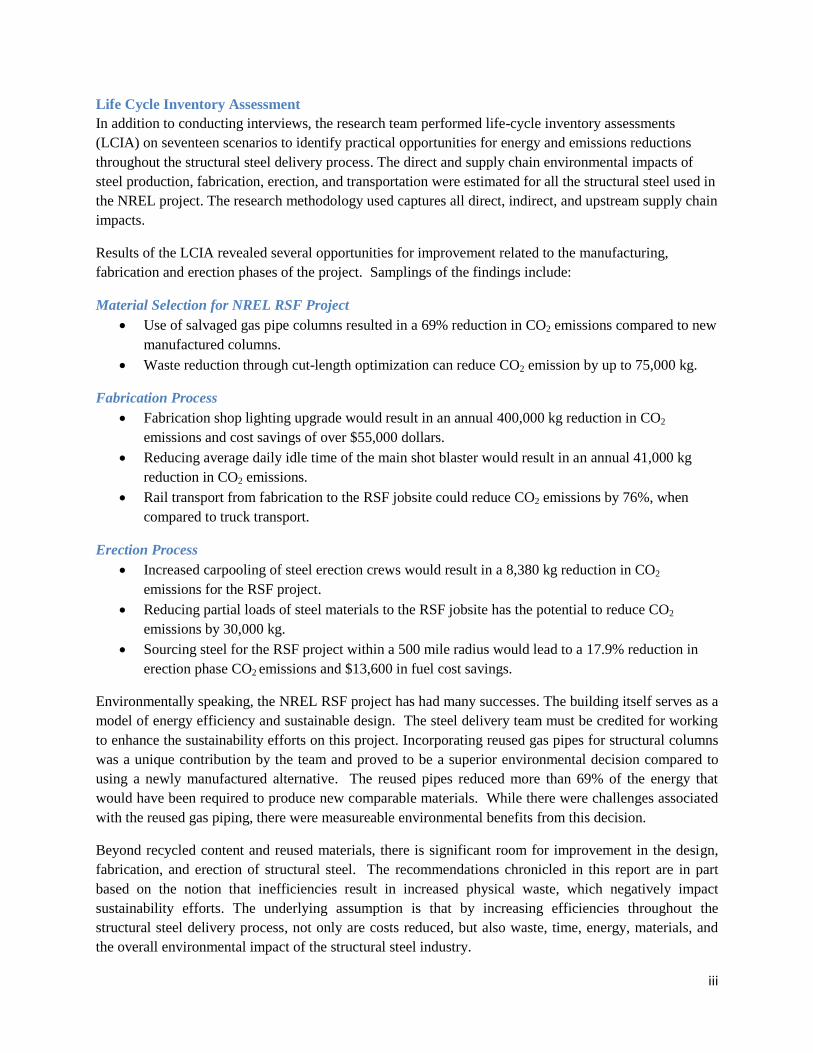
Results of the LCIA revealed several opportunities for improvement related to the manufacturing,
fabrication and erection phases of the project. Samplings of the findings include:
Material Selection for NREL RSF Project
Use of salvaged gas pipe columns resulted in a 69% reduction in CO2 emissions compared to new
manufactured columns.
Waste reduction through cut-length optimization can reduce CO2 emission by up to 75,000 kg.
Fabrication Process
Fabrication shop lighting upgrade would result in an annual 400,000 kg reduction in CO2
emissions and cost savings of over $55,000 dollars.
Reducing average daily idle time of the main shot blaster would result in an annual 41,000 kg
reduction in CO2 emissions.
Rail transport from fabrication to the RSF jobsite could reduce CO2 emissions by 76%, when
compared to truck transport.
Erection Process
Increased carpooling of steel erection crews would result in a 8,380 kg reduction in CO2
emissions for the RSF project.
Reducing partial loads of steel materials to the RSF jobsite has the potential to reduce CO2
emissions by 30,000 kg.
Sourcing steel for the RSF project within a 500 mile radius would lead to a 17.9% reduction in
erection phase CO2 emissions and $13,600 in fuel cost savings.
Environmentally speaking, the NREL RSF project has had many successes. The building itself serves as a
model of energy efficiency and sustainable design. The steel delivery team must be credited for working
to enhance the sustainability efforts on this project. Incorporating reused gas pipes for structural columns
was a unique contribution by the team and proved to be a superior environmental decision compared to
using a newly manufactured alternative. The reused pipes reduced more than 69% of the energy that
would have been required to produce new comparable materials. While there were challenges associated
with the reused gas piping, there were measureable environmental benefits from this decision.
Beyond recycled content and reused materials, there is significant room for improvement in the design,
fabrication, and erection of structural steel. The recommendations chronicled in this report are in part
based on the notion that inefficiencies result in increased physical waste, which negatively impact
sustainability efforts. The underlying assumption is that by increasing efficiencies throughout the
structural steel delivery process, not only are costs reduced, but also waste, time, energy, materials, and
the overall environmental impact of the structural steel industry.

iv
Table of Contents
Executive Summary ...................................................................................................................................... ii
Interviews .............................................................................................................................................. ii
Life Cycle Inventory Assessment ........................................................................................................ iii
List of Abbreviations .................................................................................................................................. vii
Introduction ................................................................................................................................................... 1
Background ................................................................................................................................................... 1
Methodology ................................................................................................................................................. 2
Interviews and Focus Group ..................................................................................................................... 2
Life Cycle Inventory Assessment ............................................................................................................. 3
Alternative Scenarios ................................................................................................................................ 3
Results ........................................................................................................................................................... 3
Interviews and Focus Group ..................................................................................................................... 4
Process Recommendation #1: Establish Direct Lines of Communication among the Structural Steel
Team ..................................................................................................................................................... 4
Process Recommendation #2: Ensure Early Involvement of the Erector and Fabricator in the Steel
Design Process ...................................................................................................................................... 7
Process Recommendation #3: Utilize Appropriate Technology ........................................................... 9
Life Cycle Inventory Assessment ........................................................................................................... 10
Alternative Scenarios: Material Production ............................................................................................ 12
Reused and Salvaged Materials .......................................................................................................... 12
Material Waste Reduction ................................................................................................................... 13
Alternative Scenarios: Fabrication .......................................................................................................... 14
Fabrication Process Energy ................................................................................................................. 14
Shot Blaster Operation Schedule ........................................................................................................ 15
Fabrication Shop Lighting Retrofit ..................................................................................................... 15
Green Power ........................................................................................................................................ 16
Material Transport from Fabrication to Jobsite .................................................................................. 17
Alternative Scenarios: Erection .......................................................................................................... 18
Reduced Erection Schedule ................................................................................................................ 18
Use of Site Electricity Only & No Diesel Welders ............................................................................. 19
Carpooling Incentive ........................................................................................................................... 20
Ten Hour Work Days .......................................................................................................................... 21
No Partial Loads of Materials ............................................................................................................. 21

v
Source Materials from Local Suppliers............................................................................................... 22
Conclusion .................................................................................................................................................. 23
Acknowledgements ..................................................................................................................................... 25
References ................................................................................................................................................... 25

vi
List of Figures Figure 1. Contractual Arrangement for the Structural Steel Delivery of the NREL Project. ....................... 5
Figure 2. Proposed Integrated Steel Delivery Model. ................................................................................... 6
Figure 3. Early Involvement Diagram. (AIA National & AIA California Council, 2007; Rutledge, 2009). 8
Figure 4. CO2 Emissions for NREL RSF Project Structural Steel by Source. ............................................ 11
Figure 5. Average Retail Price of Electricity: Industrial Sector, 1995 - October 2009 (EIA, 2009a) ........ 14
Figure 6. Fabrication Shop Lighting Upgrade. .......................................................................................... 16
List of Tables
Table 1. Number of Opportunities for Improvement by Theme ................................................................... 4
Table 2. NREL RSF Project’s Structural Steel Emissions by Life Cycle Phase. ....................................... 11
Table 3. Pipe Column Alternatives. ............................................................................................................ 12
Table 4. CO2 Emissions and Energy Reduction for Salvaged Pipe Columns vs. Manufactured Alternative
Columns. ..................................................................................................................................................... 13
Table 5. PVS Steel Production Phase Impacts with Waste Factor Reduction for NREL RSF Project. ...... 13
Table 6. Annual Impacts of Shot Blasting Idle Time Reduction for PVS. ................................................. 15
Table 7. Annual Impacts for PVS Fabrication Shop Lighting Upgrade. .................................................... 16
Table 8. Emissions Reduction from Shortening Erection by 3 Weeks for NREL RSF Steel. .................... 19
Table 9. Emissions Reductions from Using Site Electricity Only for NREL RSF Project. ........................ 20
Table 10. Increase in Emissions and Energy Consumption without Worker Carpooling for NREL RSF
Project. ........................................................................................................................................................ 20
Table 11. Additional Emissions and Energy Consumption Reductions with Carpooling Incentive for
NREL RSF Project. ..................................................................................................................................... 21
Table 12. Emissions Reductions from 10 Hour Work Day on NREL RSF Project. ................................... 21
Table 13. Emissions Reductions from Not Shipping Partial Loads to the NREL RSF Project. ................. 22
Table 14. Erection Phase Emissions Reductions from Sourcing Materials within 500 Miles of NREL RSF
Project. ........................................................................................................................................................ 23

vii
List of Abbreviations AGC Associated General Contractors
AIA American Institute of Architects
AISC American Institute of Steel Construction
AISI American Iron and Steel Institute
BIM Building Information Modeling
BOF Basic oxygen furnace
DB Design-Build
DBB Design-Bid-Build
DOE Department of Energy
EAF Electric arc furnace
EIO-LCA Economic Input-Output Life-Cycle Assessment
EPA Environmental Protection Agency
LCIA Life Cycle Inventory Assessment
LEED™ Leadership in Energy and Environmental Design
NREL National Renewable Energy Laboratory
REC Renewable energy certificate
RFI Request for Information
RSF Research Support Facilities
PVS Paxton & Vierling Steel
USGBC United States Green Building Council

1
Introduction The Research Support Facilities (RSF) at the National Renewable Energy Laboratory’s (NREL) campus
in Golden, Colorado aims to be the prototype for the next generation of sustainable office space. The
220,000 square foot, $64-million building was designed around 23 sustainability goals, including the US
Green Building Council’s (USGBC) Leadership in Energy and Environmental Design (LEED™)
Platinum certification, net-zero energy usage and inclusion of visible alternative energy technologies.
Haselden Construction partnered with RNL Architects, Stantec Consulting, and KL&A to win the
performance-based, design-build contract and has also worked to improve the sustainability of onsite
construction operations. The project will house approximately 700 employees at NREL’s South Table
Mesa Campus and will showcase many technologies developed in-house. The Department of Energy
(DOE) and the Alliance for Sustainable Energy have high expectations for the building and the design-
build team will be publishing a “how-to guide” for designing and constructing high performance office
buildings on the DOE website.
The RSF project challenged the design team to find creative ways of improving the overall impact of the
building process as well as operation. The structural design team, led by structural engineers KL&A, Inc.,
was inspired by the project’s ambitious sustainability goals, but saw limited guidance for greening the
structural steel process within the LEED™ framework. KL&A seized this opportunity to fill a void in
green building knowledge by commissioning a study to investigate opportunities for reducing the
environmental impacts of structural steel design, fabrication, and erection processes. Other key
stakeholders in the structural steel industry have joined the initiative, including Paxton & Vierling Steel
(PVS), LPR Construction, Haselden Construction, and the American Institute of Steel Construction
(AISC).
This study seeks to reduce the environmental impacts of structural steel through a case study of the RSF
project. The study is divided into two parts: (1) a series of interviews that identify potential sustainability
and process improvements through integrated design and delivery of structural steel and (2) analysis of
the structural steel fabrication and erection for the NREL project using life cycle inventory assessment
(LCIA) methodology. Results will include estimation of energy use and CO2 emissions for the RSF steel
fabrication and erection processes, evaluation of scenarios to reduce environmental impacts from these
processes, and potential benefits from transitioning towards a more integrated structural steel delivery
process. Although this case study focuses solely on the RSF project, the results of the research will aim to
inform a wider steel industry audience.
Background NREL’s new RSF project is targeting Platinum certification, which is symbolic of both the growth of
green building as well as the government’s commitment to sustainability efforts. The success of the
LEED™ Rating System has brought greater awareness of the need for environmentally responsible
design and construction. While LEED™ is an important tool for the green building industry, it does not
account for all facets of the built environment.

2
Aside from credits related to recycled content and regional materials, LEED™ gives little guidance for
reducing the environmental impacts associated with structural steel. In many cases, such efforts have
already become standard practice throughout the industry, due to economic efficiency. While recycled
content and sourcing local materials are important considerations, there are additional opportunities to
reduce structural steel impacts during design, fabrication and erection. A comprehensive approach to
sustainable building should include all phases of the construction process. During design, early
participation from all members of the structural team allows for valuable collective input on design
alternatives and has the potential to improve sustainability by reducing the amount of excess material
produced, cutting back on erection errors, and requiring fewer Requests for Information (RFI).
Fabricators may have opportunities to reduce waste generated in fabrication by re-evaluating internal
processes, equipment types, or source of stock materials. Steel erectors may have opportunities to limit
emissions by better managing equipment, transportation, and sources of electricity.
The RSF project incorporated an integrated design process by including the mechanical and structural
engineers during the schematic design phase. As a result, the project team made adjustments to the
building design in order to support the sustainability efforts of the whole project. An example of this
optimization was the reorientation of structural members to better accommodate mechanical systems and
improve daylighting to interior spaces. Reclaimed gas pipes were also utilized by the team as structural
columns. Although the structural engineers were involved early in the design process, other stakeholders
in the structural steel construction process (fabricators, erectors, joist manufacturers, etc.) were not
engaged until after design was complete. Without key involvement from the fabrication and erection team
during the design phase, there may have been lost opportunities for improving the sustainability of the
structural steel system.
Methodology The methodology for the study consisted of two distinct approaches: (1) individual and group interviews
to identify potential environmental improvements for the structural steel delivery process and (2) analysis
of the structural steel fabrication and erection for the NREL project using life cycle inventory assessment
(LCIA) methodology. Based on the results from the interviews and LCIA, different scenario analyses
were performed to identify ways to improve the sustainability of the structural steel delivery process for
the NREL RSF project.
Interviews and Focus Group
CSU conducted individual interviews as well as a focus group session to gather input from stakeholders.
Representatives for the owner, architect, steel detailer, structural engineer, contractor, fabricator, and
erector all participated in individual interviews. The purpose was to determine the level of integration the
steel stakeholders used on the project and to allow participants to discuss any inefficiencies and/or
opportunities for improvement for the steel delivery process based on their experiences on the NREL RSF
project.
Following the individual interviews, the same stakeholders participated in a focus group session to
determine feasibility of their recommendations from the individual interviews. In order to determine the
topics for the focus of the group session, comments from the individual interviews were synthesized into

3
common themes. Themes were selected by two factors: (1) those noted most frequently in the individual
interviews, and (2) their relevance to the structural steel industry. Three themes were selected for further
discussion at the focus group: early involvement, communication, and technology.
Life Cycle Inventory Assessment
Through consultation with Paxton & Vierling Steel (PVS) and LPR Construction, process diagrams
detailing the steps of the fabrication and erection processes were developed as the foundation of the
LCIA. These diagrams depict each process necessary to get from generic steel shapes arriving at the
fabrication plant to structural members installed in the RSF building. The materials, energy consumption,
and equipment usage associated with each step were estimated using onsite observation at PVS and
NREL, discussions with team members, electricity records, and published data.
The direct emissions from materials transportation, worker transportation, and site equipment use were
calculated using quantities of inputs (travel miles, hours of operation, fuel usage) and data from the EPA,
NREL, and equipment manufacturers (NREL, 2009; USEPA, 2004). The direct and upstream
environmental impacts from the production of raw steel, diesel, welding rod, and electricity were
calculated using the Carnegie Mellon University Green Design Institute’s Economic Input-Output Life-
Cycle Assessment (EIO-LCA) Tool (GDI, 2009).
The EIO-LCA methodology uses aggregated energy, pollution, and economic data for the entire US
economy to estimate the emissions per unit of production for each of 497 economic sectors. It captures
the inputs and outputs for the final production stage of a product, as well as all upstream suppliers, and
suppliers of suppliers. The benefit of this methodology is that the data captures all direct, indirect, and
supply chain impacts, rather than only those for a specific step within in the larger product delivery
process. Once impacts for the entire life cycle of the steel structure were determined, the relative
contribution of each individual activity was calculated and high-impact areas identified for improvement.
Alternative Scenarios
Opportunities for impact reductions were identified through process analysis, interviews, observations,
and literature review. Where feasible, opportunities were tested in the LCIA process models to generate
quantifiable results for specific efficiency and sustainability measures.
Results The results of the individual interviews and focus group session are provided first, followed by the LCIA
of the steel delivery process. This section concludes with the analysis of several alternative scenarios
identified through the interview and LCIA processes.
The following recommendations and alternative scenarios are based on the notion that inefficiencies
result in increased physical waste, which negatively impact sustainability efforts. The underlying
assumption is that by increasing efficiencies throughout the structural steel delivery process, not only are
costs reduced, but also waste, time, energy, materials, and the overall environmental impact of the
structural steel industry.

4
Interviews and Focus Group
During the eight individual interviews, participants revealed thirty-six opportunities for improvement that
could reduce environmental impacts from structural steel design and delivery processes. The suggestions
were grouped into themes and the number of times each suggestion was reported was noted. Results of
the individual interviews are listed in Table 1. The themes are ranked by frequency of occurrence.
Table 1. Number of Opportunities for Improvement by Theme
Theme Number of Suggestions
On-Site Construction Issues 10
Lines of Communication Between Steel Stakeholders 7
Early Involvement of Fabricator & Erector 7
Coordination of Mechanical Systems 4
Interoperability of Technologies 3
Applying Lessons Learned to Future Projects 2
Implications of Design or Delivery Method
Transportation of Materials
2
1
During the focus group, participants had the opportunity to view the results of the individual interviews.
Together they decided that the following process recommendations were the most common and relevant
themes affecting the structural steel delivery process (personal communication, December 22, 2009):
1. Establishing direct lines of communication among the structural steel team.
2. Ensuring early involvement of the erector and fabricator in the steel design process.
3. Utilizing appropriate technology.
The following section summarizes the findings from the focus group. It is important to note that the
following information was taken directly from the participants’ feedback and was not influenced by the
researcher or outside sources unless cited otherwise.
Process Recommendation #1: Establish Direct Lines of Communication among the Structural Steel
Team
The communication hierarchy for the NREL project was determined first by the project's contractual
arrangement and second by the trust dynamics within the team. The project was contracted as a Design-
Build (DB) partnership between Haselden Construction and RNL Architects. Even though the project
used a DB method, the fabrication and erection of the structural steel was more closely aligned with that
of a Design-Bid-Build (DBB) method. Once Haselden was hired, the steel fabricator, detailer, and erector
were brought on via a hard bid. Figure 1 illustrates the DB contractual arrangement used for this project.
The project team agreed that the DB contractual arrangement was more beneficial to the project than a
traditional DBB model would have been. However, the structural steel team members including the
structural engineers, steel detailer, fabricator and erector, felt that the delivery method was an inferior

5
Owner (NREL)
Erector(LPR)
Steel Detailer(KL&A)
Fabricator(PVS)
General Contractor(Haselden)
Architect(RNL)
StructuralEngineer(KL&A)
Contractual relationship Contractual/Primary Lines of Communication
Actual/SupplementalLines of Communication
contractual arrangement (personal communication, December 22, 2009). The primary concern was that
direct lines of communication did not exist between all structural steel project team members causing a
series of inefficient interactions, one of which was unnecessary lag time processing Requests for
Information (RFIs). While the fabricator encouraged open communication between parties, not all project
team members had practiced such open lines of communication (personal communication, December 22,
2009). Thus, it took some time to trust in a system that varied from more traditional hierarchical
methods.
The DB delivery method posed challenges to the communication among project team members. DB
allows for design and construction to occur simultaneously, with design consistently a few steps ahead of
construction. The expedited DB schedule provides a limited time to review designs so that construction
can stay on schedule. Hence, there was not always adequate time to make sure that communication needs
were being met for all stakeholders.
Project team members agreed that although there were a handful of communication issues, there was still
a relatively integrated steel design and delivery process because of the relationships among team members
(personal communication, December 22, 2009). All of the team members’ companies had worked
together previously, which allowed for a level of trust that would be uncommon for a project team who
Figure 1. Contractual Arrangement for the Structural Steel Delivery of the NREL Project.

6
had not worked together before. Once trust was established between all the individual project members,
they were more willing to directly communicate with each other, despite the contractual arrangements
(See “Actual Lines of Communication” in Figure 1). There was also a consensus that if a company
unfamiliar to the steel team had been hired, the project would have encountered additional challenges.
They believed that their team was able to avoid problems due to the established working relationships
between companies (personal communication, December 22, 2009). This highlights the correlation
between a trusting relationship within a project team and the success of a project. Although project
members established some level of integrated communication throughout the project, it was not until after
construction documents had been issued that the majority of direct communication between the structural
steel team members took place.
Despite the team’s ability to work around their contractual arrangements, there were times that team
members did not communicate directly with each other due to their contractual relationships. Given the
possibility that a different project team may not have an established level of trust, and thus be willing to
communicate outside the contractual arrangement, KL&A presented an alternative contractual model (see
Figure 2). This model allows for direct lines of communication among all structural steel project team
members and has been used successfully on another project with Haselden, PVS, and LPR.
Figure 2. Proposed Integrated Steel Delivery Model.

7
This model establishes one firm as the structural engineer, steel detailer, project manager, construction
manager (for steel), and the central point for communication and billing. The structural engineer hires the
fabricator and erector directly, thus housing all structural steel team members under one party and
establishing direct lines of communication. In this arrangement, the steel detailer would be able to directly
communicate with the structural engineer. In contrast, the steel detailer would not need to go through the
fabricator, general contractor and architect to communicate with the structural engineer in the contractual
arrangement illustrated in Figure 1. One potential benefit of an integrated steel delivery method would be
savings in paperwork, time and energy associated with RFIs (Requests for Information) for smaller design
questions. It is important to note that RFIs would still be required on issues that affect the project budget
and schedule. Smaller design questions, however, would be able to be answered in a matter of hours
versus days or sometimes weeks. A savings in time equates to a savings in money, resources, and energy.
Process Recommendation #2: Ensure Early Involvement of the Erector and Fabricator in the Steel
Design Process
During the focus group interview, there was a consensus that it would have been beneficial to include the
fabricator and erector earlier in the design phase of the NREL project (personal communication,
December 22, 2009). The fabricator and erector bring a unique perspective to the design process, as they
are able to foresee design issues that other team members may not recognize. The fabricator, PVS, and
erector, LPR, were not contractually brought onto the NREL Project until the end of the design
development phase; therefore, the design was substantially complete before any input was gathered from
PVS and LPR.
During the focus group interview, project team members spent a significant amount of time discussing a
truss girder size change that occurred during erection (personal communication, December 22, 2009). Due
to the increased member size, the crane that LPR was using was now too small to erect the new truss.
Haselden had to get a bigger crane, which was inefficient for LPR, as there were cranes moving in and
out of an already constrained job site. Switching cranes was a disruptive element to the process and LPR
suffered at least a one week delay because of the issue.
Although there were several scenarios discussed that could have resulted in avoiding this issue, the group
did agree that if LPR and PVS joined the steel delivery team earlier in the design, the team may have been
able to get preliminary information about the joists and the team could have worked out girder allowances
during preliminary design (personal communication, December 22, 2009). This would allow PVS to
foresee any fabrication issues, Haselden to order the proper crane, and would have eliminated the delays
LPR suffered during erection.
Beyond including the fabricator and erector earlier in the design of the project, the group also discussed
the importance of involving all key stakeholders early in the project (personal communication, December
22, 2009). The early involvement of key stakeholders in the design of a project allows for holistic design
decisions and the opportunity to work through issues early in the life a project. Changes in design that are
explored during schematic design and design development are generally less expensive and have a
smaller impact on the schedule. Conversely, changes made during the creation of construction documents
and the construction phase can have a much greater effect on the project resulting in a series of events that

8
will use more time, money, resources, and energy to compensate for the design change (AIA National &
AIA California Council, 2007).
A broad discussion of the implications of involving key stakeholders early in a project can be exemplified
through Figure 3 as provided by KL&A (AIA National & AIA California Council, 2007; Rutledge, 2009).
The top graph plots the level and path of knowledge for a traditional design process. The project begins
with a design team building knowledge of a particular project from predesign to the construction
documents phase. Then, traditionally, the project will go out to bid. At that point, the general contractor
(if they were not involved early) and the subcontractors will work extremely hard for a short amount of
time in order to learn the project so that they may produce a competitive bid. Once awarded, the project
then gets handed off to the construction team who then has to relearn the project yet again. Each drop in
the line of knowledge represents the drop in energy and understanding of the entity that is dedicated to the
project.
Conversely, the second illustration depicts the level and path of knowledge for an integrated delivery
process. The graph shows that if the team members (i.e. primary stakeholders as well as subcontractors
such as the fabricator and erector) are brought onto a project sooner, the team will acquire a higher level
Figure 3. Early Involvement Diagram. (AIA National & AIA California Council, 2007; Rutledge, 2009).

9
of knowledge about the project congruously. This eliminates a drop in knowledge at the transition
between project phases that can result in inefficiencies as a result of multiple knowledge transfers.
The group agreed that early involvement would be beneficial, but an integrated effort would be null if the
exchange of information between phases are not smooth. Haselden echoed this concern, noting that a
smooth handoff between the preconstruction team (of which PVS was a member) and the field crew (of
which LPR was a member) is sometimes overlooked (personal communication, December 22, 2009).
Early involvement of both parties is extremely important to ensure that a loss of knowledge does not
occur when the preconstruction team hands off the project to the field crew. Once again, early
involvement of the fabricator and erector might have narrowed the gap in knowledge between the two
parties.
The group discussed implementing a more integrated delivery model for future projects and concluded
that the biggest impediment to the integrated model is trust (personal communication, December 22,
2009). Often times, the owners and general contractors feel that they can get the best price by
competitively bidding a project, which automatically excludes certain delivery methods. Furthermore, the
established practices of the construction industry can often make an integrated process much more
difficult, since including a wide range of project team members early in the process is not standard
industry practice. Such a practice will take time to establish credibility in the eyes of a conservative
industry.
Process Recommendation #3: Utilize Appropriate Technology
Utilizing appropriate technology, such as Building Information Modeling (BIM), can greatly enhance the
sustainability of a project. Building information modeling has the ability to track several project
components including scheduling, sequencing, deliveries, and the erection progress. Utilizing a 3D model
also allows for initial problem detection virtually rather than on site. Corrections can be made before
construction begins allowing savings in time, money, and resources (AIA National & AIA California
Council, 2007). Furthermore, 3D modeling allows the erectors to visualize connections better and
understand the project more quickly. It was brought up in the focus group session that steel detailers can
also benefit from a 3D building model because they can model a detailed component including the weld
or even a washer (personal communication, December 22, 2009).
The NREL project team utilized several different software applications. Although almost every entity
produced a 3D model of the building, they were all created using different software programs. RNL built
their model in Revit, Haselden used NavisWorks, and KL&A used SDS/2 by Design Data. The project
team experienced interoperability issues that prevented them from sharing files and developing a
comprehensive building model. Interoperability issues are not always linked to the software applications,
however. Often, it is the inability of the translator that exists between the two applications.
No one denied that better use of technology could have been applied; however, the way in which to do
that was a main point of discussion. Short term, the team found that the simplest interoperability fix
would be to take advantage of the model that the steel detailer creates in order to approve electronic
drawings instead of relying on hard copies. KL&A did have some success utilizing electronic documents,
thus reducing the amount of resources used to create and transport paper documents.

10
One strong recommendation that came from KL&A and PVS was for the team to hold a technology
planning meeting early in the project (personal communication, December 22, 2009). If the team chooses
to use 3D modeling or BIM, the first thing to do is set modeling expectations within the team. The
American Institute of Architects (AIA) and Associated General Contractors (AGC) have both written
governing documents to help project teams determine what those expectations should be [see (Eastman,
Liston, Sacks, and Teicholz, 2008; AGC of America, 2008)]. Second, the team will need to understand
what each software program is capable of producing, and identify any interoperability issues for the
different software applications. Finally, it is important to define the level of modeling that each party is
interested in providing, and then assign specific components to project team members. A dedicated
planning effort is the key to successful collaboration.
Long term, companies will need to invest in more appropriate technology that can house multiple
software applications. The goal is to successfully transfer knowledge from one team member to another,
thus reducing errors and waste as a result of interoperability barriers.
Life Cycle Inventory Assessment
In addition to improvements in the contractual arrangements, timing of stakeholder input, and appropriate
use of technology, there are opportunities to reduce the environmental impacts of structural steel by
careful examination of the inputs and outputs of the fabrication and erection phases. An inventory of five
key air pollutants and embodied energy was conducted for the steel frame of the RSF facility.
Environmental impacts from the material production, fabrication, and erection phases were all quantified
for the beams, columns, joists, girders, stair assemblies, and decking. The building’s operation and end-
of-life phases were assumed to have similar impacts regardless of the structural steel design and were thus
not included in the study.
For the sake of clarity and consistency, the different life cycle phases have been defined as follows
throughout the Results section. Material production includes the extraction and refinement of raw
materials into useable commodities, such as steel. Fabrication consists of transporting materials to all
activities at the various fabrication plants that convert standard steel shapes into specific building
components and includes the emissions produced by generating electricity for the plants. Erection
includes transportation of materials from the fabricator to the jobsite, transportation of workers and
equipment to the jobsite, onsite equipment usage for erection and detailing, and the indirect impacts of
producing the electricity and fuel used during construction.
Table 2 aggregates the emissions produced during each life cycle phase, shows totals for all structural
steel activities for the NREL RSF project and gives the relative contribution of each phase. As a portion
of total impacts, the material production category dominates across all pollutants with the exception of
NOX. However, the contributions from fabrication and erection are still significant in absolute terms. For
instance, the 342,000 kilograms of CO2 emitted during erection is equivalent to the emissions from 30
average homes or 65 cars for one year.

11
Table 2. NREL RSF Project’s Structural Steel Emissions by Life Cycle Phase.
Figure 4 presents CO2 emissions by source. The transportation impacts have been subtracted out of each
phase and are presented as their own category to highlight the significant contribution of CO2 from
shipping activities across all phases.
Figure 4. CO2 Emissions for NREL RSF Project Structural Steel by Source.
With these results in mind, opportunities to improve environmental performance, or alternative scenarios,
were identified across all three life cycle phases and then modeled to quantify their potential savings.
Through discussions with the project team, these alternative scenarios were deemed to be hypothetically
CO2 SOx CO NOx PM10 Energy
(kg) (kg) (kg) (kg) (kg) (MJ)
Material
production 894,000 2,170 12,800 1,360 1,080 11,500,000
(% of Total) 59% 57% 91% 32% 89% 58%
Fabrication 277,000 1,240 494 868 49.0 3,640,000
18% 33% 3% 20% 4% 18%
Erection 342,000 388 823 2,060 83.5 4,740,000
23% 10% 6% 48% 7% 24%
Total 1,510,000 3,800 14,100 4,230 1,210 19,900,000
59%13%
12%
16%
CO2 Emissions by Source
Material Production
Fabrication
Erection
Transportation

12
feasible from a cost and technological perspective. The following sections present the findings from the
proposed alternatives.
Alternative Scenarios: Material Production
Analysis of the steel delivery process identified that the material production phase is responsible for
approximately 58% of the total embodied energy and CO2 emissions for installed structural steel material.
In recent years, studies have shown that significant manufacturing efficiencies have been made in the
steel production industry, reducing energy consumption by as much as 33% per ton in the period between
1990 and 2007 (AISI, 2008). These improvements are the result of the combined effort of steel industry
associations, producers, and the government to eliminate waste and improve efficiency. Although
additional improvements are possible, many of the primary technological advancements that result in
lower energy and emissions have already been adopted by producers (Stubbles, 2000).
Fabricators and erectors downstream from production facilities have realized process efficiencies through
technological advancements. Equipment such as computer-controlled cutting machines can extract the
maximum number of usable shapes from a single plate, thereby minimizing waste. In contrast to the steel
production industry, few studies have explored opportunities for energy and environmental emissions
reductions by downstream players. That said, fabricators and designers may have opportunities to make
significant contributions to energy and emissions reductions by simply reducing the amount of steel
needed to be produced. This study found two possible ways that raw material production energy use and
environmental emissions may be reduced for a given project: material salvage and reuse and waste
reduction in fabrication.
Reused and Salvaged Materials
The salvaged oil and gas piping used for 124 columns (88% of all columns) on the NREL project were
compared to a manufactured equivalent to identify energy and emissions impacts. This alternative design
option (W-columns) was based on the structural engineer’s determination of a newly manufactured
alternative (See Table 3). A number of the 16” diameter pipe columns were filled with concrete in order
to meet structural support requirements. Given that the concrete is a primary component of the structural
member, the concrete material and placement impacts were included in the evaluation.
Table 3. Pipe Column Alternatives.
Salvaged column type Manufactured alternative
16” x .375 pipe W14 x 74
16” x .375 concrete filled pipe W14 x 120
10” x .50 pipe W12 x 53
The use of salvaged pipe columns was determined to be an environmentally superior alternative to a
conventional structural steel column design. (See Table 4). When compared to equivalent manufactured
W-columns, the use of salvaged columns reduced CO2 emissions by 121,000 kg or 69%. Total embodied
energy was reduced from 192,000 to 60,600 MJ, a reduction of over 68%. In addition, it was determined
that there was actually a net decrease in transportation of the steel, because the baseline W-columns were
significantly heavier than the pipe columns.

13
Table 4. CO2 Emissions and Energy Reduction for Salvaged Pipe Columns vs. Manufactured Alternative Columns.
Material Waste Reduction
Demand for new steel may be reduced through reduction of waste in the fabrication phase. One example
of a waste reduction strategy is optimizing material cut lengths. This was identified through a focus group
interview in the initial phase of research. The effort would involve expanded coordination between
fabricator and designer to evaluate steel sizing options early in the design phase. Early review by the
fabricator of structural dimensions and connections may identify opportunities for member sizing to better
align with the standard manufactured sizes. The result would be a lower waste factor in fabrication and
potentially a lower overall cost. Analysis of the steel fabricated by PVS in 2008 showed that the typical
waste factor for a given unit fabricated product is 8.4%. The production impacts associated with 8.4% of
the steel on the NREL project are summarized in Table 5.
CO2 (kg) Energy (MJ)
Salvaged Pipe Column
Standard W-Column
Emissions Reduction 121,000 1,314,000
Percent Reduction
55,000 606,000
176,000 1,920,000
69% 68%
Table 5. PVS Steel Production Phase Impacts with Waste Factor Reduction for NREL RSF Project.
CO2 (kg) Energy (MJ)
Total Project Steel Production
Impacts 1,510,000 19,900,000
Total Project Fabrication Impacts 277,000 3,640,000
Waste in Fabrication (8.4%) 75,200 966,000

14
Figure 5. Average Retail Price of Electricity: Industrial Sector, 1995 -
October 2009 (EIA, 2009a)
3
3.5
4
4.5
5
5.5
6
6.5
7
19
95
19
96
19
97
19
98
19
99
20
00
20
01
20
02
20
03
20
04
20
05
20
06
20
07
20
08
20
09
Cen
ts p
er k
Wh
Average Retail Price of Electricity : Industrial Sector, 1995 through October 2009
Alternative Scenarios: Fabrication
The structural steel elements of the RSF building are comprised of numerous and often unique
components and subcomponents. In fabrication, these required varying equipment and process inputs in
order to produce what are largely custom products. Despite this variation, the majority of significant
energy-intensive steps throughout the fabrication process are constant from member to member (e.g. shot
blasting, transferring, cutting, and welding). Due to the high level of variability in fabrication, the
process-based analysis of the fabrication within the shop was limited to a representative structural column
and a beam fabricated at PVS. This allowed for the fabrication process stages to be evaluated and
prioritized within the plant without evaluating each unique component and over-complicating the
evaluation. As these primary inputs are associated with all primary structural steel members, they help
identify opportunities for the environmental improvement for all steel processed in the fabrication shop.
With a representative model established, improvement opportunities were tested and evaluated for energy,
fuel, and emissions reductions. These variables included local factors such as equipment operation
schedules and shop lighting efficiency, as well as external factors such as raw material selection and
transportation alternatives. Structural steel fabricated for the project by contractors other than PVS have
been excluded from the process-level research. However, for project-wide inventory for the NREL
structure, the fabrication energy was based on annual electricity consumption per ton of steel fabricated
by PVS in 2008. Because site-specific data was not available for the other fabricators on the project,
energy consumption and emissions impacts were estimated using the EIO-LCA database.
Fabrication Process Energy
In any effort to identify energy conservation opportunities within a process, the starting point should be
those areas with greatest potential reduction for the lowest cost and greatest ease of implementation.
These “low-hanging fruit” strategies
may require little investment while
yielding significant reduction of
energy and environmental impacts
with a rapid payback.
The PVS fabrication shop is a large
consumer of electricity for
fabrication processes and operations.
Electricity is a primary input to the
steel delivery process. In exploring
opportunities to reduce the
environmental impacts within the
control of PVS, on site electricity
reduction is the obvious starting
point.
The reliance on electricity as a
primary input to fabrication can be viewed as a risk. Over the past 10 years, electricity costs have
increased consistently (See Figure 5) (EIA, 2010). There is little indication that the trend will reverse. By

15
making a modest investment in the short term, and reducing the overall energy requirement for
fabrication, the amount of risk associated with future electricity price fluctuations is reduced. Reducing
electricity is also a primary means to reduce the carbon footprint for steel fabrication.
Shot Blaster Operation Schedule
Following analysis of the fabrication process and associated energy and emissions impacts, the steel shot
blaster was identified as a primary consumer of energy. This is, in part, due to the numerous large electric
motors used to propel rough steel pellets used to strip the surface of each fabricated member before
coating. Unlike many other pieces of equipment used in the process, the blaster is in a state of operation at
all times. It does have an idle mode for when the machine is not actively in use, which shuts off twelve
25-horsepower electric motors.
The blaster is in operation for a total of 16 hours per day, of which it was estimated to operate in idle
mode for 6 hours per day and be in full operation for the remaining 10 hours. At the time of the visit to
the fabrication shop, the blaster was operated in idle mode during breaks and between shift changes.
An opportunity for energy and cost reduction would be to evaluate the operating schedule for the blaster
and identify opportunities for reducing the overall idle time. This analysis looked at the impact of a two-
hour per day reduction in idle time relative to the overall electricity consumption per year by the blaster.
The impact resulted in a net reduction of over 60,000 kWh in electricity consumption per year, which is
detailed in Error! Reference source not found.. The blaster’s full operating mode is much more energy-
intensive and would yield much higher reductions if the operating time was decreased as well.
Table 6. Annual Impacts of Shot Blasting Idle Time Reduction for PVS.
Fabrication Shop Lighting Retrofit
One of the “low hanging fruits” for electricity reduction is the fabrication shop lighting. It is a constant
operational requirement for all processes within the shop. The PVS shop lighting currently utilizes 454
high pressure sodium 400W lights and 60 metal halide 1000W fixtures. The operating schedule for the
shop requires full lighting approximately 18 hours per day. Currently, the estimated kWh consumption for
a full year of 18-hour working days is over 1 million kilowatt-hours.
Annual kWh CO2 (kg) Energy (MJ) Cost ($US)
Existing Blastings 1,060,000 728,000 8,850,000 $99,900
Reduced Idle
Schedule 1,000,000 687,000 8,350,000 $94,200
Reduction 60,000 41,000 500,000 $5,700

16
Figure 6. Fabrication Shop Lighting Upgrade.
-
200,000
400,000
600,000
800,000
1,000,000
1,200,000
Energy (kWh) CO2 (kg)
Existing Shop Lighting
Upgraded lighting
Upgrading shop lighting will require an initial investment cost, but this may be offset by tax incentives
and rebates through the local utility and government. These factors have significant impact on the cost
benefit equation, which were not included in the evaluation.
A lighting upgrade would require the
removal and replacement of all fixtures with
6- and 10-lamp F32T8 high lumen output,
vapor tight, high bay fixtures at a cost of
approximately US $178,000. The resulting
estimated annual electricity savings would be
over US $55,000, with a simple payback of
3.2 years and an annual net CO2 reduction of
over 405,000 kg (See Figure 6). Table 7
details the costs and impacts associated with
a lighting upgrade.
Table 7. Annual Impacts for PVS Fabrication Shop Lighting Upgrade.
Green Power
The effort to reduce the environmental footprint associated with steel delivery can be achieved by first
reducing energy consumption and secondly by lowering the impacts from energy production. Once
efficiency measures have been addressed, installing renewable energy on site would, after the initial
material acquisition, lead to significant carbon and emissions reductions associated with the burning of
common fossils fuels such as coal used in electricity production. A second option would be to purchase
renewable energy certificates (RECs). RECs are renewable energy commodities equaling the production
of 1 megawatt hour of electricity. The actual energy produced may be located in another state where
renewable energy production is more efficient or cost effective. The energy produced is not directly
supplied to the REC purchaser, rather, the renewable electricity production is subsidized and fed into the
Energy (kWh) CO2 (kg) Energy (MJ) Cost ($US)
Existing Shop Lighting 1,050,000 719,000 8,730,000 $98,400
Upgraded Lighting 459,000 314,000 3,820,000 $43,100
Reduction 591,000 405,000 4,910,000 $55,300
Percent Reduction 56%
Upgrade Cost $178,000
Simple Payback (yrs.) 3.22
17
grid to be consumed in the market of origin. The idea is to use open markets to promote the production of
renewable energy in areas where it is most efficient to produce. Once that 1 MWh of power is generated
and a REC is sold, that renewable attribute is “used up” and applied to the purchaser of the REC.
The RECs should not be confused with carbon or emissions offset instruments. Offset instruments are
possible alternatives to RECs, but their impact is less because they do not promote the long term
development of renewable alternatives and lack credibility due to limited regulation (Gillenwater, 2008).
Based on the total 2008 electricity consumption by PVS, the shop and offices could use RECs to
effectively reduce CO2 emissions by over 2.8 million kilograms. The additional cost of RECs for the
associated power would be $2-3 dollars per megawatt hour of electricity per year for an annual cost to
PVS of $9,000 – $12,000 dollars.
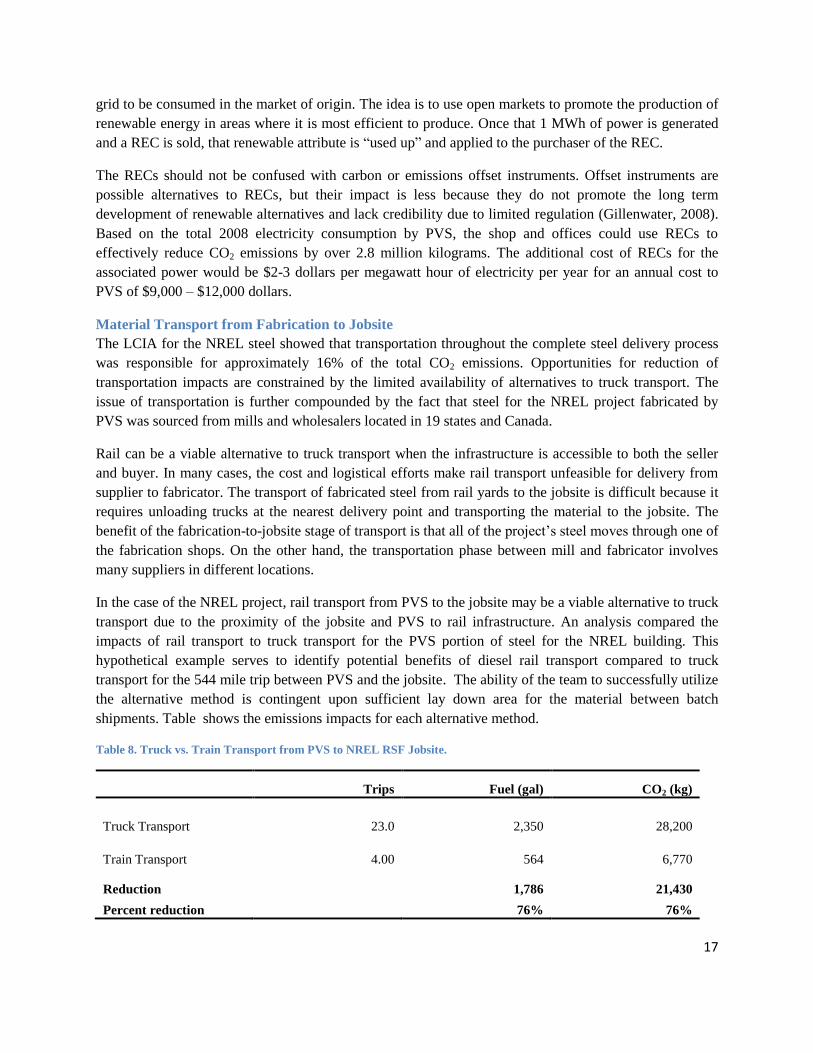
Material Transport from Fabrication to Jobsite
The LCIA for the NREL steel showed that transportation throughout the complete steel delivery process
was responsible for approximately 16% of the total CO2 emissions. Opportunities for reduction of
transportation impacts are constrained by the limited availability of alternatives to truck transport. The
issue of transportation is further compounded by the fact that steel for the NREL project fabricated by
PVS was sourced from mills and wholesalers located in 19 states and Canada.
Rail can be a viable alternative to truck transport when the infrastructure is accessible to both the seller
and buyer. In many cases, the cost and logistical efforts make rail transport unfeasible for delivery from
supplier to fabricator. The transport of fabricated steel from rail yards to the jobsite is difficult because it
requires unloading trucks at the nearest delivery point and transporting the material to the jobsite. The
benefit of the fabrication-to-jobsite stage of transport is that all of the project’s steel moves through one of
the fabrication shops. On the other hand, the transportation phase between mill and fabricator involves
many suppliers in different locations.
In the case of the NREL project, rail transport from PVS to the jobsite may be a viable alternative to truck
transport due to the proximity of the jobsite and PVS to rail infrastructure. An analysis compared the
impacts of rail transport to truck transport for the PVS portion of steel for the NREL building. This
hypothetical example serves to identify potential benefits of diesel rail transport compared to truck
transport for the 544 mile trip between PVS and the jobsite. The ability of the team to successfully utilize
the alternative method is contingent upon sufficient lay down area for the material between batch
shipments. Table shows the emissions impacts for each alternative method.
Table 8. Truck vs. Train Transport from PVS to NREL RSF Jobsite.
Trips Fuel (gal) CO2 (kg)
Truck Transport 23.0 2,350 28,200
Train Transport 4.00 564 6,770
Reduction
1,786 21,430
Percent reduction 76% 76%

18
Alternative Scenarios: Erection
Table shows the contribution of individual activities to the total erection phase environmental emissions
and energy use for the NREL project. Transportation impacts include the delivery of materials and
equipment to the site, commuting by iron workers, and upstream impacts from diesel and gasoline
production. Raising gang activities consist of unloading trucks, organizing materials, and placement and
temporary connection of structural members. Detailing covers the welding and bolting of permanent
connections and all associated equipment use.
Table 9. Erection Phase Emissions and Energy Use for NREL RSF Project.
Alternatives were modeled for all three activities with the results discussed in the following sections.
Transportation was responsible for a large share of erection phase impacts due to the long distances
covered by materials and workers coming to the site, thus the relative percentage of transportation
impacts could vary greatly for different projects. Likewise, the potential emissions reductions from each
alternative would vary depending on a project’s location, site constraints, commuting distance, etc.
Reduced Erection Schedule
Due to site constraints and crane-sizing issues, steel erection activities took approximately three weeks
longer than the original schedule proposed by the erector. Had the erection crew been afforded a larger
staging area and the preferred crane size, LPR felt that erection could have been compressed by fifteen
working days, resulting in reduced impacts from worker transportation and site equipment. This
alternative scenario quantifies these savings by eliminating 225 worker days (15 days at average
manpower of 15 employees) worth of commuting and 17% of raising gang related emissions (14 week
versus 17 week schedule). Table 8 presents the resulting savings in CO2 emissions and energy, as well as
the equivalent gallons of diesel fuel and approximate cost savings. Cost calculations throughout all
CO2 SOx CO NOx PM10 Energy
(kg) (kg) (kg) (kg) (kg) (MJ)
Transportation 216,000 97.4 407 1,430 29.4 2,990,000
63% 25% 49% 69% 35% 63%
Raising Gang 90,800 193 182 428 30.1 1,290,000
27% 50% 22% 21% 36% 27%
Detailing 35,600 98.3 234 207 24.0 457,000
10% 25% 28% 10% 29% 10%
Total 342,000 388 823 2,060 83.5 4,740,000

19
alternative scenarios assume $2.66 per gallon of diesel and $0.94 per kilowatt hour of electricity (USEIA,
2009b, USEIA, 2009a).
Table 8. Emissions Reduction from Shortening Erection by 3 Weeks for NREL RSF Steel.
Use of Site Electricity Only & No Diesel Welders
The raising gang and detailing crew used two 350 amp welders connected to site electricity for the
majority of welding and hand tool use, but occasionally used two 300 amp diesel welders for smaller
tasks or when site power could not be reached. An alternative scenario was modeled to demonstrate the
impact of using site electricity exclusively and no diesel welders. It was assumed that this would have had
no impact on productivity rates if additional 350 amp welders were used to provide access throughout the
entire site. Table 9 shows the impact on CO2, electricity consumption, diesel usage, and approximate cost.
The CO2 values are representative of the entire erection phase, while the electricity, diesel, and cost
columns represent only the welder operation. An 11.1% increase in electricity consumption resulted in a
minor 1.7% savings in erection-wide CO2 emissions but the 6.7% reduction in particulate matter
generation could significantly improve jobsite air quality.
CO2 (kg) Energy (MJ) Diesel (gal) Cost ($US)
As-Built Schedule 342,000 4,740,000 32,400 $86,100
LPR Preferred Schedule 320,000 4,420,000 30,000 $80,300
Reduction 21,900 317,000 2,170 $5,760
Percent reduction 6.4% 6.7% 6.7% 6.7%

20
Table 9. Emissions Reductions from Using Site Electricity Only for NREL RSF Project.
Carpooling Incentive
Due to an average commuting distance of 72.8 miles one way to the jobsite, many of the erector’s
employees carpooled during the project. Based on interviews and an analysis of the vehicles driven, the
erection crew averaged 1.67 occupants per vehicle and 2.91 gallons of fuel consumed per worker per day.
Carpooling resulted in a 9.8% reduction in CO2 emissions and gasoline savings of 3,420 gallons when
compared to every worker driving a separate vehicle. Table 10 shows the increase in emissions and costs
if every worker were to drive their own vehicle. All cost calculations assumed $2.63 per gallon for
gasoline (USEIA, 2009c).
To encourage additional ridesharing, an employer-sponsored incentive was modeled as an alternative
scenario. Assuming the incentive created a modest 20% increase in carpooling (2 workers per vehicle),
there would be a 2.5% savings in erection phase CO2 emissions and $2,250 in fuel savings for employees.
Table 11 details the savings from the increased carpooling scenario.
CO2 (kg) PM10 (kg) Electricity (kWh) Diesel (gal) Cost ($US)
With Diesel Welders 342,000 83.5 8,570 573 $2,330
Without Diesel Welders 336,000 78.0 9,520 0.0 $895
Reduction 5,890 5.56 -952 573 $1,440
Percent reduction 1.7% 6.7% -11.1% 100.0% 61.6%
Table 10. Increase in Emissions and Energy Consumption without Worker Carpooling for NREL RSF Project.
CO2 (kg) Energy (MJ) Gas (gal) Cost ($US)
Current 342,000 4,740,000 5,130 $13,500
No carpooling 376,000 5,250,000 8,560 $22,500
Increase 33,500 508,000 3,420 $9,000
Percent increase 9.8% 10.7% 66.7% 66.7%

21
Table 11. Additional Emissions and Energy Consumption Reductions with Carpooling Incentive for NREL RSF Project.
Ten Hour Work Days
Another suggestion for reducing emissions from worker transportation was switching to ten-hour work
days. By working the same number of hours in only four days per week, worker transportation would be
reduced by 20%. According to feedback from the erector’s project management team, decreased
productivity during longer days is typically offset by reduced start-up and shut down activities, so the
alternative schedule was assumed to have no impact on the number of man hours needed for completion.
An alternative scenario was modeled with a 20% reduction in trips for worker transportation. Results are
shown in Table 12. The net effect is an approximately 3% reduction of total erection phase CO2 emissions
and energy consumption, resulting from a 20% reduction in worker gasoline consumption and expense.
Table 12. Emissions Reductions from 10 Hour Work Day on NREL RSF Project.
No Partial Loads of Materials
Site constraints, mid-construction design changes, and coordination issues between different parties led to
a number of partial loads being delivered from the various steel fabricators to the jobsite. An analysis of
35 deliveries to the jobsite revealed that the average shipment of steel components weighed 35,250 lbs or
73% of a typical semitrailer’s 48,000 lbs capacity. To quantify the benefits of a reduction in the number
of partial loads, a hypothetical scenario was modeled in which all structural steel members were shipped
CO2 (kg) Energy (MJ) Gas (gal) Cost ($US)
Current 342,000 4,740,000 5,130 $13,500
With Incentive 334,000 4,610,000 4,280 $11,250
Reduction 8,380 127,000 856 $2,250
Percent reduction 2.5% 2.7% 16.7% 16.7%
CO2 (kg) Energy (MJ) Gas (gal) Cost ($US)
8 x 5 Work Week 342,000 4,740,000 5,130 $13,500
10 x 4 Work Week 332,000 4,580,000 4,110 $10,800
Reduction 10,100 152,000 1,030 $2,700
Percent reduction 2.9% 3.2% 20.0% 20.0%

22
to the site on fully-loaded semi-trucks (48,000 lbs). It was found that the total number of truck loads
could have been reduced from 87 to 66, and erection phase CO2 emissions could be cut by 8.7% even
after accounting for the reduced fuel mileage of the heavier loads (See Table 13). Additionally, diesel
consumption for materials transportation would decrease by 2,480 gallons, saving approximately $6,600.
A smaller number of deliveries could also have a positive impact on the erector’s productivity, as the
arrival of each shipment requires the erection gang to switch from erection to unloading tasks and back
again.
Table 13. Emissions Reductions from Not Shipping Partial Loads to the NREL RSF Project.
Source Materials from Local Suppliers
The NREL project’s steel trusses and decking were fabricated 921 miles and 1,137 miles from the site,
respectively. Price and quality are primary factors in the selection of suppliers. However, transportation of
materials is responsible for approximately 44% of erection phase CO2 emissions and sourcing materials
regionally or locally can have a significant impact on project-wide emissions. LEED™ defines local
materials as those which come from within 500 miles of the jobsite (USGBC, 2009). An alternative
scenario was tested in which the trusses and decking were sourced from 499 miles away. This minor
change resulted in a 17.9% reduction in erection phase CO2 emissions and $13,600 in fuel cost savings.
Table 14 illustrates the results for this scenario.
Trips Required CO2 (kg) Diesel (gal) Cost ($US)
As-Built 87.0 342,000 13,600 $36,300
No Partial Loads 66.0 312,000 11,200 $29,700
Reduction 21.0 29,800 2,480 $6,600
Percent reduction 24.1% 8.7% 18.2% 18.2%

23
Table 14. Erection Phase Emissions Reductions from Sourcing Materials within 500 Miles of NREL RSF Project.
Conclusion Environmentally speaking, the NREL RSF project has had many successes. The building itself serves as a
model of energy efficiency and sustainable design. The project is targeting a LEED™ Platinum
certification level, constructing a net-zero building, and incorporating advanced building technologies
developed at NREL.
The steel delivery team must also be credited for working to enhance the sustainability efforts on this
project. Incorporating reused gas pipes for structural columns was a unique contribution by the team and
proved to be a superior environmental decision compared to using a newly manufactured alternative. The
reused pipes resulted in a reduction of more than 69% of the energy that would have been required to
produce new comparable materials. It should be noted that the estimated savings account for typical
recycled content that would have been in any newly manufactured materials. While there were challenges
associated with incorporating the reused gas piping into the project, there were measureable
environmental benefits from this decision.
Beyond recycled content and reused materials, there is significant room for improvement in the design,
fabrication, and erection of structural steel. The recommendations chronicled in this report are based on
the notion that inefficiencies result in increased physical waste, which negatively impact sustainability
efforts. The underlying assumption is that by increasing efficiencies throughout the structural steel
delivery process, not only are costs reduced, but also waste, time, energy, materials, and the overall
environmental impact of the structural steel industry.
The individual interviews and focus group revealed several opportunities for improvement for the
structural steel delivery process of future projects. Opportunities for improvement include: (1) establish
direct lines of communication among the structural steel team members, (2) ensure early involvement of
the erector and fabricator in the steel design process, and (3) utilize appropriate technology in the
planning process. Adopting an integrated steel delivery model could positively impact the team’s
communication, improve overall design efficiency, reduce the need for RFIs and shorten response times
for questions. As demonstrated in the LCIA portion of the study, reductions in waste and project
Avg Distance (mi) CO2 (kg) Diesel (gal) Cost ($US)
NREL As-Built 685 342,000 13,600 $36,300
Local Suppliers 428 281,000 8,540 $22,700
Reduction 258 61,100 5,100 $13,600
Percent reduction 37.6% 17.9% 37.4% 37.4%

24
schedule have measurable environmental benefits. It is important to note, however, that the integrated
steel delivery model is highly dependent on the project team members. KL&A has been successful in
using an integrated steel delivery model, but they recognize that their success is largely driven by their
project team’s experience, level of trust, and a willingness to communicate openly and frequently
(personal communication, December 22, 2009).
In addition to conducting interviews, the research team performed life cycle inventory assessments
(LCIA) on several scenarios to identify practical opportunities for energy and emissions reductions
throughout the structural steel delivery process. The results of the LCIA revealed several opportunities for
improvement related to the fabrication and erection phases of the project. Acknowledging that the largest
component in the process is steel production, downstream players still have the potential to make
significant improvements within their own operations. Modeled improvements include: retrofitting
fabrication shop lighting, reducing idle time of the blasting equipment in the fabrication shop, using 100%
electrical site power for erection, eliminating diesel welders, creating incentives for carpooling to the
jobsite, and sourcing materials from local suppliers.
In total, the research team analyzed seventeen scenarios. Ultimately, it will be the responsibility of the
project stakeholders to determine which scenarios to implement. Each scenario will have a varying level
of cost, difficulty of implementation, and overall benefit to a project. The research team found that the
following scenarios would likely have the lowest cost (relative to the other scenarios) with the highest
impact (please refer to the Results section for a detailed analysis of each scenario):
Ensure a smooth transition of information, and thus a minimal drop in knowledge, between
project phases
Conduct a Technology Planning Meeting at the start of every project to ensure interoperability
Use salvaged gas pipe columns instead of new manufactured columns
Upgrade the fabrication shop lighting
Implement a carpooling program for the erection crew
Source materials locally and/or within 500 miles
The structural steel industry has made progress towards the interrelated goals of sustainability and a more
integrated delivery process, yet much work remains to develop and implement recommendations for all
stages of the design, fabrication, and erection processes. During the group interview, the project team
recognized that, as of now, the biggest constraints to employing the above suggestions are the slow
changing construction industry and trust issues. The construction industry was built on adversarial
relationships, after all, and it will take some time to experience a shift in mindsets (personal
communication, December 22, 2009). Eventually the steel industry may move toward a green steel
certification similar to those found in other industries (e.g. the Forest Stewardship Council certification
for sustainable forestry practices). This report chronicles some of the efforts made towards these goals by
the structural steel team on the NREL RSF project and offers opportunities for improvement on future
projects.
25
Acknowledgements The researchers would like to thank the key structural steel delivery team members who funded this
research: KL&A, Inc., Paxton & Vierling Steel, LPR Construction, Haselden Construction, and the
American Institute of Steel Construction (AISC). Additional thanks are extended to everyone who
participated in the interviews and focus group:
Camie Beagan, Steel Detailer, KL&A, Inc.
Shaun Franklin, V.P. Construction Services/Engineering Manager, KL&A, Inc.
Joel Hegge, Project Manager, LPR Construction
Joe Hall, Structural Project Manager, KL&A, Inc.
Erick Hartzell, Project Manager, Haselden Construction
Mark Holland, Chief Engineer, Paxton & Vierling Steel
Rob Hudson, Superintendent, Haselden Construction
Scott Jundt, Project Manager, Paxton & Vierling Steel
Brant Lahnert, Principal Engineer and Chief Financial Officer, KL&A, Inc.
Randy Nelson, Site Superintendent, LPR Construction
Michael Simpson, Senior Associate/Project Manager, RNL Architects
Craig Watts, Owners Representative, MKK/North Star
References AIA National & AIA California Council. (2007). “Integrated project delivery: A guide.”
<http://www.msa-ipd.com/IPD_Guide_2007.pdf> (Oct. 1, 2009).
[AISI] American Iron and Steel Institute (2008), North American steel industry: Reducing energy
consumption, <http://www.sustainable-steel.org/energy.html> (December 19, 2009)
[AGC] Associated General Contractors of America. (2008). The contractor’s guide to BIM – 2nd ed.
Eastman, C., Liston, K., Sacks, R., Teicholz, P. (2008). BIM handbook: A guide to building information
modeling, John Wiley & Sons.
Gillenwater, M. (2008). Redefining RECs—Part 1: Untangling attributes and offsets, Energy Policy 36,
2109-2119
[GDI] Green Design Institute. (2009). “Economic Input-Output Life Cycle Assessment (EIO-LCA)
model.” <http://www.eiolca.net/ > (July 25, 2009)
[NREL] National Renewable Energy Laboratory, “US life-cycle inventory database,”
<http://www.nrel.gov/lci> (Dec. 15, 2009)
Rutledge, D. (2009). In-house IPD meeting, KL&A, Inc.
Stubbles, J. (2000). Energy use in the U.S. steel industry: An historical perspective And future
opportunities. US Department of Energy Office of Industrial Technologies.

26
[USEIA] US Energy Information Administration. (2009a). “Average retail price of electricity to ultimate
customers: Total by end-use sector”
<http://www.eia.doe.gov/cneaf/electricity/epm/table5_3.html> (January 18, 2010).
[USEIA] US Energy Information Administration. (2009b). “Weekly retail on-highway diesel prices.”
<http://tonto.eia.doe.gov/oog/info/wohdp/diesel.asp> (January 18, 2010).
[USEIA] US Energy Information Administration. (2009c). “Weekly U.S. all grades all formulations
retail gasoline prices.”
<http://tonto.eia.doe.gov/dnav/pet/hist/LeafHandler.ashx?n=PET&s=MG_TT_US&f=W>
(January 18, 2010).
[USEPA] US Environmental Protection Agency. (2004). “Exhaust and crankcase emission factors for
nonroad engine modeling: Compression-ignition.” <http://www.epa.gov/oms/nonrdmdl.htm>
(November 10, 2010).
[USGBC] US Green Build Council. (2009). LEED reference guide for green building design and
construction—3rd
ed. USGBC: Washington, DC.