Embed Size (px)
Citation preview

Translating net-zero ambitions into action in the oil and gas industryGreening the barrel

ContactsDubai
Anil PandeySenior executive advisor +971-4-436-3000 [email protected]
James [email protected]
Aditya HarnejaManager+971-4-436-3000aditya.harneja @strategyand.ae.pwc.com
About the authorsJames Thomas is a partner with Strategy& Middle East. Based in Dubai, he is a member of the energy, chemicals, and utilities practice in the Middle East. He has over 20 years of experience, specializing in the oil and gas industry. He advises national and international oil and gas companies on corporate strategy, transformation and navigating the energy transition. He has functional expertise in cultural change, planning, and performance management. He leads the Katzenbach Center in the Middle East, which addresses corporate culture and behavior transformation.
Anil Pandey is a senior executive advisor with Strategy& Middle East. Based in Dubai, he is a member of the energy, chemicals, and utilities practice in the Middle East. He has over 20 years of experience, specializing in the oil and gas industry. He advises national and international oil and gas companies on corporate strategy, transformation and navigating the energy transition. He has functional expertise in strategic planning, operating model design, business performance improvement, innovation, and digitization.
Aditya Harneja is a manager with Strategy& Middle East. Based in Dubai, he is a member of the energy, chemicals, and utilities practice in the Middle East. He has over 10 years of experience focusing on corporate strategy, transformation and investment execution in the energy sector. He supports oil and gas and investment companies in navigating the energy transition, with a focus on alternative energies and decarbonization.
Ishika Sahay and Carlos Monfa of Strategy& Middle East; and Neha Bansal and Karim Salama, both formerly of Strategy& Middle East; also contributed to this report.

Strategy& | Translating net-zero ambitions into action in the oil and gas industry 1
EXECUTIVE SUMMARY
National oil companies (NOCs) and international oil companies (IOCs) are aiming to reduce greenhouse gas (GHG) emissions from their operations. Regulators, investors, customers, and other stakeholders are pressuring the industry to decarbonize. Although the long-term aim is net-zero emissions, it is vital to translate these targets into action in the near term and manage perceptional and commercial risks. Companies that reduce their emissions will acquire a differentiated value proposition. Going forward, each barrel of oil with the lowest possible emissions intensity—that is, the greenest barrel—will become a source of competitive advantage. Companies need to rapidly translate their net-zero targets into actionable plans.
To do this, it is essential for oil and gas companies to start by understanding and resolving three specific complexity challenges. The first challenge is establishing a clear emissions baseline across vast value chains to recognize the sources, concentration, and magnitude of emissions. The second challenge is to determine the actual emissions intensity across assets in the portfolio, which can vary greatly due to technical and operational characteristics. The third challenge is to develop a clear understanding of the range of decarbonization solutions, and their maturity and economics, to assess feasibility across the asset portfolio.
Thereafter, to drive tangible action toward net-zero emissions, oil and gas companies have five imperatives:
1. Approach decarbonization with a focus on long-term shareholder value.2. Identify portfolio decarbonization priorities and make clear choices.3. Take a systems approach to decarbonization solutions.4. Capitalize on new partnership models.5. Build integrated pathways for implementation.
Additionally, NOCs in the Gulf Cooperation Council (GCC)1 should become national decarbonization catalysts. Beyond decarbonizing their own operations, they should build partnerships, lead development of capabilities, and work closely with their governments to promote wider decarbonization efforts.
1. The GCC countries are Bahrain, Kuwait, Oman, Qatar, Saudi Arabia, and the United Arab Emirates.

Strategy& | Translating net-zero ambitions into action in the oil and gas industry2
Transforming the hydrocarbons-based energy system will be one of the most significant corporate actions of this decade. The oil and gas industry plays an outsized role, accounting for 45 percent of global anthropogenic GHG emissions, according to the International Energy Agency.2 Of that total, 10 percent comes directly from within oil and gas companies—known as Scope 1 (from internal operations) and Scope 2 (for the energy purchased to run those operations). The remaining 35 percent of the industry’s emissions occur when customers combust oil and gas products and their derivatives, which is defined as Scope 3 (see Exhibit 1).
GROWING PRESSURE TO DECARBONIZE
EXHIBIT 1
Main sources of oil and gas industry greenhouse gas emissions
Global greenhouse gas emissions breakdown (gigatons CO2 equivalent, 2018)
Note: Figures may not sum due to rounding. 1 Of the remaining 55% of emissions, approximately 40% come from coal, 10% from agriculture, and 5% from waste. Source: “The Oil and Gas Industry in Energy Transitions,” IEA (https://www.iea.org/reports/the-oil-and-gas-industry-in-energy-transitions); Strategy& analysis
Total Scope 3
Oil
GasOil
Gas
Others Scope 1 + 2
2
29
7
3
11
5
29(55%)
19(35%)
5(10%)
52
19
Oil and gas Scope 1 + 2 Oil and gas Scope 3 Others1
2. Of the remaining 55 percent of emissions, approximately 40 percent comes from coal, 10 percent from agriculture, and 5 percent from waste. “The Oil and Gas Industry in Energy Transitions,” (IEA https://www.iea.org/reports/the-oil-and-gas-industry-in-energy-transitions).

Governments, investors, customers, and other stakeholders have all declared their intent to reduce GHG emissions, and the race for decarbonization in the oil and gas industry has begun. At the national level, all 192 signatories of the Paris Agreement have set decarbonization targets for 2030.3 Currently, about 22 percent of global GHG emissions are covered under carbon-pricing schemes, a fourfold increase since 2010.4 Several countries are establishing or expanding national emissions trading schemes, taking advantage of market forces to determine a fair cost of hydrocarbons.
Shareholders are taking similar steps. In the first half of 2021 alone, nearly as many shareholder resolutions related to climate change and the environment were filed as in all of 2020. According to a 2020 study by Schroders, 67 percent of the world’s 650 biggest institutional investors cite full environmental, social, and governance (ESG) integration as their favored investment approach, which makes reducing emissions critical for companies looking to raise debt or equity capital from international markets.5 At the same time, public activism has focused pressure on certain types of oil and gas operations, particularly assets that have a larger environmental impact, such as oil sands and shale.
In most other sectors, companies that use oil are seeking to shift to non-hydrocarbon-based alternatives and renewables to meet their energy needs. More than 25 percent of companies listed on the S&P 500, and more than 20 percent of the Forbes Global 2000, have announced net-zero pledges, which they intend to meet mainly by reducing their reliance on hydrocarbons.6
All of these measures have considerable implications for the oil and gas industry. Although a significant need for oil and gas will remain for the foreseeable future, companies will no longer be assessed solely by the price and quality of their products. Instead, customers will factor in the emissions intensity behind every barrel produced and sold, creating new challenges and opportunities for the industry.
In response, many oil and gas companies have set targets for decarbonizing their operations. IOCs began announcing such targets in 2019, focusing primarily on achieving net-zero emissions from their operations (Scope 1 and 2). A subset of IOCs also announced their intention to reduce emissions from the use of oil and gas products among customers (Scope 3). Recognizing the importance of decarbonization, many NOCs have also announced GHG emissions reduction targets (see Exhibit 2).
3. NDC Registry, United Nations Framework Convention on Climate Change (https://www4.unfccc.int/sites/NDCStaging/Pages/All.aspx).4. World Bank, Carbon Pricing Dashboard (https://carbonpricingdashboard.worldbank.org/map_data).5. Schroders Institutional Investor Study, 2020 (https://tinyurl.com/pyvmxymy).6. Disha Shetty, “A Fifth of World’s Largest Companies Committed to Net Zero Target,” Forbes, March 24, 2021 (https://www.forbes.com/sites/dishashetty/2021/03/24/a-fifth-of-worlds-largest-companies-committed-to-net-zero-target/?sh=2bd9da8e662f).
Although a significant need for oil and gas will remain for the foreseeable future, companies will no longer be assessed solely by the price and quality of their products. Instead, customers will factor in the emissions intensity behind every barrel produced and sold, creating new challenges and opportunities for the industry.
Strategy& | Translating net-zero ambitions into action in the oil and gas industry 3

EXHIBIT 2
Net-zero target announcements by select oil and gas operators
Note: IOC = international oil company; NOC = national oil company. Selection includes top 25 oil and gas companies by market capitalization and two Gulf Cooperation Council NOCs, the Abu Dhabi National Oil Company and Qatar Petroleum. Companies with previous announcements are in gray. Source: Strategy& analysis
2
7
16
23
First half 2021Second half 2020First half 2020Second half 2019
Independents/IOCs Independents/IOCs
NOCs Independents/IOCs
NOCs Independents/IOCs
NOCs
Eni
ChevronEni
Lundin
Chevron
Repsol3
BP3 SaudiAramco
Equinor3
ConocoPhillips
Eni
OMV
Oxy
Net zero Partial decarbonization Scope 3 emissions included in targets3
Hess
Lundin
Chevron
Petronas
SaudiAramco
Lundin
PetroChina
Petrobras
Chevron
Inpex
Cenovus
Eni
Woodside
Sinopec
OMV
OxyConocoPhillipsHess
EcopetrolQatar PetroleumADNOC
Petronas
Petrobras
PetroChina
SaudiAramco
Total3
Shell3
BP3
Repsol3
Equinor3
Shell3
Total3
BP3
Repsol3
Equinor3
Strategy& | Translating net-zero ambitions into action in the oil and gas industry4
Strategy& | Translating net-zero ambitions into action in the oil and gas industry 5
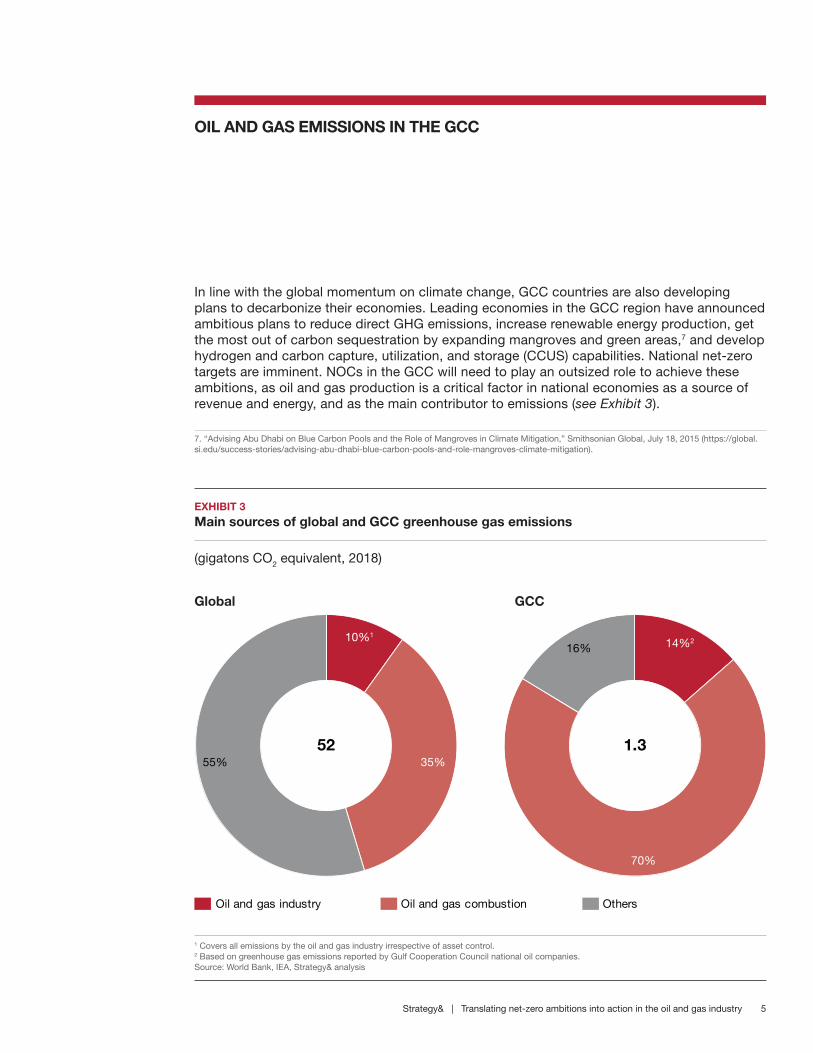
In line with the global momentum on climate change, GCC countries are also developing plans to decarbonize their economies. Leading economies in the GCC region have announced ambitious plans to reduce direct GHG emissions, increase renewable energy production, get the most out of carbon sequestration by expanding mangroves and green areas,7 and develop hydrogen and carbon capture, utilization, and storage (CCUS) capabilities. National net-zero targets are imminent. NOCs in the GCC will need to play an outsized role to achieve these ambitions, as oil and gas production is a critical factor in national economies as a source of revenue and energy, and as the main contributor to emissions (see Exhibit 3).
OIL AND GAS EMISSIONS IN THE GCC
1 Covers all emissions by the oil and gas industry irrespective of asset control.2 Based on greenhouse gas emissions reported by Gulf Cooperation Council national oil companies.Source: World Bank, IEA, Strategy& analysis
EXHIBIT 3
Main sources of global and GCC greenhouse gas emissions
(gigatons CO2 equivalent, 2018)
Global GCC
7. “Advising Abu Dhabi on Blue Carbon Pools and the Role of Mangroves in Climate Mitigation,” Smithsonian Global, July 18, 2015 (https://global.si.edu/success-stories/advising-abu-dhabi-blue-carbon-pools-and-role-mangroves-climate-mitigation).
35%55%
10%1
Oil and gas industry OthersOil and gas combustion
52
70%
16% 14%2
1.3

To play a leading role in national decarbonization plans and to maintain their position as reliable energy suppliers to the world, NOCs in the GCC need to continue to outline clear ambitions on decarbonization and translate these into visible action.
At the same time, developments in international markets and regulations give an added impetus for NOCs to demonstrate a clear commitment to decarbonization. Transparency and tangible action on emissions are already becoming important in certain export markets. For example, some governments are considering measures such as carbon border adjustment taxes for imported products based on the emissions intensity at the source of production.8 Also under consideration are market-based mechanisms such as introducing production emissions intensity as a quality indicator impacting crude oil pricing in a manner similar to sulfur content and American Petroleum Institute (API) gravity (a measure of how heavy or light a petroleum liquid is compared with water). Moreover, the increased focus of global investors on ESG means that emissions disclosures and action will be critical for continued access to international capital markets.
To play a leading role in national decarbonization plans and to maintain their position as reliable energy suppliers to the world, NOCs in the GCC need to continue to outline clear ambitions on decarbonization and translate these into visible action.
8. European Commission Carbon Border Adjustment Mechanism (https://ec.europa.eu/taxation_customs/green-taxation-0/carbon-border-adjustment-mechanism_en#:~:text=On%2014%20July%202021%2C%20the,lead%20to%20’carbon%20leakage’).
Strategy& | Translating net-zero ambitions into action in the oil and gas industry6

Strategy& | Translating net-zero ambitions into action in the oil and gas industry 7
The challenge for oil and gas companies is how to translate these ambitions into action given the sheer complexity of the task. There are three main sources of complexity. These are:
Establishing a clear emissions baseline across vast value chainsThe first major source of complexity is that most companies do not have the technology in place to measure the actual emissions from their operations. Instead, they typically rely on benchmarks that estimate emissions by the size and type of equipment the company operates. Accordingly, the first challenge is to establish a clear and reliable baseline of the company’s actual emissions footprint across the entire value chain, thereby identifying the greatest decarbonization opportunities.
Segmenting global emissions from the oil and gas industry provides an indication of emissions sources, concentration, and magnitude across the value chain (see Exhibit 4).
THREE SOURCES OF COMPLEXITY
EXHIBIT 4
Concentration of emissions along the global oil and gas value chain
Note: Some figures do not sum due to rounding. LNG = liquefied natural gas.1 Represents venting, flaring, and fugitive emissions.Source: IEA, Strategy& analysis
Energy 7% 1% 17%
1% 36%
1% 2%
3% 6%
5% 5% 4%
Process - - - - - -
- -
6%
1%
2%
Waste1
Total
3%
MidstreamUpstream Downstream
Oil and gas Drilling Completion ProductionTransport and shipping
LNG terminals,transmission,and distribution
ConversionSeparationOther processes
67% 11% 22%
Oil Gas High concentration of emissions Low concentration of emissions
Upstream sources represent the largest share of Scope 1 and 2 emissions for oil and gas companies, approximately 65 to 70 percent of the total. These include the combustion of fuel to power operations, along with venting, flaring, and the release of fugitive emissions (primarily methane) that happen during extraction and processing activities.
Midstream sources are the smallest share of Scope 1 and 2 emissions, making up roughly 10 to 12 percent of the total. These emissions sources include gas combustion to power gas pipeline networks, compressor stations, and liquefaction processes at LNG terminals; combustion of fuels to operate crude oil and products tankers and LNG carriers; and fugitive emissions during transport.
Downstream sources account for approximately 20 to 25 percent of total oil and gas Scope 1 and Scope 2 emissions. These emissions sources include the combustion of gas and fuels to power process units at refineries, along with the by-products of certain refining processes themselves, such as hydrogen production, fluid catalytic cracking, and others.
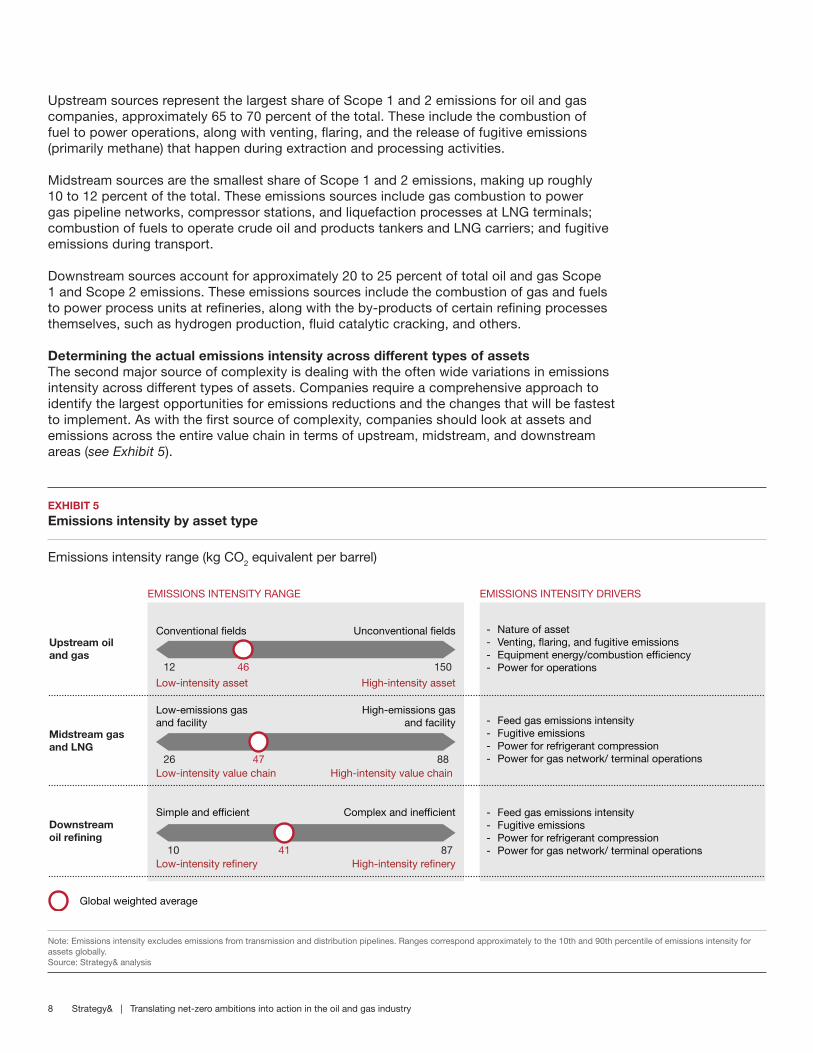
Determining the actual emissions intensity across different types of assets The second major source of complexity is dealing with the often wide variations in emissions intensity across different types of assets. Companies require a comprehensive approach to identify the largest opportunities for emissions reductions and the changes that will be fastest to implement. As with the first source of complexity, companies should look at assets and emissions across the entire value chain in terms of upstream, midstream, and downstream areas (see Exhibit 5).
Note: Emissions intensity excludes emissions from transmission and distribution pipelines. Ranges correspond approximately to the 10th and 90th percentile of emissions intensity for assets globally.Source: Strategy& analysis
EXHIBIT 5
Emissions intensity by asset type
Emissions intensity range (kg CO2 equivalent per barrel)
EMISSIONS INTENSITY DRIVERSEMISSIONS INTENSITY RANGE
Upstream oiland gas
Midstream gasand LNG
Downstreamoil refining
Conventional fields
12 15046
Unconventional fields
Low-intensity asset High-intensity asset
Low-intensity value chain High-intensity value chain
Low-intensity refinery High-intensity refinery
Low-emissions gasand facility
Global weighted average
26 8847
High-emissions gasand facility
Simple and efficient
10 8741
Complex and inefficient
- Nature of asset - Venting, flaring, and fugitive emissions- Equipment energy/combustion efficiency- Power for operations
- Feed gas emissions intensity- Fugitive emissions- Power for refrigerant compression- Power for gas network/ terminal operations
- Feed gas emissions intensity- Fugitive emissions- Power for refrigerant compression- Power for gas network/ terminal operations
Strategy& | Translating net-zero ambitions into action in the oil and gas industry8

In upstream operations, emissions intensity is driven primarily by the nature of the asset. For instance, shale assets are generally associated with higher fugitive emissions (i.e., those that are unplanned) owing to significant uncontrolled volumes of flowback gases in fracking operations. Similarly, production operations for oil sands assets are very energy-intensive because of the complex extraction methods required and the additional need to upgrade the extracted crude. By contrast, conventional assets generally require less energy for production, mostly derived from the on-site combustion of gas and other fuels, or the use of gas in pneumatic devices. Offshore platforms generate emissions mainly from combustion of fuel to power exploration rigs, and the use of associated gas to power turbines for production rigs.
However, the emissions of assets can vary, depending on several factors. These include the properties of the field, such as reservoir depth, pressure, number of wells, and production volume. Fluid properties of extracted oil, such as its relative API gravity, also affect emissions. Production processes, such as downhole pumping, water reinjection or flooding, or in situ mining for oil sands, also have an impact on emissions. Similarly, processing methods and practices, such as flaring and venting ratios, dehydration, and the removal of methane, can affect emissions intensity.
In midstream operations, the biggest source of variance in emissions occurs in LNG terminal assets. That variance is based on factors such as the inherent emissions intensity of the feed gas, the configuration and properties of the mechanical drive that powers refrigerant compression for liquefaction, the energy efficiency of ancillary processes such as oil heating, the power required for the berthing of ships, and so on.
In downstream operations, there is a direct correlation between the process complexity of refineries and the volume of emissions. However, to accurately compare the emissions performance of various refinery assets in a portfolio, companies need to link them to their equivalent distillation capacity, using a methodology such as the Nelson Complexity Index (a standard oil and gas industry measurement). For example, a deep conversion refinery could run with the most efficient energy consumption and throughput, whereas an older hydroskimming refinery could be inefficient and produce significantly more emissions per equivalent distillation capacity. The overall emissions from each asset paint a different picture owing to the differences in process complexity.
Strategy& | Translating net-zero ambitions into action in the oil and gas industry 9
Note: LNG = liquefied natural gas; R&D = research and development. 1 Includes blue and green hydrogen. 2 Represents on-site renewables installations and excludes renewables bought through power purchase agreements.Source: Strategy& analysis
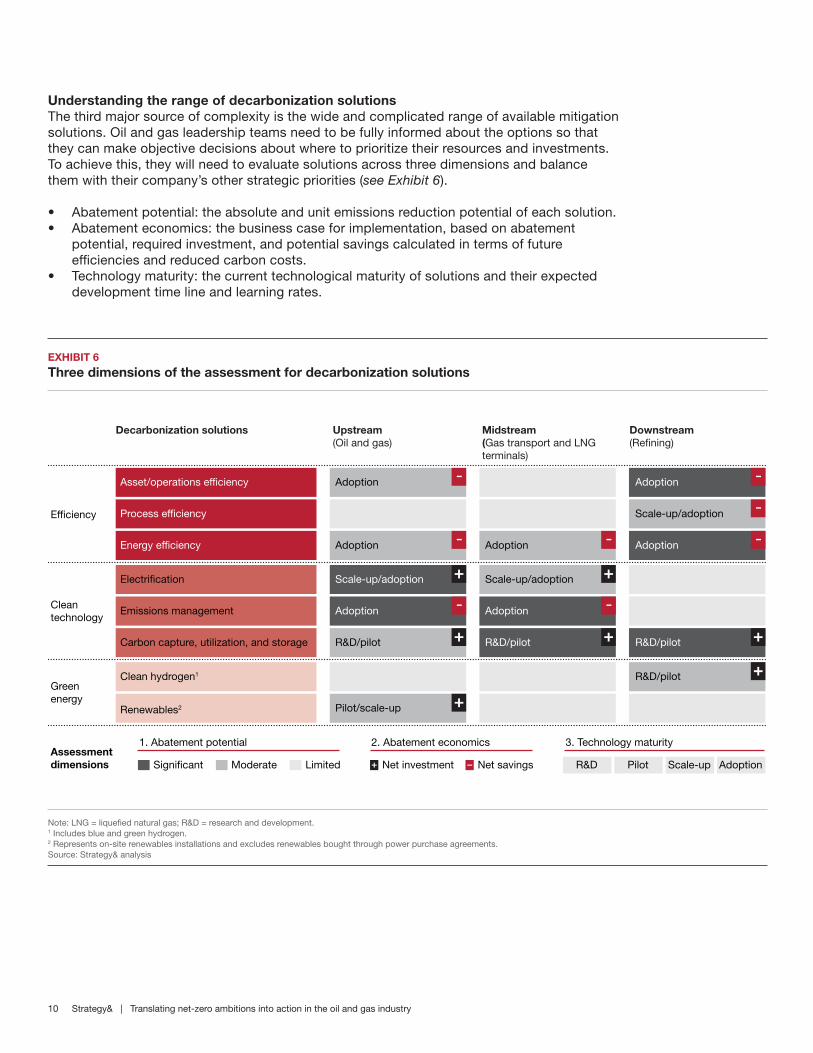
Understanding the range of decarbonization solutionsThe third major source of complexity is the wide and complicated range of available mitigation solutions. Oil and gas leadership teams need to be fully informed about the options so that they can make objective decisions about where to prioritize their resources and investments. To achieve this, they will need to evaluate solutions across three dimensions and balance them with their company’s other strategic priorities (see Exhibit 6).
• Abatement potential: the absolute and unit emissions reduction potential of each solution.• Abatement economics: the business case for implementation, based on abatement
potential, required investment, and potential savings calculated in terms of future efficiencies and reduced carbon costs.
• Technology maturity: the current technological maturity of solutions and their expected development time line and learning rates.
EXHIBIT 6
Three dimensions of the assessment for decarbonization solutions
Efficiency
Greenenergy
Assessment dimensions
Cleantechnology
Asset/operations efficiency
Decarbonization solutions Upstream (Oil and gas)
Midstream (Gas transport and LNGterminals)
Downstream(Refining)
Energy efficiency
Process efficiency
Emissions management
Electrification
Carbon capture, utilization, and storage
Renewables2
Clean hydrogen1
Adoption
Adoption
Scale-up/adoption
Scale-up/adoption
Adoption
R&D/pilot
Pilot/scale-up
Adoption
Scale-up/adoption
Adoption
R&D/pilot
Adoption
Adoption
R&D/pilot
R&D/pilot
1. Abatement potential
Significant Moderate Limited
2. Abatement economics
Net investment Net savings
3. Technology maturity
R&D Pilot Scale-up Adoption
Strategy& | Translating net-zero ambitions into action in the oil and gas industry10

For example, emissions management solutions have considerable abatement potential, are already technologically mature, and have positive economics due to the value of captured methane they address. These solutions include leak detection and repair programs, and the replacement of faulty pneumatic devices. Similarly, efficiency measures are already being adopted across upstream operations and refineries seeking to reduce emissions while also cutting energy costs.
Some measures, such as electrification, need to be evaluated on a case-by-case basis. Although it is technologically feasible to run upstream production platforms and LNG terminals using electric power, rather than combusting hydrocarbons, such technologies still incur high costs. As a result, the adoption of these measures for individual assets should be assessed using available decarbonization alternatives, and underlying economics linked to applicable carbon prices.
CCUS solutions have traditionally been less compelling, unless combined with a high-carbon-price environment or monetization plans for the captured CO2 (for example, through enhanced oil recovery). In the U.S., the business case for CCUS solutions in gas processing has recently turned positive, thanks to government incentives directly linked with the capture, storage, and utilization of CO2. Other promising applications of carbon capture systems are in refineries and LNG terminals. Although adoption today is low as a result of unfavorable economics, major international oil and gas players have already made significant commitments to scale up deployment in line with longer-term decarbonization plans toward net-zero targets.
Of course, strategic considerations can override the three assessment dimensions for certain abatement solutions, such as clean hydrogen. There is increasing consensus that clean hydrogen will play an important role in decarbonizing the energy system. However, hydrogen will play a relatively smaller role in directly decarbonizing oil and gas operations. Moreover, different approaches to produce clean hydrogen, for example green hydrogen (which uses renewables) and blue hydrogen (which uses carbon capture technology), have technological and commercial challenges today. Nonetheless, oil and gas companies are making significant investments in clean hydrogen with a strategic view on the importance of hydrogen as a fuel alternative to hydrocarbons in the future.9
9. Dr. Yahya Anouti, Dr. Shihab Elborai, Dr. Raed Kombargi, and Ramzi Hage, “The dawn of green hydrogen: Maintaining the GCC’s edge in a decarbonized world,” Strategy&, 2020 (https://www.strategyand.pwc.com/m1/en/reports/2020/the-dawn-of-green-hydrogen.html); Dr. Ulrich Koegler, James Thomas, and Susie Almasi, “How the GCC can become a force in global green hydrogen: The green ammonia supply chain,” Strategy&, 2020 (https://www.strategyand.pwc.com/m1/en/reports/2020/how-the-gcc-can-become-a-force-in-global-green-hydrogen.html).
Strategy& | Translating net-zero ambitions into action in the oil and gas industry 11

Strategy& | Translating net-zero ambitions into action in the oil and gas industry12
There are five imperatives that oil and gas companies should follow to generate tangible action from their decarbonization strategies and targets (see Exhibit 7).
FIVE IMPERATIVES FOR TRANSLATING AMBITION INTO ACTION
EXHIBIT 7
Five imperatives for oil and gas players
Source: Strategy&
Net-zerogoal
Build integrated pathways for implementation
Identify portfolio decarbonization priorities and make clear choices
Approach decarbonization with a focus on long-term shareholder value
Take a systems approach to decarbonization solutions
Capitalize on new partnership models
1
25
34

1. Approach decarbonization with a focus on long-term shareholder valueCompanies need to ensure that they can provide their investors with positive returns along with tangible progress toward emissions reduction targets. Some decarbonization investments will generate a near-term positive impact, due to potential savings and efficiencies. Others may take longer to result in a return on investment, factoring in expanding carbon price regimes, the incorporation of emissions intensity benchmarking in product pricing, future access to capital markets, and maintenance of the social license10 to operate in global markets. Management teams must weigh these considerations carefully. They will need to prioritize capital expenditures and other initiatives with an eye to ensuring positive shareholder returns while maximizing progress in reduction of emissions.
2. Identify portfolio decarbonization priorities and make clear choicesCompanies need to identify and focus on the largest opportunities to ensure that decarbonization efforts are effective. These opportunities are presented by the small number of assets in the portfolio (typically 20 to 40 percent) that contribute a disproportionate share of emissions (typically 60 to 80 percent). To find these priorities, it is essential to create a baseline of total emissions for the full value chain of operations, along with the emissions intensity of individual assets, and then benchmark them against those of industry peers in order to identify priority areas for decarbonization.
The range of potential solutions for those assets will vary. Assets that are strategically important are candidates for investment and intervention. In other cases, companies may opt to carve out, or divest, assets that are not crucial to the business strategy, or that present emissions sources that will be costly and difficult to mitigate. For example, some IOCs are divesting or shutting down emissions-intensive assets to demonstrate their low-carbon credentials.
3. Take a systems approach to decarbonization solutions Companies need to use integrated systems to address the most urgent decarbonization priorities, rather than implementing discrete solutions at specific points of emission across their operations. Doing the latter risks resulting in unfavorable returns on capital and poor levels of reduction in emissions intensity. To succeed, companies must first develop a clear understanding of solution economics, categorizing the sources and magnitude of specific emissions (energy versus process versus waste) addressed by potential solutions. For broader systems solutions, companies should determine their technology maturity, required investment, time to realize benefits, and cost per unit of emissions avoided.
As part of the systems approach, companies should bring together cross-functional teams to consider four key factors:
• Potential synergies from investing in solutions that can be applied to different assets.• Capabilities required to develop and deploy solutions.• The feasibility of implementation based on operational viability (looking at issues such as
asset downtime requirements and technical or operational complexities) and accessibility to solutions in the market.
• The best ways to combine solutions across different points of emission into integrated systems for major emissions sources.
10. E. Raufflet, S. Baba, C. Perras, and N. Delannon, “Social License.” In: S.O. Idowu, N. Capaldi, L. Zu, and A.D. Gupta (eds), Encyclopedia of Corporate Social Responsibility (Springer, 2013) (https://doi.org/10.1007/978-3-642-28036-8_77).
Strategy& | Translating net-zero ambitions into action in the oil and gas industry 13

4. Capitalize on new partnership modelsCompanies will require a new approach to partnerships because of the magnitude of emissions reductions required and the need to achieve climate targets in a timely manner. To become contenders in the race for the greenest barrel, companies must reflect on their specific contexts and develop a new partnership approach; they must take advantage of capabilities, pool investments, and maximize lessons learned from the ecosystem.
The following partnership models are emerging:
Industrial clusters: Oil and gas players are joining forces with government and heavy industry to achieve scale in decarbonization of industrial clusters, often integrating entities that did not collaborate in the past. For instance, several major CCUS clusters are taking shape in Europe and the United States. In those arrangements, governments and local authorities provide funding and devise regulatory mechanisms to incentivize decarbonization, while heavy industry players and refiners jointly invest in CO2 capture and separation facilities. Further, in these arrangements, chemicals and fertilizers players adopt newer technologies to utilize captured CO2 as feedstock, oil and gas players develop pipeline infrastructure and prepare depleted fields to sequester the captured CO2, and utility and new technology players develop low-carbon power and hydrogen plants to provide cleaner energy.
Industry alliances: NOCs and IOCs are coming together to decarbonize their operations. Multi-partner alliances are setting decarbonization targets, standardizing measurement and reporting frameworks, and investing jointly in new technology ventures.
Technology partnerships: Oil and gas service players are partnering with technology licensors to build process know-how and jointly develop holistic decarbonization systems. Such an approach is in contrast to the traditional method of technology companies developing solutions for specific emissions sources for their NOC and IOC customers.
Operating partnerships: Operating partners are expanding the scope of their relationships to jointly invest in developing and piloting emerging technologies to decarbonize producing assets.
Digital partnerships: Oil and gas players are partnering with technology giants to digitize operations, increase real-time visibility on emissions data, and explore new ways to optimize decarbonization across the value chain.
Strategy& | Translating net-zero ambitions into action in the oil and gas industry14
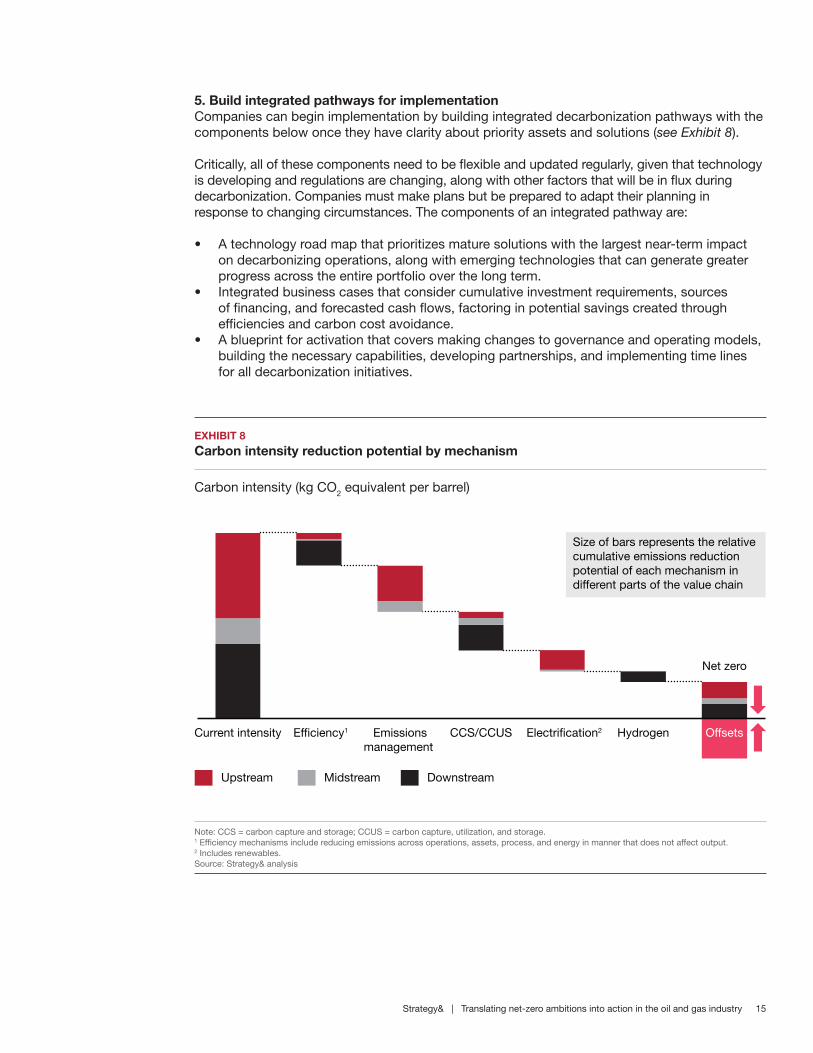
5. Build integrated pathways for implementationCompanies can begin implementation by building integrated decarbonization pathways with the components below once they have clarity about priority assets and solutions (see Exhibit 8).
Critically, all of these components need to be flexible and updated regularly, given that technology is developing and regulations are changing, along with other factors that will be in flux during decarbonization. Companies must make plans but be prepared to adapt their planning in response to changing circumstances. The components of an integrated pathway are:
• A technology road map that prioritizes mature solutions with the largest near-term impact on decarbonizing operations, along with emerging technologies that can generate greater progress across the entire portfolio over the long term.
• Integrated business cases that consider cumulative investment requirements, sources of financing, and forecasted cash flows, factoring in potential savings created through efficiencies and carbon cost avoidance.
• A blueprint for activation that covers making changes to governance and operating models, building the necessary capabilities, developing partnerships, and implementing time lines for all decarbonization initiatives.
Note: CCS = carbon capture and storage; CCUS = carbon capture, utilization, and storage. 1 Efficiency mechanisms include reducing emissions across operations, assets, process, and energy in manner that does not affect output. 2 Includes renewables.Source: Strategy& analysis
EXHIBIT 8
Carbon intensity reduction potential by mechanism
Carbon intensity (kg CO2 equivalent per barrel)
HydrogenEmissionsmanagement
Efficiency1Current intensity
Upstream
CCS/CCUS Electrification2 Offsets
Net zero
Size of bars represents the relative cumulative emissions reduction potential of each mechanism in different parts of the value chain
Midstream Downstream
Strategy& | Translating net-zero ambitions into action in the oil and gas industry 15

Strategy& | Translating net-zero ambitions into action in the oil and gas industry16
In addition to responding to the global importance of reducing emissions, GCC NOCs have an important national role to play. GCC NOCs are critical to their respective economies and can become national catalysts for decarbonization, leaders in achieving each country’s national climate targets. Simultaneously, they can enhance the long-term resilience of national hydrocarbon resources. Beyond decarbonizing their own operations, NOCs can contribute to wider efforts by taking the following actions:
• Work closely with government authorities to design national net-zero pathways.• Partner with research institutes and reporting authorities to institutionalize carbon reporting
and tracking based on emerging international standards.• Implement internal carbon pricing mechanisms and exploit that experience to work with
regulators on designing national carbon pricing frameworks.• Develop capabilities in new decarbonization technologies (such as CCUS and clean
hydrogen) and push their adoption across the broader industrial ecosystem.
GCC NOCs AS NATIONAL CATALYSTS FOR DECARBONIZATION

Strategy& | Translating net-zero ambitions into action in the oil and gas industry 17
The oil and gas industry’s recently announced decarbonization agendas and initiatives are significant. They require effective implementation and tangible results in the near future. Translating net-zero ambition to action requires that leadership teams think beyond their traditional focus on the cost and quality of their oil and gas. That will be difficult. However, the fate of individual companies and the environment depends upon how they rise to this challenge.
CONCLUSION

© 2021 PwC. All rights reserved. PwC refers to the PwC network and/or one or more of its member firms, each of which is a separate legal entity. Please see www.pwc.com/structure for further details. Mentions of Strategy& refer to the global team of practical strategists that is integrated within the PwC network of firms. For more about Strategy&, see www.strategyand.pwc.com. No reproduction is permitted in whole or part without written permission of PwC. Disclaimer: This content is for general purposes only, and should not be used as a substitute for consultation with professional advisors.
www.strategyand.pwc.com/me
Strategy&Strategy& is a global strategy consulting business uniquely positioned to help deliver your best future: one that is built on differentiation from the inside out and tailored exactly to you. As part of PwC, every day we’re building the winning systems that are at the heart of growth. We combine our powerful foresight with this tangible know-how, technology, and scale to help you create a better, more transformative strategy from day one.
As the only at-scale strategy business that’s part of a global professional services network, we embed our strategy capabilities with frontline teams across PwC to show you where you need to go, the choices you’ll need to make to get there, and how to get it right.
The result is an authentic strategy process powerful enough to capture possibility, while pragmatic enough to ensure effective delivery. It’s the strategy that gets an organization through the changes of today and drives results that redefine tomorrow. It’s the strategy that turns vision into reality. It’s strategy, made real.
strategyand.pwc.com/me
Read the latest Ideation Center insights
Connect with Strategy& Middle East
twitter.com/strategyand
linkedin.com/company/strategyand
youtube.com/user/strategyand
Connect with Strategy&
twitter.com/strategyandme
linkedin.com/company/strategyandme
ideationcenter.com
© 2021 PwC. All rights reserved. PwC refers to the PwC network and/or one or more of its member firms, each of which is a separate legal entity. Please see www.pwc.com/structure for further details. Mentions of Strategy& refer to the global team of practical strategists that is integrated within the PwC network of firms. For more about Strategy&, see www.strategyand.pwc.com. No reproduction is permitted in whole or part without written permission of PwC. Disclaimer: This content is for general purposes only, and should not be used as a substitute for consultation with professional advisors.
www.strategyand.pwc.com/me


![M1 Garand Barrel Replacement – New Barrel[1]](https://img.pdfslide.net/doc/110x75/577c79801a28abe05492e684/m1-garand-barrel-replacement-a-new-barrel1.jpg)