Embed Size (px)
DESCRIPTION
Geophysics paper
Citation preview

Pore-scale Intermittent Velocity Structure UnderpinningAnomalous Transport through 3D Porous MediaPeter Kang1, Pietro de Anna1, Joao P. Nunes2,3, Branko Bijeljic2, Martin J. Blunt2
and Ruben Juanes1
Corresponding author: Ruben Juanes, Massachusetts Institute of Technology, 77 Massachusetts Ave,
Cambridge, Massachusetts 02139, USA. ([email protected])
1Massachusetts Institute of Technology, 77
Massachusetts Ave, Cambridge, Massachusetts
02139, USA
2Imperial College London, London SW7
2AZ, United Kingdom
3Petrobras E&P, Rio de Janeiro, Brazil
This article has been accepted for publication and undergone full peer review but has not beenthrough the copyediting, typesetting, pagination and proofreading process, which may lead todifferences between this version and the Version of Record. Please cite this article as doi:10.1002/2014GL061475
c©2014 American Geophysical Union. All Rights Reserved.

We study the nature of non-Fickian particle transport in 3D porous media by
simulating fluid flow in the intricate pore space of real rock. We solve the full
Navier-Stokes equations at the same resolution as the 3D micro-CT image of
the rock sample, and simulate particle transport along the streamlines of the ve-
locity field. We find that transport at the pore scale is markedly anomalous: lon-
gitudinal spreading is superdiffusive, while transverse spreading is subdiffusive.
We demonstrate that this anomalous behavior originates from the intermittent
structure of the velocity field at the pore scale, which in turn emanates from the
interplay between velocity heterogeneity and velocity correlation. Finally, we
propose a continuous time random walk model that honors this intermittent struc-
ture at the pore scale and captures the anomalous 3D transport behavior at the
macroscale.
c©2014 American Geophysical Union. All Rights Reserved.

Fluid flow and transport in geologic porous media is critical to many natural and engineered
processes, including sustainable exploitation of groundwater resources [Harvey et al., 2002;
Gleeson et al., 2012], enhanced oil recovery [Orr and Taber, 1984], geologic carbon seques-
tration [IPCC, 2005; Szulczewski et al., 2012], geologic nuclear waste disposal [Yoshida and
Takahashi, 2012] and water filtration [Elliott et al., 2008].
Despite the broad relevance of flow and transport through geologic porous media, our under-
standing still faces significant challenges. One such challenge is the almost ubiquitous obser-
vation of anomalous (non-Fickian) transport behavior, from laboratory experiments in packed
beds [Kandhai et al., 2002; Moroni et al., 2007], sand columns [Cortis and Berkowitz, 2004]
and rock samples [Scheven et al., 2005; Bijeljic et al., 2011] to field scale experiments [Garabe-
dian et al., 1991; Le Borgne and Gouze, 2007]. The signatures of anomalous behavior are
early breakthrough, long tailing of the first passage time distribution, non-Gaussian or mul-
tipeaked plume shapes, and nonlinear scaling of the mean square displacement—effects that
cannot be captured by a traditional advection-dispersion formulation. There are several models
that describe and predict non-Fickian transport, by replicating the broad (power-law) distribu-
tion of velocity; these include multirate mass transfer [Haggerty and Gorelick, 1995], fractional
advection-dispersion [Benson et al., 2001], and continuous time random walk (CTRW) mod-
els [Berkowitz et al., 2006; Bijeljic and Blunt, 2006], and the equivalence between the models
is shown for certain cases [Dentz and Berkowitz, 2003].
In addition to velocity heterogeneity, recent studies have pointed out the importance of veloc-
ity correlation in the signature of anomalous transport, and have incorporated velocity correla-
tion in various forms [Le Borgne et al., 2008; Dentz and Bolster, 2010; Kang et al., 2011; Edery
c©2014 American Geophysical Union. All Rights Reserved.

et al., 2014]. In particular, numerical simulations using smoothed particle hydrodynamics of
flow and transport on simple 2D porous media suggest that longitudinal spreading is strongly
modulated by the intermittent structure of Lagrangian velocity [de Anna et al., 2013], which is
also observed in laboratory experiments in 3D glass bead packs [Datta et al., 2013]. However,
the role of velocity correlation on anomalous transport has not yet been studied for real 3D
rocks, and flow fields through 3D disordered porous media are fundamentally different from
flow fields in 2D or 3D ordered porous media.
Moreover, a fundamental question remains: how does the heterogeneous and correlated struc-
ture of Lagrangian velocity impact transverse spreading? It is known that transverse spreading
largely controls overall mixing and, as a result, many chemical and biological processes in
natural systems [Bijeljic and Blunt, 2007; Tartakovsky et al., 2008; Willingham et al., 2008;
Tartakovsky, 2010; Rolle et al., 2012]. In this Letter, we study flow and particle transport
through porous rock (Berea sandstone), imaged at the pore scale with X-ray micro-tomography
(micro-CT imaging). We observe strongly non-Fickian spreading behavior in both longitudinal
and transverse directions, and find complementary anomalous behavior: longitudinal spreading
is superdiffusive, while transverse spreading is subdiffusive. We show that the interplay be-
tween pore-scale velocity correlation and velocity heterogeneity is responsible for the observed
anomalous behavior. We then develop an effective stochastic transport model for 3D porous
media that incorporates the microscale velocity structure, in the form of a Continuous Time
Random Walk (CTRW) with one-step correlation.
c©2014 American Geophysical Union. All Rights Reserved.

Fluid flow and particle tracking through Berea sandstone:
We analyze the 3D Lagrangian velocities of a Newtonian fluid flowing through a cubic sample
of Berea sandstone of size L = 1.66 mm on each side. Micro-CT is used to obtain the 3D
image of the porous structure at a resolution of 5.55 µm (the image size is 3003 voxels). Image
segmentation identifies each voxel as either solid or void. The characteristic length of the mean
pore size is λc ≈ 200 µm [Mostaghimi et al., 2012], which is used to define the nondimensional
distance ξx = x/λc (the sample has ∼ 8 characteristic pore lengths in each direction).
To obtain the flow field, we solve the full Navier-Stokes equations through the pore geometry
of the Berea sandstone with no-slip boundary conditions at the grain surfaces, using a finite vol-
ume method [OPENFOAM, 2011; Bijeljic et al., 2013]. We impose constant pressure boundary
conditions at the inlet and outlet faces. The Eulerian velocity field v exhibits a complex struc-
ture, with multiple preferential flow channels and stagnation zones [Fig. 1(a)].
To study the transport properties, we simulate the advection of particles along streamlines
of the stationary 3D flow field. We trace streamlines using a semianalytical formulation to
compute entry and exit positions, and transit times, through each voxel traversed by individual
streamlines [Mostaghimi et al., 2012]. To initialize the streamlines, we place 104 particles at
the inlet face, following a flux-weighted spatial distribution through the pore geometry. To ob-
tain particle trajectories that are long enough to observe macroscopic behavior, we concatenate
particle trajectories randomly within the same class of the flux probability distribution (we have
confirmed that the flux distribution at inlet and outlet faces are virtually identical). To avoid
boundary effects on transverse displacement, we reinject a particle (following the same flux-
weighted protocol) whenever its distance to one of the lateral boundaries is less than 11.1 µm
c©2014 American Geophysical Union. All Rights Reserved.

(2 voxels). We compute the mean Lagrangian velocity across all trajectories, v, and define the
characteristic time to travel the average pore size as τA = λc/v, which is used to rescale time.
The rock sample used for the determination of the underlying flow field is approximately
8 pore lengths on each side. However, solute transport is simulated over many hundreds of
pores by the use of a Lagrangian particle transport method and reinjection of particles. This
is equivalent to studying macroscale transport properties where the medium heterogeneity is
restricted to approximately 83 pores, but a much larger system size. Berea sandstone, the rock
we use in our study, is relatively homogeneous, and this pore structure results in a smooth
flow field. Therefore, we believe that our rock sample of Berea sandstone is representative for
single-phase flow and transport.
In Fig. 1(a) we plot two particle trajectories. The temporal evolution of the Lagrangian ve-
locity and acceleration for a particle exhibits two alternating states: long periods of stagnation,
and bursts of high variability [Fig. 1(d)(e)], both in the longitudinal (x) and transverse (y, z) di-
rections of the flow. This irregular pattern of alternating states is known as intermittency. Flow
intermittency is a well known phenomenon in turbulent flows, where it is quantified by the prop-
erties of the structure functions [Pope, 2000]. Even though the flow in our system is laminar,
our simulations show that geometry of real 3D rock also leads to strongly intermittent behavior.
Similar intermittent behavior in the longitudinal direction has been observed in a 2D porous
medium consisting of a random distribution of disks [de Anna et al., 2013]. In the transverse
direction, particles with high positive velocities jump to high negative velocities—an anticor-
relation that was also observed in the particle transport through simple lattice networks [Kang
et al., 2011].
c©2014 American Geophysical Union. All Rights Reserved.

Non-Fickian spreading and intermittency:
To investigate the impact of the observed intermittent behavior of individual particles on
the macroscopic spreading of the ensemble of particles, we compute the time evolution of the
longitudinal and transverse mean square displacements (MSD) with respect to the center of mass
of a point injection, i.e., initializing every particle’s starting position to an identical reference
point. For the longitudinal direction (x), the MSD is given by σ2x(t) = 〈(x(t) − 〈x(t)〉)2〉
where 〈·〉 denotes the average over all particles. The same definition is applied to the transverse
directions to compute σ2y and σ2
z . At early times, longitudinal MSD exhibits ballistic scaling,
σ2x ∼ t2, characteristic of perfectly correlated stratified flows [Taylor, 1921]. After this initial
period, the MSD follows a non-Fickian superdiffusive scaling σ2x(t) ∼ t1.5. The MSD in the
transverse directions also scales as σ2y, σ
2z ∼ t2 at early times but, in contrast, then slows down to
an asymptotic non-Fickian subdiffusive scaling σ2y, σ
2z ∼ t0.8 (Fig. 2). The non-Fickian scaling
is persistent over 100 characteristic times (τA). Such persistent non-Fickian scaling is partly due
to the infinite Peclet number in our system. As we introduce diffusion, the transition to Fickian
scaling would occur earlier [Berkowitz et al., 2006; Bolster et al., 2014]. Vortices created by
inertia can also lead to anomalous transport [Cardenas, 2008]. In our system, however, the
Reynolds number is in the order of 10−3, and we have confirmed that inertia is not strong
enough to create eddies.
We study the role of the intermittent velocity structure on the observed multi-dimensional
anomalous spreading in real 3D rock. To quantify the intermittent behavior, we compute the
velocity increment probability density function (PDF). The Lagrangian velocity increment as-
sociated to a time lag τ is defined as ∆τv = v(t+ τ)− v(t) where v(t) = [x(t+ τ)− x(t)]/τ .
c©2014 American Geophysical Union. All Rights Reserved.

The velocity increments are rescaled with respect to their standard deviation, ∆τv/σ∆τv. We
find that the velocity increment PDFs in both the longitudinal and transverse directions collapse
(Fig. 2, inset); an indication that intermittent behavior is equally significant in all directions.
This multidimensional intermittency originates from the combined effect of the 3D pore struc-
ture and the divergence-free constraint on the velocity field, which results in a misalignment
between the local velocity and the mean flow direction. The PDF of the velocity increments is
characterized by a sharp peak near zero, and exponential tails. The peak reflects the trapping of
particles in stagnation zones, while the exponential tails indicate that large velocity jumps are
also probable due to the strong heterogeneity in the velocity field—a signature of the observed
intermittency [de Anna et al., 2013; Datta et al., 2013]. The non-Gaussian character of the ve-
locity increment PDF persists at long times (not shown), an indication that pore-scale fluid flow
cannot be modeled using the Langevin description with white noise [Tartakovsky, 2010].
Lagrangian velocity correlation structure and origin of anomalous transport:
Let χv(τ, η) be the velocity autocorrelation between times τ and η,
χv(τ, η) =〈[v(τ)− 〈v(τ)〉][v(η)− 〈v(η)〉]〉
σv(τ)σv(η), (1)
where σ2v(η) is the variance of the Lagrangian velocity at time η. Owing to its definition, the
MSD can be expressed as σ2x(t) = 2
∫ t0dη σv(η)
∫ η0dτ σv(τ)χv(τ, η) [Bear, 1972]. We have
confirmed that the velocity standard deviation σv decays in time much more slowly than the
velocity autocorrelation χv. In this case, the MSD can be approximated as
σ2x(t) ≈ 2
∫ t
0
dη σ2v(η)
∫ η
0
dτ χv(τ, η). (2)
To study the independent roles of velocity heterogeneity and velocity correlation on particle
spreading, we define Ψv(t) =∫ t
0dη σ2
v(η) and Φv(t) =∫ t
0dη∫ η
0dτ χv(τ, η), respectively. We
c©2014 American Geophysical Union. All Rights Reserved.
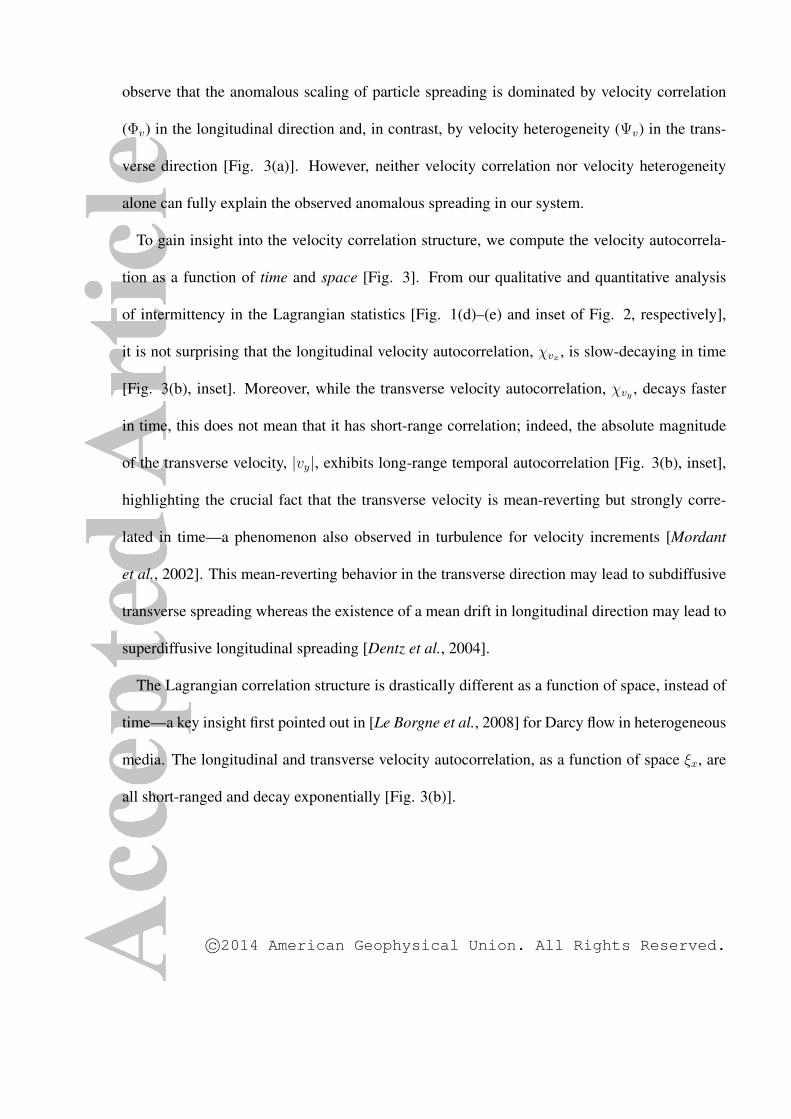
observe that the anomalous scaling of particle spreading is dominated by velocity correlation
(Φv) in the longitudinal direction and, in contrast, by velocity heterogeneity (Ψv) in the trans-
verse direction [Fig. 3(a)]. However, neither velocity correlation nor velocity heterogeneity
alone can fully explain the observed anomalous spreading in our system.
To gain insight into the velocity correlation structure, we compute the velocity autocorrela-
tion as a function of time and space [Fig. 3]. From our qualitative and quantitative analysis
of intermittency in the Lagrangian statistics [Fig. 1(d)–(e) and inset of Fig. 2, respectively],
it is not surprising that the longitudinal velocity autocorrelation, χvx , is slow-decaying in time
[Fig. 3(b), inset]. Moreover, while the transverse velocity autocorrelation, χvy , decays faster
in time, this does not mean that it has short-range correlation; indeed, the absolute magnitude
of the transverse velocity, |vy|, exhibits long-range temporal autocorrelation [Fig. 3(b), inset],
highlighting the crucial fact that the transverse velocity is mean-reverting but strongly corre-
lated in time—a phenomenon also observed in turbulence for velocity increments [Mordant
et al., 2002]. This mean-reverting behavior in the transverse direction may lead to subdiffusive
transverse spreading whereas the existence of a mean drift in longitudinal direction may lead to
superdiffusive longitudinal spreading [Dentz et al., 2004].
The Lagrangian correlation structure is drastically different as a function of space, instead of
time—a key insight first pointed out in [Le Borgne et al., 2008] for Darcy flow in heterogeneous
media. The longitudinal and transverse velocity autocorrelation, as a function of space ξx, are
all short-ranged and decay exponentially [Fig. 3(b)].
c©2014 American Geophysical Union. All Rights Reserved.

Continuous time random walk model:
The exponential decay of autocorrelation is characteristic of Markov processes [Risken,
1989], which suggests that the effective pore scale velocity transitions in space can be cap-
tured by a one-step correlated model in space. We propose a correlated CTRW macroscopic
model [Le Borgne et al., 2008; Tejedor and Metzler, 2010], where the velocity heterogeneity
structure and the one-step velocity correlation are characterized by a velocity transition matrix
derived from the pore scale 3D simulations [Le Borgne et al., 2008; Kang et al., 2011]. The
velocity transition matrix is the only input to our model.
We denote by rm(vζ |v′ζ) the transition probability density to encounter a velocity vζ after
n + m steps given that the particle velocity was v′ζ after n steps (here ζ refers to any of the
space directions, x, y, z). To evaluate the discrete transition probability from the simulated 3D
particle trajectories, we discretize the particle velocity distribution into N = 100 classes with
equiprobable binning, vζ ∈⋃Nj=1(vjζ , v
j+1ζ ), and define the m-step transition probability matrix:
Tm(k|j) =
∫ vk+1ζ
vkζ
dvζ
∫ vj+1ζ
vjζ
dv′ζ rm(vζ |v′ζ)p(v′ζ)/∫ vj+1
ζ
vjζ
dv′ζp(v′ζ), (3)
where p(v′ζ) is the univariate velocity distribution. The one-step velocity transition matrix
(T1), in longitudinal and transverse directions, is shown in Fig. 4. For the longitudinal direction,
the high probabilities along the diagonal of T1 reflect the strong persistence in the magnitude
of longitudinal velocity. For the transverse direction, this effect is also present, but in addition
we observe high probability values along the opposite diagonal, as a result of the transverse
velocity anticorrelation due to local flow reversal [Fig. 1(d)].
Average particle motion can be described by the following system of Langevin equations:
ζn+1 = ζn + ∆ζvζ(n∆ζ)
|vζ(n∆ζ)|, tn+1 = tn +
∆ζ
|vζ(n∆ζ)|, (4)
c©2014 American Geophysical Union. All Rights Reserved.

where |vζ | denotes the absolute value of vζ , and ζ = x, y, z. We have directionality information
in vζ(n∆ζ)
|vζ(n∆ζ)| . When vζ(n∆ζ)
|vζ(n∆ζ)| is +1, particles jump forward (+∆ζ), and when vζ(n∆ζ)
|vζ(n∆ζ)| is−1, parti-
cles jump backward (−∆ζ). CTRW simulations are performed independently in each direction
with their respective transition matrix, and we choose ∆x = λc/4, ∆y = λc/8 and ∆z = λc/8,
based on the characteristic correlation length of the exponential decay of the spatial velocity
autocorrelation [Fig. 3(a)]. Note that ∆ζ is a physical correlation length scale, which enables
capturing the intermittent velocity structure with one-step velocity correlation information. We
assume that the sequence of Lagrangian velocities {vζ(n∆ζ)}∞n=0 can be approximated by a
Markov process: initial particle velocities are chosen randomly from the initial velocity distri-
bution, and each new velocity at the next time step (n + 1) is determined from the velocity at
the current time step (n) and the one-step transition matrix T1 (Fig. 4) [Le Borgne et al., 2008;
Kang et al., 2011].
The proposed correlated CTRW model accurately predicts the plume evolution in all space
directions, as evidenced by the longitudinal and the transverse projections of particle density at
fixed times (Fig. 5) and by the MSDs in both longitudinal and transverse directions (Fig. 2).
The model captures nicely the early ballistic regime, the late time scaling, and the transition
time, without any fitting parameters. Since the transition matrix is the only input to our model,
which is measured directly from the pore-scale information obtained by solving the full Navier-
Stokes equations, this validates the proposed CTRW framework. Taken together, our findings
point to the critical role of velocity intermittency at the pore scale on particle spreading and,
consequently, on mixing and reactive transport processes in porous media flows.
c©2014 American Geophysical Union. All Rights Reserved.

References
Bear, J., Dynamics of Fluids in Porous Media, Elsevier, New York, 1972.
Benson, D. A., R. Schumer, M. M. Meerschaert, and S. W. Wheatcraft, Fractional dispersion,
Levy motion, and the MADE tracer tests, Transp. Porous Media, 42, 211–240, 2001.
Berkowitz, B., A. Cortis, M. Dentz, and H. Scher, Modeling non-Fickian transport in geological
formations as a continuous time random walk, Rev. Geophys., 44(2), RG2003, 2006.
Bijeljic, B., and M. J. Blunt, Pore-scale modeling and continuous time random walk analysis of
dispersion in porous media, Water Resour. Res., 42, W01,202, 2006.
Bijeljic, B., and M. J. Blunt, Pore-scale modeling of transverse dispersion in porous media,
Water Resour. Res., 43, W12S11, 2007.
Bijeljic, B., P. Mostaghimi, and M. J. Blunt, Signature of non-Fickian solute transport in com-
plex heterogeneous porous media, Phys. Rev. Lett., 107, 204,502, 2011.
Bijeljic, B., A. Raeini, P. Mostaghimi, and M. J. Blunt, Predictions of non-Fickian solute trans-
port in different classes of porous media using direct simulation on pore-scale images, Phys.
Rev. E, 87, 013,011, 2013.
Bolster, D., Y. Meheust, T. Le Borgne, J. Bouquain, and P. Davy, Modeling preasymptotic
transport in flows with significant inertial and trapping effects - The importance of velocity
correlations and a spatial Markov model, Adv. Water Resour., 70, 89–103, 2014.
Cardenas, M. B., Three-dimensional vortices in single pores and their effects on transport, Geo-
phys. Res. Lett., 35, L18,402, 2008.
Cortis, A., and B. Berkowitz, Anomalous transport in “classical” soil and sand columns, Soil
Sci. Soc. Am. J., pp. 1539–1548, 2004.
c©2014 American Geophysical Union. All Rights Reserved.

Datta, S. S., H. Chiang, T. S. Ramakrishnan, and D. A. Weitz, Spatial fluctuations of fluid
velocities in flow through a three-dimensional porous medium, Phys. Rev. Lett., 111, 064,501,
2013.
de Anna, P., T. Le Borgne, M. Dentz, A. M. Tartakovsky, D. Bolster, and P. Davy, Flow inter-
mittency, dispersion, and correlated continuous time random walks in porous media, Phys.
Rev. Lett., 110, 184,502, 2013.
Dentz, M., and B. Berkowitz, Transport behavior of a passive solute in continuous time random
walks and multirate mass transfer, Water Resour. Res., 39, 1111, 2003.
Dentz, M., and D. Bolster, Distribution- versus correlation-induced anomalous transport in
quenched random velocity fields, Phys. Rev. Lett., 105, 244,301, 2010.
Dentz, M., A. Cortis, H. Scher, and B. Berkowitz, Time behavior of solute transport in het-
erogeneous media: transition from anomalous to normal transport, Adv. Water Resour., 27,
155–173, 2004.
Edery, Y., A. Guadagnini, H. Scher, and B. Berkowitz, Origins of anomalous transport in het-
erogeneous media: Structural and dynamic controls, Water Resour. Res., 50(2), 1490–1505,
2014.
Elliott, M. A., C. E. Stauber, F. Koksal, F. A. DiGiano, and M. D. Sobsey, Reductions of E. coli,
echovirus type 12 and bacteriophages in an intermittently operated household-scale slow sand
filter, Water Res., 42(10), 2662–2670, 2008.
Garabedian, S. P., D. R. LeBlanc, L. W. Gelhar, and M. A. Celia, Large-scale natural gradient
tracer test in sand and gravel, Cape Cod, Massachusetts 2. Analysis of spatial moments for a
nonreactive tracer, Water Resour. Res., 27(5), 911–924, 1991.
c©2014 American Geophysical Union. All Rights Reserved.

Gleeson, T., Y. Wada, M. F. P. Bierkens, and L. P. H. van Beek, Water balance of global aquifers
revealed by groundwater footprint, Nature, 488(7410), 197–200, 2012.
Haggerty, R., and S. M. Gorelick, Multiple-rate mass transfer for modeling diffusion and surface
reactions in media with pore-scale heterogeneity, Water Resour. Res., 31(10), 2383–2400,
1995.
Harvey, C. F., et al., Arsenic mobility and groundwater extraction in bangladesh, Science,
298(5598), 1602–1606, 2002.
IPCC, Special Report on Carbon Dioxide Capture and Storage, B. Metz et al. (eds.), Cambridge
University Press, 2005.
Kandhai, D., D. Hlushkou, A. G. Hoekstra, P. M. A. Sloot, H. V. As, and U. Tallarek, Influence
of stagnant zones on transient and asymptotic dispersion in macroscopically homogeneous
porous media, Phys. Rev. Lett., 88, 234,501, 2002.
Kang, P. K., M. Dentz, T. Le Borgne, and R. Juanes, Spatial markov model of anomalous
transport through random lattice networks, Phys. Rev. Lett., 107, 180,602, 2011.
Le Borgne, T., and P. Gouze, Non-Fickian dispersion in porous media: 2. Model validation from
measurements at different scales, Water Resour. Res., 44, W06,427, 2007.
Le Borgne, T., M. Dentz, and J. Carrera, Lagrangian statistical model for transport in highly
heterogeneous velocity fields, Phys. Rev. Lett., 101, 090,601, 2008.
Mordant, N., J. Delour, E. Leveque, A. Arneodo, and J.-F. Pinton, Long time correlations in
Lagrangian dynamics: a key to intermittency in turbulence, Phys. Rev. Lett., 89(25), 254,502,
2002.
c©2014 American Geophysical Union. All Rights Reserved.

Moroni, M., N. Kleinfelter, and J. H. Cushman, Analysis of dispersion in porous media via
matched-index particle tracking velocimetry experiments, Adv. Water Resour., 30(1), 1–15,
2007.
Mostaghimi, P., B. Bijeljic, and M. J. Blunt, Simulation of flow and dispersion on pore-space
images, SPE J., 17, 1131, 2012.
OPENFOAM, The open source CFD toolbox, http://www.openfoam.com, 2011.
Orr, F. M., Jr., and J. J. Taber, Use of carbon dioxide in enhanced oil recovery, Science, 224,
563–569, 1984.
Pope, S. B., Turbulent Flows, 8th ed., Cambridge university Press, 2000.
Risken, H., The Fokker–Planck Equation, second ed., Springer, Berlin, 1989.
Rolle, M., D. Hochstetler, G. Chiogna, P. K. Kitanidis, and P. Grathwohl, Experimental investi-
gation and pore-scale modeling interpretation of compound-specific transverse dispersion in
porous media, Transp. Porous Media, 93(3), 347–362, 2012.
Scheven, U. M., D. Verganelakis, R. Harris, M. L. Johns, and L. F. Gladden, Quantitative nuclear
magnetic resonance measurements of preasymptotic dispersion in flow through porous media,
Phys. Fluids, 17, 117,107, 2005.
Szulczewski, M. L., C. W. MacMinn, H. J. Herzog, and R. Juanes, Lifetime of carbon capture
and storage as a climate-change mitigation technology, Proc. Natl. Acad. Sci. USA, 109(14),
5185–5189, 2012.
Tartakovsky, A. M., Langevin model for reactive transport in porous media, Phys. Rev. E, 82,
026,302, 2010.
c©2014 American Geophysical Union. All Rights Reserved.

Tartakovsky, A. M., G. Redden, P. C. Lichtner, T. D. Scheibe, and P. Meakin, Mixing-induced
precipitation: Experimental study and multiscale numerical analysis, Water Resour. Res.,
44(6), W06S04, 2008.
Taylor, G. I., Diffusion by continuous movements, Proc. London Math. Soc., 20, 196–211, 1921.
Tejedor, V., and R. Metzler, Anomalous diffusion in correlated continuous time random walks,
J. Phys. A: Math. Theor., 43(8), 082,002, 2010.
Willingham, T. W., C. J. Werth, and A. J. Valocchi, Evaluation of the effects of porous media
structure on mixing-controlled reactions using pore-scale modeling and micromodel experi-
ments, Environ. Sci. Technol., 42, 3185, 2008.
Yoshida, N., and Y. Takahashi, Land-surface contamination by radionuclides from the
Fukushima Daiichi Nuclear Power Plant accident, Elements, 8(3), 201–206, 2012.
c©2014 American Geophysical Union. All Rights Reserved.

(a) (b)
(c)
0
3
velo
city
0 50 100 150 200−3
0
3
acce
lera
tion
(d)
(e)
x directiony direction−3
time, t / τA
0
0.2
0.4
0.6
0.8
1
Figure 1. (a) Three-dimensional Eulerian velocity magnitude (|v|) through a Berea sandstone sample
of size 1.66 mm (approximately 8 pore lengths) on each side. The velocity magnitude is normalized
with respect to the maximum velocity, as indicated by the color bar; blue and cyan solid lines indicate
two particle trajectories. The domain is discretized into 3003 voxels with resolution 5.55 µm (approxi-
mately 0.03 pore lengths). (b) Cross section of the Berea sandstone at rescaled distance ξx = xλc
= 4.16,
showing the pore space (white) and solid grains (black). The average porosity (fraction of void space in
the sample) is approximately 18.25%. (c) Cross section of the velocity magnitude at rescaled distance
ξx = 4.16 (warm colors correspond to higher velocities), illustrating the presence of preferential flow
paths. (d) and (e) Time series of the normalized Lagrangian velocity and acceleration, respectively, for
the blue particle trajectory in (a). The Lagrangian statistics exhibit strongly intermittent behavior in
both longitudinal and transverse directions.
c©2014 American Geophysical Union. All Rights Reserved.

10−1 100 101 10210−3
10−2
10−1
100
101
102
spat
ial v
aria
nce
1.5
1
2
1
1
0.8
3D simulationCTRW model
x-direction
y-direction
z-direction
time, t/ τA
∆ v/ σ∆ v τ
prob
abilit
y de
nsity
∆ vx
∆ vy
∆ vz
−10 −5 0 5 1010
−4
10−3
10−2
10−1
100
Figure 2. Time evolution of the centered second spatial moments from particle-tracking simulation
(solid line) and the prediction with correlated CTRW (dashed line). In the x-direction, particle disper-
sion is superdiffusive with slope ∼ 1.5, and in the y and z directions, dispersion is subdiffusive with
slope ∼ 0.8. Inset: Probability density distributions of the normalized Lagrangian velocity increments
in x, y and z directions, for a time lag τ = τA/4. Velocity increments are normalized with respect to
their standard deviation σ∆vτ .
c©2014 American Geophysical Union. All Rights Reserved.

0 0.5 1 1.5 2 2.5 3 3.5 4
10−1
100
velo
city
cor
rela
tion
vx
vyvy
velo
city
cor
rela
tion
10−1 100 10110−2
10−1
100 1
0.4
time, t / τA
ξx
(a) (b)
102
10−1 100 101 10210−3
10−2
10−1
100
101
102
time
spat
ial v
aria
nce
10−1
100
101
10210
−3
10−1
101
σ2x ( t)
Φv ( t)
eq (2)
Ψv ( t)
σ2y ( t)
Figure 3. (a) Time evolution of the centered second spatial moments in the longitudinal direction
from particle tracking simulation (red solid line), approximation from Eq. (2) (black dashed line), and
estimations from velocity heterogeneity alone (Ψv(t), orange dashed line) and velocity correlation alone
(Φv(t), green dashed line). The orange and green lines are shifted along the y axis for clarity. Inset:
Time evolution of the centered second spatial moments in the transverse direction. (b) Longitudinal
(x, red) and transverse (y, blue) Lagrangian velocity autocorrelation as a function of space along the
longitudinal direction. All functions are short-ranged. Inset: Longitudinal (red) and transverse (blue)
Lagrangian velocity autocorrelation as a function of time. Note the strong, long range, correlation of
the longitudinal velocity vx and the absolute value of the transverse velocity, |vy|.
c©2014 American Geophysical Union. All Rights Reserved.

−7
−6
−5
−4
−3
−2
0 100
100
−9
−7
−5
−3
−1
−6
−5
−4
−3
−7
−5
−3
−1
−9
−7
−5
−3
−1
−6
−5
−4
−3
−2
(a) (b) (c)
(d) (e) (f )
dx = λ cdx = λ c/ 4dx = λ c/ 40
dy = λ c/ 8dy = λ c/ 40 λ c/ 2dy =
0
50
50
-50 50
50
-50
0
0
Figure 4. (a,b,c) Longitudinal (x) transition matrix with N = 100 velocity classes for different
values of the space transition ∆x/λc. The velocity correlation decreases as the sampling distance ∆x
increases. (d,e,f) Transverse (y) transition matrix with N = 100 velocity classes for different ∆y
values. We assign 50 bins for positive velocity and another 50 for negative velocity. The z-directional
transition matrix is almost identical to y-directional transition matrix.
c©2014 American Geophysical Union. All Rights Reserved.

0 2 4 6 8 100
0.2
0.4
0.6
0.8
1
x
prob
abilit
y de
nsity
−4 −2 0 2 40
0.5
1
1.5
y
prob
abilit
y de
nsity
simulationmodel
t = τA
t = 5 τA
t = 10 τA
t = 2 τA
t = 10 τA
Figure 5. Longitudinal projection of the particle density distribution at fixed times (t = τA, 5τA
and 10τA) from direct pore-scale simulation (solid line), and the correlated CTRW model prediction
(dashed line). Inset: Transverse projection of the particle density distribution at fixed times (t = 2τA
and 10τA) from direct simulation (solid line) and the respective CTRW model prediction (dashed line).
Different colors indicate different times.
c©2014 American Geophysical Union. All Rights Reserved.


