Embed Size (px)
Citation preview
EMBARGOED UNTIL RELEASE AT 8:30 A.M. EST, FRIDAY, DECEMBER 20, 2019 BEA 19-69
Technical: Lisa Mataloni (GDP) (301) 278-9083 [email protected] Kate Pinard (Corporate Profits) (301) 278-9417 [email protected]
Media: Jeannine Aversa (301) 278-9003 [email protected]
Gross Domestic Product, Third Quarter 2019 (Third Estimate) Corporate Profits, Third Quarter 2019 (Revised)
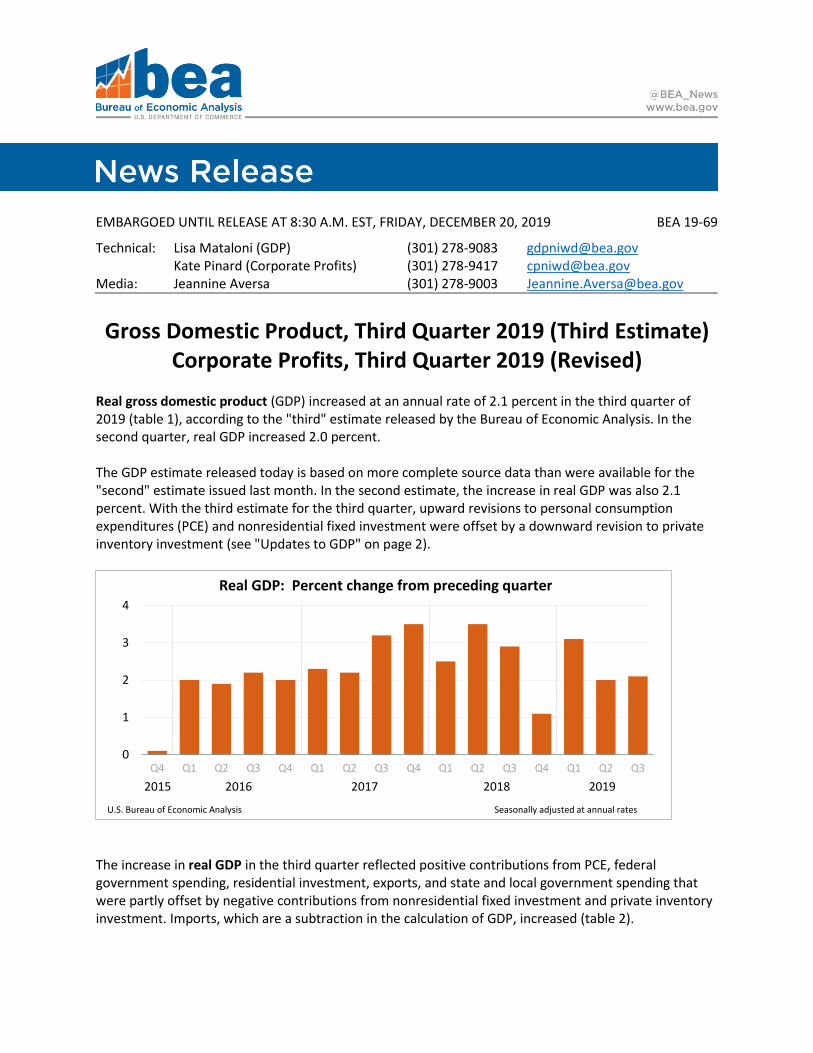
Real gross domestic product (GDP) increased at an annual rate of 2.1 percent in the third quarter of 2019 (table 1), according to the "third" estimate released by the Bureau of Economic Analysis. In the second quarter, real GDP increased 2.0 percent.
The GDP estimate released today is based on more complete source data than were available for the "second" estimate issued last month. In the second estimate, the increase in real GDP was also 2.1 percent. With the third estimate for the third quarter, upward revisions to personal consumption expenditures (PCE) and nonresidential fixed investment were offset by a downward revision to private inventory investment (see "Updates to GDP" on page 2).
The increase in real GDP in the third quarter reflected positive contributions from PCE, federal government spending, residential investment, exports, and state and local government spending that were partly offset by negative contributions from nonresidential fixed investment and private inventory investment. Imports, which are a subtraction in the calculation of GDP, increased (table 2).
0
1
2
3
4
Q4 Q1 Q2 Q3 Q4 Q1 Q2 Q3 Q4 Q1 Q2 Q3 Q4 Q1 Q2 Q3
U.S. Bureau of Economic Analysis Seasonally adjusted at annual rates
2015 2016 2017 2018 2019
Real GDP: Percent change from preceding quarter

The acceleration in real GDP in the third quarter reflected a smaller decrease in private inventory investment and upturns in exports and residential fixed investment that were partly offset by decelerations in PCE, federal government spending, and state and local government spending, and a larger decrease in nonresidential fixed investment. Real gross domestic income (GDI) increased 2.1 percent in the third quarter, compared with an increase of 0.9 percent in the second quarter. The average of real GDP and real GDI, a supplemental measure of U.S. economic activity that equally weights GDP and GDI, increased 2.1 percent in the third quarter, compared with an increase of 1.4 percent in the second quarter (table 1). Current-dollar GDP increased 3.8 percent, or $202.3 billion, in the third quarter to a level of $21.54 trillion. In the second quarter, GDP increased 4.7 percent, or $241.4 billion (tables 1 and 3). The price index for gross domestic purchases increased 1.4 percent in the third quarter, compared with an increase of 2.2 percent in the second quarter (table 4). The PCE price index increased 1.5 percent, compared with an increase of 2.4 percent. Excluding food and energy prices, the PCE price index increased 2.1 percent, compared with an increase of 1.9 percent.
Updates to GDP The percent change in real GDP in the third quarter was unrevised. Upward revisions to PCE and nonresidential fixed investment were offset by a downward revision to private inventory investment. For more information, see the Technical Note. A detailed "Key Source Data and Assumptions" file (available at 10:00 A.M. today) is also posted for each release. For information on updates to GDP, see the "Additional Information" section that follows.
Advance Estimate Second Estimate Third Estimate
(Percent change from preceding quarter)
Real GDP 1.9 2.1 2.1
Current-dollar GDP 3.5 3.8 3.8
Real GDI … 2.4 2.1
Average of Real GDP and Real GDI … 2.3 2.1
Gross domestic purchases price index 1.4 1.4 1.4
PCE price index 1.5 1.5 1.5
PCE price index excluding food and energy 2.2 2.1 2.1
- 2 -

Corporate Profits Profits from current production (corporate profits with inventory valuation and capital consumption adjustments) decreased $4.7 billion in the third quarter, in contrast to an increase of $75.8 billion in the second quarter (table 10). Profits of domestic financial corporations decreased $4.7 billion in the third quarter, in contrast to an increase of $2.5 billion in the second quarter. Profits of domestic nonfinancial corporations decreased $5.5 billion, in contrast to an increase of $34.7 billion. Rest-of-the-world profits increased $5.5 billion, compared with an increase of $38.7 billion. In the third quarter, receipts decreased $10.0 billion, and payments decreased $15.5 billion.
* * *
Next release: January 30, 2020 at 8:30 A.M. EST Gross Domestic Product, Fourth Quarter and Year 2019 (Advance Estimate)
* * *
- 3 -
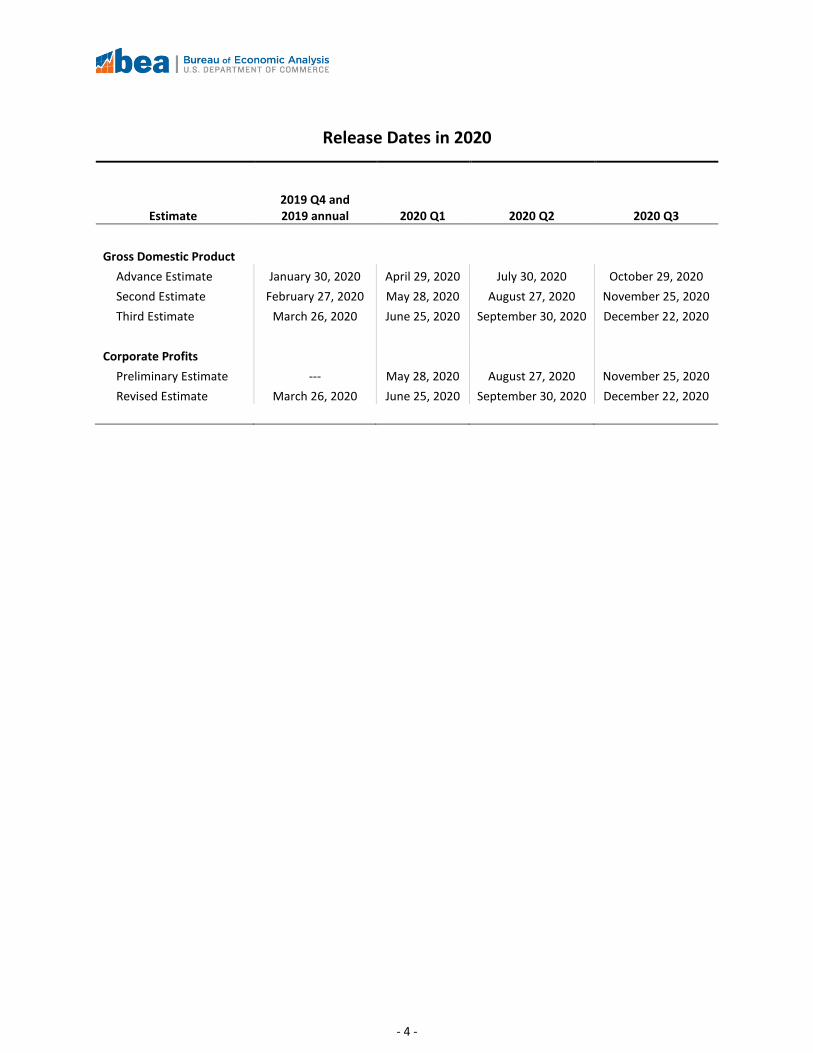
Release Dates in 2020
Estimate 2019 Q4 and 2019 annual 2020 Q1 2020 Q2 2020 Q3
Gross Domestic Product
Advance Estimate January 30, 2020 April 29, 2020 July 30, 2020 October 29, 2020
Second Estimate February 27, 2020 May 28, 2020 August 27, 2020 November 25, 2020
Third Estimate March 26, 2020 June 25, 2020 September 30, 2020 December 22, 2020
Corporate Profits
Preliminary Estimate --- May 28, 2020 August 27, 2020 November 25, 2020
Revised Estimate March 26, 2020 June 25, 2020 September 30, 2020 December 22, 2020
- 4 -
Additional Information Resources Additional resources available at www.bea.gov:
• Stay informed about BEA developments by reading the BEA blog, signing up for BEA’s email subscription service, or following BEA on Twitter @BEA_News.
• Historical time series for these estimates can be accessed in BEA’s interactive data application.
• Access BEA data by registering for BEA’s data application programming interface (API).
• For more on BEA’s statistics, see our monthly online journal, the Survey of Current Business.
• BEA's news release schedule
• NIPA Handbook: Concepts and Methods of the U.S. National Income and Product Accounts
Definitions Gross domestic product (GDP) is the value of the goods and services produced by the nation’s economy less the value of the goods and services used up in production. GDP is also equal to the sum of personal consumption expenditures, gross private domestic investment, net exports of goods and services, and government consumption expenditures and gross investment. Gross domestic income (GDI) is the sum of incomes earned and costs incurred in the production of GDP. In national economic accounting, GDP and GDI are conceptually equal. In practice, GDP and GDI differ because they are constructed using largely independent source data. Current-dollar estimates are valued in the prices of the period when the transactions occurred—that is, at "market value." Also referred to as "nominal estimates" or as "current-price estimates." Real values are inflation-adjusted estimates—that is, estimates that exclude the effects of price changes. The gross domestic purchases price index measures the prices of final goods and services purchased by U.S. residents. The personal consumption expenditure price index measures the prices paid for the goods and services purchased by, or on the behalf of, "persons." Personal income is the income received by, or on behalf of, all persons from all sources: from participation as laborers
in production, from owning a home or business, from the ownership of financial assets, and from government and business in the form of transfers. It includes income from domestic sources as well as the rest of world. It does not include realized or unrealized capital gains or losses. Disposable personal income is the income available to persons for spending or saving. It is equal to personal income less personal current taxes. Personal outlays is the sum of personal consumption expenditures, personal interest payments, and personal current transfer payments. Personal saving is personal income less personal outlays and personal current taxes. The personal saving rate is personal saving as a percentage of disposable personal income. Profits from current production, referred to as corporate profits with inventory valuation adjustment (IVA) and capital consumption (CCAdj) adjustment in the National Income and Product Accounts (NIPAs), is a measure of the net income of corporations before deducting income taxes that is consistent with the value of goods and services measured in GDP. The IVA and CCAdj are adjustments that convert inventory withdrawals and depreciation of fixed assets reported on a tax-return, historical-cost basis to the current-cost economic measures used in the national income and product accounts. Profits for domestic industries reflect profits for all corporations located within the geographic borders of the United States. The rest-of-the-world (ROW) component of profits is measured as the difference between profits received from ROW and profits paid to ROW. For more definitions, see the Glossary: National Income and Product Accounts.
Statistical conventions Annual-vs-quarterly rates. Quarterly seasonally adjusted values are expressed at annual rates, unless otherwise specified. This convention is used for BEA’s featured, seasonally adjusted measures to facilitate comparisons with related and historical data. For details, see the FAQ “Why does BEA publish estimates at annual rates?” Quarterly not seasonally adjusted values are expressed only at quarterly rates.
- 5 -
Percent changes. Percent changes in quarterly seasonally adjusted series are displayed at annual rates, unless otherwise specified. For details, see the FAQ “How is average annual growth calculated?” Percent changes in quarterly not seasonally adjusted values are calculated from the same quarter one year ago. All published percent changes are calculated from unrounded data. Calendar years and quarters. Unless noted otherwise, annual and quarterly data are presented on a calendar basis. Quantities and prices. Quantities, or "real" volume measures, and prices are expressed as index numbers with a specified reference year equal to 100 (currently 2012). Quantity and price indexes are calculated using a Fisher-chained weighted formula that incorporates weights from two adjacent periods (quarters for quarterly data and annuals for annual data). For details on the calculation of quantity and price indexes, see Chapter 4: Estimating Methods in the NIPA Handbook. Chained-dollar values are calculated by multiplying the quantity index by the current dollar value in the reference year (2012) and then dividing by 100. Percent changes calculated from real quantity indexes and chained-dollar levels are conceptually the same; any differences are due to rounding. Chained-dollar values are not additive because the relative weights for a given period differ from those of the reference year. In tables that display chained-dollar values, a "residual" line shows the difference between the sum of detailed chained-dollar series and its corresponding aggregate.
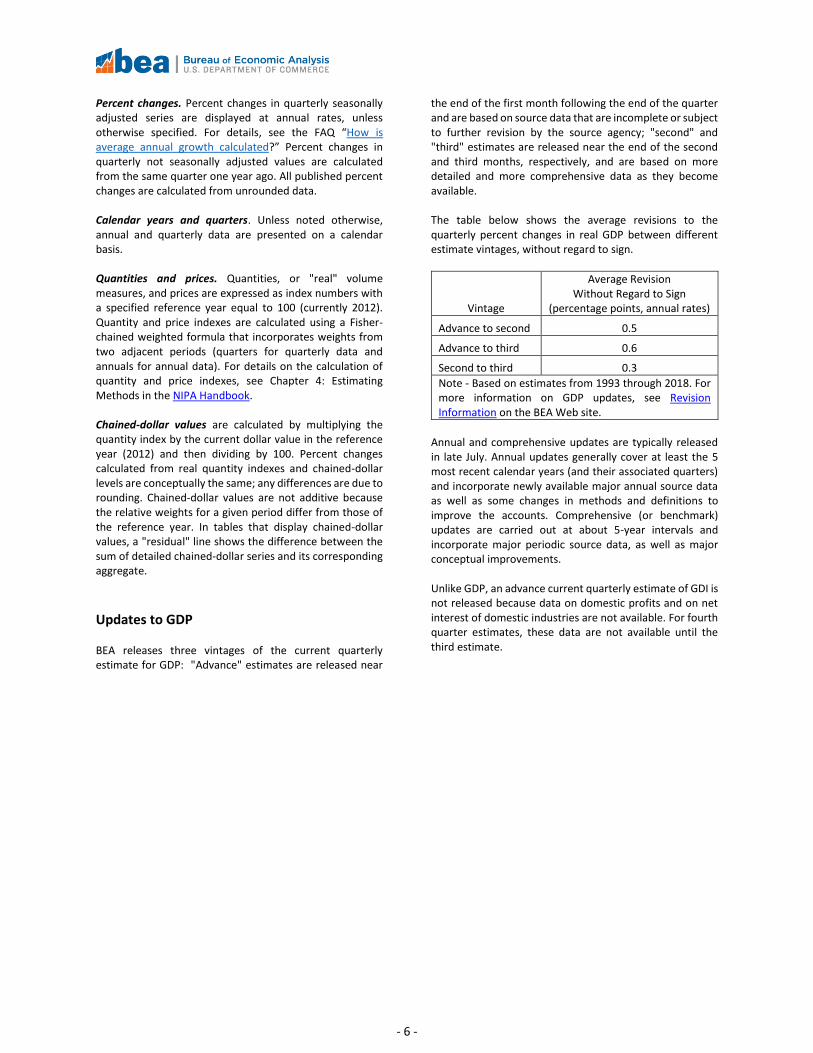
Updates to GDP BEA releases three vintages of the current quarterly estimate for GDP: "Advance" estimates are released near
the end of the first month following the end of the quarter and are based on source data that are incomplete or subject to further revision by the source agency; "second" and "third" estimates are released near the end of the second and third months, respectively, and are based on more detailed and more comprehensive data as they become available. The table below shows the average revisions to the quarterly percent changes in real GDP between different estimate vintages, without regard to sign.
Vintage
Average Revision Without Regard to Sign
(percentage points, annual rates)
Advance to second 0.5
Advance to third 0.6
Second to third 0.3
Note - Based on estimates from 1993 through 2018. For more information on GDP updates, see Revision Information on the BEA Web site.
Annual and comprehensive updates are typically released in late July. Annual updates generally cover at least the 5 most recent calendar years (and their associated quarters) and incorporate newly available major annual source data as well as some changes in methods and definitions to improve the accounts. Comprehensive (or benchmark) updates are carried out at about 5-year intervals and incorporate major periodic source data, as well as major conceptual improvements. Unlike GDP, an advance current quarterly estimate of GDI is not released because data on domestic profits and on net interest of domestic industries are not available. For fourth quarter estimates, these data are not available until the third estimate.
- 6 -
List of GDP News Release Tables Table 1. Real Gross Domestic Product and Related Measures: Percent Change from Preceding Period Table 2. Contributions to Percent Change in Real Gross Domestic Product Table 3. Gross Domestic Product: Level and Change from Preceding Period Table 4. Price Indexes for Gross Domestic Product and Related Measures: Percent Change from Preceding Period Table 5. Real Gross Domestic Product: Annual Percent Change Table 6. Real Gross Domestic Product: Percent Change from Quarter One Year Ago Table 7. Relation of Gross Domestic Product, Gross National Product, and National Income Table 8. Personal Income and Its Disposition Table 9. Corporate Profits: Level and Percent Change Table 10. Corporate Profits by Industry: Level and Change from Preceding Period Table 11. Gross Value Added of Nonfinancial Domestic Corporate Business Appendix Table A. Real Gross Domestic Product and Related Aggregates: Percent Change From Preceding Period and
Contributions to Percent Change Appendix Table B. Not Seasonally Adjusted Real Gross Domestic Product: Level and Percent Change From Quarter One Year
Ago
- 7 -

2015
Q4 Q1 Q2 Q3 Q4 Q1 Q2 Q3 Q4 Q1 Q2 Q3 Q4 Q1 Q2 Q3 r
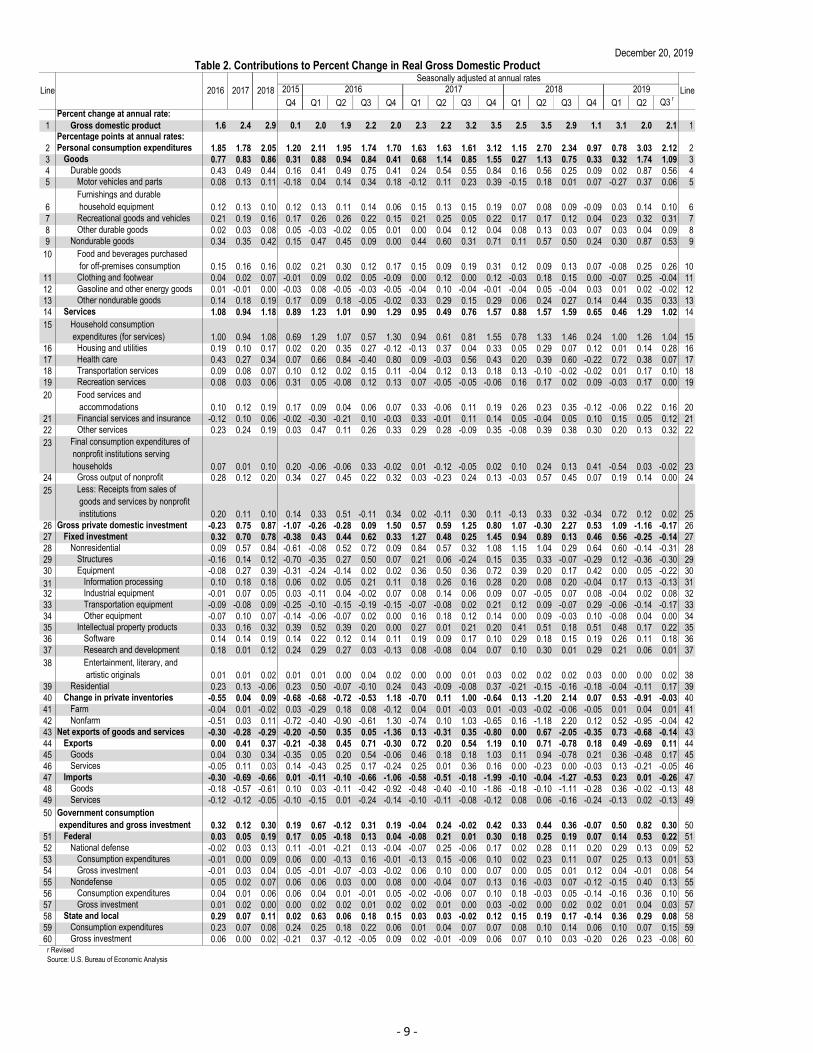
1 Gross domestic product (GDP) 1.6 2.4 2.9 0.1 2.0 1.9 2.2 2.0 2.3 2.2 3.2 3.5 2.5 3.5 2.9 1.1 3.1 2.0 2.1 12 Personal consumption expenditures 2.7 2.6 3.0 1.8 3.2 2.9 2.6 2.5 2.4 2.4 2.4 4.6 1.7 4.0 3.5 1.4 1.1 4.6 3.2 23 Goods 3.6 3.9 4.1 1.5 4.2 4.5 4.0 1.9 3.2 5.5 4.1 7.5 1.3 5.4 3.6 1.6 1.5 8.6 5.3 34 Durable goods 6.1 6.9 6.3 2.3 5.8 7.0 10.8 5.8 3.4 7.7 7.8 12.2 2.3 8.0 3.6 1.3 0.3 13.0 8.1 45 Nondurable goods 2.4 2.5 3.0 1.1 3.4 3.2 0.6 0.0 3.1 4.3 2.2 5.1 0.7 4.1 3.6 1.7 2.2 6.5 3.9 56 Services 2.3 2.0 2.5 2.0 2.7 2.2 1.9 2.8 2.0 1.0 1.6 3.4 1.9 3.4 3.4 1.4 1.0 2.8 2.2 67 Gross private domestic investment -1.3 4.4 5.1 -6.0 -1.6 -1.7 0.5 9.3 3.4 3.6 7.4 4.7 6.2 -1.8 13.7 3.0 6.2 -6.3 -1.0 78 Fixed investment 1.9 4.2 4.6 -2.2 2.6 2.7 3.8 2.0 7.7 2.8 1.4 8.7 5.5 5.2 0.7 2.7 3.2 -1.4 -0.8 89 Nonresidential 0.7 4.4 6.4 -4.4 -0.6 4.0 5.6 0.7 6.6 4.4 2.4 8.4 8.8 7.9 2.1 4.8 4.4 -1.0 -2.3 910 Structures -5.0 4.7 4.1 -20.5 -11.4 10.0 18.4 2.4 7.3 2.0 -7.7 5.2 12.1 11.0 -2.1 -9.0 4.0 -11.1 -9.9 1011 Equipment -1.3 4.7 6.8 -4.8 -3.9 -2.3 0.3 0.4 6.3 8.9 6.2 12.9 6.6 3.4 2.9 7.4 -0.1 0.8 -3.8 1112 Intellectual property products 7.9 3.7 7.4 9.8 12.9 9.3 4.7 0.0 6.3 0.3 4.9 4.7 9.7 11.9 4.1 11.7 10.8 3.6 4.7 1213 Residential 6.5 3.5 -1.5 6.6 14.7 -2.0 -2.6 6.4 11.9 -2.2 -2.0 9.9 -5.3 -3.7 -4.0 -4.7 -1.0 -3.0 4.6 1314 Change in private inventories ......... ......... ......... ......... ......... ......... ......... ......... ......... ......... ......... ......... ......... ......... ......... ......... ......... ......... ......... 1415 Net exports of goods and services ......... ......... ......... ......... ......... ......... ......... ......... ......... ......... ......... ......... ......... ......... ......... ......... ......... ......... ......... 1516 Exports 0.0 3.5 3.0 -1.6 -3.0 4.0 6.1 -2.5 6.1 1.6 4.4 10.1 0.8 5.8 -6.2 1.5 4.1 -5.7 1.0 1617 Goods 0.6 3.9 4.3 -4.1 0.9 2.7 7.2 -0.8 5.9 2.2 2.2 13.6 1.2 12.0 -9.1 2.6 4.6 -5.9 2.1 1718 Services -1.1 2.7 0.7 3.4 -10.0 6.2 4.1 -5.7 6.3 0.4 8.8 3.8 -0.1 -5.3 -0.1 -0.7 3.3 -5.1 -1.3 1819 Imports 2.0 4.7 4.4 0.0 0.9 0.8 4.7 7.5 4.1 3.5 1.3 14.0 0.6 0.3 8.6 3.5 -1.5 0.0 1.8 1920 Goods 1.5 4.8 5.0 -0.8 -0.1 1.1 3.7 8.1 4.1 3.4 0.9 16.4 1.4 0.8 9.2 2.3 -2.8 0.1 1.1 2021 Services 4.4 4.4 1.6 3.5 5.4 -0.4 9.1 5.2 3.8 4.0 2.8 4.5 -2.8 -2.0 6.1 8.9 4.5 -0.7 4.8 2122 Government consumption
expenditures and gross investment 1.8 0.7 1.7 1.1 3.8 -0.7 1.7 1.1 -0.2 1.4 -0.1 2.4 1.9 2.6 2.1 -0.4 2.9 4.8 1.7 2223 Federal 0.4 0.8 2.9 2.5 0.7 -2.7 2.0 0.6 -1.2 3.3 0.1 4.6 2.8 3.9 2.9 1.1 2.2 8.3 3.3 2324 National defense -0.6 0.7 3.3 2.8 -0.4 -5.2 3.4 -1.0 -1.9 6.8 -1.6 4.5 0.6 7.5 3.0 5.2 7.7 3.3 2.2 2425 Nondefense 2.0 0.8 2.4 2.1 2.2 1.0 -0.1 2.8 -0.2 -1.6 2.6 4.8 6.0 -1.0 2.8 -4.5 -5.4 16.1 5.0 2526 State and local 2.6 0.6 1.0 0.2 5.8 0.5 1.6 1.4 0.3 0.3 -0.2 1.1 1.4 1.8 1.6 -1.2 3.3 2.7 0.7 26
Addenda:27 Gross domestic income (GDI) 1 0.8 2.1 2.5 0.7 2.1 -1.7 2.0 1.4 3.8 2.6 0.8 2.7 4.7 0.7 3.3 0.8 3.2 0.9 2.1 2728 Average of GDP and GDI 1.2 2.2 2.7 0.4 2.1 0.1 2.1 1.7 3.1 2.4 2.0 3.1 3.6 2.1 3.1 0.9 3.2 1.4 2.1 2829 Final sales of domestic product 2.2 2.3 2.8 0.8 2.8 2.7 2.7 0.8 3.0 2.0 2.2 4.2 2.4 4.8 0.8 1.0 2.6 3.0 2.1 2930 Gross domestic purchases 1.9 2.6 3.1 0.3 2.5 1.5 2.1 3.3 2.1 2.4 2.8 4.3 2.5 2.8 4.9 1.4 2.3 2.6 2.2 3031 Final sales to domestic purchasers 2.4 2.5 3.0 1.0 3.2 2.2 2.6 2.2 2.8 2.3 1.8 4.9 2.3 4.0 2.8 1.3 1.8 3.6 2.2 3132 Final sales to private domestic
purchasers 2.6 2.9 3.3 1.0 3.0 2.9 2.8 2.4 3.4 2.5 2.2 5.5 2.4 4.2 2.9 1.7 1.6 3.3 2.3 3233 Gross national product (GNP) 1.6 2.5 3.0 0.5 1.3 2.1 1.9 3.0 1.9 1.8 4.0 3.7 2.8 3.1 3.0 0.7 3.1 2.8 2.2 3334 Disposable personal income 1.8 2.9 4.0 1.3 2.7 -0.4 1.8 2.4 4.9 2.7 2.3 3.7 6.9 2.7 3.3 2.8 4.5 1.5 2.9 34
Current-dollar measures:35 GDP 2.7 4.3 5.4 0.1 1.6 4.7 3.7 4.0 4.2 3.5 5.4 6.4 5.0 7.1 4.8 2.9 3.9 4.7 3.8 3536 GDI 1.9 4.0 5.0 0.7 1.7 1.0 3.5 3.3 5.8 4.0 2.9 5.6 7.1 4.2 5.1 2.6 4.1 3.5 3.9 3637 Average of GDP and GDI 2.3 4.2 5.2 0.4 1.6 2.8 3.6 3.7 5.0 3.8 4.1 6.0 6.1 5.6 4.9 2.7 4.0 4.1 3.9 3738 Final sales of domestic product 3.3 4.3 5.3 0.9 2.6 5.3 4.2 3.0 4.9 3.4 4.6 7.0 4.8 8.2 2.8 2.6 3.7 5.4 4.0 3839 Gross domestic purchases 2.6 4.5 5.6 -0.3 1.7 4.0 3.7 5.1 4.4 3.7 4.5 7.2 5.5 5.6 6.7 3.0 2.8 5.1 3.5 3940 Final sales to domestic purchasers 3.2 4.5 5.5 0.5 2.7 4.6 4.2 4.1 5.1 3.6 3.7 7.7 5.3 6.7 4.7 2.8 2.6 5.8 3.7 4041 Final sales to private domestic
purchasers 3.4 4.7 5.5 0.5 2.9 5.1 4.4 4.3 5.5 3.7 4.0 8.0 5.2 6.7 4.6 2.9 2.2 5.7 3.8 4142 GNP 2.6 4.4 5.5 0.5 0.9 4.9 3.4 5.0 3.8 3.1 6.2 6.6 5.2 6.6 4.8 2.5 4.0 5.4 3.9 4243 Disposable personal income 2.8 4.7 6.1 0.9 2.9 2.0 3.5 4.3 7.1 3.6 4.1 6.5 9.6 4.9 4.9 4.2 4.9 3.9 4.5 43
Source: U.S. Bureau of Economic Analysis
2016 2017 2018
Seasonally adjusted at annual rates
2016 2017 2018 2019 Line
December 20, 2019
Table 1. Real Gross Domestic Product and Related Measures: Percent Change From Preceding Period
Line
r Revised
1. Gross domestic income deflated by the implicit price deflator for gross domestic product.
- 8 -
2015
Q4 Q1 Q2 Q3 Q4 Q1 Q2 Q3 Q4 Q1 Q2 Q3 Q4 Q1 Q2 Q3 r
Percent change at annual rate:1 Gross domestic product 1.6 2.4 2.9 0.1 2.0 1.9 2.2 2.0 2.3 2.2 3.2 3.5 2.5 3.5 2.9 1.1 3.1 2.0 2.1 1
Percentage points at annual rates:2 Personal consumption expenditures 1.85 1.78 2.05 1.20 2.11 1.95 1.74 1.70 1.63 1.63 1.61 3.12 1.15 2.70 2.34 0.97 0.78 3.03 2.12 23 Goods 0.77 0.83 0.86 0.31 0.88 0.94 0.84 0.41 0.68 1.14 0.85 1.55 0.27 1.13 0.75 0.33 0.32 1.74 1.09 34 Durable goods 0.43 0.49 0.44 0.16 0.41 0.49 0.75 0.41 0.24 0.54 0.55 0.84 0.16 0.56 0.25 0.09 0.02 0.87 0.56 45 Motor vehicles and parts 0.08 0.13 0.11 -0.18 0.04 0.14 0.34 0.18 -0.12 0.11 0.23 0.39 -0.15 0.18 0.01 0.07 -0.27 0.37 0.06 5
6Furnishings and durable household equipment 0.12 0.13 0.10 0.12 0.13 0.11 0.14 0.06 0.15 0.13 0.15 0.19 0.07 0.08 0.09 -0.09 0.03 0.14 0.10 6
7 Recreational goods and vehicles 0.21 0.19 0.16 0.17 0.26 0.26 0.22 0.15 0.21 0.25 0.05 0.22 0.17 0.17 0.12 0.04 0.23 0.32 0.31 78 Other durable goods 0.02 0.03 0.08 0.05 -0.03 -0.02 0.05 0.01 0.00 0.04 0.12 0.04 0.08 0.13 0.03 0.07 0.03 0.04 0.09 89 Nondurable goods 0.34 0.35 0.42 0.15 0.47 0.45 0.09 0.00 0.44 0.60 0.31 0.71 0.11 0.57 0.50 0.24 0.30 0.87 0.53 9
10 Food and beverages purchased for off-premises consumption 0.15 0.16 0.16 0.02 0.21 0.30 0.12 0.17 0.15 0.09 0.19 0.31 0.12 0.09 0.13 0.07 -0.08 0.25 0.26 10
11 Clothing and footwear 0.04 0.02 0.07 -0.01 0.09 0.02 0.05 -0.09 0.00 0.12 0.00 0.12 -0.03 0.18 0.15 0.00 -0.07 0.25 -0.04 1112 Gasoline and other energy goods 0.01 -0.01 0.00 -0.03 0.08 -0.05 -0.03 -0.05 -0.04 0.10 -0.04 -0.01 -0.04 0.05 -0.04 0.03 0.01 0.02 -0.02 1213 Other nondurable goods 0.14 0.18 0.19 0.17 0.09 0.18 -0.05 -0.02 0.33 0.29 0.15 0.29 0.06 0.24 0.27 0.14 0.44 0.35 0.33 1314 Services 1.08 0.94 1.18 0.89 1.23 1.01 0.90 1.29 0.95 0.49 0.76 1.57 0.88 1.57 1.59 0.65 0.46 1.29 1.02 1415 Household consumption
expenditures (for services) 1.00 0.94 1.08 0.69 1.29 1.07 0.57 1.30 0.94 0.61 0.81 1.55 0.78 1.33 1.46 0.24 1.00 1.26 1.04 1516 Housing and utilities 0.19 0.10 0.17 0.02 0.20 0.35 0.27 -0.12 -0.13 0.37 0.04 0.33 0.05 0.29 0.07 0.12 0.01 0.14 0.28 1617 Health care 0.43 0.27 0.34 0.07 0.66 0.84 -0.40 0.80 0.09 -0.03 0.56 0.43 0.20 0.39 0.60 -0.22 0.72 0.38 0.07 1718 Transportation services 0.09 0.08 0.07 0.10 0.12 0.02 0.15 0.11 -0.04 0.12 0.13 0.18 0.13 -0.10 -0.02 -0.02 0.01 0.17 0.10 1819 Recreation services 0.08 0.03 0.06 0.31 0.05 -0.08 0.12 0.13 0.07 -0.05 -0.05 -0.06 0.16 0.17 0.02 0.09 -0.03 0.17 0.00 1920 Food services and
accommodations 0.10 0.12 0.19 0.17 0.09 0.04 0.06 0.07 0.33 -0.06 0.11 0.19 0.26 0.23 0.35 -0.12 -0.06 0.22 0.16 2021 Financial services and insurance -0.12 0.10 0.06 -0.02 -0.30 -0.21 0.10 -0.03 0.33 -0.01 0.11 0.14 0.05 -0.04 0.05 0.10 0.15 0.05 0.12 2122 Other services 0.23 0.24 0.19 0.03 0.47 0.11 0.26 0.33 0.29 0.28 -0.09 0.35 -0.08 0.39 0.38 0.30 0.20 0.13 0.32 2223 Final consumption expenditures of
nonprofit institutions serving households 0.07 0.01 0.10 0.20 -0.06 -0.06 0.33 -0.02 0.01 -0.12 -0.05 0.02 0.10 0.24 0.13 0.41 -0.54 0.03 -0.02 23
24 Gross output of nonprofit 0.28 0.12 0.20 0.34 0.27 0.45 0.22 0.32 0.03 -0.23 0.24 0.13 -0.03 0.57 0.45 0.07 0.19 0.14 0.00 2425 Less: Receipts from sales of
goods and services by nonprofit institutions 0.20 0.11 0.10 0.14 0.33 0.51 -0.11 0.34 0.02 -0.11 0.30 0.11 -0.13 0.33 0.32 -0.34 0.72 0.12 0.02 25
26 Gross private domestic investment -0.23 0.75 0.87 -1.07 -0.26 -0.28 0.09 1.50 0.57 0.59 1.25 0.80 1.07 -0.30 2.27 0.53 1.09 -1.16 -0.17 2627 Fixed investment 0.32 0.70 0.78 -0.38 0.43 0.44 0.62 0.33 1.27 0.48 0.25 1.45 0.94 0.89 0.13 0.46 0.56 -0.25 -0.14 2728 Nonresidential 0.09 0.57 0.84 -0.61 -0.08 0.52 0.72 0.09 0.84 0.57 0.32 1.08 1.15 1.04 0.29 0.64 0.60 -0.14 -0.31 2829 Structures -0.16 0.14 0.12 -0.70 -0.35 0.27 0.50 0.07 0.21 0.06 -0.24 0.15 0.35 0.33 -0.07 -0.29 0.12 -0.36 -0.30 2930 Equipment -0.08 0.27 0.39 -0.31 -0.24 -0.14 0.02 0.02 0.36 0.50 0.36 0.72 0.39 0.20 0.17 0.42 0.00 0.05 -0.22 3031 Information processing 0.10 0.18 0.18 0.06 0.02 0.05 0.21 0.11 0.18 0.26 0.16 0.28 0.20 0.08 0.20 -0.04 0.17 0.13 -0.13 3132 Industrial equipment -0.01 0.07 0.05 0.03 -0.11 0.04 -0.02 0.07 0.08 0.14 0.06 0.09 0.07 -0.05 0.07 0.08 -0.04 0.02 0.08 3233 Transportation equipment -0.09 -0.08 0.09 -0.25 -0.10 -0.15 -0.19 -0.15 -0.07 -0.08 0.02 0.21 0.12 0.09 -0.07 0.29 -0.06 -0.14 -0.17 3334 Other equipment -0.07 0.10 0.07 -0.14 -0.06 -0.07 0.02 0.00 0.16 0.18 0.12 0.14 0.00 0.09 -0.03 0.10 -0.08 0.04 0.00 3435 Intellectual property products 0.33 0.16 0.32 0.39 0.52 0.39 0.20 0.00 0.27 0.01 0.21 0.20 0.41 0.51 0.18 0.51 0.48 0.17 0.22 3536 Software 0.14 0.14 0.19 0.14 0.22 0.12 0.14 0.11 0.19 0.09 0.17 0.10 0.29 0.18 0.15 0.19 0.26 0.11 0.18 3637 Research and development 0.18 0.01 0.12 0.24 0.29 0.27 0.03 -0.13 0.08 -0.08 0.04 0.07 0.10 0.30 0.01 0.29 0.21 0.06 0.01 3738 Entertainment, literary, and
artistic originals 0.01 0.01 0.02 0.01 0.01 0.00 0.04 0.02 0.00 0.00 0.01 0.03 0.02 0.02 0.02 0.03 0.00 0.00 0.02 3839 Residential 0.23 0.13 -0.06 0.23 0.50 -0.07 -0.10 0.24 0.43 -0.09 -0.08 0.37 -0.21 -0.15 -0.16 -0.18 -0.04 -0.11 0.17 3940 Change in private inventories -0.55 0.04 0.09 -0.68 -0.68 -0.72 -0.53 1.18 -0.70 0.11 1.00 -0.64 0.13 -1.20 2.14 0.07 0.53 -0.91 -0.03 4041 Farm -0.04 0.01 -0.02 0.03 -0.29 0.18 0.08 -0.12 0.04 0.01 -0.03 0.01 -0.03 -0.02 -0.06 -0.05 0.01 0.04 0.01 4142 Nonfarm -0.51 0.03 0.11 -0.72 -0.40 -0.90 -0.61 1.30 -0.74 0.10 1.03 -0.65 0.16 -1.18 2.20 0.12 0.52 -0.95 -0.04 4243 Net exports of goods and services -0.30 -0.28 -0.29 -0.20 -0.50 0.35 0.05 -1.36 0.13 -0.31 0.35 -0.80 0.00 0.67 -2.05 -0.35 0.73 -0.68 -0.14 4344 Exports 0.00 0.41 0.37 -0.21 -0.38 0.45 0.71 -0.30 0.72 0.20 0.54 1.19 0.10 0.71 -0.78 0.18 0.49 -0.69 0.11 4445 Goods 0.04 0.30 0.34 -0.35 0.05 0.20 0.54 -0.06 0.46 0.18 0.18 1.03 0.11 0.94 -0.78 0.21 0.36 -0.48 0.17 4546 Services -0.05 0.11 0.03 0.14 -0.43 0.25 0.17 -0.24 0.25 0.01 0.36 0.16 0.00 -0.23 0.00 -0.03 0.13 -0.21 -0.05 4647 Imports -0.30 -0.69 -0.66 0.01 -0.11 -0.10 -0.66 -1.06 -0.58 -0.51 -0.18 -1.99 -0.10 -0.04 -1.27 -0.53 0.23 0.01 -0.26 4748 Goods -0.18 -0.57 -0.61 0.10 0.03 -0.11 -0.42 -0.92 -0.48 -0.40 -0.10 -1.86 -0.18 -0.10 -1.11 -0.28 0.36 -0.02 -0.13 4849 Services -0.12 -0.12 -0.05 -0.10 -0.15 0.01 -0.24 -0.14 -0.10 -0.11 -0.08 -0.12 0.08 0.06 -0.16 -0.24 -0.13 0.02 -0.13 4950 Government consumption
expenditures and gross investment 0.32 0.12 0.30 0.19 0.67 -0.12 0.31 0.19 -0.04 0.24 -0.02 0.42 0.33 0.44 0.36 -0.07 0.50 0.82 0.30 5051 Federal 0.03 0.05 0.19 0.17 0.05 -0.18 0.13 0.04 -0.08 0.21 0.01 0.30 0.18 0.25 0.19 0.07 0.14 0.53 0.22 5152 National defense -0.02 0.03 0.13 0.11 -0.01 -0.21 0.13 -0.04 -0.07 0.25 -0.06 0.17 0.02 0.28 0.11 0.20 0.29 0.13 0.09 5253 Consumption expenditures -0.01 0.00 0.09 0.06 0.00 -0.13 0.16 -0.01 -0.13 0.15 -0.06 0.10 0.02 0.23 0.11 0.07 0.25 0.13 0.01 5354 Gross investment -0.01 0.03 0.04 0.05 -0.01 -0.07 -0.03 -0.02 0.06 0.10 0.00 0.07 0.00 0.05 0.01 0.12 0.04 -0.01 0.08 5455 Nondefense 0.05 0.02 0.07 0.06 0.06 0.03 0.00 0.08 0.00 -0.04 0.07 0.13 0.16 -0.03 0.07 -0.12 -0.15 0.40 0.13 5556 Consumption expenditures 0.04 0.01 0.06 0.06 0.04 0.01 -0.01 0.05 -0.02 -0.06 0.07 0.10 0.18 -0.03 0.05 -0.14 -0.16 0.36 0.10 5657 Gross investment 0.01 0.02 0.00 0.00 0.02 0.02 0.01 0.02 0.02 0.01 0.00 0.03 -0.02 0.00 0.02 0.02 0.01 0.04 0.03 5758 State and local 0.29 0.07 0.11 0.02 0.63 0.06 0.18 0.15 0.03 0.03 -0.02 0.12 0.15 0.19 0.17 -0.14 0.36 0.29 0.08 5859 Consumption expenditures 0.23 0.07 0.08 0.24 0.25 0.18 0.22 0.06 0.01 0.04 0.07 0.07 0.08 0.10 0.14 0.06 0.10 0.07 0.15 5960 Gross investment 0.06 0.00 0.02 -0.21 0.37 -0.12 -0.05 0.09 0.02 -0.01 -0.09 0.06 0.07 0.10 0.03 -0.20 0.26 0.23 -0.08 60
December 20, 2019Table 2. Contributions to Percent Change in Real Gross Domestic Product
Line
r RevisedSource: U.S. Bureau of Economic Analysis
2016 2017 2018Seasonally adjusted at annual rates
2016 2017 2018 2019 Line
- 9 -

Q3 Q4 Q1 Q2 Q3 r Q3 Q4 Q1 Q2 Q3 r Q2 Q3 r
1 Gross domestic product (GDP) 20,580.2 20,749.8 20,897.8 21,098.8 21,340.3 21,542.5 18,638.2 18,732.7 18,783.5 18,927.3 19,021.9 19,121.1 530.1 94.6 99.3 12 Personal consumption expenditures 13,998.7 14,114.6 14,211.9 14,266.3 14,511.2 14,678.2 12,944.6 13,019.8 13,066.3 13,103.3 13,250.0 13,353.1 377.6 146.7 103.1 23 Goods 4,364.8 4,398.0 4,399.4 4,397.7 4,507.0 4,556.7 4,583.3 4,614.0 4,631.8 4,649.2 4,746.4 4,808.0 179.9 97.3 61.6 34 Durable goods 1,475.6 1,485.2 1,485.6 1,485.4 1,524.6 1,549.7 1,685.7 1,699.8 1,705.2 1,706.3 1,759.3 1,793.9 99.3 53.0 34.6 45 Motor vehicles and parts 521.5 524.0 528.5 513.6 533.1 537.1 533.1 534.8 538.5 524.2 544.1 547.5 21.9 19.9 3.4 56 Furnishings and durable
household equipment 341.2 344.5 341.9 346.5 352.9 359.0 394.2 399.3 394.0 395.9 404.5 410.5 23.2 8.6 6.0 67 Recreational goods and vehicles 394.6 397.5 396.6 405.9 414.8 426.3 516.1 522.4 524.8 540.5 562.9 585.4 39.3 22.4 22.5 78 Other durable goods 218.3 219.3 218.7 219.4 223.8 227.4 250.7 252.3 256.6 258.5 261.1 266.8 17.5 2.7 5.7 89 Nondurable goods 2,889.2 2,912.8 2,913.8 2,912.3 2,982.4 3,007.0 2,909.6 2,926.6 2,938.9 2,954.6 3,001.3 3,030.0 84.4 46.6 28.7 910 Food and beverages purchased
for off-premises consumption 1,003.4 1,008.0 1,012.1 1,015.4 1,030.1 1,042.8 970.4 973.8 977.2 973.1 985.8 999.0 29.8 12.6 13.3 1011 Clothing and footwear 391.5 394.9 394.8 393.5 399.3 402.3 394.4 400.5 400.5 396.7 410.4 408.0 14.9 13.7 -2.4 1112 Gasoline and other energy goods 349.6 357.9 348.2 321.8 349.3 338.0 447.4 446.3 448.5 449.0 450.1 448.9 -0.8 1.1 -1.1 1213 Other nondurable goods 1,144.6 1,152.0 1,158.6 1,181.6 1,203.6 1,223.9 1,084.9 1,092.6 1,099.2 1,121.2 1,138.9 1,155.8 36.2 17.7 16.9 1314 Services 9,633.9 9,716.6 9,812.5 9,868.6 10,004.2 10,121.5 8,388.1 8,433.6 8,462.6 8,483.1 8,541.4 8,587.9 206.0 58.3 46.5 1415 Household consumption
expenditures (for services) 9,190.9 9,271.7 9,343.3 9,426.9 9,558.5 9,670.9 8,019.7 8,064.3 8,075.1 8,119.9 8,177.2 8,224.7 188.4 57.3 47.5 1516 Housing and utilities 2,567.2 2,579.0 2,607.2 2,627.7 2,655.9 2,688.1 2,164.2 2,167.7 2,172.7 2,173.1 2,179.1 2,191.4 29.4 6.0 12.2 1617 Health care 2,352.6 2,380.3 2,381.1 2,426.2 2,459.0 2,476.0 2,181.6 2,203.2 2,192.4 2,227.0 2,245.5 2,248.7 62.2 18.5 3.3 1718 Transportation services 462.2 462.5 467.1 464.7 477.0 483.2 432.1 430.8 429.9 430.3 438.4 443.1 12.5 8.1 4.7 1819 Recreation services 563.2 566.4 573.7 574.9 586.1 588.1 498.0 499.4 503.3 502.1 510.0 510.1 10.5 7.9 0.1 1920 Food services and
accommodations 973.3 989.5 987.1 994.9 1,016.1 1,030.0 843.1 854.6 849.4 846.5 856.6 863.7 33.2 10.1 7.1 2021 Financial services and insurance 1,111.0 1,118.4 1,131.7 1,129.4 1,149.1 1,167.1 841.5 841.1 844.9 850.7 852.7 857.6 8.6 2.0 4.9 2122 Other services 1,161.3 1,175.6 1,195.4 1,209.2 1,215.4 1,238.3 1,074.3 1,084.3 1,098.7 1,108.2 1,114.4 1,129.8 35.7 6.2 15.4 2223 Final consumption expenditures
of nonprofit institutions serving households 443.0 444.9 469.2 441.7 445.6 450.6 368.5 369.4 386.9 363.8 364.8 364.0 17.2 1.1 -0.9 23
24 Gross output of nonprofit institutions 1,597.9 1,619.3 1,633.0 1,650.3 1,667.3 1,679.2 1,401.1 1,416.7 1,419.8 1,428.4 1,434.8 1,434.8 35.6 6.5 -0.1 24
25 Less: Receipts from sales of goods and services by nonprofit institutions 1,154.9 1,174.4 1,163.7 1,208.6 1,221.7 1,228.6 1,032.9 1,047.8 1,032.2 1,065.7 1,071.2 1,072.0 17.8 5.4 0.8 25
26 Gross private domestic investment 3,628.3 3,684.0 3,725.2 3,783.4 3,749.5 3,744.6 3,360.5 3,404.2 3,429.5 3,481.1 3,424.7 3,416.2 161.6 -56.4 -8.5 2627 Fixed investment 3,573.6 3,596.7 3,625.2 3,670.1 3,674.7 3,677.6 3,293.4 3,301.3 3,323.0 3,349.4 3,337.4 3,330.5 143.7 -12.0 -6.9 2728 Nonresidential 2,786.9 2,807.7 2,840.7 2,882.7 2,890.0 2,877.2 2,692.3 2,703.9 2,735.8 2,765.6 2,758.5 2,742.7 161.1 -7.0 -15.9 2829 Structures 633.2 641.7 635.2 645.8 633.2 619.4 540.9 546.2 533.4 538.6 523.0 509.6 21.4 -15.6 -13.4 2930 Equipment 1,222.6 1,227.9 1,246.4 1,249.0 1,252.9 1,237.4 1,255.3 1,256.7 1,279.2 1,278.9 1,281.5 1,269.3 79.7 2.7 -12.2 3031 Information processing
equipment 408.6 414.8 409.5 416.0 419.0 409.2 498.5 506.6 504.2 515.4 524.1 515.5 42.1 8.7 -8.6 3132 Industrial equipment 245.9 246.9 251.6 250.8 252.4 257.3 238.5 238.7 242.5 240.4 241.4 245.3 10.4 1.0 3.9 3233 Transportation equipment 301.8 299.7 311.0 309.4 306.0 294.8 280.1 275.9 289.6 286.6 279.7 271.5 16.8 -6.9 -8.2 3334 Other equipment 266.3 266.5 274.2 272.9 275.5 276.1 250.9 250.0 254.9 251.2 253.1 252.9 13.3 1.9 -0.2 3435 Intellectual property products 931.1 938.1 959.1 987.9 1,003.9 1,020.5 901.6 905.9 931.3 955.6 964.2 975.2 61.9 8.6 11.1 3536 Software 380.0 383.8 391.0 404.1 411.4 421.1 413.5 417.4 428.0 443.0 449.3 460.0 39.6 6.2 10.7 3637 Research and development 461.7 464.1 476.8 492.0 499.9 505.8 409.2 409.6 422.7 432.6 435.5 436.2 20.7 2.9 0.7 3738 Entertainment, literary, and
artistic originals 89.4 90.2 91.3 91.8 92.6 93.6 83.3 83.6 85.2 85.4 85.3 86.2 3.7 -0.1 0.9 3839 Residential 786.7 789.0 784.4 787.4 784.7 800.3 602.9 600.1 593.0 591.4 587.0 593.7 -9.0 -4.4 6.7 3940 Change in private inventories 54.7 87.3 100.1 113.3 74.8 67.0 48.1 87.2 93.0 116.0 69.4 69.4 16.5 -46.6 0.0 4041 Farm -7.8 -8.7 -11.3 -10.1 -8.2 -7.6 -9.0 -10.5 -13.7 -14.2 -11.0 -11.3 -4.2 3.2 -0.3 4142 Nonfarm 62.5 96.1 111.4 123.4 83.0 74.7 55.2 94.6 103.0 126.6 77.9 77.6 19.9 -48.7 -0.3 4243 Net exports of goods and services -638.2 -671.4 -684.1 -633.8 -662.7 -653.0 -920.0 -962.4 -983.0 -944.0 -980.7 -990.1 -70.3 -36.7 -9.4 4344 Exports 2,510.3 2,510.3 2,510.5 2,520.3 2,504.0 2,495.1 2,532.9 2,519.3 2,528.5 2,554.4 2,517.5 2,523.4 74.2 -36.9 6.0 4445 Goods 1,661.3 1,661.3 1,659.9 1,661.8 1,646.1 1,638.0 1,782.8 1,771.2 1,782.5 1,802.6 1,775.3 1,784.7 72.8 -27.4 9.5 4546 Services 848.9 849.0 850.6 858.5 858.0 857.1 755.4 753.0 751.7 757.8 748.0 745.5 5.1 -9.8 -2.5 4647 Imports 3,148.5 3,181.6 3,194.7 3,154.1 3,166.7 3,148.2 3,453.0 3,481.8 3,511.6 3,498.3 3,498.2 3,513.6 144.5 -0.2 15.4 4748 Goods 2,570.6 2,602.0 2,601.2 2,554.3 2,566.1 2,540.9 2,916.1 2,945.4 2,962.0 2,940.7 2,941.7 2,949.6 139.0 1.0 7.9 4849 Services 577.9 579.6 593.4 599.8 600.6 607.2 539.9 540.3 552.0 558.1 557.2 563.7 8.6 -1.0 6.5 49
Note. Users are cautioned that particularly for components that exhibit rapid change in prices relative to other prices in the economy, the chained-dollar estimates should not be used to measure the component's relative importance or its contribution to the growth rate of more aggregate series. For accurate estimates of the contributions to percent changes in real gross domestic product, use table 2.
Source: U.S. Bureau of Economic Analysis
Billions of dollars
2018Seasonally adjusted at annual rates
2018 2019
Billions of chained (2012) dollars
2018Seasonally adjusted at annual rates
2018 2019
Change from preceding period
20182019
December 20, 2019
Table 3. Gross Domestic Product: Level and Change From Preceding Period--Continues
Line
r Revised
1. Real gross domestic income is gross domestic income deflated by the implicit price deflator for gross domestic product.
Line
- 10 -

Q3 Q4 Q1 Q2 Q3 r Q3 Q4 Q1 Q2 Q3 r Q2 Q3 r
50 Government consumption expenditures and gross investment 3,591.5 3,622.6 3,644.8 3,683.1 3,742.3 3,772.8 3,223.9 3,238.0 3,234.9 3,258.1 3,296.6 3,310.4 54.2 38.4 13.8 50
51 Federal 1,347.3 1,358.6 1,371.8 1,394.7 1,415.2 1,432.2 1,232.2 1,238.7 1,242.1 1,248.8 1,273.9 1,284.4 35.2 25.1 10.5 5152 National defense 793.6 800.6 814.4 831.8 841.6 849.3 737.5 741.2 750.6 764.5 770.8 775.0 23.5 6.2 4.2 5253 Consumption expenditures 637.4 644.9 651.8 666.6 676.9 680.2 587.8 592.3 595.7 607.6 614.1 614.5 16.3 6.4 0.5 5354 Gross investment 156.2 155.7 162.6 165.2 164.8 169.1 149.8 149.0 155.1 157.1 156.8 160.7 7.2 -0.3 3.9 5455 Nondefense 553.7 558.0 557.4 562.9 573.5 583.0 494.2 497.0 491.3 484.5 502.9 509.1 11.8 18.4 6.2 5556 Consumption expenditures 419.5 423.2 421.3 425.0 433.6 440.9 369.0 371.5 365.1 358.0 374.2 379.1 11.0 16.2 4.8 5657 Gross investment 134.2 134.8 136.1 137.9 139.9 142.1 125.1 125.4 126.2 126.7 128.6 130.0 0.6 2.0 1.4 5758 State and local 2,244.2 2,263.9 2,273.0 2,288.4 2,327.1 2,340.5 1,990.0 1,997.7 1,991.4 2,007.9 2,021.4 2,024.9 19.4 13.6 3.5 5859 Consumption expenditures 1,847.4 1,860.6 1,876.3 1,876.4 1,897.9 1,913.2 1,636.7 1,640.3 1,643.1 1,647.5 1,650.5 1,657.7 15.0 3.0 7.1 5960 Gross investment 396.8 403.3 396.7 412.0 429.2 427.4 353.3 357.3 348.2 360.3 370.8 367.2 4.4 10.5 -3.6 6061 Residual ............... ............... ............... ............... ............... ............... -26.3 -28.4 -34.4 -51.4 -62.3 -74.8 .......... .......... .......... 61
Addenda:62 Gross domestic income (GDI) 1 20,569.4 20,716.9 20,848.6 21,056.7 21,237.8 21,440.4 18,628.4 18,703.1 18,739.3 18,889.5 18,930.5 19,030.5 457.7 41.0 100.0 6263 Average of GDP and GDI 20,574.8 20,733.3 20,873.2 21,077.8 21,289.0 21,491.5 18,633.3 18,717.9 18,761.4 18,908.4 18,976.2 19,075.8 493.9 67.8 99.6 6364 Final sales of domestic product 20,525.5 20,662.4 20,797.7 20,985.5 21,265.5 21,475.5 18,571.3 18,630.9 18,678.3 18,797.5 18,935.2 19,035.7 512.9 137.6 100.6 6465 Gross domestic purchases 21,218.4 21,421.1 21,582.0 21,732.7 22,002.9 22,195.6 19,523.2 19,656.0 19,724.2 19,836.1 19,965.4 20,073.7 592.0 129.4 108.3 6566 Final sales to domestic purchasers 21,163.7 21,333.8 21,481.9 21,619.4 21,928.1 22,128.5 19,456.8 19,554.0 19,618.8 19,705.7 19,878.9 19,988.6 574.6 173.2 109.7 6667 Final sales to private domestic
purchasers 17,572.2 17,711.2 17,837.1 17,936.3 18,185.9 18,355.8 16,237.8 16,320.9 16,389.2 16,452.7 16,587.1 16,683.1 521.4 134.4 96.0 6768 Gross domestic product 20,580.2 20,749.8 20,897.8 21,098.8 21,340.3 21,542.5 18,638.2 18,732.7 18,783.5 18,927.3 19,021.9 19,121.1 530.1 94.6 99.3 6869 Plus: Income receipts from the rest
of the world 1,106.2 1,116.0 1,127.0 1,149.0 1,177.2 1,160.4 1,023.9 1,029.7 1,036.2 1,051.1 1,071.0 1,052.0 120.2 19.9 -19.1 6970 Less: Income payments to the rest
of the world 838.3 843.6 874.4 891.2 876.2 851.4 762.5 765.1 789.9 802.9 785.3 760.3 95.7 -17.6 -25.0 7071 Equals: Gross national product 20,848.1 21,022.1 21,150.4 21,356.7 21,641.3 21,851.5 18,897.8 18,995.6 19,028.0 19,173.6 19,305.2 19,410.8 553.2 131.7 105.5 7172 Net domestic product 17,288.8 17,433.9 17,539.7 17,696.7 17,893.8 18,056.7 15,612.6 15,695.7 15,722.5 15,841.7 15,911.1 15,986.1 447.5 69.5 74.9 72
Note. Users are cautioned that particularly for components that exhibit rapid change in prices relative to other prices in the economy, the chained-dollar estimates should not be used to measure the component's relative importance or its contribution to the growth rate of more aggregate series. For accurate estimates of the contributions to percent changes in real gross domestic product, use table 2.
Source: U.S. Bureau of Economic Analysis
Billions of dollars
2018Seasonally adjusted at annual rates
2018 2019
Billions of chained (2012) dollars
2018Seasonally adjusted at annual rates
2018 2019
Change from preceding period
20182019
December 20, 2019Table 3. Gross Domestic Product: Level and Change From Preceding Period--Table Ends
Line
r Revised
1. Real gross domestic income is gross domestic income deflated by the implicit price deflator for gross domestic product.
Line
- 11 -
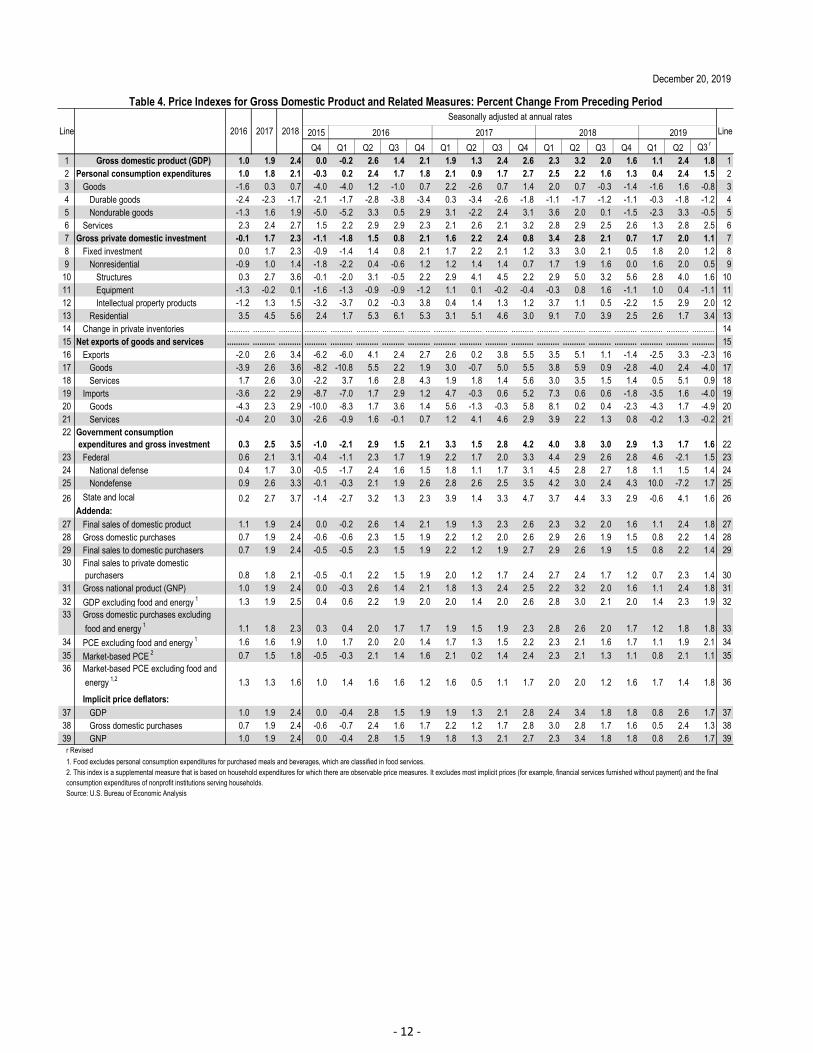
2015
Q4 Q1 Q2 Q3 Q4 Q1 Q2 Q3 Q4 Q1 Q2 Q3 Q4 Q1 Q2 Q3 r
1 Gross domestic product (GDP) 1.0 1.9 2.4 0.0 -0.2 2.6 1.4 2.1 1.9 1.3 2.4 2.6 2.3 3.2 2.0 1.6 1.1 2.4 1.8 12 Personal consumption expenditures 1.0 1.8 2.1 -0.3 0.2 2.4 1.7 1.8 2.1 0.9 1.7 2.7 2.5 2.2 1.6 1.3 0.4 2.4 1.5 23 Goods -1.6 0.3 0.7 -4.0 -4.0 1.2 -1.0 0.7 2.2 -2.6 0.7 1.4 2.0 0.7 -0.3 -1.4 -1.6 1.6 -0.8 34 Durable goods -2.4 -2.3 -1.7 -2.1 -1.7 -2.8 -3.8 -3.4 0.3 -3.4 -2.6 -1.8 -1.1 -1.7 -1.2 -1.1 -0.3 -1.8 -1.2 45 Nondurable goods -1.3 1.6 1.9 -5.0 -5.2 3.3 0.5 2.9 3.1 -2.2 2.4 3.1 3.6 2.0 0.1 -1.5 -2.3 3.3 -0.5 56 Services 2.3 2.4 2.7 1.5 2.2 2.9 2.9 2.3 2.1 2.6 2.1 3.2 2.8 2.9 2.5 2.6 1.3 2.8 2.5 67 Gross private domestic investment -0.1 1.7 2.3 -1.1 -1.8 1.5 0.8 2.1 1.6 2.2 2.4 0.8 3.4 2.8 2.1 0.7 1.7 2.0 1.1 78 Fixed investment 0.0 1.7 2.3 -0.9 -1.4 1.4 0.8 2.1 1.7 2.2 2.1 1.2 3.3 3.0 2.1 0.5 1.8 2.0 1.2 89 Nonresidential -0.9 1.0 1.4 -1.8 -2.2 0.4 -0.6 1.2 1.2 1.4 1.4 0.7 1.7 1.9 1.6 0.0 1.6 2.0 0.5 9
10 Structures 0.3 2.7 3.6 -0.1 -2.0 3.1 -0.5 2.2 2.9 4.1 4.5 2.2 2.9 5.0 3.2 5.6 2.8 4.0 1.6 1011 Equipment -1.3 -0.2 0.1 -1.6 -1.3 -0.9 -0.9 -1.2 1.1 0.1 -0.2 -0.4 -0.3 0.8 1.6 -1.1 1.0 0.4 -1.1 1112 Intellectual property products -1.2 1.3 1.5 -3.2 -3.7 0.2 -0.3 3.8 0.4 1.4 1.3 1.2 3.7 1.1 0.5 -2.2 1.5 2.9 2.0 1213 Residential 3.5 4.5 5.6 2.4 1.7 5.3 6.1 5.3 3.1 5.1 4.6 3.0 9.1 7.0 3.9 2.5 2.6 1.7 3.4 1314 Change in private inventories .......... .......... .......... .......... .......... .......... .......... .......... .......... .......... .......... .......... .......... .......... .......... .......... .......... .......... .......... 1415 Net exports of goods and services .......... .......... .......... .......... .......... .......... .......... .......... .......... .......... .......... .......... .......... .......... .......... .......... .......... .......... .......... 1516 Exports -2.0 2.6 3.4 -6.2 -6.0 4.1 2.4 2.7 2.6 0.2 3.8 5.5 3.5 5.1 1.1 -1.4 -2.5 3.3 -2.3 1617 Goods -3.9 2.6 3.6 -8.2 -10.8 5.5 2.2 1.9 3.0 -0.7 5.0 5.5 3.8 5.9 0.9 -2.8 -4.0 2.4 -4.0 1718 Services 1.7 2.6 3.0 -2.2 3.7 1.6 2.8 4.3 1.9 1.8 1.4 5.6 3.0 3.5 1.5 1.4 0.5 5.1 0.9 1819 Imports -3.6 2.2 2.9 -8.7 -7.0 1.7 2.9 1.2 4.7 -0.3 0.6 5.2 7.3 0.6 0.6 -1.8 -3.5 1.6 -4.0 1920 Goods -4.3 2.3 2.9 -10.0 -8.3 1.7 3.6 1.4 5.6 -1.3 -0.3 5.8 8.1 0.2 0.4 -2.3 -4.3 1.7 -4.9 2021 Services -0.4 2.0 3.0 -2.6 -0.9 1.6 -0.1 0.7 1.2 4.1 4.6 2.9 3.9 2.2 1.3 0.8 -0.2 1.3 -0.2 2122 Government consumption
expenditures and gross investment 0.3 2.5 3.5 -1.0 -2.1 2.9 1.5 2.1 3.3 1.5 2.8 4.2 4.0 3.8 3.0 2.9 1.3 1.7 1.6 2223 Federal 0.6 2.1 3.1 -0.4 -1.1 2.3 1.7 1.9 2.2 1.7 2.0 3.3 4.4 2.9 2.6 2.8 4.6 -2.1 1.5 2324 National defense 0.4 1.7 3.0 -0.5 -1.7 2.4 1.6 1.5 1.8 1.1 1.7 3.1 4.5 2.8 2.7 1.8 1.1 1.5 1.4 2425 Nondefense 0.9 2.6 3.3 -0.1 -0.3 2.1 1.9 2.6 2.8 2.6 2.5 3.5 4.2 3.0 2.4 4.3 10.0 -7.2 1.7 25
26 State and local 0.2 2.7 3.7 -1.4 -2.7 3.2 1.3 2.3 3.9 1.4 3.3 4.7 3.7 4.4 3.3 2.9 -0.6 4.1 1.6 26Addenda:
27 Final sales of domestic product 1.1 1.9 2.4 0.0 -0.2 2.6 1.4 2.1 1.9 1.3 2.3 2.6 2.3 3.2 2.0 1.6 1.1 2.4 1.8 2728 Gross domestic purchases 0.7 1.9 2.4 -0.6 -0.6 2.3 1.5 1.9 2.2 1.2 2.0 2.6 2.9 2.6 1.9 1.5 0.8 2.2 1.4 2829 Final sales to domestic purchasers 0.7 1.9 2.4 -0.5 -0.5 2.3 1.5 1.9 2.2 1.2 1.9 2.7 2.9 2.6 1.9 1.5 0.8 2.2 1.4 2930 Final sales to private domestic
purchasers 0.8 1.8 2.1 -0.5 -0.1 2.2 1.5 1.9 2.0 1.2 1.7 2.4 2.7 2.4 1.7 1.2 0.7 2.3 1.4 3031 Gross national product (GNP) 1.0 1.9 2.4 0.0 -0.3 2.6 1.4 2.1 1.8 1.3 2.4 2.5 2.2 3.2 2.0 1.6 1.1 2.4 1.8 31
32 GDP excluding food and energy 1 1.3 1.9 2.5 0.4 0.6 2.2 1.9 2.0 2.0 1.4 2.0 2.6 2.8 3.0 2.1 2.0 1.4 2.3 1.9 3233 Gross domestic purchases excluding
food and energy 1 1.1 1.8 2.3 0.3 0.4 2.0 1.7 1.7 1.9 1.5 1.9 2.3 2.8 2.6 2.0 1.7 1.2 1.8 1.8 33
34 PCE excluding food and energy 1 1.6 1.6 1.9 1.0 1.7 2.0 2.0 1.4 1.7 1.3 1.5 2.2 2.3 2.1 1.6 1.7 1.1 1.9 2.1 34
35 Market-based PCE 2 0.7 1.5 1.8 -0.5 -0.3 2.1 1.4 1.6 2.1 0.2 1.4 2.4 2.3 2.1 1.3 1.1 0.8 2.1 1.1 3536 Market-based PCE excluding food and
energy 1,2 1.3 1.3 1.6 1.0 1.4 1.6 1.6 1.2 1.6 0.5 1.1 1.7 2.0 2.0 1.2 1.6 1.7 1.4 1.8 36
Implicit price deflators:37 GDP 1.0 1.9 2.4 0.0 -0.4 2.8 1.5 1.9 1.9 1.3 2.1 2.8 2.4 3.4 1.8 1.8 0.8 2.6 1.7 3738 Gross domestic purchases 0.7 1.9 2.4 -0.6 -0.7 2.4 1.6 1.7 2.2 1.2 1.7 2.8 3.0 2.8 1.7 1.6 0.5 2.4 1.3 3839 GNP 1.0 1.9 2.4 0.0 -0.4 2.8 1.5 1.9 1.8 1.3 2.1 2.7 2.3 3.4 1.8 1.8 0.8 2.6 1.7 39
2. This index is a supplemental measure that is based on household expenditures for which there are observable price measures. It excludes most implicit prices (for example, financial services furnished without payment) and the final consumption expenditures of nonprofit institutions serving households.Source: U.S. Bureau of Economic Analysis
2016 2017 2018
Seasonally adjusted at annual rates
2016 2017 2018 2019 Line
December 20, 2019
Table 4. Price Indexes for Gross Domestic Product and Related Measures: Percent Change From Preceding Period
Line
r Revised
1. Food excludes personal consumption expenditures for purchased meals and beverages, which are classified in food services.
- 12 -

2011 2012 2013 2014 2015 2016 2017 2018 2011 2012 2013 2014 2015 2016 2017 20181 Gross domestic product (GDP) 1.6 2.2 1.8 2.5 2.9 1.6 2.4 2.9 1.6 1.5 2.6 2.9 1.9 2.0 2.8 2.5 12 Personal consumption expenditures (PCE) 1.9 1.5 1.5 3.0 3.7 2.7 2.6 3.0 1.2 1.6 1.9 3.8 2.9 2.8 2.9 2.6 23 Goods 2.2 2.1 3.1 4.1 4.7 3.6 3.9 4.1 0.9 2.4 3.5 5.0 3.7 3.6 5.0 2.9 34 Durable goods 5.1 6.0 6.1 7.2 7.5 6.1 6.9 6.3 3.5 6.3 5.0 9.2 5.8 7.3 7.7 3.8 45 Nondurable goods 0.9 0.4 1.8 2.6 3.4 2.4 2.5 3.0 -0.2 0.7 2.8 3.2 2.8 1.8 3.7 2.5 56 Services 1.7 1.2 0.6 2.4 3.2 2.3 2.0 2.5 1.4 1.2 1.1 3.2 2.5 2.4 2.0 2.5 67 Gross private domestic investment 6.6 11.0 6.9 5.6 4.9 -1.3 4.4 5.1 10.4 4.0 9.3 5.3 1.5 1.5 4.8 5.1 78 Fixed investment 7.1 10.0 5.6 6.6 3.4 1.9 4.2 4.6 9.2 7.2 5.7 7.0 1.0 2.8 5.1 3.5 89 Nonresidential 8.7 9.5 4.1 7.2 1.8 0.7 4.4 6.4 10.0 5.6 5.4 6.9 -0.9 2.4 5.4 5.9 9
10 Structures 2.7 13.0 1.3 11.0 -3.0 -5.0 4.7 4.1 8.6 4.0 6.7 9.3 -10.9 4.3 1.5 2.6 1011 Equipment 13.4 11.0 4.7 7.0 3.2 -1.3 4.7 6.8 12.7 7.8 5.4 5.6 1.9 -1.4 8.5 5.0 1112 Intellectual property products 6.2 5.0 5.4 4.8 3.6 7.9 3.7 7.4 7.2 3.7 4.5 6.9 2.9 6.6 4.0 9.3 1213 Residential -0.1 13.0 12.4 3.8 10.2 6.5 3.5 -1.5 5.3 15.4 7.1 7.7 9.1 3.9 4.2 -4.4 1314 Change in private inventories .......... .......... .......... .......... .......... .......... .......... .......... .......... .......... .......... .......... .......... .......... .......... .......... 1415 Net exports of goods and services .......... .......... .......... .......... .......... .......... .......... .......... .......... .......... .......... .......... .......... .......... .......... .......... 1516 Exports 7.1 3.4 3.6 4.2 0.5 0.0 3.5 3.0 4.6 2.1 6.0 2.9 -1.5 1.1 5.5 0.4 1617 Goods 7.1 3.8 3.2 4.6 -0.4 0.6 3.9 4.3 5.5 1.4 7.1 2.8 -3.1 2.5 5.9 1.4 1718 Services 7.3 2.4 4.5 3.3 2.2 -1.1 2.7 0.7 2.8 3.8 3.7 3.2 1.6 -1.6 4.8 -1.6 1819 Imports 5.6 2.7 1.5 5.0 5.3 2.0 4.7 4.4 3.8 0.6 3.0 6.5 3.2 3.4 5.6 3.2 1920 Goods 6.1 2.6 1.8 5.6 5.7 1.5 4.8 5.0 3.9 0.5 3.4 7.1 3.2 3.1 6.0 3.4 2021 Services 3.2 3.1 0.5 2.3 3.5 4.4 4.4 1.6 3.2 1.4 1.1 3.5 3.3 4.8 3.8 2.4 2122 Government consumption
expenditures and gross investment -3.1 -2.1 -2.4 -0.9 1.9 1.8 0.7 1.7 -3.4 -2.1 -2.4 0.3 2.3 1.5 0.8 1.5 2223 Federal -2.6 -1.9 -5.5 -2.6 -0.1 0.4 0.8 2.9 -3.5 -2.6 -6.1 -1.1 1.1 0.1 1.7 2.7 2324 National defense -2.1 -3.4 -6.7 -4.1 -2.1 -0.6 0.7 3.3 -3.6 -4.7 -6.5 -3.4 -0.4 -0.8 1.9 4.0 2425 Nondefense -3.4 0.9 -3.5 -0.1 3.1 2.0 0.8 2.4 -3.2 1.2 -5.5 2.7 3.4 1.5 1.4 0.7 2526 State and local -3.5 -2.2 -0.3 0.2 3.2 2.6 0.6 1.0 -3.3 -1.7 0.2 1.2 3.0 2.3 0.4 0.9 26
Addenda:27 Gross domestic income (GDI) 1 2.3 3.4 1.3 3.2 2.7 0.8 2.1 2.5 2.1 2.9 1.5 4.2 1.3 0.9 2.5 2.3 2728 Average of GDP and GDI 1.9 2.8 1.6 2.9 2.8 1.2 2.2 2.7 1.9 2.2 2.1 3.5 1.6 1.5 2.6 2.4 2829 Final sales of domestic product 1.6 2.1 1.6 2.7 2.6 2.2 2.3 2.8 1.4 1.9 2.0 3.2 1.8 2.2 2.9 2.2 2930 Gross domestic purchases 1.5 2.2 1.6 2.7 3.6 1.9 2.6 3.1 1.6 1.2 2.2 3.4 2.5 2.3 2.9 2.9 3031 Final sales to domestic purchasers 1.6 2.0 1.3 2.8 3.3 2.4 2.5 3.0 1.4 1.7 1.7 3.7 2.5 2.6 2.9 2.6 3132 Final sales to private domestic purchasers 2.8 3.0 2.2 3.7 3.6 2.6 2.9 3.3 2.6 2.6 2.6 4.5 2.5 2.8 3.4 2.8 3233 Gross national product 1.8 2.2 1.8 2.5 2.8 1.6 2.5 3.0 1.9 1.2 2.6 2.8 1.9 2.1 2.8 2.4 3334 Real disposable personal income 2.3 3.3 -1.3 4.1 4.1 1.8 2.9 4.0 1.6 4.9 -2.5 5.3 3.0 1.6 3.4 3.9 34
Price indexes:35 Gross domestic purchases 2.4 1.8 1.5 1.6 0.3 0.7 1.9 2.4 2.4 1.8 1.5 1.3 0.1 1.3 2.0 2.2 3536 Gross domestic purchases excluding
food and energy 2 1.8 1.8 1.6 1.7 1.0 1.1 1.8 2.3 1.9 1.8 1.7 1.5 0.8 1.4 1.9 2.3 3637 GDP 2.1 1.9 1.8 1.8 1.0 1.0 1.9 2.4 2.0 2.1 1.8 1.5 0.9 1.5 2.0 2.3 37
38 GDP excluding food and energy 2 1.9 1.9 1.9 1.9 1.2 1.3 1.9 2.5 2.0 2.0 2.1 1.6 1.0 1.7 2.0 2.5 3839 PCE 2.5 1.9 1.3 1.5 0.2 1.0 1.8 2.1 2.7 1.8 1.2 1.1 0.3 1.5 1.8 1.9 39
40 PCE excluding food and energy 2 1.6 1.9 1.5 1.6 1.2 1.6 1.6 1.9 1.9 1.8 1.6 1.5 1.2 1.8 1.7 1.9 40
41 Market-based PCE 3 2.5 1.8 1.0 1.1 -0.1 0.7 1.5 1.8 2.8 1.5 0.8 0.7 0.0 1.2 1.5 1.7 4142 Market-based PCE excluding food and
energy 2,3 1.4 1.8 1.2 1.1 1.0 1.3 1.3 1.6 1.9 1.5 1.1 1.1 1.1 1.4 1.2 1.7 42
2. Food excludes personal consumption expenditures for purchased meals and beverages, which are classified in food services.3. This index is a supplemental measure that is based on household expenditures for which there are observable price measures. It excludes most implicit prices (for example, financial services furnished without payment) and the final consumption expenditures of nonprofit institutions serving households.Note. Estimates under the Percent change from the preceding year columns are calculated from annual data. Estimates under the Percent change fourth quarter to fourth quarter columns are calculated from fourth quarter values relative to the same quarter one year prior.Source: U.S. Bureau of Economic Analysis
Percent change from preceding yearPercent change from fourth quarter to
fourth quarter one year ago Line
December 20, 2019
Table 5. Real Gross Domestic Product: Annual Percent Change
Line
1. Gross domestic income deflated by the implicit price deflator for gross domestic product.
- 13 -
2015
Q4 Q1 Q2 Q3 Q4 Q1 Q2 Q3 Q4 Q1 Q2 Q3 Q4 Q1 Q2 Q3 r
1 Gross domestic product (GDP) 1.9 1.6 1.3 1.6 2.0 2.1 2.2 2.4 2.8 2.9 3.2 3.1 2.5 2.7 2.3 2.1 12 Personal consumption expenditures (PCE) 2.9 2.8 2.7 2.6 2.8 2.6 2.5 2.4 2.9 2.8 3.2 3.4 2.6 2.5 2.6 2.6 23 Goods 3.7 3.7 3.7 3.5 3.6 3.4 3.6 3.7 5.0 4.5 4.5 4.4 2.9 3.0 3.8 4.2 34 Durable goods 5.8 5.5 5.1 6.4 7.3 6.7 6.9 6.2 7.7 7.4 7.5 6.4 3.8 3.2 4.4 5.5 45 Nondurable goods 2.8 2.7 3.0 2.1 1.8 1.7 2.0 2.4 3.7 3.1 3.0 3.4 2.5 2.9 3.5 3.5 56 Services 2.5 2.4 2.3 2.2 2.4 2.2 1.9 1.9 2.0 2.0 2.6 3.0 2.5 2.3 2.1 1.8 67 Gross private domestic investment 1.5 -2.0 -2.5 -2.2 1.5 2.8 4.2 5.9 4.8 5.5 4.1 5.5 5.1 5.1 3.9 0.4 78 Fixed investment 1.0 1.6 1.6 1.7 2.8 4.0 4.1 3.5 5.1 4.6 5.2 5.0 3.5 2.9 1.3 0.9 89 Nonresidential -0.9 -0.7 0.0 1.1 2.4 4.2 4.3 3.5 5.4 6.0 6.9 6.8 5.9 4.8 2.6 1.4 910 Structures -10.9 -11.5 -9.7 -2.1 4.3 9.4 7.3 0.9 1.5 2.6 4.8 6.4 2.6 0.7 -4.8 -6.7 1011 Equipment 1.9 0.0 -0.9 -2.7 -1.4 1.1 3.9 5.4 8.5 8.6 7.2 6.4 5.0 3.3 2.7 1.0 1112 Intellectual property products 2.9 6.8 9.1 9.2 6.6 5.0 2.8 2.8 4.0 4.8 7.8 7.5 9.3 9.6 7.5 7.7 1213 Residential 9.1 10.8 7.5 4.0 3.9 3.3 3.2 3.3 4.2 -0.1 -0.4 -0.9 -4.4 -3.4 -3.2 -1.1 1314 Change in private inventories ......... ......... ......... ......... ......... ......... ......... ......... ......... ......... ......... ......... ......... ......... ......... ......... 1415 Net exports of goods and services ......... ......... ......... ......... ......... ......... ......... ......... ......... ......... ......... ......... ......... ......... ......... ......... 1516 Exports -1.5 -1.2 -1.2 1.3 1.1 3.3 2.7 2.3 5.5 4.1 5.2 2.4 0.4 1.2 -1.7 0.2 1617 Goods -3.1 -0.5 -1.3 1.6 2.5 3.7 3.6 2.3 5.9 4.7 7.1 4.0 1.4 2.2 -2.1 0.8 1718 Services 1.6 -2.6 -0.9 0.7 -1.6 2.6 1.2 2.3 4.8 3.2 1.7 -0.5 -1.6 -0.7 -0.7 -1.0 1819 Imports 3.2 1.7 1.2 1.6 3.4 4.2 4.9 4.1 5.6 4.7 3.9 5.7 3.2 2.6 2.6 0.9 1920 Goods 3.2 1.1 0.6 0.9 3.1 4.2 4.8 4.1 6.0 5.3 4.7 6.7 3.4 2.3 2.1 0.1 2021 Services 3.3 4.5 3.9 4.4 4.8 4.4 5.5 4.0 3.8 2.1 0.6 1.4 2.4 4.3 4.7 4.3 2122 Government consumption
expenditures and gross investment 2.3 2.7 1.6 1.5 1.5 0.5 1.0 0.5 0.8 1.4 1.7 2.2 1.5 1.8 2.3 2.2 2223 Federal 1.1 1.0 0.1 0.6 0.1 -0.4 1.1 0.7 1.7 2.7 2.8 3.6 2.7 2.5 3.6 3.7 2324 National defense -0.4 -0.1 -1.6 0.1 -0.8 -1.2 1.8 0.5 1.9 2.5 2.7 3.9 4.0 5.8 4.8 4.6 2425 Nondefense 3.4 2.6 2.5 1.3 1.5 0.9 0.2 0.9 1.4 2.9 3.0 3.1 0.7 -2.1 1.9 2.4 2526 State and local 3.0 3.8 2.5 2.0 2.3 0.9 0.9 0.4 0.4 0.6 1.0 1.5 0.9 1.3 1.6 1.4 26
Addenda:27 Gross domestic income (GDI) 1 1.3 1.2 0.5 0.8 0.9 1.3 2.5 2.2 2.5 2.7 2.2 2.8 2.3 2.0 2.0 1.8 2728 Average of GDP and GDI 1.6 1.4 0.9 1.2 1.5 1.7 2.3 2.3 2.6 2.8 2.7 3.0 2.4 2.3 2.2 1.9 2829 Final sales of domestic product 1.8 2.3 2.1 2.2 2.2 2.3 2.1 2.0 2.9 2.7 3.4 3.0 2.2 2.3 1.8 2.2 2930 Gross domestic purchases 2.5 2.0 1.6 1.6 2.3 2.3 2.5 2.7 2.9 3.0 3.1 3.6 2.9 2.8 2.8 2.1 3031 Final sales to domestic purchasers 2.5 2.6 2.3 2.3 2.6 2.5 2.5 2.3 2.9 2.8 3.2 3.5 2.6 2.5 2.4 2.2 3132 Final sales to private domestic purchasers 2.5 2.6 2.5 2.4 2.8 2.9 2.8 2.6 3.4 3.1 3.6 3.8 2.8 2.6 2.4 2.2 3233 Gross national product 1.9 1.4 1.3 1.5 2.1 2.2 2.1 2.7 2.8 3.1 3.4 3.2 2.4 2.5 2.4 2.2 3334 Real disposable personal income 3.0 2.5 1.6 1.3 1.6 2.2 2.9 3.1 3.4 3.9 3.9 4.1 3.9 3.3 3.0 2.9 34
Price indexes:35 Gross domestic purchases 0.1 0.4 0.5 0.7 1.3 2.0 1.7 1.8 2.0 2.2 2.5 2.5 2.2 1.7 1.6 1.5 3536 Gross domestic purchases excluding
food and energy 2 0.8 0.8 0.9 1.1 1.4 1.8 1.7 1.8 1.9 2.1 2.4 2.4 2.3 1.9 1.7 1.7 3637 GDP 0.9 0.8 0.9 0.9 1.5 2.0 1.7 1.9 2.0 2.1 2.6 2.5 2.3 2.0 1.8 1.7 3738 GDP excluding food and energy 2 1.0 1.1 1.2 1.3 1.7 2.1 1.8 1.9 2.0 2.2 2.6 2.6 2.5 2.1 2.0 1.9 3839 PCE 0.3 0.7 0.8 1.0 1.5 2.0 1.6 1.6 1.8 1.9 2.3 2.2 1.9 1.4 1.4 1.4 3940 PCE excluding food and energy 2 1.2 1.4 1.5 1.7 1.8 1.8 1.6 1.5 1.7 1.8 2.0 2.0 1.9 1.6 1.6 1.7 4041 Market-based PCE 3 0.0 0.5 0.5 0.6 1.2 1.8 1.3 1.3 1.5 1.5 2.0 2.0 1.7 1.3 1.3 1.3 4142 Market-based PCE excluding food and
energy 2,3 1.1 1.3 1.3 1.4 1.4 1.5 1.2 1.1 1.2 1.3 1.7 1.7 1.7 1.6 1.5 1.6 42
2. Food excludes personal consumption expenditures for purchased meals and beverages, which are classified in food services.3. This index is a supplemental measure that is based on household expenditures for which there are observable price measures. It excludes most implicit prices (for example, financial services furnished without payment) and the final consumption expenditures of nonprofit institutions serving households.Source: U.S. Bureau of Economic Analysis
2016 2017 2018 2019Line
December 20, 2019
Table 6. Real Gross Domestic Product: Percent Change From Quarter One Year Ago
Line
r Revised
1. Gross domestic income deflated by the implicit price deflator for gross domestic product.
- 14 -
Q3 Q4 Q1 Q2 Q3 r
1 Gross domestic product (GDP) 18,715.0 19,519.4 20,580.2 20,749.8 20,897.8 21,098.8 21,340.3 21,542.5 12 Plus: Income receipts from the rest of the world 861.7 957.9 1,106.2 1,116.0 1,127.0 1,149.0 1,177.2 1,160.4 23 Less: Income payments to the rest of the world 643.5 714.6 838.3 843.6 874.4 891.2 876.2 851.4 34 Equals: Gross national product 18,933.2 19,762.7 20,848.1 21,022.1 21,150.4 21,356.7 21,641.3 21,851.5 45 Less: Consumption of fixed capital 2,991.6 3,121.4 3,291.4 3,315.8 3,358.1 3,402.2 3,446.5 3,485.9 56 Less: Statistical discrepancy -112.0 -67.6 10.8 32.9 49.2 42.1 102.5 102.1 67 Equals: National income 16,053.6 16,708.8 17,545.9 17,673.5 17,743.1 17,912.4 18,092.3 18,263.5 78 Compensation of employees 9,960.3 10,411.6 10,928.5 10,994.3 11,057.4 11,306.6 11,386.9 11,489.0 89 Wages and salaries 8,083.5 8,462.1 8,888.5 8,942.2 8,990.0 9,211.5 9,273.6 9,354.0 910 Supplements to wages and salaries 1,876.8 1,949.5 2,040.0 2,052.0 2,067.4 2,095.1 2,113.3 2,135.1 1011 Proprietors' income with inventory valuation and capital
consumption adjustments 1,423.7 1,518.2 1,588.8 1,590.0 1,624.4 1,621.2 1,632.9 1,683.4 1112 Rental income of persons with capital consumption
adjustment 681.4 718.8 756.8 765.2 764.1 767.0 777.2 779.7 1213 Corporate profits with inventory valuation and capital
consumption adjustments 2,011.5 2,005.9 2,074.6 2,104.2 2,085.6 2,006.9 2,082.7 2,078.0 1314 Net interest and miscellaneous payments 560.0 608.0 672.6 677.0 668.4 657.2 644.7 636.4 1415 Taxes on production and imports less subsidies 1,251.0 1,303.3 1,377.4 1,383.9 1,393.9 1,399.8 1,417.4 1,425.1 1516 Business current transfer payments (net) 168.2 145.4 153.7 166.1 159.2 165.4 163.3 184.6 1617 Current surplus of government enterprises -2.6 -2.5 -6.5 -7.3 -9.9 -11.5 -12.9 -12.6 17
Addenda:18 Gross domestic income (GDI) 18,827.0 19,587.0 20,569.4 20,716.9 20,848.6 21,056.7 21,237.8 21,440.4 1819 Average of GDP and GDI 18,771.0 19,553.2 20,574.8 20,733.3 20,873.2 21,077.8 21,289.0 21,491.5 1920 Statistical discrepancy as a percentage of GDP -0.6 -0.3 0.1 0.2 0.2 0.2 0.5 0.5 20
December 20, 2019
Table 7. Relation of Gross Domestic Product, Gross National Product, and National Income
r Revised
Source: U.S. Bureau of Economic Analysis
[Billions of dollars]
Line 2016 2017 2018
Seasonally adjusted at annual rates2018 2019 Line
- 15 -
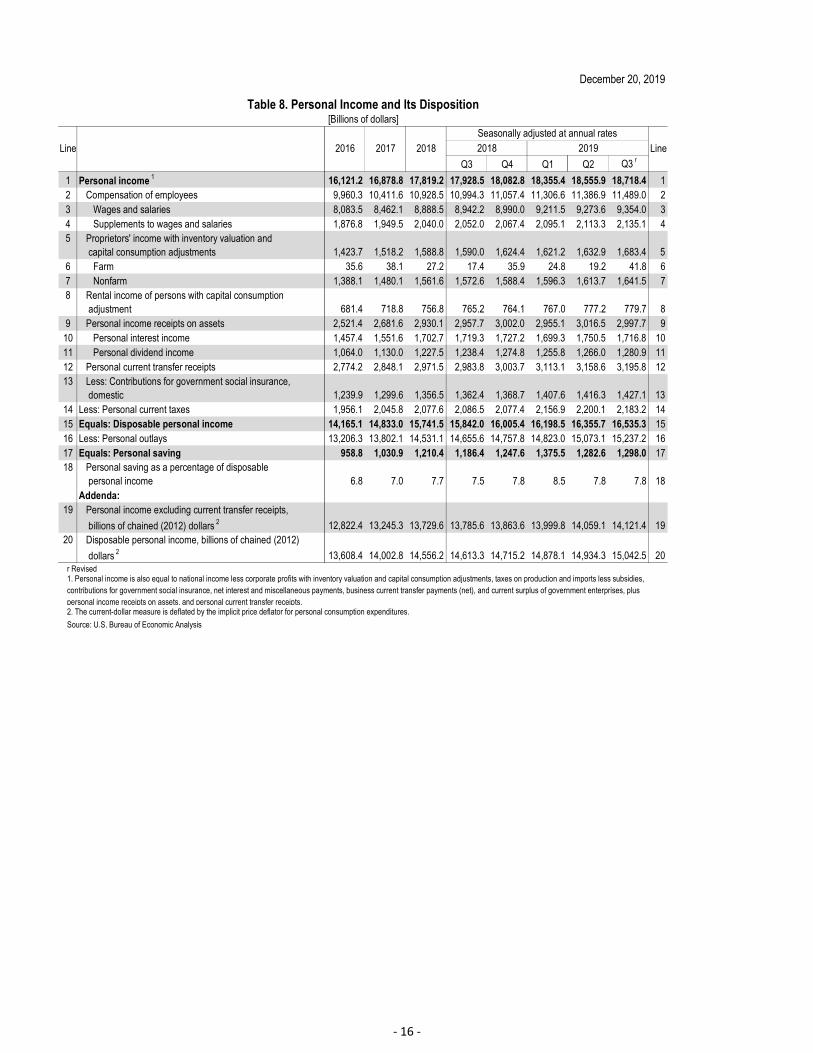
Q3 Q4 Q1 Q2 Q3 r
1 Personal income 1 16,121.2 16,878.8 17,819.2 17,928.5 18,082.8 18,355.4 18,555.9 18,718.4 12 Compensation of employees 9,960.3 10,411.6 10,928.5 10,994.3 11,057.4 11,306.6 11,386.9 11,489.0 23 Wages and salaries 8,083.5 8,462.1 8,888.5 8,942.2 8,990.0 9,211.5 9,273.6 9,354.0 34 Supplements to wages and salaries 1,876.8 1,949.5 2,040.0 2,052.0 2,067.4 2,095.1 2,113.3 2,135.1 45 Proprietors' income with inventory valuation and
capital consumption adjustments 1,423.7 1,518.2 1,588.8 1,590.0 1,624.4 1,621.2 1,632.9 1,683.4 56 Farm 35.6 38.1 27.2 17.4 35.9 24.8 19.2 41.8 67 Nonfarm 1,388.1 1,480.1 1,561.6 1,572.6 1,588.4 1,596.3 1,613.7 1,641.5 78 Rental income of persons with capital consumption
adjustment 681.4 718.8 756.8 765.2 764.1 767.0 777.2 779.7 89 Personal income receipts on assets 2,521.4 2,681.6 2,930.1 2,957.7 3,002.0 2,955.1 3,016.5 2,997.7 910 Personal interest income 1,457.4 1,551.6 1,702.7 1,719.3 1,727.2 1,699.3 1,750.5 1,716.8 1011 Personal dividend income 1,064.0 1,130.0 1,227.5 1,238.4 1,274.8 1,255.8 1,266.0 1,280.9 1112 Personal current transfer receipts 2,774.2 2,848.1 2,971.5 2,983.8 3,003.7 3,113.1 3,158.6 3,195.8 1213 Less: Contributions for government social insurance,
domestic 1,239.9 1,299.6 1,356.5 1,362.4 1,368.7 1,407.6 1,416.3 1,427.1 1314 Less: Personal current taxes 1,956.1 2,045.8 2,077.6 2,086.5 2,077.4 2,156.9 2,200.1 2,183.2 1415 Equals: Disposable personal income 14,165.1 14,833.0 15,741.5 15,842.0 16,005.4 16,198.5 16,355.7 16,535.3 1516 Less: Personal outlays 13,206.3 13,802.1 14,531.1 14,655.6 14,757.8 14,823.0 15,073.1 15,237.2 1617 Equals: Personal saving 958.8 1,030.9 1,210.4 1,186.4 1,247.6 1,375.5 1,282.6 1,298.0 1718 Personal saving as a percentage of disposable
personal income 6.8 7.0 7.7 7.5 7.8 8.5 7.8 7.8 18Addenda:
19 Personal income excluding current transfer receipts,
billions of chained (2012) dollars 2 12,822.4 13,245.3 13,729.6 13,785.6 13,863.6 13,999.8 14,059.1 14,121.4 1920 Disposable personal income, billions of chained (2012)
dollars 2 13,608.4 14,002.8 14,556.2 14,613.3 14,715.2 14,878.1 14,934.3 15,042.5 20
2. The current-dollar measure is deflated by the implicit price deflator for personal consumption expenditures.
Source: U.S. Bureau of Economic Analysis
Line 2016 2017 2018
Seasonally adjusted at annual rates2018 2019 Line
December 20, 2019
Table 8. Personal Income and Its Disposition
r Revised1. Personal income is also equal to national income less corporate profits with inventory valuation and capital consumption adjustments, taxes on production and imports less subsidies, contributions for government social insurance, net interest and miscellaneous payments, business current transfer payments (net), and current surplus of government enterprises, plus personal income receipts on assets, and personal current transfer receipts.
[Billions of dollars]
- 16 -

Quarter one year
ago2018 2019
Q3 Q4 Q1 Q2 Q3 rQ4 Q1 Q2 Q3 r Q3 r
1 Corporate profits with inventory valuation and capital consumption adjustments 2,011.5 2,005.9 2,074.6 2,104.2 2,085.6 2,006.9 2,082.7 2,078.0 -0.3 3.4 -0.9 -3.8 3.8 -0.2 -1.2 1
2 Less: Taxes on corporate income 377.6 319.4 219.8 230.3 218.5 215.4 225.2 209.3 -15.4 -31.2 -5.1 -1.4 4.5 -7.0 -9.1 23 Equals: Profits after tax with
inventory valuation and capital consumption adjustments 1,633.9 1,686.5 1,854.9 1,873.9 1,867.1 1,791.4 1,857.5 1,868.7 3.2 10.0 -0.4 -4.1 3.7 0.6 -0.3 3
4 Net dividends 1,175.9 1,239.6 1,312.6 1,329.7 1,362.5 1,324.6 1,346.9 1,339.6 5.4 5.9 2.5 -2.8 1.7 -0.5 0.7 45 Undistributed profits with inventory
valuation and capital consumption adjustments 458.0 446.9 542.3 544.2 504.6 466.8 510.7 529.1 -2.4 21.3 -7.3 -7.5 9.4 3.6 -2.8 5
Addenda for corporate cash flow:6 Net cash flow with inventory
valuation adjustment 2,084.1 1,856.6 2,327.6 2,340.1 2,308.0 2,331.2 2,404.1 2,444.1 -10.9 25.4 -1.4 1.0 3.1 1.7 4.4 67 Undistributed profits with inventory
valuation and capital consumption adjustments 458.0 446.9 542.3 544.2 504.6 466.8 510.7 529.1 -2.4 21.3 -7.3 -7.5 9.4 3.6 -2.8 7
8 Consumption of fixed capital 1,630.6 1,704.0 1,796.3 1,809.6 1,835.6 1,863.9 1,892.9 1,914.5 4.5 5.4 1.4 1.5 1.6 1.1 5.8 8
9 Less: Capital transfers paid (net) 4.4 294.2 11.0 13.8 32.2 -0.6 -0.6 -0.5 .......... .......... .......... .......... .......... .......... ............... 9
Addenda:10 Profits before tax (without inventory
valuation and capital consumption adjustments) 2,117.4 2,133.0 2,063.5 2,087.1 2,046.5 2,015.5 2,084.9 2,046.0 0.7 -3.3 -1.9 -1.5 3.4 -1.9 -2.0 10
11 Profits after tax (without inventory valuation and capital consumption adjustments) 1,739.8 1,813.6 1,843.7 1,856.8 1,828.1 1,800.0 1,859.7 1,836.6 4.2 1.7 -1.5 -1.5 3.3 -1.2 -1.1 11
12 Inventory valuation adjustment -0.9 -48.9 -51.5 -42.1 -15.2 -15.5 -4.4 27.9 .......... .......... .......... .......... .......... .......... ............... 12
13 Capital consumption adjustment -105.0 -78.1 62.7 59.2 54.3 6.9 2.2 4.1 .......... .......... .......... .......... .......... .......... ............... 13
Quarterly rates
2019
Line
December 20, 2019
Table 9. Corporate Profits: Level and Percent Change
r Revised
Source: U.S. Bureau of Economic Analysis
Line
Billions of dollars
2016 2017 2018
Seasonally adjusted at annual rates
2018 2019
Percent change from preceding period
2017 2018
- 17 -
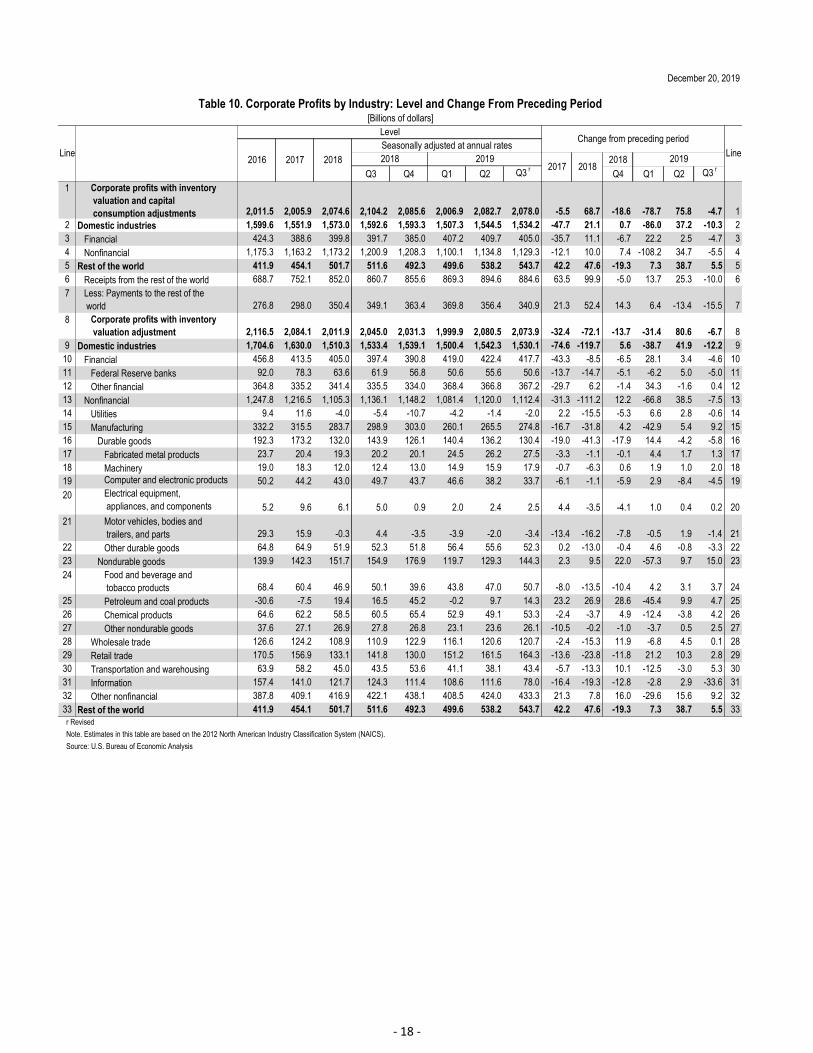
2018
Q3 Q4 Q1 Q2 Q3 rQ4 Q1 Q2 Q3 r
1 Corporate profits with inventory valuation and capital consumption adjustments 2,011.5 2,005.9 2,074.6 2,104.2 2,085.6 2,006.9 2,082.7 2,078.0 -5.5 68.7 -18.6 -78.7 75.8 -4.7 1
2 Domestic industries 1,599.6 1,551.9 1,573.0 1,592.6 1,593.3 1,507.3 1,544.5 1,534.2 -47.7 21.1 0.7 -86.0 37.2 -10.3 23 Financial 424.3 388.6 399.8 391.7 385.0 407.2 409.7 405.0 -35.7 11.1 -6.7 22.2 2.5 -4.7 34 Nonfinancial 1,175.3 1,163.2 1,173.2 1,200.9 1,208.3 1,100.1 1,134.8 1,129.3 -12.1 10.0 7.4 -108.2 34.7 -5.5 45 Rest of the world 411.9 454.1 501.7 511.6 492.3 499.6 538.2 543.7 42.2 47.6 -19.3 7.3 38.7 5.5 56 Receipts from the rest of the world 688.7 752.1 852.0 860.7 855.6 869.3 894.6 884.6 63.5 99.9 -5.0 13.7 25.3 -10.0 67 Less: Payments to the rest of the
world 276.8 298.0 350.4 349.1 363.4 369.8 356.4 340.9 21.3 52.4 14.3 6.4 -13.4 -15.5 78 Corporate profits with inventory
valuation adjustment 2,116.5 2,084.1 2,011.9 2,045.0 2,031.3 1,999.9 2,080.5 2,073.9 -32.4 -72.1 -13.7 -31.4 80.6 -6.7 89 Domestic industries 1,704.6 1,630.0 1,510.3 1,533.4 1,539.1 1,500.4 1,542.3 1,530.1 -74.6 -119.7 5.6 -38.7 41.9 -12.2 910 Financial 456.8 413.5 405.0 397.4 390.8 419.0 422.4 417.7 -43.3 -8.5 -6.5 28.1 3.4 -4.6 1011 Federal Reserve banks 92.0 78.3 63.6 61.9 56.8 50.6 55.6 50.6 -13.7 -14.7 -5.1 -6.2 5.0 -5.0 1112 Other financial 364.8 335.2 341.4 335.5 334.0 368.4 366.8 367.2 -29.7 6.2 -1.4 34.3 -1.6 0.4 1213 Nonfinancial 1,247.8 1,216.5 1,105.3 1,136.1 1,148.2 1,081.4 1,120.0 1,112.4 -31.3 -111.2 12.2 -66.8 38.5 -7.5 1314 Utilities 9.4 11.6 -4.0 -5.4 -10.7 -4.2 -1.4 -2.0 2.2 -15.5 -5.3 6.6 2.8 -0.6 1415 Manufacturing 332.2 315.5 283.7 298.9 303.0 260.1 265.5 274.8 -16.7 -31.8 4.2 -42.9 5.4 9.2 1516 Durable goods 192.3 173.2 132.0 143.9 126.1 140.4 136.2 130.4 -19.0 -41.3 -17.9 14.4 -4.2 -5.8 1617 Fabricated metal products 23.7 20.4 19.3 20.2 20.1 24.5 26.2 27.5 -3.3 -1.1 -0.1 4.4 1.7 1.3 1718 Machinery 19.0 18.3 12.0 12.4 13.0 14.9 15.9 17.9 -0.7 -6.3 0.6 1.9 1.0 2.0 1819 Computer and electronic products 50.2 44.2 43.0 49.7 43.7 46.6 38.2 33.7 -6.1 -1.1 -5.9 2.9 -8.4 -4.5 1920 Electrical equipment,
appliances, and components 5.2 9.6 6.1 5.0 0.9 2.0 2.4 2.5 4.4 -3.5 -4.1 1.0 0.4 0.2 2021 Motor vehicles, bodies and
trailers, and parts 29.3 15.9 -0.3 4.4 -3.5 -3.9 -2.0 -3.4 -13.4 -16.2 -7.8 -0.5 1.9 -1.4 2122 Other durable goods 64.8 64.9 51.9 52.3 51.8 56.4 55.6 52.3 0.2 -13.0 -0.4 4.6 -0.8 -3.3 2223 Nondurable goods 139.9 142.3 151.7 154.9 176.9 119.7 129.3 144.3 2.3 9.5 22.0 -57.3 9.7 15.0 2324 Food and beverage and
tobacco products 68.4 60.4 46.9 50.1 39.6 43.8 47.0 50.7 -8.0 -13.5 -10.4 4.2 3.1 3.7 2425 Petroleum and coal products -30.6 -7.5 19.4 16.5 45.2 -0.2 9.7 14.3 23.2 26.9 28.6 -45.4 9.9 4.7 2526 Chemical products 64.6 62.2 58.5 60.5 65.4 52.9 49.1 53.3 -2.4 -3.7 4.9 -12.4 -3.8 4.2 2627 Other nondurable goods 37.6 27.1 26.9 27.8 26.8 23.1 23.6 26.1 -10.5 -0.2 -1.0 -3.7 0.5 2.5 2728 Wholesale trade 126.6 124.2 108.9 110.9 122.9 116.1 120.6 120.7 -2.4 -15.3 11.9 -6.8 4.5 0.1 2829 Retail trade 170.5 156.9 133.1 141.8 130.0 151.2 161.5 164.3 -13.6 -23.8 -11.8 21.2 10.3 2.8 2930 Transportation and warehousing 63.9 58.2 45.0 43.5 53.6 41.1 38.1 43.4 -5.7 -13.3 10.1 -12.5 -3.0 5.3 3031 Information 157.4 141.0 121.7 124.3 111.4 108.6 111.6 78.0 -16.4 -19.3 -12.8 -2.8 2.9 -33.6 3132 Other nonfinancial 387.8 409.1 416.9 422.1 438.1 408.5 424.0 433.3 21.3 7.8 16.0 -29.6 15.6 9.2 3233 Rest of the world 411.9 454.1 501.7 511.6 492.3 499.6 538.2 543.7 42.2 47.6 -19.3 7.3 38.7 5.5 33
Note. Estimates in this table are based on the 2012 North American Industry Classification System (NAICS).
Source: U.S. Bureau of Economic Analysis
Level
2016 2017 2018
Seasonally adjusted at annual rates2018 2019
Change from preceding period
2017 20182019
Line
December 20, 2019
Table 10. Corporate Profits by Industry: Level and Change From Preceding Period[Billions of dollars]
Line
r Revised
- 18 -
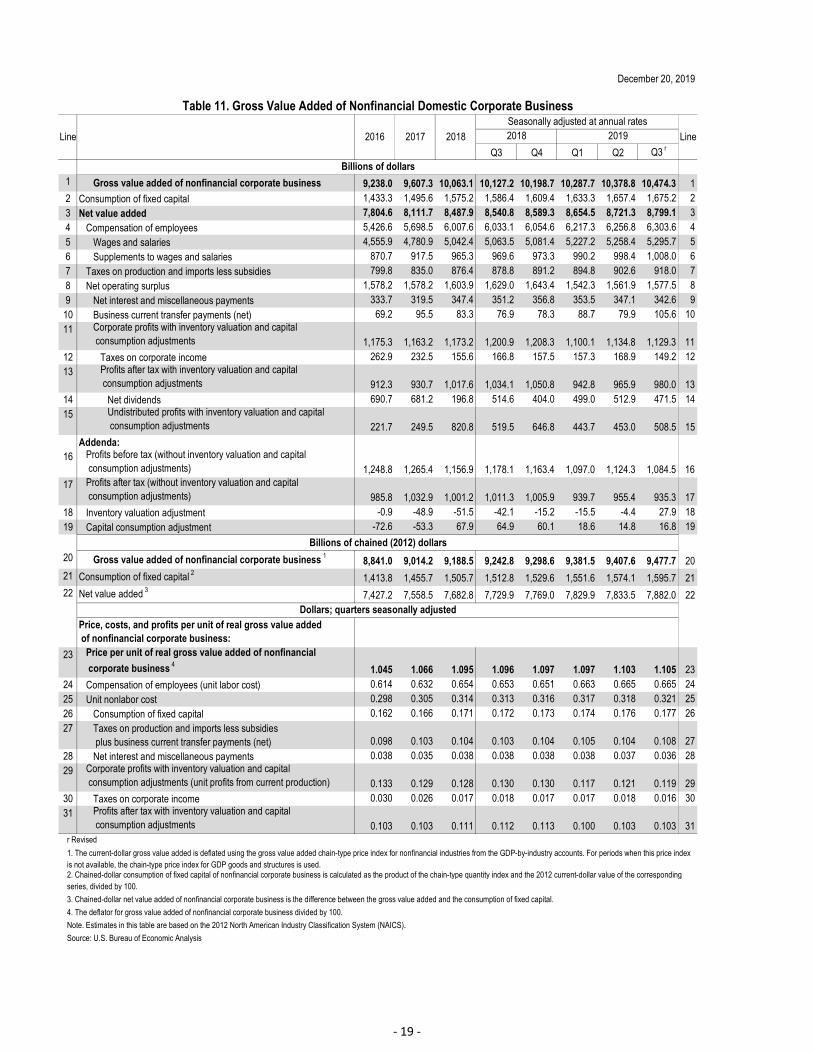
Q3 Q4 Q1 Q2 Q3 r
1 Gross value added of nonfinancial corporate business 9,238.0 9,607.3 10,063.1 10,127.2 10,198.7 10,287.7 10,378.8 10,474.3 12 Consumption of fixed capital 1,433.3 1,495.6 1,575.2 1,586.4 1,609.4 1,633.3 1,657.4 1,675.2 23 Net value added 7,804.6 8,111.7 8,487.9 8,540.8 8,589.3 8,654.5 8,721.3 8,799.1 34 Compensation of employees 5,426.6 5,698.5 6,007.6 6,033.1 6,054.6 6,217.3 6,256.8 6,303.6 45 Wages and salaries 4,555.9 4,780.9 5,042.4 5,063.5 5,081.4 5,227.2 5,258.4 5,295.7 56 Supplements to wages and salaries 870.7 917.5 965.3 969.6 973.3 990.2 998.4 1,008.0 67 Taxes on production and imports less subsidies 799.8 835.0 876.4 878.8 891.2 894.8 902.6 918.0 78 Net operating surplus 1,578.2 1,578.2 1,603.9 1,629.0 1,643.4 1,542.3 1,561.9 1,577.5 89 Net interest and miscellaneous payments 333.7 319.5 347.4 351.2 356.8 353.5 347.1 342.6 910 Business current transfer payments (net) 69.2 95.5 83.3 76.9 78.3 88.7 79.9 105.6 1011 Corporate profits with inventory valuation and capital
consumption adjustments 1,175.3 1,163.2 1,173.2 1,200.9 1,208.3 1,100.1 1,134.8 1,129.3 1112 Taxes on corporate income 262.9 232.5 155.6 166.8 157.5 157.3 168.9 149.2 1213 Profits after tax with inventory valuation and capital
consumption adjustments 912.3 930.7 1,017.6 1,034.1 1,050.8 942.8 965.9 980.0 1314 Net dividends 690.7 681.2 196.8 514.6 404.0 499.0 512.9 471.5 1415 Undistributed profits with inventory valuation and capital
consumption adjustments 221.7 249.5 820.8 519.5 646.8 443.7 453.0 508.5 15
Addenda:16 Profits before tax (without inventory valuation and capital
consumption adjustments) 1,248.8 1,265.4 1,156.9 1,178.1 1,163.4 1,097.0 1,124.3 1,084.5 1617 Profits after tax (without inventory valuation and capital
consumption adjustments) 985.8 1,032.9 1,001.2 1,011.3 1,005.9 939.7 955.4 935.3 1718 Inventory valuation adjustment -0.9 -48.9 -51.5 -42.1 -15.2 -15.5 -4.4 27.9 1819 Capital consumption adjustment -72.6 -53.3 67.9 64.9 60.1 18.6 14.8 16.8 19
20 Gross value added of nonfinancial corporate business 18,841.0 9,014.2 9,188.5 9,242.8 9,298.6 9,381.5 9,407.6 9,477.7 20
21 Consumption of fixed capital 2 1,413.8 1,455.7 1,505.7 1,512.8 1,529.6 1,551.6 1,574.1 1,595.7 2122 Net value added 3
7,427.2 7,558.5 7,682.8 7,729.9 7,769.0 7,829.9 7,833.5 7,882.0 22
Price, costs, and profits per unit of real gross value added of nonfinancial corporate business:
23 Price per unit of real gross value added of nonfinancial
corporate business 41.045 1.066 1.095 1.096 1.097 1.097 1.103 1.105 23
24 Compensation of employees (unit labor cost) 0.614 0.632 0.654 0.653 0.651 0.663 0.665 0.665 2425 Unit nonlabor cost 0.298 0.305 0.314 0.313 0.316 0.317 0.318 0.321 2526 Consumption of fixed capital 0.162 0.166 0.171 0.172 0.173 0.174 0.176 0.177 2627 Taxes on production and imports less subsidies
plus business current transfer payments (net) 0.098 0.103 0.104 0.103 0.104 0.105 0.104 0.108 2728 Net interest and miscellaneous payments 0.038 0.035 0.038 0.038 0.038 0.038 0.037 0.036 2829 Corporate profits with inventory valuation and capital
consumption adjustments (unit profits from current production) 0.133 0.129 0.128 0.130 0.130 0.117 0.121 0.119 2930 Taxes on corporate income 0.030 0.026 0.017 0.018 0.017 0.017 0.018 0.016 3031 Profits after tax with inventory valuation and capital
consumption adjustments 0.103 0.103 0.111 0.112 0.113 0.100 0.103 0.103 31
2. Chained-dollar consumption of fixed capital of nonfinancial corporate business is calculated as the product of the chain-type quantity index and the 2012 current-dollar value of the corresponding series, divided by 100.
3. Chained-dollar net value added of nonfinancial corporate business is the difference between the gross value added and the consumption of fixed capital.
4. The deflator for gross value added of nonfinancial corporate business divided by 100.
Note. Estimates in this table are based on the 2012 North American Industry Classification System (NAICS).
Source: U.S. Bureau of Economic Analysis
December 20, 2019
Table 11. Gross Value Added of Nonfinancial Domestic Corporate Business
Line
r Revised
1. The current-dollar gross value added is deflated using the gross value added chain-type price index for nonfinancial industries from the GDP-by-industry accounts. For periods when this price index is not available, the chain-type price index for GDP goods and structures is used.
Billions of chained (2012) dollars
Dollars; quarters seasonally adjusted
Billions of dollars
2016 2017 2018
Seasonally adjusted at annual rates2018 2019 Line
- 19 -
2015
Q4 Q1 Q2 Q3 Q4 Q1 Q2 Q3 Q4 Q1 Q2 Q3 Q4 Q1 Q2 Q3 r
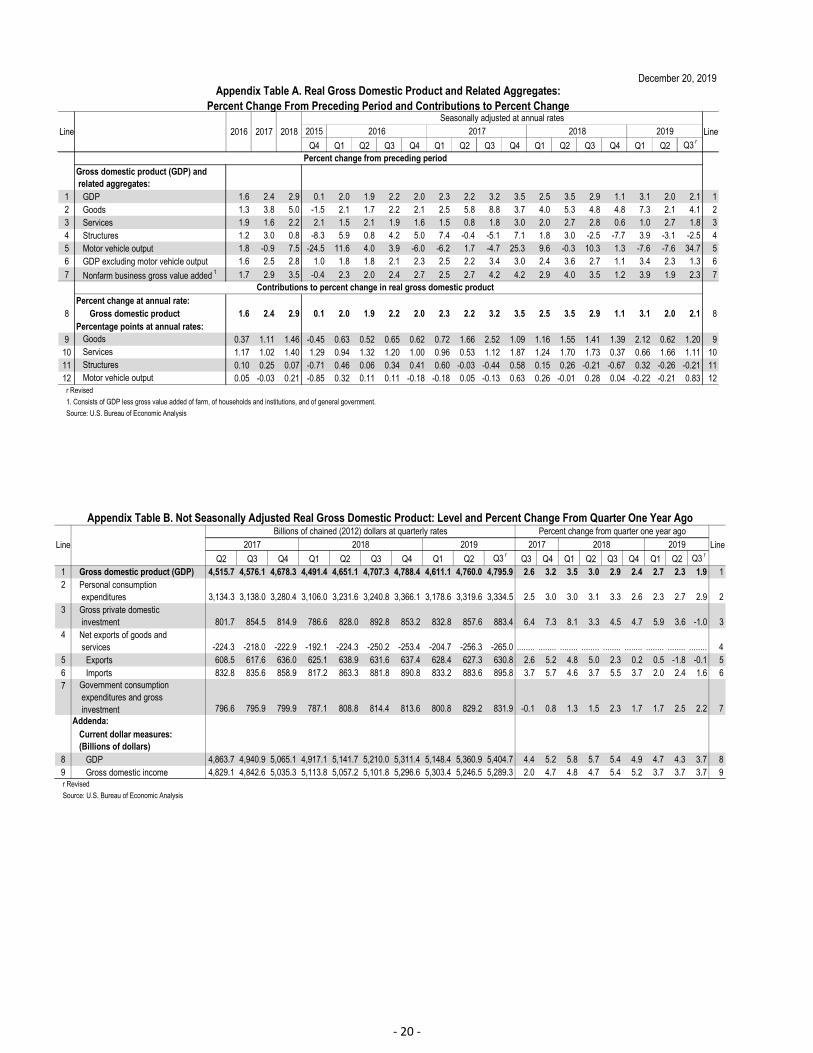
Gross domestic product (GDP) and related aggregates:
1 GDP 1.6 2.4 2.9 0.1 2.0 1.9 2.2 2.0 2.3 2.2 3.2 3.5 2.5 3.5 2.9 1.1 3.1 2.0 2.1 12 Goods 1.3 3.8 5.0 -1.5 2.1 1.7 2.2 2.1 2.5 5.8 8.8 3.7 4.0 5.3 4.8 4.8 7.3 2.1 4.1 23 Services 1.9 1.6 2.2 2.1 1.5 2.1 1.9 1.6 1.5 0.8 1.8 3.0 2.0 2.7 2.8 0.6 1.0 2.7 1.8 34 Structures 1.2 3.0 0.8 -8.3 5.9 0.8 4.2 5.0 7.4 -0.4 -5.1 7.1 1.8 3.0 -2.5 -7.7 3.9 -3.1 -2.5 45 Motor vehicle output 1.8 -0.9 7.5 -24.5 11.6 4.0 3.9 -6.0 -6.2 1.7 -4.7 25.3 9.6 -0.3 10.3 1.3 -7.6 -7.6 34.7 56 GDP excluding motor vehicle output 1.6 2.5 2.8 1.0 1.8 1.8 2.1 2.3 2.5 2.2 3.4 3.0 2.4 3.6 2.7 1.1 3.4 2.3 1.3 6
7 Nonfarm business gross value added 1 1.7 2.9 3.5 -0.4 2.3 2.0 2.4 2.7 2.5 2.7 4.2 4.2 2.9 4.0 3.5 1.2 3.9 1.9 2.3 7
Percent change at annual rate:8 Gross domestic product 1.6 2.4 2.9 0.1 2.0 1.9 2.2 2.0 2.3 2.2 3.2 3.5 2.5 3.5 2.9 1.1 3.1 2.0 2.1 8
Percentage points at annual rates:9 Goods 0.37 1.11 1.46 -0.45 0.63 0.52 0.65 0.62 0.72 1.66 2.52 1.09 1.16 1.55 1.41 1.39 2.12 0.62 1.20 9
10 Services 1.17 1.02 1.40 1.29 0.94 1.32 1.20 1.00 0.96 0.53 1.12 1.87 1.24 1.70 1.73 0.37 0.66 1.66 1.11 1011 Structures 0.10 0.25 0.07 -0.71 0.46 0.06 0.34 0.41 0.60 -0.03 -0.44 0.58 0.15 0.26 -0.21 -0.67 0.32 -0.26 -0.21 1112 Motor vehicle output 0.05 -0.03 0.21 -0.85 0.32 0.11 0.11 -0.18 -0.18 0.05 -0.13 0.63 0.26 -0.01 0.28 0.04 -0.22 -0.21 0.83 12
2019 Line
December 20, 2019Appendix Table A. Real Gross Domestic Product and Related Aggregates:
Percent Change From Preceding Period and Contributions to Percent Change
r Revised
1. Consists of GDP less gross value added of farm, of households and institutions, and of general government.
Source: U.S. Bureau of Economic Analysis
Line
Contributions to percent change in real gross domestic product
Percent change from preceding period
2016 2017 2018
Seasonally adjusted at annual rates2016 2017 2018
Q2 Q3 Q4 Q1 Q2 Q3 Q4 Q1 Q2 Q3 r Q3 Q4 Q1 Q2 Q3 Q4 Q1 Q2 Q3 r
1 Gross domestic product (GDP) 4,515.7 4,576.1 4,678.3 4,491.4 4,651.1 4,707.3 4,788.4 4,611.1 4,760.0 4,795.9 2.6 3.2 3.5 3.0 2.9 2.4 2.7 2.3 1.9 12 Personal consumption
expenditures 3,134.3 3,138.0 3,280.4 3,106.0 3,231.6 3,240.8 3,366.1 3,178.6 3,319.6 3,334.5 2.5 3.0 3.0 3.1 3.3 2.6 2.3 2.7 2.9 23 Gross private domestic
investment 801.7 854.5 814.9 786.6 828.0 892.8 853.2 832.8 857.6 883.4 6.4 7.3 8.1 3.3 4.5 4.7 5.9 3.6 -1.0 34 Net exports of goods and
services -224.3 -218.0 -222.9 -192.1 -224.3 -250.2 -253.4 -204.7 -256.3 -265.0 ........ ........ ........ ........ ........ ........ ........ ........ ........ 45 Exports 608.5 617.6 636.0 625.1 638.9 631.6 637.4 628.4 627.3 630.8 2.6 5.2 4.8 5.0 2.3 0.2 0.5 -1.8 -0.1 56 Imports 832.8 835.6 858.9 817.2 863.3 881.8 890.8 833.2 883.6 895.8 3.7 5.7 4.6 3.7 5.5 3.7 2.0 2.4 1.6 67 Government consumption
expenditures and gross investment 796.6 795.9 799.9 787.1 808.8 814.4 813.6 800.8 829.2 831.9 -0.1 0.8 1.3 1.5 2.3 1.7 1.7 2.5 2.2 7
Addenda:Current dollar measures: (Billions of dollars)
8 GDP 4,863.7 4,940.9 5,065.1 4,917.1 5,141.7 5,210.0 5,311.4 5,148.4 5,360.9 5,404.7 4.4 5.2 5.8 5.7 5.4 4.9 4.7 4.3 3.7 89 Gross domestic income 4,829.1 4,842.6 5,035.3 5,113.8 5,057.2 5,101.8 5,296.6 5,303.4 5,246.5 5,289.3 2.0 4.7 4.8 4.7 5.4 5.2 3.7 3.7 3.7 9r Revised
Source: U.S. Bureau of Economic Analysis
Appendix Table B. Not Seasonally Adjusted Real Gross Domestic Product: Level and Percent Change From Quarter One Year Ago
Line
Billions of chained (2012) dollars at quarterly rates2017 2018 2019
Percent change from quarter one year ago2017 2018 2019 Line
- 20 -