Embed Size (px)
Citation preview
Ground-source and air-source heat pump system performance at
the ASHRAE headquarters building
Jeffrey D. Spitlera*, Laura E. Southarda, Xiaobing Liub
aOklahoma State University, MAE, 218 Engineering North, Stillwater, OK 74074, USA bOak Ridge National Lab, PO Box 2008, Oak Ridge, TN 37831, USA
Abstract
When the ASHRAE headquarters building in Atlanta, Georgia was renovated in 2008, two separate heat pump
systems were installed and instrumented: – a variable refrigerant flow (VRF) air-source heat pump serving the
first floor and a ground source heat pump (GSHP) system, primarily serving the second floor. Two previous
articles by the authors have covered energy consumption of the two heat pump systems, determination of the
heating and cooling provided by both systems, and system coefficients of performance (COP) for both heating
and cooling on a monthly and annual basis for both systems. This paper focuses firstly on analysis of both
systems with the mean system COPs determined as a function of outdoor air temperature. Over a significant
part of the temperature range, system cooling COPs increase with increasing outdoor air temperature, contrary
to expectations for the heat pumps. Several reasons are identified for this trend – standby power consumption
of the heat pumps, heat pump fan power consumption for ventilation, decreased efficiency of the circulation
pump at low speeds, and heat pump startup losses. Significant changes in the GSHP system COPs due to a
change in the differential pressure setpoint used to control the circulation pump speed will also be examined.
Keywords: Heat pumps; ground-source, system coefficient of performance
1. Introduction
The ASHRAE headquarters building in Atlanta, Georgia was renovated in 2008. Two state-of-the-art heat
pump systems were installed and instrumented. The first floor (with the exception of a computer server room,
* Corresponding author. Tel.: 1-405-744-5900
E-mail address: [email protected].
Spitler, Southard, Liu/ 12th IEA Heat Pump Conference (2017) O.2.8.3
2
entry foyer, and rear stairwell) has an area of 1600 m2 and is served by variable refrigerant flow (VRF) air-source
heat pump. The second floor and rear stairwell with an area of 1445 m2 are served by a ground source heat pump
(GSHP) system. Data relating to the operation of the different HVAC systems have been collected and analyzed
for the two-year time span from July 1, 2011 through June 30, 2013 in an attempt to evaluate and compare the
performance of the systems.
The areas served by both systems are primarily office and meeting space. A larger fraction of the space on the
1st floor consists of infrequently-used meeting rooms. The measured combined average lighting and plug load
density is the same on the areas served by both systems: 4.8 W/m2. The normal occupancy density is higher on
the 2nd floor than the 1st floor. A separate dedicated outdoor air system provides semi-conditioned (i.e., cooled
and dehumidified in summer but not heated in winter) fresh air to both floors, with measured flow rates generally
being larger to the first floor. The net result of these differences along with differences in the building envelope
is that, when compared to the other floor, the 1st floor generally has higher heating loads and the 2nd floor generally
has higher cooling loads; the 2nd floor has higher total cooling and heating loads.
The VRF air-source heat pump system is of multi-split design with two outdoor heat-recovery type units with
total nominal cooling capacity of 99 kW and 22 indoor fan coil units (FCU). The indoor FCUs have a total
nominal capacity of 125 kW.
The GSHP system that serves the second floor includes 14 individual water-to-air heat pumps with total
nominal cooling capacity of 111 kW connected to a ground loop consisting of 12 122-meter deep vertical
boreholes. During the two-year study period, the maximum heat pump entering fluid temperature (EFT) was
30.3°C and the minimum EFT was 16.5°C. Given that the GSHP system was in its 4th and 5th years of operation
in a cooling dominated climate, the maximum temperature is quite satisfactory. The heat pumps have two-steps
of compressor capacity and three-speed fans with electronically commutated motors. The heat pumps are
distributed around the building and water is circulated from the ground loop to the heat pumps with a 2-pipe
building loop and a speed-controlled 3.7 kW centrifugal pump. The pump speed is controlled to maintain a
differential pressure across the heat pumps.
The two systems were well-instrumented; we used 559 data points covering air temperatures at the outlet of
each heat pump, return air temperatures, loop water temperatures, air flow rates, water flow rates, humidity
measurements, and power measurements for both systems. With some approximations, the heating and cooling
provided by both systems could be determined on a 15-minute basis along with the electrical energy consumed.
Due to a change in control boards for the VRF system, we were only able to determine the monthly heating and
cooling provided for the first nine months of the two-year period. The uncertainties in all measurements were
quantified, culminating in a monthly analysis of the heating and cooling system coefficients of performance for
both systems, shown in Figures 1 and 2.
For the July 2011-March 2012 period, the system coefficients of performance were:
GSHP Heating SCOP: 3.3±0.2
VRF Heating SCOP: 2.0±0.1
GSHP Cooling SCOP: 4.3±0.6
VRF Cooling SCOP: 2.5±0.1
The building, systems, instrumentation, analysis, and monthly results are covered in further detail in two
papers1,2 and a final report3. This paper presents more granular results, comparing performance of the two
systems versus outdoor air temperature. Then, further investigation into the GSHP system performance is
presented.
Spitler, Southard, Liu/ 12th IEA Heat Pump Conference (2017) O.2.8.3
3
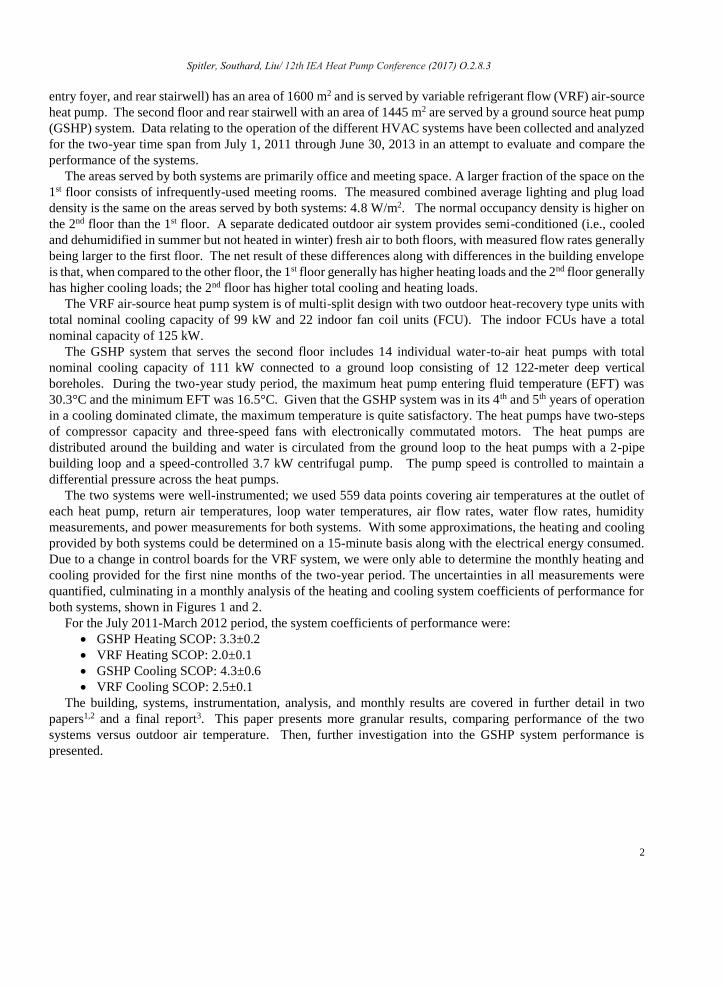
Fig. 1 Comparison of monthly system heating COP
Fig. 2 Comparison of monthly system cooling COP
2. Methodology
The two previous papers1,2 and the report3 detail the instrumentation and how the heating and cooling provided
by each system were calculated. In general, discharge air temperatures from the heat pumps and VRF indoor
units were measured; return air temperatures to each unit were either measured (GSHPs) or estimated from room
temperatures (VRF FCUs). The GSHPs have flow rates corresponding to the operation mode (compressor off
but fan running or either heating or cooling with the compressor in 1st stage or 2nd stage.) The VRF FCUs had
two-speed fans that give a low flow rate when only the fan was operating and a higher flow rate when heating or
cooling is provided. The flow rates corresponding to each operational state were measured with flow hoods; then
over the study period, the airflow could be determined based on the unit status, which was recorded. This worked
0
1
2
3
4
5
6
He
atin
g Sy
ste
m C
OP
GSHP VRF
0
1
2
3
4
5
6
Co
olin
g Sy
ste
m C
OP
GSHP VRF
Spitler, Southard, Liu/ 12th IEA Heat Pump Conference (2017) O.2.8.3
4
well until the VRF manufacturer changed the FCU control boards in April of 2012, resulting in different flow
rates. Therefore, the VRF performance is only shown through March of 2012 in Figures 1 and 2.
Latent cooling was estimated from measurements of the room humidity and, for the GSHPs, estimates of the
discharge humidity were based on detailed measurements of one of the heat pumps. For the VRF FCUs, the
discharge humidity was estimated from manufacturer’s data. However, both systems had relatively low latent
cooling loads because most of the latent loads were met by a separate dedicated outdoor air system (DOAS).
Electrical power was measured for both systems from the electrical panels – the entire VRF system was
measured with one meter and the entire GSHP system, including the central circulating pump, was measured
with a separate meter.
3. Results
3.1. System comparison
Reviewing Figures 1 and 2, one notable feature is that, in general, the heating COPs are highest in the coldest
months and the cooling COPs are highest in the warmest months. This is contrary to expectations based on the
thermodynamics of the heat pump vapor compression cycle, though it may be explained by other effects,
investigated below. To further investigate this, the hourly data were divided into outdoor air temperature bins,
so that average system heating and cooling COPs could be determined as a function of outdoor air temperature.
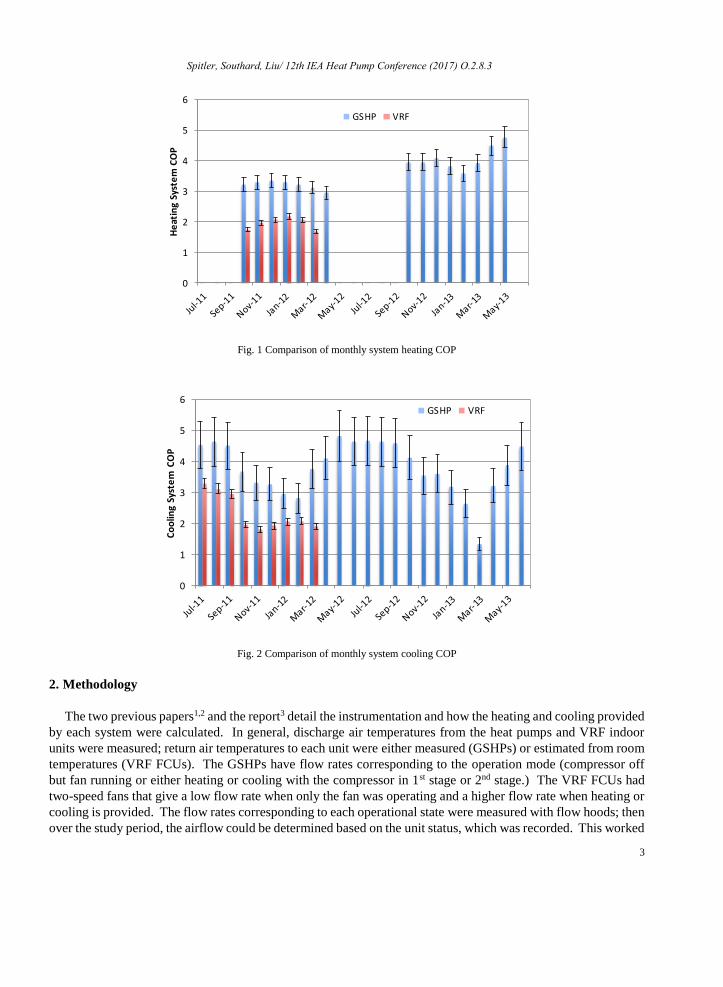
The results are shown in Figures 3 and 4. In general, for cooling, the system COPs rise with increasing outdoor
air temperature, up to a certain point – about 28°C for the VRF system and about 31°C for the GSHP system
before starting to fall. For heating, as shown in Figure 4, the GSHP system is fairly flat while the VRF system
has COP rising with decreasing temperature over much of the ODA temperature range.
Fig. 3. Comparison of system cooling COPs vs. outdoor air temperature
What accounts for these trends which are contrary to the expectation that the system COP should increase
with more favorable source temperatures? Of course, for the GSHP system, the outdoor air temperature may be
only a rough indicator of the source temperature from the ground loop. We will move to that directly. But for
the VRF system, the outdoor air is the source, and from a thermodynamic standpoint, the cycle cooling COP
would be expected to decrease with increasing outdoor air temperature, yet we see the opposite trend over much
0.0
0.5
1.0
1.5
2.0
2.5
3.0
3.5
4.0
4.5
5.0
0 5 10 15 20 25 30 35 40
Syst
em
Co
olin
g C
OP
OA Temp, °C
GSHP VRF
Spitler, Southard, Liu/ 12th IEA Heat Pump Conference (2017) O.2.8.3
5
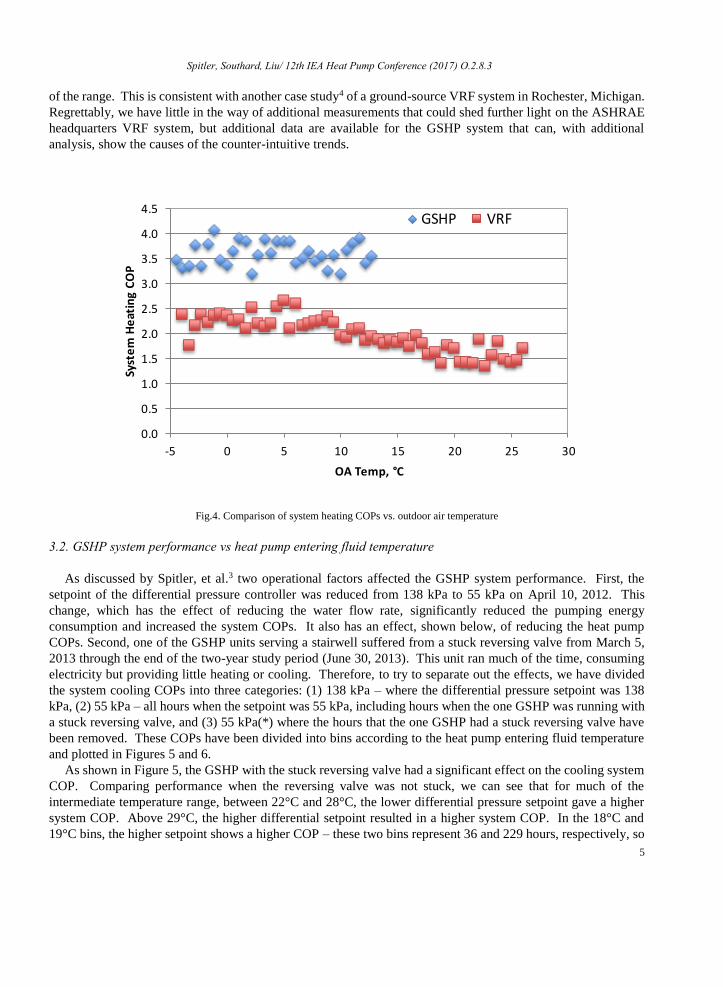
of the range. This is consistent with another case study4 of a ground-source VRF system in Rochester, Michigan.
Regrettably, we have little in the way of additional measurements that could shed further light on the ASHRAE
headquarters VRF system, but additional data are available for the GSHP system that can, with additional
analysis, show the causes of the counter-intuitive trends.
Fig.4. Comparison of system heating COPs vs. outdoor air temperature
3.2. GSHP system performance vs heat pump entering fluid temperature
As discussed by Spitler, et al.3 two operational factors affected the GSHP system performance. First, the
setpoint of the differential pressure controller was reduced from 138 kPa to 55 kPa on April 10, 2012. This
change, which has the effect of reducing the water flow rate, significantly reduced the pumping energy
consumption and increased the system COPs. It also has an effect, shown below, of reducing the heat pump
COPs. Second, one of the GSHP units serving a stairwell suffered from a stuck reversing valve from March 5,
2013 through the end of the two-year study period (June 30, 2013). This unit ran much of the time, consuming
electricity but providing little heating or cooling. Therefore, to try to separate out the effects, we have divided
the system cooling COPs into three categories: (1) 138 kPa – where the differential pressure setpoint was 138
kPa, (2) 55 kPa – all hours when the setpoint was 55 kPa, including hours when the one GSHP was running with
a stuck reversing valve, and (3) 55 kPa(*) where the hours that the one GSHP had a stuck reversing valve have
been removed. These COPs have been divided into bins according to the heat pump entering fluid temperature
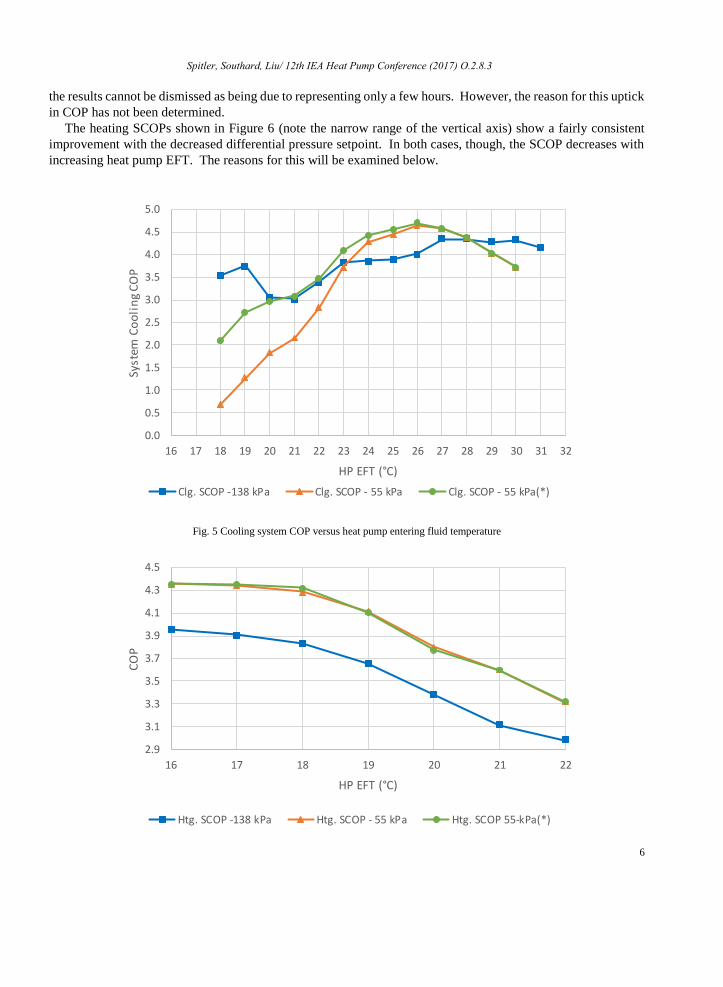
and plotted in Figures 5 and 6.
As shown in Figure 5, the GSHP with the stuck reversing valve had a significant effect on the cooling system
COP. Comparing performance when the reversing valve was not stuck, we can see that for much of the
intermediate temperature range, between 22°C and 28°C, the lower differential pressure setpoint gave a higher
system COP. Above 29°C, the higher differential setpoint resulted in a higher system COP. In the 18°C and
19°C bins, the higher setpoint shows a higher COP – these two bins represent 36 and 229 hours, respectively, so
0.0
0.5
1.0
1.5
2.0
2.5
3.0
3.5
4.0
4.5
-5 0 5 10 15 20 25 30
Syst
em
He
atin
g C
OP
OA Temp, °C
GSHP VRF
Spitler, Southard, Liu/ 12th IEA Heat Pump Conference (2017) O.2.8.3
6
the results cannot be dismissed as being due to representing only a few hours. However, the reason for this uptick
in COP has not been determined.
The heating SCOPs shown in Figure 6 (note the narrow range of the vertical axis) show a fairly consistent
improvement with the decreased differential pressure setpoint. In both cases, though, the SCOP decreases with
increasing heat pump EFT. The reasons for this will be examined below.
Fig. 5 Cooling system COP versus heat pump entering fluid temperature
0.0
0.5
1.0
1.5
2.0
2.5
3.0
3.5
4.0
4.5
5.0
16 17 18 19 20 21 22 23 24 25 26 27 28 29 30 31 32
Syst
em C
oo
lin
g C
OP
HP EFT (°C)
Clg. SCOP -138 kPa Clg. SCOP - 55 kPa Clg. SCOP - 55 kPa(*)
2.9
3.1
3.3
3.5
3.7
3.9
4.1
4.3
4.5
16 17 18 19 20 21 22
CO
P
HP EFT (°C)
Htg. SCOP -138 kPa Htg. SCOP - 55 kPa Htg. SCOP 55-kPa(*)
Spitler, Southard, Liu/ 12th IEA Heat Pump Conference (2017) O.2.8.3
7
Fig. 6 Heating system coefficient of performance vs. heat pump entering fluid temperature
Figures 5 and 6 show the system coefficients of performance versus the heat pump entering fluid temperatures.
However, all temperature bins are not equal with respect to the load that is met in each bin. Computing system
coefficients of performance over periods with different setpoints, but no heat pumps with stuck reversing valves
gives:
Setpoint 138 kPa, July 1, 2011-April 12, 2012: Heating system COP = 3.53; cooling system
COP=3.95
Setpoint 55 kPa, April 12, 2012- March 5, 2013: Heating system COP=3.93, cooling system
COP=4.29
So, despite the system cooling COP when the higher setpoint is in effect being higher for some EFT bins, the
cooling system COP is about 9% higher overall with the lower setpoint. The heating system COP is 11% higher
with the lower setpoint.
3.3. GSHP power consumption breakdown
As may already be inferred from the performance data, the system does not merely consist of heat pumps
running an ideal vapor compression cycle. Outside the heat pumps, there is a system circulating pump that
consumes energy and has lower efficiency as the flow rate decreases. It should be noted that the circulating pump
is switched off when at night if no heat pumps are running. Many central pumping systems for GSHP systems
have been designed without this feature, in which case the pump energy consumption would be considerably
higher. When only one or a few heat pumps are running, the circulating pump speed will be reduced, saving
energy. But the pump efficiency is typically lower at low speed, so the energy consumption of the pump relative
to the heating or cooling provided will be higher. Furthermore, the pump speed controller may consume some
electrical energy even when the pump is off.
Inside the water-to-air heat pump cabinet, there are additional energy consumers besides the compressor.
These include the fans, which in this system are run during office hours even when the compressor is off, in order
to maintain indoor air quality. Each heat pump also contains a control board (and possibly other electronic
devices) that consume energy even when the heat pump is entirely off. For this system with 14 heat pumps, when
the compressors, fans, and pump are all off, the electricity consumption is about 385 W. We will refer to this as
the “standby power” and though it may seem small, it has a surprisingly detrimental effect on system COPs at
low-load conditions.
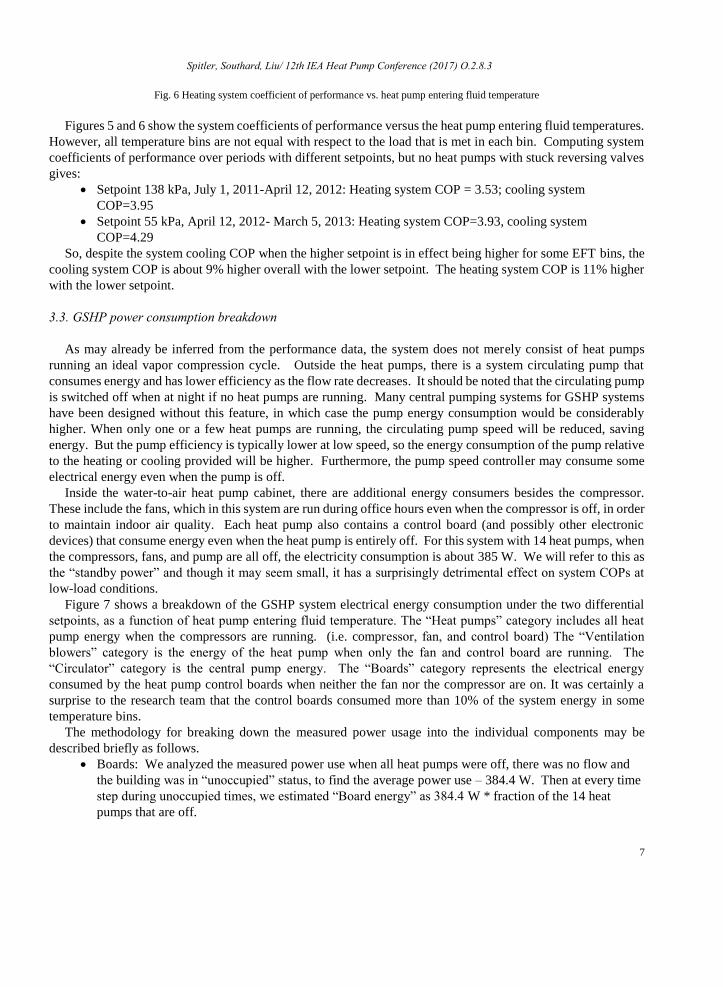
Figure 7 shows a breakdown of the GSHP system electrical energy consumption under the two differential
setpoints, as a function of heat pump entering fluid temperature. The “Heat pumps” category includes all heat
pump energy when the compressors are running. (i.e. compressor, fan, and control board) The “Ventilation
blowers” category is the energy of the heat pump when only the fan and control board are running. The
“Circulator” category is the central pump energy. The “Boards” category represents the electrical energy
consumed by the heat pump control boards when neither the fan nor the compressor are on. It was certainly a
surprise to the research team that the control boards consumed more than 10% of the system energy in some
temperature bins.
The methodology for breaking down the measured power usage into the individual components may be
described briefly as follows.
Boards: We analyzed the measured power use when all heat pumps were off, there was no flow and
the building was in “unoccupied” status, to find the average power use – 384.4 W. Then at every time
step during unoccupied times, we estimated “Board energy” as 384.4 W * fraction of the 14 heat
pumps that are off.
Spitler, Southard, Liu/ 12th IEA Heat Pump Conference (2017) O.2.8.3
8
Blowers: Similarly, we analyzed measured power use when all heat pumps were off, there was no
flow, and the building was in “occupied” status, meaning that although the compressors were off, all
of the blowers were on for ventilation, to find the average power use when 14 blowers were on. Then
at every time step during occupied times we multiplied the average power use with all blowers on by
the fraction of heat pumps that did not have the compressor running.
Circulator: We developed a pump model that was a function of measured flow rate, loop differential
pressure setpoint, and drive speed. The model was calibrated with measurements of pumping power
during a 24-hour test. Additional details are in the report3 on pages 70-75.
Heat pumps: From the total measured power, we subtract off the estimated power used by the control
boards of the 14 heat pumps, by the fans of heat pumps for which the compressors were not running,
and the circulating pump power.
Comparing Figures 7a and 7b, the effect of the differential pressure setpoint on the circulating pump energy
consumption can be clearly seen. It is reduced from a range of 12-21% at the higher differential pressure setpoint
to only 5-9% of the system power at the lower differential pressure setpoint. It also has an effect on the heat pump
energy consumption, as discussed in the next section.
(a) (b)
Fig, 7 Estimated breakdown of electrical energy consumption for differential pressure setpoint of (a) 138 kPa and (b) 55 kPa
3.4. Heat pump performance
After subtracting off the energy consumed by the boards when the heat pumps are off, the energy consumed
by the circulating pump, and the energy consumed by the heat pump fans and boards when the compressors are
off, we can calculate the heat pump cooling and heating COPs. These estimated COPs are similar to those defined
by manufacturers for a specific heat pump, but these values cover all 14 heat pumps. Perhaps these values should
be called “Heat pumps COPs”, but that being grammatically incorrect, we will stick with “Heat pump COP”.
Heat pump cooling and heating COPs, broken down into the same three categories as Figures 5 and 6 are shown
in Figures 8 and 9.
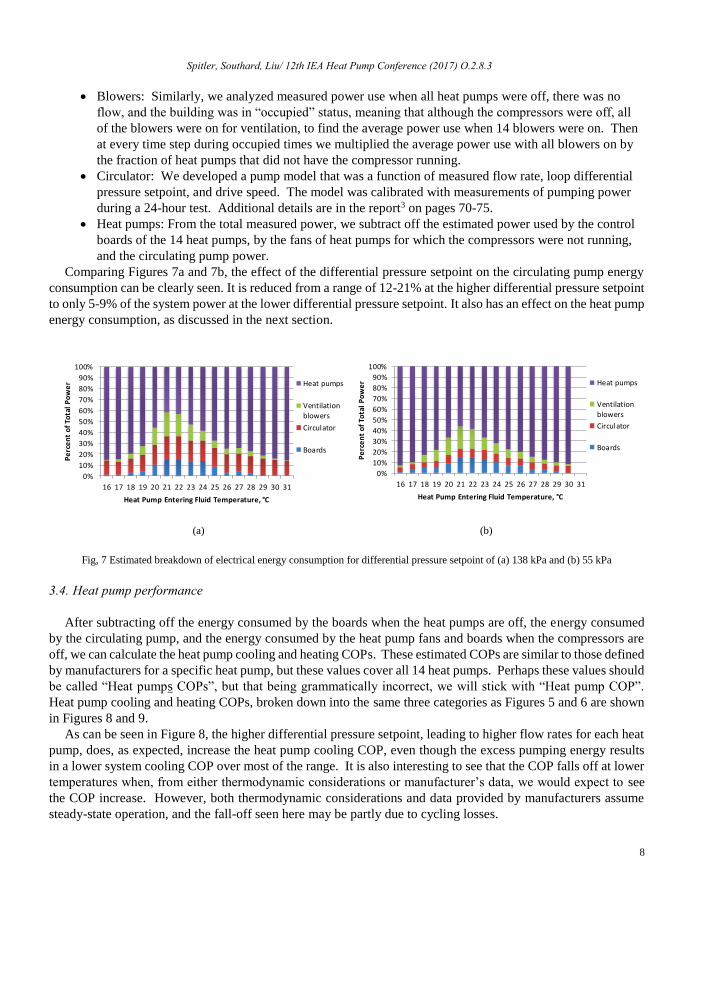
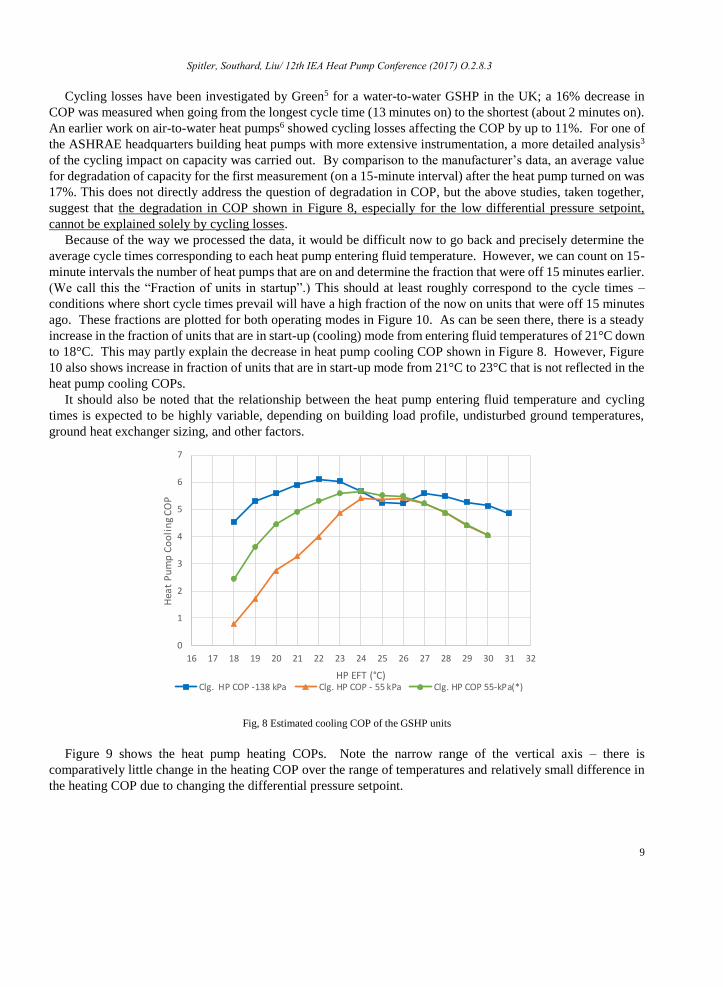
As can be seen in Figure 8, the higher differential pressure setpoint, leading to higher flow rates for each heat
pump, does, as expected, increase the heat pump cooling COP, even though the excess pumping energy results
in a lower system cooling COP over most of the range. It is also interesting to see that the COP falls off at lower
temperatures when, from either thermodynamic considerations or manufacturer’s data, we would expect to see
the COP increase. However, both thermodynamic considerations and data provided by manufacturers assume
steady-state operation, and the fall-off seen here may be partly due to cycling losses.
0%
10%
20%
30%
40%
50%
60%
70%
80%
90%
100%
16 17 18 19 20 21 22 23 24 25 26 27 28 29 30 31
Pe
rce
nt
of
Tota
l P
ow
er
Heat Pump Entering Fluid Temperature, °C
Heat pumps
Ventilationblowers
Circulator
Boards
0%
10%
20%
30%
40%
50%
60%
70%
80%
90%
100%
16 17 18 19 20 21 22 23 24 25 26 27 28 29 30 31
Pe
rce
nt
of
Tota
l P
ow
er
Heat Pump Entering Fluid Temperature, °C
Heat pumps
Ventilation
blowers
Circulator
Boards
Spitler, Southard, Liu/ 12th IEA Heat Pump Conference (2017) O.2.8.3
9
Cycling losses have been investigated by Green5 for a water-to-water GSHP in the UK; a 16% decrease in
COP was measured when going from the longest cycle time (13 minutes on) to the shortest (about 2 minutes on).
An earlier work on air-to-water heat pumps6 showed cycling losses affecting the COP by up to 11%. For one of
the ASHRAE headquarters building heat pumps with more extensive instrumentation, a more detailed analysis3
of the cycling impact on capacity was carried out. By comparison to the manufacturer’s data, an average value
for degradation of capacity for the first measurement (on a 15-minute interval) after the heat pump turned on was
17%. This does not directly address the question of degradation in COP, but the above studies, taken together,
suggest that the degradation in COP shown in Figure 8, especially for the low differential pressure setpoint,
cannot be explained solely by cycling losses.
Because of the way we processed the data, it would be difficult now to go back and precisely determine the
average cycle times corresponding to each heat pump entering fluid temperature. However, we can count on 15-
minute intervals the number of heat pumps that are on and determine the fraction that were off 15 minutes earlier.
(We call this the “Fraction of units in startup”.) This should at least roughly correspond to the cycle times –
conditions where short cycle times prevail will have a high fraction of the now on units that were off 15 minutes
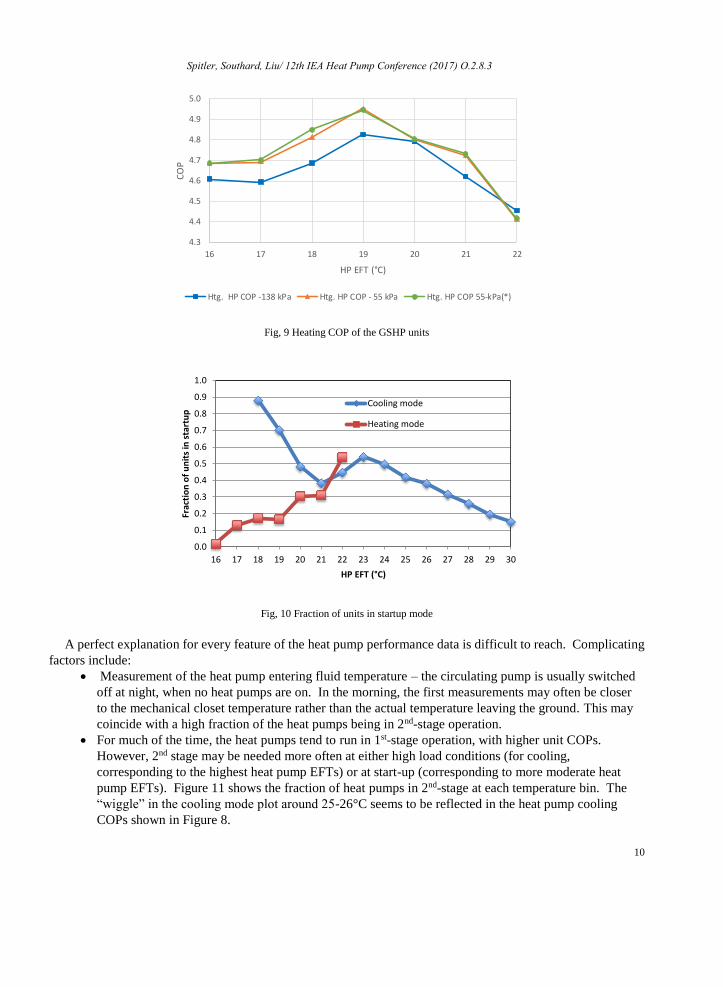
ago. These fractions are plotted for both operating modes in Figure 10. As can be seen there, there is a steady
increase in the fraction of units that are in start-up (cooling) mode from entering fluid temperatures of 21°C down
to 18°C. This may partly explain the decrease in heat pump cooling COP shown in Figure 8. However, Figure
10 also shows increase in fraction of units that are in start-up mode from 21°C to 23°C that is not reflected in the
heat pump cooling COPs.
It should also be noted that the relationship between the heat pump entering fluid temperature and cycling
times is expected to be highly variable, depending on building load profile, undisturbed ground temperatures,
ground heat exchanger sizing, and other factors.
Fig, 8 Estimated cooling COP of the GSHP units
Figure 9 shows the heat pump heating COPs. Note the narrow range of the vertical axis – there is
comparatively little change in the heating COP over the range of temperatures and relatively small difference in
the heating COP due to changing the differential pressure setpoint.
0
1
2
3
4
5
6
7
16 17 18 19 20 21 22 23 24 25 26 27 28 29 30 31 32
Hea
t P
um
p C
oo
lin
g C
OP
HP EFT (°C)Clg. HP COP -138 kPa Clg. HP COP - 55 kPa Clg. HP COP 55-kPa(*)
Spitler, Southard, Liu/ 12th IEA Heat Pump Conference (2017) O.2.8.3
10
Fig, 9 Heating COP of the GSHP units
Fig, 10 Fraction of units in startup mode
A perfect explanation for every feature of the heat pump performance data is difficult to reach. Complicating
factors include:
Measurement of the heat pump entering fluid temperature – the circulating pump is usually switched
off at night, when no heat pumps are on. In the morning, the first measurements may often be closer
to the mechanical closet temperature rather than the actual temperature leaving the ground. This may
coincide with a high fraction of the heat pumps being in 2nd-stage operation.
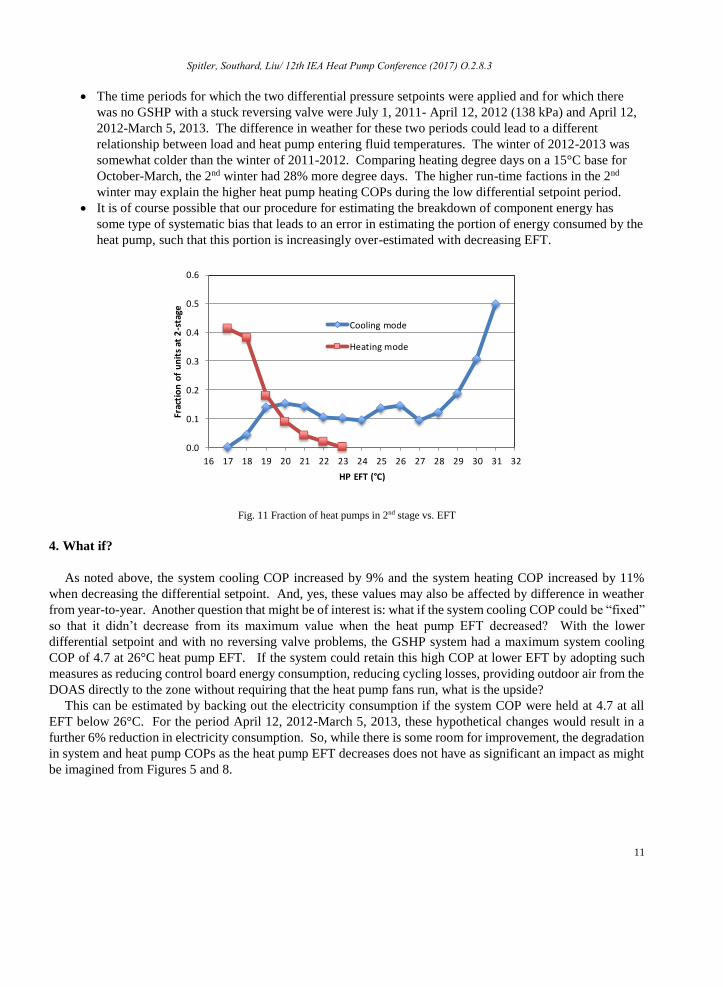
For much of the time, the heat pumps tend to run in 1st-stage operation, with higher unit COPs.
However, 2nd stage may be needed more often at either high load conditions (for cooling,
corresponding to the highest heat pump EFTs) or at start-up (corresponding to more moderate heat
pump EFTs). Figure 11 shows the fraction of heat pumps in 2nd-stage at each temperature bin. The
“wiggle” in the cooling mode plot around 25-26°C seems to be reflected in the heat pump cooling
COPs shown in Figure 8.
4.3
4.4
4.5
4.6
4.7
4.8
4.9
5.0
16 17 18 19 20 21 22
CO
P
HP EFT (°C)
Htg. HP COP -138 kPa Htg. HP COP - 55 kPa Htg. HP COP 55-kPa(*)
0.0
0.1
0.2
0.3
0.4
0.5
0.6
0.7
0.8
0.9
1.0
16 17 18 19 20 21 22 23 24 25 26 27 28 29 30
Frac
tio
n o
f u
nit
s in
sta
rtu
p
HP EFT (°C)
Cooling mode
Heating mode
Spitler, Southard, Liu/ 12th IEA Heat Pump Conference (2017) O.2.8.3
11
The time periods for which the two differential pressure setpoints were applied and for which there
was no GSHP with a stuck reversing valve were July 1, 2011- April 12, 2012 (138 kPa) and April 12,
2012-March 5, 2013. The difference in weather for these two periods could lead to a different
relationship between load and heat pump entering fluid temperatures. The winter of 2012-2013 was
somewhat colder than the winter of 2011-2012. Comparing heating degree days on a 15°C base for
October-March, the 2nd winter had 28% more degree days. The higher run-time factions in the 2nd
winter may explain the higher heat pump heating COPs during the low differential setpoint period.
It is of course possible that our procedure for estimating the breakdown of component energy has
some type of systematic bias that leads to an error in estimating the portion of energy consumed by the
heat pump, such that this portion is increasingly over-estimated with decreasing EFT.
Fig. 11 Fraction of heat pumps in 2nd stage vs. EFT
4. What if?
As noted above, the system cooling COP increased by 9% and the system heating COP increased by 11%
when decreasing the differential setpoint. And, yes, these values may also be affected by difference in weather
from year-to-year. Another question that might be of interest is: what if the system cooling COP could be “fixed”
so that it didn’t decrease from its maximum value when the heat pump EFT decreased? With the lower
differential setpoint and with no reversing valve problems, the GSHP system had a maximum system cooling
COP of 4.7 at 26°C heat pump EFT. If the system could retain this high COP at lower EFT by adopting such
measures as reducing control board energy consumption, reducing cycling losses, providing outdoor air from the
DOAS directly to the zone without requiring that the heat pump fans run, what is the upside?
This can be estimated by backing out the electricity consumption if the system COP were held at 4.7 at all
EFT below 26°C. For the period April 12, 2012-March 5, 2013, these hypothetical changes would result in a
further 6% reduction in electricity consumption. So, while there is some room for improvement, the degradation
in system and heat pump COPs as the heat pump EFT decreases does not have as significant an impact as might
be imagined from Figures 5 and 8.
0.0
0.1
0.2
0.3
0.4
0.5
0.6
16 17 18 19 20 21 22 23 24 25 26 27 28 29 30 31 32
Frac
tio
n o
f u
nit
s at
2-s
tage
HP EFT (°C)
Cooling mode
Heating mode
Spitler, Southard, Liu/ 12th IEA Heat Pump Conference (2017) O.2.8.3
12
5. Conclusions and Recommendations
An air-source variable refrigerant flow system and a ground-source heat pump system provide heating and
cooling at the ASHRAE headquarters building in Atlanta, Georgia. For the nine-month period from July 2011-
March 2012, it was possible to do a comparison between the two systems, which served different floors with
similar, but not identical, loads. Over that time period, the GSHP system had a heating system COP that was
65% higher than the VRF system and a cooling system COP that was 72% higher than the VRF system.
In this paper, the analysis was extended to show a comparison as a function of outdoor air temperature. For
cooling both systems showed performance (COP) trends that were counter to what would be expected from a
thermodynamic analysis of a vapor compression cycle. That is, the system cooling COP increased with outdoor
air temperature over much of the range of operation. A similar trend in heating could be observed for the VRF
system.
Further effort was expended on determining the reasons for the counter-intuitive trend shown by the GSHP
system, for which many more measurements over a longer period of time (July 2011-June 2013) were available.
A reduction in differential pressure setpoint that controls the flow across the heat pumps was made in April of
2012. Excluding the period of time when one heat pump had a stuck reversing valve, the reduction in differential
pressure setpoint gave a 9% increase in system cooling COP and an 11% increase in system heating COP.
The portions of the system electrical energy consumption due to the heat pumps, circulating pump, fans
running when the compressors are off, and heat pump and pump speed control boards were estimated. Some of
the decrease in system cooling COP with lower heat pump entering fluid temperatures can be attributed to lower
cooling provided, and lower run-times leading to higher relative energy consumption by the circulating pump,
fans, and control boards. However, it also appears that the heat pump COPs also decrease at a rate beyond what
can be explained by cycling losses.
The reasons for this are explored; possibilities include different building loads for the two periods, a different
proportion of units in 2nd stage operation, and some type of systematic error in the procedure for estimating the
portion of system energy consumed by the heat pumps. Further work, likely including additional instrumentation
and measurements, will be necessary to reach a conclusion on this aspect of the system performance.
Finally, a very rough analysis was made to estimate how much further savings might be possible by
eliminating the reduction in system cooling COPs with lower heat pump EFT. A further 6% savings is estimated.
Further research on system and heat pump design is warranted to try and achieve this savings.
Acknowledgements
The project that supported collection of the data and the earlier analysis was funded by GEO, the
Geothermal Exchange Organization, with additional support from the Southern Company.
References
[1] Southard LE, Liu X, Spitler JD. Performance of HVAC Systems at ASHRAE HQ – Part 1. ASHRAE Journal. 2014, 56(9):14-24.
[2] Southard LE, Liu X, Spitler JD. Performance of HVAC Systems at ASHRAE HQ – Part 2. ASHRAE Journal. 2014, 56(12):12-23.
[3] Spitler JD, Southard LE, Liu X. Performance of the HVAC Systems at the ASHRAE Headquarters Building. Final Report to GEO.
2014. Available online at: https://www.geoexchange.org/library/8274-2/ .
[4] Im P and Liu X. Case Study for ARRA-funded Ground-Source Heat Pump (GSHP) Demonstration at Oakland University. Technical
report ORNL/TM-2014/712, Oak Ridge National Laboratory. 2015.
[5] Green R. The Effects of Cycling on Heat Pump Performance. Report, EA Technology. Project No: 46640. 2012.
[6] Tassou SA and Votsis P. Transient response and cycling losses of air-to-water heat pump systems. Heat Recovery Systems and CHP
2012. 12(2):123-129.