Embed Size (px)
Citation preview

Munich Personal RePEc Archive
Group Size Effect and Over-Punishment
in the Case of Third Party Enforcement
of Social Norms
Kamei, Kenju
Durham University
17 February 2018
Online at https://mpra.ub.uni-muenchen.de/85713/
MPRA Paper No. 85713, posted 05 Apr 2018 15:31 UTC

1
Group Size Effect and Over-Punishment in the Case of
Third Party Enforcement of Social Norms
Kenju Kamei
Department of Economics and Finance, Durham University
Email: [email protected], [email protected]
This version: February 2018
Abstract: One of the important topics in public choice is how people’s free-riding behavior
could differ by group size in collective action dilemmas. This paper experimentally studies how
the strength of third party punishment in a prisoner’s dilemma could differ by the number of third parties in a group. Our data indicate that as the number of third party punishers increases in
a group, the average punishment intensity per third party punisher decreases. However, the
decrease rate is very mild and therefore the size of total punishment in a group substantially
increases with an increase in group size. As a result, third party punishment becomes a sufficient
deterrent against a player selecting defection in the prisoner’s dilemma when the number of third
party punishers is sufficiently large. Nevertheless, when there are too many third party punishers
in a group, a defector’s expected payoff is far lower than that of a cooperator due to strong
aggregate punishment, while some cooperators are even hurt through punishment. Therefore, the
group incurs a huge efficiency loss. Such over-punishment results from third party punishers’ conditional punishment behaviors: their punishment intensity is positively correlated with their
beliefs on the peers’ punitive actions. Some possible ways to coordinate punishment among
peers even when group size is very large, thus enabling the efficiency loss to be mitigated, are
also discussed in the paper.
Keywords: experiment, cooperation, third party punishment, dilemma, group size effect
JEL codes: C92, D72, D78, H41
Acknowledgment: I thank John Hey for his hospitality to let me conduct the experiment at the
University of York. I also thank Mark Wilson for his support in setting the z-Tree software and
managing the computer during the experiment. This project was funded by a grant by the Murata
Science Foundation. Durham University Business School provided additional funding. I thank
the editor, Daniel Houser, an associate editor and anonymous referee for valuable comments.
2
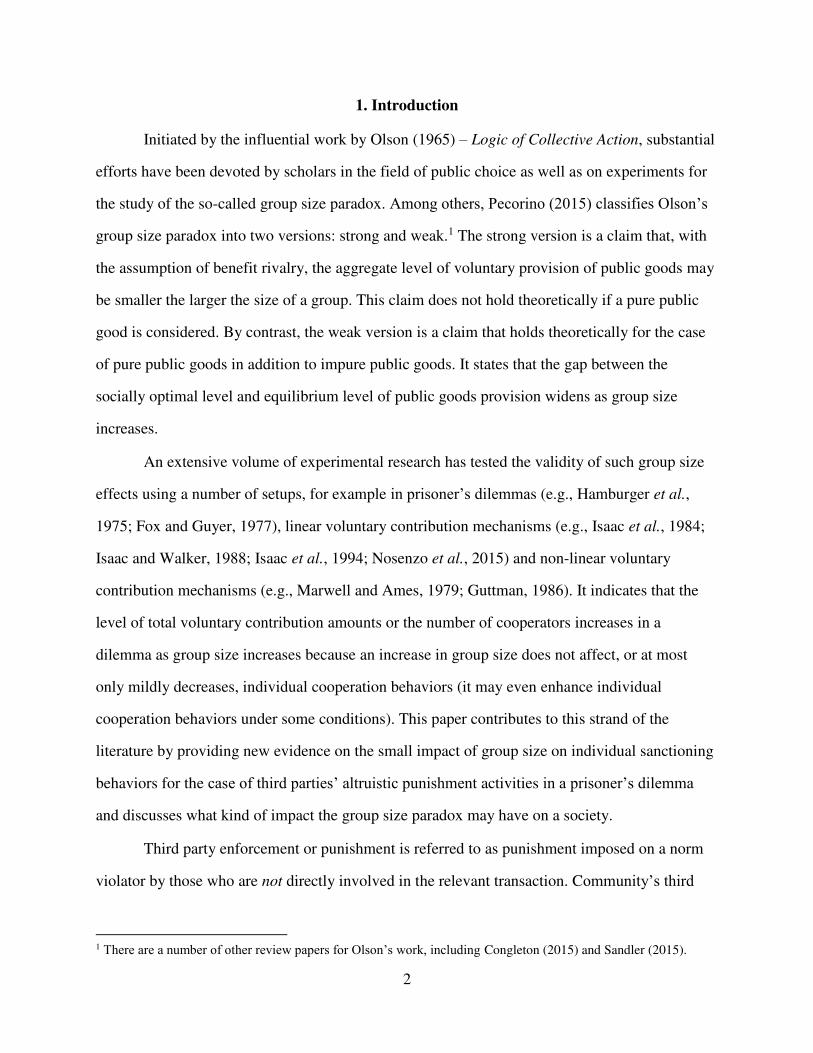
1. Introduction
Initiated by the influential work by Olson (1965) – Logic of Collective Action, substantial
efforts have been devoted by scholars in the field of public choice as well as on experiments for
the study of the so-called group size paradox. Among others, Pecorino (2015) classifies Olson’s
group size paradox into two versions: strong and weak.1 The strong version is a claim that, with
the assumption of benefit rivalry, the aggregate level of voluntary provision of public goods may
be smaller the larger the size of a group. This claim does not hold theoretically if a pure public
good is considered. By contrast, the weak version is a claim that holds theoretically for the case
of pure public goods in addition to impure public goods. It states that the gap between the
socially optimal level and equilibrium level of public goods provision widens as group size
increases.
An extensive volume of experimental research has tested the validity of such group size
effects using a number of setups, for example in prisoner’s dilemmas (e.g., Hamburger et al.,
1975; Fox and Guyer, 1977), linear voluntary contribution mechanisms (e.g., Isaac et al., 1984;
Isaac and Walker, 1988; Isaac et al., 1994; Nosenzo et al., 2015) and non-linear voluntary
contribution mechanisms (e.g., Marwell and Ames, 1979; Guttman, 1986). It indicates that the
level of total voluntary contribution amounts or the number of cooperators increases in a
dilemma as group size increases because an increase in group size does not affect, or at most
only mildly decreases, individual cooperation behaviors (it may even enhance individual
cooperation behaviors under some conditions). This paper contributes to this strand of the
literature by providing new evidence on the small impact of group size on individual sanctioning
behaviors for the case of third parties’ altruistic punishment activities in a prisoner’s dilemma
and discusses what kind of impact the group size paradox may have on a society.
Third party enforcement or punishment is referred to as punishment imposed on a norm
violator by those who are not directly involved in the relevant transaction. Community’s third
1 There are a number of other review papers for Olson’s work, including Congleton (2015) and Sandler (2015).

3
party enforcement mechanism is recognized as important as an informal contract enforcement
institution, along with many other mechanisms such as reputation mechanisms and information
transmission network.2 The informal contract enforcement is not built on the codification by the
government, but rather based on factors such as norms and beliefs. The literature discusses that
such informal enforcement, together with formal institutions (e.g., legal), facilitates people’s
exchanges, even anonymous ones, although its relative importance depends on the contexts (e.g.,
Greif, 1997; Dixit, 2004). Even in an economy with well-developed legal systems, informal
enforcement could enhance the efficiency of formal institutions and lead to economic
development, for example by promoting pro-social behaviors of both citizens and bureaucrats.3 In
addition, people may even choose to overcome conflicts and opportunism using informal
enforcement mechanisms, such as community punishment via gossiping, without resorting to the
coercive legal authority (e.g., Ellickson [1991] for the cattle-trespass case in Shasta County,
California).4 In an economy with weak formal institutions, informal enforcement may be the key
for successful cooperation to happen. For instance, Mathew and Boyd (2011) found that in
warfare in Turkana societies, which lacked formal political institutions, individuals who
demonstrated cowardice and deserted from combat were not only subject to verbal punishment by
age-mates, women, and seniors, but were also punished by a sufficient number of third parties
(the violator’s age group) when the community collectively decided to impose corporal
punishment through consensus. Warriors who raid another Turkana territorial section could also
2 The theoretical literature explains that even without any institutions or coordination devices, a community’s decentralized punishment enables community members to sustain cooperation in their infinitely repeated
interactions with stranger matching if they are sufficiently patient (e.g., Kandori, 1992; Ellison, 1994). 3 Without well-developed informal institutions, a country may not be able to achieve economic development even if
strong formal institutions are successfully established, because governments may select an inefficient or sub-optimal
system that benefits the state (e.g., Williamson, 2009). The importance of informal institutions can also be seen with
the evidence that high levels of social norms, such as citizens’ trust and respect for others, are positive predictors for a
region’s per capita output (e.g., Tabellini, 2010). 4 In common pool resource problems, self-organized regimes by those involved frequently outperform formal
regimes operated by the government (e.g., Ostrom, 2000). An empirical study that includes both measures of formal
and informal institutions indicates that a high quality of informal institution, rather than formal legal systems, may
be the key channel that leads to more secure property rights (e.g., Williamson and Kerekes, 2011). One reason for
the higher efficiency of private ordering compared to the formal legal system in cases of disputes is the high costs of
using the latter, including the time required for the formal authority to enforce a judgement, the courts’ limited ability to obtain verifiable information, and a possible low precision of the judgement (e.g., Dixit, 2004).
4
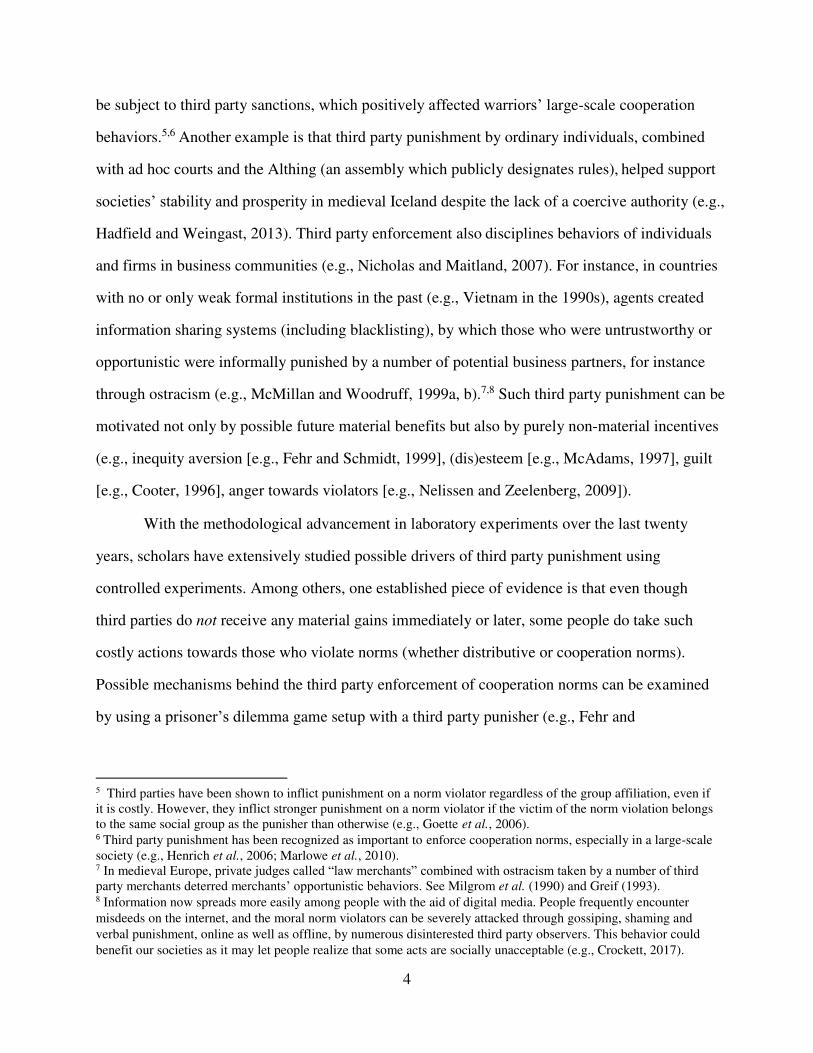
be subject to third party sanctions, which positively affected warriors’ large-scale cooperation
behaviors.5,6 Another example is that third party punishment by ordinary individuals, combined
with ad hoc courts and the Althing (an assembly which publicly designates rules), helped support
societies’ stability and prosperity in medieval Iceland despite the lack of a coercive authority (e.g.,
Hadfield and Weingast, 2013). Third party enforcement also disciplines behaviors of individuals
and firms in business communities (e.g., Nicholas and Maitland, 2007). For instance, in countries
with no or only weak formal institutions in the past (e.g., Vietnam in the 1990s), agents created
information sharing systems (including blacklisting), by which those who were untrustworthy or
opportunistic were informally punished by a number of potential business partners, for instance
through ostracism (e.g., McMillan and Woodruff, 1999a, b).7,8 Such third party punishment can be
motivated not only by possible future material benefits but also by purely non-material incentives
(e.g., inequity aversion [e.g., Fehr and Schmidt, 1999], (dis)esteem [e.g., McAdams, 1997], guilt
[e.g., Cooter, 1996], anger towards violators [e.g., Nelissen and Zeelenberg, 2009]).
With the methodological advancement in laboratory experiments over the last twenty
years, scholars have extensively studied possible drivers of third party punishment using
controlled experiments. Among others, one established piece of evidence is that even though
third parties do not receive any material gains immediately or later, some people do take such
costly actions towards those who violate norms (whether distributive or cooperation norms).
Possible mechanisms behind the third party enforcement of cooperation norms can be examined
by using a prisoner’s dilemma game setup with a third party punisher (e.g., Fehr and
5 Third parties have been shown to inflict punishment on a norm violator regardless of the group affiliation, even if
it is costly. However, they inflict stronger punishment on a norm violator if the victim of the norm violation belongs
to the same social group as the punisher than otherwise (e.g., Goette et al., 2006). 6 Third party punishment has been recognized as important to enforce cooperation norms, especially in a large-scale
society (e.g., Henrich et al., 2006; Marlowe et al., 2010). 7 In medieval Europe, private judges called “law merchants” combined with ostracism taken by a number of third party merchants deterred merchants’ opportunistic behaviors. See Milgrom et al. (1990) and Greif (1993). 8 Information now spreads more easily among people with the aid of digital media. People frequently encounter
misdeeds on the internet, and the moral norm violators can be severely attacked through gossiping, shaming and
verbal punishment, online as well as offline, by numerous disinterested third party observers. This behavior could
benefit our societies as it may let people realize that some acts are socially unacceptable (e.g., Crockett, 2017).

5
Fischbacher, 2004). With such a framework, past research has conducted experiments where
there are only one, or at most two, third party punishers in a group, and it has been shown that
third parties more frequently and more strongly inflict punishment on a defector who exploited a
cooperator than on any other type of player, even if the interaction is one-shot and they never
directly interact with the punished during the experiment (e.g., Fehr and Fischbacher, 2004;
Kurzban et al., 2007; Lergetporer et al., 2014; Kamei, 2017b).9,10 This suggests that
interdependent preferences (e.g., inequity aversion), besides potential future material gains to be
obtained within the community, indeed drive third party punishment. However, the past work
leaves two important questions unanswered. First, what happens to the levels of individual and
aggregate punishment if the number of independent third parties grows in an interaction unit?
Second, why do some societies, such as Turkana in the above example, or some societies before
the emergence of states (e.g., medieval Iceland), have some rules to determine the size of
aggregate punishment towards norm violators? The answer to this question could be related to
the group size paradox explained earlier. If the punishment strength per third party does not
decrease or decreases only mildly as the number of independent third party punishers grows,
third party punishment could be a greater deterrent against players’ opportunistic behaviors in a
dilemma when there are a sufficiently large number of third party players. However, having too
many uncoordinated third parties could be harmful to a society because a norm violator may
receive very strong punishment in aggregate from uncoordinated third parties far beyond the
threshold level that makes selecting defection not materially beneficial. It is true that social
welfare can improve if the community achieves high cooperation norms through punishment.
However, such heavy aggregate punishment means that (a) punishers’ welfare decreases due to
unnecessarily high punitive costs and also that (b) the society may incur a loss from the strong
9 Third party punishment is shown to be weaker than second party punishment [i.e., a direct punitive action that an
agent takes toward her interaction partner]. 10 See also Carpenter and Matthews (2012).

6
punishment imposed on the norm violators.11 Or worse, we may even have perverse punishment,
such as punishment of cooperators, in a very large group.
In almost all societies around the world, we in fact observe informal enforcement of rules
with strong punishment, and also “misdirected” punishment, by a group of individuals,
sometimes in the form of mob or vigilante justice, regardless of the quality of formal
institutions.12 However, despite such common observations and the empirical literature on the
group size paradox, to our knowledge, the issue of possible third parties’ over-punishment has
not been central to the theoretical discussions of punishment in relation to group size. Besides,
there is little consensus regarding whether third parties free ride on others’ punitive acts. For
example, the theoretical work on law and public choice proposes that third parties’ enforcement
systems could have legal attributes. For instance, Hadfield and Weingast (2012, 2013), in re-
defining law, explain that the classification of a behavior as wrongful as well as the enforcement
of punishment can be made through “decentralized collective punishment,” which they define as
“independent and simultaneous decisions made by individual actors (nonofficial) to punish a
wrongdoer,” without requiring formal legal institutions such as a police force. Nevertheless, they
argue that a device for coordination would be required for third parties to initiate punishment
because (a) there would be no incentives for them to engage in punishment as it is a costly act
and (b) each punisher has an idiosyncratic reasoning.13,14 By contrast, some of the literature that
considers non-material motives (e.g., Coorter, 1996; McAdams, 1997) instead suggests that the
free-riding problem can be easily resolved if there are a sufficient number of third parties
11 What exactly is optimal regarding the size of punishment is debatable. While punishment should be a deterrent
against norm violations, there is a view that a loss incurred by the punished is a form of economic cost. For example,
Becker (1968) discusses that in the case of crime, the economic costs of punishment include not only costs on
punishers’ sides, but also foregone wages imprisoned offenders could otherwise earn in societies. 12 Mob justice is observed in almost any country. However it more frequently occurs in some countries, for example,
countries in Africa and India. For instance, in Kenya more than 500 people were killed by furious crowds for their
wrongdoing in 2011 (Krinninger, 2016). 13 Ancient Athens (e.g., Lanni, 2009; Carugati et al., 2017) and medieval Iceland (e.g., Hadfield and Weingast,
2013) are discussed as examples. We note that, as explained in footnote 2, theoretically third parties’ punishment could emerge as an equilibrium behavior without any institutions if interactions in a given community infinitely or
indefinitely continue and people are sufficiently patient. 14 Masten and Prüfer (2014) discuss that courts and community enforcement are complementary in the sense that
community enforcement works best for low value transactions while courts function for high value transactions.

7
because then the cost each person must share for the punishment becomes small enough. This
paper fills the gap between the empirical literature on the group size paradox and the theoretical
literature by studying whether third parties’ free-riding in fact happens, to what extent if so, and
what kind of coordination mechanism may be required considering their behavioral pattern.
In our experiment, there are two players who play a prisoner’s dilemma game (PD
players, hereafter) in each group along with third parties. In this paper, the phrase “third parties”
is used interchangeably with “third party players” and “third party punishers.” We vary the
number of (independent) third parties in each group: one, two, four and ten. Each third party
player can reduce the payoffs of the PD players based on their interaction outcomes, but the
punishment acts are costly.
The experiment shows that first, consistent with past research, third parties are more
likely to impose strong punishment on a norm violator (a defector who exploited a cooperator)
than on a player in any other scenario. Second, punishment intensity per individual third party
decreases as the number of third parties increases in a group. However, the decrease rate is only
mild, and therefore, third party punishment is in aggregate strong enough to prevent a PD player
from defecting when there are at least four third parties. However, if a group has too many third
parties (ten in a group), the group suffers from a large efficiency loss due to (a) over-punishment
of norm violators and (b) perverse punishment of cooperators. This implies that some institutions
that limit, not encourage, third parties’ punishment behaviors are desirable.
Using an additional experiment, we discuss that the small impact of group size on the
punishment intensity per third party player results from third parties’ conditional punishment
behaviors. The conditional punishment hypothesis assumes that third parties are concerned about
inequality with other third parties. Our data show that (i) third party players’ punishment targeted
at a PD player is positively correlated with their beliefs regarding other third party players’
punishment behaviors, and that (ii) they believe that others strongly punish defectors.
This paper further discusses people’s ability to democratically mitigate the coordination
failure. As an illustration, we show that people can not only eliminate some peers’ perverse
8
punishment of cooperators, but can also alleviate over-punishment of norm violators once we
allow third parties to democratically regulate their punishment activities through voting. This
explains why some societies (e.g., Turkana) have rules to collectively decide the level of
punishment to norm violators. This also suggests that, in reality, having a large group size may
not be harmful if there are mechanisms for third parties to coordinate their punishment activities.
The rest of the paper proceeds as follows: Section 2 provides the experimental design.
Section 3 summarizes the related experiments on group size effects. Section 4 reports the results.
Section 5 provides results on third parties’ conditional punishment behaviors, and Section 6
explains how the rule-making by third parties could help them coordinate punishment in the case
where the group size is large. Section 7 concludes.
2. The Experimental Design
The experimental design is based on a prisoner’s dilemma game with third party
punishment (Fehr and Fischbacher, 2004). We use a within-subjects design. One advantage of
using a within-subjects design is that we can control for individual characteristics thoroughly
when identifying group size effects because we compare the behaviors of the same subjects
between different group sizes. There are four treatment conditions. Each subject makes third
party punishment decisions under all of the four treatment conditions in sequence. The order of
the four conditions is randomly determined for each experimental session.15
The four treatment conditions have the same structure, except for the number of third
party punishers in a group, which is one, two, four or ten (Section 2.1).
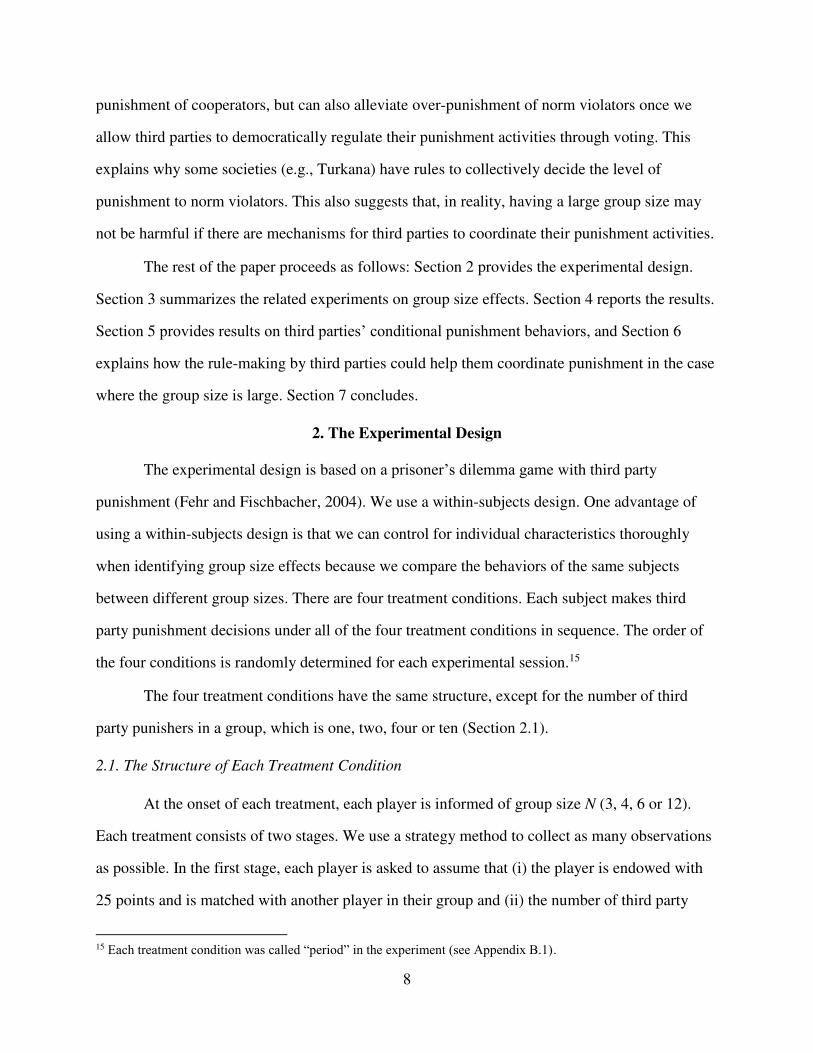
2.1. The Structure of Each Treatment Condition
At the onset of each treatment, each player is informed of group size N (3, 4, 6 or 12).
Each treatment consists of two stages. We use a strategy method to collect as many observations
as possible. In the first stage, each player is asked to assume that (i) the player is endowed with
25 points and is matched with another player in their group and (ii) the number of third party
15 Each treatment condition was called “period” in the experiment (see Appendix B.1).

9
punishers is N – 2. They are then asked to decide whether or not to send 10 points to the
counterpart. The amount sent is tripled and becomes the payoff for the counterpart. The strictly
dominant strategy for a player is to keep 10 points since the sender’s payoff would be reduced if
she sends it. However, the social optimum is achieved when both players send 10 points to each
other. Thus, this is a prisoner’s dilemma game (Fig. 1). As in Fehr and Fischbacher (2004), PD
players do not have a direct punishment opportunity in order to study the pure role of third party
punishment in enforcing cooperation norms.
The prisoner’s dilemma describes the tension between cooperation and defection using a
simple format. Examples include a person’s relationship with a neighbor where one has to decide
whether to fulfill or not fulfill her responsibility (e.g., the cattle-trespass case in Shasta County
[Ellickson, 1991]), a business relationship with her partner where one has to decide whether to
keep or break an industry norm (e.g., the secrecy norm in the diamond market [Bernstein, 1992]),
and a person’s relationship with another member where one has to decide whether to comply
with or break a society’s norm or non-binding ordinance (e.g., the community’s norm regarding
livestock raids in another community in Turkana [Mathew and Boyd, 2011]). It also describes
the nature of international politics, such as the tension between two countries regarding military
competition (e.g., expand or shrink a military budget), trade conflict (e.g., protest or open a
market), and voluntary cooperation in the case of crisis (e.g., support or not support a
neighboring country in the event of a massive natural disaster).16 There are usually third parties
that are not directly involved in the relevant prisoner’s dilemma interaction in these examples.
In the second stage, each player is asked to assume that (i) they are endowed with 40
points and (ii) they are assigned the role of third party punisher. They are then asked to
independently and privately decide how many punishment points they wish to impose on each of
16 The advantage of using a prisoner’s dilemma game is its simplicity without losing the important nature of
people’s tension between two parties. Theoretical studies on third party enforcement of norms often use prisoner’s dilemma game setups (e.g., Milgrom et al., 1990; Kandori, 1992; Ellison, 1994). Nevertheless, we acknowledge that
some people’s interactions can be better described as a two-person public goods game (a near-continuous version of
the prisoner’s dilemma game).

10
the two PD players.17 Specifically, they are asked to choose punishment actions under the
following four scenarios, on the condition that they are aware of each PD player’s action choices
without any noise:18
Scenario (a): how many punishment points the player would like to impose on a player who sent
10 points while the matched player also sent 10 points;
Scenario (b): how many punishment points the player would like to impose on a player who did
not send 10 points while the matched player sent 10 points;
Scenario (c): how many punishment points the player would like to impose on a player who sent
10 points while the matched player did not send 10 points;
Scenario (d): how many punishment points the player would like to impose on a player who did
not send 10 points while the matched player also did not send 10 points.
As in Fehr and Fischbacher (2004), the punishment points to a target must be an integer
between 0 and 20. For each punishment point a third party player assigns to a PD player, one
point will be deducted from the third party player and three points will be deducted from the
target. When the payoff of a PD player is negative, it is set to zero.
Note that as the number of third parties in a group increases, the per-person cost of
imposing a given punishment level falls. The costs per third party to impose one punishment point
on a PD player are 1, 1/2, 1/4, and 1/10 when the numbers of third parties are one, two, four and
ten, respectively. Thus, if income effects are present, third parties’ free-riding problem could
theoretically be more easily resolved for a larger group size. Nevertheless, a coordination issue
could occur as third parties do not know the strength of the punishment that their peers inflict.
17 Kamei (2017b) studied how the behaviors of two-person pairs who jointly make single punishment decisions
through communication differ from those of independent third party individuals. The study showed that there are no
differences in the pattern and strength of punishment between the pairs and individuals. Kamei (2017b) also studied
whether raising the visibility of punishment actions among independent third parties may enhance their punishment
strength, finding an affirmative result. 18 This strategy method was also used in Kamei (2017b). Using a dictator game with third party punishment, Jordan
et al. (2016) showed that the strength of third party punishment is not influenced by manipulating the use of the
strategy method, compared with letting third parties decide what to punish after learning dictators’ action choices.
11
As there are four treatment conditions, all subjects make sending decisions as a PD player
and punishment decisions as a third party punisher four times in the format of the strategy method.
2.2. The Experiment
Subjects are asked to make decisions four times, each with a different group size, in
sequence, without being provided any feedback regarding previous treatment conditions. All
decisions are incentive-compatible. Once all subjects go through the four treatment conditions,
the computer will randomly select one treatment condition for payment calculation. The
conversion rate is: 6 points = 1 pound sterling. Subjects will then be randomly assigned to a
group of a given size as well as randomly the role of either a PD player or a third party player. If
a subject is assigned the role of PD player, the player’s choice already made assuming the role of
PD player will be used in the interaction. If a subject is assigned the role of third party punisher,
the player’s choice under one of the four scenarios (scenarios (a), (b), (c) and (d)) will be used to
punish each PD player in the group, dependent on the actual sending decisions of the PD players.
We note that third parties in the experiment do not receive any material gains through
punishment, although they incur costs for imposing punishment. In most real-world situations
described in Section 1, however, third parties are members of a given community and can
indirectly benefit from their punitive actions. Thus, we can interpret the punishment intensity we
measure in this study as a conservative estimate; therefore, this setup will suffice our aim to
study the role of third party punishment in the evolution of cooperation, as in past research (e.g.,
Fehr and Fischbacher, 2004; Kamei, 2017b).
We also note that all individual-level data are treated as independent because we employ
the strategy method and subjects are not given any information feedback on their decisions until
the end. This would help secure a high statistical power to study group size effects.19
2.3. Experimental Procedure
19 Using a between-subjects design is not practical because we aim to compare PD players’ and third parties’ behaviors among four different group sizes, and the largest group size is 12.
12
All experimental sessions were conducted at the Centre for Experimental Economics
Laboratory at the University of York in the United Kingdom in May and June 2017. There were
three sufficiently high partitions (one in front and two on the sides) between each desk. A total of
144 students there participated in the experiment (Table 1). Invitation messages were sent to all
eligible subjects in the database in hroot (Bock et al., 2015); subsequently subjects voluntarily
registered for and participated in the experiment. The experiment was programmed with the z-
Tree software (Fischbacher, 2007). The experiment (including subject payment) lasted around 50
minutes on average. The average payment was 8.44 pounds sterling. With the same experimental
procedure, two additional experiments were conducted from August through October 2017 (see
Sections 5 and 6). In total, 96 students at the University of York participated in the additional
sessions (Table 1).20 All the instructions were neutrally framed. Words with positive or negative
connotations (e.g., “punish;” “cooperate”) were avoided (see Appendix B for the instructions).
3. Related Literature on Group Size Effects
A large volume of experimental literature in dilemma situations has documented that
people’s free-riding behaviors may depend on group size. However, the impact of group size
depends on the formats of the games. First, there is a classic body of work on N-person
prisoner’s dilemma games. It indicates that as the group size increases the percentage of subjects
selecting cooperative actions tends to decrease but the total number of cooperators increases (see,
e.g., Hamburger et al. [1975], Fox and Guyer [1977]).21
Initiated by Isaac and Walker (1988), scholars have also studied group size effects using
voluntary contribution mechanisms (also known as public goods games). Past research has found
that the aggregate level of contributions increases as group size increases, similar to the finding
20 The number of subjects per session was 24, except for two sessions in the original treatment and two sessions in
the Voting treatment (it was 12 for these four sessions due to a low show-up rate). 21 Group size effects on the percentage of subjects selecting cooperative actions appear to depend on the payoff
matrix. Some studies found that group size did not affect subjects’ selection of cooperative actions (e.g., Franzen,
1995; Komorita et al., 1980). See also Bonacich et al. (1976), who showed that the sign of group size effects may
depend on payoff matrices.

13
in the N-person prisoner’s dilemmas. Results on the level of individual contributions, however,
differ depending on which experimental parameters are used: the size of the Marginal Per Capita
Return (MPCR) and the type of voluntary contribution mechanism, among others. On the one
hand, in linear voluntary contribution mechanisms (VCMs) with low levels of MPCRs, the level
of individual contributions does not decrease, or may even increase, as group size increases (e.g.,
Isaac et al., 1984; Isaac and Walker, 1988; Isaac et al., 1994; Nosenzo et al., 2015).22,23
However, on the other hand, when the MPCR is high in linear VCMs, the level of individual
contributions decreases, or at most stays at similar levels, as group size increases (see again, e.g.,
Isaac and Walker, 1988; Isaac et al., 1994; Nosenzo et al., 2015). The latter finding is somewhat
similar to the results in N-person prisoner’s dilemmas. Our paper studies the impact of group size
on third party punishment. Notice that the material return for third parties from punishment acts
is zero in our case. Thus, the behaviors of third party punishers may be closer to what is seen
with low MPCRs: the level of individual punishment may not decrease as group size increases.
The impact of group size has also been studied using non-linear VCMs. Past
experimental research found phenomena that are similar to what we see with linear VCMs or N-
person prisoner’s dilemmas: the level of individual contributions decreases only to a small
degree, and thus the size of aggregate contribution amount increases, as group size increases
(e.g., Marwell and Ames, 1979; Guttman, 1986). Field studies provide similar results. For
instance, Goetze et al. (1993), using data on voluntary contributions to public broadcasting, show
that per household contribution amount declines but the aggregate contribution amount increases
as the number of households that receive television signals increases.
Compared with studies using prisoner’s dilemma games or VCMs, to our knowledge,
there are a relatively small number of studies into the effect of group size on punishment. The
impact of group size on direct punishment has been studied by Carpenter (2007), who found that
22 Lipford (1995) provides field evidence that per member contribution amount to a church does not decline as the
membership increases. 23 See Zelmer (2003) for a meta analysis, which finds that, on average, group size is a positive predictor for the
mean contribution in a group.

14
individual expenditure on second party punishment decreases as group size increases. Regarding
third party punishment, the closest studies to ours are Lewisch et al. (2011) and Kamei (2017b).
Lewisch et al. (2011) studied the impact of group size in the case where third parties can punish
a dictator who plays a dictator game. They found that the average strength of individual
punishment to dictators decreases but the strength of aggregate punishment increases as the
number of third parties in a group increases from one to two. Kamei (2017b), using prisoner’s
dilemma games as second party interactions, found a similar phenomenon in a specific setup
where each third party punisher’s action is made known to the other punisher in the group (see
the I-P-P and 2-I-P-S treatments). These two studies compared punishment strength between one
and two third party punishers only. In contrast, the present paper studies group size effects by
systematically changing the number of third parties and also by exploring the driving forces
behind the group size effects observed in the laboratory.
4. Result
This section is devoted to the analysis of the experimental data. We will first report the
behavior of PD players (Section 4.1). We will then study how the group size affected third
parties’ punitive actions (Sections 4.2 and 4.3).
4.1. Sending Decisions of PD Players
PD players’ decisions to send are affected by the number of third party punishers per
group. As shown in Fig. 2, the percentage of PD players who chose to send 10 points
monotonically increases as the number of third party punishers increases in a group. The
percentage is 47.9% when the group size is three, whereas it is 70.8% when the group size is 12.
In order to study the statistical significance of the group size effect, we conducted a
regression analysis with the dependent variable being a dummy that equals 1 if a subject sends
10 points to the partner, and 0 otherwise. The independent variables include three group size
dummies (the reference group is subjects’ sending decisions when the group size is three). As

15
shown in Table 3, the percentages of subjects that send 10 points are significantly larger when
the group size is six or 12, compared with when the group size is three or four (see column (1)).24
Result 1: The higher the number of third party punishers there are in a group, the greater
likelihood that PD players will send 10 points to their partners.
4.2. Third Party Punishment and Group Size
We now move on to the behaviors of third parties. Table 2 reports the frequency of
punishment as well as the average punishment points per third party player, by scenario and by
group size. We will first compare third parties’ punishment behaviors between scenarios and will
then study how their punishment behaviors in a given scenario are affected by group size.
4.2.1. Comparison between different scenarios
Three clear phenomena were found. First, third party punishment is widespread, in
agreement with past research (e.g., Fehr and Fischbacher, 2004; Kamei, 2017b). In particular,
third party punishment is more frequently imposed when third parties encounter an unfair
economic transaction (i.e., scenario (b)) than in any other situation (see Table 2(I)). The
frequency of third party punishment in scenario (b) is greater than 50%. The difference in the
frequency between scenario (b) and any other scenario is significant (Appendix Table A.2). This
result holds regardless of group size. Second, the same holds also when we use punishment
strength for comparisons, for each group size. The average punishment points that third parties
impose are significantly stronger in scenario (b) than in any other scenario (Table 2(II), Table
A.2). Third, not only the frequency of punishment but also the punishment intensity in scenario
(d) is significantly stronger than in scenario (a) [Table 2, Table A.2]. This holds for each group
size. This is also consistent with past studies (e.g., Fehr and Fischbacher, 2004; Kamei, 2017b).
Result 2: (i) Regardless of group size, third parties impose punishment significantly more
frequently in scenario (b) than in other scenarios. (ii) The punishment intensity in scenario (b) is
24 We also conducted a regression while having a group size variable (= 3, 4, 6, 12) instead of the treatment dummies
as an independent variable. This shows that the group size variable is a significantly positive predictor for PD players’ decisions to send.

16
also significantly stronger than in other scenarios. (iii) Not only the frequency of third party
punishment, but also the punishment intensity, is stronger in scenario (d) than in scenario (a),
for each group size.
Result 2 implies that the behavioral findings in the past research, including Fehr and
Fischbacher (2004), extend to different group sizes.
4.2.2. Comparison between different group sizes
How do the third parties’ punishment behaviors differ by group size? We found that
punishment patterns are similar between different group sizes (Result 2), but there is an
interesting pattern for scenario (b). Table 2 shows that while the frequencies of punishment in
scenario (b) do not change by group size, the punishment strength per third party seems to
decrease, although only to a small degree, as the number of third parties in a group increases. We
take a regression approach to investigate whether the decrease in the punishment strength is
significant (see column (2) in Table 3). The dependent variable is the punishment points that
third party punisher i imposes on a defector in scenario (b). Group size dummies are included as
independent variables. The estimation indicates that per third party player punishment strength in
scenario (b) is significantly weaker for group sizes of 4 and 12 than for a group size of 3. It also
shows that the strength is significantly weaker for a group size of 12 than for a group size of
6.25,26 However, the decrease rate is small, and each third party on average imposes sizable
punishment even with a large group size. We also explored whether such a group size effect is
present in third parties’ punishment acts in scenarios (a), (c) and (d). However, we did not find
significant correlations between punishment strength and group sizes in those three scenarios
(Appendix Table A.4).
25 Although third parties played the game under different group sizes in a random order (see Section 2), there was a
chance that their behaviors were affected by the orders of group sizes realized. A close look at the data indicates that
third parties’ punishment behaviors were not affected by such possible order effects. As shown in Appendix Table A.3, we performed regressions while controlling for the ordering of realized group sizes. The estimation reveals
almost the same results as Table 3. 26 See again Table 2. We also conducted a regression with a group size variable (= 3, 4, 6, 12), instead of group size
dummies, being an independent variable. The estimation shows that per third party player punishment strength in
scenario (b) decreases significantly as the group size increases.

17
Result 3: (i) The third party punishers’ punishment strength in scenario (b) significantly
decreases as the number of the punishers increases in a group, but the decrease rate is very
small. (ii) Such a group size effect is not observed in scenarios (a), (c) and (d).
Punishment activities in scenario (b) play a key role in limiting norm violations. Because
of Result 3(i), the total punishment points received by a PD player in scenario (b) [i.e., average
punishment points in Table 2(II), multiplied by N – 2 (the number of third parties)] is
significantly increasing with N (see Appendix Table A.5). Such strong positive correlations can
also be seen with punishment in scenario (d). These suggest that third party punishment is more
effective in limiting the opportunistic behavior of PD players the more third party punishers there
are in a group.
Result 4: The larger number of third party punishers there are in a group, the more strongly
norm violators are punished.
The fact that punishment intensity per third party declines only mildly, and thus the level
of aggregate punishment increases, as the group size grows implies that past findings on group
size effects from N-person prisoner’s dilemmas and voluntary contribution games, overviewed in
Section 3, hold also for the case of third party punishment.27 This result, nevertheless, has both
positive and negative implications for a community, as will be explained in Section 4.3.
4.3. Incentive Changes with Third Party Punishment
27 As an anonymous referee pointed out, the use of the strategy method where everyone selects to cooperate or
defect in addition to third party punishment decisions (see Section 2) before the actual role is assigned may
potentially have increased the punishment strength because third parties may have realized the virtue of mutual
cooperation through the cooperation decisions they made, which could be in effect if they were assigned the role of
PD player in the experiment. However, while we cannot say that as in Fehr and Fischbacher (2004) our third party
players are fully disinterested third parties, they are still less affected in the first-stage prisoner’s dilemma decisions
than most of third parties in the real-world situations where they are members of the community, considering that
our third parties do not interact with others as PD players, nor are they informed of possible results of the games.
(For example, in the cattle-trespass case in Shasta County [Ellickson, 1991], all ranchers decide whether or not to
build fence and they also learn what their neighbors or others decide.) If the third parties were directly involved in
the prisoner’s dilemma other than the relevant dilemma interaction, as is the case with the real-world examples, we
can imagine that the punishment level could be even higher. Our results could therefore still be treated as a
conservative estimate.

18
How effective is third party punishment to stop a PD player from selecting defection? To
explore this question, we first examine how the incentives of the PD player change because of
punishment. Panel (A) of Fig. 3 shows the payoff matrix for each group size when the average
total reductions that PD players received are considered.28 This reveals a clear impact of third
party punishment. When the group size is three, defection (not sending 10 points) is the strictly
dominant strategy for a PD player, and the unique Nash Equilibrium (NE) is mutual defection.
When the group size is four, defection is no longer the strictly dominant strategy, and the
situation a PD player faces is a coordination game, where both mutual cooperation and mutual
defection are Nash Equilibria (NEs). When the group size is six or 12, cooperation (sending 10
points) is the strictly dominant strategy for a PD player, and mutual cooperation is the unique
NE.
Second, we calculated the expected payoffs when a PD player selects to cooperate as well
as when the player selects to defect, as in Kamei (2017b). We can do so by calculating the
expected payoff from each action choice using the percentage of cooperators in the samples (Fig.
2) and average payoffs for the four scenarios (panel (A) of Fig. 3). Three clear patterns were
found (see panel (B) of Fig. 3). First, the expected payoff from selecting defection monotonically
decreases as the number of third party punishers in a group increases. When the number of third
party punishers is four or ten, a PD player would receive a higher expected payoff when she
selects to send 10 points compared to when she does not do so.29 Second, however, we observe
over-punishment when the group size is 12 since third parties’ inclinations to punish are not that
sensitive to the number of third parties present in a group (Result 3(i)). In this treatment
condition, a defector would not even obtain a positive payoff. This means that the third parties
had unnecessarily high costs for punishment. This implies that we may need some institutions
28 Average reductions due to punishment points received, calculated based on Table 2, were subtracted from the
stage 1 payoff in each scenario. 29 In Kamei (2017b), third party punishment was a sufficient deterrent even when there were only two independent
third party punishers per group, in a setup where each punisher’s punitive actions were made known to the other
punisher in the group. This suggests that the results in the present experiment could be at the lower end of people’s punishment intensity considering that punitive actions were not at all revealed to peer punishers in the present paper.

19
that help third parties coordinate punitive acts in order for these to inflict punishment efficiently.
Third, due to some third parties’ punishment of cooperators, even cooperators would be hurt
severely in expectation if there are a large number of third party punishers (see also Appendix
Table A.5). The expected payoff from selecting cooperation when there are ten third parties is
13.42 points, which is around half the expected payoff from selecting cooperation when the
number of third parties in a group is one (26.60 points) [see again panel (B) of Fig. 3].
Result 5: The relative advantage for a PD player to select defection compared with cooperation
decreases as the number of third party punishers in a group increases. The expected payoff is
lower when she selects defection than when she selects cooperation if the group size is six or 12.
When the group size is 12, however, the total punishment is so large that a defector does not
obtain a positive expected payoff, and even a cooperator can be hurt by perverse punishment.
5. Causes of Over-punishment with Large Group Size
We found that third party punishers tend to free ride on others’ punitive actions as the
number of third party punishers in a group increases (Result 3(i)). However, the free-riding
behaviors are very weak; accordingly, third party punishment as a whole becomes a sufficient
deterrent if there are a sufficiently large number of third party punishers in a group (Result 5).
Due to this, our data showed two issues of third party punishment. First, when the number of
third party punishers is too large, cooperators could be hurt severely by some punishers’ perverse
punishment. Second, norm violators could be heavily punished in a very large group, making
their payoffs far below zero (Fig. 3).
In our view, there are two potential reasons for the third parties’ low level of free-riding
behavior:
(i) Third parties believe that other third parties spend large amounts on punishing PD players
(e.g., Fischbacher et al., 2001; Fischbacher and Gächter, 2010; Kamei, 2014, 2017a).
(ii) Third parties enjoy the act of punishment itself (e.g., Casari and Luini, 2009; Fudenberg and
Parag, 2010).

20
There is past experimental evidence that supports both explanations. First, people are known to
be conditionally cooperative upon others’ cooperation behaviors (e.g., Fischbacher and Gächter,
2010). In the context of punishment, in their second party interactions agents impose direct
punishment on norm violators positively proportional to other punishers’ punishment acts, even
if such punitive actions are privately costly (Kamei, 2014, 2017a). This is because the punishers
are concerned about income inequality with other punishers in their groups, rather than
inequality with the norm violators.30 If the “conditional punishment” hypothesis is applicable for
third party punishment, third parties may inflict in aggregate unnecessarily strong punishment on
norm violators if they believe that others will carry large costs for punishment. Second, subjects
may not be satisfied even if their peers inflict punishment (explanation (ii)). For instance, Casari
and Luini (2009) compared punishment decisions when subjects simultaneously decide the
strength of punishment as in Fehr and Gächter (2000), with when subjects are randomly given a
turn to punish while seeing how much punishment the target has received before their turn. The
latter sequential procedure makes it easier for subjects to coordinate on punishment. Casari and
Luini (2009) found that frequencies of punishment and total punishment received by free riders
are similar between the simultaneous and sequential procedures. If the “enjoy” hypothesis
(explanation (ii)) is more appropriate in our context, third parties would on average impose
strong punishment to satisfy their desire to punish, regardless of group size and their belief on
the peers’ punishment acts.
In order to study which explanation is more appropriate, we conducted an additional
treatment in which subjects played a one-shot third party punishment game with a group size of
12, and third parties were asked to answer their beliefs regarding their peers’ average punishment
behaviors in addition to deciding on their own punishment intensity. We call this the “Belief
Elicitation” experiment (Table 1). As in the original experiment, the strategy method was used to
30 See also Kamei and Putterman (2018) for experimental evidence of conditional punishment in the case of costly
reporting of defectors by cooperators in a prisoner’s dilemma.

21
elicit subjects’ punishment behaviors and their beliefs.31 The belief elicitation task was
incentivized. If a subject was assigned the role of a third party punisher, she was paid based on
either her actual punishment behavior realized or the accuracy of the belief elicitation task (one of
the two was randomly selected for payment by the computer). The other design pieces were the
same as the original experiment: with the same strategy method, all subjects made sending
decisions as a PD player and punishment decisions as a third party punisher, with a group size of
12 (see Appendix B.2 for the instructions).
The additional data first show that the pattern of third party punishment is similar to that
in the original experiment. The average punishment points per third party were 0.625, 5.083,
0.521, and 2.250, in scenarios (a), (b), (c) and (d), respectively.32 The high punishment intensity
in scenario (b) seen in the Belief Elicitation experiment is consistent with the over-punishment
result reported in Section 4.3. A PD player’s expected payoff from selecting defection, calculated
as in panel (B) of Fig. 3, is much smaller than 0, –87.19 (see panel (B) of Fig. 5).33 Once third
party punishment is taken into account, the unique NE is mutual cooperation as in the original
experiment with a group size of 12 (see panel (A1) of Fig. 5).
Third parties’ punishment of cooperators was also observed in the additional experiment.
Although as mentioned above, the average punishment per third party was relatively small in
scenarios (a) and (c), a PD player will receive a negative payoff in expectation due to a large
number of third parties if scenario (c) occurs – the player cooperates but his counterpart defects
(see panel (A1) of Fig. 5). The PD players’ expected payoff from selecting cooperation is
31 Unlike the original experiment, we did not let subjects play the games with four different group sizes because we
wanted to avoid making the additional experiment too complex for subjects and also because the additional
experiment aims to study the issue of over-punishment with a large group size by eliciting beliefs. 32 Punishment intensity was, however, stronger in the additional experiment than in the original experiment with a
group size of 12. It could mean that third parties’ inclinations to punish are not at all sensitive to the number of other
third parties in a group. However, this perhaps occurred by chance: more pro-social subjects might have participated
in the Belief Elicitation experiment. This is confirmed by observing the percentage of PD players who sent 10
points. This percentage was 81.3%, which is higher than the percentage in the original experiment with a group size
of 12 (70.8%). We note that Results 1, 3 and 4 were obtained by controlling for individual characteristics thanks to
the within-subjects design. 33 As in the original experiment, we did not take money from subjects and their payoffs were set to zero in the cases
where their payoffs were negative.

22
calculated as 21.21 points, still about 20% lower than the expected payoff from selecting
cooperation when there is a single third party punisher (26.60 points) [see panel (B) of Fig. 3 and
panel (B) of Fig. 5].
We will now study third parties’ punishment behaviors in relation to their beliefs on the
others’ punishment acts (Fig. 4). Two clear patterns were found. First, third parties’ punishment
intensity targeted at a norm violator is significantly positively correlated with their beliefs
regarding other third parties’ punishment intensity (see the graphs for scenarios (b) and (d)).
Second, interestingly, third parties’ punishment acts towards a cooperator are likewise
significantly positively correlated with their beliefs on others’ such perverse punishment
behaviors, although the majority of third party players did not engage in such punishment (see
the graphs for scenarios (a) and (c)).34 These findings resonate with the idea that third parties
impose punishment based on their beliefs on other third party punishers’ behaviors and that they
are concerned about income inequality amongst them.
Result 6: Third parties’ punishment intensity in each scenario is positively correlated with their
beliefs on other punishers’ punishment behaviors. Result 6 suggests that third party punishers’ low level of free-riding behavior seen in the
original experiment may have been driven by subjects’ conditional punishment behaviors. This
implies that the over-punishment problem could be mitigated if some coordination mechanisms
on third party punishment were present. Nevertheless, we acknowledge that we cannot fully rule
out the possibility that the “enjoy” hypothesis may partly account for the positive correlations
between the third parties’ own punishment and their beliefs. If third parties gain utility from
punishment acts themselves, they may believe that their peers would also enjoy punishment (e.g.,
social projection).
6. Coordinated Punishment and Discussions
34 Similar conditional punishment targeted at a cooperator was likewise observed in the case of second party
punishment (e.g., Kamei 2014, 2017a).

23
One possible way to mitigate the third parties’ over-punishment phenomenon is to allow
them to construct rules that regulate their punishment activities. People’s ability to
democratically construct rules that govern punishment activities has been documented, whether it
is in the form of self-governance or centralized regulations (e.g., Ostrom, 1990; Ertan et al.,
2009; Putterman et al., 2011; Kamei et al., 2015). If over-punishment of norm violators
happened due to mis-coordination among third parties, it could be attenuated if we let third
parties collectively implement rules on punishment. In addition, considering the fact that a
minority of third parties were engaged in perverse punishment of cooperators, the majority may
outperform the minority’s preferences if an appropriate democratic process is available. In this
sense, having some formal enforcement based on democracy may be beneficial. Nevertheless, it
is unclear how people implement rules for punishing norm violators. Past studies, including
Ertan et al. (2009), Putterman et al. (2011) and Kamei et al. (2015), let subjects collectively
select rules for their on-going interactions in setups where rules can materially benefit the
constituents. For instance, in Putterman et al. (2011), most groups collectively selected
sanctioning rules that make contributing full amounts to the group account the strictly dominant
strategy in a linear VCM (see also Kamei et al. [2015]). In the setups where rules are too weak to
change the equilibrium for material payoffs, however, it is known that a non-negligible fraction
of people vote against the rules. For instance, in Kamei (2016), 53% of subjects voted against
implementing non-deterrent sanctions for free-riding in a linear VCM (see also Tyran and Feld
[2006]). In our case, third parties’ punishment activities can help PD players who select
cooperation, but not the third parties themselves. Third party players would be materially better
off if they prohibit punishment by voting because punishment is costly.
We conducted an additional experiment where third parties could implement a binding
rule, which we call the “Voting” experiment (Table 1). As in the Belief Elicitation experiment,
group size was 12, and subjects played the game in a one-shot environment. At the onset of the
Voting experiment, subjects were randomly assigned to a group of 12; subsequently, all subjects
made sending decisions (Fig. 1), assuming that they were assigned the role of PD player. Their

24
decisions were used only when they were assigned the role of PD player. Once all subjects had
made the decisions, the computer randomly assigned the role of PD player to two persons and the
role of third party player to ten persons in each group. Next, third party players democratically
decided the levels of punishment with the strategy method. The same strategy method as in the
other treatments was used. Specifically, third parties voted on the levels of punishment each third
party player should impose under the four scenarios. If third parties collectively decided that each
person should spend c punishment points in a scenario, then a total of 10c punishment points
would be imposed on the PD player when that scenario happened. The median of the votes was
selected in each scenario as an agreement among the third parties. When the median was not an
integer, either the fifth or sixth value (in descending order) was randomly selected by the
computer. In this reduction stage, there were no decisions for PD players to make. The beliefs
were not elicited from third parties in this Voting experiment to simplify the design. Subjects were
informed of the PD players’ sending decisions in their groups at the end of the experiment (see
Appendix B.3 for the instructions).
We note that constructing an effective rule under the median voting rule is not an easy
task. This is because if subjects were to vote similarly to what they chose as their independent
punishment points in the original experiment, the group might not reach a sufficiently deterrent
rule. In the original experiment with a group size of 12, the median values of third parties’
punishment points were 0, 1, 0 and 0 in scenarios (a), (b), (c) and (d), respectively. If this occurs
as a group’s vote outcome, a defector would collectively receive 10 (=1×10) punishment points if
scenario (b) happens and would not receive any punishment if scenario (d) happens. The payoff
matrix after deducting the total punishment amounts would become a coordination game where
both mutual cooperation and mutual defection are NEs. The reason why a defector would receive
such a low level of punishment in this simulation is that 43.7% and 59.0% of third parties do not
inflict any punishment in scenarios (b) and (d), respectively, in the original experiment with a
group size of 12 (see panel (I) of Table 2). This suggests that to build a deterrent rule, third parties
would need to propose punishment levels that are different from the ones they would choose if

25
they were independent. Nevertheless, third parties may attempt to build a deterrent, but not too
strong, rule, considering that ten third parties in a group are assured that they incur the same cost
for punishment and therefore they would obtain the same payoff.
A total of 48 students participated in the Voting experiment. The percentage of those who
sent 10 points was 64.6%. There were four independent observations for third party players’
collective choices (i.e., four groups) in this additional experiment. Among others, two interesting
patterns were found. First, no cooperators received punishment in all groups, whether their
matched partners were cooperators or defectors (panel (C) of Fig. 5), because the majority voted
against punishment of cooperators. As a result, the expected payoff when a PD player selected
cooperation was at a very high level, namely 34.38 points (see panel (B) of Fig. 5). This suggests
that democratic decision-making is indeed a powerful tool to limit the perverse behaviors of a
minority of subjects. Second, over-punishment of a norm violator was not seen in three out of four
groups (groups 1 to 3 in panel (C)).35 Overall, a defector received a much lower payoff in
expectation compared with a cooperator. However, the negative size of the expected payoff from
selecting defection is small, –5.00 points (panel (B)), while the unique NE is mutual cooperation
(panel (A2)).36 The result that the collective decision-making procedure well mitigates the over-
punishment problem can explain the real world observations why some societies with weak or no
formal institutions, such as Turkana, have a collective decision-making procedure to determine a
level of punishment targeted at a norm violator if a severe sanction is considered.
Result 7: Third parties do not punish cooperators when they democratically decide on the level
of punishment that each third party punisher inflicts. The strength of punishment targeted at
norm violators is also lower when it is decided democratically, but it is a sufficient deterrent.
35 We note that over-punishment of norm violators was observed in group 4 even under the median voting rule. This
may mean that the strong punishment targeted at a norm violator is more difficult to be resolved, compared with
punishment of cooperators. 36 Each third party player’s voting decision can be treated as independent because this was their very first decision as
a third party player before interacting with their peers. The median voting rule was used in the experiment. Thus, in
calculating the payoff matrix in panel (A2) and the expected payoffs in panel (B) of Fig. 5, we used the median
values of all third parties’ voting preferences, assuming that the distribution of 40 third party players’ votes is approximately the distribution of people’s preferences in the sample.

26
In our experiment, the strength of collective punishment was determined by the subjects’
median opinion. There are other voting rules, such as consensus and super-majority rule. How much
the extent to which people can resolve the over-punishment of norm violators and punishment of
cooperators differs by the voting rule would be an exciting area for further research.
We note that there are other forms of collective decision-making procedures without
formally determining the punishment level unlike in our study. For example, another potential
rule could be to allow subjects to impose punishment in a decentralized manner only when a
certain number of persons agree on it (e.g., Casari and Luini, 2009; Ertan et al., 2009). For
instance, in one treatment of Casari and Luini (2009), a player was punished only when at least
two members requested it in a linear VCM with a group size of five. In Ertan et al. (2009), a
player was allowed to inflict punishment in a decentralized manner if the majority of members
voted for such punishment in a linear VCM with a group size of four. With these agreement
procedures, informal sanctioning activities were disciplined and high contributions were
achieved in both Casari and Luini (2009), and Ertan et al. (2009). This kind of procedure could
also work for third party punishment.
An alternative to constructing binding rules is to have unbinding rules, backed by peer
monitoring of third party punishment acts and decentralized punishment of punishers (e.g.,
Ostrom, 1990), instead of using coercive schemes. A large body of the literature on “order
without law” discussed in Section 1 also suggests that this could work under some conditions.
Related to this, allowing people to be engaged in higher-order punishment without having
any rule-making may also discipline third parties’ behaviors. Punishment of cooperators or the
failure to punish a norm violator could be punished by their peers if second-order punishment is
allowed (e.g., Denant-Boemont et al., 2007; Henrich and Boyd, 2001). Or perhaps, only having a
threat of higher-order punishment or making punishment acts visible to others could be sufficient
enough to make punishment better targeted and more effective (e.g., Kamei and Putterman,
2015; Kamei, 2017b).

27
Lastly, needless to say, letting third party punishers communicate with each other could
also help resolve the over-punishment problem (e.g., Ostrom et al. [1992] and Bochet et al.
[2006] for the case of direct punishment).
7. Conclusion
How people’s free-riding behaviors may differ by group size is one of the central
questions in public choice research, initiated by Olson (1965). This paper examined how people’s
third party punishment behaviors could differ by the number of third parties in a group.
Decentralized third party enforcement is recognized as an important factor in regulating our
societies, whether they have well-developed formal institutions or not. Our experiment found that
per third party player punishment strength decreases at most only mildly as the number of third
party players increases in a group. The third parties’ low level of free-riding behavior benefits
prisoner’s dilemma interactions when the number of third parties is relatively large because
aggregate punishment becomes a sufficient deterrent against PD players selecting defection.
However, when the number of third parties was ten in a group, we observed over-punishment
problems: not only were defectors too heavily punished, but cooperators were also hurt severely
by perverse punishment. This suggests that some device in coordinating punishment is desirable
for a very large group because of the over-punishment phenomenon, rather than the third parties’
free-riding possibility. Although the results are clear, there are many areas where further research
is needed to extend our findings. For example, it would be a useful robustness check to study the
same research question with a different punishment technology (e.g., with cost ratio of 1:2). It
would also be useful to examine the same question when direct punishment is also available in
the prisoner’s dilemma interactions. Considering that second party punishment is a substitute for
third party punishment, third parties’ inclinations to punish may diminish, while their free-riding
behavior may also increase, in that condition as group size grows.
This paper further showed that the third parties’ low level of free-riding behavior may be
caused by their conditional punishment behaviors. Moreover, using an additional experiment, we

28
showed that people are able to mitigate the over-punishment problem once we allow third parties
to democratically construct a rule to regulate their punishment activities, and thus having a large
group could be beneficial if we have appropriate coordination mechanisms in a society.
Nevertheless, what happens if there are many more third parties, say 50, 100 or even more, in a
group? We cannot answer this question using only our data. It may be difficult for those involved
to regulate their punishment activities by rules, for example for reasons such as a more
challenging process to implement a rule that is acceptable to everyone. In addition, sharing
information of norm violations among all third parties in an entire community may no longer be
cost-free, unlike in our experimental setup (e.g., Milgrom et al., 1990; Dixit, 2004). If these are
the cases, some form of hierarchical structure or dissolution of a group into small sub-groups, for
example as discussed in Olson (1965), may be needed for coordinated decentralized punishment
to be successful. On the other hand, considering past studies on private ordering (e.g., Mathew
and Boyd, 2011; Hadfield and Weingast, 2013), third parties may be able to regulate their
activities democratically by setting a binding rule as in our study, or even merely by
implementing an unbinding rule regardless of group size if a complementary legal institution
such as courts is available. Studying this question in a controlled environment would be an
interesting area for future research.
REFERENCES
Becker, G., 1968. Crime and Punishment: An Economic Approach. Journal of Political
Economy 76(2): 169-217.
Bernstein, L., 1992. Opting out of the Legal System: Extralegal Contractual Relations in the
Diamond Industry. Journal of Legal Studies 21(1): 115-157.
Bochet, O., Page, T., Putterman, L., 2006. Communication and punishment in voluntary
contribution experiments. Journal of Economic Behavior & Organization 60(1): 11-26.
Bock, O., Baetge, I., Nicklisch, A., 2014. hroot: Hamburg Registration and Organization Online
Tool. European Economic Review 71: 117-120.
Bonacich, P., Shure, G., Kahan, J., Meeker, R., 1976. Cooperation and Group Size in the N-
Person Prisoners’ Dilemma. Journal of Conflict Resolution 20(4): 687-706.
Carpenter, J., 2007. Punishing free-riders: How group size affects mutual monitoring and the
provision of public goods. Games and Economic Behavior 60: 31-51.

29
Carpenter, J., Matthews, P., 2012. Norm Enforcement: Anger, Indignation, or Reciprocity?
Journal of European Economic Association 10: 555-572.
Carugati, F., Hadfield, G., Weingast, B., 2017. Building Legal Order in Ancient Athens. Journal
of Legal Analysis 7(2): 291-324.
Casari, M., Luini, L., 2009. Cooperation under alternative punishment institutions: An
experiment. Journal of Economic Behavior and Organization 71: 273-282.
Congleton, R., 2015. The Logic of Collective Action and Beyond. Public Choice 164: 217-234.
Cooter, R., 1996. Decentralized Law for a Complex Economy: The Structural Approach to
Adjudicating the New Law Merchant. University of Pennsylvania Law Review 144: 1643-1696.
Crockett, M., 2017. Moral Outrage in the Digital Age. Nature Human Behaviour 1: 769-771.
Denant-Boemont, L., Masclet, D., Noussair, C., 2007. Punishment, counterpunishment and
sanction enforcement in a social dilemma experiment. Economic Theory 33(1): 145-167.
Dixit, A., 2004. Lawlessness and Economics: Alternative Models of Governance. Princeton,
New Jersey: Princeton University Press.
Ellickson, R., 1991. Order without law: how neighbors settle disputes. Cambridge, Mass.:
Harvard University Press.
Ellison, G., 1994. Cooperation in the Prisoner's Dilemma with Anonymous Random Matching.
Review of Economic Studies 61(3): 567-588.
Ertan, A., Page, T., Putterman, L., 2009. Who to punish? Individual decisions and majority rule
in mitigating the free rider problem. European Economic Review 53(5): 495-511.
Fehr, E., Fischbacher, U., 2004. Third-Party Punishment and Social Norms. Evolution and
Human Behavior 25(2): 63-87.
Fehr, E., Schmidt, K., 1999. A Theory of Fairness, Competition, and Cooperation. Quarterly
Journal of Economics 114(3): 817-868.
Fischbacher, U., 2007. z-Tree: Zurich toolbox for ready-made economic experiments.
Experimental Economics 10(2): 171-178.
Fischbacher, U., Gächter, S., 2010. Social Preferences, Beliefs, and the Dynamics of Free Riding
in Public Good Experiments. American Economic Review 100(1): 541-56.
Fischbacher, U., Gächter, S., Fehr, E., 2001. Are people conditionally cooperative? Evidence
from a public goods experiment. Economics Letters 71(3): 397-404.
Fox, J., Guyer, M., 1977. Group Size and Others' Strategy in an N-Person Game. Journal of
Conflict Resolution 21(2): 323-338.
Franzen, A., 1995. Group Size and One-Shot Collective Action. Rationality and Society 7(2):
183-200.
Fudenberg, D., Pathak, P., 2010. Unobserved punishment supports cooperation. Journal of
Public Economics 94: 78-86.

30
Goette, L., Huffman, D., Meier, S., 2006. The impact of group membership on cooperation and
norm enforcement: Evidence using random assignment to real social groups. American
Economic Review 96(2): 212-216.
Goetze, L., Glover, T., Biswas, B., 1993. The Effects of Group Size and Income on
Contributions to the Corporation for Public Broadcasting. Public Choice 77(2): 407-414.
Greif, A., 1993. Contract Enforceability and Economic Institutions in Early Trade: The Maghribi
Traders' Coalition. American Economic Review 83(3): 525-48.
Greif, A., 1997. Contracting, Enforcement, and Efficiency: Economics Beyond the Law. Annual
World Bank Conference on Development Economics, pp. 239-66.
Guttman, J., 1986. Matching behavior in collective action: Some experimental evidence. Journal
of Economic Behavior and Organization 7(2): 171-198.
Hadfield, G., Weingast, B., 2012. What is Law? A Coordination Model of the Characteristics of
Legal Order. Journal of Legal Analysis 4(2): 471-514.
Hadfield, G., Weingast, B., 2013. Law without the State Legal Attributes and the Coordination
of Decentralized Collective Punishment. Journal of Law and Courts 1(1): 3-34.
Hamburger, H., Guyer, M., Fox, J., 1975. Group Size and Cooperation. Journal of Conflict
Resolution 19(3): 503-531.
Henrich, J., Boyd, R., 2001. Why People Punish Defectors: Weak Conformist Transmission Can
Stabilize Costly Enforcement of Norms in Cooperative Dilemmas. Journal of Theoretical
Biology 208(1): 79-89.
Henrich, J., McElreath, R., Barr, A., Ensminger, J., Barrett, C., Bolyanatz, A., Cardenas, J.,
Gurven, M., Gwako, E., Henrich, N., Lesorogol, C., Marlowe, F., Tracer, D., Ziker, J., 2006.
“Costly punishment across human societies.” Science 1767-1770.
Isaac, M., Walker, J., 1988. Group Size Effects in Public Goods Provision: The Voluntary
Contributions Mechanism. Quarterly Journal of Economics 103(1): 179-199.
Isaac, M., Walker, J., Thomas, S., 1984. Divergent evidence on free riding: An Experimental
examination of possible explanations. Public Choice 43(2): 113-149.
Isaac, M., Walker, J., Williams, A., 1994. Group size and the voluntary provision of public goods:
Experimental evidence utilizing large groups. Journal of Public Economics 54(1): 1-36.
Jordan, J., McAuliffe, K., Rand, D., 2016. The effects of endowment size and strategy method on
third party punishment. Experimental Economics 19(4): 741-763.
Kamei, K., 2014. Conditional Punishment. Economics Letters, 124(2): 199-202.
Kamei, K., 2016. Democracy and resilient pro-social behavioral change: an experimental study.
Social Choice and Welfare 47(2): 359-378.
Kamei, K., 2017a. Conditional Punishment in England. Economics Bulletin, 37(2), p.A74.
Kamei, K., 2017b. Altruistic Norm Enforcement and Decision-Making Format in a Dilemma:
Experimental Evidence. Available at https://papers.ssrn.com/abstract=2912543.

31
Kamei, K., Putterman, L., 2015. In broad daylight: Fuller information and higher-order
punishment opportunities can promote cooperation. Journal of Economic Behavior and
Organization 120: 145-159.
Kamei, K., Putterman, L., 2018. “Reputation Transmission without Benefit to the Reporter: a
Behavioral Underpinning of Markets in Experimental Focus.” Economic Inquiry 56(1): 158-172.
Kamei, K., Putterman, L., Tyran, J.-R., 2015. State or nature? Endogenous formal versus
informal sanctions in the voluntary provision of public goods. Experimental Economics 18(1):
38-65.
Kandori, M., 1992. Social Norms and Community Enforcement. Review of Economic Studies
59(1): 63-80.
Komorita, S., Sweeney, J., Kravitz, D., 1980. Cooperative Choice in the N-Person Dilemma
Situation. Journal of Personality and Social Psychology 38(3): 504-516.
Krinninger, T., 2016. Mob justice in Africa: Why people take the law into their own hands.
Deutsche Welle, May 5.
Kurzban, R., DeScioli, P., O’Brien, E., 2007. Audience effects on moralistic punishment.
Evolution and Human Behavior 28: 75-84.
Lanni, A., 2009. Social Norms in the Courts of Ancient Athens. Journal of Legal Analysis 1:
691-736.
Lergetporer, P., Angerer, S., Glätzle-Rützler, D., Sutter, M., 2014. Third-party punishment
increases cooperation in children through (misaligned) expectations and conditional
cooperation. Proceedings of the National Academy of Sciences 111: 6916-6921.
Lewisch, P., Ottone, S., Ponzano, F., 2011. Free-Riding on Altruistic Punishment? An
Experimental Comparison of Third-Party Punishment in a Stand-Alone and in an In-Group
Environment. Review of Law & Economics 7(1): 161-190.
Lipford, J., 1993. Group size and the free-rider hypothesis: An examination of new evidence
from churches. Public Choice 83: 291-303.
Marlowe, F., Berbesque, C., Barrett, C., Bolyanatz, A., Gurven, M., Tracer, D., 2010. The
‘spiteful’ origins of human cooperation. Proceedings of the Royal Society B 278: 2159-2164.
Marwell, G., Ames, R., 1979. Experiments on the Provision of Public Goods. I. Resources,
Interest, Group Size, and the Free-Rider Problem.” American Journal of Sociology 84(6): 1335-
1360.
Masten, S., Prüfer, J., 2014. On the Evolution of Collective Enforcement Institutions:
Communities and Courts. Journal of Legal Studies 43(2): 359-400.
Mathew, S., Boyd, R., 2011. Punishment sustains large-scale cooperation in prestate warfare.
Proceedings of National Academy of Sciences 108(28): 11375-11380.
McAdams, R., 1997. The Origin, Development, and Regulation of Norms. Michigan Law Review
96(2): 338-433.
32
McMillan, J., Woodruff, C., 1999a. Interfirm Relationships and Informal Credit in Vietnam.
Quarterly Journal of Economics 114(4): 1285-1320.
McMillan, J., Woodruff, C., 1999b. Dispute Prevention without Courts in Vietnam. Journal of
Law, Economics & Organization 15(3): 637-658.
Milgrom, P., North, D., Weingast, R., 1990. The Role of Institutions in the Revival of Trade: The
Law Merchant, Private Judges, and the Champagne Fairs. Economics and Politics 1(2): 1-23.
Nicholas, S., Maitland, E., 2007. Private Sector Development: How Business Interacts with
Informal Institutions. In J. Johannes, D. Denis, B. Sebastian, and S. Indra (eds), Development
Centre Studies Informal Institutions How Social Norms Help or Hinder Development: How
Social Norms Help or Hinder Development: pp.109-129, OECD Publishing.
Nelissen, R, Zeelenberg, M., 2009. Moral emotions as determinants of third-party punishment:
Anger, guilt, and the functions of altruistic sanctions. Judgment and Decision Making 4(7):
543-553.
Nosenzo, D., Quercia, S., Sefton, M., 2015. Cooperation in small groups: the effect of group
size. Experimental Economics 18: 4-14.
Olson, M., 1965. The Logic of Collective Action. Cambridge, Mass.: Harvard University Press.
Ostrom, E., 1990. Governing the Commons: The Evolution of Institutions for Collective Action.
Cambridge University Press.
Ostrom, E., 2000. Collective Action and the Evolution of Social Norms. Journal of Economic
Perspectives 14(3): 137-158.
Ostrom, E., Walker, J., Gardner, R., 1992. Covenants With and Without a Sword: Self-
Governance is Possible. American Political Science Review 86(2): 404-417.
Pecorino, P., 2015. Olson’s Logic of Collective Action at fifty. Public Choice 162(3-4): 243-262.
Putterman, L., Tyran, J.-R., Kamei, K., 2011. Public Goods and Voting on Formal Sanction
Schemes. Journal of Public Economics 95(9-10): 1213-22.
Sandler, T., 2015. Collective action: fifty years later. Public Choice 164(3-4): 195-216.
Tabellini, G., 2010. Culture and Institutions: Economic Development in the Regions of Europe.
Journal of European Economic Association 8(4): 677-716.
Tyran, J.-R., Feld, L., 2006. Achieving Compliance when Legal Sanctions are Non-deterrent.
Scandinavian Journal of Economics 108(1): 135-156.
Williamson, C., 2009. Informal institutions rule: institutional arrangements and economic
performance. Public Choice 139(3-4): 371-87.
Williamson, C., Kerekes, C., 2011. Securing Private Property: Formal versus Informal
Institutions. Journal of Law & Economics 54: 537-572.
Zelmer, J., 2003. Linear Public Goods Experiments: A Meta-Analysis. Experimental Economics
6: 299-310.

33
Table 1: Summary of Treatments
Experiment
condition#1
Subjects’ decisions Belief
elicitation
Voting Total number
of subjects
Original
Experiment
Four treatment
conditions (group
size = 3, 4, 6, 12)#2
All subjects make decisions as a
PD player and a third party
punisher.
No No 144
Additional
Experiment 1
(“Belief Elicitation”)
group size = 12 All subjects make decisions as a
PD player and a third party
punisher.
Yes No 48
Additional
Experiment 2
(“Voting”)
group size = 12 All subjects make decisions as a
PD player. Subjects who are
randomly assigned the role of a
third party player make
punishment decisions.
No Yes 48
Total 240
Notes: #1 The number of third party players is N – 2, where N is group size. #2 A within-subjects design was used.

34
Fig. 1: Payoff Matrix
Player 1
Send
(Cooperate)
Not Send
(Defect)
Player 2 Send
(Cooperate) 45, 45 15, 55
Not Send
(Defect) 55, 15 25, 25
Note: This payoff matrix is from Fehr and Fischbacher (2004).
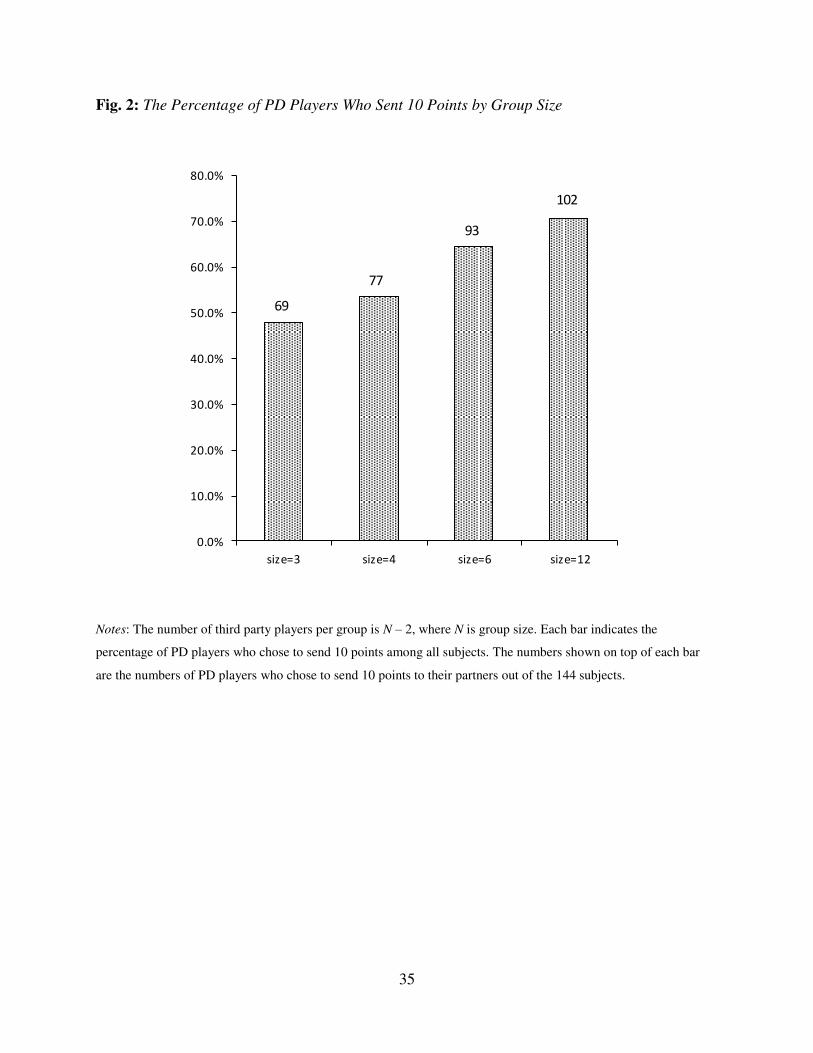
35
Fig. 2: The Percentage of PD Players Who Sent 10 Points by Group Size
Notes: The number of third party players per group is N – 2, where N is group size. Each bar indicates the
percentage of PD players who chose to send 10 points among all subjects. The numbers shown on top of each bar
are the numbers of PD players who chose to send 10 points to their partners out of the 144 subjects.
0.0%
10.0%
20.0%
30.0%
40.0%
50.0%
60.0%
70.0%
80.0%
size=3 size=4 size=6 size=12
69
77
93
102

36
Table 2: Third Party Punishment by Group Size, and by Scenario
(I) The Percentage of Subjects Who Imposed Positive Punishment Points
Target of
punishment:
Group size:
A cooperator who
interacted with a
cooperator
[Scenario (a)]
A defector who
interacted with a
cooperator
[Scenario (b)]
A cooperator who
interacted with a
defector
[Scenario (c)]
A defector who
interacted with a
defector
[Scenario (d)]
3 24.3% 55.6% 16.7% 41.0%
4 22.2% 55.6% 20.8% 40.3%
6 23.6% 61.1% 18.8% 44.4%
12 18.1% 56.3% 16.7% 41.0%
(II) The Average Punishment Points Per Third Party Player
Target of
punishment:
Group size:
A cooperator who
interacted with a
cooperator
[Scenario (a)]
A defector who
interacted with a
cooperator
[Scenario (b)]
A cooperator who
interacted with a
defector
[Scenario (c)]
A defector who
interacted with a
defector
[Scenario (d)]
3 1.042 4.104 0.819 1.854
4 1.014 3.076 1.118 1.792
6 0.813 3.563 0.944 1.951
12 0.757 2.722 0.771 1.806
Note: For each punishment point a third party player assigned to a PD player, one point was deducted from the third
party player and three points were deducted from the PD player.

37
Table 3: The Impact of Group Size on the Sending Behavior of PD players, and on the
Punishment Behavior of Third Parties in Scenario (b)
Dependent variable:
Independent
variables:
A dummy which equals 1(0) if a
PD player sent (did not send) 10
points to the partner
Punishment points that a third party
assigned to a defector who interacted
with a cooperator [Scenario (b)]
(1) (2)
(i) Group size 4 dummy {= 1
if group size is four; = 0
otherwise}
.139
(.095)
-1.028***
(.361)
(ii) Group size 6 dummy {=
1 if group size is six; = 0
otherwise}
.426***
(.102)
-.542
(.416)
(iii) Group size 12 dummy
{= 1 if group size is 12; = 0
otherwise}
.601***
(.121)
-1.382***
(.384)
Constant -.052
(.105)
4.104***
(.456)
# of observations 576 576
Chi-squared (F) 28.28 5.45
Prob > Chi-squared (F) .0000*** .0014***
Two-sided p-value for
Chi-squared test (F test)
H0: (i) = (ii) .0029*** .1963
H0: (i) = (iii) .0001*** .2153
H0: (ii) = (iii) .0817* .0071***
Notes: Probit regressions with robust standard errors clustered by subject ID in column (1). Linear regressions with
robust standard errors clustered by subject ID in column (2). The numbers in parenthesis are robust standard errors.
The reference groups in column (1) and column (2) are subjects’ sending and punishment decisions, respectively,
when the group size is three. See Appendix Table A.3 for a robustness check when possible order effects are
controlled for.
*, **, and *** indicate significance at the .10 level, at the .05 level and at the .01 level, respectively.

38
Fig. 3: Payoff Matrix after Punishment, and PD Players’ Expected Payoff
Send Not Send Send Not Send
Send 41.9, 41.9 12.5, 42.7 Send 38.9, 38.9 8.3, 36.5
Not Send 42.7, 12.5 19.4, 19.4 Not Send 36.5, 8.3 14.3, 14.3
(A1) Group size of 3 (A2) Group size of 4
Send Not Send Send Not Send
Send 35.3, 35.3 3.7, 12.3 Send 22.3, 22.3 -8.1, -26.7
Not Send 12.3, 3.7 1.6, 1.6 Not Send -26.7, -8.1 -29.2, -29.2
(A3) Group size of 6 (A4) Group size of 12
(A) Payoff matrix after the average total punishment PD players received is subtracted
(B) PD players’ expected payoff
Notes: The shaded cells in panel (A) are Nash Equilibria. The unit of vertical axis in panel (B) is points. In the case
where a PD player received a negative payoff in the experiment, the player’s payoff was set to zero (we did not take
money from the subject).
26.624.7 24.1
13.4
30.6
26.2
8.5
-27.4
-40
-30
-20
-10
0
10
20
30
40
when subject i selects to cooperate
when subject i selects to defect
group size = 3 group size = 4 group size = 6
group size = 12

39
Fig. 4: Subjects’ Own Punishment Behaviors and Beliefs on Other Third Parties’ Punishment
Notes: The horizontal axis (x-axis) is subjects’ beliefs on other punishers’ average punishment points. The vertical axis (y-axis) is subjects’ own punishment points. The size of each point indicates its frequency. The numbers in
parenthesis in the linear equations (OLS) in figures are robust standard errors. The slope in each line is significantly
positive (p < .000). Two-sided F tests do not reject the null that the slope is equal to 1 with p = .7598, p = .8111, p
= .4541, and p = .2062, in scenarios (a), (b), (c) and (d), respectively.
y = 1.054x - 0.317
(0.224) (0.863)
R² = 0.469
0
2
4
6
8
10
12
14
16
18
20
0 2 4 6 8 10 12 14 16 18 20
Linear line that fits data
Belief on peers' avg. punishment
y = 1.075x - 0.271
(0.245) (0.117)
R² = 0.632
0
2
4
6
8
10
12
14
16
18
20
0 2 4 6 8 10 12 14 16 18 20
Belief on peers' avg. punishment
Linear line that fits data
y = 0.920x - 0.323
(0.106) (0.092)
R² = 0.814
0
2
4
6
8
10
12
14
16
18
20
0 2 4 6 8 10 12 14 16 18 20
Belief on peers' avg. punishment
Linear line that fits data
y = 0.819x + 0.254
(0.141) (0 .312)
R² = 0.557
0
2
4
6
8
10
12
14
16
18
20
0 2 4 6 8 10 12 14 16 18 20
Belief on peers' avg. punishment
Linear line that fits data
Scenario (a) [punishment to a cooperator who
interacted with a cooperator]
Scenario (b) [punishment to a defector who
interacted with a cooperator]
Scenario (c) [punishment to a cooperator who
interacted with a defector]
Scenario (d) [punishment to a defector who
interacted with a defector]

40
Fig. 5: Incentive Changes with Punishment in the Two Additional Treatments
Send Not Send Send Not Send
Send 26.3, 26.3 -0.6, -97.5 Send 45.0, 45.0 15.0, -5.0
Not Send -97.5, -0.6 -42.5, -42.5 Not Send -5.0, 15.0 -5.0, -5.0
(A1) Belief Elicitation Experiment (A2) Voting Experiment
(A) Payoff matrix after the average total punishment PD players received is subtracted
(B) PD players’ expected payoff (C) Vote outcomes for each player B’s level of punishment in the Voting experiment#1
Notes: The shaded cells in panel (A) are Nash Equilibria. #1 The median values were integers, except the following
two cases. First, the median vote for scenario (d) in group 1 was 0.5. The computer randomly selected 0 as each
player B’s level of reduction points. Second, the median vote for scenario (d) in group 3 was 1.5. The computer
randomly selected 2 as each player B’s level of reduction points.
21.2
34.4
-87.2
-5.0
-100
-80
-60
-40
-20
0
20
40
60
when subject i selects to cooperate
when subject i selects to defect
Belief Elicitation
experimentVoting experiment
scenario a scenario b scenario c scenario d
group 1 0 2 0 0
group 2 0 1 0 0
group 3 0 2 0 2
group 4 0 5 0 3
Median of all
third parties0.00 2.00 0.00 1.00

1
Research Highlights:
Punishment intensity per third party decreases only mildly as the number of third party
punishers increases in a group where a prisoner’s dilemma interaction takes place.
Having a sufficiently large number of third parties is helpful in preventing players from
selecting defection because of third party punishment.
Having too many third party players is harmful because aggregate punishment becomes too
strong and even cooperators might be punished severely.
Third parties’ punishment intensity is positively correlated with their beliefs on peers’ punishment behaviors.
Third parties prohibit punishment of cooperators and limit over-punishment targeted at norm
violators when they are given a chance to democratically decide on the levels of punishment
through voting.

1
Appendix A: Additional Tables
Table A.1: The Difference in PD Players’ Sending Rate by Treatment (supplementing Fig. 2 and
Table 3 in the paper)
[Fisher’s exact tests:]
The numbers below indicate two-sided p-values for Fisher’s exact tests to compare PD players’
sending rates between the treatments:
Group size = 3 Group size = 4 Group size = 6 Group size = 12
Group size = 3 --- .409 .006*** .000***
Group size = 4 --- --- .072* .002***
Group size = 6 --- --- --- .157
Group size = 12 --- --- --- ---
Note: *, **, and *** indicate significance at the .10 level, at the .05 level and at the .01 level, respectively.

2
Table A.2: Comparison of the Strength of Third Party Punishment between Different Scenarios
(supplementing Table 2 of the paper)
[For panel (I) of Table 2:]
Dependent variable: A dummy which equals 1 if third party punisher i imposed positive
punishment points on a PD player, and 0 otherwise
Treatment:
Independent
variables:
Group size =3 Group size =4 Group size =6 Group size =12
(1) (2) (3) (4)
(i) Scenario (a) dummy .24***
(.036)
.22***
(.035)
.24***
(.036)
.18***
(.032)
(ii) Scenario (b) dummy .56***
(.042)
.56***
(.042)
.61***
(.041)
.56***
(.042)
(iii) Scenario (c) dummy .17***
(.031)
.21***
(.034)
.19***
(.033)
.17***
(.031)
(iv) Scenario (d) dummy .41***
(.041)
.40***
(.041)
.44***
(.042)
.41***
(.041)
# of observations 576 576 576 576
F 45.91 48.06 57.38 46.56
Prob > F .0000*** .0000*** .0000*** .0000***
Two-sided p-value for
F test
H0: (i) = (ii) .0000*** .0000*** .0000*** .0000***
H0: (i) = (iii) .0113** .6721 .1461 .6399
H0: (i) = (iv) .0001*** .0000*** .0000*** .0000***
H0: (ii) = (iii) .0000*** .0000*** .0000*** .0000***
H0: (ii) = (iv) .0000*** .0000*** .0000*** .0000***
H0: (iii) = (iv) .0000*** .0001*** .0000*** .0000***
Notes: Linear regressions (linear probability model) without constant terms, and with robust standard errors clustered
by subject ID. The numbers in parenthesis are standard errors.
*, **, and *** indicate significance at the .10 level, at the .05 level and at the .01 level, respectively.

3
[For panel (II) of Table 2:]
Dependent variable: Punishment points given from third party punisher i to a PD player
Treatment:
Independent
variables:
Group size =3 Group size =4 Group size =6 Group size =12
(1) (2) (3) (4)
(i) Scenario (a) dummy 1.04***
(.23)
1.01***
(.24)
.81***
(.19)
.76***
(.24)
(ii) Scenario (b) dummy 4.10***
(.46)
3.08***
(.36)
3.56***
(.40)
2.72***
(.34)
(iii) Scenario (c) dummy .82***
(.24)
1.12***
(.26)
.94***
(.27)
.77***
(.22)
(iv) Scenario (d) dummy 1.85***
(.29)
1.79***
(.31)
1.95***
(.32)
1.81***
(.34)
# of observations 576 576 576 576
F 22.94 21.72 21.07 17.01
Prob > F .0000*** .0000*** .0000*** .0000***
Two-sided p-value for
F test
H0: (i) = (ii) .0000*** .0000*** .0000*** .0000***
H0: (i) = (iii) .3467 .6568 .5897 .9390
H0: (i) = (iv) .0178** .0335** .0015*** .0018***
H0: (ii) = (iii) .0000*** .0000*** .0000*** .0000***
H0: (ii) = (iv) .0000*** .0000*** .0000*** .0001***
H0: (iii) = (iv) .0014*** .0629* .0031*** .0004***
Notes: Linear regressions without constant terms, and with robust standard errors clustered by subject ID. The
numbers in parenthesis are standard errors.
*, **, and *** indicate significance at the .10 level, at the .05 level and at the .01 level, respectively.

4
Table A.3: Possible Order Effects (supplementing Table 3 in the paper)
In the experiment, in order to rule out potential order effects, subjects played the game for
four different group sizes in a random order. Subjects’ decisions might be affected by the realized
orders of group sizes, nevertheless. If this is the case, results shown in Table 3 of the paper might
have been affected by such potential order effects. A close look at the data shows that our results
reported in Table 3 are not due to potential order effects.
To study possible order effects, we compared the percentages in which PD players chose
to send 10 points (cooperate) between two group sizes while controlling for realized orders of the
two group sizes. We also compared third party players’ decisions to inflict punishment between
two group sizes controlling for realized orders of the two group sizes. These comparisons were
conducted for any possible two group sizes (e.g., 3 versus 12). As summarized in the following
tables, we have qualitatively the same results even when we control for potential order effects.
(A) PD players’ selection of sending 10 points (cooperating)
We studied group size effects on PD players while having an Order dummy as an independent
variable to control for possible order effects. Results shown below are almost the same as Table 3
of the paper.
Dependent variable: A dummy which equals 1(0) if a PD player sent (did not send) 10 points to
the partner
Comparison:
Independent
variables:
Group size
3 versus 4
Group size
3 versus 6
Group size
3 versus 12
Group size
4 versus 6
Group size
4 versus 12
Group size
6 versus 12
(1) (2) (3) (4) (5) (6)
(i) Group size 4 dummy
{= 1 if group size is four;
= 0 otherwise}
.139
(.095) --- --- --- --- ---
(ii) Group size 6 dummy
{= 1 if group size is six;
= 0 otherwise}
--- .428***
(.103) ---
.288***
(.096) --- ---
(iii) Group size 12
dummy {= 1 if group
size is 12; = 0
otherwise}
--- --- .601***
(.121) ---
.462***
(.120)
.175*
(.100)
Order dummy {= 1 if the
smaller group size was
realized earlier; = 0
otherwise.}#1
-.070
(.215)
-.173
(.208)
-.065
(.194)
.156
(.192)
.021
(.179)
-.119
(.231)

5
Constant .0002
(.192)
.077
(.184)
-.004
(.173)
.022
(.132)
.076
(.143)
.464**
(.208)
Data used in the
regression
Decisions
when size
= 3 or 4
Decisions
when size
= 3 or 6
Decisions
when size =
3 or 12
Decisions
when size
= 4 or 6
Decisions
when size
= 4 or 12
Decisions
when size
= 6 or 12
Reference group Group
size of 3
Group
size of 3
Group
size of 3
Group
size of 4
Group
size of 4
Group
size of 6
# of observations 288 288 288 288 288 288
Chi-squared 2.25 18.20 24.81 9.60 14.83 3.32
Prob > Chi-squared .3246 .0001 .0000 .0082 .0006 .1905
Notes: Probit regressions with robust standard errors clustered by subject ID. The numbers in parenthesis are robust
standard errors. The reference group in each regression is subjects’ punishment decisions in the smaller group. #1 The Order dummy in column (1) equals 1 if a subject made a decision in the smaller group (size = 3) before the
larger group (size = 4), and 0 otherwise. The Order dummy in column (2) equals 1 if a subject made a decision in the
smaller group (size = 3) before the larger group (size = 6), and 0 otherwise. The Order dummy in column (3) equals
1 if a subject made a decision in the smaller group (size = 3) before the larger group (size = 12), and 0 otherwise. The
Order dummy in column (4) equals 1 if a subject made a decision in the smaller group (size = 4) before the larger
group (size = 6), and 0 otherwise. The Order dummy in column (5) equals 1 if a subject made a decision in the
smaller group (size = 4) before the larger group (size = 12), and 0 otherwise. The Order dummy in column (6) equals
1 if a subject made a decision in the smaller group (size = 6) before the larger group (size = 12), and 0 otherwise.
*, **, and *** indicate significance at the .10 level, at the .05 level and at the .01 level, respectively.
RESULT: Results on PD players’ sending decisions reported in Table 3 in the paper are robust
when controlling for order effects. The results little change when controlling for realized orders
of the group sizes in regressions: PD players are significantly more likely to send 10 points when
the group size is six or 12, compared with when the group size is three or four.

6
(B) Third party players’ decisions to punish in scenario (b)
As in Part (A) of Table A.3, we studied group size effects on third party players’ punishment decisions while having an Order dummy as an independent variable to control for possible order
effects. Results shown below are almost the same as Table 3 of the paper.
Dependent variable: Punishment points that a third party player assigned to a defector who
interacted with a cooperator [Scenario (b)]
Comparison:
Independent
variables:
Group size
3 versus 4
Group size
3 versus 6
Group size
3 versus 12
Group size
4 versus 6
Group size
4 versus 12
Group size
6 versus 12
(1) (2) (3) (4) (5) (6)
(i) Group size 4 dummy
{= 1 if group size is four;
= 0 otherwise}
-1.028***
(.361) --- --- --- --- ---
(ii) Group size 6 dummy
{= 1 if group size is six;
= 0 otherwise}
--- -.542
(.417) ---
.486
(.375) --- ---
(iii) Group size 12
dummy {= 1 if group
size is 12; = 0
otherwise}
--- --- -1.382***
(.385) ---
-.354
(.284)
-.840***
(.308)
Order dummy {= 1 if the
smaller group size was
realized earlier; = 0
otherwise.}#1
-.843
(.811)
.056
(.783)
-.394
(.773)
-.276
(.637)
.938
(.635)
1.116*
(.619)
Constant 4.736***
(.726)
4.063***
(.686)
4.399***
(.685)
3.191***
(.488)
2.608***
(.450)
2.726***
(.472)
Data used in the
regression
Decisions
when size
= 3 or 4
Decisions
when size
= 3 or 6
Decisions
when size =
3 or 12
Decisions
when size
= 4 or 6
Decisions
when size
= 4 or 12
Decisions
when size
= 6 or 12
Reference group Group
size of 3
Group
size of 3
Group
size of 3
Group
size of 4
Group
size of 4
Group
size of 6
# of observations 288 288 288 288 288 288
F 4.85 .85 7.01 .4134 2.03 4.62
Prob > F .0092 .4314 .0012 .0038 .1350 .0114
Notes: Linear regressions with robust standard errors clustered by subject ID. The numbers in parenthesis are robust
standard errors. The reference group in each regression is subjects’ punishment decisions in the smaller group. #1 The Order dummy in column (1) equals 1 if a subject made a decision in the smaller group (size = 3) before the
larger group (size = 4), and 0 otherwise. The Order dummy in column (2) equals 1 if a subject made a decision in the
smaller group (size = 3) before the larger group (size = 6), and 0 otherwise. The Order dummy in column (3) equals
1 if a subject made a decision in the smaller group (size = 3) before the larger group (size = 12), and 0 otherwise. The

7
Order dummy in column (4) equals 1 if a subject made a decision in the smaller group (size = 4) before the larger
group (size = 6), and 0 otherwise. The Order dummy in column (5) equals 1 if a subject made a decision in the
smaller group (size = 4) before the larger group (size = 12), and 0 otherwise. The Order dummy in column (6) equals
1 if a subject made a decision in the smaller group (size = 6) before the larger group (size = 12), and 0 otherwise.
*, **, and *** indicate significance at the .10 level, at the .05 level and at the .01 level, respectively.
RESULT: Results on third party players’ punishment decisions reported in Table 3 in the paper
are robust. They little change when controlling for realized orders of the group sizes.
Specifically, third parties’ punishment points in scenario (b) are significantly smaller with a
group size of four than with a group size of three (see column (1) in the table above). Also, third
parties’ punishment points in scenario (b) are significantly smaller with a group size of 12 than
with a group size of three (see column (3) in the table above). Lastly, third parties’ punishment points in scenario (b) are significantly smaller with a group size of 12 than with a group size of
six (see column (6) in the table above).
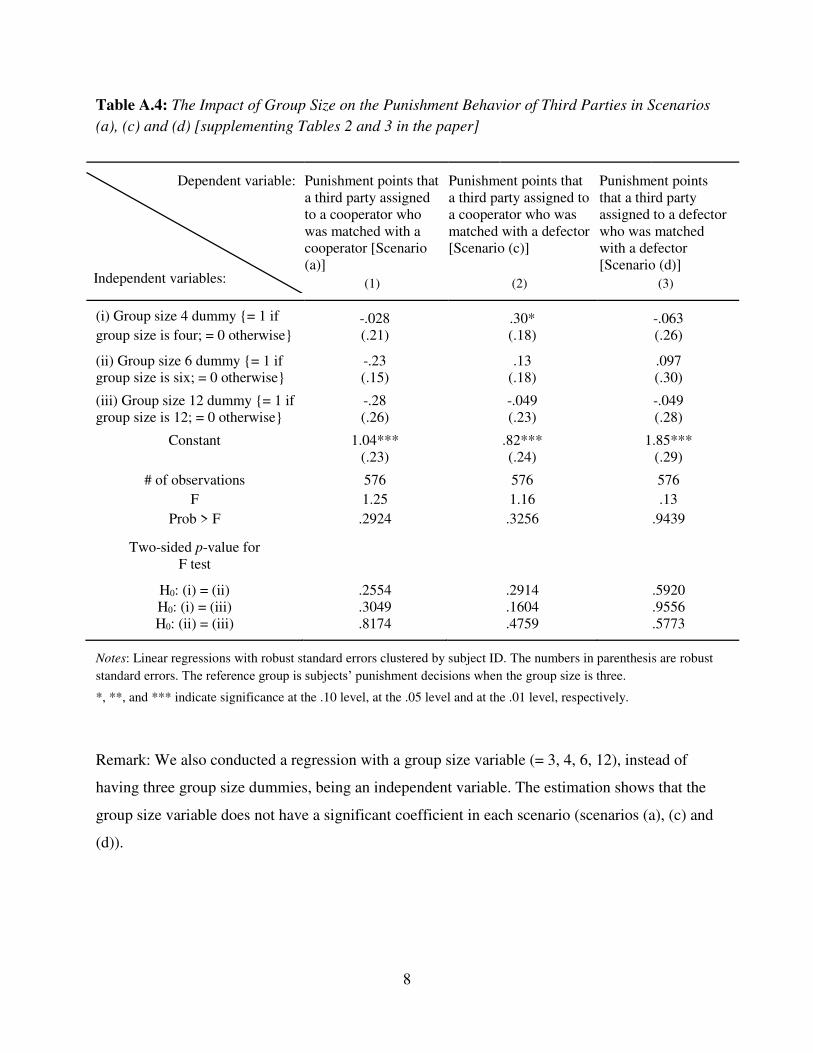
8
Table A.4: The Impact of Group Size on the Punishment Behavior of Third Parties in Scenarios
(a), (c) and (d) [supplementing Tables 2 and 3 in the paper]
Dependent variable:
Independent variables:
Punishment points that
a third party assigned
to a cooperator who
was matched with a
cooperator [Scenario
(a)]
Punishment points that
a third party assigned to
a cooperator who was
matched with a defector
[Scenario (c)]
Punishment points
that a third party
assigned to a defector
who was matched
with a defector
[Scenario (d)]
(1) (2) (3)
(i) Group size 4 dummy {= 1 if
group size is four; = 0 otherwise}
-.028
(.21)
.30*
(.18)
-.063
(.26)
(ii) Group size 6 dummy {= 1 if
group size is six; = 0 otherwise}
-.23
(.15)
.13
(.18)
.097
(.30)
(iii) Group size 12 dummy {= 1 if
group size is 12; = 0 otherwise}
-.28
(.26)
-.049
(.23)
-.049
(.28)
Constant 1.04***
(.23)
.82***
(.24)
1.85***
(.29)
# of observations 576 576 576
F 1.25 1.16 .13
Prob > F .2924 .3256 .9439
Two-sided p-value for
F test
H0: (i) = (ii) .2554 .2914 .5920
H0: (i) = (iii) .3049 .1604 .9556
H0: (ii) = (iii) .8174 .4759 .5773
Notes: Linear regressions with robust standard errors clustered by subject ID. The numbers in parenthesis are robust
standard errors. The reference group is subjects’ punishment decisions when the group size is three.
*, **, and *** indicate significance at the .10 level, at the .05 level and at the .01 level, respectively.
Remark: We also conducted a regression with a group size variable (= 3, 4, 6, 12), instead of
having three group size dummies, being an independent variable. The estimation shows that the
group size variable does not have a significant coefficient in each scenario (scenarios (a), (c) and
(d)).

9
Table A.5: The Impact of Group Size on the Total Punishment Points Received by a PD Player
Because subjects’ third party punishment decisions were elicited by using the strategy method,
we studied the relationships between total punishment strength and group size with the following
three steps:
Step 1: We calculated the average punishment points imposed by third party individuals in each
scenario, by group size and session.
Step 2: We then, for each session data, calculated the average total punishment points received
by PD players under each scenario by: N – 2 the average strength for a given group size
(calculated in Step 1). Here, N is a given group size [N – 2 is the number of third party punishers
per group].
Step 3: We performed linear regressions using session-level data created in Step 2.
As shown in the table below, the total punishment points received by a defector are strongly
positively correlated with the group sizes both in scenarios (b) and (d). We also find that a
cooperator is more strongly punished in groups with a larger size (see columns (1) and (3)).
Dependent variable:
Independent
variables:
Total punishment
points received by
a PD player in
Scenario (a)
Total punishment
points received by
a PD player in
Scenario (b)
Total punishment
points received by
a PD player in
Scenario (c)
Total punishment
points received
by a PD player in
Scenario (d)
(1) (2) (3) (4)
(i) Group size 4 dummy
{= 1 if group size is
four; = 0 otherwise}
.92**
(.30)
2.38**
(.93)
1.33**
(.40)
1.89**
(.63)
(ii) Group size 6 dummy
{= 1 if group size is six;
= 0 otherwise}
2.06***
(.53)
9.70***
(1.97)
2.72
(1.59)
5.86***
(.90)
(iii) Group size 12
dummy {= 1 if group
size is 12; = 0
otherwise}
5.85*
(2.51)
23.5***
(4.01)
6.29**
(2.06)
16.2***
(3.95)
Constant .94**
(.27)
3.99***
(.51)
.73
(.42)
1.92***
(.34)
# of observations 28 28 28 28
F 8.40 14.30 4.19 21.23
Prob > F .0144** .0038*** .0640* .0014***
Two-sided p-value for F test
H0: (i) = (ii) .1114 .0176** .3313 .0139**
H0: (i) = (iii) .0989* .0011*** .0317** .0088***
H0: (ii) = (iii) .1359 .0098*** .1266 .0258**

10
Notes: Linear regressions with robust standard errors clustered by session ID. The numbers in parenthesis are robust
standard errors. The reference group is session-average total punishment points when the group size is three.
*, **, and *** indicate significance at the .10 level, at the .05 level and at the .01 level, respectively.