Embed Size (px)
Citation preview

Growing Up In Ireland Research Conference 2009

The Health of 9-Year-Olds

Introduction
• GUI provides some of the first nationally representative data on children’s health status and healthcare utilisation.
• Substantial details on physical and health development. Much on basis of maternal report.
• Substantial detail on healthcare use and access to services.

Structure of Presentation
- Child’s health status- Chronic illness- Oral health and healthcare- BMI, obesity and food consumption- GP utilisation- Dental care utilisation- Accidents- Summary / Conclusions

Foundations of health
• Shaped by– Biological– Psychological– Environmental– Social – Spiritual
• Health outcomes– Interaction of genetic & environment
– Plans to develop genetic arm of this study
– Begin in womb - perhaps earlier

Good child health
• A national asset
• Important for their wellbeing & development
• Good predictor of adult health
• Sensitive to socioeconomic variations
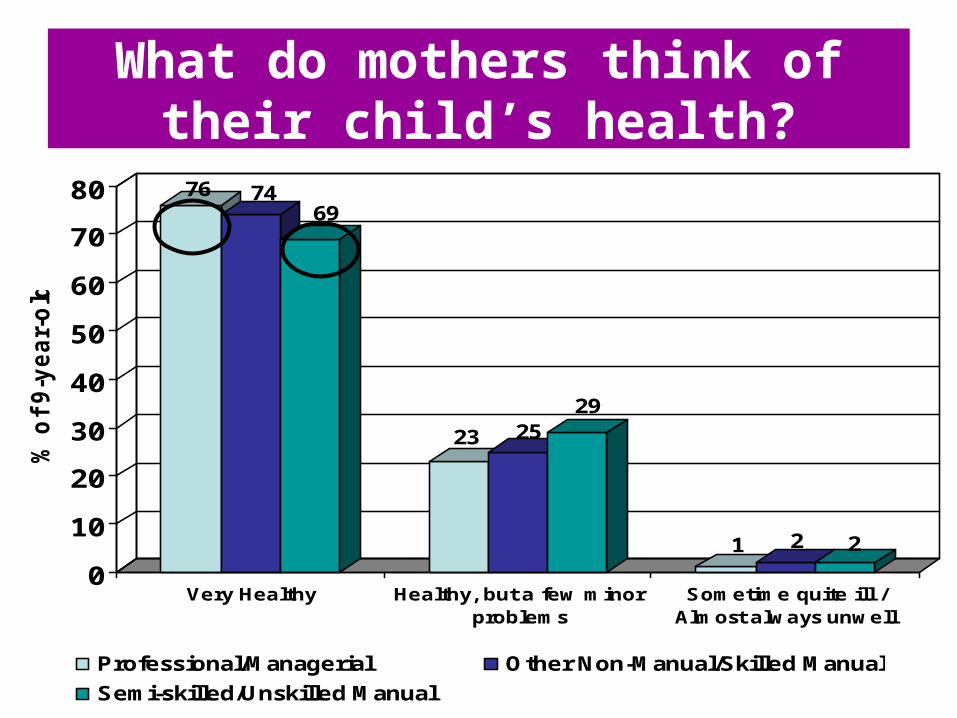
What do mothers think of their child’s health?
76 7469
23 2529
1 2 2
0
10
20
30
40
50
60
70
80
% o
f 9
-ye
ar-
old
s
Very Healthy Healthy, but a few minorproblems
Sometime quite ill /Almost always unwell
Professional/Managerial Other Non-Manual/Skilled Manual
Semi-skilled/Unskilled Manual

Prevalence of chronic illness and impact on daily activities
11% overall
10.2 10.4
14.1
3.3
6.6
9.4
0
2
4
6
8
10
12
14
16
% with chronic illness Child Severely Hampered inDaily Activities
Professional/Managerial Other Non-Manual/Skilled Manual
Semi-skilled/Unskilled Manual

0
5
10
15
20
25
30
35
40
45
50
I llness
Percenta
ge
Male
Female
Total
Chronic illnesses and child’s gender

Strengths & Difficulties Questionnaire (SDQ)
• Short behavioural screening questionnaire
• Used by clinicians & educationalists3 - 16 year olds
• 5 domains– Emotional– Conduct– Hyperactivity/inattention– Peer relationships– Prosocial behaviour

Domain
Emotional 12.5 25.8Conduct 8.7 17.2Hyperactivity 9.9 25.6Peer problems 6.9 20.4Prosocial 1.1 3.1
Total 5.5 20.0
No chronic illness
Chronic illness
Abnormal SDQ Scores (%)
Chronic illness & (SDQ)

Chronic illness & family income
13 14
11
9 9
11
0
2
4
68
10
12
14
16
Per
cent
age
with
ong
oing
chr
onic
ill
ness
Lowest 2nd 3rd 4th Highest Total
Household Annual Income Quintiles

Chronic illness & mother’s education
Chronic Illness and Mother's Education
0
2
4
6
8
10
12
14
16
Low Secondaryor less
Leaving +Vocational
Sub-degree Graduate Total
Educational level attained
Pe
rce
nta
ge
wit
h illn
ess
15
15
9
11
99

Oral Healthcare
Adds up to 6% in total
Children not brushing their teeth at least once per day by income
9
8
5
4
3
0
1
2
3
4
5
6
7
8
9
Lowestincomegroup
2nd 3rd 4th Highestincomegroup

Child’s weight and BMI
78 72 67
18
30
22
48 11
0
10
20
30
40
50
60
70
80
% o
f 9
-ye
ar-
old
s
Non Overweight Overweight Obese
Professional/Managerial Other Non-Manual/Skilled Manual
Semi-skilled/Unskilled Manual

Influence of Parental BMI on the child’s BMI
8981
67
10
1624
14
9
0
10
20
30
40
50
60
70
80
90
Non Overweight Overweight Obese
Neither caregiver overweight or obeseOne caregiver overweight or obeseBoth caregivers overweight

Food consumption and mother’s education
At least one daily portion of various foods by mother’s education
71
86
67
82
22
33
43
27
45
25
65
42
63
40
71
76
0
10
20
30
40
50
60
70
80
90
Fresh Fruit CookedVegetables
RawVegetables or
Salad
Pies, Burgers,Hotdogs
Hot Chips orFrench Fries
Crisps orSavourySnacks
Non--diet SoftDrinks
Biscuits, Cake,Chocolate
Lower secondary or less Degree

Prices of fruit & veg, sugar & sweets, fizzy drinks over 30 years in US.
NEJM 18: 360;2009

Eating Breakfast
Percentage of Children not Eating Breakfast by Family Income
5
4 4
1 1
0
1
2
3
4
5
6
% o
f 9
-ye
ar-
old
s
Lowestincomegroup
2nd 3rd 4th Highestincomegroup
Adds up to 6%
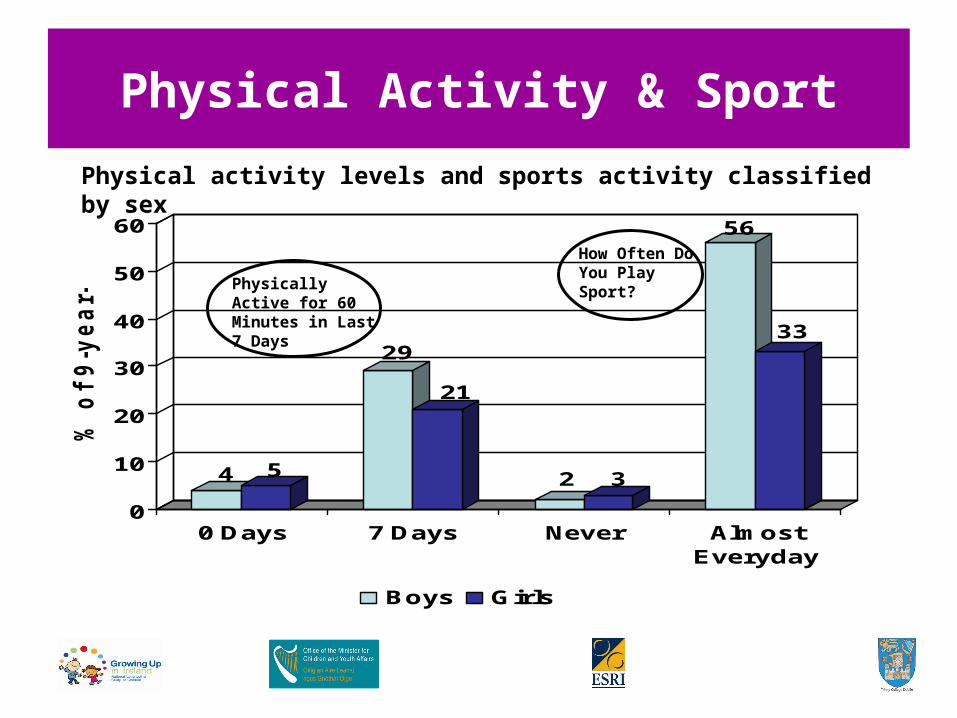
Physical Activity & Sport
Physical activity levels and sports activity classified by sex
4 5
29
21
2 3
56
33
0
10
20
30
40
50
60
% o
f 9
-ye
ar-
old
s
0 Days 7 Days Never AlmostEveryday
Boys Girls
Physically Active for 60 Minutes in Last 7 Days
How Often Do You Play Sport?

Getting to School
Usual mode of transport to school by family social class
23 22
32
11
16 16
64 61
51
2 1 10
10
20
30
40
50
60
70
% o
f 9-y
ea
r-o
lds
Walks Bus/PublicTransport
By Car Cycles
Child's Mode of Transport to School
Professional/Managerial Other Non-Manual/Skilled Manual
Semi-skilled/Unskilled Manual
General Practitioner Care
• Degree of access to GP’s can influence use of other services
• Financing of GP care has raised concerns about access
• Irish studies of adults show important income and medical card effects

GP Consultation and Family Income
Average Number of GP Visits in the Last Year by Sex of Child and Income Group
1
1.4
1.11
0.8
1
0.8 0.8 0.80.9
0
0.2
0.4
0.6
0.8
1
1.2
1.4
1.6
Av
era
ge
nu
mb
er
of
GP
Vis
its
Lowest 2nd 3rd 4th Highest
Boys Girls
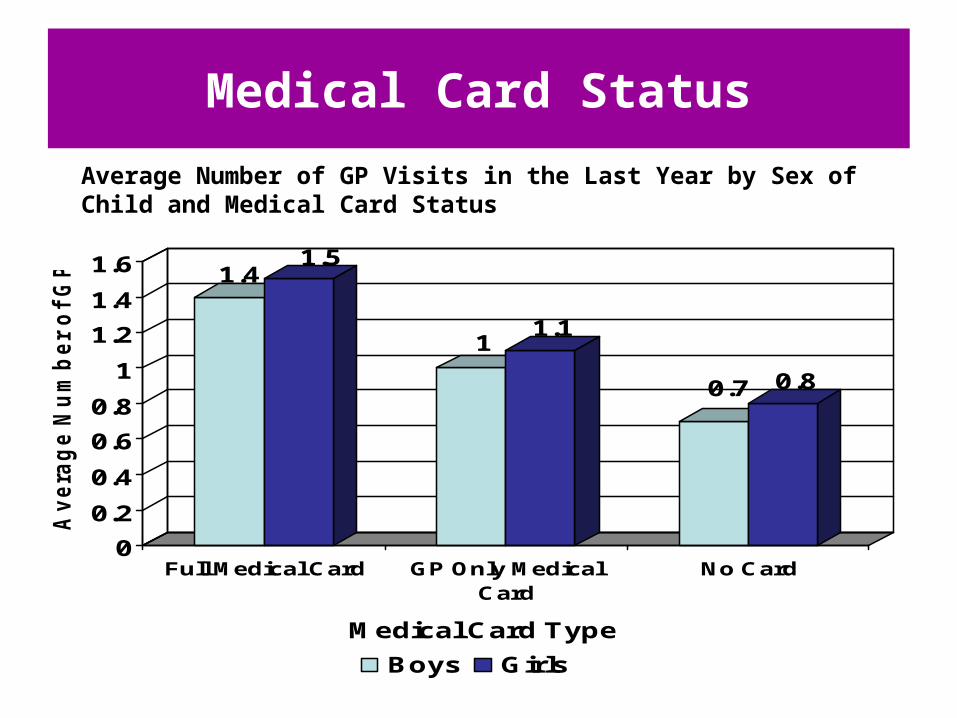
Medical Card Status
Average Number of GP Visits in the Last Year by Sex of Child and Medical Card Status
1.41.5
11.1
0.7 0.8
0
0.2
0.4
0.6
0.8
1
1.2
1.4
1.6
Av
era
ge
Nu
mb
er
of
GP
Vis
its
Full Medical Card GP Only MedicalCard
No Card
Medical Card Type
Boys Girls

General Practitioner Care
• The differential between medical card holders and others is large
• Difficult to say whether this represents ‘over use’ by MC holders or ‘under use’ by non-holders
• Essential to control for level of ‘health need’

GP Consultation and Chronic Illness
Average Number of GP Visits in the Last Year by Chronic Illness, Degree of Hampering and Medical Card Status
0.71
1.5
2.42.2
4.6
3.5
5.1
0
1
2
3
4
5
6
Av
era
ge
Nu
mb
er o
f G
P V
isit
s
No Illness Illness, NoHampering
Illness, SomeHampering
Illness, SevereHampering
No Medical Card Medical Card

Proportion of ‘Medical Card Effect’ Explained
100
1
28
100
19
46
0
20
40
60
80
100
120
Av
era
ge
Nu
mb
er
of
GP
Vis
its
Boys Girls
Basic Difference
Controlling for family characteristics
Controlling for health

Dental Care
• Dental care utilisation among adults follows a different pattern to GP use
• Greater use as income rises largely because of more preventative care
• Studies show significantly poorer dental health among lower income group children

Visiting the Dentist
Percentage visiting their Dentist at least yearly by sex of child and family income group
5355
5459
31
62 64 65
74 71
0
10
20
30
40
50
60
70
80
% o
f 9
-ye
ar-
old
s
Lowest 2nd 3rd 4th Highest
Family Income Group
Boys Girl
Medical Specialists
• Greater health need among lower income groups is reflected in greater use of medical specialists
• As with GP, once we control for health and a number of other characteristics, differences remain

Percentage Visiting a Medical Specialist in the Last Year by Sex of Child and Medical Card
Status
15
19
15
18
0
2
4
6
8
10
12
14
16
18
20
% o
f 9
-ye
ar-
old
s
Boys Girls
No Medical Card Medical Card

Accidents
• Internationally, social disadvantage is associated with higher accident rates
• GUI survey asked about accident or injury requiring hospital treatment
• No class or income gradient in overall accident probability
• Of those that have had an accident there is a gradient in number

Visits to A&E
Percentage Visiting an Accident and Emergency Department in the Last Year Among Boys by Income Group
17 1716
15
13
0
2
4
6
8
10
12
14
16
18
% o
f 9
-ye
ar-
old
s
Lowest 2nd 3rd 4th Highest
Family Income Group

Summary / Conclusions
• The majority are healthy
• Influenced by socioeconomic status, maternal education, sex of child
• 11% have chronic illness - mainly respiratory & mental health & behaviour
• Mental & behaviour problems twice as common in boys
• 19% overweight/obese - more common in girls
• Boys a lot more active and engaged in sports

Summary / Conclusions
• As found among adults, family income and access to a medical card have an impact on utilisation of GP care
• The difference between income groups in GP use is partially explained by differences in health need, but not all
• Dental care utilisation increases with family income though data suggest oral health inversely related to income. This may suggest differences in perceived need for preventative care
• Overall, only 2% of parents report that their child did not receive medical care when required and 5%, dental care
• Of those not receiving care, being on a waiting list predominates

Growing Up In Ireland Research Conference 2009