Embed Size (px)
Citation preview
Growth and product quality of European eel (Anguilla anguilla) as affectedby dietary protein and lipid sources
By U. Luzzana1, M. Scolari2, B. Campo Dall’Orto3, F. Caprino3, G. Turchini3, E. Orban4, F. Sinesio4
and F. Valfre3
1A.S.A. s.r.l. – Agridea, Servizio Nutrizione, San Martino Buon Albergo (VR), Italy; 2Nuova Azzurro S.p.A., Verona, Italy;3Universita degli Studi di Milano, Facolta di Medicina Veterinaria, Dipartimento di Scienze e Tecnologie Veterinarie per laSicurezza Alimentare, Milano, Italy; 4Istituto Nazionale della Nutrizione, Roma, Italy
Summary
A 12-week feeding trial was undertaken to evaluate the effectsof partial replacement of marine raw materials in the diet withsoybean meal and beef tallow on growth and product quality
of European eel (Anguilla anguilla). Based on growth, feedefficiency and chemical composition, soybean meal was foundto be an unsuitable ingredient for eel diets as a substitute for
fishmeal (25% on a protein basis), probably because of the lowdigestibility of its carbohydrate content. However, beef tallowcan be used to replace 50% of fish oil without reduction ingrowth, provided that digestible carbohydrates are present in
the diet. No major effects of protein and lipid sources in thediet were found on fillet chemical composition. Sensoryanalysis revealed no significant differences between fish fed
the control and the experimental diets, with the exception ofsalty taste which was significantly higher in fish fed combinedsoybean meal and beef tallow compared with fish fed the
control diet.
Introduction
Identification of alternative ingredients to reduce the levels ofexpensive marine raw materials in fish diets in recent years hasbecome a priority in order to lower production costs and
improve sustainability of the aquaculture industry (Hardy,1995). The expansion of semi-intensive and intensive farmingsystems, in fact, leads to the prediction of further increases in
the amount of fishmeal consumed by aquaculture, which isexpected to reach 40% of the global production in 2010(Barlow and Pike, 1998). Major benefits would obviously be
expected from fishmeal and oil replacement in carnivorous fishdiets, where these ingredients are present in substantialamounts. Soybean meal has been extensively studied as aprotein source for several fish species, especially salmonids
(Kaushik et al., 1995; Hardy, 1996; Carter and Hauler, 2000),because of its relatively high protein content and goodamino acid balance. Although only a few studies are available
concerning dietary fish oil replacement, Hardy (1998) repor-ted that 4–5% fish oil in coldwater fish diets should satisfyessential fatty acid requirements, and alternative vegetable or
animal lipids may be used in addition as energy sourceswithout reduction in weight gain.European eel (Anguilla anguilla) is a carnivorous fish
(Lecomte-Finiger, 1983) whose commercial diets are basedon high-quality marine raw material; nevertheless, only a fewstudies have evaluated the possibility of using alternative
protein and lipid sources in diets for this species. Poultrymeal (Degani et al., 1985; Gallagher and Degani, 1988) andsunflower meal (Garcıa-Gallego et al., 1998) have been used
successfully as protein sources for eels, while meat meal wasfound to be an unsuitable ingredient (Garcıa-Gallego et al.,1998). Among possible lipid sources, poultry oil (Degani, 1986;
Gallagher and Degani, 1988) has been proven to be wellutilized by eels, while inclusion of soybean oil led to areduction in growth rate (Degani, 1986). In the cited studies noeffects of dietary manipulations on product quality had been
evaluated, while it is well known that diet is a majordeterminant of chemical composition and therefore productquality of eel (Abrami et al., 1992; Haard, 1992; Shearer, 1994;
Morris, 2001). The objective of the present study was thereforeto evaluate the effects of soybean meal and beef tallow in thediet on the growth and product quality of European eel.
Materials and methods
A practical control diet (CD) was formulated based on Arai
(1991). Furthermore, it was used as a base to obtain threeexperimental diets: SB (soybean-based diet: 25% of fishmealprotein replaced by soybean protein), BT (beef tallow-based
diet: 50% of the lipids from fish oil replaced by beef tallow)and ST (soybean- and beef tallow-based diet). These andfurther definitions are presented in Table 1. Composition,
proximate analysis and fatty acid composition of the diets arereported in Tables 2 and 3.European eels (A. anguilla) of about 150 g were obtained
from a commercial fish farm (Azienda Agricola Luca Cereda,Cassano d’Adda, MI, Italy) where they had been fed acommercial fishmeal-based moist diet [eel farm diet (EFD):55% protein and 13% fat on a dry matter basis)]. The fish were
transferred to the experimental station �Stazione di Idrobiolo-gia Fluviale La Casella� of ENEL (Sarmato, PC, Italy) andmaintained as a group for 2 weeks before being randomly
transferred into eight 300-L tanks (50 fish per tank) for afurther 2-week adaptation period during which they were fedCD diet. Water temperature was kept at 23�C throughout the
trial, while dissolved oxygen (DO) after feeding varied between6.5 and 7.0 mg L)1. The photoperiod was 12 h light:12 h dark.From the beginning of the trial, each experimental diet (CD,
SB, BT, ST) was fed to duplicate groups of eel twice a dayas a paste (at 08:00 and 15:00 hours) (following Mackie andMitchell, 1983; Degani, 1986; Degani and Viola, 1987; Dorosetzand Degani, 1987; de la Higuera et al., 1989; Garcıa-Gallego
J. Appl. Ichthyol. 19 (2003), 74–78� 2003 Blackwell Verlag, BerlinISSN 0175–8659
Received: June 27, 2002Accepted: September 15, 2002
U.S. Copyright Clearance Centre Code Statement: 0175–8659/2003/1902–0074$15.00/0 www.blackwell.de/synergy
et al., 1993; Agradi et al., 1995; Suarez et al., 1995; Li, 1998; de laHiguera, 2001) similar to the one used in the farm (EFD) toavoid problems of low feed acceptability (Jobling et al., 2001).For each meal ration was 0.5% (as dry matter) of the biomass
in each tank (1% per day). The paste was placed on a meshtray at the water surface so that uneaten paste remained on thetray without being washed away (Usui, 1974; Li, 1998).
Pregelatinized wheat starch and carboxymethylcellulose wereincluded in the formulation as binding agents to improve waterstability of the paste clod (Hardy, 1989; Li, 1998). However,
due to possible leaching of nutrients and feed dispersion fromthe moist diet, a preliminary evaluation of the water stabilityof the experimental diets was undertaken in order to quantify
the potential leaching of dry matter and nutrients. Feed wastesafter 1 h were on average 2.5% (CV ± 5.0%), with nosignificant differences between the experimental diets. On thebasis of these results, more accurate estimation of actual feed
intake during feeding trials was undertaken as follows: feedremaining after 1 h was carefully recovered and the feedingtray was lifted while keeping a gauze net below the tray itself to
avoid losses. The contents were oven-dried following AOAC(1996) and weighed. Feed recovered in each tank wassubtracted from the amount given in each experimental unit.
The resulting amount was further reduced by 2.5% to take intoaccount losses caused by leaching (Hidalgo et al., 1993).However, in most cases, feed offered was completely consumed
within 30 min (see also de la Higuera et al., 1989 for furtherdetails on eel feeding behavior and feeding method) and insuch cases only the 2.5% reduction was applied. The fish werebulk weighed every 14 days and feed ration was adjusted
accordingly. Duration of the trial was 12 weeks.At the end of the feeding trial all fish were chill-killed by
immersion in ice water. Ten fish per tank were used for
product quality evaluation while those remaining were ana-lyzed for whole body composition.All chemical analyses were carried out in duplicate. Mois-
ture, protein and ash content of diets and fish as well as lipidcontent of fish based on whole body weight were carried outfollowing AOAC (1996). Lipids from diets and fish fillets wereextracted by methanol–chloroform (Bligh and Dyer, 1959) and
gravimetrically quantified. Gross energy was calculated onthe basis of 23.6, 39.5, and 17.2 kJ g)1 of protein, fat, andcarbohydrate, respectively (Suarez et al., 1995). Lipid extracts
from diets and fish fillets were also analyzed for fatty acids andcholesterol content (the latter only for fillets). Fatty acidmethyl esters were obtained following Sukhija and Palmquist
(1988) and analyzed by capillary gas chromatography asdescribed by Luzzana et al. (1996). Total cholesterol wasquantified by gas chromatography following saponification of
lipids and extraction of the unsaponifiables without furtherprocessing (Kovacs et al., 1979).Data were subjected to two-way ANOVA to evaluate the
effects of protein source, lipid source and interaction of protein
and lipid source. Where appropriate, the Student–Newman–Keuls’ test (P < 0.05) was applied to evaluate differencesbetween the means, using the Prism 3.0 statistical package
(GraphPad Software, San Diego, CA, USA).
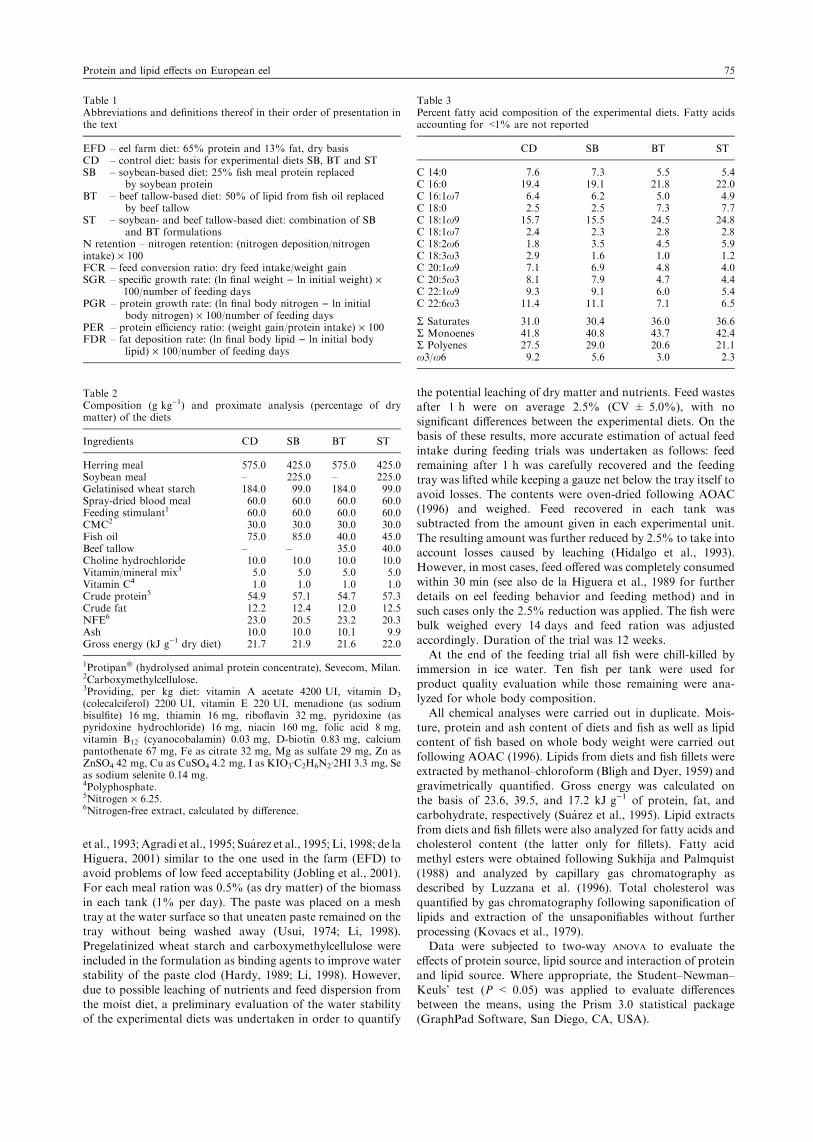
Table 1Abbreviations and definitions thereof in their order of presentation inthe text
EFD – eel farm diet: 65% protein and 13% fat, dry basisCD – control diet: basis for experimental diets SB, BT and STSB – soybean-based diet: 25% fish meal protein replaced
by soybean proteinBT – beef tallow-based diet: 50% of lipid from fish oil replaced
by beef tallowST – soybean- and beef tallow-based diet: combination of SB
and BT formulationsN retention – nitrogen retention: (nitrogen deposition/nitrogenintake) · 100FCR – feed conversion ratio: dry feed intake/weight gainSGR – specific growth rate: (ln final weight ) ln initial weight) ·
100/number of feeding daysPGR – protein growth rate: (ln final body nitrogen ) ln initial
body nitrogen) · 100/number of feeding daysPER – protein efficiency ratio: (weight gain/protein intake) · 100FDR – fat deposition rate: (ln final body lipid ) ln initial body
lipid) · 100/number of feeding days
Table 2Composition (g kg)1) and proximate analysis (percentage of drymatter) of the diets
Ingredients CD SB BT ST
Herring meal 575.0 425.0 575.0 425.0Soybean meal – 225.0 – 225.0Gelatinised wheat starch 184.0 99.0 184.0 99.0Spray-dried blood meal 60.0 60.0 60.0 60.0Feeding stimulant1 60.0 60.0 60.0 60.0CMC2 30.0 30.0 30.0 30.0Fish oil 75.0 85.0 40.0 45.0Beef tallow – – 35.0 40.0Choline hydrochloride 10.0 10.0 10.0 10.0Vitamin/mineral mix3 5.0 5.0 5.0 5.0Vitamin C4 1.0 1.0 1.0 1.0Crude protein5 54.9 57.1 54.7 57.3Crude fat 12.2 12.4 12.0 12.5NFE6 23.0 20.5 23.2 20.3Ash 10.0 10.0 10.1 9.9Gross energy (kJ g)1 dry diet) 21.7 21.9 21.6 22.0
1Protipan� (hydrolysed animal protein concentrate), Sevecom, Milan.2Carboxymethylcellulose.3Providing, per kg diet: vitamin A acetate 4200 UI, vitamin D3
(colecalciferol) 2200 UI, vitamin E 220 UI, menadione (as sodiumbisulfite) 16 mg, thiamin 16 mg, riboflavin 32 mg, pyridoxine (aspyridoxine hydrochloride) 16 mg, niacin 160 mg, folic acid 8 mg,vitamin B12 (cyanocobalamin) 0.03 mg, D-biotin 0.83 mg, calciumpantothenate 67 mg, Fe as citrate 32 mg, Mg as sulfate 29 mg, Zn asZnSO4 42 mg, Cu as CuSO4 4.2 mg, I as KIO3ÆC2H6N2Æ2HI 3.3 mg, Seas sodium selenite 0.14 mg.4Polyphosphate.5Nitrogen · 6.25.6Nitrogen-free extract, calculated by difference.
Table 3Percent fatty acid composition of the experimental diets. Fatty acidsaccounting for <1% are not reported
CD SB BT ST
C 14:0 7.6 7.3 5.5 5.4C 16:0 19.4 19.1 21.8 22.0C 16:1x7 6.4 6.2 5.0 4.9C 18:0 2.5 2.5 7.3 7.7C 18:1x9 15.7 15.5 24.5 24.8C 18:1x7 2.4 2.3 2.8 2.8C 18:2x6 1.8 3.5 4.5 5.9C 18:3x3 2.9 1.6 1.0 1.2C 20:1x9 7.1 6.9 4.8 4.0C 20:5x3 8.1 7.9 4.7 4.4C 22:1x9 9.3 9.1 6.0 5.4C 22:6x3 11.4 11.1 7.1 6.5
R Saturates 31.0 30.4 36.0 36.6R Monoenes 41.8 40.8 43.7 42.4R Polyenes 27.5 29.0 20.6 21.1x3/x6 9.2 5.6 3.0 2.3
Protein and lipid effects on European eel 75
Sensory analysis of the eels was performed by conventional
profiling using a trained panel of nine members who had beenselected for their high degree of sensory sensibility, experiencein sensory methodology, consistency and repeatability in
sensory assessment of fish. During training, the assessorsdeveloped a vocabulary by describing differences betweenextreme samples and agreed on a list of 13 attributes for
profiling. Attributes and definitions are presented in Table 4.Sensory evaluations were recorded using a computer system.For sample preparation and presentation to the panel, the
anterior and posterior parts of the fillet were removed; thecentral part was cut in three 50-g pieces, wrapped in alumin-ium foil, cooked at 180�C for 7 min in an air-heated oven andimmediately served to the assessors in closed containers
following a balanced order. Individual evaluations of blind-coded test samples were performed on 12 fish collected fromtwo tanks (6 + 6 individuals) for each dietary treatment.
Three pieces from one eel were evaluated by three randomlyselected assessors. Thus, three eels were used for each panelevaluation (two replicate evaluations per tank). The average
assessment of fish fed different diets provided the matrix datafor data analysis, whereas single assessments were used whenexamining between assessor variability and sample by assessor
interaction.ANOVAANOVA was used to evaluate the data. Differences between
the means were subjected to Duncan’s multiple range test(P < 0.05).
Results and discussion
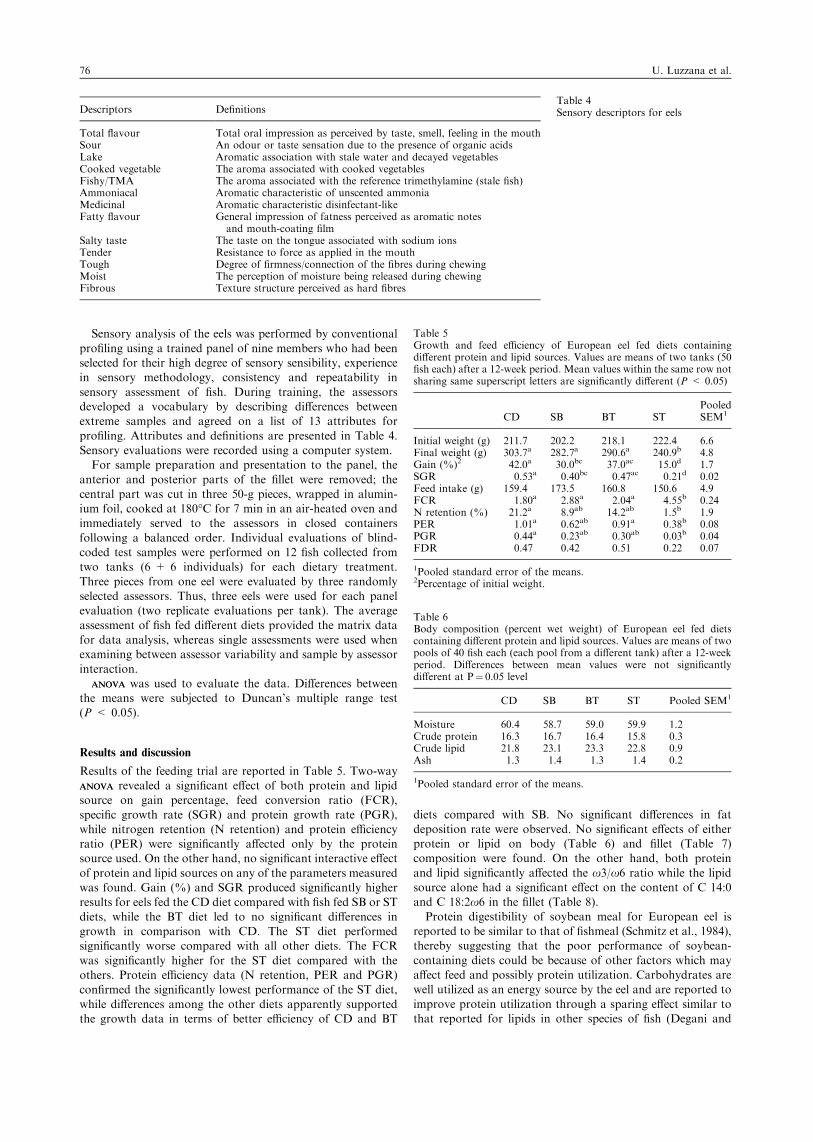
Results of the feeding trial are reported in Table 5. Two-wayANOVAANOVA revealed a significant effect of both protein and lipidsource on gain percentage, feed conversion ratio (FCR),
specific growth rate (SGR) and protein growth rate (PGR),while nitrogen retention (N retention) and protein efficiencyratio (PER) were significantly affected only by the proteinsource used. On the other hand, no significant interactive effect
of protein and lipid sources on any of the parameters measuredwas found. Gain (%) and SGR produced significantly higherresults for eels fed the CD diet compared with fish fed SB or ST
diets, while the BT diet led to no significant differences ingrowth in comparison with CD. The ST diet performedsignificantly worse compared with all other diets. The FCR
was significantly higher for the ST diet compared with theothers. Protein efficiency data (N retention, PER and PGR)confirmed the significantly lowest performance of the ST diet,
while differences among the other diets apparently supportedthe growth data in terms of better efficiency of CD and BT
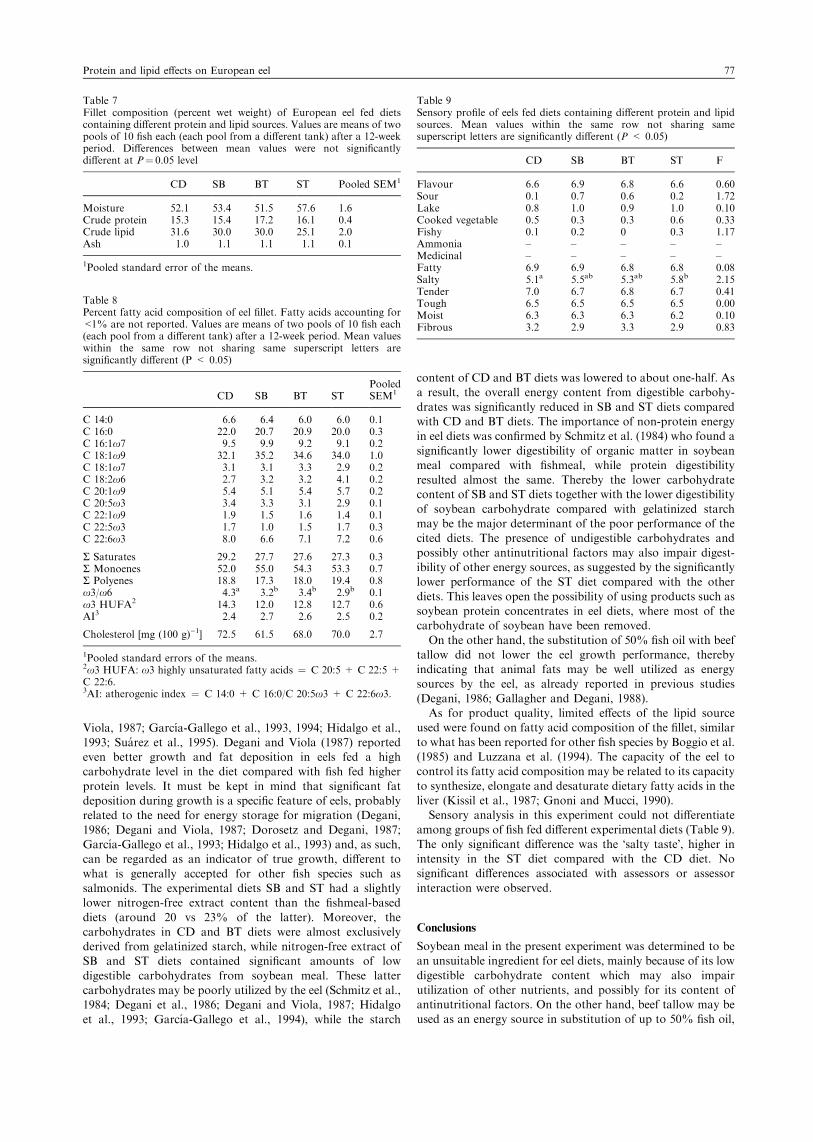
diets compared with SB. No significant differences in fatdeposition rate were observed. No significant effects of eitherprotein or lipid on body (Table 6) and fillet (Table 7)composition were found. On the other hand, both protein
and lipid significantly affected the x3/x6 ratio while the lipidsource alone had a significant effect on the content of C 14:0and C 18:2x6 in the fillet (Table 8).Protein digestibility of soybean meal for European eel is
reported to be similar to that of fishmeal (Schmitz et al., 1984),thereby suggesting that the poor performance of soybean-
containing diets could be because of other factors which mayaffect feed and possibly protein utilization. Carbohydrates arewell utilized as an energy source by the eel and are reported to
improve protein utilization through a sparing effect similar tothat reported for lipids in other species of fish (Degani and
Table 5Growth and feed efficiency of European eel fed diets containingdifferent protein and lipid sources. Values are means of two tanks (50fish each) after a 12-week period. Mean values within the same row notsharing same superscript letters are significantly different (P < 0.05)
CD SB BT STPooledSEM1
Initial weight (g) 211.7 202.2 218.1 222.4 6.6Final weight (g) 303.7a 282.7a 290.6a 240.9b 4.8Gain (%)2 42.0a 30.0bc 37.0ac 15.0d 1.7SGR 0.53a 0.40bc 0.47ac 0.21d 0.02Feed intake (g) 159.4 173.5 160.8 150.6 4.9FCR 1.80a 2.88a 2.04a 4.55b 0.24N retention (%) 21.2a 8.9ab 14.2ab 1.5b 1.9PER 1.01a 0.62ab 0.91a 0.38b 0.08PGR 0.44a 0.23ab 0.30ab 0.03b 0.04FDR 0.47 0.42 0.51 0.22 0.07
1Pooled standard error of the means.2Percentage of initial weight.
Descriptors Definitions
Total flavour Total oral impression as perceived by taste, smell, feeling in the mouthSour An odour or taste sensation due to the presence of organic acidsLake Aromatic association with stale water and decayed vegetablesCooked vegetable The aroma associated with cooked vegetablesFishy/TMA The aroma associated with the reference trimethylamine (stale fish)Ammoniacal Aromatic characteristic of unscented ammoniaMedicinal Aromatic characteristic disinfectant-likeFatty flavour General impression of fatness perceived as aromatic notes
and mouth-coating filmSalty taste The taste on the tongue associated with sodium ionsTender Resistance to force as applied in the mouthTough Degree of firmness/connection of the fibres during chewingMoist The perception of moisture being released during chewingFibrous Texture structure perceived as hard fibres
Table 4Sensory descriptors for eels
Table 6Body composition (percent wet weight) of European eel fed dietscontaining different protein and lipid sources. Values are means of twopools of 40 fish each (each pool from a different tank) after a 12-weekperiod. Differences between mean values were not significantlydifferent at P¼ 0.05 level
CD SB BT ST Pooled SEM1
Moisture 60.4 58.7 59.0 59.9 1.2Crude protein 16.3 16.7 16.4 15.8 0.3Crude lipid 21.8 23.1 23.3 22.8 0.9Ash 1.3 1.4 1.3 1.4 0.2
1Pooled standard error of the means.
76 U. Luzzana et al.
Viola, 1987; Garcıa-Gallego et al., 1993, 1994; Hidalgo et al.,1993; Suarez et al., 1995). Degani and Viola (1987) reportedeven better growth and fat deposition in eels fed a highcarbohydrate level in the diet compared with fish fed higher
protein levels. It must be kept in mind that significant fatdeposition during growth is a specific feature of eels, probablyrelated to the need for energy storage for migration (Degani,
1986; Degani and Viola, 1987; Dorosetz and Degani, 1987;Garcıa-Gallego et al., 1993; Hidalgo et al., 1993) and, as such,can be regarded as an indicator of true growth, different to
what is generally accepted for other fish species such assalmonids. The experimental diets SB and ST had a slightlylower nitrogen-free extract content than the fishmeal-based
diets (around 20 vs 23% of the latter). Moreover, thecarbohydrates in CD and BT diets were almost exclusivelyderived from gelatinized starch, while nitrogen-free extract ofSB and ST diets contained significant amounts of low
digestible carbohydrates from soybean meal. These lattercarbohydrates may be poorly utilized by the eel (Schmitz et al.,1984; Degani et al., 1986; Degani and Viola, 1987; Hidalgo
et al., 1993; Garcıa-Gallego et al., 1994), while the starch
content of CD and BT diets was lowered to about one-half. Asa result, the overall energy content from digestible carbohy-
drates was significantly reduced in SB and ST diets comparedwith CD and BT diets. The importance of non-protein energyin eel diets was confirmed by Schmitz et al. (1984) who found a
significantly lower digestibility of organic matter in soybeanmeal compared with fishmeal, while protein digestibilityresulted almost the same. Thereby the lower carbohydratecontent of SB and ST diets together with the lower digestibility
of soybean carbohydrate compared with gelatinized starchmay be the major determinant of the poor performance of thecited diets. The presence of undigestible carbohydrates and
possibly other antinutritional factors may also impair digest-ibility of other energy sources, as suggested by the significantlylower performance of the ST diet compared with the other
diets. This leaves open the possibility of using products such assoybean protein concentrates in eel diets, where most of thecarbohydrate of soybean have been removed.
On the other hand, the substitution of 50% fish oil with beeftallow did not lower the eel growth performance, therebyindicating that animal fats may be well utilized as energysources by the eel, as already reported in previous studies
(Degani, 1986; Gallagher and Degani, 1988).As for product quality, limited effects of the lipid source
used were found on fatty acid composition of the fillet, similar
to what has been reported for other fish species by Boggio et al.(1985) and Luzzana et al. (1994). The capacity of the eel tocontrol its fatty acid composition may be related to its capacity
to synthesize, elongate and desaturate dietary fatty acids in theliver (Kissil et al., 1987; Gnoni and Mucci, 1990).Sensory analysis in this experiment could not differentiate
among groups of fish fed different experimental diets (Table 9).
The only significant difference was the �salty taste�, higher inintensity in the ST diet compared with the CD diet. Nosignificant differences associated with assessors or assessor
interaction were observed.
Conclusions
Soybean meal in the present experiment was determined to bean unsuitable ingredient for eel diets, mainly because of its low
digestible carbohydrate content which may also impairutilization of other nutrients, and possibly for its content ofantinutritional factors. On the other hand, beef tallow may beused as an energy source in substitution of up to 50% fish oil,
Table 7Fillet composition (percent wet weight) of European eel fed dietscontaining different protein and lipid sources. Values are means of twopools of 10 fish each (each pool from a different tank) after a 12-weekperiod. Differences between mean values were not significantlydifferent at P¼ 0.05 level
CD SB BT ST Pooled SEM1
Moisture 52.1 53.4 51.5 57.6 1.6Crude protein 15.3 15.4 17.2 16.1 0.4Crude lipid 31.6 30.0 30.0 25.1 2.0Ash 1.0 1.1 1.1 1.1 0.1
1Pooled standard error of the means.
Table 8Percent fatty acid composition of eel fillet. Fatty acids accounting for<1% are not reported. Values are means of two pools of 10 fish each(each pool from a different tank) after a 12-week period. Mean valueswithin the same row not sharing same superscript letters aresignificantly different (P < 0.05)
CD SB BT STPooledSEM1
C 14:0 6.6 6.4 6.0 6.0 0.1C 16:0 22.0 20.7 20.9 20.0 0.3C 16:1x7 9.5 9.9 9.2 9.1 0.2C 18:1x9 32.1 35.2 34.6 34.0 1.0C 18:1x7 3.1 3.1 3.3 2.9 0.2C 18:2x6 2.7 3.2 3.2 4.1 0.2C 20:1x9 5.4 5.1 5.4 5.7 0.2C 20:5x3 3.4 3.3 3.1 2.9 0.1C 22:1x9 1.9 1.5 1.6 1.4 0.1C 22:5x3 1.7 1.0 1.5 1.7 0.3C 22:6x3 8.0 6.6 7.1 7.2 0.6
R Saturates 29.2 27.7 27.6 27.3 0.3R Monoenes 52.0 55.0 54.3 53.3 0.7R Polyenes 18.8 17.3 18.0 19.4 0.8x3/x6 4.3a 3.2b 3.4b 2.9b 0.1x3 HUFA2 14.3 12.0 12.8 12.7 0.6AI3 2.4 2.7 2.6 2.5 0.2
Cholesterol [mg (100 g))1] 72.5 61.5 68.0 70.0 2.7
1Pooled standard errors of the means.2x3 HUFA: x3 highly unsaturated fatty acids ¼ C 20:5 + C 22:5 +C 22:6.3AI: atherogenic index ¼ C 14:0 + C 16:0/C 20:5x3 + C 22:6x3.
Table 9Sensory profile of eels fed diets containing different protein and lipidsources. Mean values within the same row not sharing samesuperscript letters are significantly different (P < 0.05)
CD SB BT ST F
Flavour 6.6 6.9 6.8 6.6 0.60Sour 0.1 0.7 0.6 0.2 1.72Lake 0.8 1.0 0.9 1.0 0.10Cooked vegetable 0.5 0.3 0.3 0.6 0.33Fishy 0.1 0.2 0 0.3 1.17Ammonia – – – – –Medicinal – – – – –Fatty 6.9 6.9 6.8 6.8 0.08Salty 5.1a 5.5ab 5.3ab 5.8b 2.15Tender 7.0 6.7 6.8 6.7 0.41Tough 6.5 6.5 6.5 6.5 0.00Moist 6.3 6.3 6.3 6.2 0.10Fibrous 3.2 2.9 3.3 2.9 0.83
Protein and lipid effects on European eel 77
provided that no antinutritional factors are present in the diet,with no adverse effects on growth and product quality.
Acknowledgements
The authors are grateful to Dott. Filippo A. Vaini and Dott.Nakour Nargaye for technical assistance. Research was fundedby the Italian Ministry of Agriculture (MiPA, Project 4C 052).
References
Abrami, G.; Natiello, F.; Bronzi, P.; McKenzie, D.; Bolis, L.; Agradi,E., 1992: A comparison of highly unsaturated fatty acid levels inwild and farmed eels (Anguilla anguilla). Comp. Biochem. Physiol.101B, 79–81.
Agradi, E.; Bonomi, L.; Rigamonti, E.; Liguori, M.; Bronzi, P., 1995:The effect of dietary lipids on tissue lipids and ammonia excretionin European eels (Anguilla anguilla). Comp. Biochem. Physiol.111A, 445–451.
AOAC, 1996: Official methods of analysis, 16th edn. Association ofOfficial Analytical Chemists, Arlington, VA, USA.
Arai, S., 1991: Eel, Anguilla spp. In: Handbook of nutrient require-ments of finfish. R. P. Wilson (Ed.). CRC Press, Boca Raton, FL,USA, pp. 69–75.
Barlow, S. M.; Pike, I. H., 1998: Aquaculture feed ingredients in theyear 2010: fish meal and fish oil. Presented at Aquavision 98 –Second Nutreco Aquacult. Business Conf., Stavanger, Norway,May 1998.
Bligh, E. G.; Dyer, W. J., 1959: A rapid method of total lipidextraction and purification. Can. J. Biochem. Physiol. 37, 911–917.
Boggio, S. M.; Hardy, R. W.; Babbit, J. K.; Brannon, E. L., 1985: Theinfluence of dietary lipid source and alpha-tocopheryl acetate levelon product quality of rainbow trout (Salmo gairdneri). Aqua-culture 51, 13–25.
Carter, C. G.; Hauler, R. C., 2000: Fish meal replacement by plantmeals in extruded feeds for Atlantic salmon, Salmo salar L.Aquaculture 185, 299–311.
Degani, G., 1986: Dietary effects of lipid source, lipid level andtemperature on growth of glass eel (Anguilla anguilla). Aqua-culture 56, 207–214.
Degani, G.; Viola, S., 1987: The protein sparing effect of carbo-hydrates in the diet of eels (Anguilla anguilla). Aquaculture 64,
283–291.Degani, G.; Horowitz, A.; Levanon, D., 1985: Effect of protein level in
purified diet and of density, ammonia and O2 level on growth ofjuvenile European eels (Anguilla anguilla L.). Aquaculture 46,
193–200.Degani, G.; Viola, S.; Levanon, D., 1986: Effect of dietary carbohy-
drate source on growth and body composition of the European eel(Anguilla anguilla L.). Aquaculture 52, 97–104.
Dorosetz, C.; Degani, C., 1987: Effect of fat rich diet and temperatureon growth and body composition of European eels (Anguillaanguilla). Comp. Biochem. Physiol. 87A, 733–736.
Gallagher, M. L.; Degani, G., 1988: Poultry meal and poultry oil assources of protein and lipid in the diet of European eels (Anguillaanguilla). Aquaculture 73, 177–187.
Garcıa-Gallego, M.; Hidalgo, M. C.; Suarez, M. D.; Sanz, A.; de laHiguera, M., 1993: Feeding of the European eel Anguilla anguilla.II. Influence of dietary lipid level. Comp. Biochem. Physiol. 105A,171–175.
Garcıa-Gallego, M.; Bazoco, J.; Akharbach, H.; Suarez, M.D.; Sanz,A., 1994: Utilization of different carbohydrates by the Europeaneel (Anguilla anguilla). Aquaculture 124, 99–108.
Garcıa-Gallego, M.; Akharbach, H.; de la Higuera, M., 1998: Use ofprotein sources alternative to fish meal in diets with amino acidssupplementation for the European eel (Anguilla anguilla). Anim.Sci. 66, 285–292.
Gnoni, G. V.; Mucci, M. R., 1990: De novo fatty acid synthesis ineel-liver cytosol. Comp. Biochem. Physiol. 95B, 153–158.
Haard, N. F., 1992: Control of chemical composition and food qualityattributes of cultured fish. Food Res. Int. 25, 289–307.
Hardy, R. W., 1989: Diet preparation. In: Fish nutrition, 2nd edn. J. E.Halver (Ed.). Academic Press, San Diego, CA, USA, pp. 475–548.
Hardy, R. W., 1995: Current issues in salmonid nutrition. In: Nutritionand utilization Technology in Aquaculture. C. Lim and D. J.Sessa (Eds). AOCS Press, Champaign, IL, USA, pp. 26–40.
Hardy, R. W., 1996: Alternate protein sources for salmon and troutdiets. Anim. Feed Sci. Technol. 59, 71–80.
Hardy, R. W., 1998: Feeding salmon and trout. In: Nutrition andfeeding of fish, 2nd edn. T. Lovell (Ed.). Kluwer AcademicPublisher, Norwell, MA, USA, pp. 175–197.
Hidalgo, M. C.; Sanz, A.; Garcıa-Gallego, M.; Suarez, M. D.; de laHiguera, M., 1993. Feeding of the European eel Anguilla anguilla.I. Influence of dietary carbohydrate level. Comp. Biochem.Physiol. 105A, 165–169.
de la Higuera, M., 2001: Effects of nutritional factors and feedcharacteristics on feed intake. In: Food intake in fish. D.Houlihan, T. Boujard and M. Jobling (Eds). Blackwell Science,Oxford, UK, pp. 250–268.
de la Higuera, M.; Garcıa-Gallego, M.; Sanz, A.; Hidalgo, M. C.;Suarez, M. D., 1989: Utilization of dietary protein by the eel(Anguilla anguilla): optimum dietary protein levels. Aquaculture79, 53–61.
Jobling, M.; Gomes, E.; Dias, J., 2001: Feed types, manufacture andingredients. In: Food intake in fish. D. Houlihan, T. Boujard andM. Jobling (Eds). Blackwell Science, Oxford, UK, pp. 25–48.
Kaushik, S. J.; Cravedi, J. P.; Lalles, J. P.; Sumpter, J.; Fauconneau,B.; Laroche, M., 1995: Partial or total replacement of fish meal bysoybean protein on growth, protein utilization, potential estro-genic or antigenic effects, cholesterolemia and flesh quality inrainbow trout (Oncorhynchus mykiss). Aquaculture 133, 257–274.
Kissil, G. W.; Youngston, A.; Cowey, C. B., 1987: Capacity of theEuropean eel (Anguilla anguilla) to elongate and desaturatedietary linoleic acid. J. Nutr. 11, 1379–1384.
Kovacs, M. I. P.; Anderson, W. E.; Ackman, R. G., 1979: A simplemethod for the determination of cholesterol and some plantsterols in fishery-based food products. J. Food Sci. 44, 1299–1305.
Lecomte-Finiger, R., 1983: Regime alimentaire des civelles et anguil-lettes (Anguilla anguilla) dans trois etanges saumaters des rous-sillon. Bull. Ecol. 14, 297–306.
Li, M. H., 1998: Feed formulation and processing. In: Nutrition andfeeding of fish, 2nd edn. T. Lovell (Ed.). Kluwer AcademicPublisher, Norwell, MA, USA, pp. 135–152.
Luzzana, U.; Serrini, G.; Moretti, V. M.; Gianesini, C.; Valfre, F.,1994: Effect of expanded feed with high fish oil content on growthand fatty acid composition of rainbow trout. Aquac. Int. 2, 239–248.
Luzzana, U.; Serrini, G.; Moretti, V. M.; Grimaldi, P.; Paleari, M. A.;Valfre, F., 1996: Seasonal variations in fat content and fatty acidcomposition of male and female coregonid �bondella� from LakeMaggiore and landlocked shad from Lake Como (NorthernItaly). J. Fish Biol. 48, 352–366.
Mackie, A. M.; Mitchell, A. I., 1983: Studies on the chemical nature offeeding stimulants for the juvenile European eel, Anguilla anguilla(L.). J. Fish Biol. 22, 425–430.
Morris, P., 2001: The effects of nutrition on the composition of farmedfish. In: Farmed fish quality. S. C. Kestin and P. D. Warriss (Eds).Blackwell Science, Oxford, UK, pp. 161–179.
Shearer, K. D., 1994: Factors affecting the proximate composition ofcultured fishes with emphasis on salmonids. Aquaculture 119, 63–88.
Schmitz, O.; Greuel, E.; Pfeffer, E., 1984: Digestibility of crude proteinand organic matter of potential sources of dietary protein for eels(Anguilla anguilla L.). Aquaculture 41, 21–30.
Suarez, M. D.; Hidalgo, M. C.; Garcıa-Gallego, M.; Sanz, A.; de laHiguera, M., 1995: Influence of the relative proportions of energyyielding nutrients on liver intermediary metabolism of theEuropean eel. Comp. Biochem. Physiol. 111A, 421–428.
Sukhija, P. S.; Palmquist, D. L., 1988: Rapid method for determin-ation of total fatty acid content and composition of foodstuffs andfeces. J. Agric. Food Chem. 36, 1202–1206.
Usui, A., 1974: Eel culture. Fishing News (Books) Ltd, West Byfleet,Surrey, UK, pp. 186.
Author’s address: Dr Umberto Luzzana, A.S.A. s.r.l. – Agridea,Servizio Nutrizione, Viale del Lavoro 45, I-37036San Martino Buon Albergo (VR), Italy.E-mail: [email protected]
78 U. Luzzana et al.