Embed Size (px)
Citation preview
WP/03/217
Growth and Recovery in Mongolia During Transition
Kevin C. Cheng

© 2003 International Monetary Fund WP/03/217
IMF Working Paper
Asia and Pacific Department
Growth and Recovery in Mongolia During Transition1
Prepared by Kevin C. Cheng
Authorized for distribution by Lazaros E. Molho
November 2003
Abstract
The views expressed in this Working Paper are those of the author(s) and do not necessarily represent those of the IMF or IMF policy. Working Papers describe research in progress by the author(s) and are published to elicit comments and to further debate.
This paper studies Mongolia’s experience of growth and recovery during the first decade of its transition to a market-based system and compares it with those of other transition economies. Mongolia, like most other transition economies, experienced a painful, initial “transformational recession” before the economy began to recover, with efficiency gains the main source of growth during the early stages of transition. Mongolia’s transition process has been relatively smooth compared with other transition economies, probably reflecting the combined effects of some favorable initial conditions, coupled with the early adoption of appropriate adjustment policies and market-oriented reforms. JEL Classification Numbers: P20, P27, O40 Keywords: transition, growth accounting
Author’s E-Mail Address: [email protected]
1 This paper originates from Chapter I of IMF Country Report No. 02/253. I would like to thank Lazaros E. Molho, David T. Coe, Jose Fajgenbaum, Byung Kyoon Jang, Kyung Hur, Roman Zytek, Francis Kumah, Yuan Xiao, Yutaka Nishigaki, and Erik Lueth for valuable comments.
- 2 -
Contents Page I. Introduction........................................................................................................................ 3 II. An Overview of Mongolia’s Transition Experience.......................................................... 4 III. A Growth Accounting Exercise for Mongolia................................................................... 7 IV. Comparison with Other Transition Economies................................................................ 13 V. Conclusions...................................................................................................................... 15 References .................................................................................................................................... 25 Tables 1. Composition of Population Aged 15 or Above by Educational Status.............................. 9 2. Regression Results for the Income Share of Capital ....................................................... 10 3. Growth Accounting.......................................................................................................... 11 4. Growth Accounting Sensitivity Analysis......................................................................... 12 Figures 1. Real GDP, 1990–2001 ....................................................................................................... 4 2. Composition of Real GDP ................................................................................................. 5 3. Composition of GDP by Expenditure ................................................................................ 6 4. Consumer Prices ................................................................................................................ 6 5. Capital and Labor Productivity........................................................................................ 11 6. Comparative GDP Performance in Transition Economies, 1990–2001 .......................... 13 Appendix Tables 1. Population and Labor Statistics ....................................................................................... 17 2. Estimates of Real GDP and Factor Inputs, 1980–2001 ................................................... 18 3. GDP Performance in Transition Economies.................................................................... 19 4. Growth Performance and Location.................................................................................. 20 5. Growth Performance and Share of Agriculture in GDP ................................................. 21 6. Growth Performance and PPP-Based Per Capita Income Level ..................................... 22 7. Growth Performance and Openness................................................................................. 23 8. Trade Restrictiveness Ratings and Average Tariffs, 1997–2001..................................... 24
- 3 -
I. INTRODUCTION
Mongolia, like its two giant neighbors, China and Russia, was once a socialist economy. From the early 1920s to the late 1980s, Mongolia was closely linked to the Soviet Union, with the Mongolian political and economic systems modeled on those of the latter. Following the collapse of the Soviet Union, however, Mongolia began its transformation from a centrally planned economy to a market-based economy in the early 1990s.
While there is a large literature on the growth experiences of other transition
countries, Mongolia has received relatively little attention.2 The objective of this paper is to fill this gap by focusing on the following questions: (i) What were Mongolia’s sources of growth before and during transition? (ii) How does Mongolia’s growth and recovery compare with those of other transition economies? and (iii) What explains differences in Mongolia’s performance relative to other transition economies?
The findings of previous studies about transition economies include the following stylized facts.3 First, reforms introduced early in the transition were typically followed by a temporary period of output declines. Second, initial conditions are important factors in determining the speed of recovery. In particular, overindustrialization during the socialist regime may hinder the transitional process. Third, traditional factor inputs appear to have had a limited role in explaining growth over time and across countries for transition economies. In particular, econometric studies have found no strong link between the level of aggregate investment and the strength of recovery from the fall in output recorded in the early years of transition. Therefore, most researchers agree that efficiency gains are the main source of growth during the recovery phase of transition, with the development of good institutions and sound economic policies playing an important supportive role. The major findings of this paper concur with those of most studies on transition economies. Specifically, while the Mongolian economy suffered great output losses at the outset of its transition, it has subsequently benefited from efficiency gains following its market reforms. In addition, Mongolia’s transition process was relatively smooth compared with other transition economies, probably due to the combined effects of its relatively underindustrialized economy prior to the transition, a peaceful and relatively stable social and political environment, and sound economic policies. The paper is organized as follows: Section II presents a brief background discussion on Mongolia’s transition experience. Section III describes the major sources of economic growth in Mongolia since the early 1980s in the context of a basic growth accounting 2 Among the studies relating to Mongolia’s transition experience, two notable examples are Sløk (2000) and Black (2001).
3 For an extensive review of the literature on this issue, see IMF Staff Papers, Special Issue, Volume 48.
- 4 -
framework. Section IV discusses Mongolia’s post-transition growth performance relative to other transition countries. The main conclusions along with some caveats are summarized in Section V.
II. AN OVERVIEW OF MONGOLIA’S TRANSITION EXPERIENCE
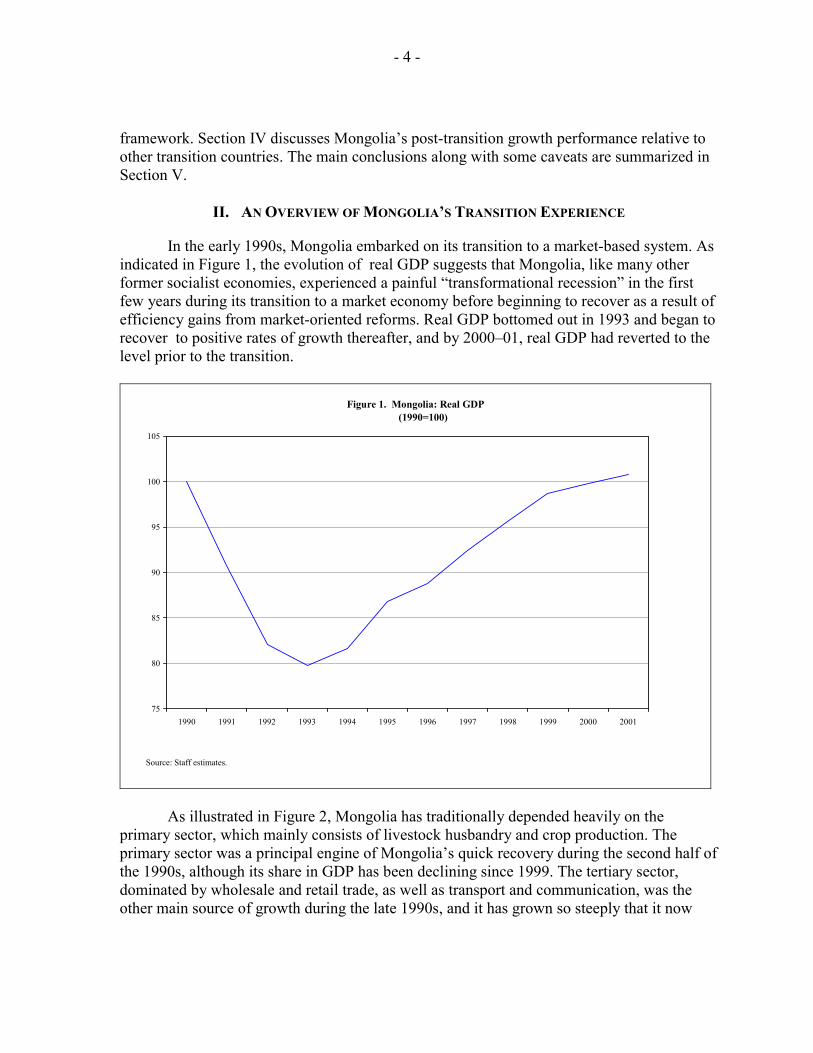
In the early 1990s, Mongolia embarked on its transition to a market-based system. As indicated in Figure 1, the evolution of real GDP suggests that Mongolia, like many other former socialist economies, experienced a painful “transformational recession” in the first few years during its transition to a market economy before beginning to recover as a result of efficiency gains from market-oriented reforms. Real GDP bottomed out in 1993 and began to recover to positive rates of growth thereafter, and by 2000–01, real GDP had reverted to the level prior to the transition.
Figure 1. Mongolia: Real GDP (1990=100)
75
80
85
90
95
100
105
1990 1991 1992 1993 1994 1995 1996 1997 1998 1999 2000 2001
Source: Staff estimates.
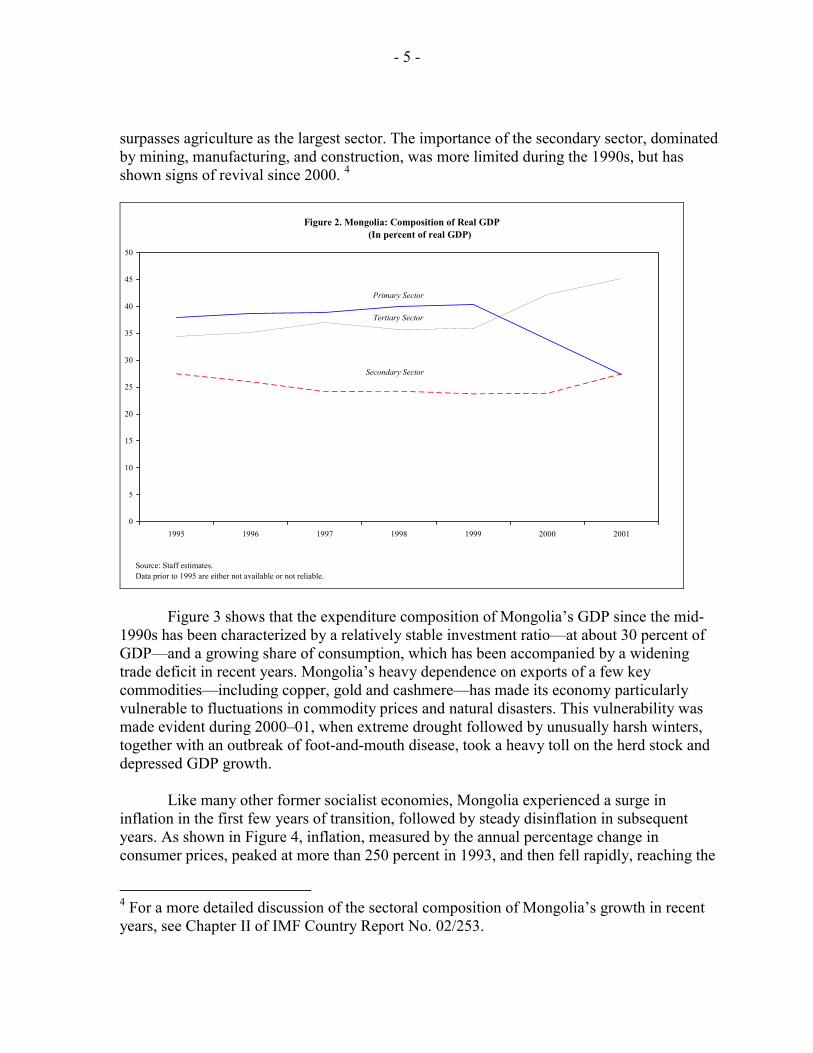
As illustrated in Figure 2, Mongolia has traditionally depended heavily on the primary sector, which mainly consists of livestock husbandry and crop production. The primary sector was a principal engine of Mongolia’s quick recovery during the second half of the 1990s, although its share in GDP has been declining since 1999. The tertiary sector, dominated by wholesale and retail trade, as well as transport and communication, was the other main source of growth during the late 1990s, and it has grown so steeply that it now
- 5 -
surpasses agriculture as the largest sector. The importance of the secondary sector, dominated by mining, manufacturing, and construction, was more limited during the 1990s, but has shown signs of revival since 2000. 4
Figure 2. Mongolia: Composition of Real GDP (In percent of real GDP)
Primary Sector
Secondary Sector
Tertiary Sector
0
5
10
15
20
25
30
35
40
45
50
1995 1996 1997 1998 1999 2000 2001
Source: Staff estimates.Data prior to 1995 are either not available or not reliable.
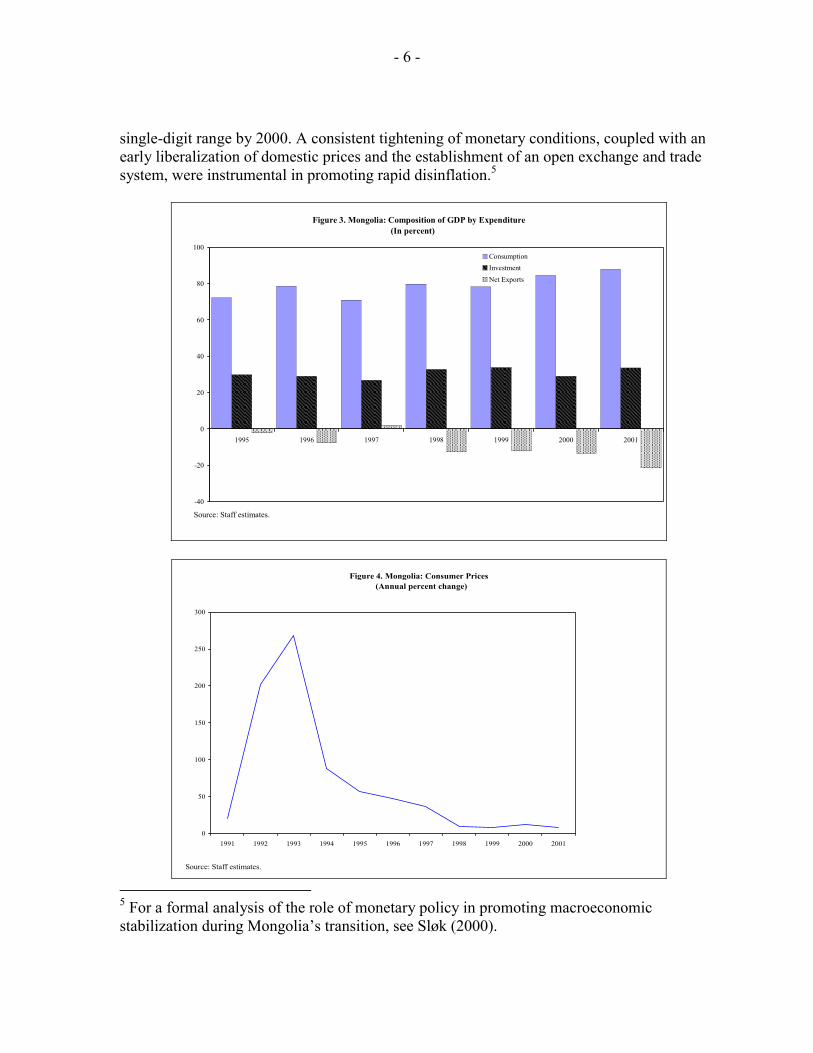
Figure 3 shows that the expenditure composition of Mongolia’s GDP since the mid-1990s has been characterized by a relatively stable investment ratio—at about 30 percent of GDP—and a growing share of consumption, which has been accompanied by a widening trade deficit in recent years. Mongolia’s heavy dependence on exports of a few key commodities—including copper, gold and cashmere—has made its economy particularly vulnerable to fluctuations in commodity prices and natural disasters. This vulnerability was made evident during 2000–01, when extreme drought followed by unusually harsh winters, together with an outbreak of foot-and-mouth disease, took a heavy toll on the herd stock and depressed GDP growth.
Like many other former socialist economies, Mongolia experienced a surge in inflation in the first few years of transition, followed by steady disinflation in subsequent years. As shown in Figure 4, inflation, measured by the annual percentage change in consumer prices, peaked at more than 250 percent in 1993, and then fell rapidly, reaching the
4 For a more detailed discussion of the sectoral composition of Mongolia’s growth in recent years, see Chapter II of IMF Country Report No. 02/253.
- 6 -
single-digit range by 2000. A consistent tightening of monetary conditions, coupled with an early liberalization of domestic prices and the establishment of an open exchange and trade system, were instrumental in promoting rapid disinflation.5
Figure 3. Mongolia: Composition of GDP by Expenditure (In percent)
-40
-20
0
20
40
60
80
100
1995 1996 1997 1998 1999 2000 2001
ConsumptionInvestmentNet Exports
Source: Staff estimates.
Figure 4. Mongolia: Consumer Prices (Annual percent change)
0
50
100
150
200
250
300
1991 1992 1993 1994 1995 1996 1997 1998 1999 2000 2001
Source: Staff estimates. 5 For a formal analysis of the role of monetary policy in promoting macroeconomic stabilization during Mongolia’s transition, see Sløk (2000).
- 7 -
Fiscal policy also played a supportive role in helping bring about short-term macroeconomic stabilization. While government efforts to ease some of the social costs of transition led to a sharp expansion of public expenditures and wide budget deficits, government borrowing from the domestic banking system was progressively reduced, as the deficits were largely financed through concessional foreign loans. This mode of financing the budget served to ease pressures on the balance of payments and prevented a crowding out of credit to the private sector. At the same time, however, Mongolia’s post-1991 public debt rose sharply, reaching the equivalent of 100 percent of GDP by 1999. While the concessional terms on most of this debt have helped to restrain the debt service burden to a manageable level to date, there is also a looming burden of the yet-to-be settled stock of pre-1991 transferable ruble debt to Russia, which was equivalent to about 10 times Mongolia’s GDP as of 2001. These developments suggest that a more disciplined fiscal policy will have to be a central part of Mongolia’s strategy to ensure enduring macroeconomic stability in the period ahead.
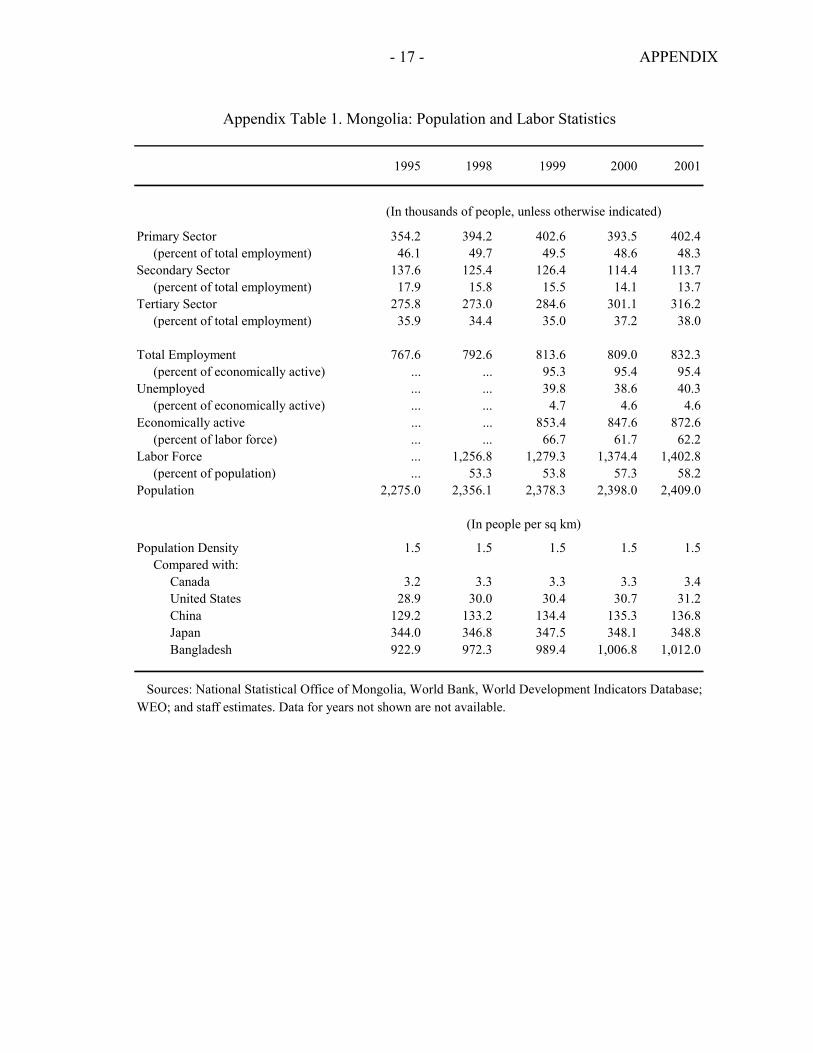
The early introduction of public enterprise reforms helped smooth the labor market’s adjustment process during the period of transition. As is illustrated in Appendix Table 1, Mongolia has a sparse population of about 2.4 million. As of 2001, around 58 percent of the population was in the labor force, of which about 62 percent was economically active. Despite the significant adjustment problems of large, inefficient public enterprises, which caused major dislocations in the labor market during the early years of transition, total employment fell by a relatively modest 5½ percent during the early 1990s and recovered steadily thereafter, exceeding its pre-transition level by1999 (Appendix Table 2). The unemployment rate was estimated to have been restrained to about 4½ percent of the economically active population as of 2001. Although the primary sector accounted for the largest share of the increase in employment since the mid-1990s, the number of workers in the tertiary sector has also increased rapidly in recent years. A key contributing factor to the dynamism of the agricultural and tertiary sectors was the early privatization of herds and of small- and medium-sized enterprises. Thus, while manufacturing suffered a prolonged decline, the former employees of defunct state industries were able to quickly find new opportunities in herding, trading and other services.6
III. A GROWTH ACCOUNTING EXERCISE FOR MONGOLIA
Methodology and Data
Following the conventional growth accounting framework, we assume that Mongolia’s output performance since the early 1980s can be explained by the following Cobb-Douglas production function:
6 For a discussion of Mongolia’s experience with public enterprise restructuring and privatization, see Chapter III of IMF Country Report No. 02/253.
- 8 -
αα −= 1)( ttttt LqKAY (1) where Y is real GDP, K is the physical capital stock, q is a human capital index, L is labor input, and A is total factor productivity (TFP). Taking logarithms and differentiating, we obtain the following growth accounting equation:
qdq
LdL
KdK
AdA
YdY )1()1( ααα −+−++= (2)
Equation (2) decomposes the growth rate of output into the growth rates of TFP, physical capital, labor, and human capital. Physical capital K is calculated by the conventional perpetual inventory method, as discussed in Barro and Sala-i-Martin (2000):
ttt KIK )1(1 δ−+=+ (3)
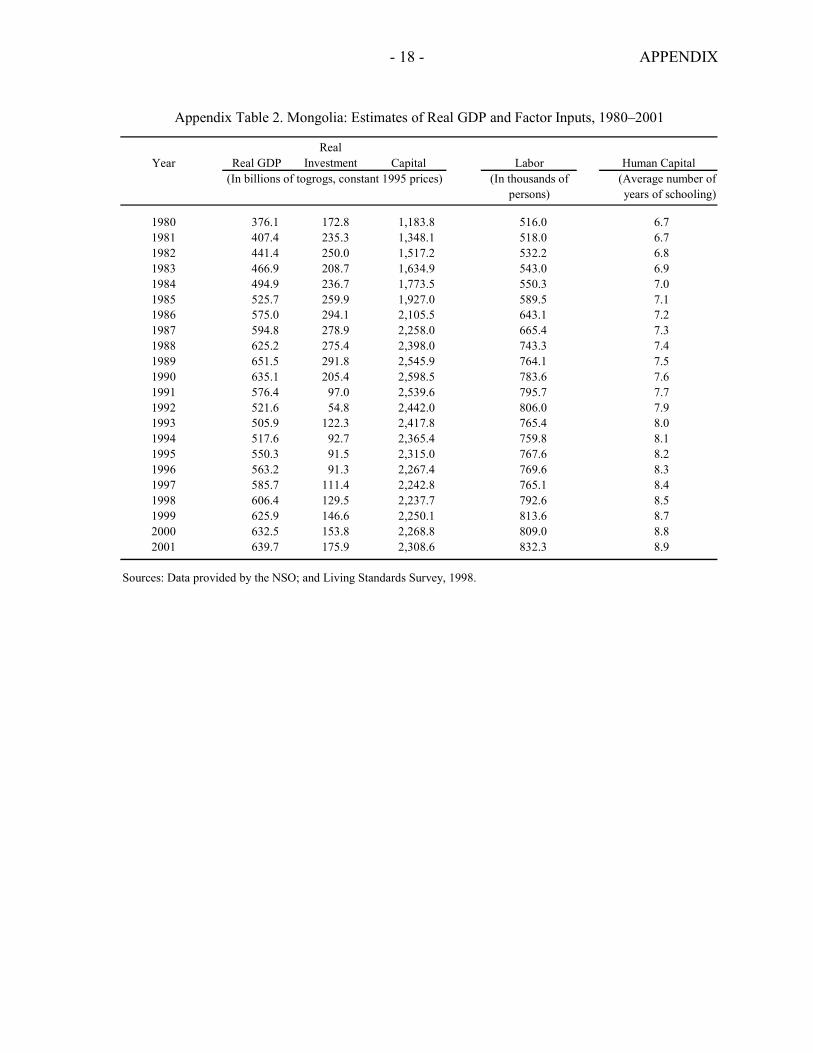
where I is the level of real investment and δ is the rate of depreciation of the existing capital stock. Given estimates of the depreciation rate and the initial capital stock, and a time series for investment, we can calculate the capital stock series recursively using (3). In this study, the depreciation rate is assumed to be 6 percent, which is well within the range of 4–10 percent used in similar studies. Since Mongolia’s industrialization began in the early 1960s, 1959 has been selected as the initial year when the capital stock was assumed to be zero.7 The time series data used in this study for real GDP, real investment, the capital stock, labor, and human capital between 1980 and 2001 are presented in Appendix Table 2. Data on real GDP and investment in current prices were obtained from the Mongolian National Statistical Office (NSO).8 Due to the lack of official data on the expenditure deflators, the investment deflator was approximated based on the following equation:
7 The Mongolian economy depended almost exclusively on livestock herding until the early 1960s when the economy began to be industrialized with the assistance of the former Soviet Union. It is likely that most of the capital stock that existed in 1959 would have depreciated fully by 1980. In any case, changing the initial year does not materially alter the main results, as illustrated in the sensitivity analysis below. For more details on the structure of the Mongolian economy prior to the transition, see Economist Intelligence Unit (2001).
8 The data on total investment have been compiled by adding together construction, machinery, inventories, and other miscellaneous items.
- 9 -
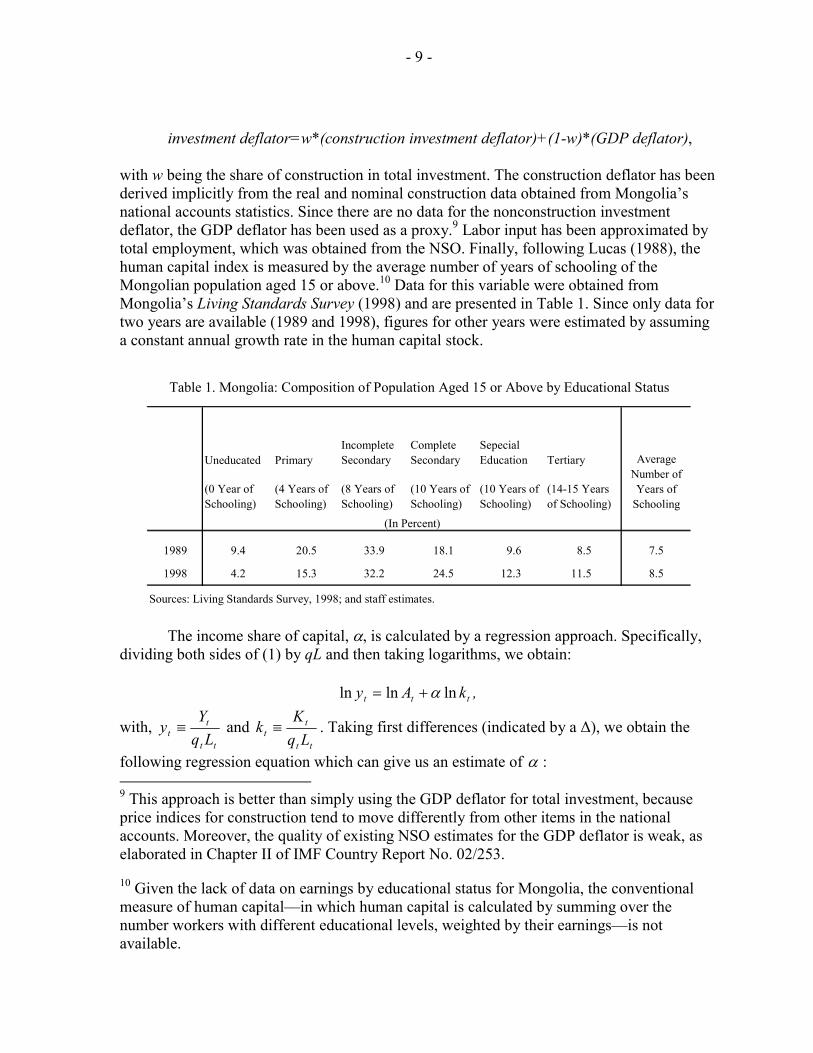
investment deflator=w*(construction investment deflator)+(1-w)*(GDP deflator), with w being the share of construction in total investment. The construction deflator has been derived implicitly from the real and nominal construction data obtained from Mongolia’s national accounts statistics. Since there are no data for the nonconstruction investment deflator, the GDP deflator has been used as a proxy.9 Labor input has been approximated by total employment, which was obtained from the NSO. Finally, following Lucas (1988), the human capital index is measured by the average number of years of schooling of the Mongolian population aged 15 or above.10 Data for this variable were obtained from Mongolia’s Living Standards Survey (1998) and are presented in Table 1. Since only data for two years are available (1989 and 1998), figures for other years were estimated by assuming a constant annual growth rate in the human capital stock.
Uneducated PrimaryIncomplete Secondary
Complete Secondary
Sepecial Education Tertiary
(0 Year of Schooling)
(4 Years of Schooling)
(8 Years of Schooling)
(10 Years of Schooling)
(10 Years of Schooling)
(14-15 Years of Schooling)
1989 9.4 20.5 33.9 18.1 9.6 8.5 7.5
1998 4.2 15.3 32.2 24.5 12.3 11.5 8.5
Sources: Living Standards Survey, 1998; and staff estimates.
Average Number of Years of
Schooling
(In Percent)
Table 1. Mongolia: Composition of Population Aged 15 or Above by Educational Status
The income share of capital, α, is calculated by a regression approach. Specifically, dividing both sides of (1) by qL and then taking logarithms, we obtain:
ttt kAy lnlnln α+= ,
with, tt
tt Lq
Yy ≡ and
tt
tt Lq
Kk ≡ . Taking first differences (indicated by a ∆), we obtain the
following regression equation which can give us an estimate of α : 9 This approach is better than simply using the GDP deflator for total investment, because price indices for construction tend to move differently from other items in the national accounts. Moreover, the quality of existing NSO estimates for the GDP deflator is weak, as elaborated in Chapter II of IMF Country Report No. 02/253.
10 Given the lack of data on earnings by educational status for Mongolia, the conventional measure of human capital––in which human capital is calculated by summing over the number workers with different educational levels, weighted by their earnings––is not available.
- 10 -
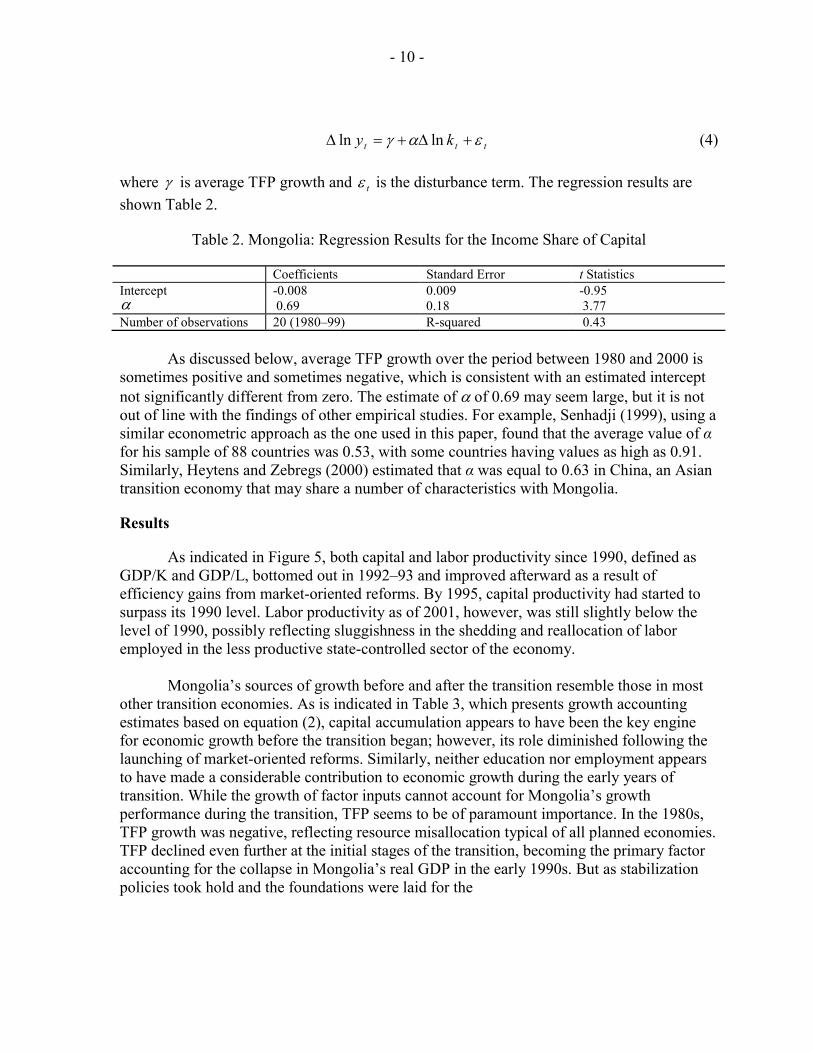
ttt ky εαγ +∆+=∆ lnln (4) where γ is average TFP growth and tε is the disturbance term. The regression results are shown Table 2.
Table 2. Mongolia: Regression Results for the Income Share of Capital
As discussed below, average TFP growth over the period between 1980 and 2000 is
sometimes positive and sometimes negative, which is consistent with an estimated intercept not significantly different from zero. The estimate of α of 0.69 may seem large, but it is not out of line with the findings of other empirical studies. For example, Senhadji (1999), using a similar econometric approach as the one used in this paper, found that the average value of α for his sample of 88 countries was 0.53, with some countries having values as high as 0.91. Similarly, Heytens and Zebregs (2000) estimated that α was equal to 0.63 in China, an Asian transition economy that may share a number of characteristics with Mongolia.
Results
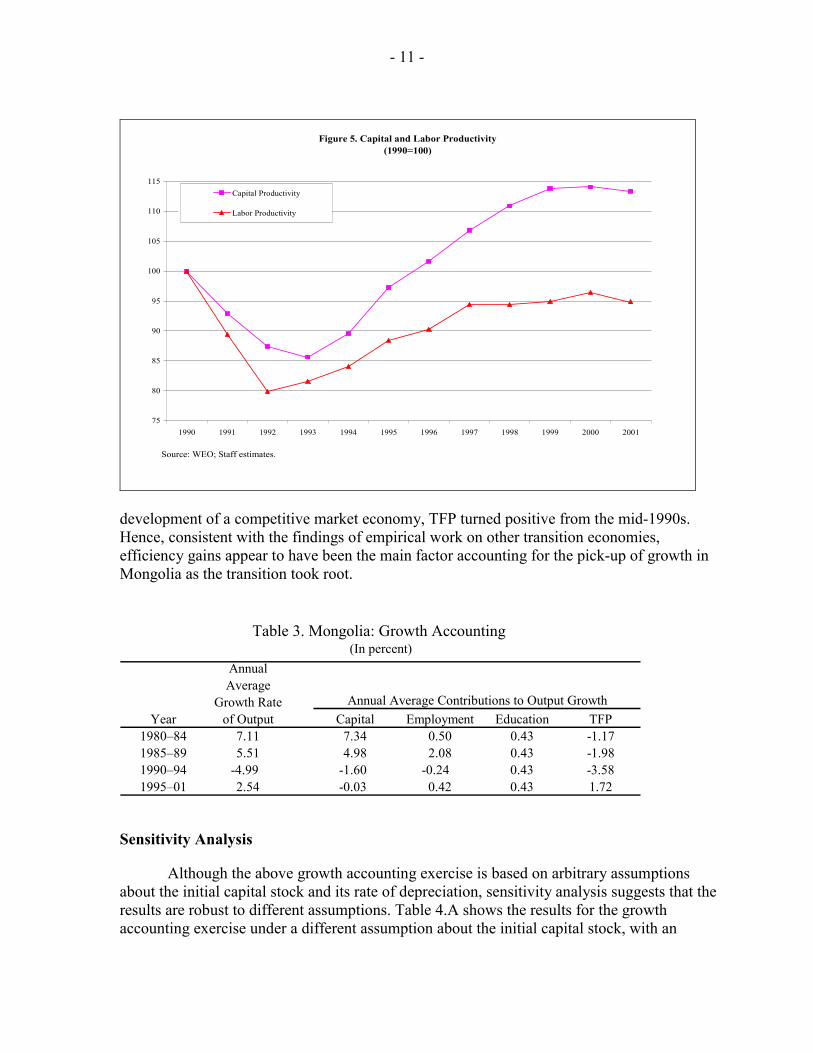
As indicated in Figure 5, both capital and labor productivity since 1990, defined as GDP/K and GDP/L, bottomed out in 1992–93 and improved afterward as a result of efficiency gains from market-oriented reforms. By 1995, capital productivity had started to surpass its 1990 level. Labor productivity as of 2001, however, was still slightly below the level of 1990, possibly reflecting sluggishness in the shedding and reallocation of labor employed in the less productive state-controlled sector of the economy. Mongolia’s sources of growth before and after the transition resemble those in most other transition economies. As is indicated in Table 3, which presents growth accounting estimates based on equation (2), capital accumulation appears to have been the key engine for economic growth before the transition began; however, its role diminished following the launching of market-oriented reforms. Similarly, neither education nor employment appears to have made a considerable contribution to economic growth during the early years of transition. While the growth of factor inputs cannot account for Mongolia’s growth performance during the transition, TFP seems to be of paramount importance. In the 1980s, TFP growth was negative, reflecting resource misallocation typical of all planned economies. TFP declined even further at the initial stages of the transition, becoming the primary factor accounting for the collapse in Mongolia’s real GDP in the early 1990s. But as stabilization policies took hold and the foundations were laid for the
Coefficients Standard Error t Statistics Intercept -0.008 0.009 -0.95 α 0.69 0.18 3.77 Number of observations 20 (1980–99) R-squared 0.43
- 11 -
Figure 5. Capital and Labor Productivity(1990=100)
75
80
85
90
95
100
105
110
115
1990 1991 1992 1993 1994 1995 1996 1997 1998 1999 2000 2001
Capital Productivity
Labor Productivity
Source: WEO; Staff estimates.
development of a competitive market economy, TFP turned positive from the mid-1990s. Hence, consistent with the findings of empirical work on other transition economies, efficiency gains appear to have been the main factor accounting for the pick-up of growth in Mongolia as the transition took root.
Year Capital Employment Education TFP1980–84 7.11 7.34 0.50 0.43 -1.171985–89 5.51 4.98 2.08 0.43 -1.981990–94 -4.99 -1.60 -0.24 0.43 -3.581995–01 2.54 -0.03 0.42 0.43 1.72
Table 3. Mongolia: Growth Accounting (In percent)
Annual Average Contributions to Output Growth
Annual Average
Growth Rate of Output
Sensitivity Analysis
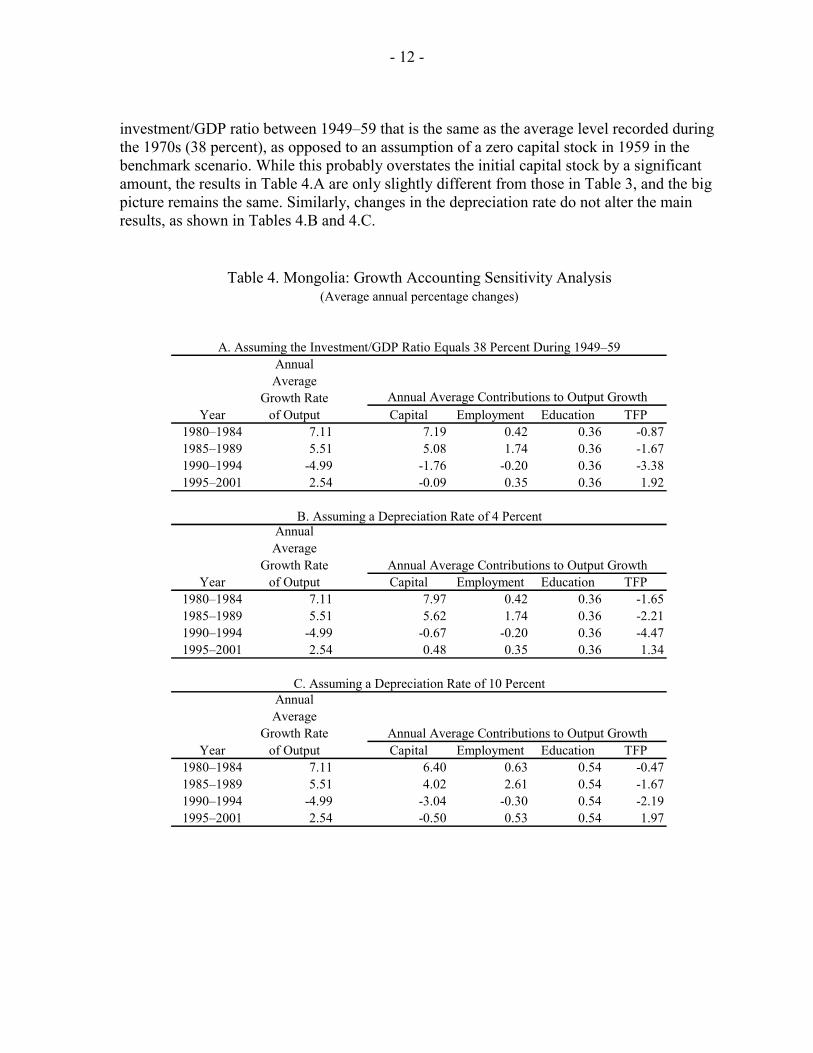
Although the above growth accounting exercise is based on arbitrary assumptions about the initial capital stock and its rate of depreciation, sensitivity analysis suggests that the results are robust to different assumptions. Table 4.A shows the results for the growth accounting exercise under a different assumption about the initial capital stock, with an
- 12 -
investment/GDP ratio between 1949–59 that is the same as the average level recorded during the 1970s (38 percent), as opposed to an assumption of a zero capital stock in 1959 in the benchmark scenario. While this probably overstates the initial capital stock by a significant amount, the results in Table 4.A are only slightly different from those in Table 3, and the big picture remains the same. Similarly, changes in the depreciation rate do not alter the main results, as shown in Tables 4.B and 4.C.
Year Capital Employment Education TFP1980–1984 7.11 7.19 0.42 0.36 -0.871985–1989 5.51 5.08 1.74 0.36 -1.671990–1994 -4.99 -1.76 -0.20 0.36 -3.381995–2001 2.54 -0.09 0.35 0.36 1.92
Year Capital Employment Education TFP1980–1984 7.11 7.97 0.42 0.36 -1.651985–1989 5.51 5.62 1.74 0.36 -2.211990–1994 -4.99 -0.67 -0.20 0.36 -4.471995–2001 2.54 0.48 0.35 0.36 1.34
Year Capital Employment Education TFP1980–1984 7.11 6.40 0.63 0.54 -0.471985–1989 5.51 4.02 2.61 0.54 -1.671990–1994 -4.99 -3.04 -0.30 0.54 -2.191995–2001 2.54 -0.50 0.53 0.54 1.97
B. Assuming a Depreciation Rate of 4 Percent
C. Assuming a Depreciation Rate of 10 Percent
Annual Average
Growth Rate of Output
Annual Average Contributions to Output Growth
Annual Average
Growth Rate of Output
Annual Average Contributions to Output Growth
Table 4. Mongolia: Growth Accounting Sensitivity Analysis(Average annual percentage changes)
A. Assuming the Investment/GDP Ratio Equals 38 Percent During 1949–59Annual Average
Growth Rate of Output
Annual Average Contributions to Output Growth
- 13 -
IV. COMPARISON WITH OTHER TRANSITION ECONOMIES
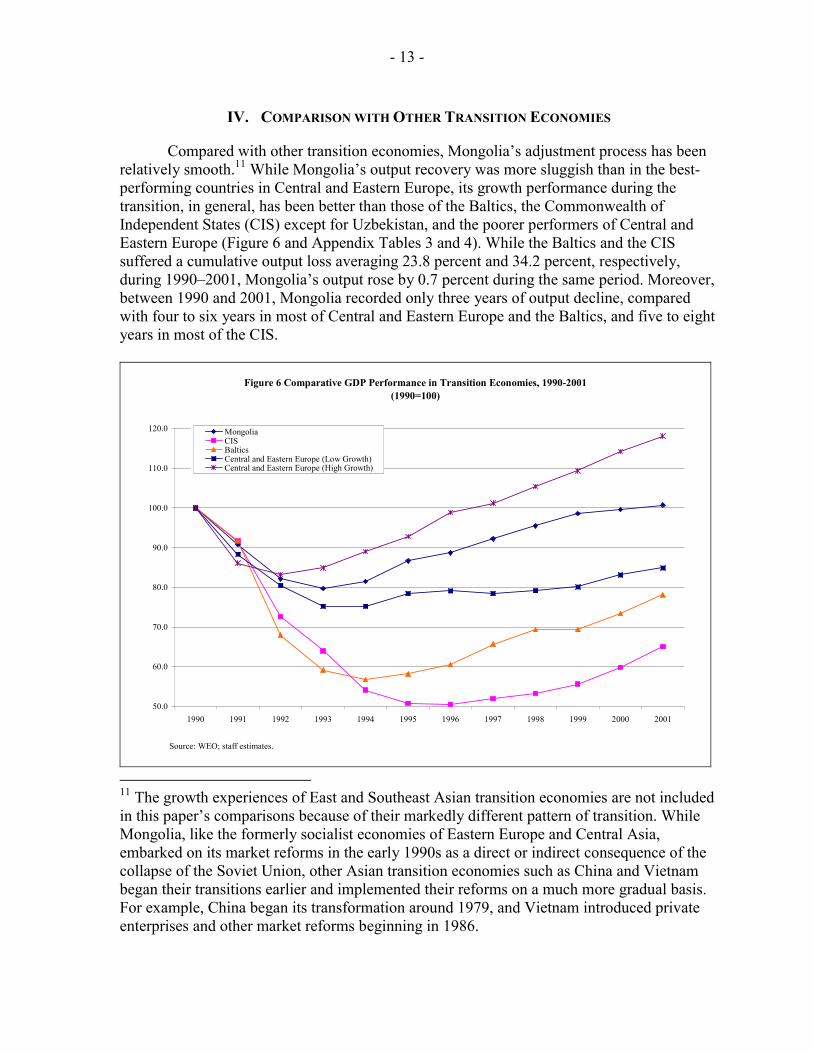
Compared with other transition economies, Mongolia’s adjustment process has been relatively smooth.11 While Mongolia’s output recovery was more sluggish than in the best-performing countries in Central and Eastern Europe, its growth performance during the transition, in general, has been better than those of the Baltics, the Commonwealth of Independent States (CIS) except for Uzbekistan, and the poorer performers of Central and Eastern Europe (Figure 6 and Appendix Tables 3 and 4). While the Baltics and the CIS suffered a cumulative output loss averaging 23.8 percent and 34.2 percent, respectively, during 1990–2001, Mongolia’s output rose by 0.7 percent during the same period. Moreover, between 1990 and 2001, Mongolia recorded only three years of output decline, compared with four to six years in most of Central and Eastern Europe and the Baltics, and five to eight years in most of the CIS.
Figure 6 Comparative GDP Performance in Transition Economies, 1990-2001(1990=100)
50.0
60.0
70.0
80.0
90.0
100.0
110.0
120.0
1990 1991 1992 1993 1994 1995 1996 1997 1998 1999 2000 2001
MongoliaCISBalticsCentral and Eastern Europe (Low Growth)Central and Eastern Europe (High Growth)
Source: WEO; staff estimates.
11 The growth experiences of East and Southeast Asian transition economies are not included in this paper’s comparisons because of their markedly different pattern of transition. While Mongolia, like the formerly socialist economies of Eastern Europe and Central Asia, embarked on its market reforms in the early 1990s as a direct or indirect consequence of the collapse of the Soviet Union, other Asian transition economies such as China and Vietnam began their transitions earlier and implemented their reforms on a much more gradual basis. For example, China began its transformation around 1979, and Vietnam introduced private enterprises and other market reforms beginning in 1986.
- 14 -
Mongolia’s relatively fast recovery cannot be easily attributed to geographical, historical, and other noneconomic factors. Despite Mongolia’s physical proximity and close historical and cultural ties to the former Soviet Union, its economic performance since the early 1990s has been noticeably stronger than that of CIS countries with similar characteristics. Indeed, quite surprisingly, Mongolia’s pattern of growth and recovery resembles more those in the high-growth Central and Eastern European countries, which are very different from Mongolia in terms of geography and history, and have had a somewhat shorter-lived experience under a Soviet-style system of central planning.
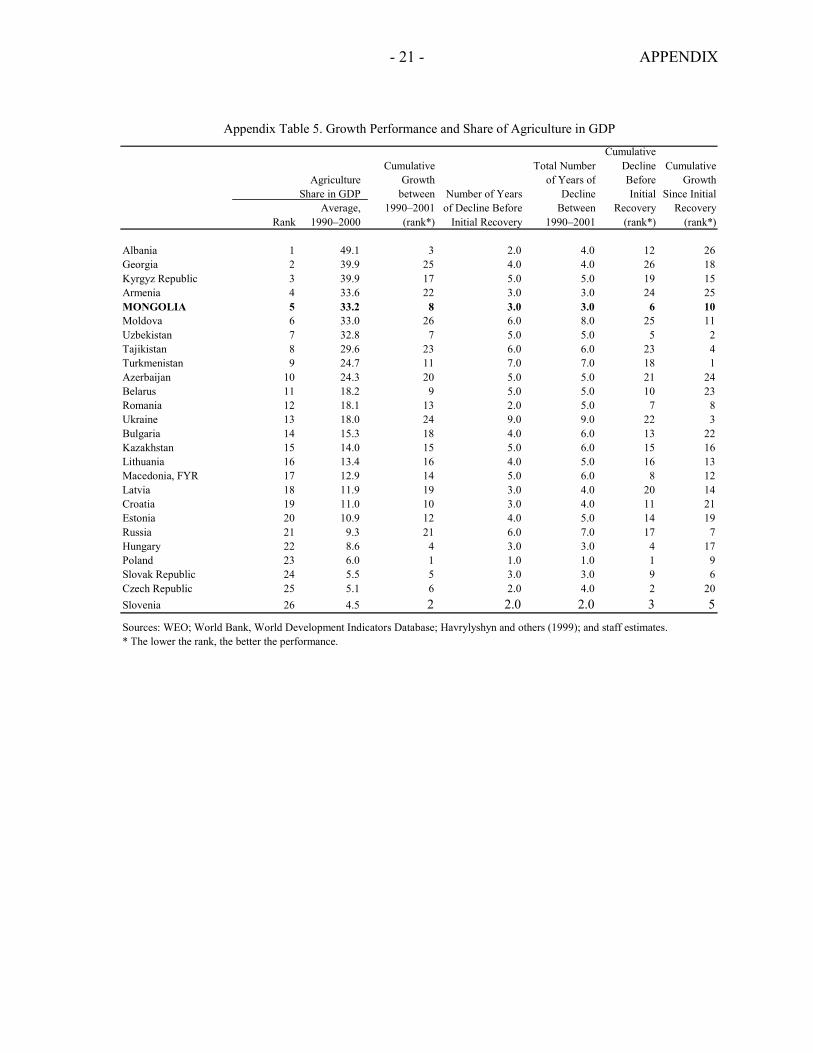
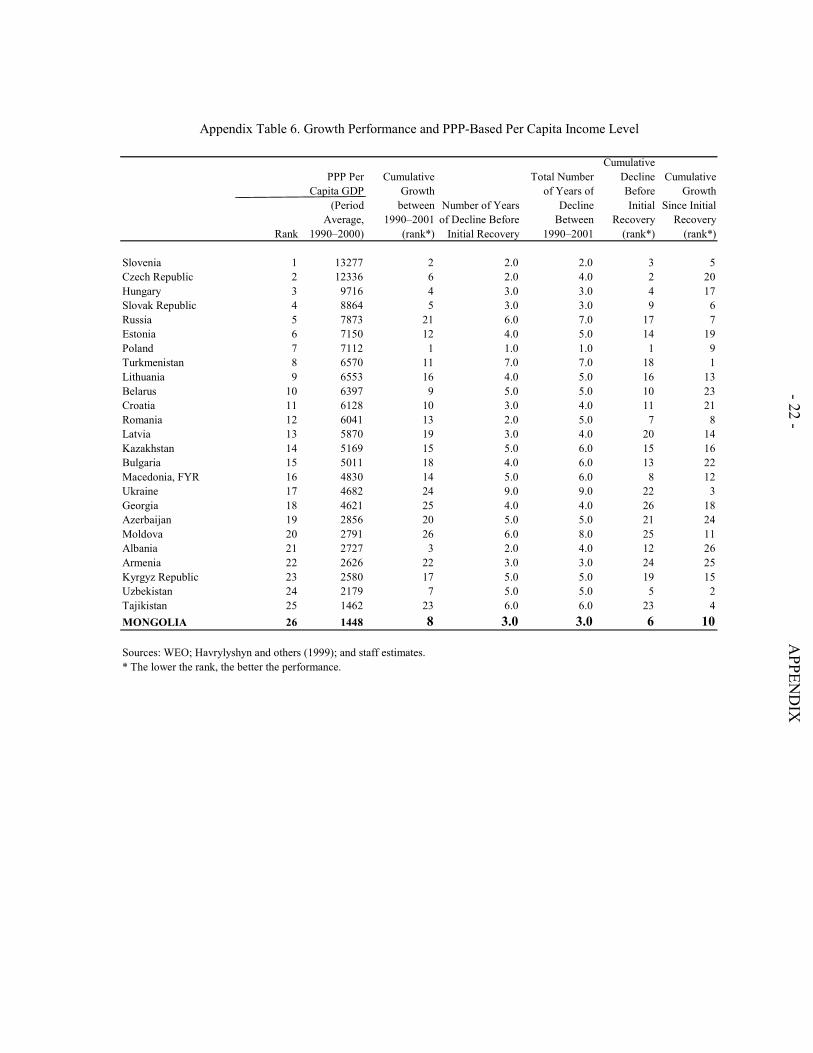
A number of favorable initial economic and social factors may partly explain Mongolia’s relatively good performance. First, unlike some transition countries that embarked on their transition with a significant degree of overindustrialization, Mongolia launched its market reforms with a relatively rudimentary economic structure. As shown in Appendix Tables 5–6, Mongolia was among the countries with the highest share of the agricultural sector in GDP over the period 1990–2000 and has been the poorest country in terms of PPP-based per capita income.12 Such a simple economic structure is likely to have reduced the complexity of the market reforms, facilitating price liberalization and early enterprise restructuring.13 Second, Mongolia’s relatively good performance may also be partly attributed to some favorable noneconomic initial conditions. Unlike some other transition economies seriously disrupted by civil conflicts, blockades, or sanctions such as in Armenia, Azerbaijan, and Tajikistan, Mongolia has enjoyed a peaceful and relatively stable social and political environment from the early days of the transition.
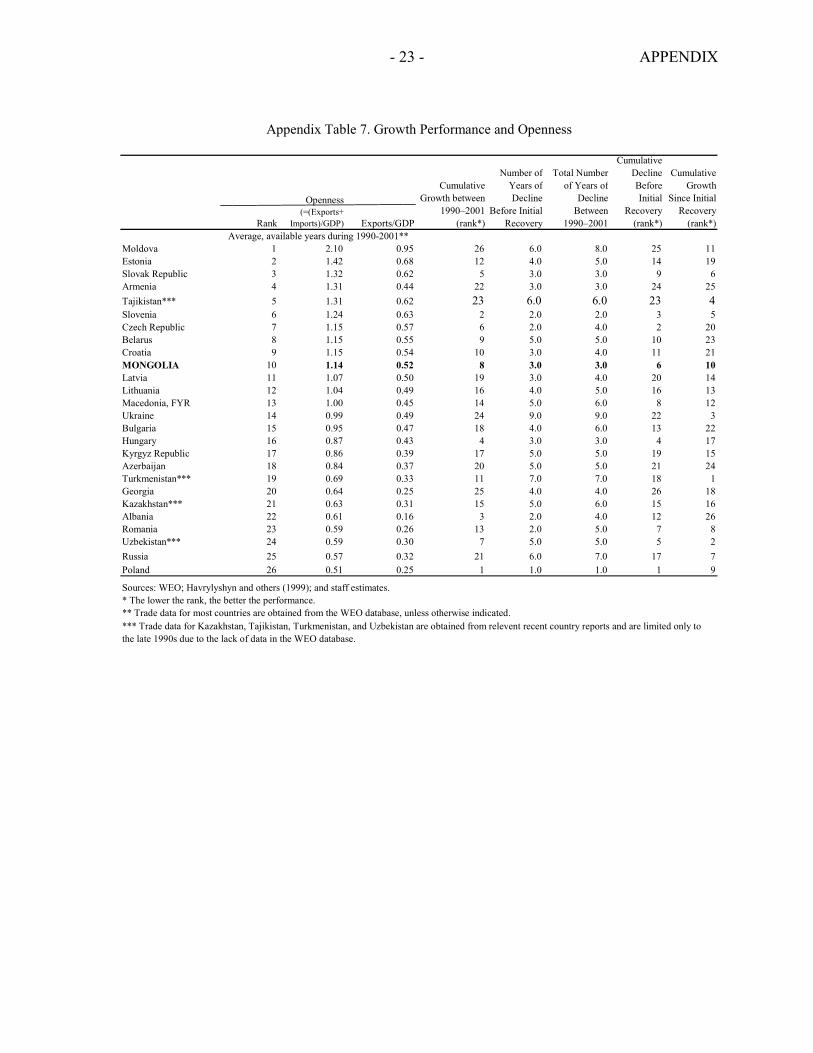
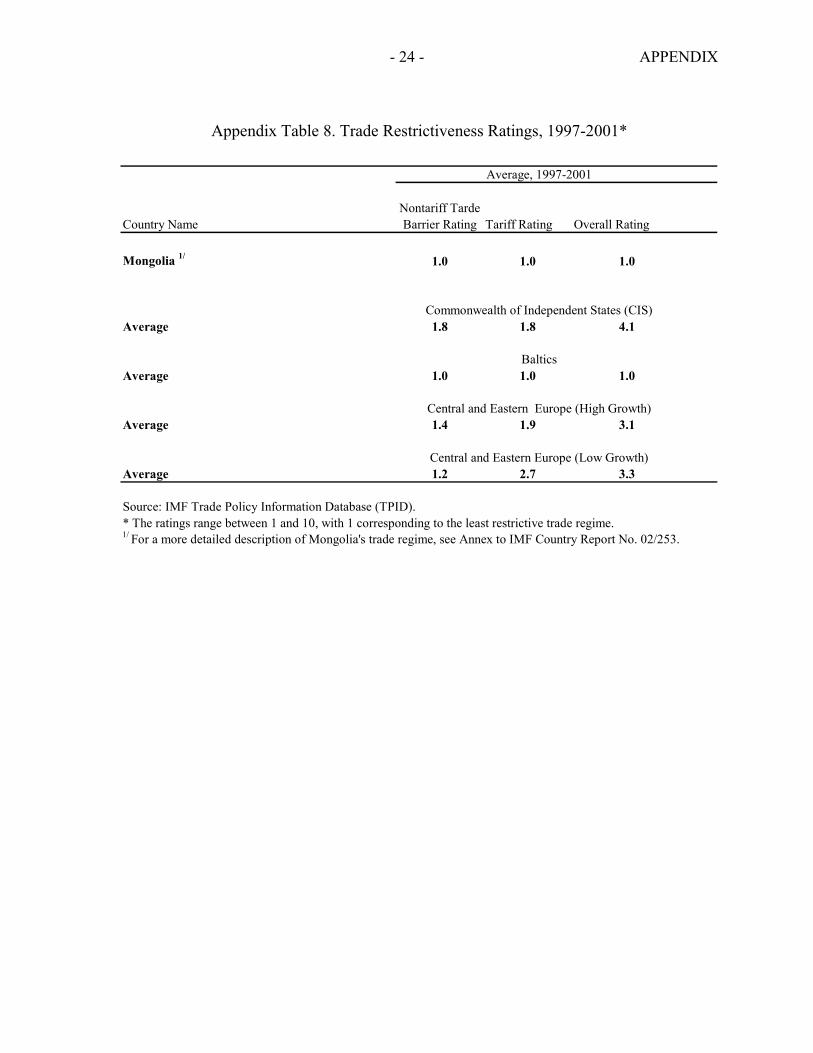
Perhaps most importantly, the early adoption of appropriate adjustment policies and
market-based reforms is likely to have been instrumental in promoting sustainable growth. In particular, the Mongolian authorities promptly established an open exchange and trade system at the outset of transition. As shown in Appendix Tables 7 and 8, compared with other transition economies, Mongolia is a fairly open economy, with a high exports-plus-imports-to-GDP ratio and one of the least restrictive trade regimes.14 Moreover, the authorities made a determined macroeconomic adjustment effort to contain inflation and
12 For a more general discussion of how initial conditions such as overindustrialization may have affected the pace of growth and recovery in transition countries, see Havrylyshyn et al. (1999) and references therein.
13 For a more detailed review of the possible factors that may have spurred enterprise restructuring and the formation of new enterprises in transition economies, see Djankov and Murrell (2002) and McMillan and Woodruff (2002).
14 The strong and positive link between openness to international trade and growth is well-documented in the economics literature. In a recent study of economic performance and trade in the CIS, Odling-Smee (2003) provides considerable evidence suggesting that the relatively low degree of openness of CIS countries has been a barrier to growth in the region.

- 15 -
external imbalances, including by implementing a firm monetary policy coupled with a flexible exchange rate system. This created the conditions for a rapid expansion of trade and investment without threatening short-term macroeconomic stability.15
V. CONCLUSIONS
This paper has described some of the key stylized facts of Mongolia’s growth and recovery during the first decade of its transition to a market-based system, and compared them with those of other transition economies. The major findings are as follows:
• As in most former socialist countries, while capital accumulation appears to have been the primary factor accounting for growth prior to the establishment of a market system, efficiency gains became the main source of growth during the early stages of transition;
• Mongolia, like most other transition economies, experienced a painful, initial
“transformational recession” before the economy began to recover; • Mongolia’s adjustment process has been smooth compared with other transition
economies and has been less costly in terms of output loss than those of countries of the former Soviet Union that have similar geographical and historical features; and
• While Mongolia’s relatively strong output performance can be partly explained by
favorable economic and noneconomic initial conditions, the early adoption of appropriate adjustment policies and market-oriented reforms is likely to have played a key role in supporting the prompt recovery of growth.
While the above results are instructive, they need to be interpreted with caution in light of the well-known weaknesses in the quality of national accounts and related data in transition economies.16 These data weaknesses mean that comparisons of economic performance before and after the transition, and across countries, along the lines described above, may be subject to a large margin of error.
One particularly important general caveat for the results of this paper is that, owing to the serious limitations of GDP statistics for transition economies, the collapse in economic activity in CIS countries during the 1990s may be considerably overstated. To the extent that 15 Many studies have found that sound macroeconomic policies and structural reforms have played a critical role in promoting growth during the transition process. See, for example, Iradian (2003).
16 See, for example, Campos and Coricelli (2002) and references therein. For Mongolia, the quality of post-transition national accounts are of particular concern, as elaborated in Chapter II of IMF Country Report No. 02/253.

- 16 -
some particular features of Mongolia’s economy, such as the importance of the agricultural sector, have resulted in a more modest overstatement of the fall in output during the early 1990s, the actual differences in cumulative output performance between Mongolia and the CIS countries may be somewhat smaller than suggested in this paper.
- 17 - APPENDIX
1995 1998 1999 2000 2001
Primary Sector 354.2 394.2 402.6 393.5 402.4(percent of total employment) 46.1 49.7 49.5 48.6 48.3
Secondary Sector 137.6 125.4 126.4 114.4 113.7(percent of total employment) 17.9 15.8 15.5 14.1 13.7
Tertiary Sector 275.8 273.0 284.6 301.1 316.2(percent of total employment) 35.9 34.4 35.0 37.2 38.0
Total Employment 767.6 792.6 813.6 809.0 832.3(percent of economically active) ... ... 95.3 95.4 95.4
Unemployed ... ... 39.8 38.6 40.3(percent of economically active) ... ... 4.7 4.6 4.6
Economically active ... ... 853.4 847.6 872.6(percent of labor force) ... ... 66.7 61.7 62.2
Labor Force ... 1,256.8 1,279.3 1,374.4 1,402.8(percent of population) ... 53.3 53.8 57.3 58.2
Population 2,275.0 2,356.1 2,378.3 2,398.0 2,409.0
Population Density 1.5 1.5 1.5 1.5 1.5Compared with:
Canada 3.2 3.3 3.3 3.3 3.4United States 28.9 30.0 30.4 30.7 31.2China 129.2 133.2 134.4 135.3 136.8Japan 344.0 346.8 347.5 348.1 348.8Bangladesh 922.9 972.3 989.4 1,006.8 1,012.0
Sources: National Statistical Office of Mongolia, World Bank, World Development Indicators Database;WEO; and staff estimates. Data for years not shown are not available.
Appendix Table 1. Mongolia: Population and Labor Statistics
(In thousands of people, unless otherwise indicated)
(In people per sq km)
- 18 - APPENDIX
Year Real GDPReal
Investment Capital Labor Human Capital(In thousands of
persons)(Average number of years of schooling)
1980 376.1 172.8 1,183.8 516.0 6.71981 407.4 235.3 1,348.1 518.0 6.71982 441.4 250.0 1,517.2 532.2 6.81983 466.9 208.7 1,634.9 543.0 6.91984 494.9 236.7 1,773.5 550.3 7.01985 525.7 259.9 1,927.0 589.5 7.11986 575.0 294.1 2,105.5 643.1 7.21987 594.8 278.9 2,258.0 665.4 7.31988 625.2 275.4 2,398.0 743.3 7.41989 651.5 291.8 2,545.9 764.1 7.51990 635.1 205.4 2,598.5 783.6 7.61991 576.4 97.0 2,539.6 795.7 7.71992 521.6 54.8 2,442.0 806.0 7.91993 505.9 122.3 2,417.8 765.4 8.01994 517.6 92.7 2,365.4 759.8 8.11995 550.3 91.5 2,315.0 767.6 8.21996 563.2 91.3 2,267.4 769.6 8.31997 585.7 111.4 2,242.8 765.1 8.41998 606.4 129.5 2,237.7 792.6 8.51999 625.9 146.6 2,250.1 813.6 8.72000 632.5 153.8 2,268.8 809.0 8.82001 639.7 175.9 2,308.6 832.3 8.9
Sources: Data provided by the NSO; and Living Standards Survey, 1998.
Appendix Table 2. Mongolia: Estimates of Real GDP and Factor Inputs, 1980–2001
(In billions of togrogs, constant 1995 prices)

- 19 - APPENDIX
Coun
try19
8919
9019
9119
9219
9319
9419
9519
9619
9719
9819
9920
0020
01
Mon
golia
102.
610
0.0
90.8
82.1
79.7
81.5
86.6
88.7
92.2
95.5
98.6
99.6
100.
7
Arm
enia
102.
210
0.0
87.6
41.5
35.7
37.6
40.2
42.6
44.0
47.2
48.8
51.7
56.7
Aze
rbai
jan
113.
310
0.0
99.3
76.7
59.0
47.4
41.8
42.3
44.8
49.3
52.9
58.8
64.1
Bela
rus
102.
310
0.0
98.8
89.2
82.9
75.5
67.7
69.6
77.5
83.9
86.8
91.8
95.6
Geo
rgia
117.
610
0.0
78.9
43.5
30.7
27.5
28.3
31.2
34.5
35.5
36.6
37.3
39.0
Kaz
akhs
tan
102.
310
0.0
89.0
84.3
76.5
66.9
61.4
61.7
62.7
61.5
63.2
69.4
78.5
Kyr
gyz
Rep
ublic
102.
410
0.0
92.2
79.4
67.1
53.8
50.9
54.5
59.9
61.1
63.3
66.8
70.3
Mol
dova
102.
410
0.0
82.5
53.9
53.3
36.8
36.3
34.2
34.7
32.4
31.3
32.0
34.0
Russ
ia96
.410
0.0
94.5
76.9
66.9
57.9
55.5
53.6
54.1
51.4
54.2
59.1
62.1
Tajik
ista
n14
8.3
100.
092
.966
.158
.746
.240
.438
.639
.341
.342
.946
.451
.2Tu
rkm
enist
an10
2.3
100.
095
.390
.281
.267
.262
.358
.251
.655
.264
.375
.991
.4U
krai
ne10
3.7
100.
089
.480
.769
.253
.346
.942
.240
.940
.140
.042
.346
.2U
zbek
istan
95.9
100.
099
.588
.586
.482
.882
.083
.485
.489
.192
.996
.510
0.8
Ave
rage
107.
410
0.0
91.6
72.6
64.0
54.4
51.1
51.0
52.4
54.0
56.4
60.7
65.8
Esto
nia
102.
310
0.0
92.1
72.2
66.2
64.9
67.7
70.4
77.2
80.8
80.3
86.0
90.3
Latv
ia10
2.3
100.
088
.957
.649
.049
.348
.950
.554
.957
.057
.661
.666
.2Li
thua
nia
94.8
100.
094
.374
.262
.256
.158
.060
.765
.168
.465
.868
.372
.3A
vera
ge99
.810
0.0
91.8
68.0
59.2
56.8
58.2
60.5
65.7
68.8
67.9
72.0
76.3
Bulg
aria
110.
010
0.0
89.6
81.7
71.8
66.2
69.1
62.6
59.1
61.5
62.9
66.3
68.9
Croa
tia10
8.1
100.
083
.073
.367
.471
.476
.380
.886
.188
.388
.091
.295
.0M
aced
onia
, FY
R10
8.1
100.
093
.887
.681
.079
.678
.779
.680
.883
.587
.191
.087
.3Ro
man
ia10
5.9
100.
087
.179
.480
.783
.889
.993
.587
.883
.682
.684
.188
.6
Ave
rage
108.
010
0.0
88.4
80.5
75.2
75.3
78.5
79.1
78.5
79.2
80.1
83.2
84.9
Alb
ania
111.
110
0.0
72.0
66.8
73.2
80.1
79.4
95.2
88.5
95.6
102.
611
0.6
117.
8Cz
ech
Rep
ublic
102.
510
0.0
88.4
87.9
88.0
89.9
95.3
99.4
98.6
97.6
98.0
101.
210
4.5
Hun
gary
103.
610
0.0
88.1
85.4
84.9
87.4
88.7
89.9
94.0
98.6
102.
710
8.1
112.
2Po
land
107.
710
0.0
93.0
94.9
99.0
104.
111
1.2
117.
912
5.9
131.
913
7.3
142.
814
4.3
Slov
ak R
epub
lic10
0.4
100.
084
.178
.575
.679
.384
.689
.995
.499
.310
0.5
102.
810
6.1
Slov
enia
108.
110
0.0
91.1
86.1
88.5
93.3
97.1
100.
510
5.1
109.
111
4.8
120.
112
3.6
Ave
rage
105.
610
0.0
86.1
83.3
84.9
89.0
92.7
98.8
101.
310
5.4
109.
311
4.3
118.
1
Sour
ces:
IMF,
WEO
; Hav
ryly
shyn
and
oth
ers (
1999
); an
d sta
ff es
timat
es.
App
endi
x Ta
ble
3. G
DP
Perf
orm
ance
in T
rans
ition
Eco
nom
ies
Cen
tral
and
Eas
tern
Eur
ope
(Pos
itive
Gro
wth
)
Inde
x (1
990=
100)
Com
mon
thw
ealth
of I
ndep
ende
nt S
tate
s (C
IS)
Bal
tics
Cen
tral
and
Eas
tern
Eur
ope
(Neg
ativ
e G
row
th)

- 20 - APPENDIX
Cumulative Growth
between 1990–2001
Number of Years of Decline
Before Initial Recovery
Total Number of Years of
Decline Between
1990–2001
Cumulative Decline Before Initial
Recovery
Cumulative Growth
Since Initial Recovery
Average Growth
between Initial
Recovery and 2001
MONGOLIA 0.7 3.0 3.0 -20.3 26.4 3.0
Armenia -43.3 3.0 3.0 -64.3 58.8 5.9Azerbaijan -35.9 5.0 5.0 -58.2 53.3 7.4Belarus -4.4 5.0 5.0 -32.3 41.2 5.9Georgia -61.0 4.0 4.0 -72.5 41.5 5.1Kazakhstan -21.5 5.0 6.0 -38.6 28.0 4.2Kyrgyz Republic -29.7 5.0 5.0 -49.1 38.1 5.5Moldova -66.0 6.0 8.0 -65.8 -0.6 -0.1Russia -37.9 6.0 7.0 -46.4 15.8 3.0Tajikistan -48.8 6.0 6.0 -61.4 32.5 5.8Turkmenistan -8.6 7.0 7.0 -48.4 77.2 15.4Ukraine -53.8 9.0 9.0 -60.0 15.4 7.4Uzbekistan 0.8 5.0 5.0 -18.0 22.9 3.5Average -34.2 5.5 5.8 -51.3 35.3 5.8
Estonia -9.7 4.0 5.0 -35.1 39.1 4.8Latvia -33.8 3.0 4.0 -51.0 35.1 3.8Lithuania -27.7 4.0 5.0 -43.9 28.8 3.7Average -23.7 3.7 4.7 -43.3 34.3 4.1
Albania 17.8 2.0 4.0 -33.2 76.3 6.5Czech Republic 4.5 2.0 4.0 -12.1 18.9 1.9Hungary 12.2 3.0 3.0 -15.1 32.2 3.5Poland 44.3 1.0 1.0 -7.0 55.1 4.5Slovak Republic 6.1 3.0 3.0 -24.4 40.5 4.3Slovenia 23.6 2.0 2.0 -13.9 43.6 4.1Average 18.1 2.2 2.8 -17.6 44.4 4.2
Bulgaria -31.1 4.0 6.0 -33.8 4.0 0.6Croatia -5.0 3.0 4.0 -32.6 40.8 4.4Macedonia, FYR -12.7 5.0 6.0 -21.3 10.9 1.7Romania -11.4 2.0 5.0 -20.6 11.5 1.2Average -15.1 3.5 5.3 -27.0 16.8 2.0
Sources: IMF, WEO; Havrylyshyn and others (1999); and staff estimates.
Appendix Table 4. Growth Performance and Location
Central and Eastern Europe (Low Growth)
Commonwealth of Independent States (CIS)
Baltics
Central and Eastern Europe (High Growth)
- 21 - APPENDIX
Rank
Agriculture Share in GDP
Average, 1990–2000
Cumulative Growth
between 1990–2001
(rank*)
Number of Years of Decline Before
Initial Recovery
Total Number of Years of
Decline Between
1990–2001
Cumulative Decline Before Initial
Recovery (rank*)
Cumulative Growth
Since Initial Recovery
(rank*)
Albania 1 49.1 3 2.0 4.0 12 26Georgia 2 39.9 25 4.0 4.0 26 18Kyrgyz Republic 3 39.9 17 5.0 5.0 19 15Armenia 4 33.6 22 3.0 3.0 24 25MONGOLIA 5 33.2 8 3.0 3.0 6 10Moldova 6 33.0 26 6.0 8.0 25 11Uzbekistan 7 32.8 7 5.0 5.0 5 2Tajikistan 8 29.6 23 6.0 6.0 23 4Turkmenistan 9 24.7 11 7.0 7.0 18 1Azerbaijan 10 24.3 20 5.0 5.0 21 24Belarus 11 18.2 9 5.0 5.0 10 23Romania 12 18.1 13 2.0 5.0 7 8Ukraine 13 18.0 24 9.0 9.0 22 3Bulgaria 14 15.3 18 4.0 6.0 13 22Kazakhstan 15 14.0 15 5.0 6.0 15 16Lithuania 16 13.4 16 4.0 5.0 16 13Macedonia, FYR 17 12.9 14 5.0 6.0 8 12Latvia 18 11.9 19 3.0 4.0 20 14Croatia 19 11.0 10 3.0 4.0 11 21Estonia 20 10.9 12 4.0 5.0 14 19Russia 21 9.3 21 6.0 7.0 17 7Hungary 22 8.6 4 3.0 3.0 4 17Poland 23 6.0 1 1.0 1.0 1 9Slovak Republic 24 5.5 5 3.0 3.0 9 6Czech Republic 25 5.1 6 2.0 4.0 2 20Slovenia 26 4.5 2 2.0 2.0 3 5
Sources: WEO; World Bank, World Development Indicators Database; Havrylyshyn and others (1999); and staff estimates.* The lower the rank, the better the performance.
Appendix Table 5. Growth Performance and Share of Agriculture in GDP
- 22 -
APPEN
DIX
Rank
PPP Per Capita GDP
(Period Average,
1990–2000)
Cumulative Growth
between 1990–2001
(rank*)
Number of Years of Decline Before
Initial Recovery
Total Number of Years of
Decline Between
1990–2001
Cumulative Decline Before Initial
Recovery (rank*)
Cumulative Growth
Since Initial Recovery
(rank*)
Slovenia 1 13277 2 2.0 2.0 3 5Czech Republic 2 12336 6 2.0 4.0 2 20Hungary 3 9716 4 3.0 3.0 4 17Slovak Republic 4 8864 5 3.0 3.0 9 6Russia 5 7873 21 6.0 7.0 17 7Estonia 6 7150 12 4.0 5.0 14 19Poland 7 7112 1 1.0 1.0 1 9Turkmenistan 8 6570 11 7.0 7.0 18 1Lithuania 9 6553 16 4.0 5.0 16 13Belarus 10 6397 9 5.0 5.0 10 23Croatia 11 6128 10 3.0 4.0 11 21Romania 12 6041 13 2.0 5.0 7 8Latvia 13 5870 19 3.0 4.0 20 14Kazakhstan 14 5169 15 5.0 6.0 15 16Bulgaria 15 5011 18 4.0 6.0 13 22Macedonia, FYR 16 4830 14 5.0 6.0 8 12Ukraine 17 4682 24 9.0 9.0 22 3Georgia 18 4621 25 4.0 4.0 26 18Azerbaijan 19 2856 20 5.0 5.0 21 24Moldova 20 2791 26 6.0 8.0 25 11Albania 21 2727 3 2.0 4.0 12 26Armenia 22 2626 22 3.0 3.0 24 25Kyrgyz Republic 23 2580 17 5.0 5.0 19 15Uzbekistan 24 2179 7 5.0 5.0 5 2Tajikistan 25 1462 23 6.0 6.0 23 4MONGOLIA 26 1448 8 3.0 3.0 6 10
Sources: WEO; Havrylyshyn and others (1999); and staff estimates.* The lower the rank, the better the performance.
Appendix Table 6. Growth Performance and PPP-Based Per Capita Income Level
- 23 - APPENDIX
Rank
Openness (=(Exports+
Imports)/GDP) Exports/GDP
Cumulative Growth between
1990–2001 (rank*)
Number of Years of Decline
Before Initial Recovery
Total Number of Years of
Decline Between
1990–2001
Cumulative Decline Before Initial
Recovery (rank*)
Cumulative Growth
Since Initial Recovery
(rank*)
Moldova 1 2.10 0.95 26 6.0 8.0 25 11Estonia 2 1.42 0.68 12 4.0 5.0 14 19Slovak Republic 3 1.32 0.62 5 3.0 3.0 9 6Armenia 4 1.31 0.44 22 3.0 3.0 24 25Tajikistan*** 5 1.31 0.62 23 6.0 6.0 23 4Slovenia 6 1.24 0.63 2 2.0 2.0 3 5Czech Republic 7 1.15 0.57 6 2.0 4.0 2 20Belarus 8 1.15 0.55 9 5.0 5.0 10 23Croatia 9 1.15 0.54 10 3.0 4.0 11 21MONGOLIA 10 1.14 0.52 8 3.0 3.0 6 10Latvia 11 1.07 0.50 19 3.0 4.0 20 14Lithuania 12 1.04 0.49 16 4.0 5.0 16 13Macedonia, FYR 13 1.00 0.45 14 5.0 6.0 8 12Ukraine 14 0.99 0.49 24 9.0 9.0 22 3Bulgaria 15 0.95 0.47 18 4.0 6.0 13 22Hungary 16 0.87 0.43 4 3.0 3.0 4 17Kyrgyz Republic 17 0.86 0.39 17 5.0 5.0 19 15Azerbaijan 18 0.84 0.37 20 5.0 5.0 21 24Turkmenistan*** 19 0.69 0.33 11 7.0 7.0 18 1Georgia 20 0.64 0.25 25 4.0 4.0 26 18Kazakhstan*** 21 0.63 0.31 15 5.0 6.0 15 16Albania 22 0.61 0.16 3 2.0 4.0 12 26Romania 23 0.59 0.26 13 2.0 5.0 7 8Uzbekistan*** 24 0.59 0.30 7 5.0 5.0 5 2Russia 25 0.57 0.32 21 6.0 7.0 17 7Poland 26 0.51 0.25 1 1.0 1.0 1 9
Sources: WEO; Havrylyshyn and others (1999); and staff estimates.* The lower the rank, the better the performance.** Trade data for most countries are obtained from the WEO database, unless otherwise indicated.*** Trade data for Kazakhstan, Tajikistan, Turkmenistan, and Uzbekistan are obtained from relevent recent country reports and are limited only to the late 1990s due to the lack of data in the WEO database.
Appendix Table 7. Growth Performance and Openness
Average, available years during 1990-2001**
- 24 - APPENDIX
Country NameNontariff Tarde Barrier Rating Tariff Rating Overall Rating
Mongolia 1/ 1.0 1.0 1.0
Average 1.8 1.8 4.1
Average 1.0 1.0 1.0
Average 1.4 1.9 3.1
Average 1.2 2.7 3.3
Source: IMF Trade Policy Information Database (TPID).* The ratings range between 1 and 10, with 1 corresponding to the least restrictive trade regime.1/ For a more detailed description of Mongolia's trade regime, see Annex to IMF Country Report No. 02/253.
Central and Eastern Europe (Low Growth)
Appendix Table 8. Trade Restrictiveness Ratings, 1997-2001*
Average, 1997-2001
Commonwealth of Independent States (CIS)
Baltics
Central and Eastern Europe (High Growth)

- 25 -
References
Anderson, James, Young Lee, and Peter Murrell, 2000, “Competition and Privatization Amidst Weak Institutions: Evidence From Mongolia,” Economic Inquiry, Vol. 38, No. 4 (October), pp. 527–549.
Barro, Robert J., and Xavier Sala-i-Martin, 2000, Economic Growth, (New York: McGraw-
Hill). Black, Stanley, 2001, “Obstacles to Faster Growth in Transition Economies: The Mongolian
Case,” IMF Working Paper WP/01/37 (Washington, D.C.: International Monetary Fund).
Campos, Nauro and Fabrizio Coricelli, 2002, “Growth in Transition: What We Know, What
We Don’t and What We Should,” Journal of Economic Literature, Vol. 60, No. 3 (September), pp.793–836.
Djankov, Simeon, and Peter Murrell, 2002, “Enterprise Restructuring in Transition: A
Quantitative Survey,” Journal of Economic Literature, Vol. 60, No. 3 (September), pp. 739–92.
Doyle, Peter, Guorong Jiang, and Louis Kuijs, 2002, “Real Convergence to EU Income
Levels: Central Europe from 1990 to the Long Term,” Into the EU: Policy Frameworks in Central Europe (Washington, D.C.: International Monetary Fund).
Economist Intelligence Unit, 2001, Mongolia Country Profile. Havrylyshyn, Oleh, 2001, “Recovery and Growth in Transition: A Decade of Evidence,”
IMF Staff Papers (Special Issue), Vol 48, pp. 53–87. Havrylyshyn, Oleh, Thomas Wolf, Julian Berengaut, Marta Castello-Branco, Ron van
Rooden, and Valerie Mercer-Blackman, 1999, “Growth Experience in Transition Countries, 1990–98,” IMF Occasional Paper 184 (Washington, D.C.: International Monetary Fund).
Heytens, Paul and Harm Zebregs, 2000, “How Fast can China Grow?” People’s Republic of
China: Selected Issues (Washington, D.C.: International Monetary Fund). International Monetary Fund, 2002, IMF Country Report No. 02/253 (Washington, D.C.:
International Monetary Fund). Iradian, Garbis, 2003, “Armenia: The Road to Sustained Rapid Growth, Cross-Country
Evidence,” IMF Working Paper 03/103 (Washington, D.C.: International Monetary Fund).
- 26 -
Kalra, Sanjay, and Torsten Sløk, 1999, “Inflation and Growth in Transition: Are the Asian Economies Different?” IMF Working Paper 99/118 (Washington, D.C.: International Monetary Fund).
Lucas, Robert, 1998, “On the Mechanics of Economic Development,” Journal of Monetary
Economics, Vol. 22 (July), pp. 3–42. McMillan, John, and Christopher Woodruff, 2002, “The Central Role of Entrepreneurs in
Transition Economies,” Journal of Economic Perspectives, Vol. 16, No. 3 (Summer), pp. 153–70.
Mongolian National Statistical Office and UNDP, 1998, Living Standards Measurement
Survey 1998. Odling-Smee, John, 2003, Economic Performance and Trade in the CIS, presentation
delivered at the International Conference dedicated to the 10th Anniversary of the National Currency of the Kyrgyz Republic, held in Bishkek on May 10, 2003.
Sarel, Michael, 1997, “Growth and Productivity in ASEAN Countries,” IMF Working Paper
97/97 (Washington, D.C.: International Monetary Fund). Schneider, Friedrich, and Dominik H. Enste, 2000, “Shadow Economies: Size, Causes and
Consequences,” Journal of Economic Literature, Vol. 38, No. 1 (March), pp. 77–114.
Senhadji, Abdelhak, 1999, “Sources of Economic Growth: An Extensive Growth Accounting
Exercise,” IMF Working Paper 99/77 (Washington, D.C.: International Monetary Fund).
Sløk, Torsten, 2000, “Monetary Policy in Transition: The Case of Mongolia,” IMF Working
Paper WP/00/21 (Washington, D.C.: International Monetary Fund). Young, Alwyn, “Gold into Base Metals: Productivity Growth in the People’s Republic of
China During the Reform Period,” NBER Working Paper 7856 (Cambridge, Massachusetts: National Bureau of Economic Research).