Embed Size (px)
Citation preview
Growth an d Yield 3 5 Years afterComme rcial ly Thinnin g 50-year-oldDouglas-firISSN 0835 0752 JANUARY 1988
FORESTRY FRDAREPORT 021
E C O N O M I C & R E G I O N A L D E V E L O P M E N T A G R E E M E N T

Growth and Yield 35 Years afterCommercially Thinning 50-year-old
Douglas-fir
byS.A.Y. Omule
B.C. Ministry of Forests and LandsResearch Branch31 Bastion Square
Victoria, B.C.V8W 3E7
January 1988
E C O N O M I C & R E G I O N A L D E V E L O P M E N T A G R E E M E N T
ABSTRACT
Remeasurement data over a period of 35 years from fourteen 0.2023-ha permanent plots were analysedto determine the growth and yield effects of commercially thinning 50-year-old Douglas-fir stands on a goodsite on Vancouver Island, British Columbia. Compared to unthinned stands, the commercially thinned standshad:
- virtually the same total volume gross annual growth, top height, and top height growth;
- 12% more potentially usable total volume yield (including thinnings);
- 18% less total volume at final harvest age 86;
- virtually the same crop-tree (193 largest-diameter trees per hectare) average diameter, but 24% largerentire-stand quadratic mean diameter; and
- 11% less total volume production lost to mortality.
These results show that commercial thinning slightly increased total stand yield (including thinnings) andproduced larger diameter trees at rotation age 86, but that it also reduced usable total volume at final harvestand had virtually no effect on size of the crop-trees. Data from this study are useful for validating growthmodels, and for constructing and comparing managed stand yield tables for various commercial thinningregimes.
iii
ACKNOWLEDGEMENTS
The study on which this report is based was initiated by Christian Joergensen, and subsequentlyremeasured and maintained by several individuals, in particular the late K. Bradley, of the Research Branch.The fall 1986 plot remeasurement was funded by the direct delivery component of the Canada/BritishColumbia Forest Resource Development Agreement 1985-1990. I thank I.R. Cameron and D. Geils forcomputerizing and reformatting the original data, K.R. Polsson for conducting the data summaries; J. Barker(Western Forest Products Ltd.), K. Iles (MacMillan Bloedel Ltd.), W. Johnstone, K. Mitchell, D. Reukema(USDA Forest Service), J.H.G. Smith (UBC), T. Wright (Consulting Forester, Vancouver), and G. Weetman(UBC) for reviewing the draft manuscript; G. Montgomery for doing the editorial review; and L. Gronmyr fordoing the word processing.
iv
TABLE OF CONTENTS
ABSTRACT . . . . . . . . . . . . . . . . . . . . . . . . . . . . . . . . . . . . . . . . . . . . . . . . . . . . . . . . . . . . . . . . . . . . iii
ACKNOWLEDGEMENTS . . . . . . . . . . . . . . . . . . . . . . . . . . . . . . . . . . . . . . . . . . . . . . . . . . . . . . . . . . iv
INTRODUCTION . . . . . . . . . . . . . . . . . . . . . . . . . . . . . . . . . . . . . . . . . . . . . . . . . . . . . . . . . . . . . . . . 1
METHODOLOGY . . . . . . . . . . . . . . . . . . . . . . . . . . . . . . . . . . . . . . . . . . . . . . . . . . . . . . . . . . . . . . . . 2
Study Area . . . . . . . . . . . . . . . . . . . . . . . . . . . . . . . . . . . . . . . . . . . . . . . . . . . . . . . . . . . . . . . . . . . . . 2Study Design and Treatments . . . . . . . . . . . . . . . . . . . . . . . . . . . . . . . . . . . . . . . . . . . . . . . . . . . . . . . 2Analysis . . . . . . . . . . . . . . . . . . . . . . . . . . . . . . . . . . . . . . . . . . . . . . . . . . . . . . . . . . . . . . . . . . . . . . . 5
Mortality . . . . . . . . . . . . . . . . . . . . . . . . . . . . . . . . . . . . . . . . . . . . . . . . . . . . . . . . . . . . . . . . . . . . 5Growth and Yield . . . . . . . . . . . . . . . . . . . . . . . . . . . . . . . . . . . . . . . . . . . . . . . . . . . . . . . . . . . . . 5
RESULTS AND DISCUSSION . . . . . . . . . . . . . . . . . . . . . . . . . . . . . . . . . . . . . . . . . . . . . . . . . . . . . . 7
Mortality . . . . . . . . . . . . . . . . . . . . . . . . . . . . . . . . . . . . . . . . . . . . . . . . . . . . . . . . . . . . . . . . . . . . . . . 7Growth and Yield . . . . . . . . . . . . . . . . . . . . . . . . . . . . . . . . . . . . . . . . . . . . . . . . . . . . . . . . . . . . . . . . 7
Height . . . . . . . . . . . . . . . . . . . . . . . . . . . . . . . . . . . . . . . . . . . . . . . . . . . . . . . . . . . . . . . . . . . . . 7Diameter . . . . . . . . . . . . . . . . . . . . . . . . . . . . . . . . . . . . . . . . . . . . . . . . . . . . . . . . . . . . . . . . . . . 7Basal area . . . . . . . . . . . . . . . . . . . . . . . . . . . . . . . . . . . . . . . . . . . . . . . . . . . . . . . . . . . . . . . . . . 7Total volume . . . . . . . . . . . . . . . . . . . . . . . . . . . . . . . . . . . . . . . . . . . . . . . . . . . . . . . . . . . . . . . . . 13Merchantable volume . . . . . . . . . . . . . . . . . . . . . . . . . . . . . . . . . . . . . . . . . . . . . . . . . . . . . . . . . . 13
CONCLUSIONS . . . . . . . . . . . . . . . . . . . . . . . . . . . . . . . . . . . . . . . . . . . . . . . . . . . . . . . . . . . . . . . . . 14
REFERENCES . . . . . . . . . . . . . . . . . . . . . . . . . . . . . . . . . . . . . . . . . . . . . . . . . . . . . . . . . . . . . . . . . . 15
v
TABLES
1 Pre-treatment stand attributes . . . . . . . . . . . . . . . . . . . . . . . . . . . . . . . . . . . . . . . . . . . . . . . . . . . 4
2 EP 364 plot remeasurement and treatment schedule . . . . . . . . . . . . . . . . . . . . . . . . . . . . . . . . . 4
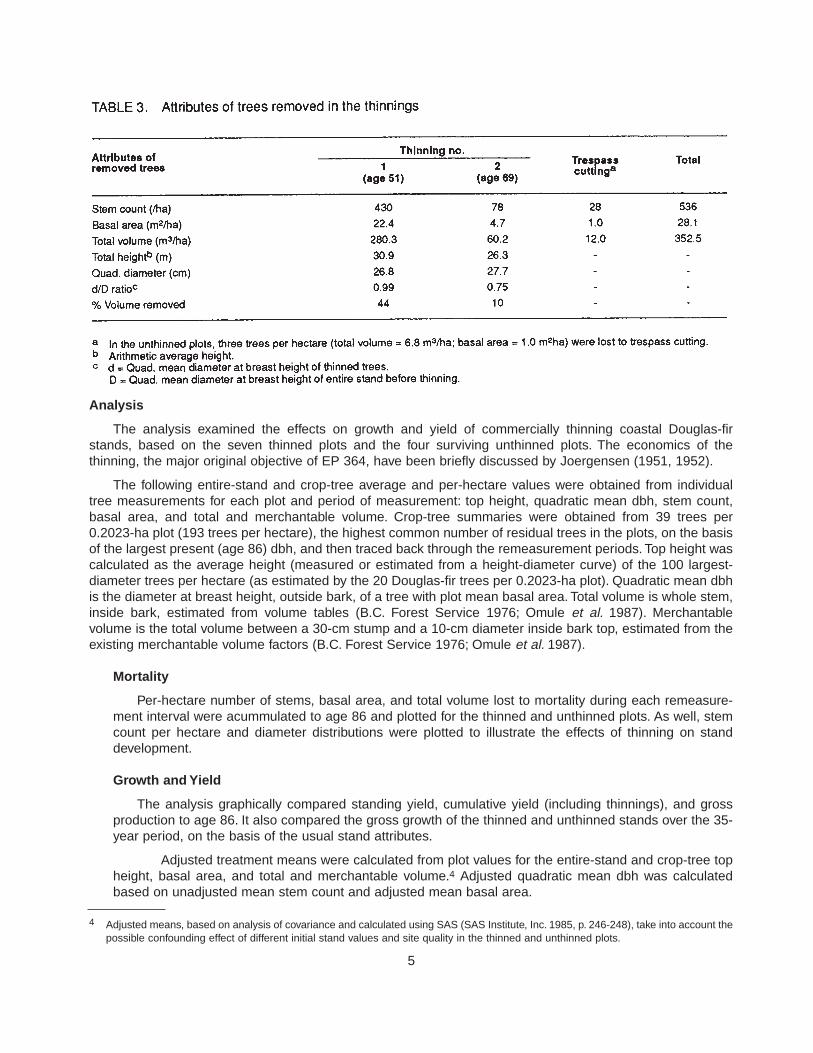
3 Attributes of trees removed in the thinnings . . . . . . . . . . . . . . . . . . . . . . . . . . . . . . . . . . . . . . . . . 5
4 A summary of attributes of standing trees at ages 51 and 86 . . . . . . . . . . . . . . . . . . . . . . . . . . . 8
FIGURES
1 EP 364 study area and plot layout . . . . . . . . . . . . . . . . . . . . . . . . . . . . . . . . . . . . . . . . . . . . . . . . 3
2 Stem count development of thinned and unthinned stands . . . . . . . . . . . . . . . . . . . . . . . . . . . . . 8
3 Diameter distribution of mortality in the age 62-69 period . . . . . . . . . . . . . . . . . . . . . . . . . . . . . . 8
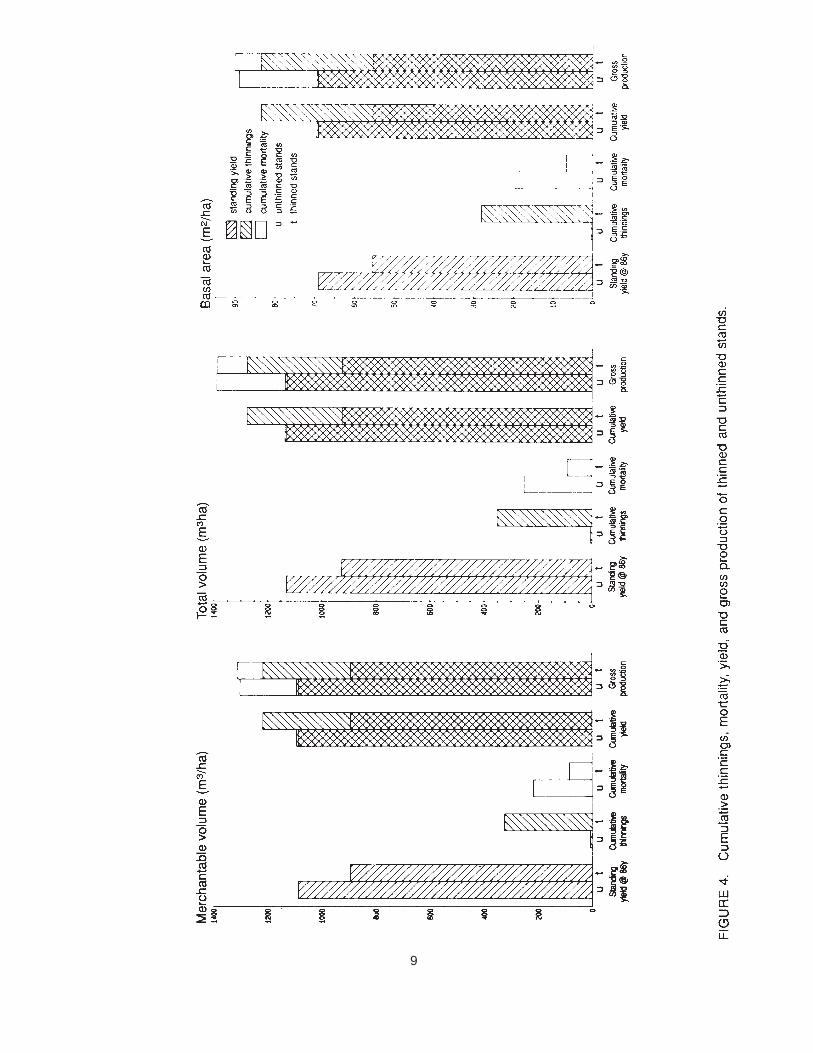
4 Cumulative thinnings, mortality, yield, and gross production of thinned and unthinned stands . . . . 9
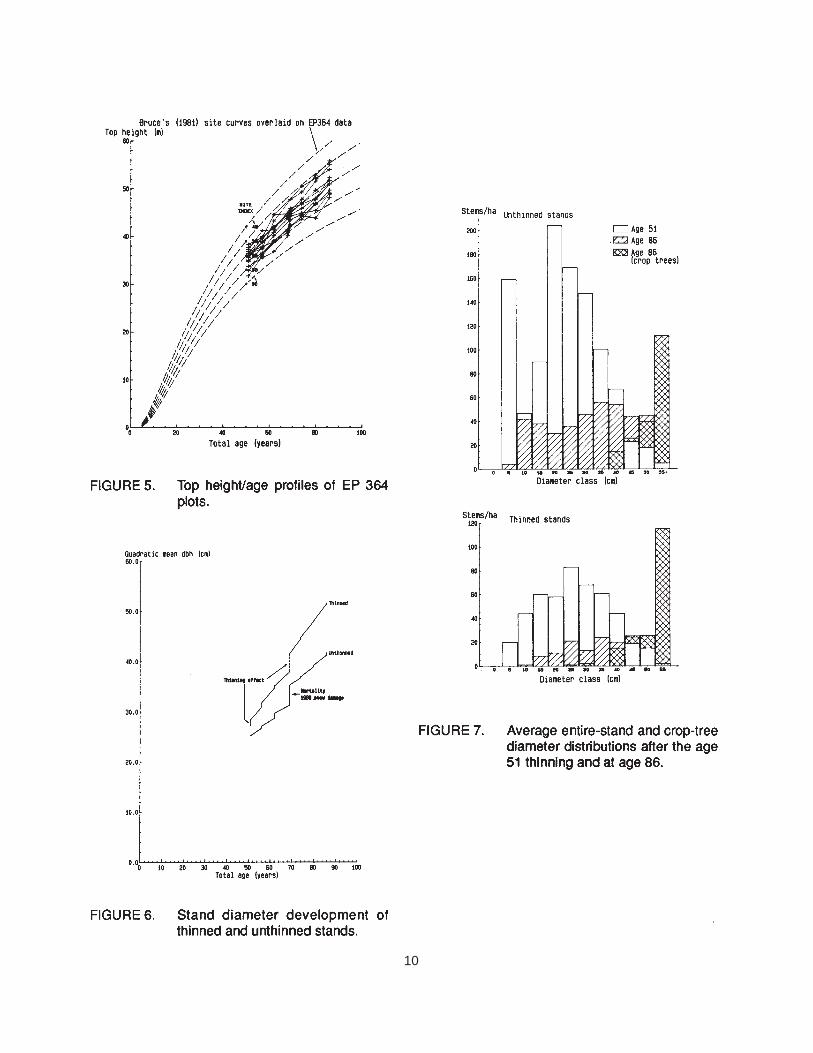
5 Top height/age profiles of EP 364 plots . . . . . . . . . . . . . . . . . . . . . . . . . . . . . . . . . . . . . . . . . . . . 10
6 Stand diameter development of thinned and unthinned stands . . . . . . . . . . . . . . . . . . . . . . . . . . 10
7 Average entire-stand and crop-tree diameter distributions after the age 51 thinning and at the age 86 10
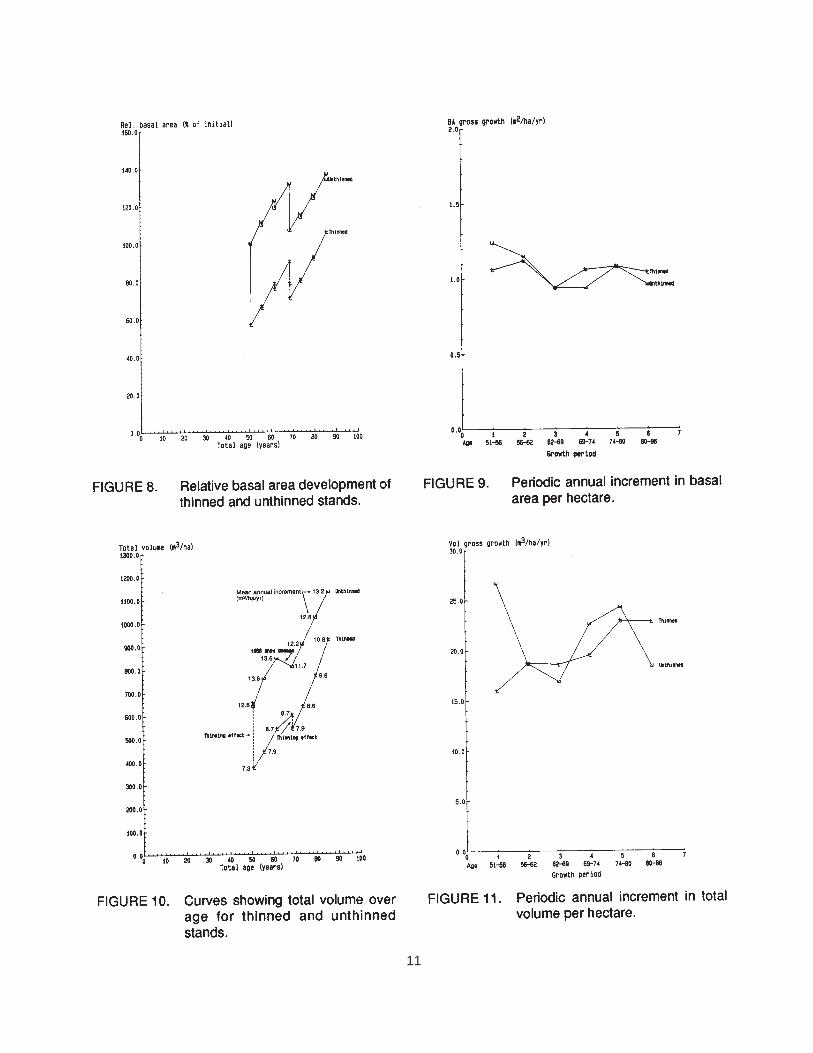
8 Relative basal area stand development of thinned and unthinned stands . . . . . . . . . . . . . . . . . . . 11
9 Periodic annual increment in basal area per hectare . . . . . . . . . . . . . . . . . . . . . . . . . . . . . . . . . . 11
10 Curves showing total volume over age for thinned and unthinned stands . . . . . . . . . . . . . . . . . . . 11
11 Periodic annual increment in total volume per hectare . . . . . . . . . . . . . . . . . . . . . . . . . . . . . . . . . 11
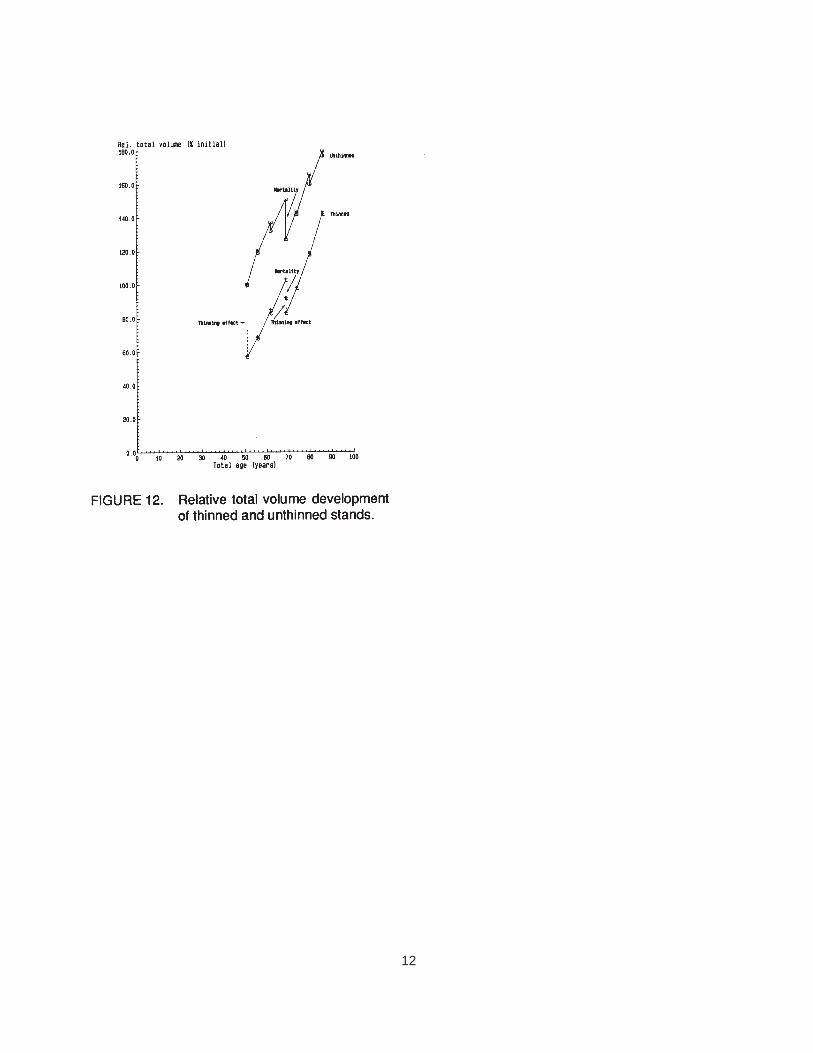
12 Relative total volume development of thinned and unthinned stands . . . . . . . . . . . . . . . . . . . . . . . 12
vi
INTRODUCTION
Commercial thinning can increase value and net revenue from forests by making some wood availableearly, and by producing larger trees at rotation. Thinning can also increase employment and overcome somewood supply problems. The potential magnitude of these benefits varies with the thinning regimes adopted,prevailing market conditions, and stand history. Although rarely practised in the past in British Columbia(mainly because of the abundance of old-growth forests and a lack of suitable second-growth stands),commercial thinning has recently become of great interest to forest managers, particularly in the 1940’splantations of coastal Douglas-fir.
Several studies of commercial thinning have been published in the Pacific Northwest (Worthington andStaebler 1961; Williamson 1966; Worthington 1966; Williamson and Price 1971; Reukema 1972; andReukema and Pienaar 1973). There are also some informal reports of commercial thinning studies in coastalDouglas-fir in British Columbia.1,2
This report documents growth and yield following a moderate, double-entry commercial thinning in a 50-year-old coastal Douglas-fir (Pseudotsuga menziesii [Mirb.] Franco) stand on a good site in the CWHa2variant (Klinka et\al. 1984) on Vancouver Island, B.C. It is based on 35-year remeasurements andobservations from B.C. Ministry of Forests and Lands Research Branch Experimental Project (EP) 364, theonly well-designed and consistently remeasured and maintained long-term study of its kind in coastal BritishColumbia.
1 Wright, T.G. 1986. Report on commercial thinning in a Douglas-fir stand. Unpubl. report on Tree Farm No. 1, Type 7. 2908 West 49thAvenue, Vancouver, B.C. 12 p.
2 Reid, D. and B. English. 1977. Comparison between thinned and unthinned stands 53 years old, 20 years after commercial thinningand pruning. Unpubl. rep. on Project 22-06-05, British Columbia Forest Products Ltd., Vancouver, B.C. 42 p. + Appendices.
METHODOLOGY
Study Area
Experimental Project 364 was established in 1950 in a Douglas-fir stand of age 50 years by the B.C.Forest Service. It is roughly 10 km from Cowichan Lake village on the east coast of Vancouver Island. Thestudy was to determine growth response and potential utilization and profit from thinning immature Douglas-firstands.3 The study area was 20 ha of a fairly uniform, well-stocked 50-year-old stand of 90% Douglas-fir (byvolume) and 10% western hemlock (Tsuga heterophylla [Ref.] Sarg.), western redcedar (Thuja plicata Donn.),and some hardwoods. The stand originated from natural regeneration following clearfelling of old growth in1891, making it one of the oldest second-growth stands in the province. The ground is level and the soil typeis a well-drained deep sandy loam. The Douglas-fir site index is estimated to range from 36 to 43 m (average40 m) at 50 years breast-height age, based on Bruce’s (1981) site curves. For further details on thecharacteristics of the study area, see Joergensen (1952, p. 1-2).
The climate near the study area is characterized by warm summers and mild winters. The annualprecipitation is about 2123 mm (7% falls as snow), and the daily temperature average 9.1 C (with a minimumof - 1.5 C and a maximum of 24.1 C).
Study Design and Treatments
The original design consisted of seven thinned plots, and seven unthinned (control) plots. Three of thecontrol plots, which are not included in this report, were clearfelled about 20 years after establishment.
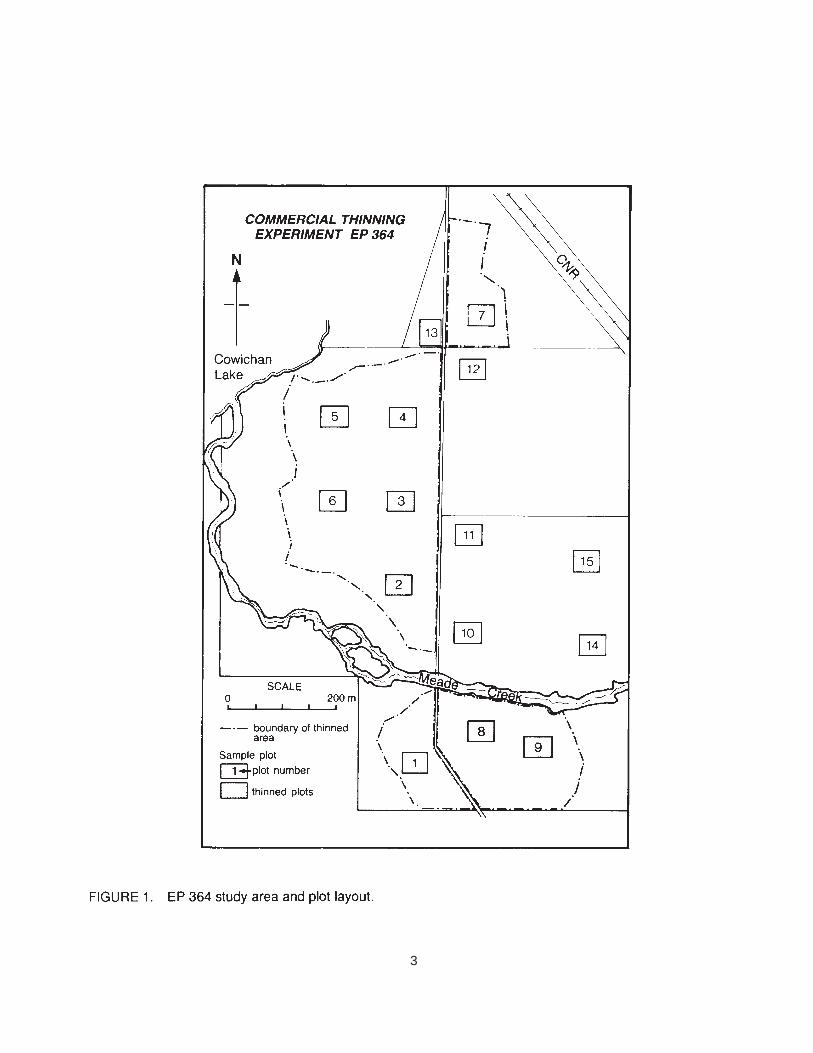
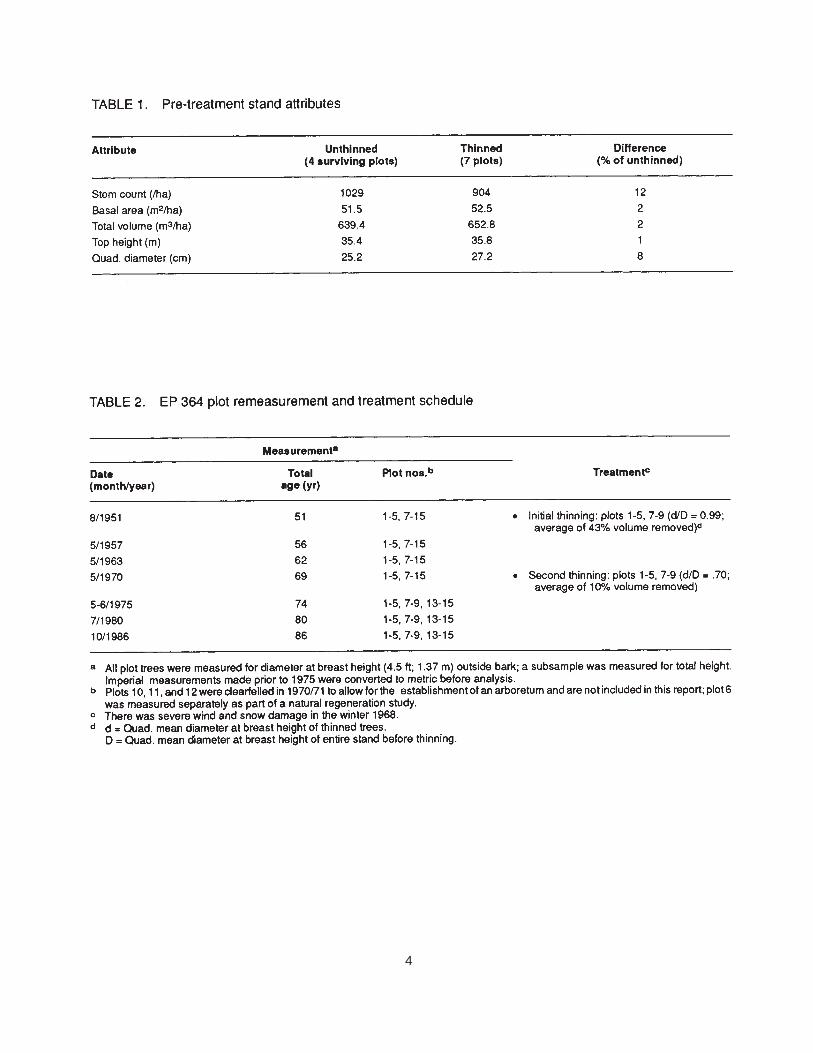
To set up a practical commercial thinning operation, three separate blocks of areas 32.3, 5.3, and 12.3acres (13.1, 2.1, 5.0 ha, respectively) were selected for thinning within the study site. Seven 0.5-acre (0.2023-ha) rectangular plots were established within these blocks. Also, seven plots of the same dimension andshape were established in similar, adjacent unthinned portions of the study stands (Figure 1). In general therewas little variation in initial (before first thinning) stand characteristics between the stand designated forthinning and the unthinned stand, although the thinned stand averaged slightly fewer but larger stems, and 2%more basal area than the unthinned stand (Table 1). The average height to the lowest live branch was 26-36%of total height.
Layout of plots, marking of trees to be thinned, layout of roads and landings, and cruising of timber for salewere done in autumn 1950. Logging by horses was started in February 1951 and continued until February thefollowing year. The thinned trees, bucked into 18-ft (5.5-m) logs, were all sold as sawlogs of unknown valueand top diameter. The total volume extracted from the three blocks was about 134 200 ft3 (3800 m3). The aver-age cost of logging was about $5.15/m3 (at a rate of $2.00/hour). Logging damage was minimal, with stemscars about 1 ft2 (.09 m2) or less in area.
Thinnings were made at ages 51 and 69; the plots were measured at 5- to 7-year intervals between ages51 and 86, including before each thinning (Table 2). The first thinning was moderately heavy and neutral, withd/D = 0.99. It removed an average of 44% of the original volume (Table 3). The thinning, although done in1951, is still typical of commercial thinnings in British Columbia. It was done too late in the life of the stand toeffect any growth response. The second thinning was light and low, with d/D = 0.75, and removed an averageof 10% of the standing volume (Table 3). During the 35-year period, a total of 28 trees per hectare have beenlost in the thinned plots and 3 in the unthinned plots through trespass cutting for road and recreation siteaccess.
3 Joergensen, C. 1951. Commercial thinning - North Arm Forest. Working Plan, EP 364. B.C. Ministry Forests and Lands, Res. BranchFile EP 364.
2
3
4
Anal ysis
The analysis examined the effects on growth and yield of commercially thinning coastal Douglas-firstands, based on the seven thinned plots and the four surviving unthinned plots. The economics of thethinning, the major original objective of EP 364, have been briefly discussed by Joergensen (1951, 1952).
The following entire-stand and crop-tree average and per-hectare values were obtained from individualtree measurements for each plot and period of measurement: top height, quadratic mean dbh, stem count,basal area, and total and merchantable volume. Crop-tree summaries were obtained from 39 trees per0.2023-ha plot (193 trees per hectare), the highest common number of residual trees in the plots, on the basisof the largest present (age 86) dbh, and then traced back through the remeasurement periods. Top height wascalculated as the average height (measured or estimated from a height-diameter curve) of the 100 largest-diameter trees per hectare (as estimated by the 20 Douglas-fir trees per 0.2023-ha plot). Quadratic mean dbhis the diameter at breast height, outside bark, of a tree with plot mean basal area. Total volume is whole stem,inside bark, estimated from volume tables (B.C. Forest Service 1976; Omule et al. 1987). Merchantablevolume is the total volume between a 30-cm stump and a 10-cm diameter inside bark top, estimated from theexisting merchantable volume factors (B.C. Forest Service 1976; Omule et al. 1987).
Mor tality
Per-hectare number of stems, basal area, and total volume lost to mortality during each remeasure-ment interval were acummulated to age 86 and plotted for the thinned and unthinned plots. As well, stemcount per hectare and diameter distributions were plotted to illustrate the effects of thinning on standdevelopment.
Growth and Yield
The analysis graphically compared standing yield, cumulative yield (including thinnings), and grossproduction to age 86. It also compared the gross growth of the thinned and unthinned stands over the 35-year period, on the basis of the usual stand attributes.
Adjusted treatment means were calculated from plot values for the entire-stand and crop-tree topheight, basal area, and total and merchantable volume.4 Adjusted quadratic mean dbh was calculatedbased on unadjusted mean stem count and adjusted mean basal area.
4 Adjusted means, based on analysis of covariance and calculated using SAS (SAS Institute, Inc. 1985, p. 246-248), take into account thepossible confounding effect of different initial stand values and site quality in the thinned and unthinned plots.
5
Standing yield (= adjusted means of live trees at age 86), cumulative yield (= standing yield +cumulative thinnings), and gross production (= cumulative yield + cumulative mortality over the 35-yearperiod) were calculated in terms of basal area per hectare and total and merchantable volumes perhectare, and plotted for the thinned and unthinned stands.
Gross annual growth in quadratic mean dbh, top height, basal area, and total and merchantablevolume was calculated by dividing the difference between the attribute’s adjusted mean for standing treesat beginning of a growth period and the attribute’s adjusted mean for all trees at end of the period, by thenumber of growing seasons in the growth period. These values were plotted for thinned and unthinnedstands by measurement interval.
6
RESULTS AND DISCUSSION
Mor tality
Generally, mortality in the thinned stands was much less than that in the unthinned. Over the 35-yearperiod, the unthinned stands lost 519 trees per hectare (a total volume loss of 253 m3/ha or 18% of grossproduction), whereas the thinned stands lost only 103 trees per hectare (91 m3/ha, or 7% of gross production).That is, the total volume lost to mortality in the thinned stands was about 36% of the volume lost in theunthinned, suggesting that thinning salvaged impending mortality.
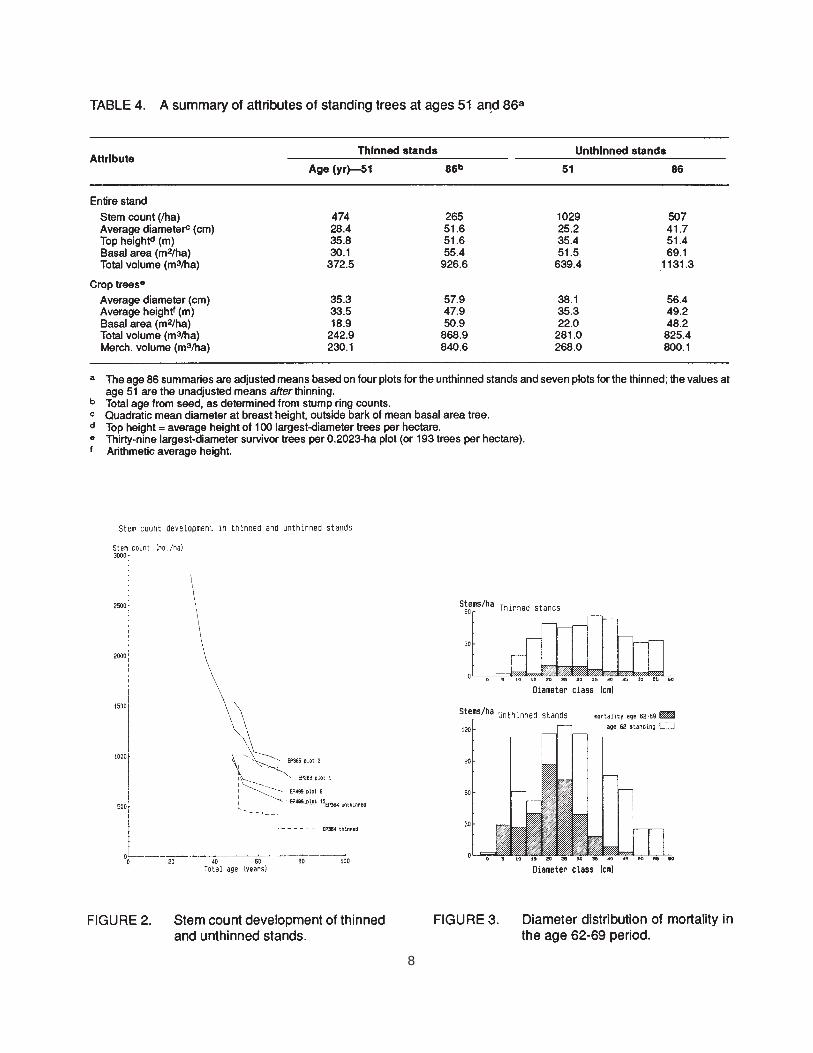
These results may be confounded by the substantial mortality from the 1968 snow damage, in which manymore trees were lost in the unthinned than in the thinned stands. Compared to that of some unthinnedDouglas-fir stands on Vancouver Island,5 however, the development of the unthinned stands in this reportappears to be progressing normally (Figure 2).
Tree mortality, especially in the period age 62-69 (in which snow damage occurred), was mainly confinedto the smaller diameter trees, with only the occasional larger diameter trees being lost (due largely to root rotwhich was prevalent in the study area) (Figure 3).
Growth and Yield
The effects of commercial thinning on stand growth and yield are briefly discussed below. Readersinterested primarily in the yield summaries can proceed directly to Table 4 and Figure 4.
Height
Top height was not affected by the commercial thinning. The adjusted average top height at age 86 inthe thinned and unthinned stands was 51.6 m and 51.4 m, respectively. Over the 35-year period, topheight growth was about the same in both types of stand — about 0.45 m/yr. The top height/age profilesfrom all the 14 study plots were similar in shape to those defined by Bruce’s (1981) site curves (Figure 5).
Diameter
Attained stand diameter was higher in the thinned than in the unthinned stands. At age 86 theadjusted entire-stand quadratic mean dbh in the thinned and unthinned stands was 51.6 and 41.7 cm,respectively. However, the adjusted crop-tree quadratic mean dbh was virtually the same in the thinnedand in the unthinned stands — 57.9 and 56.4 cm, respectively. Over the 35-year period, and excluding the3.8-cm arithmetic increase due to trees cut in the thinnings (Figure 6), quadratic mean dbh in the thinnedstands increased by about 25% more than in the unthinned (20.6 cm versus 16.5 cm). This 4.1-cmdifference represents a combination of the actual growth of comparable trees in the thinned relative to theunthinned stand, slower growth on the many more small trees present in the unthinned stand (Figure 7),and the arithmetic increase due to loss of smaller-than-average trees to mortality.6 Crop-tree quadraticmean dbh increased by 22.6 cm and 18.3 cm in the thinned and unthinned stands, respectively, over thesame period.
Basal area
Thinnings reduced residual basal area to a minimum of 58% of that in the unthinned stand (Figure 8).Gross annual growth in the 6-year period immediately after the initial thinning was 15% lower in the thinnedthan in the unthinned stands. Since that time, however, gross growth has been about the same in both typesof stand, even if the thinned stands have lower levels of growing stock (Figure 9.)
5 Based on data from permanent plots of Research Branch EP’s 283 (Schenstrom plot), 365, and 499, which are on file at B.C. Ministry ofForests and Lands, Research Branch, Victoria, B.C.
6 D.L. Reukema. Personal communication. 1987. Review comments on earlier draft of this report.
7
8
9
10
11
12
The adjusted basal area of standing trees at age 86, plus cumulative thinnings, was 83.5 and 69.5 m2/ha in the thinned and unthinned stands, respectively. That is, the thinned stand produced about 14.0 m2/ha (20%) more cumulative basal area yield to age 86 than did a comparable unthinned stand. Thisdifference might be slightly exaggerated because of excessive irregular mortality in the unthinned plotsduring the 1968 snow damage. (It was not possible to separate regular and irregular mortality.)
At a final-harvest age of 86 years, the adjusted basal area available in the unthinned stands washigher than in the thinned stands by 13.7 m2/ha (20%) . The unthinned stands had a basal area of 69.1 m2/ha at age 86. Gross production was only about 1% higher in the thinned than in the unthinned stands —about 90.2 and 89.1 m2/ha, respectively (Figure 4). Thus, as expected, commercial thinning has providedan earlier harvest of part of the stand and recovered impending mortality, but reduced final harvest basalarea.
Total v olume
Total volume mean annual increment is lower in the thinned stand than in the unthinned, but neiterstand has reached a maximum mean annual increment (Figure 10).
Gross annual growth in the 6-year period immediately after the initial thinning was abut 40% lower inthe thinned than in the unthinned stands. Since that time, however, the growth has been about the samein both types of stand (Figure 11), even if the thinned stand has lower levels of growing stock (Figure 12).
The adjusted total volume of standing trees at age 86, plus cumulative thinnings, was 1279.1 and1138.1 m3/ha in the thinned and unthinned stands, respectively. That is, the thinned stands produced141.0 m3/ha or 12% more cumulative total volume yield to age 86 than did comparable unthinned stands.
The adjusted total volume available for harvest at age 86 was higher in the unthinned than in thethinned stands by 204.7 m3/ha (18%). The total volume available for harvest in the unthinned stands atage 86 was 1131.3 m3/ha. Based on crop trees, however, the total volume available for harvest washigher by 5% in the thinned than in the unthinned stands. Gross production to age 86 was less than 1%different in the thinned and unthinned stands — 1387.7 and 1390.9 m3/ha, respectively (Figure 4).
Merchantab le volume
The results for merchantable volume, the total volume between a 30-cm high stump and a 10-cmdiameter inside bark top, were virtually the same as those for total volume. The adjusted merchantablevolume of standing trees (including cumulative thinnings) at age 86, was 1218.7 and 1094.3 m3/ha inthinned and unthinned stands, respectively. That is, the thinned stand produced 124.4 m3/ha or 11%more cumulative merchantable volume yield to age 86 than the unthinned stand. The adjustedmerchantable volume available for harvest at age 86 was 17.8% higher (194.0 m3/ha) in the unthinnedthan in the thinned stand. The unthinned merchantable volume at harvest was 1087.8 m3/ha, 92% ofwhich resided in trees with dbh greater than or equal to 42.5 cm (compared to 97% for the thinned stands).Note that the merchantable volume results may change depending on how “merchantable volume” isdefined in terms of the stump height and top diameter limits.
13
CONCLUSIONS
For the range of site, stand, and treatment conditions in this study, the results indicate that:
- The thinned and unthinned stands had virtually the same total volume gross annual growth.
- The thinned stands produced 12% more potentially usuable cumulative total volume yield (includingthinnings) to age 86 than did the unthinned stands.
- At a rotation age of 86 years, the unthinned stands had 18% more total volume available for final harvestthan did the thinned stands.
- Crop-tree diameter was about the same in the thinned and unthinned stands at age 86; however, theentire-stand diameter was 24% larger in the thinned than in the unthinned stands.
- Top height and top height growth were about the same in the thinned and unthinned stands.
- The top height/age profiles of the stands studied were similar in shape to Bruce’s (1981) site curves.
- There were no important differences in gross production between the thinned and unthinned stands.
- The gross production (total volume) lost to mortality was 7% in the thinned stands, and 18% in theunthinned stands.
This study supports previous research which shows that commercial thinning of coastal Douglas-firresults in: marginally more cumulative volume yield over the rotation; and fewer and larger trees at finalharvest, but also lower total volume (Worthington and Staebler 1961; Reukema and Pienaar 1973; Reukemaand Bruce 1977). The importance of these effects, and whether to thin or not, will depend upon several otherfactors, such as the economics of the commercial thinning (frequency, grade and timing) and stand history andconditions, as well as the need to create employment and alleviate local timber supply problems. The growthand yield data collected and the actual growth response values obtained to date are useful for validating growthmodels such as TASS (Mitchell 1975), and for constructing and comparing managed stand yield tables forvarious commercial thinning regimes.
14
REFERENCES
B.C. Forest Service. 1976. Whole stem cubic meter volume equations and tables. Centimeter diameter classmerchantable volume factors. B.C. Min. For. Lands, Victoria, B.C.
Bruce, D. 1981. Consistent height-growth and growth-rate estimates from remeasured plots. For. Sci. 27(4):711-725.
Joergensen, C. 1951. Experimental thinning operations on a commercial scale. For Chron. 27(1): 64-72.
. 1952. A commercial thinning experiment in Douglas-fir. B.C. For. Serv. Res. Note No. 22.
Klinka, K, R.N. Green, P.J. Courtin, and F.E. Nuszdorfer. 1984. Site diagnosis, tree species selection, andslashburning guidelines for the Vancouver Forest Region. B.C. Min. For. Lands, Land Manage. Rep.No. 25.
Mitchell, K.J. 1975. Dynamics and simulated yield of Douglas-fir. For. Sci. Monogr. No. 17.
Omule, S.A.Y., V.E. Fletcher, and K.R. Polsson. [1987]. Total and merchantable volume equations for smallcoastal Douglas-fir. B.C. Min. For. Lands - FRDA Rep. In press.
Reukema, D.L. 1972. Twenty-one-year development of Douglas-fir stands repeatedly thinned at varyingintervals. U.S. Dep. Agric. For. Serv., Pac. NW For. Range Exp. Stn., Res. Pap. PNW-141.
Reukema, D.L. and D. Bruce. 1977. Effects of thinning on yield of Douglas-fir: concepts and some estimatesobtained by simulation. U.S. Dep. Agric. For. Serv., Pac. NW For. Range Exp. Stn., Gen Tech. Rep.PNW-58.
Reukema, D.L. and L.V. Pienaar. 1973. Yield with and without repeated commercial thinnings in a high-sitequality Douglas-fir stand. U.S. Dep. Agric. For. Serv., Pac. NW For. Range Exp. Stn., Res. Pap.PNW-155.
SAS Institute Inc. 1985. SAS/STAT guide for personal computers, version 6 Edition. SAS Institute Inc., Box8000, Cavy, North Carolina 27511-8000, USA.
Williamson, R.L. 1966. Thinning response in 110-year-old Douglas-fir. U.S. Dep. Agric. For. Serv., Pac. NWFor. Range Exp. Stn., Res. Note PNW-36.
Williamson, R.L. and F.E. Price. 1971. Initial thinning effects in a 70- to 150-year-old Douglas-fir westernOregon and Washington. U.S. Dep. Agric. For. Serv., Pac. NW For. Range Exp. Stn., Res. Pap.PNW-117.
Worthington, N.P. 1966. Response to thinning 60-year-old Douglas-fir. U.S. Dep. Agric. For. Serv., Pac. NWFor. Range Exp. Stn., Res. Note PNW-35.
Worthington, N.P. and G.R. Staebler. 1961. Commercial thinning of Douglas-fir in the Pacific Northwest. U.S.Dep. Agric. For. Serv., Pac. NW For. Range Exp. Stn., Tech. Bull. No. 1230.
15