Embed Size (px)
Citation preview
Journal of Agricultural Science; Vol. 10, No. 10; 2018 ISSN 1916-9752 E-ISSN 1916-9760
Published by Canadian Center of Science and Education
122
Growth of Sugar Cane Under Cultivation Flooded at Different Speeds Lowering of the Water Table
Antonio Clarette Santiago Tavares1, Sergio Nascimento Duarte2, Nildo da Silva Dias3, Francisco Vanies da Silva Sá3, Jarbas Honorio de Miranda2, Kelly Tagianne Santos de Souza4,
Maria Alejandra Moreno Pizani2, Osvaldo Nogueira de Sousa Neto5 & Cleyton dos Santos Fernandes3 1 Federal Institute of Northern Minas Gerais, Almenara, MG, Brazil 2 Department of Biosystems Engineering, Luiz de Queiroz College of Agriculture, University of Sao Paulo, Piracicaba, SP, Brazil 3 Center of Agrarian Sciences, Univerdidade Federal Rural do Semi-Árido, Mossoró, RN, Brazil 4 Department of Agrarian Sciences, Federal University of Roraima, Boa Vista, RR, Brazil 5 Department of Exact, Technological and Human Sciences, Federal Rural University of the Semi-Arid, Angicos, RN, Brazil
Correspondence: Francisco Vanies da Silva Sá, Center of Agrarian Sciences, Federal Rural University of Semi-Arid, Mossoró, RN, Brazil. Tel: 55-083-998-619-267. E-mail: [email protected]
Received: June 17, 2018 Accepted: July 31, 2018 Online Published: September 15, 2018
doi:10.5539/jas.v10n10p122 URL: https://doi.org/10.5539/jas.v10n10p122
Abstract In order to study the effect of downgrade rate of water table in the growth of sugar cane (Saccharum spp, cultivate 867515), an experiment in was carried under randomized block design with factorial arrangement (3 × 5 + 1) and 4 replications, applying the flood irrigation system in 3 stages of development (67, 210 and 300 days after planting - DAP) with 5 downgrade rate of water table (3, 6, 9, 12 and 15 days) and the control (no flood). The plants were grown in soil columns of 240 liters, filled with Yellow Oxisol by 300 days after planting and monitored as the height of the stem, number of leaves, stem diameter, number of internodes, number of tillers, leaf area, growth increment, rate relative growth, leaf area index, leaf area ratio and specific leaf area. The stages of development that the flooding was applied at a rate of lowering of the groundwater level variables influenced the growth of cane sugar. The plants drenched at 210 days after planting for 12 days had higher growth of stem, leaf number, leaf area and leaf area index. Plants exposed to water logging after 67 and 210 days after planting obtain better physiological indices that the witness and those who received the 305 DAP waterlogging. It is recommended that the spacing between drains is estimated to be able to lower the water table, after a reloading project to 30 cm deep in 15 days.
Keywords: drainage, physiological indices, waterlogging
1. Introduction Sugarcane (Saccharum spp.) is a species of great economic importance in the world. In Brazil, the area cultivated with the species has increased every year, because of its use in the production of ethanol and refined sugar, with high economic value (Vale et al., 2011; Galon et al., 2012; Holanda et al., 2014; Ferraz et al., 2015).
To maximize the production of the crop, it is necessary to install irrigation or drainage systems. In the main regions of sugarcane cultivation in Brazil, drainage systems have become increasingly more frequent to remedy the deficiency in the natural drainage of the soil, allowing the profitable cultivation of sugarcane with sustainability, being mainly implemented in the states of São Paulo, Minas Gerais, Mato Grosso do Sul and Goiás, and in the ‘Zona da Mata’ of the Northeastern region.
Most drainage systems are projected based on the practical experience of the designer, without rational technical criteria. The necessity of artificial drainage and its dimensioning depend on the physical-hydraulic and geometric properties of the soil profile. Thus, the adoption of an empirical procedure is the main cause of failure in sugarcane cultivation in these areas with deficiency of drainage (Mingoti et al., 2006).
jas.ccsenet.org Journal of Agricultural Science Vol. 10, No. 10; 2018
123
Gava et al. (2011) report that the growth and development of sugarcane plants are affected by both the lack and excess of water supply. Soil variability makes it difficult the adoption of representative values for the physical-hydraulic and geometric properties of the soil profile. However, this problem can be overcome with a more detailed investigation at field (Messchmidt et al., 2015; Tavares et al., 2015).
Most studies have so far evaluated the effects of deficiency or temporary absence of oxygen in the soil, without the simultaneous verification of factors that may interfere with the capacity of the plants to tolerate anoxic stress. Thus, this study aimed to evaluate sugarcane growth in flooded cultivation at different speeds of water table lowering, in three development stages of the plant-cane cycle.
2. Material and Methods The experiment was carried out in a greenhouse of the Department of Biosystems Engineering of the “Luiz de Queiroz” College of Agriculture-USP, in the municipality of Piracicaba-SP, Brazil (22°42′ of latitude S; 47°38′ of longitude W and altitude of 540 m) in October of 2007 to October of 2008. According to Köppen’s classification, the climate of the region is Cwa, i.e., humid tropical, with 3 drier months (June, July and August), rainfalls in the summer and droughts in the winter, with mean temperature of the hottest month higher than 22 ºC and coldest month lower than 18 ºC.
The study consisted in determining the production and maturation of sugarcane (Saccharum spp., cultivar RB 867515) under flooded cultivation and subsequently lowering the water table by 0.3 m at the speeds of 3, 6, 9, 12 and 15 days (V1, V2, V3, V4 and V5, respectively). In addition, there was a treatment with conventional irrigation, without flooding, to obtain values of plants not subjected to the stress (T1 = control).
The statistical design was randomized blocks, arranged in a [(3 × 5) + 1] × 4 factorial scheme, i.e., 3 development stages in which the flooding was applied, 5 speeds of water table lowering and a control (without irrigation but without stress by the excess of moisture), forming 16 treatments with 4 replicates, totaling 64 plots.
The flooding depth was initially maintained above the soil surface at approximately 2 cm for 12 hours and, after this interval, the progressive lowering continued until the total drainage of the lysimeter. The moment of flooding was determined by the development stages of the crop, which were: a) initial development stage (P1)—at 67 days after planting (DAP); b) stage of slow development of the radicle system (P2)—at 210 DAP-P2
and c) stage in which the sugarcane has an accelerated development of its root system (P3), i.e., close to harvest, when the stress can influence the qualitative value of the production—at 300 DAP-P3. Thus, the following combinations were obtained: T1, P1V1, P1V2, P1V3, P1V4, P1V5, T2, P2V1, P2V2, P2V3, P2V4, P2V5, T3, P3V1, P3V2, P3V3, P3V4 and P3V5.
The sugarcane was cultivated in 64 lysimeters, which consisted of large waterproof concrete pipes, with height of 1.2 m, diameter of 0.5 m, planted area of 0.20 m2 and useful volume of 240 L, installed in the experimental area. The containers were positioned in 4 rows of 16 pipes and each one of these containers represented one experimental plot.
Water was supplied to the lysimeters through two asbestos cement tanks, with capacity for 1000 L each, equipped with a float switch and placed on a wooden platform (2.5 m long, 1.6 m wide and 1.6 m high), located inside the greenhouse.
For water inlet and drainage, the lysimeters were perforated close to the bottom, where 19-mm-diameter PVC pipes were inserted, sealed with epoxy resin and gutter sealant. The pipes were 0.60 m long, with 5-mm-diameter holes in its perimeter, spaced by 0.05 m. A synthetic geotextile (Bidim OP-20) and a 0.10-m-thick layer of washed crushed stone were used to facilitate drainage and avoid the carrying of soil.
The pipes had an entry for water at the bottom part, connected to auxiliary mobile tanks that allowed to maintain the water table level inside the pipes at the desired depth.
The soil used to fill the lysimeters was collected in a profile of Red Yellow Latosol, with sandy loam texture, at the campus of the ESALQ/USP, called “Série Sertãozinho”, removed from the layer of 0-0.50 m of its natural profile. Soil chemical and physical attributes (Table 1) were determined with the collection of disturbed samples. Soil liming was performed when the lysimeters were filled, by applying 2 Mg ha-1 of dolomitic limestone (40 g per lysimeter), homogenized with the soil in layers from 0.50 m on, from bottom to top, correcting a total soil layer of 0.30 m. After filling the lysimeters, the water table level was raised to soil surface so that it accommodated and the limestone reacted.
jas.ccsenet.org Journal of Agricultural Science Vol. 10, No. 10; 2018
124
Table 1. Granulometric and chemical analyses of the soil used to fill the lysimeters
Sand (%) Silte (%) Clay (%) Real Density (g dm-3)
78 4 18 2.86
pH M.O P S K+ Ca2+ Mg2+ Al3+ H++Al3+ SB T V M
CaCl2 -- g dm-3 -- -- mg dm-3 -- ----------------------------- mmolc dm-3 ----------------------------- ------ % ------
4.2 8 2 20 3.6 7 3 6 20 13.6 33.6 40 31
Chemical fertilization was applied in 3 plots, guaranteeing full vegetative development and yield, using the following doses per hectare: 67 kg of nitrogen, 180 kg of P2O5 and 225 kg of K2O, which corresponded to 10.5, 20 and 10 g per lysimeter, respectively. Phosphate fertilization was applied at planting, using single superphosphate (18% of P2O5). Nitrogen and potassium were applied as top-dressing at 40, 110 and 220 DAP, using potassium nitrate (45% of K2O and 13% of N). At 150 DAP, 5 kg of organic matter was incorporated in each plot, to improve aeration in the superficial soil layer, improving its structure and also promoting the reduction of the superficial soil temperature.
In the initial stage of plant cane, precautions were taken to promote ideal conditions of moisture for the sprouting and rooting of the setts. In the first 20 DAP, daily irrigations were performed using water from the supply system of the Department of Biosystems Engineering of the ESALQ-USP, to maintain the soil with satisfactory moisture. In the period from 20 to 30 DAP, the water table level was maintained at 0.30 m from the surface, through the utilized flooding system, because the root system was still in development, thus preventing the crop from suffering water stress. After 30 DAP, the water table level was lowered to 0.40 m from the surface to stimulate the development of the root system and, at this moment, tensiometers were installed in the plots at depth of 30 cm.
The sugarcane crop was irrigated along its cycle, except in the period in which the flooding treatments were applied, guaranteeing that the obtained differences were caused only by the stress due to excessive moisture (hypoxia). After applying the treatments, the water table level was lowered to 0.80 m from the soil surface and the irrigation of these plants resumed when the reading of the tensiometers installed at depth of 0.30 m in the lysimeters reached the value of 50 kPa.
The utilized irrigation system was subirrigation, using the same flooding system of the lysimeters. The level of the auxiliary tank remained at 0.40 m deep and, when the readings of the tensiometers were above the specified tension, the valves of the tanks were opened and the water table level remained for a period of 24 hours. Thus, the water depth applied in each irrigation was sufficient to increase soil moisture again to close to field capacity (6 kPa), characterized by the soil water retention curve. Irrigation was continuous and maintained until its stop, 45 days before cutting.
The biometric and physiological parameters relative to growth and development of sugarcane plants were monthly evaluated and are described below:
- Stem height: measured from the level of the soil until the top visible dewlap of the +1 leaf, according to the Kuijper system.
- Number of leaves: counted as the number of fully opened leaves (expanded) with at least 20% of green leaf area, from the +1 leaf, according to the leaf identification of the Kuijper system.
- Stem diameter: measured at the base of the stem, in the middle portion of the 3rd internode, using a digital caliper.
- Number of internodes: evaluations consisted only in the count of the number of exposed internodes and the first evaluation occurred 90 days after planting.
- Number of tillers in the plot: all tillers were counted in each plot, along the entire plant-cane cycle, considered as tillers until the moment when the stems had the +3 leaf, i.e., three fully opened leaves (expanded).
- Leaf area (LA): The choice of the leaf to be used in the measurement followed the numbering proposed by Kuijper. The leaf area of each plot was obtained by the sum of the leaf areas of all stems of each plot.
- Growth increment: calculated by measuring the distance from the old +3 leaf (from the previous sampling) until the current +3 leaf, divided by the number of days elapsed between both samplings, Equation 1.
jas.ccsenet.org Journal of Agricultural Science Vol. 10, No. 10; 2018
125
(1)
Where, CGI: crop growth increment (m); Pcur: position of the current +3 leaf (m); Pold: position of the old +3 leaf (m) and Nde: number of days elapsed between the measurements.
- Relative growth rate (RGR) is the growth of a plant or any organ, calculated using as the parameters the leaf area useful for photosynthesis and the net photosynthetic rate, in two successive samplings (m m-1 day-1), which can be obtained by:
(2)
Where, RGR: relative growth rate, m m-1 day-1; Ln: natural logarithm; LAf: final leaf area, m2; Lai: initial leaf area, m2; T: time interval between two consecutive measurements, days.
- Leaf area index (LAI) is the relationship between leaf area and the soil area shaded by the leaves, obtained through the calculation of the mean leaf area (m2) of one plant, multiplied by the number of plants per square meter, as presented in Equation 3.
(3)
Where, LA: leaf area, m2; As: area of soil, m2; Npp: number of plants per plot.
- Leaf area ratio (LAR) is a morphophysiological component, the ratio between the area responsible for the interception of luminous energy (LA) and CO2 and the total dry matter resulting from photosynthesis, calculated in cm2 g-1 and expressed by Equation 4.
(4)
Where, LAR: leaf area ratio, m2 kg-1; LA: leaf area, m2; TDM: total dry matter, kg.
The specific leaf area (SLA) is an index that allows to evaluate if the plants are accumulating photoassimilates in their leaves or translocating to other sink organs, measured in cm2 day-1 and expressed by Equation 5.
(5)
Where, SLA: specific leaf area, m2 kg-1; LA: leaf area, m2; LDM: leaf dry matter, kg.
The results were interpreted through the analysis of variance. Since the utilized factors were quantitative and qualitative, F test was applied along with the Tukey and Dunnett tests, at 0.05 probability level, to compare the means between the treatments and the treatments with the control, respectively.
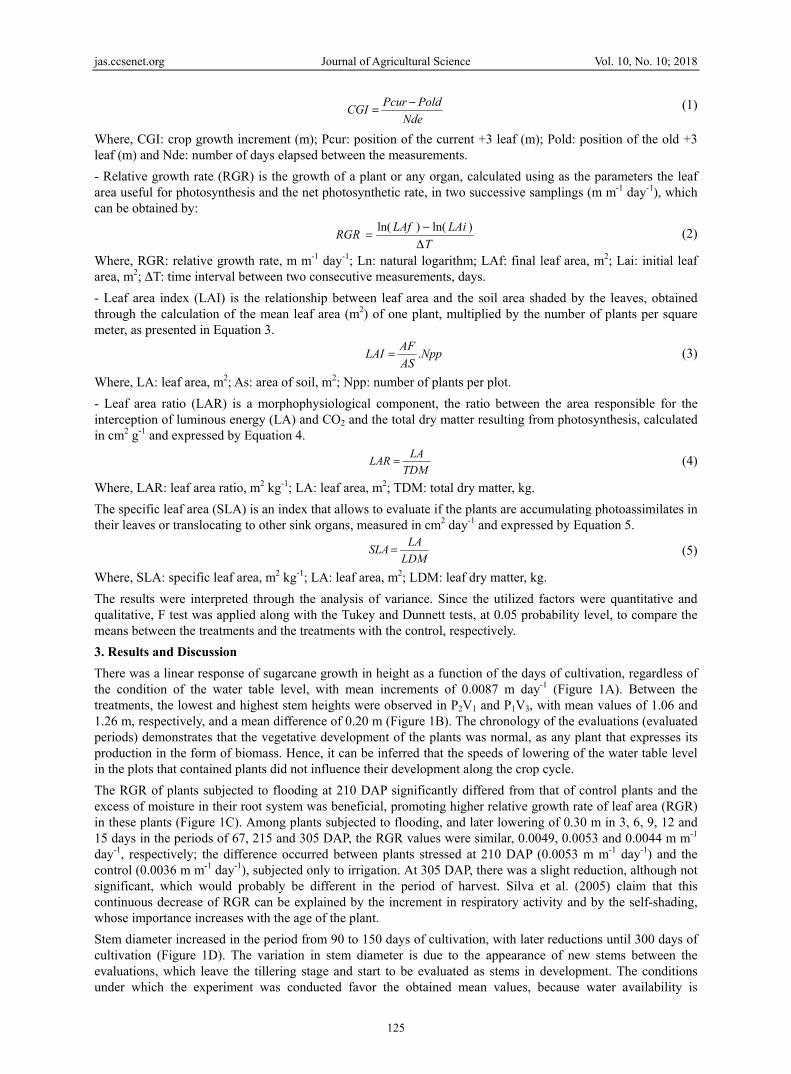
3. Results and Discussion There was a linear response of sugarcane growth in height as a function of the days of cultivation, regardless of the condition of the water table level, with mean increments of 0.0087 m day-1 (Figure 1A). Between the treatments, the lowest and highest stem heights were observed in P2V1 and P1V3, with mean values of 1.06 and 1.26 m, respectively, and a mean difference of 0.20 m (Figure 1B). The chronology of the evaluations (evaluated periods) demonstrates that the vegetative development of the plants was normal, as any plant that expresses its production in the form of biomass. Hence, it can be inferred that the speeds of lowering of the water table level in the plots that contained plants did not influence their development along the crop cycle.
The RGR of plants subjected to flooding at 210 DAP significantly differed from that of control plants and the excess of moisture in their root system was beneficial, promoting higher relative growth rate of leaf area (RGR) in these plants (Figure 1C). Among plants subjected to flooding, and later lowering of 0.30 m in 3, 6, 9, 12 and 15 days in the periods of 67, 215 and 305 DAP, the RGR values were similar, 0.0049, 0.0053 and 0.0044 m m-1 day-1, respectively; the difference occurred between plants stressed at 210 DAP (0.0053 m m-1 day-1) and the control (0.0036 m m-1 day-1), subjected only to irrigation. At 305 DAP, there was a slight reduction, although not significant, which would probably be different in the period of harvest. Silva et al. (2005) claim that this continuous decrease of RGR can be explained by the increment in respiratory activity and by the self-shading, whose importance increases with the age of the plant.
Stem diameter increased in the period from 90 to 150 days of cultivation, with later reductions until 300 days of cultivation (Figure 1D). The variation in stem diameter is due to the appearance of new stems between the evaluations, which leave the tillering stage and start to be evaluated as stems in development. The conditions under which the experiment was conducted favor the obtained mean values, because water availability is
Nde
PoldPcurCGI
T
LAiLAfRGR
)ln()ln(
NppAS
AFLAI .
TDM
LALAR
LDM
LASLA
jas.ccsenet.
relevant fovalues of cultivation
A
C
Figure 1. stems su
periods of
Note. NS ando not diff
Regarding(February et al. (200elongationthe period can be asso
The numbwhich alloin the exppossibly dbecause, aadopted lecondition, excess of m
org
or the maximistem diameter
n.
Means of heigubjected to diff water table lo
nd * = Not sigfer statistically
g the CGI, plato March). Af
05) studied then rate to the incd of greatest stociated with th
ber of tillers unows to claim thperiment (Figudue to the streaccording to Sevel of manag
the reduced spmoisture impo
ization of yielr equal to 0.03
ght of sugarcanfferent treatmeowering (C) an
gnificant and sy by the Dunne
ants reached tfter this phase, e growth of sucrease in self-sem elongationhe adequate su
ntil 120 DAP hat these tillersure 2B). From ess imposed oSuguitani (200ement. In thispace between
osed on the plo
Journal of A
ld gains. This 319 m in the
ne stems (HS) ents (B), relativnd stem diamet
significant at 5ett test at 5% p
their maximumthe internode
ugarcane cultivshading during
n coincided wiupply of nutrien
remained closs were the one120 DAP on,n the plants w01), tillering
s experiment, tlysimeters in cts.
Agricultural Sci
126
is consistent cultivar RB72
B
D
as a function ove growth rate ter (SD) of sug
5% (p <0.05) probability.
m developmenelongation devvars in Paranág the maturatioith the periodsnts and water.
se to 3, indicates that transfor there was a r
with the floodvaries accordthe low numbcomparison to
ience
with Oliveira2454 - progeni
of days after p(RGR) obtain
garcane as a fu
probability. M
nt at 120 DAveloped increaá and attributeon period. Olivs of highest LA
ting that therermed into stemreduction in th
ding, as well ading to variety
er of tillers mfield plantatio
V
a et al. (2004)itor of RB867
planting (A), hened in the plotsunction of days
Means followed
AP and remainasingly less (Fed the effect oveira et al. (20AI values. The
was a uniformms, responsiblehe number of as the environy, environmen
may have beenons, and by the
Vol. 10, No. 10;
, who found m7515, for 18-m
eight of sugarcs considering ths after planting
d by the same
ned until 150 igure 2A). Oli
on the reductio004) also foundese maximum
m initial sproue for the produtillers in the p
nmental conditntal conditionsn caused by the stress throug
2018
mean month
cane he
g (D)
letter
DAP veira on of d that rates
uting, ction plots, tions, s and e pot h the
jas.ccsenet.
A
C
Figure 2tillers of
Note. NS ando not diff
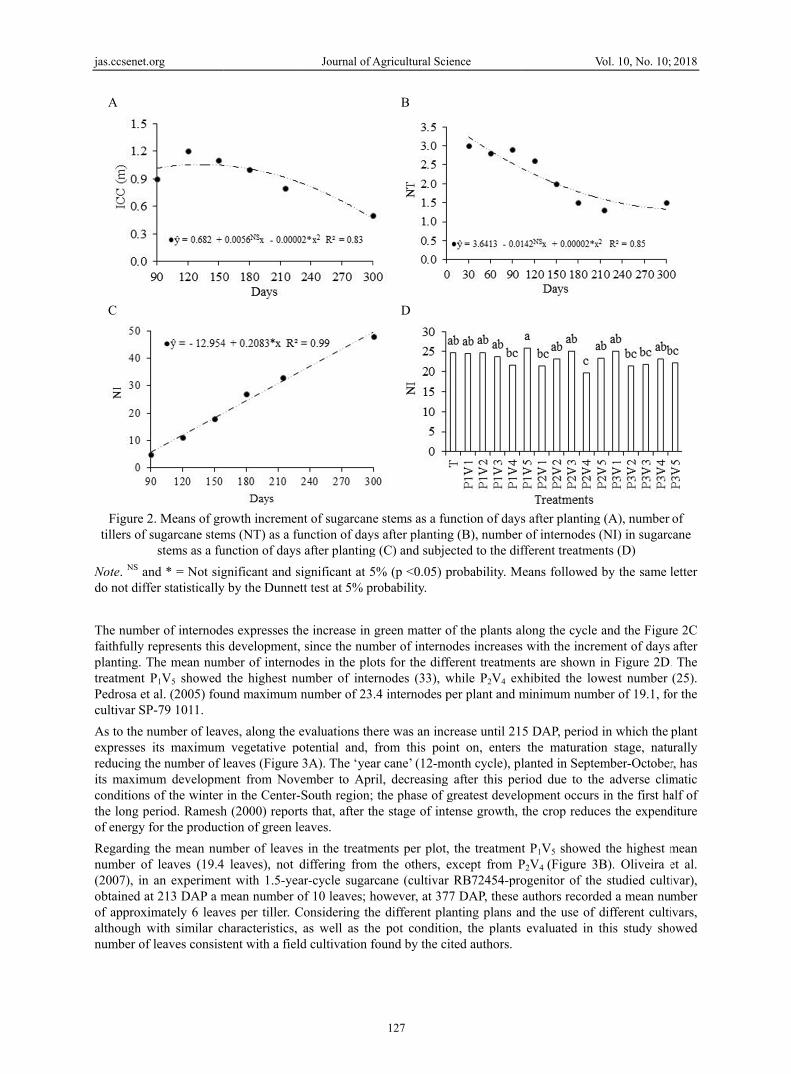
The numbfaithfully rplanting. Ttreatment Pedrosa etcultivar SP
As to the nexpresses reducing thits maximconditionsthe long pof energy f
Regardingnumber of(2007), in obtained aof approxialthough wnumber of
org
2. Means of grsugarcane stem
stems as a fu
nd * = Not sigfer statistically
er of internoderepresents thisThe mean numP1V5 showed
t al. (2005) fouP-79 1011.
number of leavits maximum
he number of lmum developms of the winter eriod. Rameshfor the produc
g the mean numf leaves (19.4an experimen
at 213 DAP a mimately 6 leavwith similar cf leaves consist
rowth incremenms (NT) as a fuunction of days
gnificant and sy by the Dunne
es expresses ths development,mber of interno
the highest nund maximum
ves, along the m vegetative p
leaves (Figurement from Nov
in the Center-h (2000) reportion of green l
mber of leave4 leaves), not nt with 1.5-yemean number oves per tiller. Characteristics, tent with a fiel
Journal of A
nt of sugarcanfunction of days after planting
significant at 5ett test at 5% p
he increase in , since the numodes in the plo
number of intenumber of 23
evaluations thpotential and, e 3A). The ‘yeavember to Apr-South region;rts that, after thleaves.
s in the treatmdiffering fromar-cycle sugarof 10 leaves; hConsidering th
as well as thld cultivation f
Agricultural Sci
127
B
D
e stems as a fuys after planting (C) and subje
5% (p <0.05) probability.
green matter omber of internoots for the differnodes (33), w.4 internodes p
here was an incfrom this poi
ar cane’ (12-mril, decreasing the phase of ghe stage of int
ments per plot,m the others, ercane (cultivarhowever, at 37he different plahe pot conditiofound by the ci
ience
unction of daysg (B), numberected to the dif
probability. M
of the plants aodes increasesferent treatmenwhile P2V4 exper plant and m
crease until 21int on, enters
month cycle), plg after this pergreatest develotense growth,
, the treatmentexcept from Pr RB72454-pro77 DAP, these anting plans aon, the plants ited authors.
V
s after plantingr of internodes fferent treatme
Means followed
long the cycles with the incrents are shown xhibited the lominimum num
5 DAP, periodthe maturatio
lanted in Septeriod due to thopment occursthe crop reduc
t P1V5 showedP2V4 (Figure 3ogenitor of theauthors record
and the use of evaluated in
Vol. 10, No. 10;
g (A), number (NI) in sugarc
ents (D)
d by the same
e and the Figurement of days in Figure 2D.
owest number mber of 19.1, fo
d in which the on stage, natuember-Octoberhe adverse clims in the first haces the expend
d the highest m3B). Oliveira ee studied cultided a mean nudifferent cultithis study sho
2018
of cane
letter
re 2C after
. The (25).
or the
plant urally r, has matic alf of diture
mean et al. ivar), mber ivars, owed
jas.ccsenet.
A
C
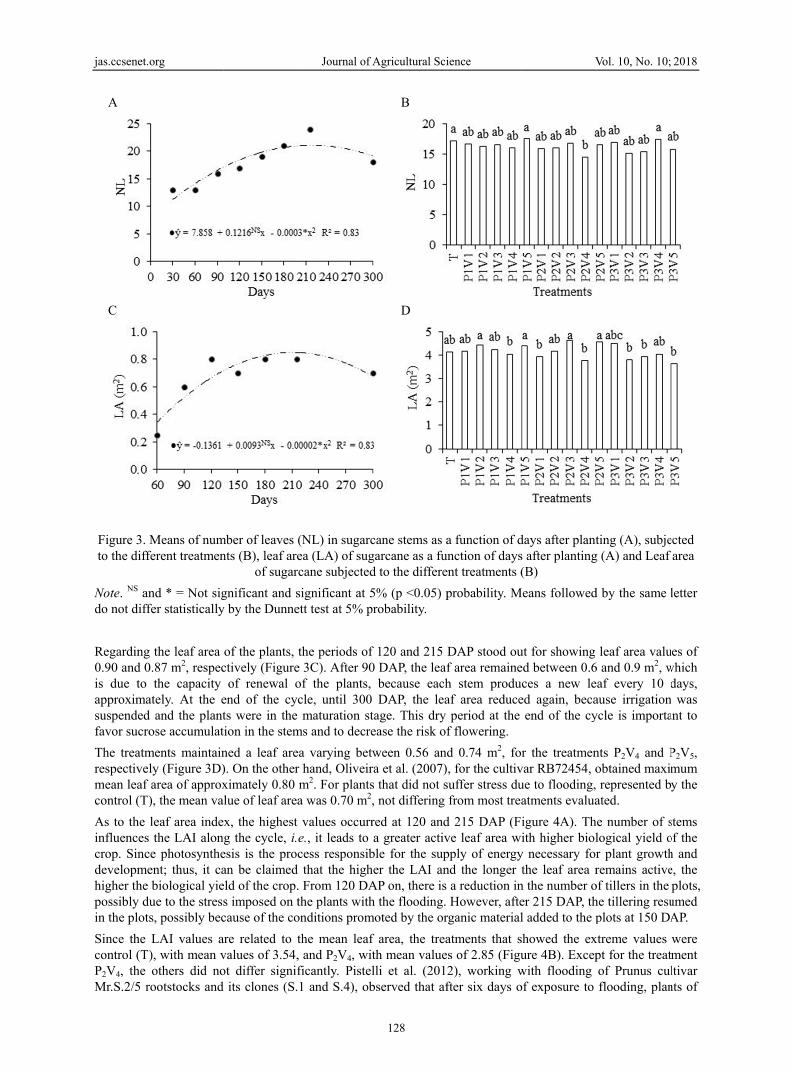
Figure 3. to the diff
Note. NS ando not diff
Regarding0.90 and 0is due to approximasuspendedfavor sucro
The treatmrespectivelmean leaf control (T)
As to the influencescrop. Sincdevelopmehigher the possibly duin the plot
Since the control (T)P2V4, the Mr.S.2/5 r
org
Means of numferent treatmen
nd * = Not sigfer statistically
g the leaf area 0.87 m2, respec
the capacity ately. At the ed and the plantose accumulat
ments maintainly (Figure 3D)area of approx), the mean va
leaf area inde the LAI alon
ce photosyntheent; thus, it cabiological yieue to the stresss, possibly bec
LAI values a), with mean vothers did no
rootstocks and
mber of leaves (nts (B), leaf are
of sugar
gnificant and sy by the Dunne
of the plants, ctively (Figure
of renewal oend of the cycts were in the tion in the stem
ned a leaf are). On the otherximately 0.80 lue of leaf area
x, the highest g the cycle, i.
esis is the procan be claimed eld of the crop.s imposed on tcause of the co
are related to tvalues of 3.54,ot differ signifd its clones (S.
Journal of A
(NL) in sugarcea (LA) of sugcane subjected
significant at 5ett test at 5% p
the periods of e 3C). After 90of the plants, cle, until 300 maturation st
ms and to decre
ea varying betwr hand, Oliveirm2. For plantsa was 0.70 m2,
values occurre., it leads to cess responsibthat the high
. From 120 DAthe plants withonditions prom
the mean leaf, and P2V4, witficantly. Pistel1 and S.4), ob
Agricultural Sci
128
B
D
cane stems as agarcane as a fud to the differe
5% (p <0.05) probability.
f 120 and 215 0 DAP, the leaf
because eachDAP, the lea
tage. This dry ease the risk of
ween 0.56 andra et al. (2007)s that did not s, not differing
red at 120 anda greater activ
ble for the supher the LAI anAP on, there is h the flooding.
moted by the or
f area, the treath mean valuelli et al. (2012bserved that af
ience
a function of dunction of daysent treatments (
probability. M
DAP stood ouf area remaineh stem produaf area reduceperiod at the
f flowering.
d 0.74 m2, for, for the cultiv
suffer stress dufrom most trea
d 215 DAP (Five leaf area wipply of energynd the longer t
a reduction inHowever, afte
rganic material
atments that ss of 2.85 (Figu2), working wfter six days o
V
days after plants after planting(B)
Means followed
ut for showing ed between 0.6ces a new le
ed again, becaend of the cy
r the treatmenvar RB72454, oue to flooding,atments evalua
igure 4A). Thith higher biol
y necessary forthe leaf area r
n the number oer 215 DAP, thl added to the p
showed the exure 4B). Excepwith flooding of exposure to
Vol. 10, No. 10;
ting (A), subjeg (A) and Leaf
d by the same
leaf area valu6 and 0.9 m2, weaf every 10 ause irrigationycle is importa
nts P2V4 and Pobtained maxi represented bated.
he number of slogical yield or plant growthremains active
of tillers in the he tillering resuplots at 150 DA
xtreme values pt for the treatof Prunus culflooding, plan
2018
ected area
letter
ues of which days, was
ant to
P2V5, mum y the
stems of the h and e, the plots,
umed AP.
were ment ltivar nts of
jas.ccsenet.
the clone behavior wphotosynthleaves and
A
Figure 4.differen
lowering
Note. NS ando not diff
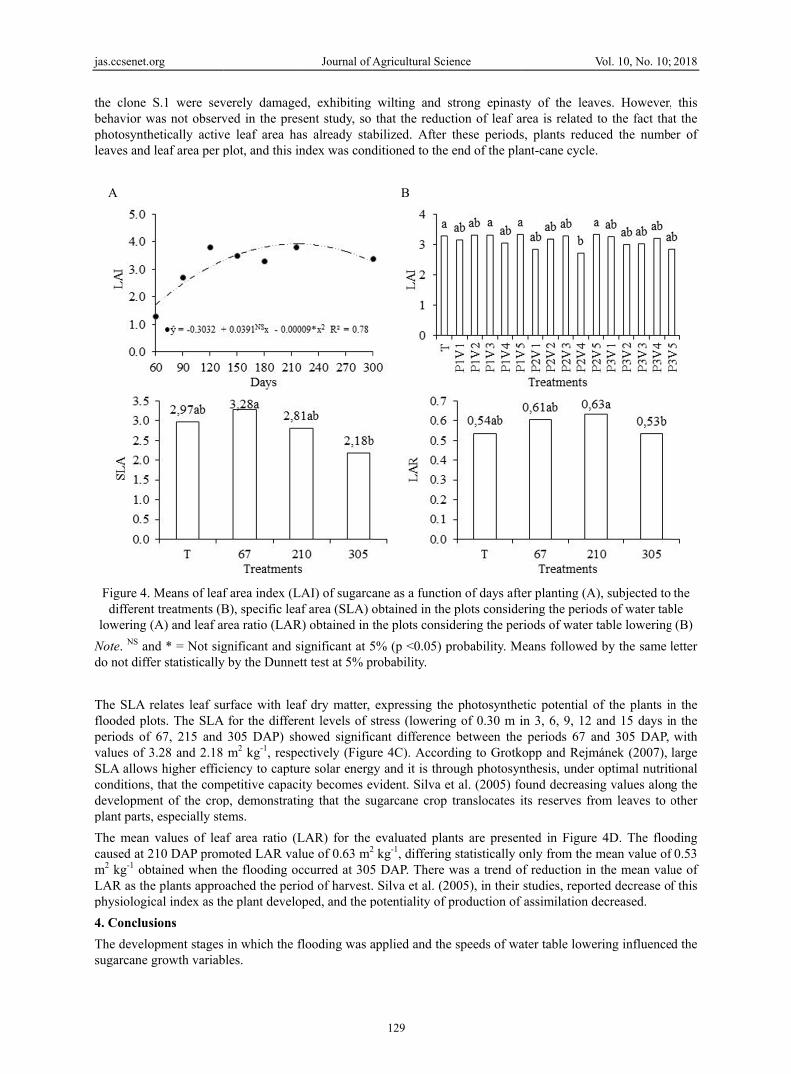
The SLA flooded plperiods ofvalues of 3SLA allowconditionsdevelopmeplant parts
The meancaused at 2m2 kg-1 obLAR as thphysiologi
4. ConclusThe develosugarcane
org
S.1 were sevwas not observhetically activ
d leaf area per p
. Means of leafnt treatments (B(A) and leaf ar
nd * = Not sigfer statistically
relates leaf sulots. The SLA f 67, 215 and 3.28 and 2.18
ws higher effics, that the coment of the crops, especially ste
n values of lea210 DAP prombtained when the plants approical index as th
sions opment stages growth variab
verely damageved in the pre
ve leaf area haplot, and this i
f area index (LB), specific learea ratio (LAR
gnificant and sy by the Dunne
urface with leaA for the differ
305 DAP) shm2 kg-1, respe
iency to captumpetitive capac
p, demonstratiems.
af area ratio (Lmoted LAR vathe flooding ooached the perihe plant develo
in which the fbles.
Journal of A
ed, exhibiting sent study, so as already staindex was cond
LAI) of sugarcaaf area (SLA) oR) obtained in t
significant at 5ett test at 5% p
af dry matter, rent levels of showed significectively (Figu
ure solar energity becomes eing that the su
LAR) for the lue of 0.63 m2
ccurred at 305iod of harvest.oped, and the p
flooding was a
Agricultural Sci
129
wilting and that the reduc
abilized. After ditioned to the
B
ane as a functiobtained in thethe plots consi
5% (p <0.05) probability.
expressing thstress (lowerincant differenceure 4C). Accorgy and it is throvident. Silva eugarcane crop
evaluated pla2 kg-1, differing5 DAP. There . Silva et al. (2potentiality of
applied and the
ience
strong epinastction of leaf a
these periodse end of the pla
ion of days aftee plots consideidering the per
probability. M
he photosyntheng of 0.30 m ie between therding to Grotkough photosynet al. (2005) fo
translocates i
ants are preseng statistically owas a trend o
2005), in their production of
e speeds of wa
V
ty of the leavarea is related s, plants reducant-cane cycle.
er planting (A)ering the periodriods of water t
Means followed
etic potential oin 3, 6, 9, 12 e periods 67 akopp and Rejmnthesis, under ound decreasinits reserves fro
nted in Figureonly from the mof reduction in
studies, reportassimilation d
ater table lowe
Vol. 10, No. 10;
ves. However,to the fact thaced the numb.
), subjected tods of water tabtable lowering
d by the same
of the plants inand 15 days in
and 305 DAP, mánek (2007),
optimal nutritng values alonom leaves to
e 4D. The floomean value ofthe mean valu
ted decrease odecreased.
ering influence
2018
, this at the er of
the ble g (B)
letter
n the n the with large
tional g the other
oding f 0.53 ue of f this
d the
jas.ccsenet.org Journal of Agricultural Science Vol. 10, No. 10; 2018
130
Plants flooded at 210 DAP for 12 days obtained greater stem growth, number of leaves, leaf area and leaf area index.
Plants exposed to flooding at 67 and 210 DAP obtained better physiological indices in comparison to the control and those flooded at 305 DAP.
It is recommended that the spacing between drains be calculated to be able to lower the water table, after a recharge of project, to 30 cm deep in 15 days.
References Ferraz, R. L. S., Barbosa, M. A., Batista, J. L., Magalhães, I. D., Dantas, G. F., & Franco, F. O. (2015). Calagem
em cana-de-açúcar: Efeitos no solo, planta e reflexos na produção. InterfacEHS—Saúde, Meio Ambiente e Sustentabilidade, 10(1), 166-177.
Galon, L., Tironi, S. P., Silva, A. F., Beutler, A. N., Rocha, P. R. R., Ferreira, E. A., & Silva, A. A. (2012). Disponibilidade de macronutrientes em cultivares de cana-de-açúcar submetidas à competição com Brachiaria brizantha. Ciência Rural, 42(8), 1372-1379. https://doi.org/10.1590/S0103-84782012000800007
Gava, G. J., De C., Silva, M. De A., Silva, R. C. Da, Jeronimo, E. M., Cruz, J. C. S., & Kölln, O. T. (2011). Produtividade de três cultivares de cana-de-açúcar sob manejos de sequeiro e irrigado por gotejamento. Rev. Bras. de Eng. Agrí. e Amb, 15(3), 250-255. https://doi.org/10.1590/S1415-43662011000300005
Grotkopp, E. and Rejmánek, M. (2007) High Seedling Relative Growth Rate and Specific Leaf Area Are Traits of Invasive Species: Phylogenetically Independent Contrasts of Woody Angiosperms. American Journal of Botany, 94(4), 526-532. https://doi.org/10.3732/ajb.94.4.526
Holanda, L. A., Santos, C. M., Sampaio Neto, G. D., Sousa, A. P., & Silva, M. A. (2014). Variáveis morfológicas da cana-de-açúcar em função do regime hídrico durante o desenvolvimento inicial. Irriga, 19(4), 573-584. https://doi.org/10.15809/irriga.2014v19n4p573
Messchmidt, A. A., Bianchi, V. J., Zanandrea, I., Martinazzo, E. G., Radmann, E. B., & Bacarin, M. A. (2015). Trocas gasosas e atividade antioxidante de portaenxertos de Prunus spp. submetidos ao estresse seca e alagamento. Rev. de la Facultad de Agron, 114(1), 71-81.
Mingoti, R., Duarte, S. N., Miranda, J. H., & Cruciani, D. E. (2006). Dimensionamento econômico de profundidades e espaçamentos de drenos para a produção de cana-de-açúcar. Rev. Bras. de Eng. Agrí. e Ambi, 10(3), 535-540. https://doi.org/10.1590/S1415-43662006000300001
Oliveira, R. A., Daros, E., Zambon, J. L. C., Weber, H., Ido, O. T., Zuffellato-Ribas, K. C., Koehler, H. S., & Silva, D. K. T. (2004). Crescimento e desenvolvimento de três cultivares de cana-de-açúcar, em cana-planta, no estado do Paraná. Scientia Agraria, 5(1), 87-94. https://doi.org/10.5380/rsa.v5i1.1102
Oliveira, R. A., Daros, E., Zambon, J. L. C., Weber, H., Ido, O. T., Zuffellato-Ribas, K. C., Koehler, H. S., & Silva, D. K. T. (2005). Crescimento e desenvolvimento de três cultivares de cana-de-açúcar, em cana-planta, no estado do Paraná: taxas de crescimento. Scientia Agrária, 6(1), 85-89. https://doi.org/10.5380/ rsa.v6i1.4599
Oliveira, R. A., Daros, E., Zambon, J. L. C., Weber, H., Ido, O. T., Bespalhok-Filho, J. C., Zuffellato-Ribas, K .C., & Silva, D. K. T. (2007). Área foliar em cana-de-açúcar e sua correlação com produção de biomassa. Pesq. Agrop. Tropical, 37(2), 71-76.
Pedrosa, R. M. B., Dantas Neto, J., Santos, J. S., Albuquerque, W. G., Farias, C. H. A., & Azevedo, H. M. (2005). Avaliação dos parâmetros dos colmos da cana-de-açúcar, segunda folha, submetida a níveis de irrigação e adubação. Rev. de Bio. e Ciên. da Terra, 5(1), 1-5.
Pistelli, L., Lacona, C., Miano, D.: Cirilli, M., Colao, M. C., Mensuali-Sodi, A., & Muleo, R. (2012). Novel Prunus rootstock somaclonal variants with divergent ability to tolerate waterlogging. Tree Physiology, 32(3), 355-368. https://doi.org/10.1093/treephys/tpr135
Ramesh, P. (2000). Effect of different levels of drought during the formative phase on growth parameters and its relationship with dry matter accumulation in sugarcane. J. of Agron. Crop Science, 185(1), 83-89. https://doi.org/10.1046/j.1439-037x.2000.00404.x
Silva, D. K. T., Daros, E., Zambon, J. C., Weber, H., Ido, O. T., Zuffellato-Ribas, K. C., Koehler, H., & Oliveira, R. A. (2005). Análise de crescimento em cultivares de cana-de-açúcar em cana-soca no noroeste do Paraná na safra de 2002/2003. Scientia Agraria, 6(1), 47-53. https://doi.org/10.5380/rsa.v8i1.8341
jas.ccsenet.org Journal of Agricultural Science Vol. 10, No. 10; 2018
131
Suguitani, C. (2001). Fenologia da cana-de-açúcar (Saccharum spp.) sob efeito do fósforo (p. 79). Dissertação (Mestrado na área de Fitotecnia) – Escola Superior de Agricultura “Luiz de Queiroz,” Universidade de São Paulo, Piracicaba.
Tavares, A. C. S., Duarte, S. N., Miranda, J. H., Dias, N. S., Souza, K. T. S., & Arraes, F. D. D. (2015). Velocidade de rebaixamento do nível freático na qualidade do caldo da cana-de-açúcar. Irriga, 20(3), 458-472. https://doi.org/10.15809/irriga.2015v20n3p458
Vale, D. W., Prado, R. M., Avalhães, C. C., & Hojo, R. H. (2011). Omissão de macronutrientes na nutrição e no crescimento da cana-de-açúcar cultivada em solução nutritiva. Rev. Bras. de Ciên. Agrá, 6(2), 189-196. https://doi.org/10.5039/agraria.v6i2a550
Copyrights Copyright for this article is retained by the author(s), with first publication rights granted to the journal.
This is an open-access article distributed under the terms and conditions of the Creative Commons Attribution license (http://creativecommons.org/licenses/by/4.0/).


![Araz S. Abdullah* Aerobic Rice Cultivation€¦ · In aerobic conditions, rice is grown as a dry field-crop in . irrigated, but not flooded, fertile soils [6]. Currently, aerobic](https://img.pdfslide.net/doc/110x75/60080c741da62a18f9567b66/araz-s-abdullah-aerobic-rice-cultivation-in-aerobic-conditions-rice-is-grown.jpg)