Embed Size (px)
Citation preview

Data
She
et |
Vers
ion
04.0
0
GSM MeasurementsSpecificationsR&S®FSW-K10 GSM/EDGE/EDGE Evolution/VAMOS MeasurementsR&S®FSV3-K10 Analysis of GSM, EDGE and EDGE Evolution SignalsR&S®FSV-K10 Analysis of GSM, EDGE and EDGE Evolution SignalsR&S®FPS-K10 GSM/EDGE/EDGE Evolution/VAMOS MeasurementsR&S®VSE-K10 GSM Measurements
VSE-FSx-K10_dat-sw_en_3607-2726-22_v0400_cover.indd 1 18.06.2019 11:00:25
Version 04.00, June 2019
2 Rohde & Schwarz GSM Measurements
CONTENTS Specifications ................................................................................................................................................................................................................................................. 5
General remarks ............................................................................................................................................................................................................................................. 5
GSM measurements ................................................................................................................................................................................................................................................................. 6
Supported measurements ..................................................................................................................................................................................................................................................... 6
Inputs .................................................................................................................................................................................................................................................................................... 6
Frequency ............................................................................................................................................................................................................................................................................. 6
Level ..................................................................................................................................................................................................................................................................................... 7
Signal acquisition .................................................................................................................................................................................................................................................................. 7
Result display ...................................................................................................................................................................................................................................................................... 10
Measurement uncertainty (nominal) ........................................................................................................................................................................................................................................ 12
Demodulation – GSM, EGPRS (EDGE) and VAMOS ......................................................................................................................................................................................................... 12
Demodulation – EGPRS2-A ................................................................................................................................................................................................................................................ 14
Demodulation – EGPRS2-B narrow pulse ........................................................................................................................................................................................................................... 15
Demodulation – EGPRS2-B wide pulse ............................................................................................................................................................................................................................... 16
Power versus slot, for all modulations ................................................................................................................................................................................................................................ 17
Power versus time, for all modulations ............................................................................................................................................................................................................................... 17
Spectrum due to modulation and noise ............................................................................................................................................................................................................................... 18
Spectrum due to switching transients .................................................................................................................................................................................................................................. 20
Ordering information ................................................................................................................................................................................................................................... 21

Version 04.00, June 2019
Rohde & Schwarz GSM Measurements 3
Definitions General
Product data applies under the following conditions:
Three hours storage at ambient temperature followed by 30 minutes warm-up operation
Specified environmental conditions met
Recommended calibration interval adhered to
All internal automatic adjustments performed, if applicable
Specifications with limits
Represent warranted product performance by means of a range of values for the specified parameter. These specifications are marked with limiting symbols such as <, ≤, >, ≥, ±, or
descriptions such as maximum, limit of, minimum. Compliance is ensured by testing or is derived from the design. Test limits are narrowed by guard bands to take into account measurement
uncertainties, drift and aging, if applicable.
Non-traceable specifications with limits (n. trc.)
Represent product performance that is specified and tested as described under “Specifications with limits” above. However, product performance in this case cannot be warranted due to the
lack of measuring equipment traceable to national metrology standards. In this case, measurements are referenced to standards used in the Rohde & Schwarz laboratories.
Specifications without limits
Represent warranted product performance for the specified parameter. These specifications are not specially marked and represent values with no or negligible deviations from the given
value (e.g. dimensions or resolution of a setting parameter). Compliance is ensured by design.
Typical data (typ.)
Characterizes product performance by means of representative information for the given parameter. When marked with <, > or as a range, it represents the performance met by approximately
80 % of the instruments at production time. Otherwise, it represents the mean value.
Nominal values (nom.)
Characterize product performance by means of a representative value for the given parameter (e.g. nominal impedance). In contrast to typical data, a statistical evaluation does not take place
and the parameter is not tested during production.
Version 04.00, June 2019
4 Rohde & Schwarz GSM Measurements
Measured values (meas.)
Characterize expected product performance by means of measurement results gained from individual samples.
Uncertainties
Represent limits of measurement uncertainty for a given measurand. Uncertainty is defined with a coverage factor of 2 and has been calculated in line with the rules of the Guide to the
Expression of Uncertainty in Measurement (GUM), taking into account environmental conditions, aging, wear and tear.
Device settings and GUI parameters are indicated as follows: “parameter: value”.
Typical data as well as nominal and measured values are not warranted by Rohde & Schwarz.
In line with the 3GPP/3GPP2 standard, chip rates are specified in Mcps (million chips per second), whereas bit rates and symbol rates are specified in Gbps (billion bits per second), Mbps
(million bits per second), kbps (thousand bits per second), Msps (million symbols per second) or ksps (thousand symbols per second), and sample rates are specified in Msample/s (million
samples per second). Gbps, Mcps, Mbps, Msps, kbps, ksps and Msample/s are not SI units.
Version 04.00, June 2019
Rohde & Schwarz GSM Measurements 5
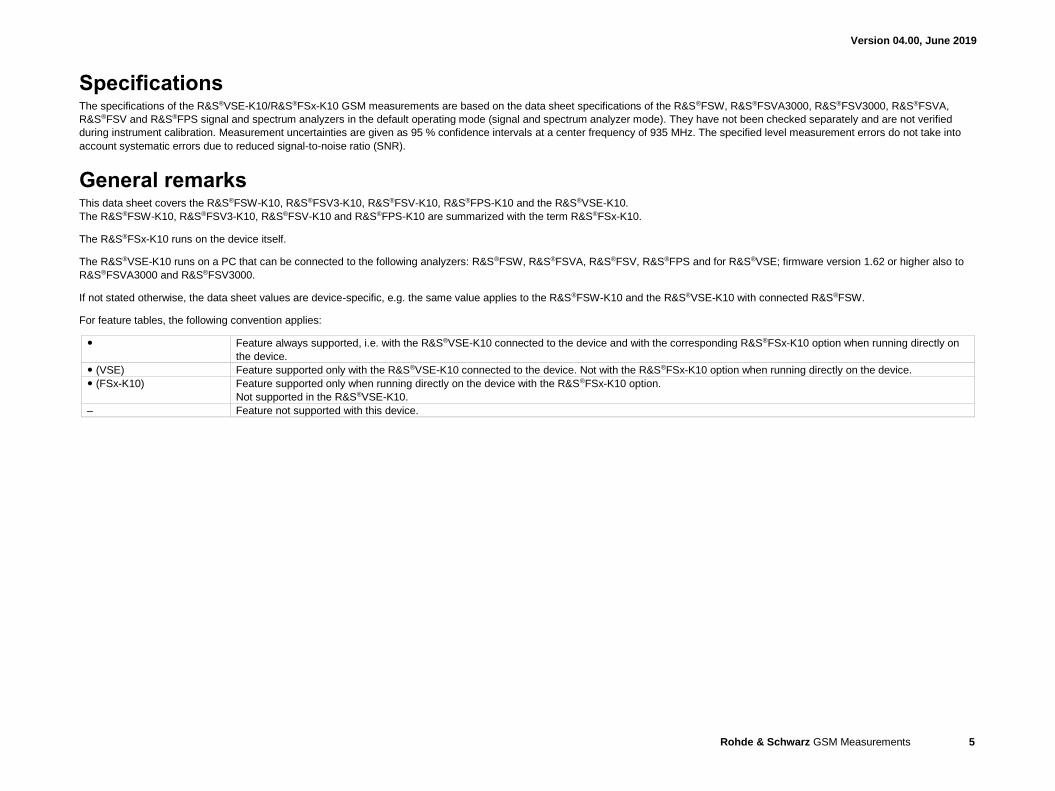
Specifications The specifications of the R&S®VSE-K10/R&S®FSx-K10 GSM measurements are based on the data sheet specifications of the R&S®FSW, R&S®FSVA3000, R&S®FSV3000, R&S®FSVA,
R&S®FSV and R&S®FPS signal and spectrum analyzers in the default operating mode (signal and spectrum analyzer mode). They have not been checked separately and are not verified
during instrument calibration. Measurement uncertainties are given as 95 % confidence intervals at a center frequency of 935 MHz. The specified level measurement errors do not take into
account systematic errors due to reduced signal-to-noise ratio (SNR).
General remarks This data sheet covers the R&S®FSW-K10, R&S®FSV3-K10, R&S®FSV-K10, R&S®FPS-K10 and the R&S®VSE-K10.
The R&S®FSW-K10, R&S®FSV3-K10, R&S®FSV-K10 and R&S®FPS-K10 are summarized with the term R&S®FSx-K10.
The R&S®FSx-K10 runs on the device itself.
The R&S®VSE-K10 runs on a PC that can be connected to the following analyzers: R&S®FSW, R&S®FSVA, R&S®FSV, R&S®FPS and for R&S®VSE; firmware version 1.62 or higher also to
R&S®FSVA3000 and R&S®FSV3000.
If not stated otherwise, the data sheet values are device-specific, e.g. the same value applies to the R&S®FSW-K10 and the R&S®VSE-K10 with connected R&S®FSW.
For feature tables, the following convention applies:
Feature always supported, i.e. with the R&S®VSE-K10 connected to the device and with the corresponding R&S®FSx-K10 option when running directly on
the device.
(VSE) Feature supported only with the R&S®VSE-K10 connected to the device. Not with the R&S®FSx-K10 option when running directly on the device.
(FSx-K10) Feature supported only when running directly on the device with the R&S®FSx-K10 option.
Not supported in the R&S®VSE-K10.
– Feature not supported with this device.

Version 04.00, June 2019
6 Rohde & Schwarz GSM Measurements
GSM measurements
Supported measurements
Measurement mode 1 R&S®FSW R&S®FSVA3000/R&S®FSV3000 R&S®FSVA/R&S®FSV R&S®FPS
I/Q measurements 2
MCWN measurements 3 (FSW-K10), only RF input (FSV3-K10), only RF input – (FPS-K10), only RF input
Wide modulation spectrum
measurements 4
2 2 (FSV-K10) 2
Inputs
R&S®FSW R&S®FSVA3000/R&S®FSV3000 R&S®FSVA/R&S®FSV R&S®FPS
Measurement mode I/Q MCWN I/Q MCWN I/Q Wide modulation
spectrum
I/Q MCWN
RF input (FSW-K10) (FSV3-K10) (FSV-K10) (FPS-K10)
Frequency range frequency range same as
R&S®FSW 5
frequency range same as
R&S®FSVA3000/FSV3000
frequency range same as
R&S®FSVA/FSV 5
frequency range same as R&S®FPS 5
Digital baseband input (FSW-K10) 6 – – – (FSV-K10) 7 – – –
Analog baseband input (FSW-K10) 8 – – – – – – –
File – – (VSE) – –
Frequency
Frequency bands T-GSM380, T-GSM410, GSM450, GSM480, GSM710, GSM750, T-GSM810, GSM850, P-GSM900, E-GSM900, R-GSM900, T-GSM900, DCS1800,
PCS1900
Frequency setting frequency band
single carrier frequency and ARFCN
multicarrier 9 up to 16 carriers
frequencies
carrier allocation:
contiguous
noncontiguous 10
1 R&SFSW/FSV3/FPS-K10: MEAS hardkey switches between multicarrier wideband noise measurement and single carrier I/Q based measurement. R&SFSV-K10: Softkeys switch between single carrier I/Q based
measurements and the wide modulation spectrum measurement. 2 Modulation spectrum measurements are covered by the MCWN (R&S®FSW/FSV3-K10/FPS-K10) or the I/Q measurement (R&S®FSW/FSV3/FPS/VSE-K10) mode. No separate measurement mode available. 3 Measurement in line with 3GPP TS 51.021, chapter 6.12: Wideband noise and intra-BSS intermodulation attenuation in multicarrier operation. 4 Gated zero span modulation spectrum measurements for offset frequencies up to 6 MHz. 5 Restricted dynamic range, IF overload, IF power trigger and auto level functionality depending on carrier frequency and bandwidth at carrier frequencies < 90 MHz. 6 Only with R&S®FSW-B17 option. 7 Only with R&S®FSV-B17 option. 8 Only with R&S®FSW-B71 option. 9 R&S®FSV-K10: Only up to 12 active carriers. Configuration of carrier allocation and carrier frequencies not supported. 10 Noncontiguous frequency allocation is defined as an allocation where two sub-blocks are separated by at least 5 MHz (cf. 3GPP TS 51.021, chapter 4.10.10. multicarrier BTS).
Version 04.00, June 2019
Rohde & Schwarz GSM Measurements 7
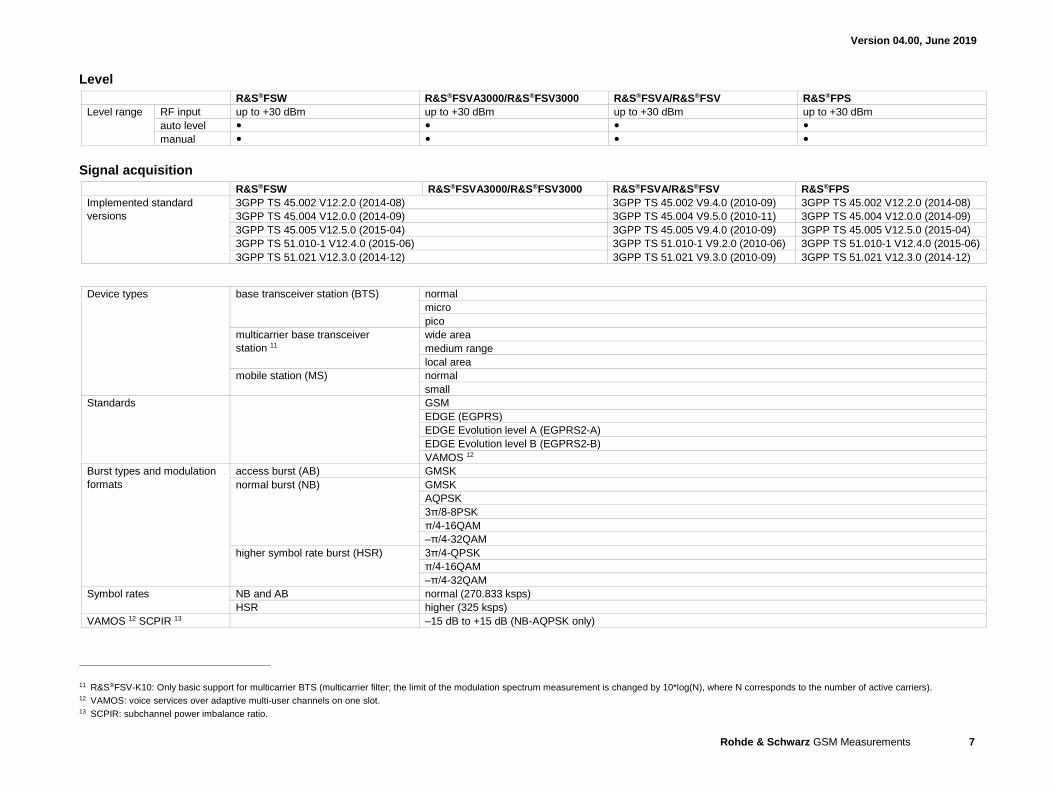
Level
R&S®FSW R&S®FSVA3000/R&S®FSV3000 R&S®FSVA/R&S®FSV R&S®FPS
Level range RF input up to +30 dBm up to +30 dBm up to +30 dBm up to +30 dBm
auto level
manual
Signal acquisition
R&S®FSW R&S®FSVA3000/R&S®FSV3000 R&S®FSVA/R&S®FSV R&S®FPS
Implemented standard
versions
3GPP TS 45.002 V12.2.0 (2014-08) 3GPP TS 45.002 V9.4.0 (2010-09) 3GPP TS 45.002 V12.2.0 (2014-08)
3GPP TS 45.004 V12.0.0 (2014-09) 3GPP TS 45.004 V9.5.0 (2010-11) 3GPP TS 45.004 V12.0.0 (2014-09)
3GPP TS 45.005 V12.5.0 (2015-04) 3GPP TS 45.005 V9.4.0 (2010-09) 3GPP TS 45.005 V12.5.0 (2015-04)
3GPP TS 51.010-1 V12.4.0 (2015-06) 3GPP TS 51.010-1 V9.2.0 (2010-06) 3GPP TS 51.010-1 V12.4.0 (2015-06)
3GPP TS 51.021 V12.3.0 (2014-12) 3GPP TS 51.021 V9.3.0 (2010-09) 3GPP TS 51.021 V12.3.0 (2014-12)
Device types base transceiver station (BTS) normal
micro
pico
multicarrier base transceiver
station 11
wide area
medium range
local area
mobile station (MS) normal
small
Standards GSM
EDGE (EGPRS)
EDGE Evolution level A (EGPRS2-A)
EDGE Evolution level B (EGPRS2-B)
VAMOS 12
Burst types and modulation
formats
access burst (AB) GMSK
normal burst (NB) GMSK
AQPSK
3π/8-8PSK
π/4-16QAM
–π/4-32QAM
higher symbol rate burst (HSR) 3π/4-QPSK
π/4-16QAM
–π/4-32QAM
Symbol rates NB and AB normal (270.833 ksps)
HSR higher (325 ksps)
VAMOS 12 SCPIR 13 –15 dB to +15 dB (NB-AQPSK only)
11 R&S®FSV-K10: Only basic support for multicarrier BTS (multicarrier filter; the limit of the modulation spectrum measurement is changed by 10*log(N), where N corresponds to the number of active carriers). 12 VAMOS: voice services over adaptive multi-user channels on one slot. 13 SCPIR: subchannel power imbalance ratio.
Version 04.00, June 2019
8 Rohde & Schwarz GSM Measurements
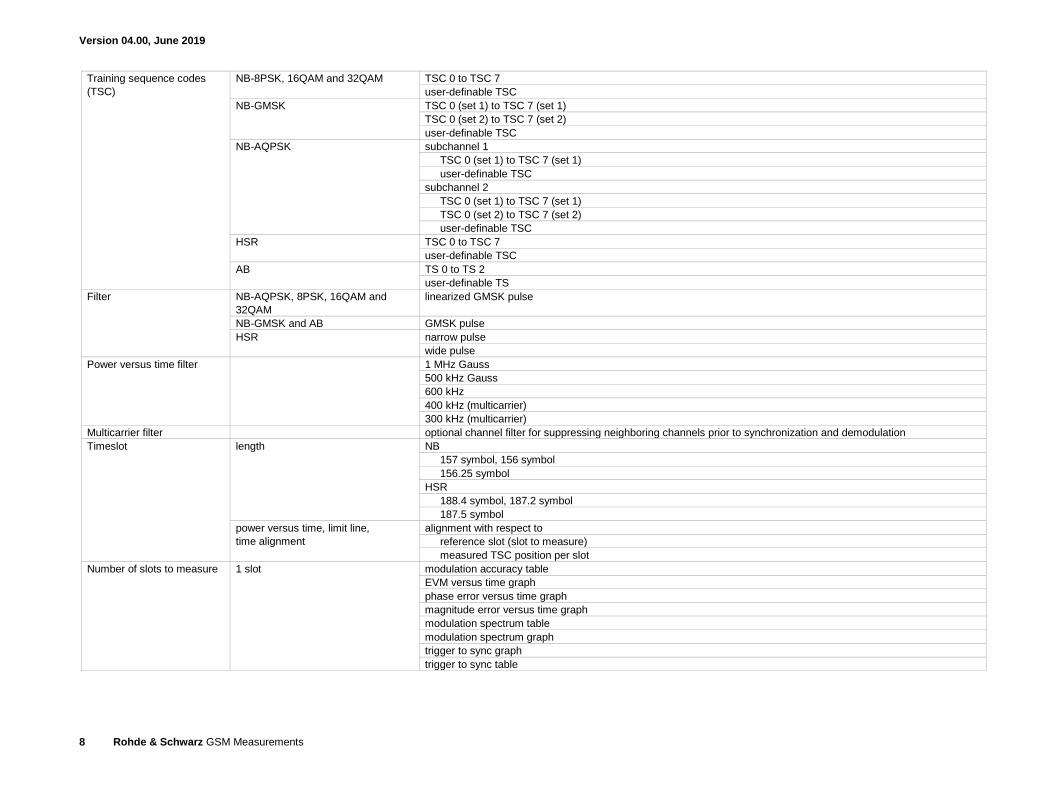
Training sequence codes
(TSC)
NB-8PSK, 16QAM and 32QAM TSC 0 to TSC 7
user-definable TSC
NB-GMSK TSC 0 (set 1) to TSC 7 (set 1)
TSC 0 (set 2) to TSC 7 (set 2)
user-definable TSC
NB-AQPSK subchannel 1
TSC 0 (set 1) to TSC 7 (set 1)
user-definable TSC
subchannel 2
TSC 0 (set 1) to TSC 7 (set 1)
TSC 0 (set 2) to TSC 7 (set 2)
user-definable TSC
HSR TSC 0 to TSC 7
user-definable TSC
AB TS 0 to TS 2
user-definable TS
Filter NB-AQPSK, 8PSK, 16QAM and
32QAM
linearized GMSK pulse
NB-GMSK and AB GMSK pulse
HSR narrow pulse
wide pulse
Power versus time filter 1 MHz Gauss
500 kHz Gauss
600 kHz
400 kHz (multicarrier)
300 kHz (multicarrier)
Multicarrier filter optional channel filter for suppressing neighboring channels prior to synchronization and demodulation
Timeslot length NB
157 symbol, 156 symbol
156.25 symbol
HSR
188.4 symbol, 187.2 symbol
187.5 symbol
power versus time, limit line,
time alignment
alignment with respect to
reference slot (slot to measure)
measured TSC position per slot
Number of slots to measure 1 slot modulation accuracy table
EVM versus time graph
phase error versus time graph
magnitude error versus time graph
modulation spectrum table
modulation spectrum graph
trigger to sync graph
trigger to sync table
Version 04.00, June 2019
Rohde & Schwarz GSM Measurements 9
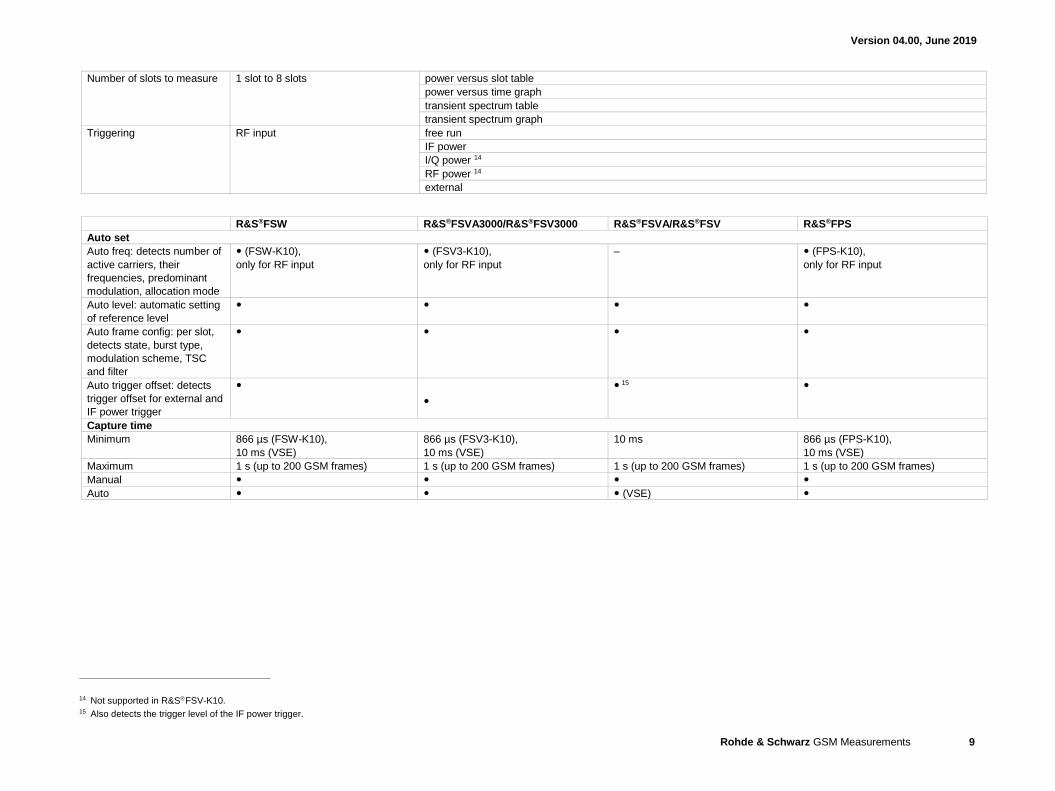
Number of slots to measure 1 slot to 8 slots power versus slot table
power versus time graph
transient spectrum table
transient spectrum graph
Triggering RF input free run
IF power
I/Q power 14
RF power 14
external
R&S®FSW R&S®FSVA3000/R&S®FSV3000 R&S®FSVA/R&S®FSV R&S®FPS
Auto set
Auto freq: detects number of
active carriers, their
frequencies, predominant
modulation, allocation mode
(FSW-K10),
only for RF input
(FSV3-K10),
only for RF input
– (FPS-K10),
only for RF input
Auto level: automatic setting
of reference level
Auto frame config: per slot,
detects state, burst type,
modulation scheme, TSC
and filter
Auto trigger offset: detects
trigger offset for external and
IF power trigger
15
Capture time
Minimum 866 µs (FSW-K10),
10 ms (VSE)
866 µs (FSV3-K10),
10 ms (VSE)
10 ms 866 µs (FPS-K10),
10 ms (VSE)
Maximum 1 s (up to 200 GSM frames) 1 s (up to 200 GSM frames) 1 s (up to 200 GSM frames) 1 s (up to 200 GSM frames)
Manual
Auto (VSE)
14 Not supported in R&SFSV-K10. 15 Also detects the trigger level of the IF power trigger.
Version 04.00, June 2019
10 Rohde & Schwarz GSM Measurements
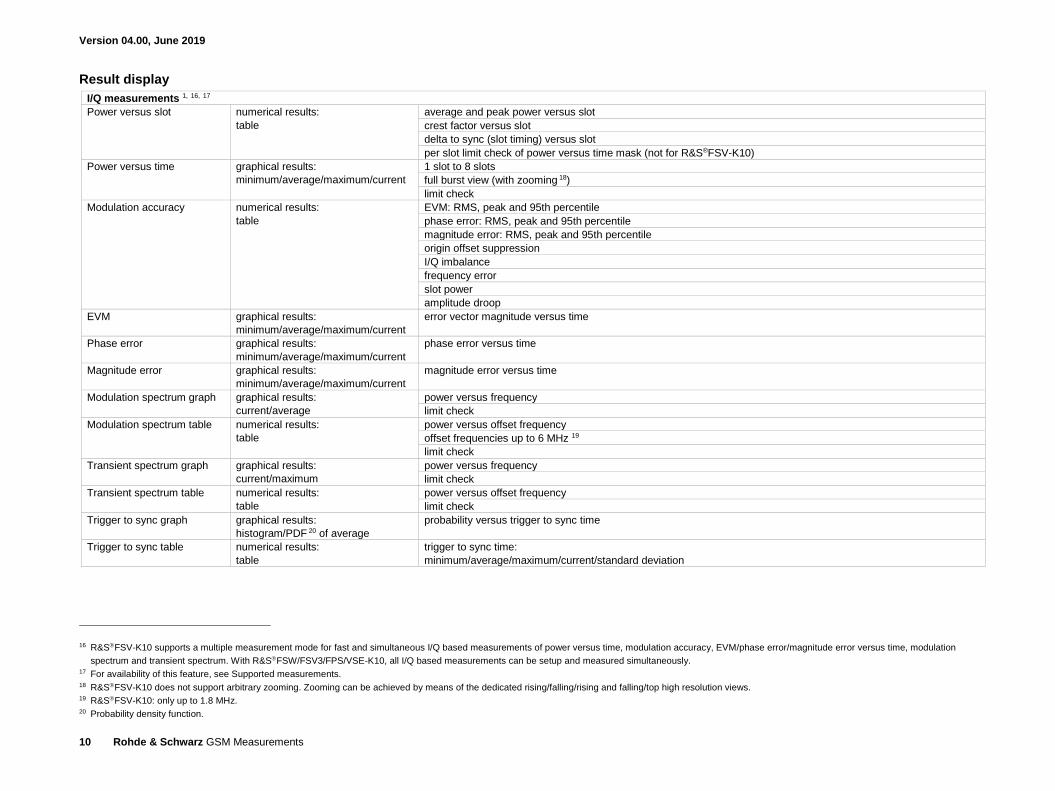
Result display
I/Q measurements 1, 16, 17
Power versus slot numerical results:
table
average and peak power versus slot
crest factor versus slot
delta to sync (slot timing) versus slot
per slot limit check of power versus time mask (not for R&S®FSV-K10)
Power versus time graphical results:
minimum/average/maximum/current
1 slot to 8 slots
full burst view (with zooming 18)
limit check
Modulation accuracy numerical results:
table
EVM: RMS, peak and 95th percentile
phase error: RMS, peak and 95th percentile
magnitude error: RMS, peak and 95th percentile
origin offset suppression
I/Q imbalance
frequency error
slot power
amplitude droop
EVM graphical results:
minimum/average/maximum/current
error vector magnitude versus time
Phase error graphical results:
minimum/average/maximum/current
phase error versus time
Magnitude error graphical results:
minimum/average/maximum/current
magnitude error versus time
Modulation spectrum graph graphical results:
current/average
power versus frequency
limit check
Modulation spectrum table numerical results:
table
power versus offset frequency
offset frequencies up to 6 MHz 19
limit check
Transient spectrum graph graphical results:
current/maximum
power versus frequency
limit check
Transient spectrum table numerical results:
table
power versus offset frequency
limit check
Trigger to sync graph graphical results:
histogram/PDF 20 of average
probability versus trigger to sync time
Trigger to sync table numerical results:
table
trigger to sync time:
minimum/average/maximum/current/standard deviation
16 R&SFSV-K10 supports a multiple measurement mode for fast and simultaneous I/Q based measurements of power versus time, modulation accuracy, EVM/phase error/magnitude error versus time, modulation
spectrum and transient spectrum. With R&SFSW/FSV3/FPS/VSE-K10, all I/Q based measurements can be setup and measured simultaneously. 17 For availability of this feature, see Supported measurements. 18 R&SFSV-K10 does not support arbitrary zooming. Zooming can be achieved by means of the dedicated rising/falling/rising and falling/top high resolution views. 19 R&SFSV-K10: only up to 1.8 MHz. 20 Probability density function.
Version 04.00, June 2019
Rohde & Schwarz GSM Measurements 11
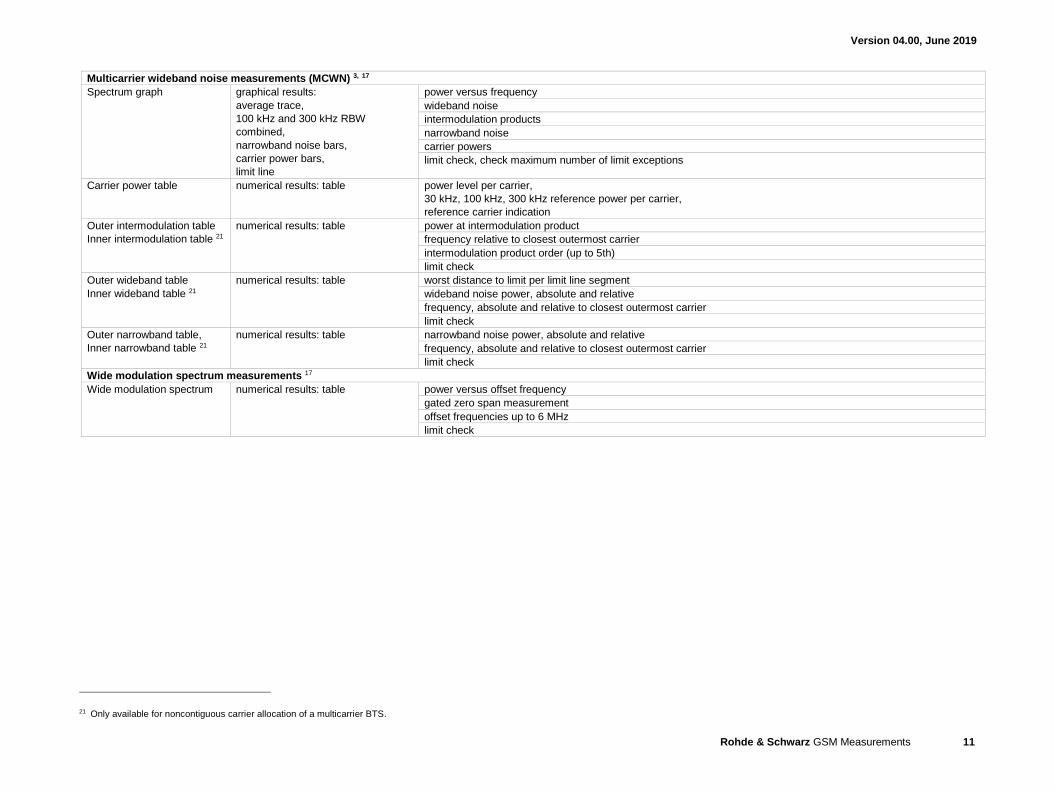
Multicarrier wideband noise measurements (MCWN) 3, 17
Spectrum graph graphical results:
average trace,
100 kHz and 300 kHz RBW
combined,
narrowband noise bars,
carrier power bars,
limit line
power versus frequency
wideband noise
intermodulation products
narrowband noise
carrier powers
limit check, check maximum number of limit exceptions
Carrier power table numerical results: table power level per carrier,
30 kHz, 100 kHz, 300 kHz reference power per carrier,
reference carrier indication
Outer intermodulation table
Inner intermodulation table 21
numerical results: table power at intermodulation product
frequency relative to closest outermost carrier
intermodulation product order (up to 5th)
limit check
Outer wideband table
Inner wideband table 21
numerical results: table worst distance to limit per limit line segment
wideband noise power, absolute and relative
frequency, absolute and relative to closest outermost carrier
limit check
Outer narrowband table,
Inner narrowband table 21
numerical results: table narrowband noise power, absolute and relative
frequency, absolute and relative to closest outermost carrier
limit check
Wide modulation spectrum measurements 17
Wide modulation spectrum numerical results: table power versus offset frequency
gated zero span measurement
offset frequencies up to 6 MHz
limit check
21 Only available for noncontiguous carrier allocation of a multicarrier BTS.
Version 04.00, June 2019
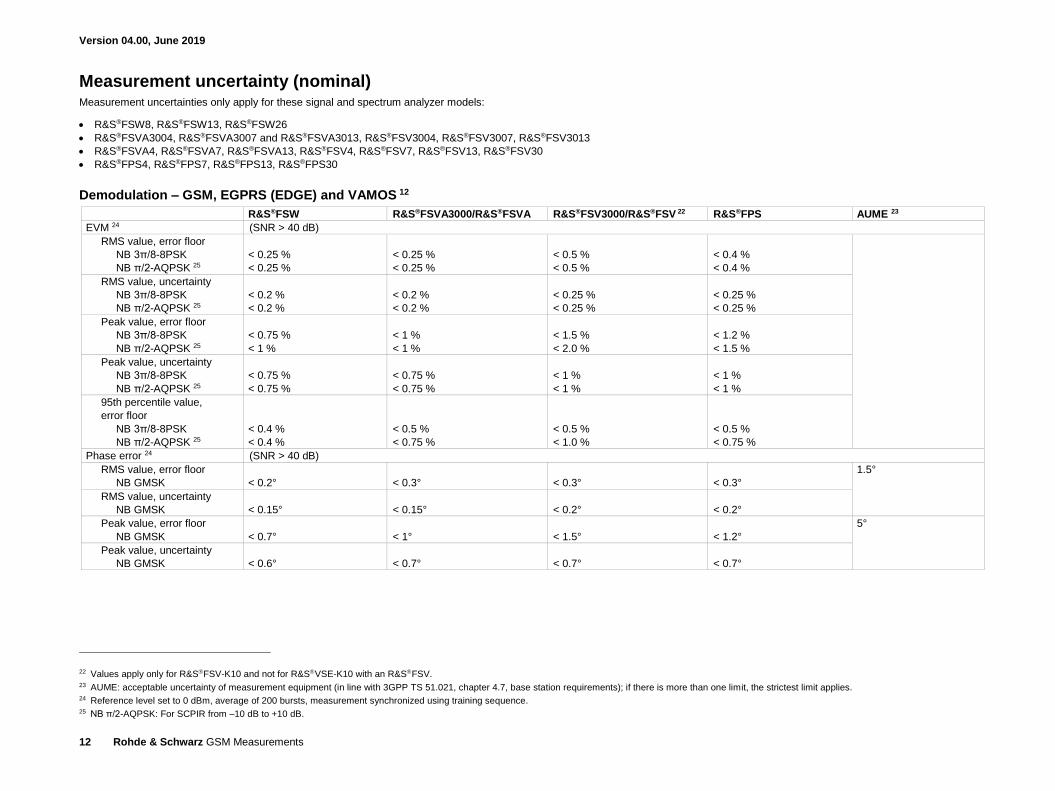
12 Rohde & Schwarz GSM Measurements
Measurement uncertainty (nominal) Measurement uncertainties only apply for these signal and spectrum analyzer models:
R&S®FSW8, R&S®FSW13, R&S®FSW26
R&S®FSVA3004, R&S®FSVA3007 and R&S®FSVA3013, R&S®FSV3004, R&S®FSV3007, R&S®FSV3013
R&S®FSVA4, R&S®FSVA7, R&S®FSVA13, R&S®FSV4, R&S®FSV7, R&S®FSV13, R&S®FSV30
R&S®FPS4, R&S®FPS7, R&S®FPS13, R&S®FPS30
Demodulation – GSM, EGPRS (EDGE) and VAMOS 12
R&S®FSW R&S®FSVA3000/R&S®FSVA R&S®FSV3000/R&S®FSV 22 R&S®FPS AUME 23
EVM 24 (SNR > 40 dB)
RMS value, error floor
NB 3π/8-8PSK
NB π/2-AQPSK 25
< 0.25 %
< 0.25 %
< 0.25 %
< 0.25 %
< 0.5 %
< 0.5 %
< 0.4 %
< 0.4 %
RMS value, uncertainty
NB 3π/8-8PSK
NB π/2-AQPSK 25
< 0.2 %
< 0.2 %
< 0.2 %
< 0.2 %
< 0.25 %
< 0.25 %
< 0.25 %
< 0.25 %
Peak value, error floor
NB 3π/8-8PSK
NB π/2-AQPSK 25
< 0.75 %
< 1 %
< 1 %
< 1 %
< 1.5 %
< 2.0 %
< 1.2 %
< 1.5 %
Peak value, uncertainty
NB 3π/8-8PSK
NB π/2-AQPSK 25
< 0.75 %
< 0.75 %
< 0.75 %
< 0.75 %
< 1 %
< 1 %
< 1 %
< 1 %
95th percentile value,
error floor
NB 3π/8-8PSK
NB π/2-AQPSK 25
< 0.4 %
< 0.4 %
< 0.5 %
< 0.75 %
< 0.5 %
< 1.0 %
< 0.5 %
< 0.75 %
Phase error 24 (SNR > 40 dB)
RMS value, error floor
NB GMSK
< 0.2°
< 0.3°
< 0.3°
< 0.3°
1.5°
RMS value, uncertainty
NB GMSK
< 0.15°
< 0.15°
< 0.2°
< 0.2°
Peak value, error floor
NB GMSK
< 0.7°
< 1°
< 1.5°
< 1.2°
5°
Peak value, uncertainty
NB GMSK
< 0.6°
< 0.7°
< 0.7°
< 0.7°
22 Values apply only for R&SFSV-K10 and not for R&SVSE-K10 with an R&SFSV. 23 AUME: acceptable uncertainty of measurement equipment (in line with 3GPP TS 51.021, chapter 4.7, base station requirements); if there is more than one limit, the strictest limit applies. 24 Reference level set to 0 dBm, average of 200 bursts, measurement synchronized using training sequence. 25 NB π/2-AQPSK: For SCPIR from –10 dB to +10 dB.
Version 04.00, June 2019
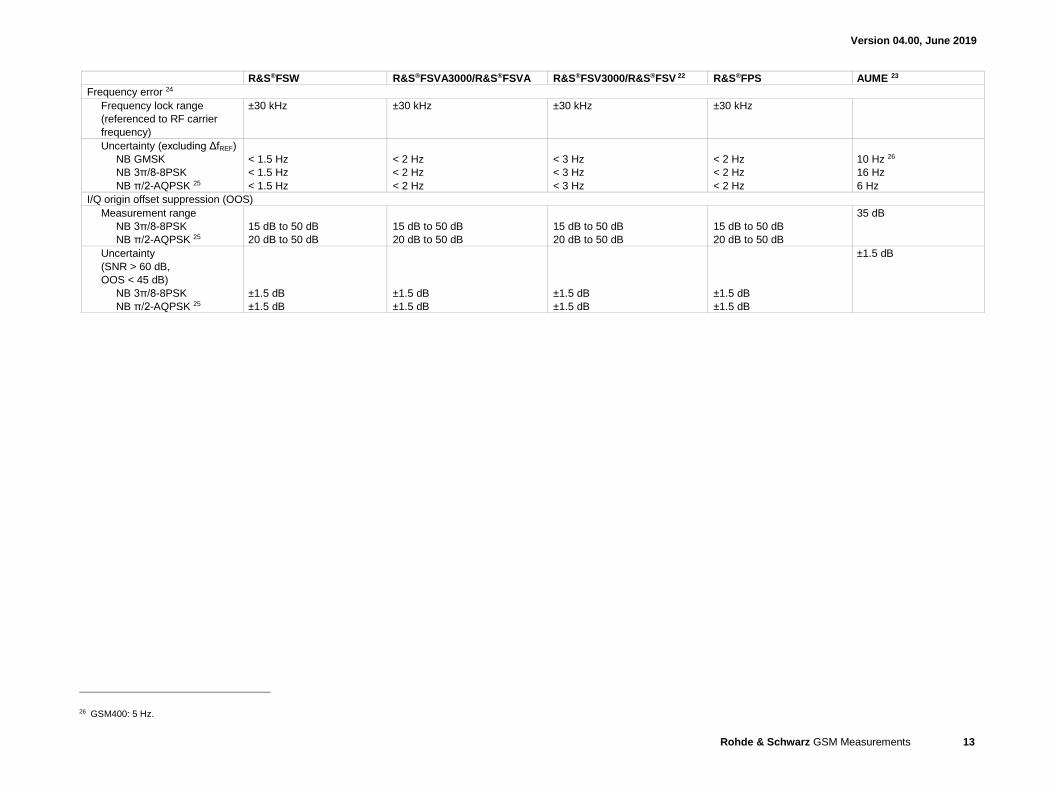
Rohde & Schwarz GSM Measurements 13
R&S®FSW R&S®FSVA3000/R&S®FSVA R&S®FSV3000/R&S®FSV 22 R&S®FPS AUME 23
Frequency error 24
Frequency lock range
(referenced to RF carrier
frequency)
±30 kHz ±30 kHz ±30 kHz ±30 kHz
Uncertainty (excluding ΔfREF)
NB GMSK
NB 3π/8-8PSK
NB π/2-AQPSK 25
< 1.5 Hz
< 1.5 Hz
< 1.5 Hz
< 2 Hz
< 2 Hz
< 2 Hz
< 3 Hz
< 3 Hz
< 3 Hz
< 2 Hz
< 2 Hz
< 2 Hz
10 Hz 26
16 Hz
6 Hz
I/Q origin offset suppression (OOS)
Measurement range
NB 3π/8-8PSK
NB π/2-AQPSK 25
15 dB to 50 dB
20 dB to 50 dB
15 dB to 50 dB
20 dB to 50 dB
15 dB to 50 dB
20 dB to 50 dB
15 dB to 50 dB
20 dB to 50 dB
35 dB
Uncertainty
(SNR > 60 dB,
OOS < 45 dB)
NB 3π/8-8PSK
NB π/2-AQPSK 25
±1.5 dB
±1.5 dB
±1.5 dB
±1.5 dB
±1.5 dB
±1.5 dB
±1.5 dB
±1.5 dB
±1.5 dB
26 GSM400: 5 Hz.
Version 04.00, June 2019
14 Rohde & Schwarz GSM Measurements
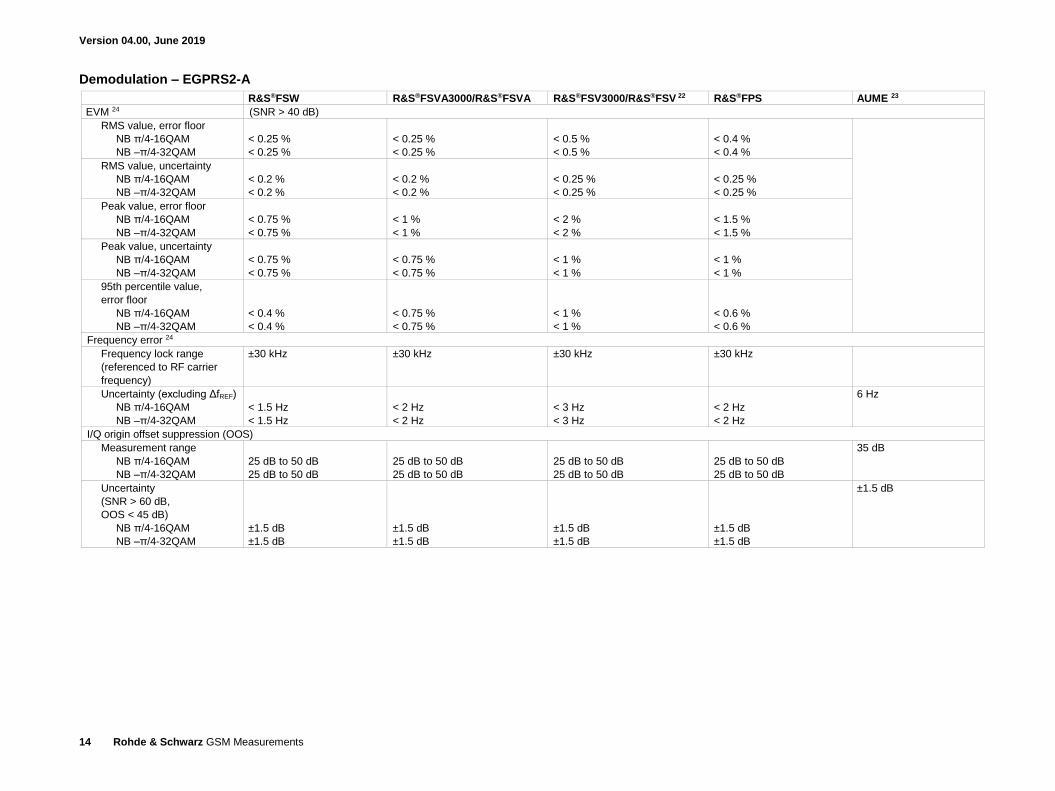
Demodulation – EGPRS2-A
R&S®FSW R&S®FSVA3000/R&S®FSVA R&S®FSV3000/R&S®FSV 22 R&S®FPS AUME 23
EVM 24 (SNR > 40 dB)
RMS value, error floor
NB π/4-16QAM
NB –π/4-32QAM
< 0.25 %
< 0.25 %
< 0.25 %
< 0.25 %
< 0.5 %
< 0.5 %
< 0.4 %
< 0.4 %
RMS value, uncertainty
NB π/4-16QAM
NB –π/4-32QAM
< 0.2 %
< 0.2 %
< 0.2 %
< 0.2 %
< 0.25 %
< 0.25 %
< 0.25 %
< 0.25 %
Peak value, error floor
NB π/4-16QAM
NB –π/4-32QAM
< 0.75 %
< 0.75 %
< 1 %
< 1 %
< 2 %
< 2 %
< 1.5 %
< 1.5 %
Peak value, uncertainty
NB π/4-16QAM
NB –π/4-32QAM
< 0.75 %
< 0.75 %
< 0.75 %
< 0.75 %
< 1 %
< 1 %
< 1 %
< 1 %
95th percentile value,
error floor
NB π/4-16QAM
NB –π/4-32QAM
< 0.4 %
< 0.4 %
< 0.75 %
< 0.75 %
< 1 %
< 1 %
< 0.6 %
< 0.6 %
Frequency error 24
Frequency lock range
(referenced to RF carrier
frequency)
±30 kHz ±30 kHz ±30 kHz ±30 kHz
Uncertainty (excluding ΔfREF)
NB π/4-16QAM
NB –π/4-32QAM
< 1.5 Hz
< 1.5 Hz
< 2 Hz
< 2 Hz
< 3 Hz
< 3 Hz
< 2 Hz
< 2 Hz
6 Hz
I/Q origin offset suppression (OOS)
Measurement range
NB π/4-16QAM
NB –π/4-32QAM
25 dB to 50 dB
25 dB to 50 dB
25 dB to 50 dB
25 dB to 50 dB
25 dB to 50 dB
25 dB to 50 dB
25 dB to 50 dB
25 dB to 50 dB
35 dB
Uncertainty
(SNR > 60 dB,
OOS < 45 dB)
NB π/4-16QAM
NB –π/4-32QAM
±1.5 dB
±1.5 dB
±1.5 dB
±1.5 dB
±1.5 dB
±1.5 dB
±1.5 dB
±1.5 dB
±1.5 dB
Version 04.00, June 2019
Rohde & Schwarz GSM Measurements 15
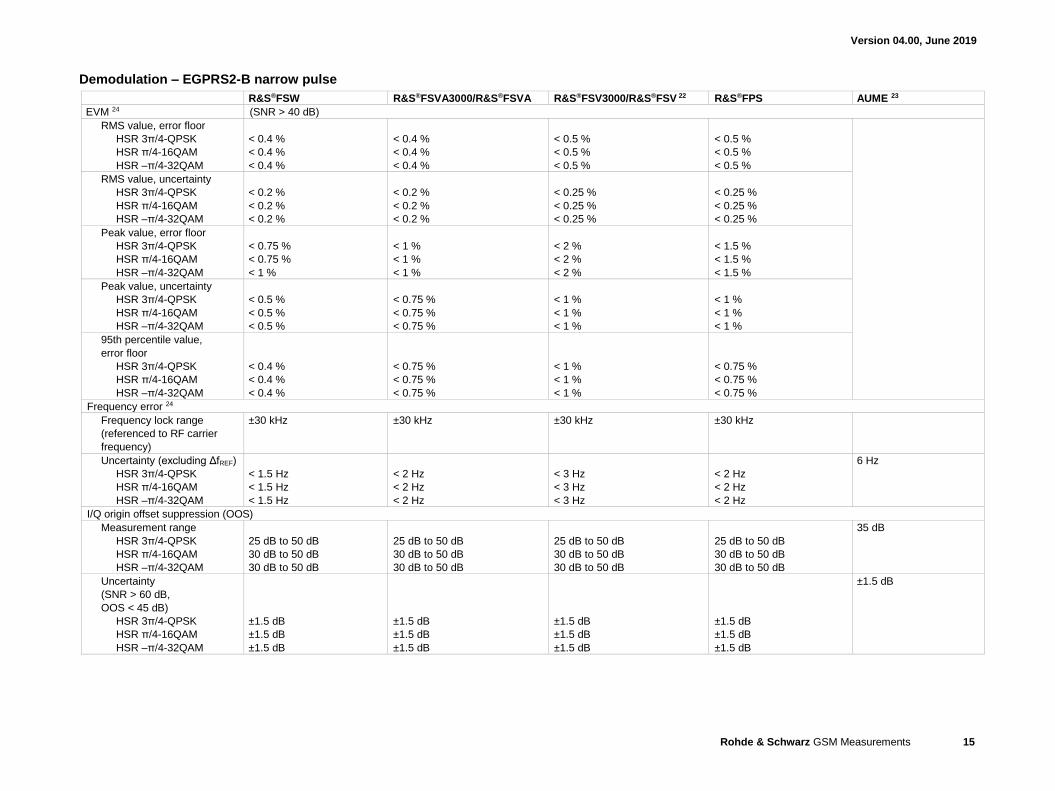
Demodulation – EGPRS2-B narrow pulse
R&S®FSW R&S®FSVA3000/R&S®FSVA R&S®FSV3000/R&S®FSV 22 R&S®FPS AUME 23
EVM 24 (SNR > 40 dB)
RMS value, error floor
HSR 3π/4-QPSK
HSR π/4-16QAM
HSR –π/4-32QAM
< 0.4 %
< 0.4 %
< 0.4 %
< 0.4 %
< 0.4 %
< 0.4 %
< 0.5 %
< 0.5 %
< 0.5 %
< 0.5 %
< 0.5 %
< 0.5 %
RMS value, uncertainty
HSR 3π/4-QPSK
HSR π/4-16QAM
HSR –π/4-32QAM
< 0.2 %
< 0.2 %
< 0.2 %
< 0.2 %
< 0.2 %
< 0.2 %
< 0.25 %
< 0.25 %
< 0.25 %
< 0.25 %
< 0.25 %
< 0.25 %
Peak value, error floor
HSR 3π/4-QPSK
HSR π/4-16QAM
HSR –π/4-32QAM
< 0.75 %
< 0.75 %
< 1 %
< 1 %
< 1 %
< 1 %
< 2 %
< 2 %
< 2 %
< 1.5 %
< 1.5 %
< 1.5 %
Peak value, uncertainty
HSR 3π/4-QPSK
HSR π/4-16QAM
HSR –π/4-32QAM
< 0.5 %
< 0.5 %
< 0.5 %
< 0.75 %
< 0.75 %
< 0.75 %
< 1 %
< 1 %
< 1 %
< 1 %
< 1 %
< 1 %
95th percentile value,
error floor
HSR 3π/4-QPSK
HSR π/4-16QAM
HSR –π/4-32QAM
< 0.4 %
< 0.4 %
< 0.4 %
< 0.75 %
< 0.75 %
< 0.75 %
< 1 %
< 1 %
< 1 %
< 0.75 %
< 0.75 %
< 0.75 %
Frequency error 24
Frequency lock range
(referenced to RF carrier
frequency)
±30 kHz ±30 kHz ±30 kHz ±30 kHz
Uncertainty (excluding ΔfREF)
HSR 3π/4-QPSK
HSR π/4-16QAM
HSR –π/4-32QAM
< 1.5 Hz
< 1.5 Hz
< 1.5 Hz
< 2 Hz
< 2 Hz
< 2 Hz
< 3 Hz
< 3 Hz
< 3 Hz
< 2 Hz
< 2 Hz
< 2 Hz
6 Hz
I/Q origin offset suppression (OOS)
Measurement range
HSR 3π/4-QPSK
HSR π/4-16QAM
HSR –π/4-32QAM
25 dB to 50 dB
30 dB to 50 dB
30 dB to 50 dB
25 dB to 50 dB
30 dB to 50 dB
30 dB to 50 dB
25 dB to 50 dB
30 dB to 50 dB
30 dB to 50 dB
25 dB to 50 dB
30 dB to 50 dB
30 dB to 50 dB
35 dB
Uncertainty
(SNR > 60 dB,
OOS < 45 dB)
HSR 3π/4-QPSK
HSR π/4-16QAM
HSR –π/4-32QAM
±1.5 dB
±1.5 dB
±1.5 dB
±1.5 dB
±1.5 dB
±1.5 dB
±1.5 dB
±1.5 dB
±1.5 dB
±1.5 dB
±1.5 dB
±1.5 dB
±1.5 dB
Version 04.00, June 2019
16 Rohde & Schwarz GSM Measurements
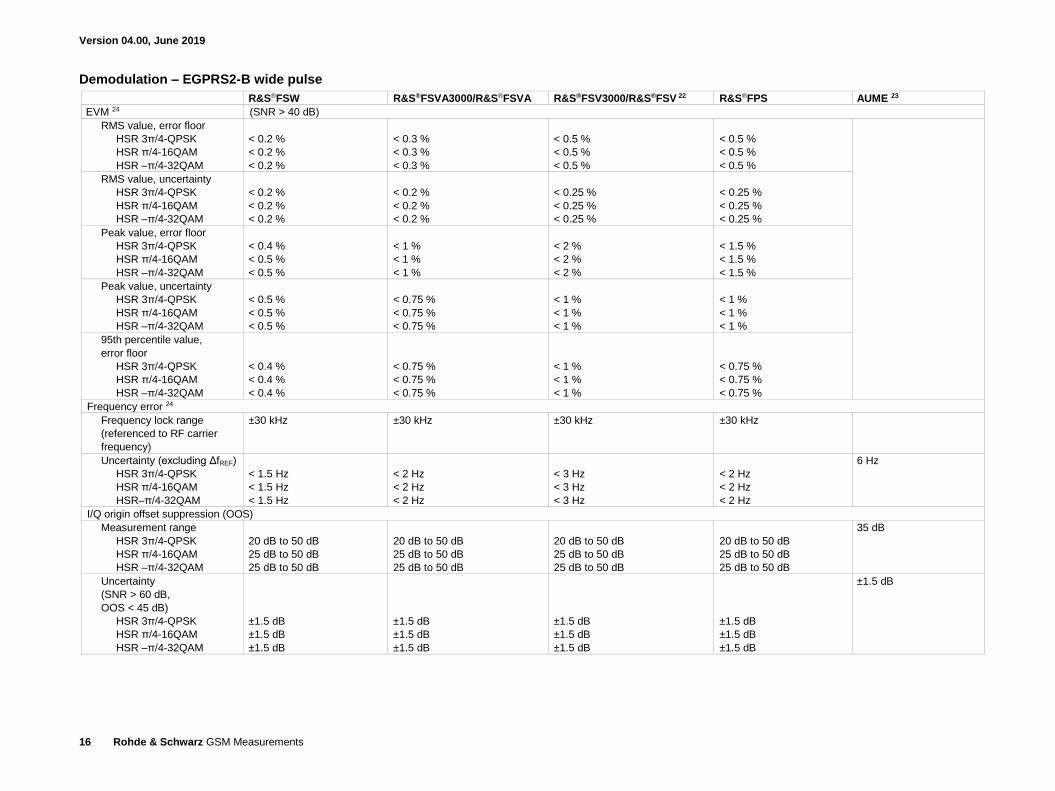
Demodulation – EGPRS2-B wide pulse
R&S®FSW R&S®FSVA3000/R&S®FSVA R&S®FSV3000/R&S®FSV 22 R&S®FPS AUME 23
EVM 24 (SNR > 40 dB)
RMS value, error floor
HSR 3π/4-QPSK
HSR π/4-16QAM
HSR –π/4-32QAM
< 0.2 %
< 0.2 %
< 0.2 %
< 0.3 %
< 0.3 %
< 0.3 %
< 0.5 %
< 0.5 %
< 0.5 %
< 0.5 %
< 0.5 %
< 0.5 %
RMS value, uncertainty
HSR 3π/4-QPSK
HSR π/4-16QAM
HSR –π/4-32QAM
< 0.2 %
< 0.2 %
< 0.2 %
< 0.2 %
< 0.2 %
< 0.2 %
< 0.25 %
< 0.25 %
< 0.25 %
< 0.25 %
< 0.25 %
< 0.25 %
Peak value, error floor
HSR 3π/4-QPSK
HSR π/4-16QAM
HSR –π/4-32QAM
< 0.4 %
< 0.5 %
< 0.5 %
< 1 %
< 1 %
< 1 %
< 2 %
< 2 %
< 2 %
< 1.5 %
< 1.5 %
< 1.5 %
Peak value, uncertainty
HSR 3π/4-QPSK
HSR π/4-16QAM
HSR –π/4-32QAM
< 0.5 %
< 0.5 %
< 0.5 %
< 0.75 %
< 0.75 %
< 0.75 %
< 1 %
< 1 %
< 1 %
< 1 %
< 1 %
< 1 %
95th percentile value,
error floor
HSR 3π/4-QPSK
HSR π/4-16QAM
HSR –π/4-32QAM
< 0.4 %
< 0.4 %
< 0.4 %
< 0.75 %
< 0.75 %
< 0.75 %
< 1 %
< 1 %
< 1 %
< 0.75 %
< 0.75 %
< 0.75 %
Frequency error 24
Frequency lock range
(referenced to RF carrier
frequency)
±30 kHz
±30 kHz ±30 kHz ±30 kHz
Uncertainty (excluding ΔfREF)
HSR 3π/4-QPSK
HSR π/4-16QAM
HSR–π/4-32QAM
< 1.5 Hz
< 1.5 Hz
< 1.5 Hz
< 2 Hz
< 2 Hz
< 2 Hz
< 3 Hz
< 3 Hz
< 3 Hz
< 2 Hz
< 2 Hz
< 2 Hz
6 Hz
I/Q origin offset suppression (OOS)
Measurement range
HSR 3π/4-QPSK
HSR π/4-16QAM
HSR –π/4-32QAM
20 dB to 50 dB
25 dB to 50 dB
25 dB to 50 dB
20 dB to 50 dB
25 dB to 50 dB
25 dB to 50 dB
20 dB to 50 dB
25 dB to 50 dB
25 dB to 50 dB
20 dB to 50 dB
25 dB to 50 dB
25 dB to 50 dB
35 dB
Uncertainty
(SNR > 60 dB,
OOS < 45 dB)
HSR 3π/4-QPSK
HSR π/4-16QAM
HSR –π/4-32QAM
±1.5 dB
±1.5 dB
±1.5 dB
±1.5 dB
±1.5 dB
±1.5 dB
±1.5 dB
±1.5 dB
±1.5 dB
±1.5 dB
±1.5 dB
±1.5 dB
±1.5 dB
Version 04.00, June 2019
Rohde & Schwarz GSM Measurements 17
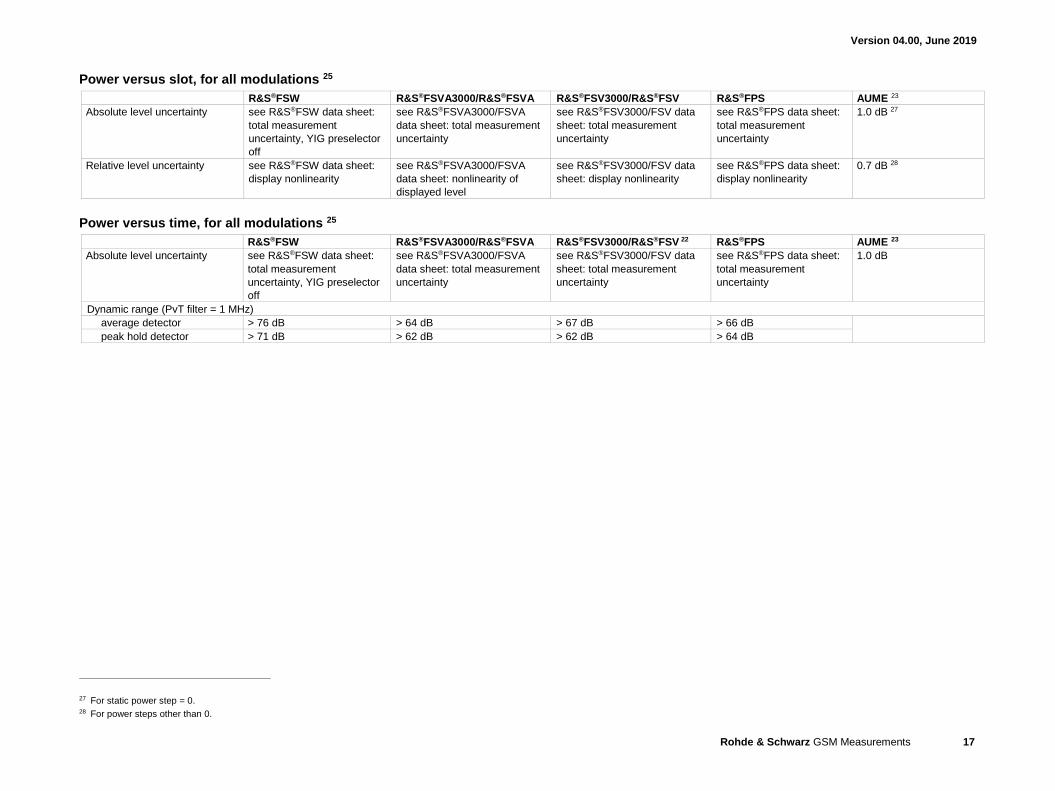
Power versus slot, for all modulations 25
R&S®FSW R&S®FSVA3000/R&S®FSVA R&S®FSV3000/R&S®FSV R&S®FPS AUME 23
Absolute level uncertainty see R&S®FSW data sheet:
total measurement
uncertainty, YIG preselector
off
see R&S®FSVA3000/FSVA
data sheet: total measurement
uncertainty
see R&S®FSV3000/FSV data
sheet: total measurement
uncertainty
see R&S®FPS data sheet:
total measurement
uncertainty
1.0 dB 27
Relative level uncertainty see R&S®FSW data sheet:
display nonlinearity
see R&S®FSVA3000/FSVA
data sheet: nonlinearity of
displayed level
see R&S®FSV3000/FSV data
sheet: display nonlinearity
see R&S®FPS data sheet:
display nonlinearity
0.7 dB 28
Power versus time, for all modulations 25
R&S®FSW R&S®FSVA3000/R&S®FSVA R&S®FSV3000/R&S®FSV 22 R&S®FPS AUME 23
Absolute level uncertainty see R&S®FSW data sheet:
total measurement
uncertainty, YIG preselector
off
see R&S®FSVA3000/FSVA
data sheet: total measurement
uncertainty
see R&S®FSV3000/FSV data
sheet: total measurement
uncertainty
see R&S®FPS data sheet:
total measurement
uncertainty
1.0 dB
Dynamic range (PvT filter = 1 MHz)
average detector > 76 dB > 64 dB > 67 dB > 66 dB
peak hold detector > 71 dB > 62 dB > 62 dB > 64 dB
27 For static power step = 0. 28 For power steps other than 0.
Version 04.00, June 2019
18 Rohde & Schwarz GSM Measurements
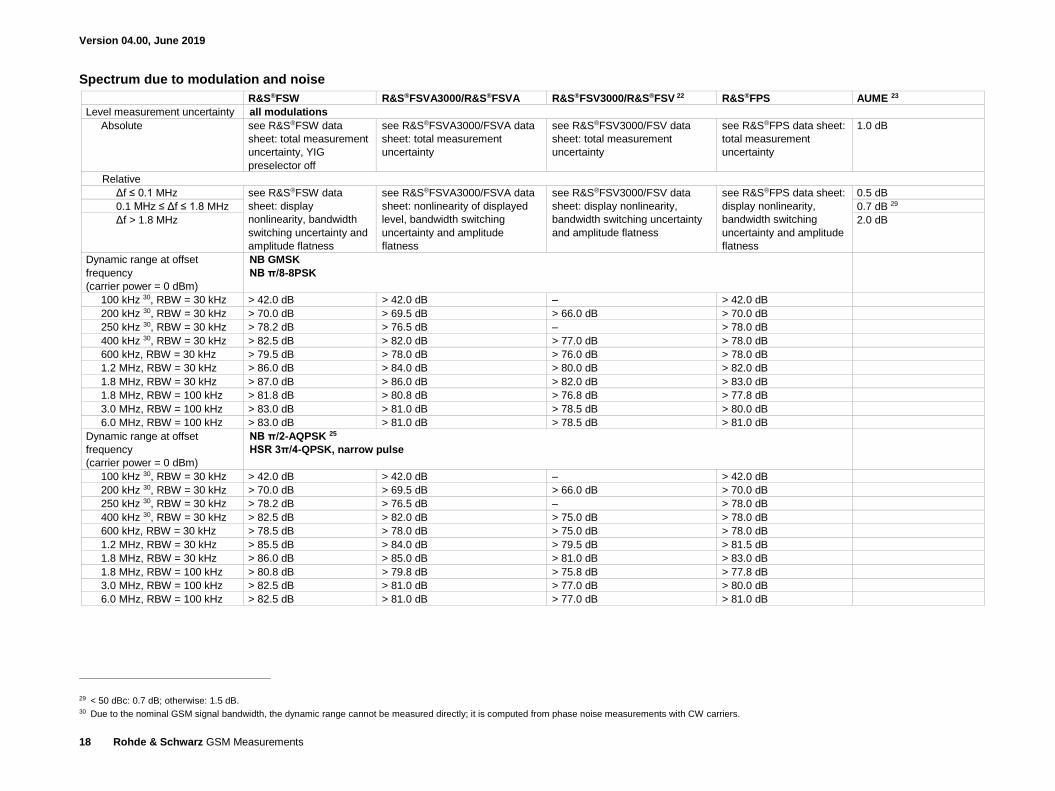
Spectrum due to modulation and noise
R&S®FSW R&S®FSVA3000/R&S®FSVA R&S®FSV3000/R&S®FSV 22 R&S®FPS AUME 23
Level measurement uncertainty all modulations
Absolute see R&S®FSW data
sheet: total measurement
uncertainty, YIG
preselector off
see R&S®FSVA3000/FSVA data
sheet: total measurement
uncertainty
see R&S®FSV3000/FSV data
sheet: total measurement
uncertainty
see R&S®FPS data sheet:
total measurement
uncertainty
1.0 dB
Relative
Δf ≤ 0.1 MHz see R&S®FSW data
sheet: display
nonlinearity, bandwidth
switching uncertainty and
amplitude flatness
see R&S®FSVA3000/FSVA data
sheet: nonlinearity of displayed
level, bandwidth switching
uncertainty and amplitude
flatness
see R&S®FSV3000/FSV data
sheet: display nonlinearity,
bandwidth switching uncertainty
and amplitude flatness
see R&S®FPS data sheet:
display nonlinearity,
bandwidth switching
uncertainty and amplitude
flatness
0.5 dB
0.1 MHz ≤ Δf ≤ 1.8 MHz 0.7 dB 29
Δf > 1.8 MHz 2.0 dB
Dynamic range at offset
frequency
(carrier power = 0 dBm)
NB GMSK
NB π/8-8PSK
100 kHz 30, RBW = 30 kHz > 42.0 dB > 42.0 dB – > 42.0 dB
200 kHz 30, RBW = 30 kHz > 70.0 dB > 69.5 dB > 66.0 dB > 70.0 dB
250 kHz 30, RBW = 30 kHz > 78.2 dB > 76.5 dB – > 78.0 dB
400 kHz 30, RBW = 30 kHz > 82.5 dB > 82.0 dB > 77.0 dB > 78.0 dB
600 kHz, RBW = 30 kHz > 79.5 dB > 78.0 dB > 76.0 dB > 78.0 dB
1.2 MHz, RBW = 30 kHz > 86.0 dB > 84.0 dB > 80.0 dB > 82.0 dB
1.8 MHz, RBW = 30 kHz > 87.0 dB > 86.0 dB > 82.0 dB > 83.0 dB
1.8 MHz, RBW = 100 kHz > 81.8 dB > 80.8 dB > 76.8 dB > 77.8 dB
3.0 MHz, RBW = 100 kHz > 83.0 dB > 81.0 dB > 78.5 dB > 80.0 dB
6.0 MHz, RBW = 100 kHz > 83.0 dB > 81.0 dB > 78.5 dB > 81.0 dB
Dynamic range at offset
frequency
(carrier power = 0 dBm)
NB π/2-AQPSK 25
HSR 3π/4-QPSK, narrow pulse
100 kHz 30, RBW = 30 kHz > 42.0 dB > 42.0 dB – > 42.0 dB
200 kHz 30, RBW = 30 kHz > 70.0 dB > 69.5 dB > 66.0 dB > 70.0 dB
250 kHz 30, RBW = 30 kHz > 78.2 dB > 76.5 dB – > 78.0 dB
400 kHz 30, RBW = 30 kHz > 82.5 dB > 82.0 dB > 75.0 dB > 78.0 dB
600 kHz, RBW = 30 kHz > 78.5 dB > 78.0 dB > 75.0 dB > 78.0 dB
1.2 MHz, RBW = 30 kHz > 85.5 dB > 84.0 dB > 79.5 dB > 81.5 dB
1.8 MHz, RBW = 30 kHz > 86.0 dB > 85.0 dB > 81.0 dB > 83.0 dB
1.8 MHz, RBW = 100 kHz > 80.8 dB > 79.8 dB > 75.8 dB > 77.8 dB
3.0 MHz, RBW = 100 kHz > 82.5 dB > 81.0 dB > 77.0 dB > 80.0 dB
6.0 MHz, RBW = 100 kHz > 82.5 dB > 81.0 dB > 77.0 dB > 81.0 dB
29 < 50 dBc: 0.7 dB; otherwise: 1.5 dB. 30 Due to the nominal GSM signal bandwidth, the dynamic range cannot be measured directly; it is computed from phase noise measurements with CW carriers.

Version 04.00, June 2019
Rohde & Schwarz GSM Measurements 19
R&S®FSW R&S®FSVA3000/R&S®FSVA R&S®FSV3000/R&S®FSV 22 R&S®FPS AUME 23
Dynamic range at offset
frequency
(carrier power = 0 dBm)
NB π/4-16QAM
NB –π/4-32QAM
HSR π/4-16QAM, narrow pulse
HSR –π/4-32QAM, narrow pulse
100 kHz 30, RBW = 30 kHz > 42.0 dB > 42.0 dB – > 42.0 dB
200 kHz 30, RBW = 30 kHz > 70.0 dB > 69.5 dB > 66.0 dB > 70.0 dB
250 kHz 30, RBW = 30 kHz > 78.2 dB > 76.5 dB – > 78.0 dB
400 kHz 30, RBW = 30 kHz > 82.5 dB > 82.0 dB > 74.5 dB > 78.0 dB
600 kHz, RBW = 30 kHz > 78.5 dB > 78.0 dB > 74.5 dB > 78.0 dB
1.2 MHz, RBW = 30 kHz > 82.5 dB > 82.0 dB > 77.0 dB > 80.0 dB
1.8 MHz, RBW = 30 kHz > 84.0 dB > 84.0 dB > 78.5 dB > 81.2 dB
1.8 MHz, RBW = 100 kHz > 78.8 dB > 78.8 dB > 73.3 dB > 76.0 dB
3.0 MHz, RBW = 100 kHz > 79.5 dB > 79.0 dB > 74.5 dB > 77.0 dB
6.0 MHz, RBW = 100 kHz > 79.5 dB > 79.0 dB > 75.5 dB > 78.0 dB
Dynamic range at offset
frequency,
(carrier power = 0 dBm)
HSR 3π/4-QPSK, wide pulse
HSR π/4-16QAM, wide pulse
HSR –π/4-32QAM, wide pulse
100 kHz 30, RBW = 30 kHz > 42.0 dB > 42.0 dB – > 42.0 dB
200 kHz 30, RBW = 30 kHz > 70.0 dB > 69.5 dB > 66.0 dB > 70.0 dB
250 kHz 30, RBW = 30 kHz > 78.2 dB > 76.5 dB – > 78.0 dB
400 kHz 30, RBW = 30 kHz > 82.5 dB > 82.0 dB > 72.0 dB > 78.0 dB
600 kHz, RBW = 30 kHz > 74.0 dB > 73.0 dB > 72.0 dB > 73.0 dB
1.2 MHz, RBW = 30 kHz > 79.5 dB > 78.0 dB > 76.0 dB > 77.0 dB
1.8 MHz, RBW = 30 kHz > 82.5 dB > 81.0 dB > 78.0 dB > 80.2 dB
1.8 MHz, RBW = 100 kHz > 77.3 dB > 75.8 dB > 72.8 dB > 75.0 dB
3.0 MHz, RBW = 100 kHz > 78.5 dB > 78.0 dB > 73.5 dB > 76.0 dB
6.0 MHz, RBW = 100 kHz > 78.5 dB > 78.0 dB > 74.0 dB > 77.0 dB
Version 04.00, June 2019
20 Rohde & Schwarz GSM Measurements
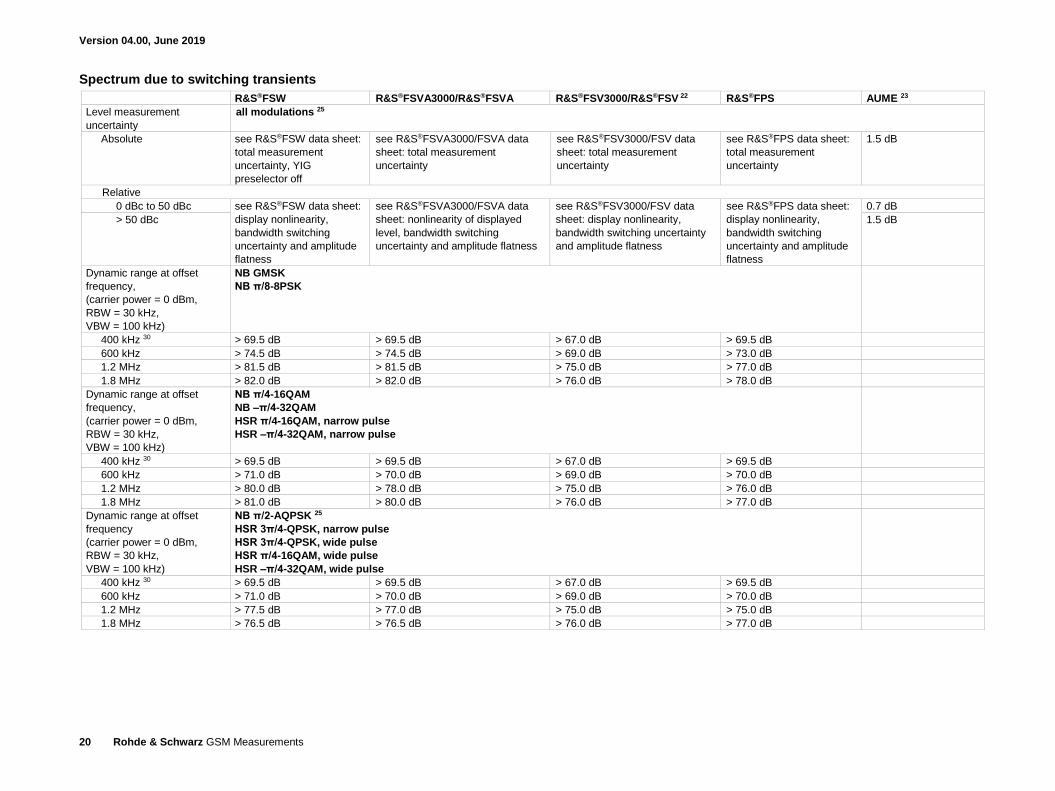
Spectrum due to switching transients
R&S®FSW R&S®FSVA3000/R&S®FSVA R&S®FSV3000/R&S®FSV 22 R&S®FPS AUME 23
Level measurement
uncertainty
all modulations 25
Absolute see R&S®FSW data sheet:
total measurement
uncertainty, YIG
preselector off
see R&S®FSVA3000/FSVA data
sheet: total measurement
uncertainty
see R&S®FSV3000/FSV data
sheet: total measurement
uncertainty
see R&S®FPS data sheet:
total measurement
uncertainty
1.5 dB
Relative
0 dBc to 50 dBc see R&S®FSW data sheet:
display nonlinearity,
bandwidth switching
uncertainty and amplitude
flatness
see R&S®FSVA3000/FSVA data
sheet: nonlinearity of displayed
level, bandwidth switching
uncertainty and amplitude flatness
see R&S®FSV3000/FSV data
sheet: display nonlinearity,
bandwidth switching uncertainty
and amplitude flatness
see R&S®FPS data sheet:
display nonlinearity,
bandwidth switching
uncertainty and amplitude
flatness
0.7 dB
> 50 dBc 1.5 dB
Dynamic range at offset
frequency,
(carrier power = 0 dBm,
RBW = 30 kHz,
VBW = 100 kHz)
NB GMSK
NB π/8-8PSK
400 kHz 30 > 69.5 dB > 69.5 dB > 67.0 dB > 69.5 dB
600 kHz > 74.5 dB > 74.5 dB > 69.0 dB > 73.0 dB
1.2 MHz > 81.5 dB > 81.5 dB > 75.0 dB > 77.0 dB
1.8 MHz > 82.0 dB > 82.0 dB > 76.0 dB > 78.0 dB
Dynamic range at offset
frequency,
(carrier power = 0 dBm,
RBW = 30 kHz,
VBW = 100 kHz)
NB π/4-16QAM
NB –π/4-32QAM
HSR π/4-16QAM, narrow pulse
HSR –π/4-32QAM, narrow pulse
400 kHz 30 > 69.5 dB > 69.5 dB > 67.0 dB > 69.5 dB
600 kHz > 71.0 dB > 70.0 dB > 69.0 dB > 70.0 dB
1.2 MHz > 80.0 dB > 78.0 dB > 75.0 dB > 76.0 dB
1.8 MHz > 81.0 dB > 80.0 dB > 76.0 dB > 77.0 dB
Dynamic range at offset
frequency
(carrier power = 0 dBm,
RBW = 30 kHz,
VBW = 100 kHz)
NB π/2-AQPSK 25
HSR 3π/4-QPSK, narrow pulse
HSR 3π/4-QPSK, wide pulse
HSR π/4-16QAM, wide pulse
HSR –π/4-32QAM, wide pulse
400 kHz 30 > 69.5 dB > 69.5 dB > 67.0 dB > 69.5 dB
600 kHz > 71.0 dB > 70.0 dB > 69.0 dB > 70.0 dB
1.2 MHz > 77.5 dB > 77.0 dB > 75.0 dB > 75.0 dB
1.8 MHz > 76.5 dB > 76.5 dB > 76.0 dB > 77.0 dB

Version 04.00, June 2019
Rohde & Schwarz GSM Measurements 21
Ordering information Designation Type Order No.
GSM measurements
GSM/EDGE/EDGE Evolution/VAMOS measurements R&S®FSW-K10 1313.1368.02
Analysis of GSM, EDGE and EDGE Evolution signals R&S®FSV3-K10 1330.5039.02
Analysis of GSM, EDGE and EDGE Evolution signals R&S®FSV-K10 1310.8055.02
GSM/EDGE/EDGE Evolution/VAMOS measurements R&S®FPS-K10 1321.4091.02
GSM measurements 31 R&S®VSE-K10 1313.1368.06
Signal and spectrum analyzers
R&S®FSW
Spectrum and signal analyzer, 2 Hz to 8 GHz R&S®FSW8 1331.5003.08
Spectrum and signal analyzer, 2 Hz to 13.6 GHz R&S®FSW13 1331.5003.13
Spectrum and signal analyzer, 2 Hz to 26.5 GHz R&S®FSW26 1331.5003.26
R&S®FSVA3000, R&S®FSV3000
Signal and spectrum analyzer, 10 Hz to 4 GHz R&S®FSVA3004 1330.5000.05
Signal and spectrum analyzer, 10 Hz to 7.5 GHz R&S®FSVA3007 1330.5000.08
Signal and spectrum analyzer, 10 Hz to 13.6 GHz R&S®FSVA3013 1330.5000.14
Signal and spectrum analyzer, 10 Hz to 4 GHz R&S®FSV3004 1330.5000.04
Signal and spectrum analyzer, 10 Hz to 7.5 GHz R&S®FSV3007 1330.5000.07
Signal and spectrum analyzer, 10 Hz to 13.6 GHz R&S®FSV3013 1330.5000.13
R&S®FSVA, R&S®FSV
Signal and spectrum analyzer, 10 Hz to 4 GHz R&S®FSVA4 1321.3008.05
Signal and spectrum analyzer, 10 Hz to 7 GHz R&S®FSVA7 1321.3008.08
Signal and spectrum analyzer, 10 Hz to 13.6 GHz R&S®FSVA13 1321.3008.14
Signal and spectrum analyzer, 10 Hz to 4 GHz R&S®FSV4 1321.3008.04
Signal and spectrum analyzer, 10 Hz to 7 GHz R&S®FSV7 1321.3008.07
Signal and spectrum analyzer, 10 Hz to 13.6 GHz R&S®FSV13 1321.3008.13
Signal and spectrum analyzer, 10 Hz to 30 GHz R&S®FSV30 1321.3008.30
R&S®FPS
Signal and spectrum analyzer, 9 kHz to 4 GHz R&S®FPS4 1319.2008.04
Signal and spectrum analyzer, 9 kHz to 7 GHz R&S®FPS7 1319.2008.07
Signal and spectrum analyzer, 9 kHz to 13.6 GHz R&S®FPS13 1319.2008.13
Signal and spectrum analyzer, 9 kHz to 30 GHz R&S®FPS30 1319.2008.30
Vector signal explorer
R&S®VSE basic edition R&S®VSE 1345.1011.06
R&S®VSE enterprise edition R&S®VSE Enterprise Edition 1345.1105.06
R&S®VSE software maintenance R&S®VSE-SWM 1320.7622.81
License dongle R&S®FSPC 1310.0090.03
31 Requires R&S®VSE and R&S®FSPC.
Version 04.00, June 2019
22 Rohde & Schwarz GSM Measurements
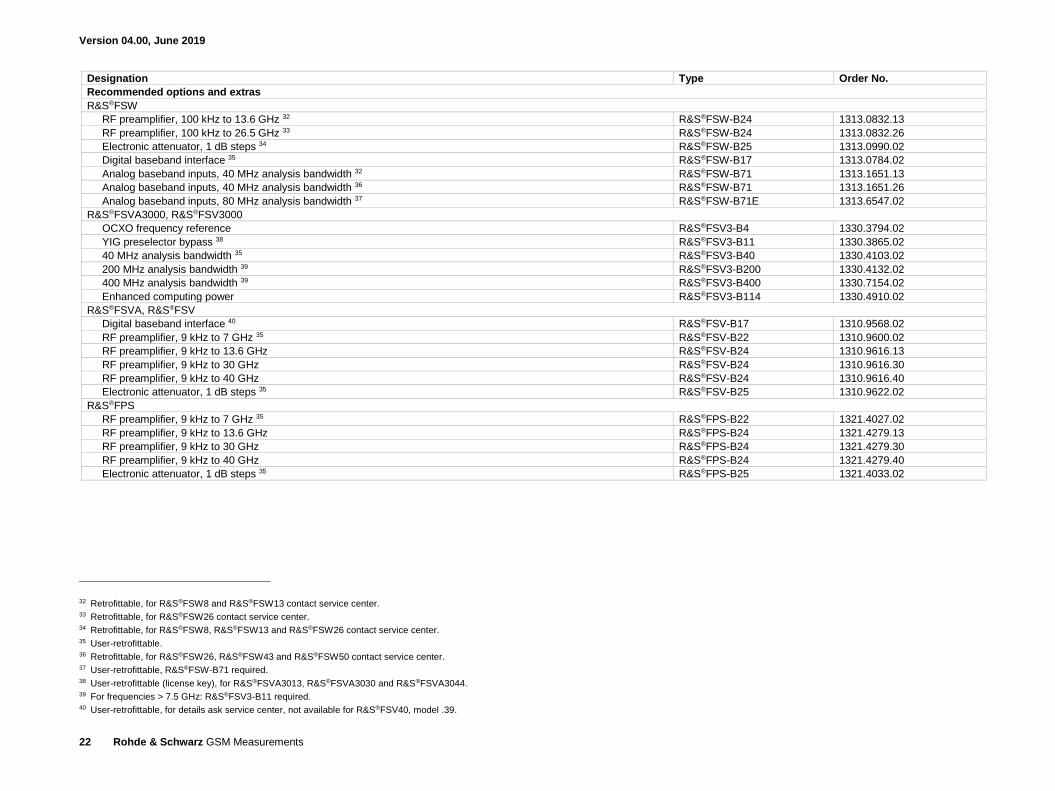
Designation Type Order No.
Recommended options and extras
R&S®FSW
RF preamplifier, 100 kHz to 13.6 GHz 32 R&S®FSW-B24 1313.0832.13
RF preamplifier, 100 kHz to 26.5 GHz 33 R&S®FSW-B24 1313.0832.26
Electronic attenuator, 1 dB steps 34 R&S®FSW-B25 1313.0990.02
Digital baseband interface 35 R&S®FSW-B17 1313.0784.02
Analog baseband inputs, 40 MHz analysis bandwidth 32 R&S®FSW-B71 1313.1651.13
Analog baseband inputs, 40 MHz analysis bandwidth 36 R&S®FSW-B71 1313.1651.26
Analog baseband inputs, 80 MHz analysis bandwidth 37 R&S®FSW-B71E 1313.6547.02
R&S®FSVA3000, R&S®FSV3000
OCXO frequency reference R&S®FSV3-B4 1330.3794.02
YIG preselector bypass 38 R&S®FSV3-B11 1330.3865.02
40 MHz analysis bandwidth 35 R&S®FSV3-B40 1330.4103.02
200 MHz analysis bandwidth 39 R&S®FSV3-B200 1330.4132.02
400 MHz analysis bandwidth 39 R&S®FSV3-B400 1330.7154.02
Enhanced computing power R&S®FSV3-B114 1330.4910.02
R&S®FSVA, R&S®FSV
Digital baseband interface 40 R&S®FSV-B17 1310.9568.02
RF preamplifier, 9 kHz to 7 GHz 35 R&S®FSV-B22 1310.9600.02
RF preamplifier, 9 kHz to 13.6 GHz R&S®FSV-B24 1310.9616.13
RF preamplifier, 9 kHz to 30 GHz R&S®FSV-B24 1310.9616.30
RF preamplifier, 9 kHz to 40 GHz R&S®FSV-B24 1310.9616.40
Electronic attenuator, 1 dB steps 35 R&S®FSV-B25 1310.9622.02
R&S®FPS
RF preamplifier, 9 kHz to 7 GHz 35 R&S®FPS-B22 1321.4027.02
RF preamplifier, 9 kHz to 13.6 GHz R&S®FPS-B24 1321.4279.13
RF preamplifier, 9 kHz to 30 GHz R&S®FPS-B24 1321.4279.30
RF preamplifier, 9 kHz to 40 GHz R&S®FPS-B24 1321.4279.40
Electronic attenuator, 1 dB steps 35 R&S®FPS-B25 1321.4033.02
32 Retrofittable, for R&S®FSW8 and R&S®FSW13 contact service center. 33 Retrofittable, for R&S®FSW26 contact service center. 34 Retrofittable, for R&S®FSW8, R&S®FSW13 and R&S®FSW26 contact service center. 35 User-retrofittable. 36 Retrofittable, for R&S®FSW26, R&S®FSW43 and R&S®FSW50 contact service center. 37 User-retrofittable, R&S®FSW-B71 required. 38 User-retrofittable (license key), for R&S®FSVA3013, R&S®FSVA3030 and R&S®FSVA3044. 39 For frequencies > 7.5 GHz: R&S®FSV3-B11 required. 40 User-retrofittable, for details ask service center, not available for R&S®FSV40, model .39.
Version 04.00, June 2019
Rohde & Schwarz GSM Measurements 23
3607
.272
6.22
04.
00 P
DP
1 e
n
R&S® is a registered trademark of Rohde & Schwarz GmbH & Co. KG
PD 3607.2726.22 | Version 04.00 | June 2019 (jr)
Trade names are trademarks of the owners
GSM Measurements
Data without tolerance limits is not binding | Subject to change
© 2016 - 2019 Rohde & Schwarz GmbH & Co. KG | 81671 Munich, Germany
Service that adds value❙ Worldwide ❙ Local and personalized❙ Customized and flexible❙ Uncompromising quality ❙ Long-term dependability
Regional contact ❙ Europe, Africa, Middle East | +49 89 4129 12345 [email protected]
❙ North America | 1 888 TEST RSA (1 888 837 87 72) [email protected]
❙ Latin America | +1 410 910 79 88 [email protected]
❙ Asia Pacific | +65 65 13 04 88 [email protected]
❙ China | +86 800 810 82 28 | +86 400 650 58 96 [email protected]
Rohde & Schwarz GmbH & Co. KGwww.rohde-schwarz.com
Rohde & SchwarzThe Rohde & Schwarz electronics group offers innovative solutions in the following business fields: test and mea-surement, broadcast and media, secure communications, cybersecurity, monitoring and network testing. Founded more than 80 years ago, the independent company which is headquartered in Munich, Germany, has an extensive sales and service network with locations in more than 70 countries.
Sustainable product design ❙ Environmental compatibility and eco-footprint ❙ Energy efficiency and low emissions ❙ Longevity and optimized total cost of ownership
Certified Environmental Management
ISO 14001Certified Quality Management
ISO 9001
3607272622
VSE-FSx-K10_dat-sw_en_3607-2726-22_v0400_cover.indd 2 18.06.2019 11:00:25