Embed Size (px)
Citation preview
Guidance on cost-benefit analysis for fire precautions in schools A report Prepared for: Department for Education & Skills 15 February 2007
Client report number 226-023
1 Guidance on cost benefit analysis
BRE Fire and Security Client report number 226-023
© BRE Certification Ltd 2007
Printed on environmentally friendly paper
BRE Fire and Security BRE Certification Ltd
Garston WD25 9XX
T + 44 (0) 1923 664100 F + 44 (0) 1923 664994
E [email protected] www.bre.co.uk
This report is made on behalf of BRE Fire and Security. By receiving the report and acting on it, the client - or any third party relying on it - accepts that no individual is personally liable in contract, tort or breach of statutory duty (including negligence).
2 Guidance on cost benefit analysis
BRE Fire and Security Client report number 226-023
© BRE Certification Ltd 2007
Printed on environmentally friendly paper
Foreword
This Cost Benefit Analysis Tool is intended for designers, architects, fire safety engineers or others who wish to assess the likely benefits in fitting sprinklers (or other fire safety measures, in their proposed school building).
The user-selected data values shown in the current version are based on information available to BRE at the time of writing or are examples provided for illustration purposes only. The user should select the appropriate values for their specific project, or satisfy themselves that the current values are appropriate.
If there is more than one building, the tool should be applied to each independently, although any savings (e.g. a common inspection and maintenance program for the whole site) should be accounted for.
Disclaimer of Warranty and Limitation of Liability
BRE gives no warranties and makes no representations that any of the Software will be suitable for any particular purpose or for use under any specific conditions even if BRE is aware of the purpose or conditions. BRE accepts no responsibility for any mathematical or technical limitations of the Software. The User will be wholly responsible for the use to which the Software is put, except to the extent that losses occur as a result of negligence on the part of BRE. In no circumstances will BRE be under any liability for consequential losses of any nature.
It is the User's responsibility to ensure that all input data values are appropriate for a particular application. If this tool is being used for risk assessments to satisfy the UK Regulatory Reform (Fire Safety) Order, for example, then the data should stand up to external scrutiny.
BRE accepts no liability for the misuse of the tool (including inappropriate use of data values, which may only exist to demonstrate the working of the tool).
This report and the accompanying spread-sheet tool are made on behalf of BRE Fire and Security. By receiving the report and tool and acting on both or either, the client - or any third party relying on it - accepts that no individual is personally liable in contract, tort or breach of statutory duty (including negligence).
Limitation of the tool
The probability that all the systems, modelled in the tool, fail to prevent a scenario developing (or reduce its consequences) is given by the product of all the individual probabilities. In other words, all the systems are assumed to act independently - which may not actually be the case in reality. The model is not sophisticated enough to handle conditional probabilities.
3 Guidance on cost benefit analysis
BRE Fire and Security Client report number 226-023
© BRE Certification Ltd 2007
Printed on environmentally friendly paper
Contents
1 Introduction 4 2 User’s Guide 6 3 Description of the spreadsheet tool worksheets 10 4 Mathematical basis to the spreadsheet tool 35 5 Different measures of risk 45 6 Risk scenarios: assumptions and data 48 7 Fire prevention & mitigation systems: assumptions and data 68 8 Extending the spreadsheet tool 82
4 Guidance on cost benefit analysis
BRE Fire and Security Client report number 226-023
© BRE Certification Ltd 2007
Printed on environmentally friendly paper
1 Introduction
This is the report for the Department for Education and Skills, Schools Building and Design Unit, project titled “Cost benefit analysis of sprinklers in schools” carried out by BRE. This report gives the information required in order to operate a spreadsheet-based cost-benefit analysis tool produced by the above project.
The proposed new DfES guide [BB100] “Designing and Managing against the risk of fire in Schools” makes the following reference to sprinklers (inter alia):
“Where the risk assessment highlights the fact that an ignition is probable, possibly as a result of location, the existence of certain processes or other socio-economic factors, then the fitting of automatic fire suppression systems will need serious consideration”.
This project is intended to assist in this process of risk assessment, and cost-benefit analysis by providing some helpful tools. This document describes the cost-benefit analysis tool.
The cost benefit analysis tool has been developed to assist in the decision whether to fit automatic sprinkler installations to new or existing school buildings. The tool is spreadsheet (Microsoft Excel) based. Methodologies from an existing BRE cost/benefit tool have been used in agreement with DfES to incorporate the required fields, revised field weightings, sensitivity analyses and a customised user interface.
The reasons for developing the tool in Microsoft Excel were:
• most users will already be familiar with this package
• the workings of the tool are transparent (just click on a cell to see the formula it contains), and
• the tool will be very flexible because a user can extend and / or customise it to suit their particular needs.
The drawback is that the tool is rather daunting at first sight. However, by following the simple instructions (“Getting Started”, Section 2) it is possible to start using the tool before acquiring familiarity with all the details. Nevertheless the user must be aware that they have ultimate responsibility for ensuring that the data values they choose are appropriate for their particular project. It may be necessary to seek specialist advice.
The tool is intended to cover the range of specific defined building types representing the variety of planned school building types and building procurement processes.
The definition of risk used here is
• Risk = “expected (or average) loss”
or, mathematically
• Risk = {frequency of hazard occurring} x {consequence of hazard}
5 Guidance on cost benefit analysis
BRE Fire and Security Client report number 226-023
© BRE Certification Ltd 2007
Printed on environmentally friendly paper
Refer to Section 4 for further details.
Introduction to this user guide
The detailed information on the tool is given in the following Sections, as follows:
Section 2 – User’s Guide. This is the user’s guide to the Cost-benefit Tool
Section 3 – Description of the spreadsheet tool worksheets. This provides further information to support the user’s guide to the Cost-benefit Tool.
Section 4 – Mathematical basis to the spreadsheet tool. This describes the theoretical basis behind the Cost-benefit Tool.
Section 5 – Different measures of risk. This describes each of the measures (e.g. deaths, injuries, building damage etc) and monetary conversion factors.
Section 6 – Risk scenarios: assumptions and data. This provides detailed information on default values and sources of data.
Section 7 – Fire prevention and mitigation systems: assumptions and data. This provides detailed information on default values and sources of data.
Section 8 – Extending the spreadsheet tool. This provides outline instructions for adding further risk measures, further risk scenarios, and further protection systems.
6 Guidance on cost benefit analysis
BRE Fire and Security Client report number 226-023
© BRE Certification Ltd 2007
Printed on environmentally friendly paper
2 User’s Guide
Introduction
This Cost Benefit Analysis Tool is intended for designers, architects, fire safety engineers or others who wish to assess the likely benefits in fitting sprinklers (or other fire safety measures, in their proposed school building. If there is more than one building, the tool should be applied to each independently, although any savings (e.g. a common inspection and maintenance program for the whole site) should be accounted for.
This User’s Guide is intended for both the new user of the Tool, and for experienced users.
The key element in the use of the Tool is the input data; often these will be hard to come by and so “default” data is provided, based on current or best estimates.
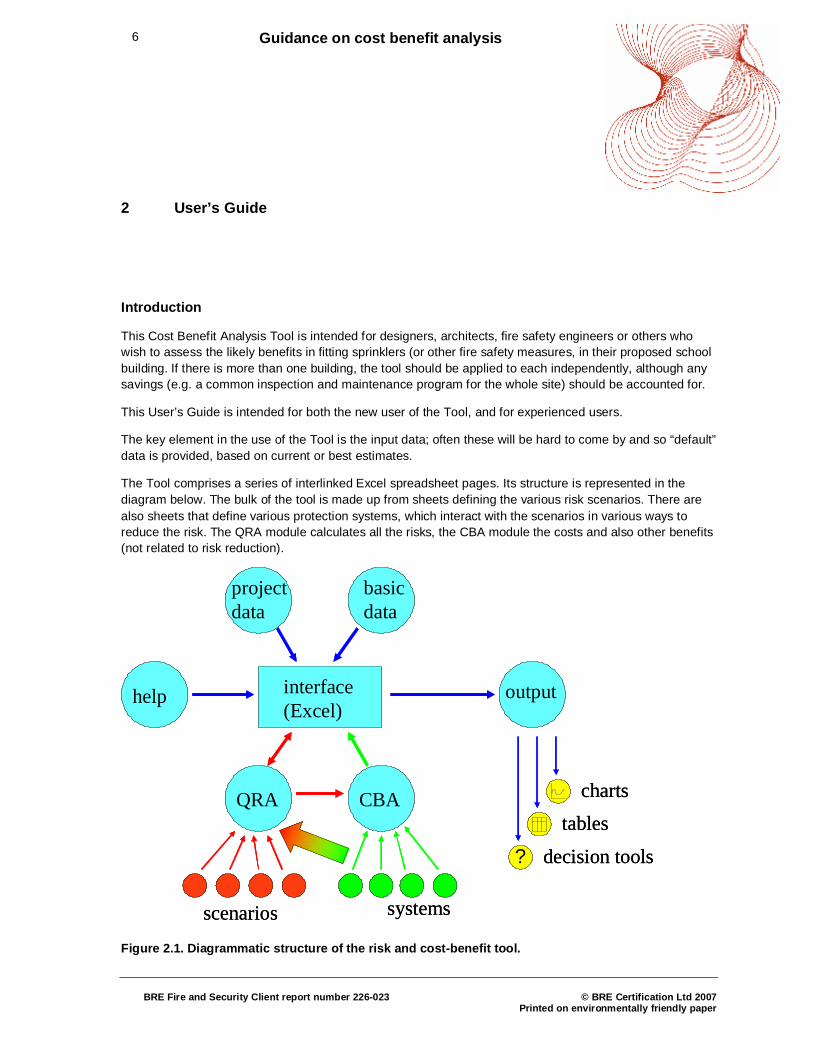
The Tool comprises a series of interlinked Excel spreadsheet pages. Its structure is represented in the diagram below. The bulk of the tool is made up from sheets defining the various risk scenarios. There are also sheets that define various protection systems, which interact with the scenarios in various ways to reduce the risk. The QRA module calculates all the risks, the CBA module the costs and also other benefits (not related to risk reduction).
interface (Excel)
QRA CBA
scenarios systems
help output
?
chartstables
decision tools
project data
basic data
interface (Excel)
QRA CBA
scenarios systems
help output
?
chartstables
decision tools
project data
basic data
Figure 2.1. Diagrammatic structure of the risk and cost-benefit tool.
7 Guidance on cost benefit analysis
BRE Fire and Security Client report number 226-023
© BRE Certification Ltd 2007
Printed on environmentally friendly paper
This spreadsheet tool allows you to look at the effects of various combinations of prevention and mitigation systems on various fire scenarios. It calculates
i) the risk, converted to monetary terms, before and after the package of systems is in place
ii) the cost of supplying the package of systems
iii) the net difference between the benefit (i.e. reduced risk) and cost, and the probability (confidence level) that this net difference is +ve.
This tool contains the following types of sheets:
i) Instructions for use – enough for getting started. For more detailed instructions, refer to this manual.
ii) Cost Summary and CBA - summary of costs, benefits, and confidence level that net benefit is positive. Allows different system packages to be set up easily
iii) Project Data - fundamental data about the school, e.g. how many rooms of different types, etc.
iv) Basic Data - "constants" such as the monetary conversion factors for different consequences.
v) Risk Summary sheets - allow easy comparison of risks from different scenarios; provide data for charts.
vi) Charts - visual representation of risk magnitudes.
vii) System ~ <system name> - one sheet of data (mainly concerned with costs) for each prevention or mitigation system.
viii) Risk ~ <location> - one sheet of data for each room type: probabilities of different fire sizes, impacts of different systems on each transition probability, and summarised monetary risks.
ix) Loss ~ <location (severity)> - one sheet of data for each risk scenario: consequences, impacts of different systems on each consequence, and conversion of consequences to monetary terms.
These sheets are described in detail in the next Section.
In the current version of the tool, there are seven different room types that define the building (classroom, cloakroom, corridor, laboratory, main hall, office, store room) with four levels of fire severity: minor, serious, major and catastrophic. There are six different measures of risk (deaths, injuries, building damage, contents damage, business interruption and environmental damage) which are combined together to provide an overall value. There are three protection systems defined (sprinklers, CCTV, and automatic fire detection).
It is possible to add more room types, more risk measures, and more protection systems, although in each case this is quite an involved process, and best left to people who are comfortable with editing formulae in Excel, as well as having some experience in using the tool in its existing format. See Section 8 for more guidance in extending the tool.
8 Guidance on cost benefit analysis
BRE Fire and Security Client report number 226-023
© BRE Certification Ltd 2007
Printed on environmentally friendly paper
Method
The Cost Benefit Analysis Tool uses standard EXCEL spreadsheet methodology; you will need to work through the spread sheet and input the necessary relevant information regarding your school design. As mentioned above, some of your input data will be specific to your building (or, indeed, define it). Other information may need to be estimated, or you may wish to use the “default” values provided. It is the user’s responsibility to ensure that the data values are appropriate to a particular project.
Getting started:
1. Save a backup copy of this spreadsheet now, and also at intervals as you work.
2. Start by entering the data required on the "Project Data" sheet
3. Try different combinations of systems (toggle on/off via the “Cost Summary and CBA” sheet), to see which package gives the highest confidence level of a positive net benefit.
4. You may also need to edit the "Basic Data" sheet, particularly for the monetary impact of each day the school is closed
5. Try varying the system costs in the “System ~ <system name>” sheets, either directly, or indirectly by varying the rooms where the system is fitted.
The following conventions apply:
1. Red values: These are fixed values, or calculated values, which should not be changed by the user.
2. Black values: These are input values which you need to determine for your individual project. In most cases, default values have been inserted here.
3. Black values on yellow background: These are key input values, which will be project-specific, and therefore the user should enter his own values rather than use defaults.
4. “User workspace below this line”: The layout above this line is fixed, so values above this line may have links to other pages of the workbook (above their user workspaces) with full confidence that the linked values are the correct ones. The user workspace is for supplementary calculations or data input; the layout is determined by the user’s needs (although we have provided some suggestions in many of the sheets, particularly the loss and risk calculations). If there are links to other sheets, the onus is on the user to ensure these are to the correct cells.
Most, but not all, values have inaccuracy (in %) and uncertainty. See Section 4 for definitions of these concepts. You will need to estimate some of these values.
Help on use is provided by the embedded comments. Use EXCEL's "Tools|Options|View" menu to decide whether you want to see:
i) all the comments (useful to see where they all are, but may get rather cluttered)
9 Guidance on cost benefit analysis
BRE Fire and Security Client report number 226-023
© BRE Certification Ltd 2007
Printed on environmentally friendly paper
ii) just the comment indicators (red triangle in top RH corner of spreadsheet cell) - displays the
comment when cursor moves over the indicated cell
iii) neither comments nor indicators (NB. you can always use the menu again to change the display options)
Disclaimers
It is the user's responsibility to ensure that all input data values are appropriate for a particular application. If this tool is being used for risk assessments to satisfy the UK Regulatory Reform (Fire Safety) Order, for example, then the data should stand up to external scrutiny.
BRE accepts no liability for the misuse of the tool (including inappropriate use of data values, which may only exist to demonstrate the working of the tool)
Limitation of the tool
The probability that all the systems, modelled in the tool, fail to prevent a scenario (or reduce its consequences) is given by the product of all the individual probabilities. In other words, all the systems are assumed to act independently - which may not actually be the case in reality. The model is not sophisticated enough to handle conditional probabilities.
10 Guidance on cost benefit analysis
BRE Fire and Security Client report number 226-023
© BRE Certification Ltd 2007
Printed on environmentally friendly paper
3 Description of the spreadsheet tool worksheets
The Excel workbook contains the following worksheets:
• Instructions for use Risk ~ corridor • Costs and CBA Loss ~ corridor (1) • Risk Summary Loss ~ corridor (2) • Risk Summary (2) Loss ~ corridor (3) • Chart ~ risk vs location Risk ~ lab • Chart ~ risk contributions Loss ~ lab (1) • Basic Data Loss ~ lab (2) • Project Data Loss ~ lab (3) • System ~ sprinkler Risk ~ main hall System ~ CCTV Loss ~ main hall (1) System ~ detection Loss ~ main hall (2) • Risk ~ classroom Loss ~ main hall (3) • Loss ~ classroom (1) Risk ~ office Loss ~ classroom (2) Loss ~ office (1) Loss ~ classroom (3) Loss ~ office (2) Risk ~ cloakroom Loss ~ office (3) Loss ~ cloakroom (1) Risk ~ store Loss ~ cloakroom (2) Loss ~ store (1) Loss ~ cloakroom (3) Loss ~ store (2) Loss ~ store (3) Loss ~ catastrophic Since many of the sheets have a similar format, only one example of each will be described. Those that are covered in this Section are indicated by a black spot in the left-hand column of the table above.
11 Guidance on cost benefit analysis
BRE Fire and Security Client report number 226-023
© BRE Certification Ltd 2007
Printed on environmentally friendly paper
Instructions for Use
AAA
Figure 3.1. Screen shot of the “Instructions” sheet
A. this sheet gives simple instructions on how to get started with the tool. For more detailed instructions, refer to the user guide and also the description of the spreadsheets in this Section.
12 Guidance on cost benefit analysis
BRE Fire and Security Client report number 226-023
© BRE Certification Ltd 2007
Printed on environmentally friendly paper
Costs and CBA
A CB
DE
AA CCBB
DDEE
Figure 3.2. Screen shot of the “Cost Summary and CBA” sheet
This page provides you with your primary outputs from the analysis.
Do not alter the cells with Red Values.
Difference (benefits-costs) is the “benefit” from your selected safety systems. For there to be a benefit this value must be positive. The uncertainty needs to be much smaller than the cost.
Confidence: pr(=ve difference) This value should approach 100%.
In order to review the contribution of the measures you have selected you can switch them on and off using availability; 0 is off, 1 is on.
A. This area allows the user to easily investigate the effects of different permutations of systems. The systems can be added or removed from the package by typing “1” or “0” (zero) respectively, under the “availability” heading.
13 Guidance on cost benefit analysis
BRE Fire and Security Client report number 226-023
© BRE Certification Ltd 2007
Printed on environmentally friendly paper
B. This area summarises the cost of the systems, assuming they are available in the permutation being considered. These cells are simply repeating the results of calculations performed in the “system ~ <system name>” sheets.
C. This area summarises the additional benefits (not related to risk reduction) of the systems, assuming they are available in the permutation being considered. These cells are simply repeating the results of calculations performed in the “system ~ <system name>” sheets.
D. This area calculates the total system costs (from the values in area B), the total risk reduction benefits (repeating the results in the “Risk Summary” sheet), the total additional benefits (from the values in area C), and then calculates the net benefit. The units for the values in area D are pounds (£) per year.
E. Based on the overall net benefit and its uncertainty, calculated in area D, this cell gives the confidence level that the net benefit will be positive in reality.
14 Guidance on cost benefit analysis
BRE Fire and Security Client report number 226-023
© BRE Certification Ltd 2007
Printed on environmentally friendly paper
Risk Summary
E FA
B
DC
EE FFAA
BB
DDCC
Figure 3.3. Screen shot of the “Risk Summary” sheet
This is an intermediate summary sheet.
Do not alter any of the values, however you can sort the columns, e.g. to see which scenario gives the highest baseline risk, or highest residual risk.
A. This area summarises the results of calculations from the “risk ~ <location>” sheets (Risk scenario frequency data, area Q) for the baseline risks, not accounting for system effects.
B. This area summarises the results of calculations from the “risk ~ <location>” sheets (Risk scenario frequency data, area R) for the reduced risks, that account for system effects.
C. This gives the total baseline risk as the sum of the components from area A.
D. Similarly, this gives the total reduced risk as the sum of the components from area B.
E. This area lists the results of all the individual scenario calculations, both baseline and reduced risk scenarios (Risk scenario frequency data, areas O and P). These can be sorted, for example in order of
15 Guidance on cost benefit analysis
BRE Fire and Security Client report number 226-023
© BRE Certification Ltd 2007
Printed on environmentally friendly paper
ascending baseline risk. As this area is in the user workspace, it is not essential to keep the columns of data in the “correct” order.
F. This is a user calculation to calculate cumulative distribution functions for different magnitudes of loss. This is an option currently under development, so will not be further discussed here. (update: this area has been omitted from the Feb. 2007 release version of the tool)
16 Guidance on cost benefit analysis
BRE Fire and Security Client report number 226-023
© BRE Certification Ltd 2007
Printed on environmentally friendly paper
Risk Summary (2)
D
F GE
C
B
A
DD
FF GGEE
CC
BB
AA
Figure 3.4. Screen shot of the “Risk Summary (2)” sheet
This is an intermediate summary sheet.
Do not alter any of the values, however you can sort the columns, e.g. to see which scenario gives the highest baseline risk, or highest residual risk.
A. This area summarises the results of calculations from the different risk metrics (area F) for the baseline risks, not accounting for system effects. Note that the percentages in the right-hand column are the fractional contribution of each metric to the overall baseline risk.
B. This area summarises the results of calculations from the different risk metrics (area G) for the reduced risks, that account for system effects. Note that the percentages in the right-hand column are the fractional contribution of each metric to the overall reduced risk.
C. This gives the difference between the baseline risks (area A) and the reduced risks (area B).
17 Guidance on cost benefit analysis
BRE Fire and Security Client report number 226-023
© BRE Certification Ltd 2007
Printed on environmentally friendly paper
D. This gives the total number of fires in the baseline case; included for interest only, not directly part of the risk calculation. It is calculated by summing all the fire frequencies in the “Death Risks” block of area F.
E. This gives the total number of fires in the reduced risk case; included for interest only, not directly part of the risk calculation. The percentage value is the number of fires as a percentage of the number of fires in the baseline case. It is calculated by summing all the fire frequencies in the “Death Risks” block of area G.
F. Each block of data within this area corresponds to one of the risk metrics (deaths, injuries, building damage, etc). Values are taken from the relevant “Risk ~ <roomname>” sheets. The three columns of data within the block are (L-R): the frequency of the fire scenario, the contribution of the appropriate risk metric to the consequential loss of the scenario, and the contribution to the risk (calculated as the product of the frequency and the consequence).
G. This is analogous to block F, but using the reduced frequencies and reduced consequences once prevention and / or mitigation systems are in place.
18 Guidance on cost benefit analysis
BRE Fire and Security Client report number 226-023
© BRE Certification Ltd 2007
Printed on environmentally friendly paper
Chart ~ risk output
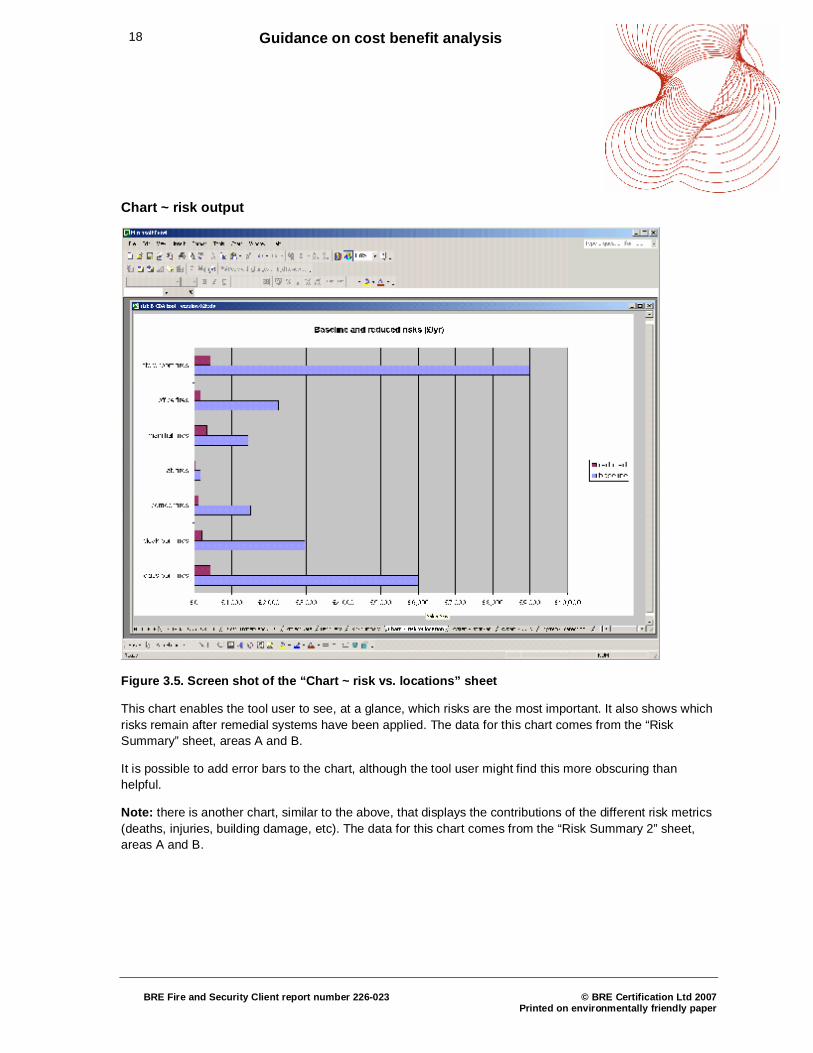
Figure 3.5. Screen shot of the “Chart ~ risk vs. locations” sheet
This chart enables the tool user to see, at a glance, which risks are the most important. It also shows which risks remain after remedial systems have been applied. The data for this chart comes from the “Risk Summary” sheet, areas A and B.
It is possible to add error bars to the chart, although the tool user might find this more obscuring than helpful.
Note: there is another chart, similar to the above, that displays the contributions of the different risk metrics (deaths, injuries, building damage, etc). The data for this chart comes from the “Risk Summary 2” sheet, areas A and B.
19 Guidance on cost benefit analysis
BRE Fire and Security Client report number 226-023
© BRE Certification Ltd 2007
Printed on environmentally friendly paper
Basic Data
E
D
C
B
A
EE
DD
CC
BB
AA
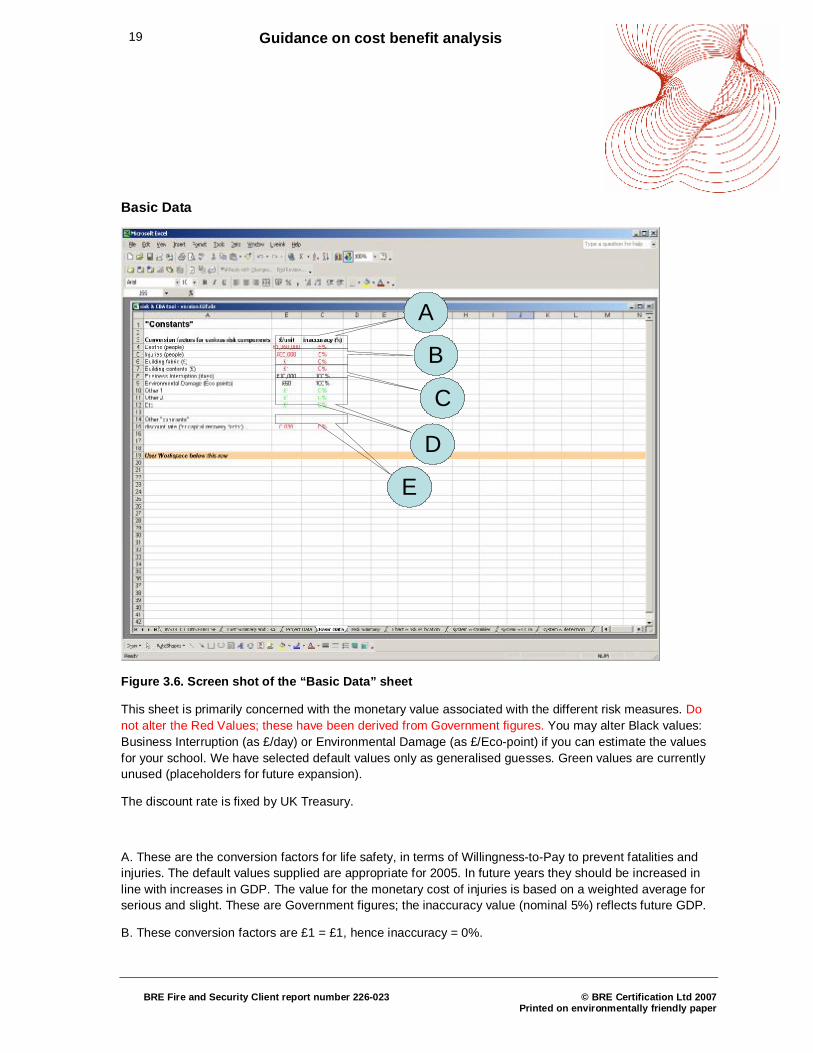
Figure 3.6. Screen shot of the “Basic Data” sheet
This sheet is primarily concerned with the monetary value associated with the different risk measures. Do not alter the Red Values; these have been derived from Government figures. You may alter Black values: Business Interruption (as £/day) or Environmental Damage (as £/Eco-point) if you can estimate the values for your school. We have selected default values only as generalised guesses. Green values are currently unused (placeholders for future expansion).
The discount rate is fixed by UK Treasury.
A. These are the conversion factors for life safety, in terms of Willingness-to-Pay to prevent fatalities and injuries. The default values supplied are appropriate for 2005. In future years they should be increased in line with increases in GDP. The value for the monetary cost of injuries is based on a weighted average for serious and slight. These are Government figures; the inaccuracy value (nominal 5%) reflects future GDP.
B. These conversion factors are £1 = £1, hence inaccuracy = 0%.
20 Guidance on cost benefit analysis
BRE Fire and Security Client report number 226-023
© BRE Certification Ltd 2007
Printed on environmentally friendly paper
C. The business interruption value reflect the cost of the whole building being unavailable, per day. It can include factors such as lost revenue (e.g. for a sport hall open to the public outside school hours), costs of alternative accommodation, transport, costs to parents looking after children when they are sent home, overtime worked by teachers and staff, etc. This figure will vary from school to school and building to building, so needs to be set by the user. The environmental impact conversion figure can be left at its default value if desired.
D. These are dummy values (placeholders) which do nothing at present.
E. The UK Treasury [Green Book] recommends a discount rate of 3.5% for capital projects with a payback period between 1~30 years (which should be appropriate to most of the systems under consideration).
21 Guidance on cost benefit analysis
BRE Fire and Security Client report number 226-023
© BRE Certification Ltd 2007
Printed on environmentally friendly paper
Project Data
B
AC
BB
AACC
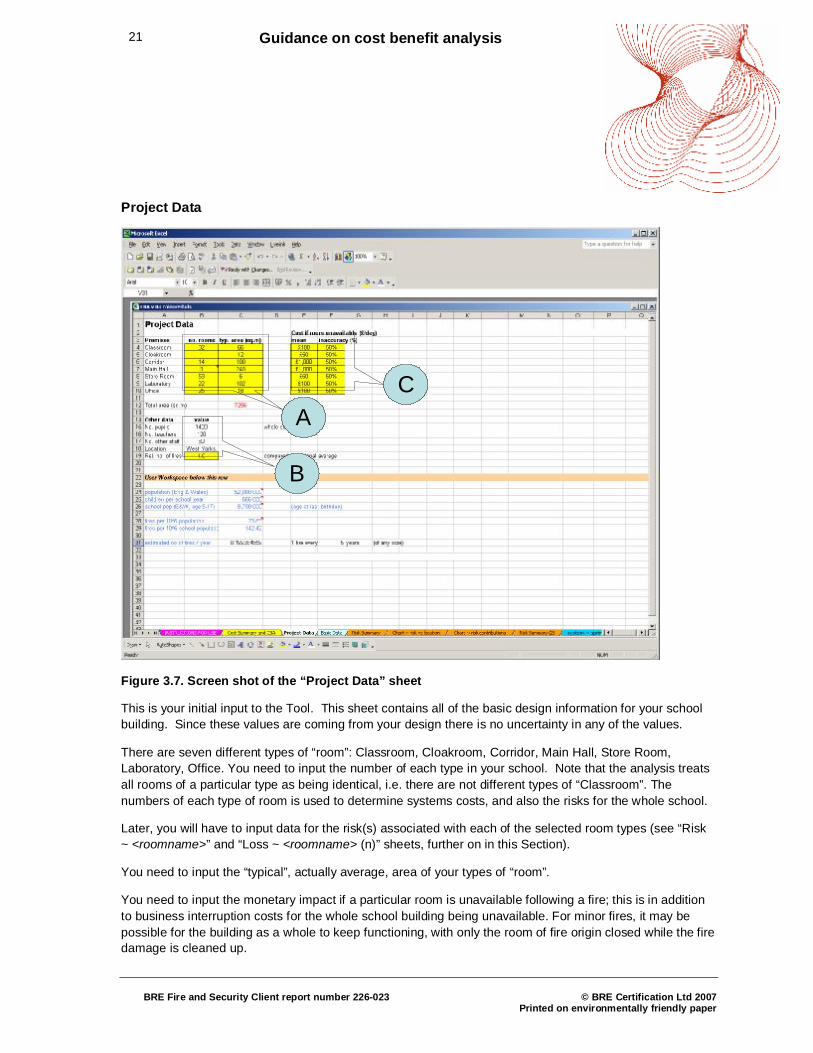
Figure 3.7. Screen shot of the “Project Data” sheet
This is your initial input to the Tool. This sheet contains all of the basic design information for your school building. Since these values are coming from your design there is no uncertainty in any of the values.
There are seven different types of “room”: Classroom, Cloakroom, Corridor, Main Hall, Store Room, Laboratory, Office. You need to input the number of each type in your school. Note that the analysis treats all rooms of a particular type as being identical, i.e. there are not different types of “Classroom”. The numbers of each type of room is used to determine systems costs, and also the risks for the whole school.
Later, you will have to input data for the risk(s) associated with each of the selected room types (see “Risk ~ <roomname>” and “Loss ~ <roomname> (n)” sheets, further on in this Section).
You need to input the “typical”, actually average, area of your types of “room”.
You need to input the monetary impact if a particular room is unavailable following a fire; this is in addition to business interruption costs for the whole school building being unavailable. For minor fires, it may be possible for the building as a whole to keep functioning, with only the room of fire origin closed while the fire damage is cleaned up.
22 Guidance on cost benefit analysis
BRE Fire and Security Client report number 226-023
© BRE Certification Ltd 2007
Printed on environmentally friendly paper
A. These values define the characteristics of the school building. If the design has already been determined, these values will be known from that. If not, it is recommended that the typical designs listed in the standards BB98 and BB99 are used. The number of rooms will be required for estimating fire frequencies; the room areas are required for estimating system costs where a quotation is not available.
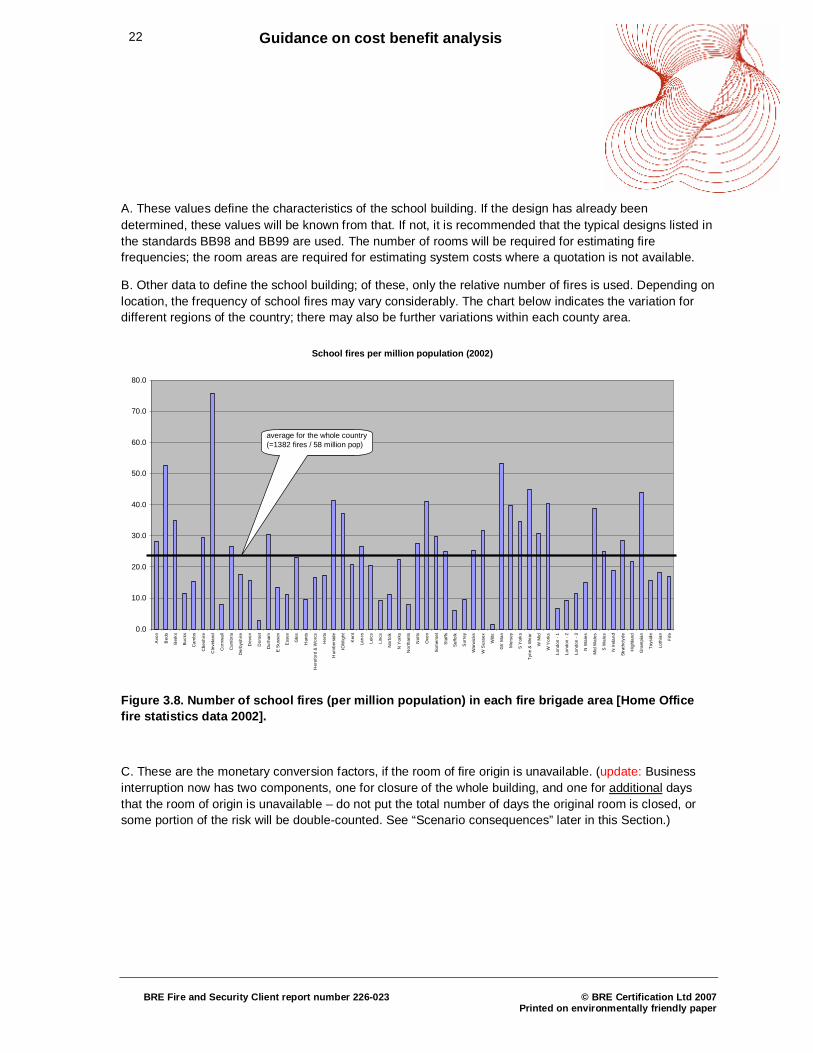
B. Other data to define the school building; of these, only the relative number of fires is used. Depending on location, the frequency of school fires may vary considerably. The chart below indicates the variation for different regions of the country; there may also be further variations within each county area.
School fires per million population (2002)
0.0
10.0
20.0
30.0
40.0
50.0
60.0
70.0
80.0
Avo
n
Bed
s
Ber
ks
Buck
s
Cam
bs
Che
shire
Cle
vela
nd
Cor
nwal
l
Cum
bria
Der
bysh
ire
Dev
on
Dor
set
Dur
ham
E S
usse
x
Ess
ex
Glo
s
Han
ts
Her
efor
d &
Wor
cs
Her
ts
Hum
bers
ide
IOW
ight
Ken
t
Lanc
s
Leic
s
Linc
s
Nor
folk
N Y
orks
Nor
than
ts
Not
ts
Oxo
n
Som
erse
t
Sta
ffs
Suffo
lk
Sur
rey
War
wic
ks
W S
usse
x
Wilt
s
Gtr
Man
Mer
sey
S Y
orks
Tyne
& W
ear
W M
id
W Y
orks
Lond
on -
1
Lond
on -
2
Lond
on -
3
N W
ales
Mid
Wal
es
S W
ales
N Ir
elan
d
Stra
thcl
yde
Hig
hlan
d
Gra
mpi
an
Tays
ide
Loth
ian
Fife
average for the whole country (=1382 fires / 58 million pop)
Figure 3.8. Number of school fires (per million population) in each fire brigade area [Home Office fire statistics data 2002].
C. These are the monetary conversion factors, if the room of fire origin is unavailable. (update: Business interruption now has two components, one for closure of the whole building, and one for additional days that the room of origin is unavailable – do not put the total number of days the original room is closed, or some portion of the risk will be double-counted. See “Scenario consequences” later in this Section.)
23 Guidance on cost benefit analysis
BRE Fire and Security Client report number 226-023
© BRE Certification Ltd 2007
Printed on environmentally friendly paper
System Data
BC
L
M
N
A
BBCC
LL
MM
NN
AA
G
I
KJ
H
F
ED
GG
II
KKJJ
HH
FF
EEDD
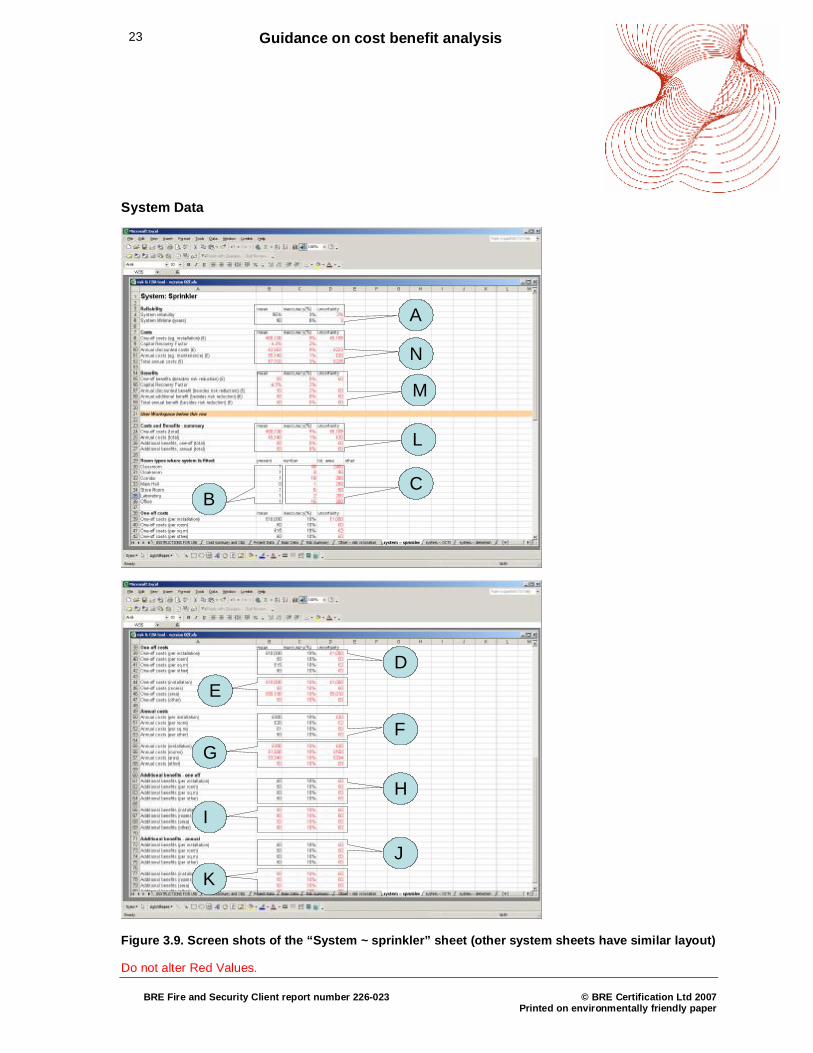
Figure 3.9. Screen shots of the “System ~ sprinkler” sheet (other system sheets have similar layout)
Do not alter Red Values.
24 Guidance on cost benefit analysis
BRE Fire and Security Client report number 226-023
© BRE Certification Ltd 2007
Printed on environmentally friendly paper
System reliability and System lifetime (years) : Default values are supplied. The “uncertainty” relates to whether the system is operational when required. This affects the risk (probability x consequences). The System Lifetime only affects the Capital Recovery Factor.
“Annual discounted costs” convert the one-off cost to an annual equivalent.
“Total Annual Costs” and “Annual additional benefits” feed into the Costs and CBA results.
Room types where system is fitted - You may not wish to fit sprinklers in every type of room. You need to select which of your types of room will have sprinklers; 1 if present 0 if absent. Sprinklers should normally be in all rooms. Note: Detectors should be in all rooms. CCTV only needs to be present somewhere (we suggest corridors) to benefit the whole building.
One-off costs: You need to input your values here – if you can. Note that these may be per room or per sq. m. You may need to get quotes from suppliers. The default values are best guesses. These values are then totalled for the whole school.
Annual costs: Input needed. These will primarily be maintenance costs.
Additional benefits: Input needed. These benefits could include one-offs (e.g. design freedoms leading to savings in construction costs) or annual (e.g. reduction in insurance premiums). These will depend upon local conditions; sprinklers may not offer any additional benefits.
A. The system reliability is used to determine the probability that the system will be working at the time there is a fire. Values will normally be 90% or higher, although confirmation may be required from system manufacturers. The lifetime of the system is used to determine the annual cost (i.e. the capital cost, discounted over the system lifetime).
B. Input here which room types have a system fitted (“1”) or not (“0”). This information is used to help estimate the system costs, and also whether or not a system will be effective in certain scenarios. For systems such as sprinklers and detection, it will normally be desired to fit the system to all types of room. For other systems, such as CCTV, it may be sufficient to fit the system to the circulation spaces only. Note that it is not possible (in this model) to fit a system to only some rooms of a given type; it is all or nothing.
C. This region of the spreadsheet picks up the number of rooms of each type from the “Project Data” sheet, and calculates the total areas. This information is used in building up cost estimates.
D. The capital cost of the system may be calculated based on some or all of: a lump sum for the whole installation; a sum based on the number of rooms; or a sum based on the area of coverage. For many systems (e.g. sprinklers) an estimate of the cost will be built up on the basis of a price per unit area covered. However, as the building design nears completion, actual quotations for the cost may have been obtained. The default inaccuracy levels are nominal values; once a firm quotation has been obtained the inaccuracy will be 0%.
E. This region of the spreadsheet calculates the total capital cost of the system, from the cost factors in region D of this sheet, and the building characteristics in region C.
25 Guidance on cost benefit analysis
BRE Fire and Security Client report number 226-023
© BRE Certification Ltd 2007
Printed on environmentally friendly paper
F. This region is analogous to region D, except that it is concerned with annual costs (for inspection, maintenance and the like). As with the capital cost, there may be one or more factors employed to calculate the annual cost.
G. Analogous to region E, except that the annual cost is calculated from the factors in region F and the building characteristics in region C.
H. This region is analogous to region D, except that it is concerned with any one-off benefits that may accrue from fitting the system. For example, some building authorities may permit less compartmentation of the building if sprinklers are fitted. This will obviously lead to reduced construction costs, which would be counted here as a benefit. As with the capital cost, there may be one or more factors employed to calculate the annual cost.
I. Analogous to region E, except that the one-off benefit is calculated from the factors in region H and the building characteristics in region C.
J. This region is analogous to region D, except that it is concerned with annual benefits. For example, security systems would prevent theft and vandalism, as well as reduce the incidence of arson. The annual reduction of theft and vandalism would be included here (but not the arson, as this would be covered under the main “Risk…” sheets). As with the capital cost, there may be one or more factors employed to calculate the annual benefits.
K. Analogous to region E, except that the annual benefit is calculated from the factors in region J and the building characteristics in region C.
L. This region calculated the total costs (capital and annual) and total benefits (one-off and annual) from the components in regions E, G, I and K.
M. The Capital recovery factor is calculated, and used to work out the annual value of the one-off benefit. This is added to the other annual benefits, to give a total benefit per year. The bottom line (total annual benefit) feeds into the “Costs and CBA” sheet.
N. This is analogous to region M, except that all the costs are converted to annual terms. The bottom line (total annual cost) feeds into the “Costs and CBA” sheet.
26 Guidance on cost benefit analysis
BRE Fire and Security Client report number 226-023
© BRE Certification Ltd 2007
Printed on environmentally friendly paper
Risk Scenario Frequency Data
K
S
B
M
Q R
T
N
L
CA
KK
SS
BB
MM
QQ RR
TT
NN
LL
CCAA
T
R
N
L
C
POTT
RR
NN
LL
CC
PPOO
Figure 3.10. Screen shots of the “Risk ~ classroom” sheet (other risk sheets have similar layout)
27 Guidance on cost benefit analysis
BRE Fire and Security Client report number 226-023
© BRE Certification Ltd 2007
Printed on environmentally friendly paper
E
F
G
D
H
J
I
EE
FF
GG
DD
HH
JJ
II
Figure 3.10 (continued). Screen shots of the “Risk ~ classroom” sheet (other risk sheets have similar layout)
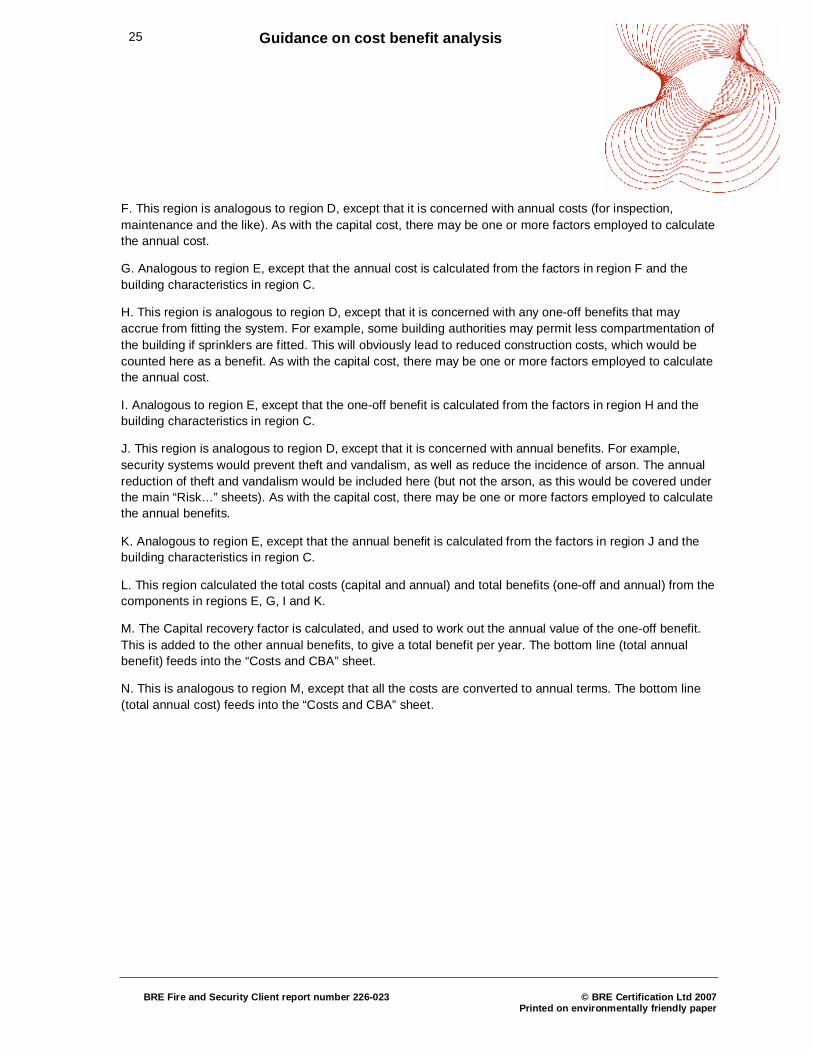
This sheet calculates the frequency of the four levels of fire scenario (minor, serious, major and catastrophic) for the given room type. It also takes the expected losses from the scenario consequence sheets, and used this to calculate the risk. These values feed into the Risk Summary Sheets. Do not alter Red Values.
For each “system” you need to determine the probability that it will prevent the various scenario levels. Best-guess default values are provided. For example; a sprinkler will have little effect on a minor fire, but a big effect on a serious fire. If you can stop the event that leads to the scenario there can be substantial savings.
Terminology:
• A minor fire is one where the fire is confined to the item ignited, with only smoke damage to the room.
• A serious fire is one where fire damage is confined to the room of origin, with smoke damage beyond.
• A major fire is one where there is fire damage beyond the room of origin, and smoke damage to most or all of the building
• A catastrophic fire is one where fire damage affects most or all of the building – it will probably have to be demolished
28 Guidance on cost benefit analysis
BRE Fire and Security Client report number 226-023
© BRE Certification Ltd 2007
Printed on environmentally friendly paper
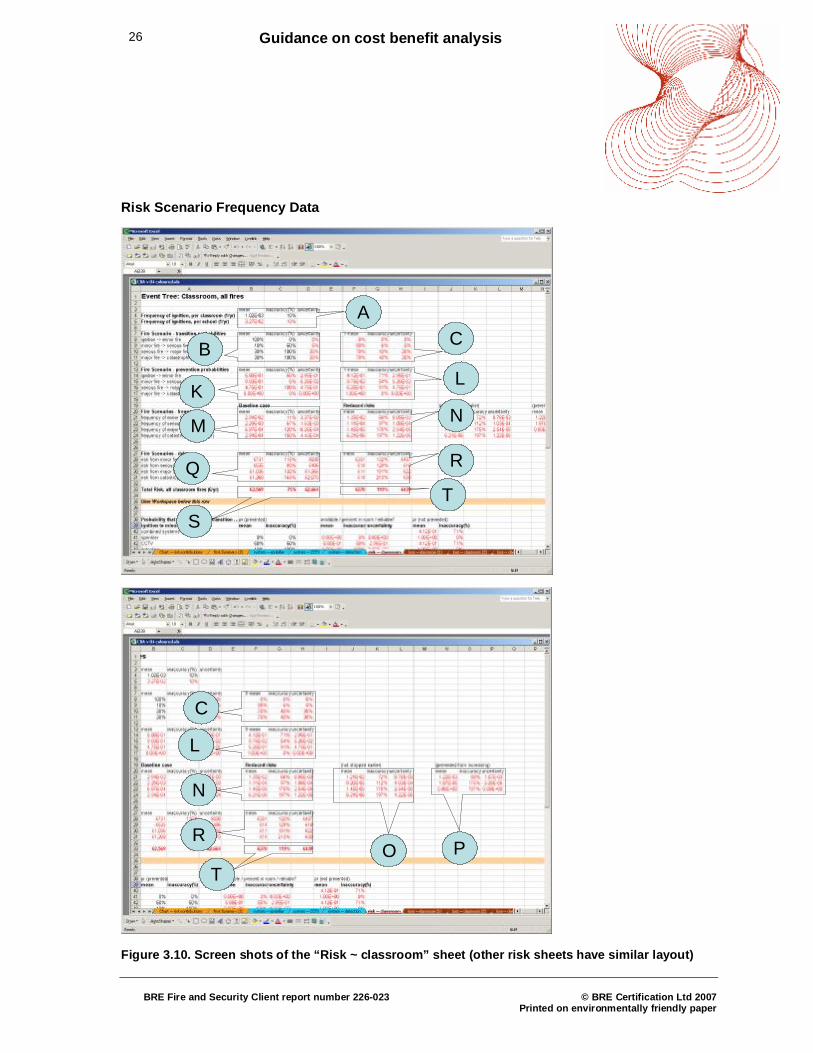
A. Input here the frequency of ignitions, per room type per year. (It is recommended that the default values are used, since these have been derived from UK Home Office fire statistics). The number of fires for the whole building in rooms of this type will then be calculated, using values from the “Project Data” sheet for the number of rooms and the relative frequency of fires relative to the national average.
B. This region is used to input the transition probabilities between one fire size and the next size up. The four fire sizes are “minor” (fire confined to item first ignited, smoke confined to room), “serious” (fire spread beyond item but contained to room of origin, smoke spread beyond room), “major” (fire and smoke spread beyond room of origin), and “catastrophic” (fire damage to majority of the building). For the smaller fires, the transition probabilities are derived from fire statistics (so it is recommended to use the default values); for the transitions to larger fires, where statistics are scarce, engineering judgement is used.
C. This region simply calculates q = 1-p, where p is the transition probability from one fire size to the next (region B). It also calculates the inaccuracy in q, given that the uncertainty in q is the same as the corresponding uncertainty in p. The probabilities in regions B and C are used to calculate the proportions of fires that end up in each of the four size ranges.
D. Here the user inputs the probability for a system (assuming it is present and functioning as intended) to prevent the transition from ignition to minor fire. See Section 6 for more guidance on system effects. Note that “system4” is just a placeholder for future expansion, and therefore data for this is not required.
E. Similar to region D, except that the probabilities are now for the systems to prevent the transition from an established minor fire to a serious one.
F. Similar to region D, except that the probabilities are now for the systems to prevent the transition from an established serious fire to a major one.
G. Similar to region D, except that the probabilities are now for the systems to prevent the transition from an established major fire to a catastrophic one.
H. This region takes the prevention probabilities from region D, and multiplies by the reliability data (“system ~ …” sheet, region A) and whether or not the system is present in the relevant room type, to calculate the probability that the transition will be prevented.
I. This region calculates the probability that each of the systems will not individually prevent the transition to the next fire size, as well as the probability that all systems together fail to prevent the transition. It is assumed that each system operates independently from the others. If
pn is the probability that system n prevents transition (calculated in region H)
qn = 1-pn is the probability that system n does not prevent transition
then q1 x q2 x q3 is the probability that all three systems fail to prevent transition to the next fire size
J. Analogous calculations to regions H and I, for transitions to larger fire sizes
K. This region calculates the probability that the combined systems prevent the various fire transitions. These probabilities are in fact calculated as 1-probability(transition not prevented), using results from region L
29 Guidance on cost benefit analysis
BRE Fire and Security Client report number 226-023
© BRE Certification Ltd 2007
Printed on environmentally friendly paper
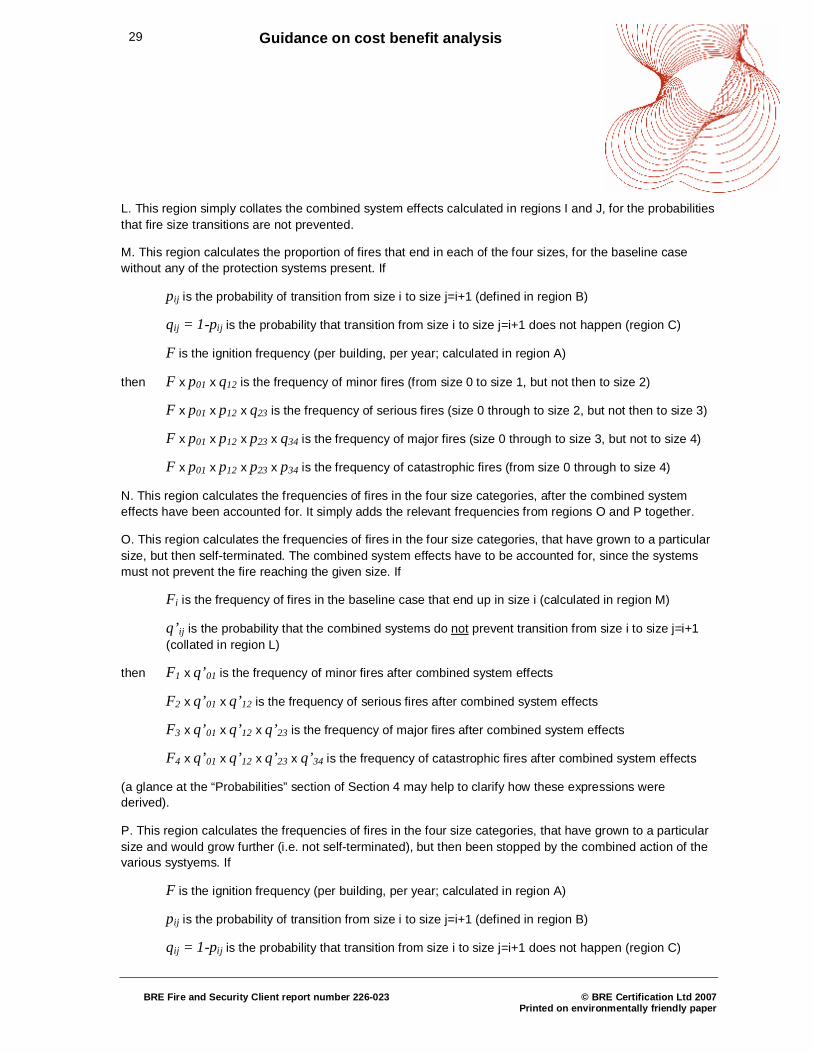
L. This region simply collates the combined system effects calculated in regions I and J, for the probabilities that fire size transitions are not prevented.
M. This region calculates the proportion of fires that end in each of the four sizes, for the baseline case without any of the protection systems present. If
pij is the probability of transition from size i to size j=i+1 (defined in region B)
qij = 1-pij is the probability that transition from size i to size j=i+1 does not happen (region C)
F is the ignition frequency (per building, per year; calculated in region A)
then F x p01 x q12 is the frequency of minor fires (from size 0 to size 1, but not then to size 2)
F x p01 x p12 x q23 is the frequency of serious fires (size 0 through to size 2, but not then to size 3)
F x p01 x p12 x p23 x q34 is the frequency of major fires (size 0 through to size 3, but not to size 4)
F x p01 x p12 x p23 x p34 is the frequency of catastrophic fires (from size 0 through to size 4)
N. This region calculates the frequencies of fires in the four size categories, after the combined system effects have been accounted for. It simply adds the relevant frequencies from regions O and P together.
O. This region calculates the frequencies of fires in the four size categories, that have grown to a particular size, but then self-terminated. The combined system effects have to be accounted for, since the systems must not prevent the fire reaching the given size. If
Fi is the frequency of fires in the baseline case that end up in size i (calculated in region M)
q’ij is the probability that the combined systems do not prevent transition from size i to size j=i+1 (collated in region L)
then F1 x q’01 is the frequency of minor fires after combined system effects
F2 x q’01 x q’12 is the frequency of serious fires after combined system effects
F3 x q’01 x q’12 x q’23 is the frequency of major fires after combined system effects
F4 x q’01 x q’12 x q’23 x q’34 is the frequency of catastrophic fires after combined system effects
(a glance at the “Probabilities” section of Section 4 may help to clarify how these expressions were derived).
P. This region calculates the frequencies of fires in the four size categories, that have grown to a particular size and would grow further (i.e. not self-terminated), but then been stopped by the combined action of the various systyems. If
F is the ignition frequency (per building, per year; calculated in region A)
pij is the probability of transition from size i to size j=i+1 (defined in region B)
qij = 1-pij is the probability that transition from size i to size j=i+1 does not happen (region C)
30 Guidance on cost benefit analysis
BRE Fire and Security Client report number 226-023
© BRE Certification Ltd 2007
Printed on environmentally friendly paper
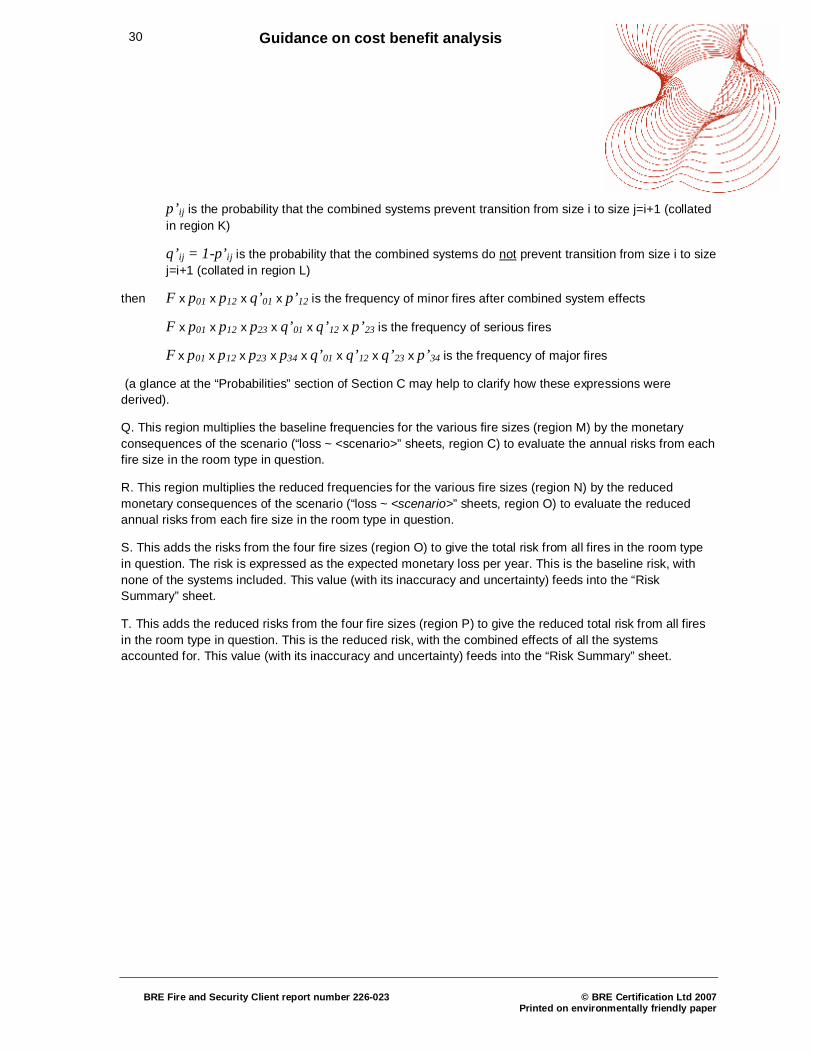
p’ij is the probability that the combined systems prevent transition from size i to size j=i+1 (collated in region K)
q’ij = 1-p’ij is the probability that the combined systems do not prevent transition from size i to size j=i+1 (collated in region L)
then F x p01 x p12 x q’01 x p’12 is the frequency of minor fires after combined system effects
F x p01 x p12 x p23 x q’01 x q’12 x p’23 is the frequency of serious fires
F x p01 x p12 x p23 x p34 x q’01 x q’12 x q’23 x p’34 is the frequency of major fires
(a glance at the “Probabilities” section of Section C may help to clarify how these expressions were derived).
Q. This region multiplies the baseline frequencies for the various fire sizes (region M) by the monetary consequences of the scenario (“loss ~ <scenario>” sheets, region C) to evaluate the annual risks from each fire size in the room type in question.
R. This region multiplies the reduced frequencies for the various fire sizes (region N) by the reduced monetary consequences of the scenario (“loss ~ <scenario>” sheets, region O) to evaluate the reduced annual risks from each fire size in the room type in question.
S. This adds the risks from the four fire sizes (region O) to give the total risk from all fires in the room type in question. The risk is expressed as the expected monetary loss per year. This is the baseline risk, with none of the systems included. This value (with its inaccuracy and uncertainty) feeds into the “Risk Summary” sheet.
T. This adds the reduced risks from the four fire sizes (region P) to give the reduced total risk from all fires in the room type in question. This is the reduced risk, with the combined effects of all the systems accounted for. This value (with its inaccuracy and uncertainty) feeds into the “Risk Summary” sheet.
31 Guidance on cost benefit analysis
BRE Fire and Security Client report number 226-023
© BRE Certification Ltd 2007
Printed on environmentally friendly paper
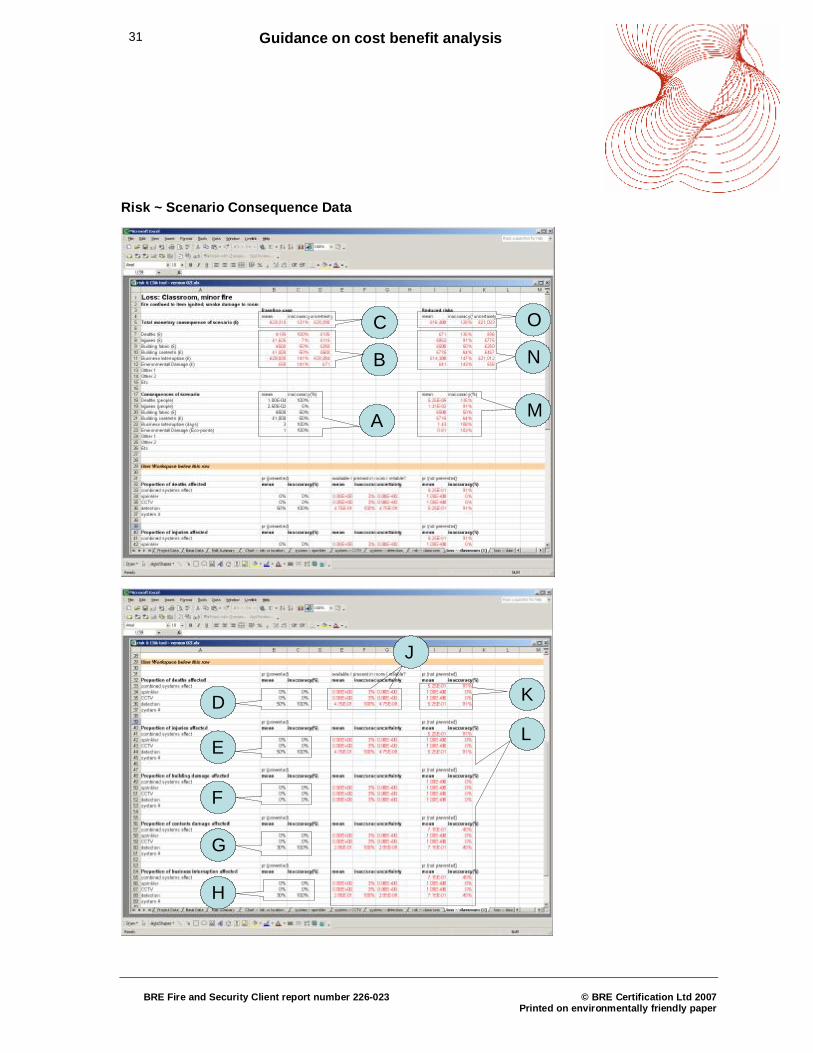
Risk ~ Scenario Consequence Data
A
B
C
M
N
O
AA
BB
CC
MM
NN
OO
D
E
F
L
K
J
H
G
DD
EE
FF
LL
KK
JJ
HH
GG
32 Guidance on cost benefit analysis
BRE Fire and Security Client report number 226-023
© BRE Certification Ltd 2007
Printed on environmentally friendly paper
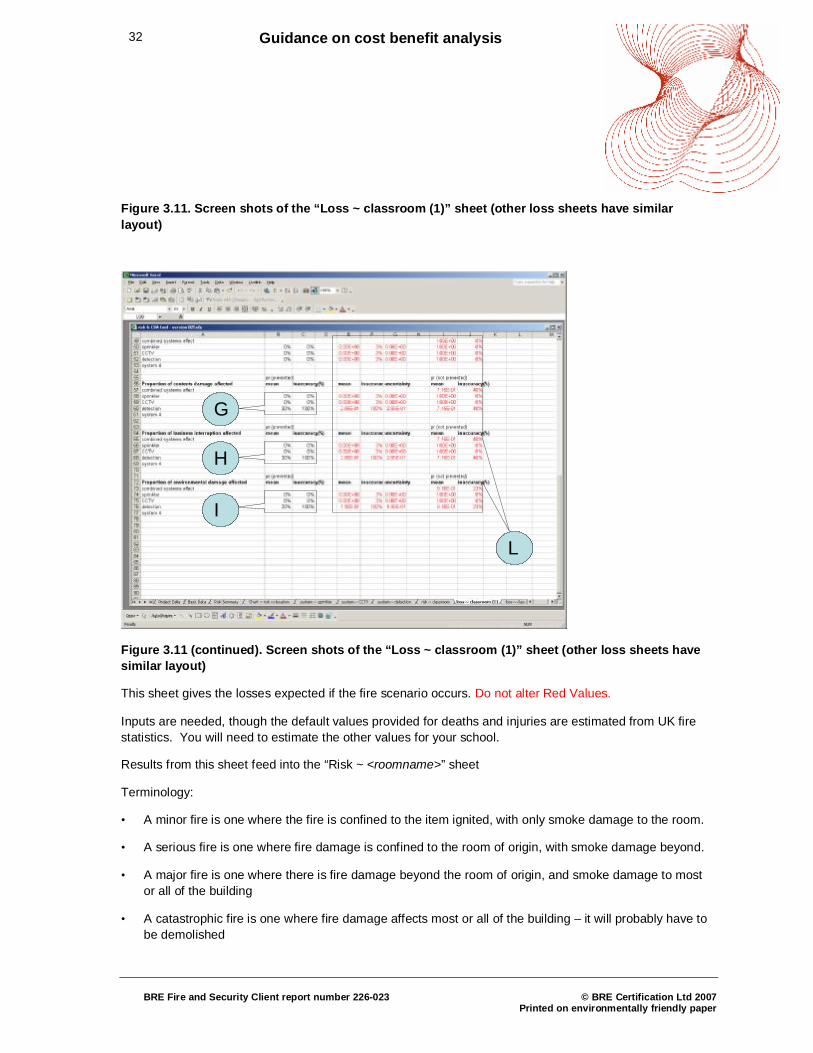
Figure 3.11. Screen shots of the “Loss ~ classroom (1)” sheet (other loss sheets have similar layout)
G
H
I
L
GG
HH
II
LL
Figure 3.11 (continued). Screen shots of the “Loss ~ classroom (1)” sheet (other loss sheets have similar layout)
This sheet gives the losses expected if the fire scenario occurs. Do not alter Red Values.
Inputs are needed, though the default values provided for deaths and injuries are estimated from UK fire statistics. You will need to estimate the other values for your school.
Results from this sheet feed into the “Risk ~ <roomname>” sheet
Terminology:
• A minor fire is one where the fire is confined to the item ignited, with only smoke damage to the room.
• A serious fire is one where fire damage is confined to the room of origin, with smoke damage beyond.
• A major fire is one where there is fire damage beyond the room of origin, and smoke damage to most or all of the building
• A catastrophic fire is one where fire damage affects most or all of the building – it will probably have to be demolished
33 Guidance on cost benefit analysis
BRE Fire and Security Client report number 226-023
© BRE Certification Ltd 2007
Printed on environmentally friendly paper
A. Input here the expected consequences from a fire of a given size in a given room type. Refer to Section 6 for more guidance on suitable values. (Note – catastrophic fires are assumed to have the same consequences regardless of their origin, thus there is only one “loss ~ catastrophic” sheet, rather than a sheet for each room type)
(update: Business interruption now has two components, one for closure of the whole building, and one for additional days that the room of origin is unavailable – do not put the total number of days the original room is closed, or some portion of the risk will be double-counted. The “Project Data” sheet contains the costs per additional day the room of origin is unavailable. In the Feb 2007 release version, area A has an additional row, compared to the figure above. Areas B, M and N also have extra rows for the additional risk metric.)
B. This region multiplies each of the consequences in region A by the appropriate monetary conversion factor (“Basic Data” sheet, regions A – C)
C. This is the sum of all the monetary consequences evaluated in region B.
D. Input here the proportion of deaths that each system would prevent, for a fire of this size and location (assuming that the system is present and functioning properly, and had not prevented the scenario in the first place). These values are generally based on engineering judgement, and it is recommended that the default values be used unless there is good reason to do otherwise.
E. Analogous to region D, but applies to the proportion of injuries that each system would prevent.
F. Analogous to region D, but applies to the proportion of building damage that each system would prevent.
G. Analogous to region D, but applies to the proportion of contents damage that each system would prevent.
H. Analogous to region D, but applies to the proportion of business interruption that each system would prevent.
I. Analogous to region D, but applies to the proportion of environmental damage that each system would prevent.
J. This region takes the proportion of deaths prevented by each system (from region D), and multiplies these by the reliability data (“system ~ …” sheet, region A) and whether or not the system is present in the relevant room type, to calculate the proportion of deaths that will be prevented.
K. This region calculates the proportion of deaths that each of the systems will not individually prevent, as well as the proportion of deaths that all systems together fail to prevent. It is assumed that each system operates independently from the others. If
pn is the proportion of deaths that system n prevents (calculated in region H)
qn = 1-pn is the proportion of deaths that system n does not prevent
then q1 x q2 x q3 is the proportion of deaths that all three systems fail to prevent.
L. Analogous calculations to regions J and K, but for the proportion of injuries, building damage, etc not prevented.
34 Guidance on cost benefit analysis
BRE Fire and Security Client report number 226-023
© BRE Certification Ltd 2007
Printed on environmentally friendly paper
M. Multiplies each of the baseline consequences (region A) by the proportions prevented by the combined system effects (regions K and L).
N. This region multiplies each of the reduced consequences in region M by the appropriate monetary conversion factor (“Basic Data” sheet, regions A – C).
O. This is the sum of all the reduced monetary consequences evaluated in region N.
References
Gamble, J, “Fire Statistics User Guide”, Home Office Statistical Bulletin Issue 1/98, December 1998.
Gamble, J, private communication (Home Office fire statistics databases 1994-2002)
HM Treasury, “The green book: appraisal and evaluation in central government”, ISBN 0115601074, January 2003
35 Guidance on cost benefit analysis
BRE Fire and Security Client report number 226-023
© BRE Certification Ltd 2007
Printed on environmentally friendly paper
4 Mathematical basis to the spreadsheet tool
Risks
The definition of risk that we use is
• Risk = “expected (or average) loss”
or, mathematically
• Risk = {frequency of hazard occurring} x {consequence of hazard}
Some readers may be more familiar with a definition of risk in terms of “probability” x “consequence”. The (subtle) distinction is that probabilities are dimensionless numbers, lying in the range 0…1. The risk must therefore be calculated for a defined time period, and moreover, this period must be such that the chance of the hazard occurring must be less than 100%. The advantage of defining risk in terms of frequency, rather than probability, is that the time frame is determined by the units in which the frequency is expressed (e.g. 1/year).
Risks are additive, thus the total risk for all possible scenarios is given by
∑ ×=i
ii CFR £ {4.1}
where R is the risk, i is an index number identifying the different scenarios, Fi is the frequency with which the i'th scenario occurs, and £Ci is the (monetary) consequence of the i'th scenario. The units of frequency are (1/year), and the unit of the consequence is £, so the unit of risk is £/year.
Example. Suppose that the average damage, caused when a fire occurs, is £100,000. If a fire occurs, on average, once every 10 years (i.e. a frequency of 0.1 year-1), then the risk is £10,000 / year.
Note that, although the average frequency in this example is 1 fire in 10 years, due to the random nature of fire occurrences it is quite possible for a school to experience no fires during its entire lifetime. Alternatively, it could experience a catastrophic fire tomorrow.
Risks may be reduced by preventing hazards from occurring (i.e. reducing the frequency), from mitigating the consequences should hazards occur, or some combination of both.
If a system (or package of systems) has a probability p of preventing a hazard occurring and hence a probability q = 1 – p of failing to prevent it), then the reduced risk for the scenario will be
( ) ( )∑ ×+×=′i
iii CFqFpR £.00.0£. {4.2}
36 Guidance on cost benefit analysis
BRE Fire and Security Client report number 226-023
© BRE Certification Ltd 2007
Printed on environmentally friendly paper
i.e. ∑ ×=′i
ii CFqR £. {4.3}
By analogy with {C.1}, the quantity q.Fi is the reduced frequency of the hazard occurring. The product of a frequency and a probability will always be a reduced frequency.
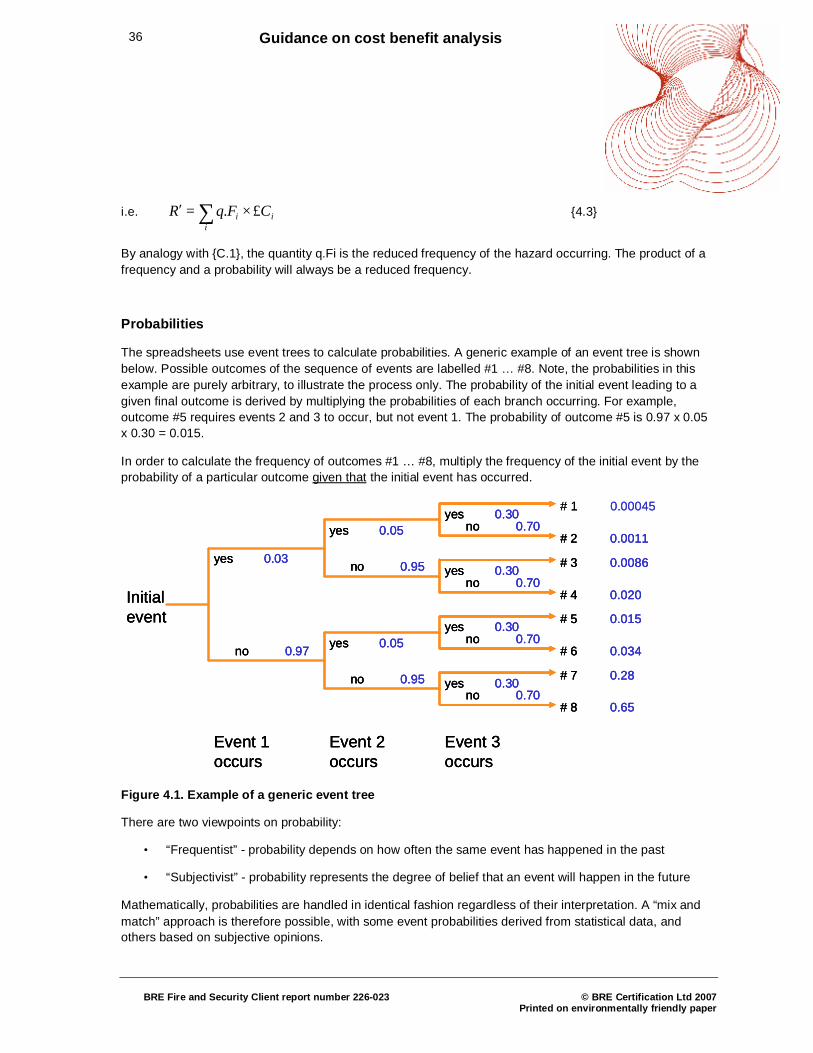
Probabilities
The spreadsheets use event trees to calculate probabilities. A generic example of an event tree is shown below. Possible outcomes of the sequence of events are labelled #1 … #8. Note, the probabilities in this example are purely arbitrary, to illustrate the process only. The probability of the initial event leading to a given final outcome is derived by multiplying the probabilities of each branch occurring. For example, outcome #5 requires events 2 and 3 to occur, but not event 1. The probability of outcome #5 is 0.97 x 0.05 x 0.30 = 0.015.
In order to calculate the frequency of outcomes #1 … #8, multiply the frequency of the initial event by the probability of a particular outcome given that the initial event has occurred.
Event 3 occurs
Event 2 occurs
Event 1 occurs
Initialevent
yes 0.30
no 0.97
no 0.95
no 0.95
no 0.70
no 0.70
no 0.70
no 0.70
yes 0.30
yes 0.30
yes 0.30
yes 0.05
yes 0.05
yes 0.03
# 8 0.65
# 7 0.28
# 6 0.034
# 5 0.015
# 4 0.020
# 3 0.0086
# 2 0.0011
# 1 0.00045
Event 3 occurs
Event 2 occurs
Event 1 occurs
Initialevent
yes 0.30
no 0.97
no 0.95
no 0.95
no 0.70
no 0.70
no 0.70
no 0.70
yes 0.30
yes 0.30
yes 0.30
yes 0.05
yes 0.05
yes 0.03
# 8 0.65
# 7 0.28
# 6 0.034
# 5 0.015
# 4 0.020
# 3 0.0086
# 2 0.0011
Event 3 occurs
Event 2 occurs
Event 1 occurs
Initialevent
yes 0.30
no 0.97
no 0.95
no 0.95
no 0.70
no 0.70
no 0.70
no 0.70
yes 0.30
yes 0.30
yes 0.30
yes 0.05
yes 0.05
yes 0.03
# 8 0.65
# 7 0.28
# 6 0.034
# 5 0.015
# 4 0.020
# 3 0.0086
# 2 0.0011
# 1 0.00045
Figure 4.1. Example of a generic event tree
There are two viewpoints on probability:
• “Frequentist” - probability depends on how often the same event has happened in the past
• “Subjectivist” - probability represents the degree of belief that an event will happen in the future
Mathematically, probabilities are handled in identical fashion regardless of their interpretation. A “mix and match” approach is therefore possible, with some event probabilities derived from statistical data, and others based on subjective opinions.
37 Guidance on cost benefit analysis
BRE Fire and Security Client report number 226-023
© BRE Certification Ltd 2007
Printed on environmentally friendly paper
no fireq01
p01
minor fireq12
p12
serious fireq23
p23
major fireq34
p34catastrophic fire
F
Key
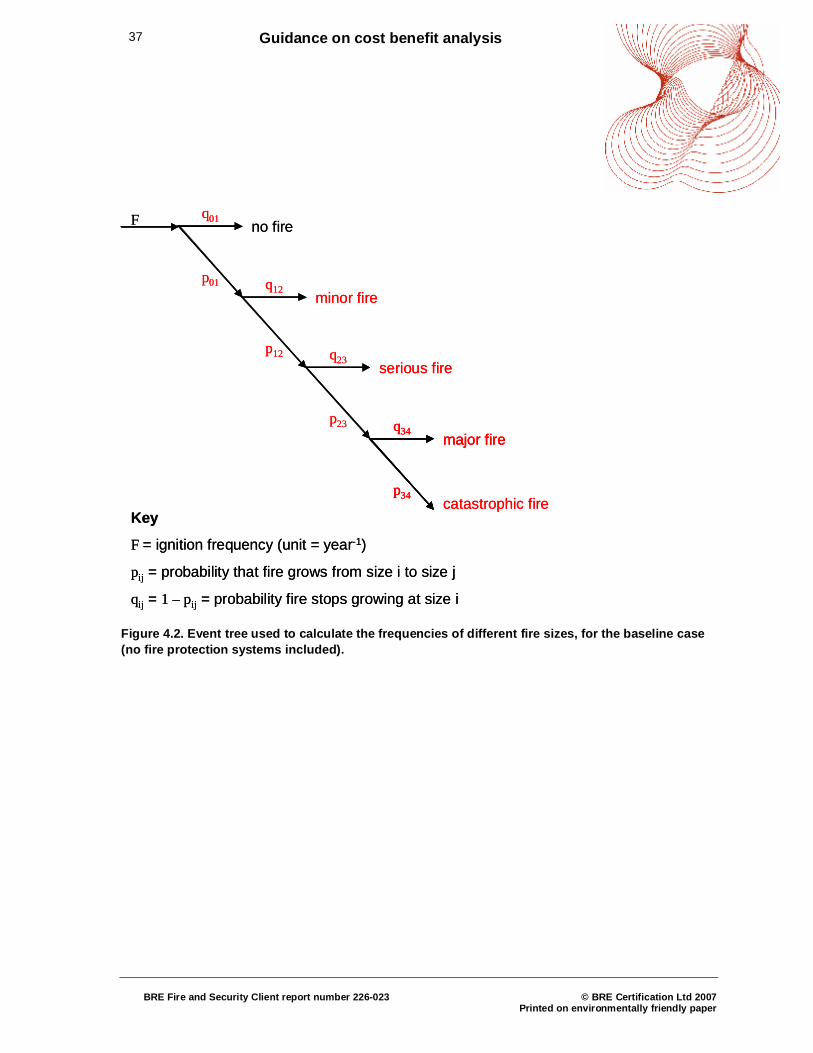
F = ignition frequency (unit = year-1)
pij = probability that fire grows from size i to size j
qij = 1 – pij = probability fire stops growing at size i
no fireq01
p01
minor fireq12
p12
serious fireq23
p23
major fireq34
p34
major fireq34
p34catastrophic fire
F
Key
F = ignition frequency (unit = year-1)
pij = probability that fire grows from size i to size j
qij = 1 – pij = probability fire stops growing at size i
Figure 4.2. Event tree used to calculate the frequencies of different fire sizes, for the baseline case (no fire protection systems included).
38 Guidance on cost benefit analysis
BRE Fire and Security Client report number 226-023
© BRE Certification Ltd 2007
Printed on environmentally friendly paper
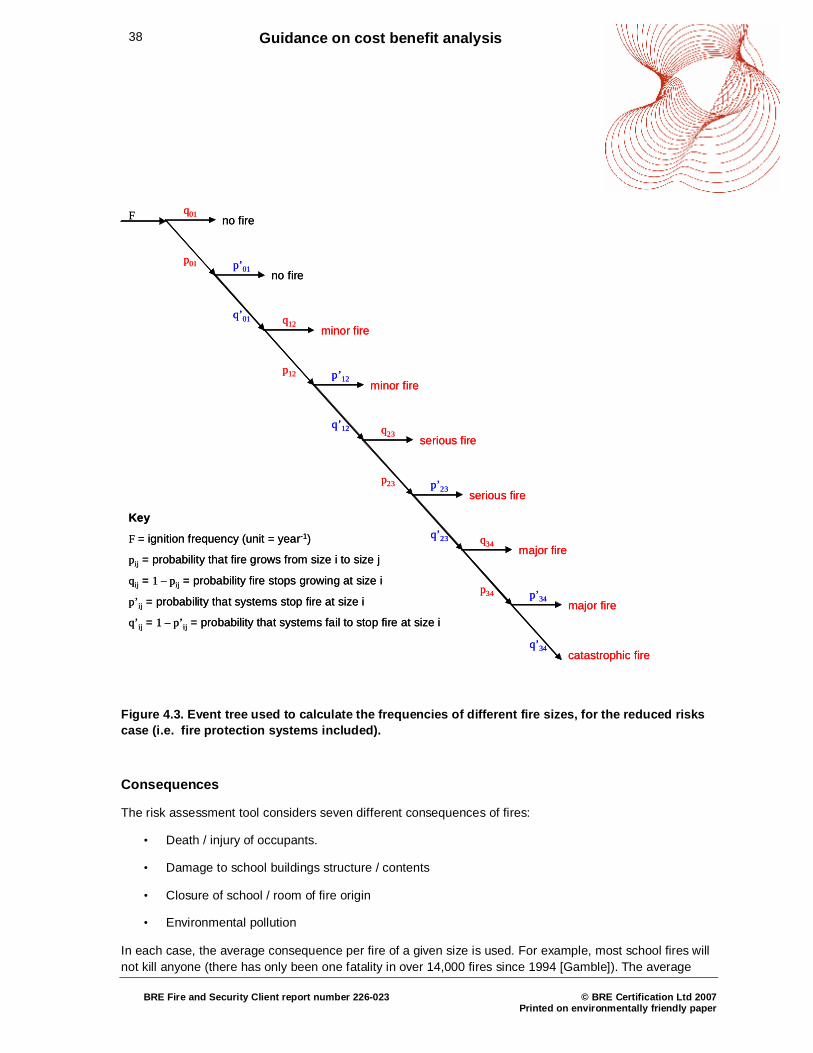
no fireq01
p01
major firep’34
q’34
no firep’01
q’01
minor fireq12
p12
minor firep’12
q’12
major fireq34
p34
serious firep’23
q’23
serious fireq23
p23
F
catastrophic fire
Key
F = ignition frequency (unit = year-1)
pij = probability that fire grows from size i to size j
qij = 1 – pij = probability fire stops growing at size i
p’ij = probability that systems stop fire at size i
q’ij = 1 – p’ij = probability that systems fail to stop fire at size i
Figure 4.3. Event tree used to calculate the frequencies of different fire sizes, for the reduced risks case (i.e. fire protection systems included).
Consequences
The risk assessment tool considers seven different consequences of fires:
• Death / injury of occupants.
• Damage to school buildings structure / contents
• Closure of school / room of fire origin
• Environmental pollution
In each case, the average consequence per fire of a given size is used. For example, most school fires will not kill anyone (there has only been one fatality in over 14,000 fires since 1994 [Gamble]). The average
39 Guidance on cost benefit analysis
BRE Fire and Security Client report number 226-023
© BRE Certification Ltd 2007
Printed on environmentally friendly paper
number of deaths per fire will therefore be very small (~10-4), even though when a particular fire occurs the number of deaths will be an integer (0, 1, …).
We handle different consequences by converting them all to monetary terms. These are assumed to be the replacement costs (or Willingness-to-Pay values to prevent deaths / injuries, see Section 5). If desired, the tool could be modified to consider uninsured losses instead (by insuring the maximum loss for each risk scenario could not be greater than the insurance policy excess) – this would require some editing of the formulae in the “Risk ~ <roomname>” sheets, or in the “Risk summary” sheets. See Section 5 for suggestions on how to do this.
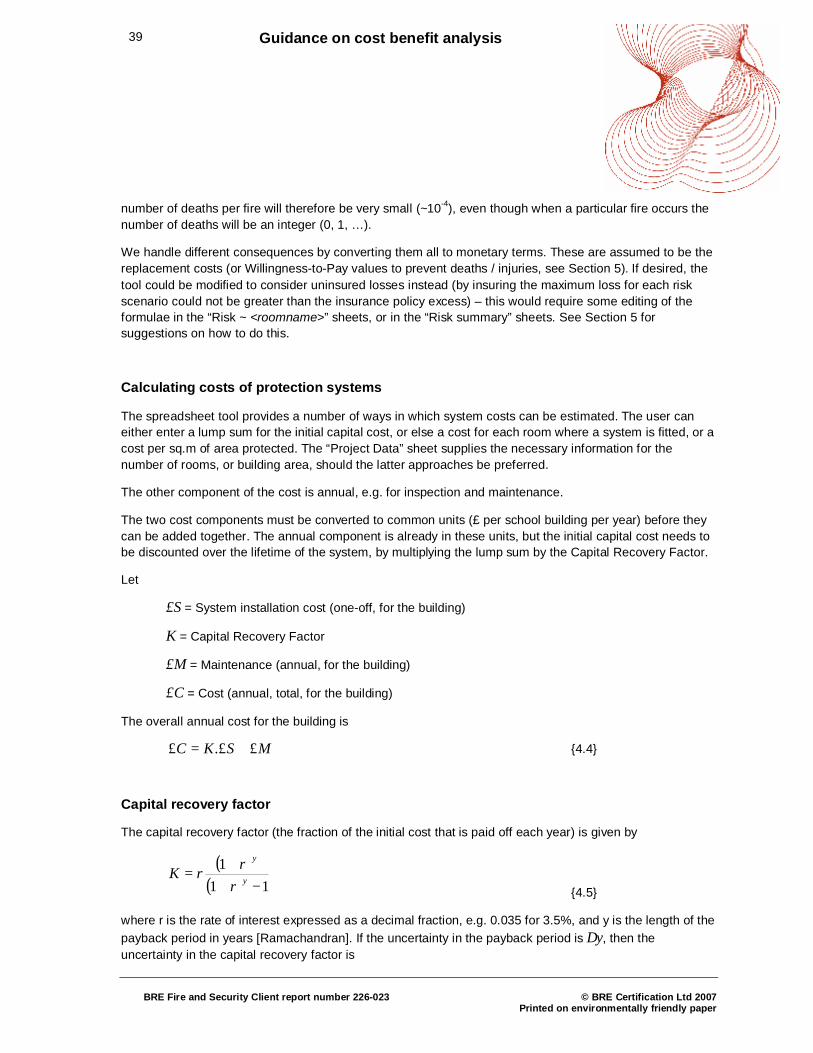
Calculating costs of protection systems
The spreadsheet tool provides a number of ways in which system costs can be estimated. The user can either enter a lump sum for the initial capital cost, or else a cost for each room where a system is fitted, or a cost per sq.m of area protected. The “Project Data” sheet supplies the necessary information for the number of rooms, or building area, should the latter approaches be preferred.
The other component of the cost is annual, e.g. for inspection and maintenance.
The two cost components must be converted to common units (£ per school building per year) before they can be added together. The annual component is already in these units, but the initial capital cost needs to be discounted over the lifetime of the system, by multiplying the lump sum by the Capital Recovery Factor.
Let
£S = System installation cost (one-off, for the building)
K = Capital Recovery Factor
£M = Maintenance (annual, for the building)
£C = Cost (annual, total, for the building)
The overall annual cost for the building is
MSKC £.££ += {4.4}
Capital recovery factor
The capital recovery factor (the fraction of the initial cost that is paid off each year) is given by
( )( ) 11
1−+
+= y
y
rrrK
{4.5}
where r is the rate of interest expressed as a decimal fraction, e.g. 0.035 for 3.5%, and y is the length of the payback period in years [Ramachandran]. If the uncertainty in the payback period is ∆y, then the uncertainty in the capital recovery factor is
40 Guidance on cost benefit analysis
BRE Fire and Security Client report number 226-023
© BRE Certification Ltd 2007
Printed on environmentally friendly paper
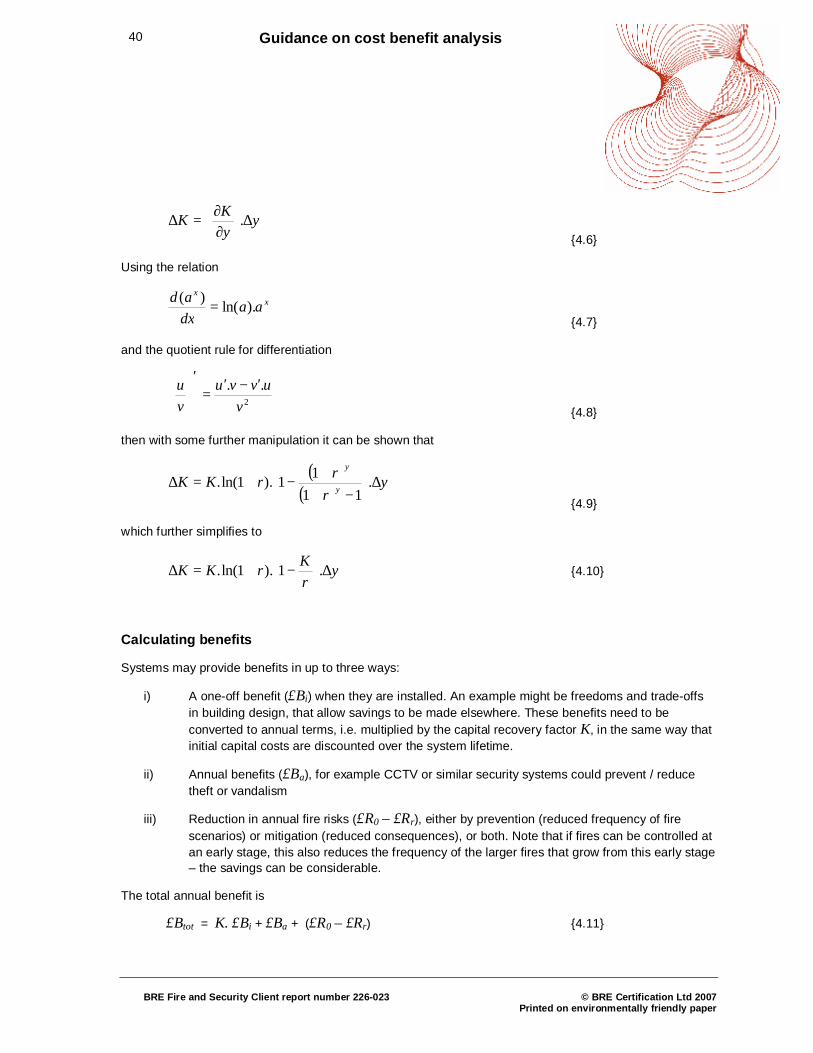
y
yKK ∆
∂∂
=∆ . {4.6}
Using the relation
xx
aadxad ).ln()(
= {4.7}
and the quotient rule for differentiation
2
..v
uvvuvu ′−′
=′
{4.8}
then with some further manipulation it can be shown that
( )( )
yr
rrKK y
y
∆
−++
−+=∆ .11
11).1ln(. {4.9}
which further simplifies to
yrKrKK ∆
−+=∆ .1).1ln(. {4.10}
Calculating benefits
Systems may provide benefits in up to three ways:
i) A one-off benefit (£Bi) when they are installed. An example might be freedoms and trade-offs in building design, that allow savings to be made elsewhere. These benefits need to be converted to annual terms, i.e. multiplied by the capital recovery factor K, in the same way that initial capital costs are discounted over the system lifetime.
ii) Annual benefits (£Ba), for example CCTV or similar security systems could prevent / reduce theft or vandalism
iii) Reduction in annual fire risks (£R0 – £Rr), either by prevention (reduced frequency of fire scenarios) or mitigation (reduced consequences), or both. Note that if fires can be controlled at an early stage, this also reduces the frequency of the larger fires that grow from this early stage – the savings can be considerable.
The total annual benefit is
£Btot = K. £Bi + £Ba + (£R0 – £Rr) {4.11}
41 Guidance on cost benefit analysis
BRE Fire and Security Client report number 226-023
© BRE Certification Ltd 2007
Printed on environmentally friendly paper
In order for prevention or mitigation measures to be cost-effective, the following inequality needs to be satisfied (where £C is the total annual cost):
0££ ≥− CBtot {4.12}
Note: it is slightly more rigorous to express the cost benefits in this format, rather than the alternative (benefit: cost ratio > 1), when it comes to handling the uncertainties and confidence levels – see later.
Uncertainty and inaccuracy
Most if not all values will have some uncertainty associated with them.
We define the uncertainty U by specifying a range within which the true value lies.
UVV estimatetrue ±= {4.13}
We have chosen to define “inaccuracy” as the fractional uncertainty (expressed as a percentage in the spreadsheets)
estimateVUI = {4.14}
If two quantities are added together, the uncertainty of the result is given by
22
2121 UUU +=+ {4.15}
If two quantities are multiplied together, the inaccuracy of the result is given by
22
2121 III +=× {4.16}
Before progressing, a comment should be made concerning uncertainties. These are generally quoted in the form “ x ± y “, where x is the value, and y the corresponding uncertainty. In most cases there has been an implicit assumption/approximation that the value is Normally-distributed. The uncertainty will be quoted either as 1 or 2 standard deviations of the distribution (the text will specify which). Usually this Normal approximation gets worse as the uncertainty gets larger. This explains why the uncertainty (particularly when quoted as 2 standard deviations) may appear to be larger than the value, when a negative value would be a physical impossibility. Although the standard deviation is correct, the distribution is skewed, rather than symmetrical as would be the case for a Normal distribution. Nevertheless the “± “ symbol has been retained as a convenient shorthand.
The net difference between benefit and cost is defined as N, and is made up from various components for each of the benefits and costs. The difference is simply
CBN −= {4.17}
42 Guidance on cost benefit analysis
BRE Fire and Security Client report number 226-023
© BRE Certification Ltd 2007
Printed on environmentally friendly paper
where ∑=i
ibB and ∑=j
jcC
and the subscripts i and j refer to each of the individual benefits and costs, respectively. Each component will make a contribution to the uncertainty
ii
i bbNN ∆
∂∂
=∆ for a benefit, {4.18}
jj
j ccNN ∆
∂∂
=∆ for a cost {4.19}
and the overall uncertainty in the difference is given by adding each of the (independent) component uncertainties in quadrature:
2
2
22
2j
j ji
i i
ccNb
bNN ∆
∂∂
+∆
∂∂
=∆ ∑∑ {4.20}
Each of the benefit and cost uncertainties may in turn be comprised of a number of sub-components. Consider for example the benefit due to the number of deaths prevented, given by
DVb ddd ..ε= {4.21}
where dV is the value of each life saved, dε is the effectiveness of the system(s) at preventing deaths, and
D is the expected annual number of deaths in the absence of the system(s). As before, the individual component uncertainties add in quadrature, thus
( ) 22
22
22
2 DDbbV
Vbb d
dd
dd
d
dd ∆
∂∂
+∆
∂∂
+∆
∂∂
=∆ εε
{4.22}
Evaluating the individual derivatives, substituting and simplifying gives
2222
∆
+
∆+
∆=
∆DD
VV
bb
d
d
d
d
d
d
εε
{4.23}
Note that we started with an equation for the uncertainty of a variable that was a product of other variables, and ended up with a simplified expression in terms of the fractional uncertainty, or “inaccuracy”, thus demonstrating the derivation of equation {C.16}.
The process could be continued at increasing levels of detail, for example the estimates of the system effectiveness dε and the expected number of deaths D may both in turn depend on a number of more fundamental factors.
A similar approach can be used for all the benefit and cost components, which can then be substituted into the general equation above for the overall uncertainty in the benefit: cost difference.
43 Guidance on cost benefit analysis
BRE Fire and Security Client report number 226-023
© BRE Certification Ltd 2007
Printed on environmentally friendly paper
Confidence levels
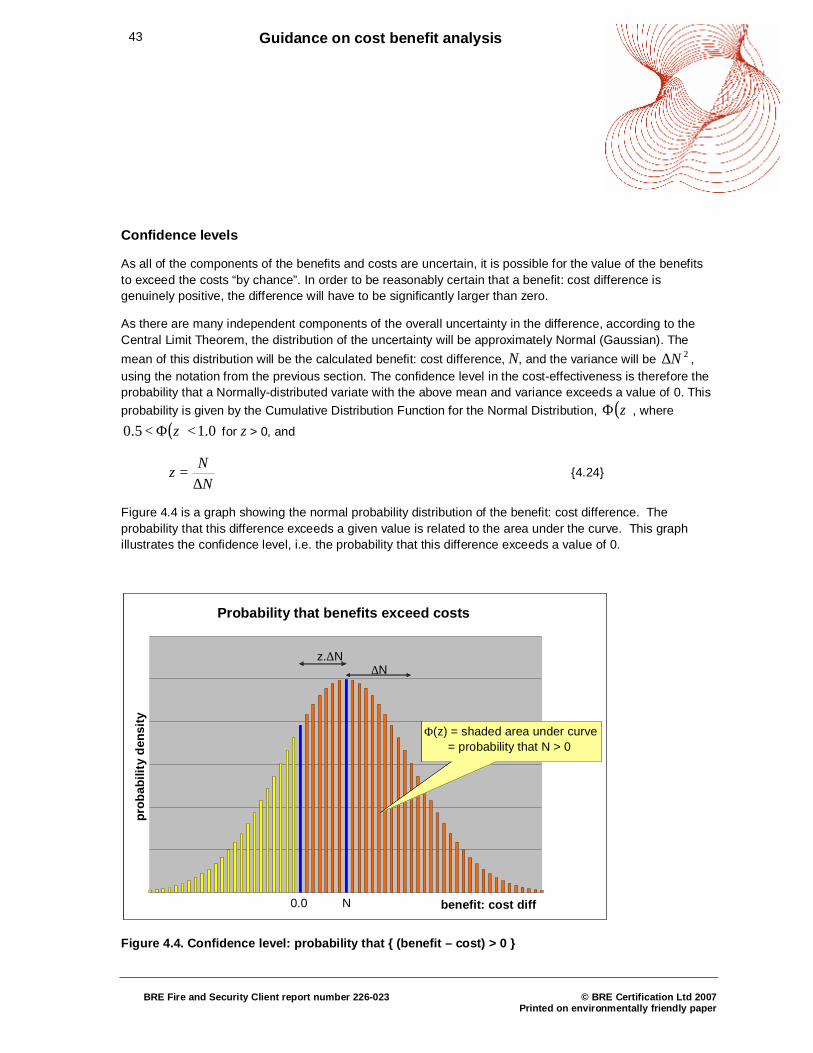
As all of the components of the benefits and costs are uncertain, it is possible for the value of the benefits to exceed the costs “by chance”. In order to be reasonably certain that a benefit: cost difference is genuinely positive, the difference will have to be significantly larger than zero.
As there are many independent components of the overall uncertainty in the difference, according to the Central Limit Theorem, the distribution of the uncertainty will be approximately Normal (Gaussian). The mean of this distribution will be the calculated benefit: cost difference, N, and the variance will be 2N∆ , using the notation from the previous section. The confidence level in the cost-effectiveness is therefore the probability that a Normally-distributed variate with the above mean and variance exceeds a value of 0. This probability is given by the Cumulative Distribution Function for the Normal Distribution, ( )zΦ , where
( ) 0.15.0 <Φ< z for z > 0, and
N
Nz∆
= {4.24}
Figure 4.4 is a graph showing the normal probability distribution of the benefit: cost difference. The probability that this difference exceeds a given value is related to the area under the curve. This graph illustrates the confidence level, i.e. the probability that this difference exceeds a value of 0.
Probability that benefits exceed costs
benefit: cost diff
prob
abili
ty d
ensi
ty
0.0 N
z.∆N∆N
Φ(z) = shaded area under curve = probability that N > 0
Probability that benefits exceed costs
benefit: cost diff
prob
abili
ty d
ensi
ty
0.0 N
z.∆N∆N
Φ(z) = shaded area under curve = probability that N > 0
Figure 4.4. Confidence level: probability that { (benefit – cost) > 0 }
44 Guidance on cost benefit analysis
BRE Fire and Security Client report number 226-023
© BRE Certification Ltd 2007
Printed on environmentally friendly paper
Note that it is possible for the benefit: cost difference to exceed 0, even if the mean value of the distribution is less than 0. However, from the symmetry of Figure 4.4, it is clear that the confidence level will always be less than 50% in such cases.
It is common practice to require a confidence level of 95% in order to be “reasonably certain” an observed result did not arise by chance. This requires the value of z to be equal to 1.65, and hence for 95% confidence or greater,
NN ∆≥ 65.1 {4.25}
from equation {4.24}
Note – it is slightly more rigorous to use the difference between the benefits and costs, rather than the ratio. This is because the probability distribution of the ratio is not close to a Normal distribution if the ratio differs greatly from 1, and the confidence level will not be correct. However the distribution of the difference between benefit and cost is approximately Normal regardless of the value of the difference. This is a minor point however, and if ratios are used with the assumption of Normality, the confidence level will be high for ratio >>1 (as long as the uncertainty is not too large) thus the decision-making is unlikely to be adversely affected.
Uncertainty analysis and estimation of confidence levels are essential parts of a cost-benefit calculation, since a single value “answer” without any estimate of its uncertainty does not contain enough information for a rational decision to be made. This section has presented a fairly simple uncertainty analysis, that allows cost-benefit analysis to be performed by a spreadsheet tool. For more sophisticated analyses (e.g. uncertainties that do not approximately follow a Normal distribution, or non-independent component variables), Monte-Carlo techniques can be employed to derive the probability distributions of cost-benefit outcomes [Notarianni 2002].
References for Section 4
HM Treasury, “The green book: appraisal and evaluation in central government”, ISBN 0115601074, January 2003
Notarianni, K, “Uncertainty”, The SFPE Handbook of Fire Protection Engineering, Third Edition, chapter 5-4, pub. Society of Fire Protection Engineers, 2002. IBSN 087765 4514
Ramachandran G, “The Economics of Fire Protection”, pub. E&FN Spon, p22, 1998.
45 Guidance on cost benefit analysis
BRE Fire and Security Client report number 226-023
© BRE Certification Ltd 2007
Printed on environmentally friendly paper
5 Different measures of risk
Deaths
The number of deaths in school fires is very small.
During the period 1994-2002, only one person died, in approximately 14,700 fires. The casualty was a 56-year old man, who died from burns. He was found in the place of fire origin (the roof space) where he had been working with a blow lamp (or similar heat source). The fire occurred at about 1445 on Saturday 22 Feb 1997 [Gamble 1994-2002].
The value of a human life is determined by HM Treasury on the basis of Willingness-to-Pay to prevent a fatality. This value was originally calculated by the Department of Transport, when justifying road safety improvements, but has since been more widely adopted throughout Government. The value in 2002 was £1.24 million [HM Treasury; Dennison]. This value should be increased in line with rises in GDP, year on year [Cruickshank].
Injuries
The number of injuries in school fires is also quite small. During the period 1994-2002, 461 people were injured, an average of 51 per year, and 0.03 injuries per fire.
Injuries may have varying degrees of severity. In 2002, there were 46 injuries, as follows:
• 14 people suffering from smoke inhalation
• 5 people suffering from burns
• 4 people suffering from physical injuries (cuts, sprains, abrasions, etc)
• 2 people suffering from shock
• 2 people suffering from other injuries
• 19 people referred to hospital for precautionary checks
The value of preventing injuries is also determined by [HM Treasury] on the basis of Willingness-to-Pay. In 2002, serious injuries were given a value of £140k, and minor injuries £11k. If it is assumed that:
• the data above is typical for the proportions of different injuries each year
• 25% of smoke inhalation, and 100% of burns are classed as “serious” injuries
• 75% of smoke inhalation, and 100% of physical injuries and 100% of shock are “minor” injuries
• 100% of precautionary checks are negligible injuries
46 Guidance on cost benefit analysis
BRE Fire and Security Client report number 226-023
© BRE Certification Ltd 2007
Printed on environmentally friendly paper
• other injuries have the same proportions of severe / minor same as all other injury types combined
(not including precautionary check)
then 9.18 people / 46 people have severe injuries (20%), 17.82 people / 44 people have minor injuries (39%), and 19 people / 46 people (41%) have negligible injuries.
The weighted average value of an injury is therefore £32k.
Building fabric
Damage to the building fabric (rebuilding / refurbishment costs) is measured directly in monetary terms. It is assumed that most of the damage will be caused by heat or direct burning. Damage will therefore tend to be confined to the room of origin, for most (non-catastrophic) fires.
Building contents
Damage to the contents (replacement costs) is also measured directly in monetary terms. Contents include furniture, equipment, books, etc. Loss of coursework / administrative paperwork could either be lumped with building contents, or included under business interruption. Smoke, as well as heat and direct burning, may also damage contents. The extent of damage is likely to be greater than damage to the building fabric (although the latter may cost more to repair / replace).
Business interruption
Business interruption is measured in days. The cost conversion should take account of the fraction of the school that is unusable, as well as the duration. Costs include provision of temporary accommodation, or transporting pupils and staff to alternative premises. Costs also include loss of community amenities / revenue, if the school is used outside school hours.
Update: business interruption now has two components, one for the time that the whole building is closed, and one for the additional time that the room of fire origin is unavailable (do not double-count the room unavailability while the whole building is also closed). This has been done to allow a more accurate estimate for the impact of minor fires.
Environmental damage
This is measured in Ecopoints. The average UK citizen has an annual environmental impact defined as 100 Ecopoints. A BRE Digest [no.446] provides a full description of Ecopoints and how they can be applied.
An average person produces 12,300 kg CO2 (equivalent) per year, which constitutes 35% of their overall impact (i.e. 35 Ecopoints). Each kg CO2 is therefore equivalent to 0.0029 Ecopoints. Fires also produce CO2 as a combustion product. A cellulosic fuel (wood, paper) produces 1.6 kg of CO2 for each kg of fuel consumed. For plastics, the ratio is nearer 3:1.
47 Guidance on cost benefit analysis
BRE Fire and Security Client report number 226-023
© BRE Certification Ltd 2007
Printed on environmentally friendly paper
It has been estimated that the value of preventing 1 Ecopoint worth of environmental damage is about £50. The environmental impact of most fires, in monetary terms, will therefore be very small.
Insurance
Insurance premiums and excesses are not considered as risk measures. If an insurance company allows reductions in premiums when certain systems are in place, these may be considered as annual benefits.
Users of the tool may wish to see what happens if an insurance company offers a reduced excess when certain systems are in place. This is slightly more involved than normal operation of the tool (which just involves “switching” systems “on/off” via the “Cost Summary & CBA” sheet, and seeing how the net benefit and confidence levels change. However, it is possible, by following the procedure outlined below.
1. Make a back-up copy of the tool before starting, in case you make a mistake!
2. Switch “on” all the appropriate systems via the “Cost Summary & CBA” sheet.
3. Edit the “Loss ~ <roomname> (<n>)” sheets so that the total monetary consequence of the scenario cannot exceed the insurance excess. Note that the excess will differ for the baseline (no systems) and reduced risks case. You will need to make these modifications to each of the “Loss…” sheets (3 for each room name, plus 1 for catastrophic loss):
Cell Current formula New formula
B5 =SUM(B7:B13) =MIN(SUM(B7:B13),<base excess>)
I5 =SUM(I7:I13) =MIN(SUM(I7:I13),<reduced excess>)
4. Go back to the “Cost Summary & CBA” sheet to see what the net benefit and confidence levels are.
References for Section 5
BRE Digest 446, "Assessing environmental impacts of construction: Industry consensus, BREEAM and UK Ecopoints"
Cruickshank, S, Private Communication (“Comments on BRE draft final report 204505: Effectiveness of sprinklers in residential premises”) , 30 January 2004
Dennison, S, Private Communication (“Comments on BRE draft report 203173: Effectiveness of sprinklers in residential premises – cost benefit analysis”), 10 May 2002
Gamble, J, “Fire Statistics User Guide”, Home Office Statistical Bulletin Issue 1/98, December 1998.
Gamble, J, private communication (Home Office fire statistics databases 1994-2002)
HM Treasury, “The green book: appraisal and evaluation in central government”, ISBN 0115601074, January 2003
48 Guidance on cost benefit analysis
BRE Fire and Security Client report number 226-023
© BRE Certification Ltd 2007
Printed on environmentally friendly paper
6 Risk scenarios: assumptions and data
For all risk scenarios, we have assumed there are four levels of severity:
• Minor fire – burning confined to the item first ignited, smoke spread contained within the room of origin
• Serious fire – burning confined to the room of origin, smoke spread beyond
• Major fire – burning beyond the room of origin
• Catastrophic fire – widespread fire damage to majority of building
All fires start as “minor”, but there are possibilities for them to pass through the stages “serious”, “major” and “catastrophic”. As room geometry may be a factor in determining whether the fire will continue to grow, the transition probabilities depend on the location of the fire origin, as well as the magnitude of the fire in the “precursor” stage.
The consequences of the fires also depend upon the location of the fire origin as well as the ultimate fire size. The exception to this is a catastrophic fire, which causes such widespread damage that the location of the fire origin is not important in determining the amount of loss.
In the spreadsheet tool, the starting point for the determination of the number of fires expected is the number of fires in rooms of different types. The total number of fires in UK school rooms of different types can be extracted fairly easily from the UK fire statistics. However the number of rooms is not known directly, and has to be estimated. There is a further complication, in that schools (and the fire statistics) have a great many room types, yet the spreadsheet only defines 7 generic types – classroom, cloakroom, corridor, lab, main hall, office, and store. In order to avoid disrupting the flow of text, details of this analysis have been left to the end of this Section.
For each of the scenarios,
• Transition probabilities were estimated from an analysis of the fire statistics [Gamble]
• Deaths and injuries were estimated from the fire statistics, supplemented by expert judgement
• Building and contents damage and business interruption were mainly based on insurance estimates [Blackie]
Supplementary information was also used to inform expert judgement estimates [Dennison, DfES]
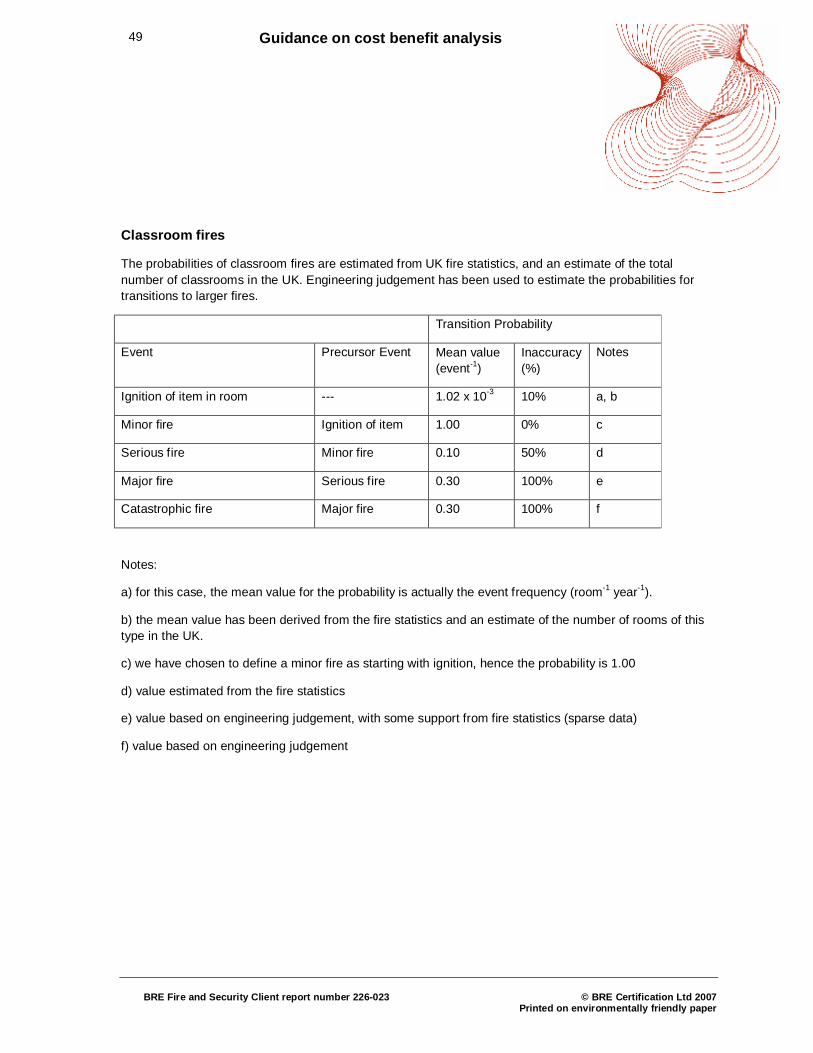
49 Guidance on cost benefit analysis
BRE Fire and Security Client report number 226-023
© BRE Certification Ltd 2007
Printed on environmentally friendly paper
Classroom fires
The probabilities of classroom fires are estimated from UK fire statistics, and an estimate of the total number of classrooms in the UK. Engineering judgement has been used to estimate the probabilities for transitions to larger fires.
Transition Probability
Event Precursor Event Mean value (event-1)
Inaccuracy (%)
Notes
Ignition of item in room --- 1.02 x 10⁻³ 10% a, b
Minor fire Ignition of item 1.00 0% c
Serious fire Minor fire 0.10 50% d
Major fire Serious fire 0.30 100% e
Catastrophic fire Major fire 0.30 100% f
Notes:
a) for this case, the mean value for the probability is actually the event frequency (room-1 year-1).
b) the mean value has been derived from the fire statistics and an estimate of the number of rooms of this type in the UK.
c) we have chosen to define a minor fire as starting with ignition, hence the probability is 1.00
d) value estimated from the fire statistics
e) value based on engineering judgement, with some support from fire statistics (sparse data)
f) value based on engineering judgement
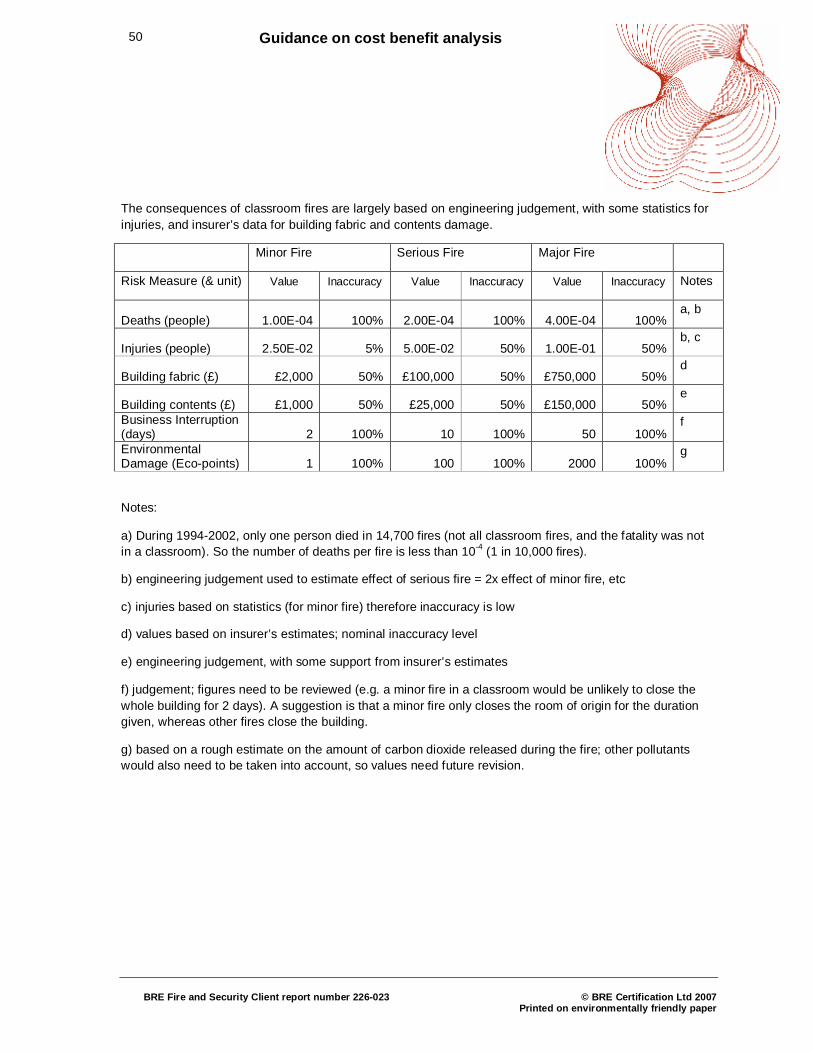
50 Guidance on cost benefit analysis
BRE Fire and Security Client report number 226-023
© BRE Certification Ltd 2007
Printed on environmentally friendly paper
The consequences of classroom fires are largely based on engineering judgement, with some statistics for injuries, and insurer’s data for building fabric and contents damage.
Minor Fire Serious Fire Major Fire
Risk Measure (& unit) Value Inaccuracy Value Inaccuracy Value Inaccuracy Notes
Deaths (people) 1.00E-04 100% 2.00E-04 100% 4.00E-04 100% a, b
Injuries (people) 2.50E-02 5% 5.00E-02 50% 1.00E-01 50% b, c
Building fabric (£) £2,000 50% £100,000 50% £750,000 50% d
Building contents (£) £1,000 50% £25,000 50% £150,000 50% e
Business Interruption (days) 2 100% 10 100% 50 100%
f
Environmental Damage (Eco-points) 1 100% 100 100% 2000 100%
g
Notes:
a) During 1994-2002, only one person died in 14,700 fires (not all classroom fires, and the fatality was not in a classroom). So the number of deaths per fire is less than 10-4 (1 in 10,000 fires).
b) engineering judgement used to estimate effect of serious fire = 2x effect of minor fire, etc
c) injuries based on statistics (for minor fire) therefore inaccuracy is low
d) values based on insurer’s estimates; nominal inaccuracy level
e) engineering judgement, with some support from insurer’s estimates
f) judgement; figures need to be reviewed (e.g. a minor fire in a classroom would be unlikely to close the whole building for 2 days). A suggestion is that a minor fire only closes the room of origin for the duration given, whereas other fires close the building.
g) based on a rough estimate on the amount of carbon dioxide released during the fire; other pollutants would also need to be taken into account, so values need future revision.
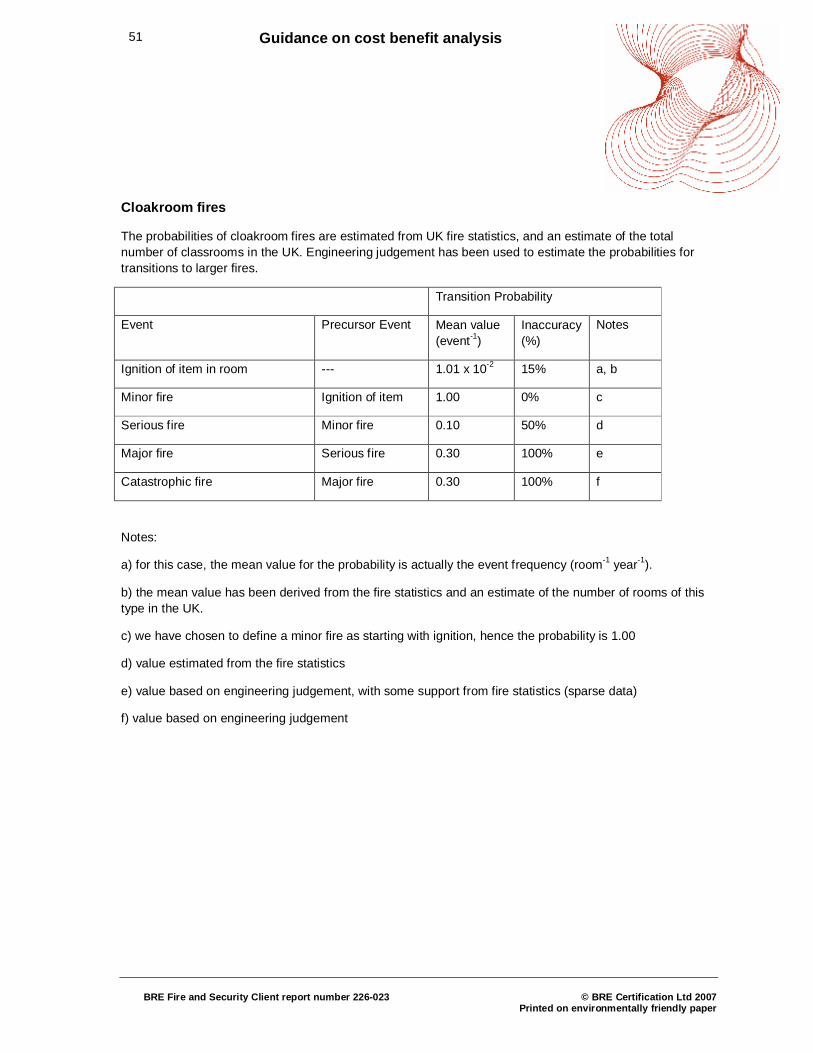
51 Guidance on cost benefit analysis
BRE Fire and Security Client report number 226-023
© BRE Certification Ltd 2007
Printed on environmentally friendly paper
Cloakroom fires
The probabilities of cloakroom fires are estimated from UK fire statistics, and an estimate of the total number of classrooms in the UK. Engineering judgement has been used to estimate the probabilities for transitions to larger fires.
Transition Probability
Event Precursor Event Mean value (event-1)
Inaccuracy (%)
Notes
Ignition of item in room --- 1.01 x 10⁻² 15% a, b
Minor fire Ignition of item 1.00 0% c
Serious fire Minor fire 0.10 50% d
Major fire Serious fire 0.30 100% e
Catastrophic fire Major fire 0.30 100% f
Notes:
a) for this case, the mean value for the probability is actually the event frequency (room-1 year-1).
b) the mean value has been derived from the fire statistics and an estimate of the number of rooms of this type in the UK.
c) we have chosen to define a minor fire as starting with ignition, hence the probability is 1.00
d) value estimated from the fire statistics
e) value based on engineering judgement, with some support from fire statistics (sparse data)
f) value based on engineering judgement

52 Guidance on cost benefit analysis
BRE Fire and Security Client report number 226-023
© BRE Certification Ltd 2007
Printed on environmentally friendly paper
The consequences of cloakroom fires are largely based on engineering judgement, with some statistics for injuries, and insurer’s data for building fabric and contents damage.
Minor Fire Serious Fire Major Fire
Risk Measure (& unit) Value Inaccuracy Value Inaccuracy Value Inaccuracy Notes
Deaths (people) 1.00E-04 100% 2.00E-04 100% 4.00E-04 100% a, b
Injuries (people) 2.50E-02 5% 5.00E-02 50% 1.00E-01 50% b, c
Building fabric (£) £2,000 50% £100,000 50% £750,000 50% d
Building contents (£) £1,000 50% £25,000 50% £150,000 50% e
Business Interruption (days) 2 100% 10 100% 50 100%
f
Environmental Damage (Eco-points) 1 100% 100 100% 2000 100%
g
Notes:
a) assumed similar to classroom fire in severity
b) engineering judgement used to estimate effect of serious fire = 2x effect of minor fire, etc
c) injuries based on statistics (for minor fire) therefore inaccuracy is low
d) values based on insurer’s estimates; nominal inaccuracy level
e) engineering judgement, with some support from insurer’s estimates
f) judgement; figures need to be reviewed. A suggestion is that a minor fire only closes the room of origin for the duration given, whereas other fires close the building.
g) based on a rough estimate on the amount of carbon dioxide released during the fire; other pollutants would also need to be taken into account, so values need future revision.

53 Guidance on cost benefit analysis
BRE Fire and Security Client report number 226-023
© BRE Certification Ltd 2007
Printed on environmentally friendly paper
Corridor fires
The probabilities of corridor fires are estimated from UK fire statistics, and an estimate of the total number of classrooms in the UK. Engineering judgement has been used to estimate the probabilities for transitions to larger fires.
Transition Probability
Event Precursor Event Mean value (event-1)
Inaccuracy (%)
Notes
Ignition of item in room --- 6.46 x 10⁻⁴ 10% a, b
Minor fire Ignition of item 1.00 0% c
Serious fire Minor fire 0.10 50% d
Major fire Serious fire 0.60 100% e
Catastrophic fire Major fire 0.30 100% f
Notes:
a) for this case, the mean value for the probability is actually the event frequency (room-1 year-1).
b) the mean value has been derived from the fire statistics and an estimate of the number of rooms of this type in the UK.
c) we have chosen to define a minor fire as starting with ignition, hence the probability is 1.00
d) value estimated from the fire statistics
e) value based on engineering judgement, with some support from fire statistics (sparse data)
f) value based on engineering judgement

54 Guidance on cost benefit analysis
BRE Fire and Security Client report number 226-023
© BRE Certification Ltd 2007
Printed on environmentally friendly paper
The consequences of corridor fires are largely based on engineering judgement, with some statistics for injuries, and insurer’s data for building fabric and contents damage.
Minor Fire Serious Fire Major Fire
Risk Measure (& unit) Value Inaccuracy Value Inaccuracy Value Inaccuracy Notes
Deaths (people) 1.00E-04 100% 2.00E-04 100% 4.00E-04 100% a, b
Injuries (people) 2.50E-02 5% 5.00E-02 50% 1.00E-01 50% b, c
Building fabric (£) £2,000 50% £100,000 50% £750,000 50% d
Building contents (£) £1,000 50% £25,000 50% £150,000 50% e
Business Interruption (days) 2 100% 10 100% 50 100%
f
Environmental Damage (Eco-points) 1 100% 100 100% 2000 100%
g
Notes:
a) assumed similar to classroom fire in severity
b) engineering judgement used to estimate effect of serious fire = 2x effect of minor fire, etc
c) injuries based on statistics (for minor fire) therefore inaccuracy is low
d) values based on insurer’s estimates; nominal inaccuracy level
e) engineering judgement, with some support from insurer’s estimates
f) judgement; figures need to be reviewed. A suggestion is that a minor fire only closes the room of origin for the duration given, whereas other fires close the building.
g) based on a rough estimate on the amount of carbon dioxide released during the fire; other pollutants would also need to be taken into account, so values need future revision.

55 Guidance on cost benefit analysis
BRE Fire and Security Client report number 226-023
© BRE Certification Ltd 2007
Printed on environmentally friendly paper
Laboratory fires
The probabilities of Laboratory fires are estimated from UK fire statistics, and an estimate of the total number of classrooms in the UK. Engineering judgement has been used to estimate the probabilities for transitions to larger fires.
Transition Probability
Event Precursor Event Mean value (event-1)
Inaccuracy (%)
Notes
Ignition of item in room --- 1.41 x 10⁻⁴ 10% a, b
Minor fire Ignition of item 1.00 0% c
Serious fire Minor fire 0.10 50% d
Major fire Serious fire 0.30 100% e
Catastrophic fire Major fire 0.30 100% f
Notes:
a) for this case, the mean value for the probability is actually the event frequency (room-1 year-1).
b) the mean value has been derived from the fire statistics and an estimate of the number of rooms of this type in the UK.
c) we have chosen to define a minor fire as starting with ignition, hence the probability is 1.00
d) value estimated from the fire statistics
e) value based on engineering judgement, with some support from fire statistics (sparse data)
f) value based on engineering judgement
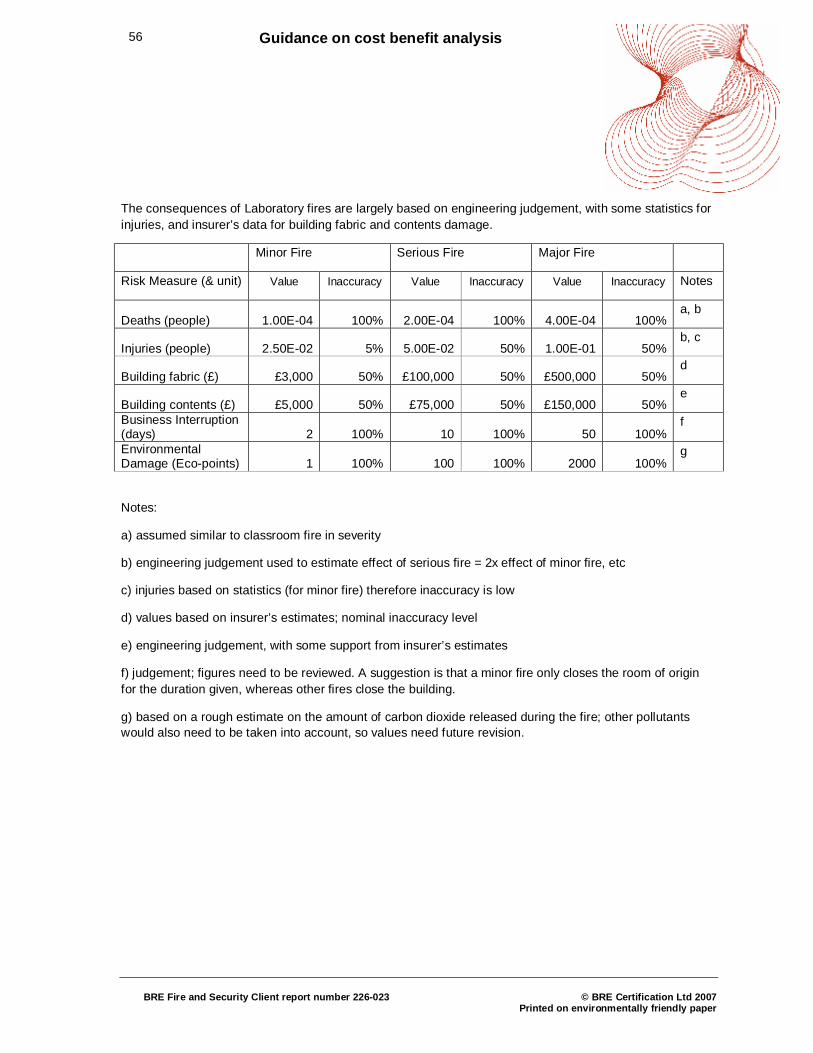
56 Guidance on cost benefit analysis
BRE Fire and Security Client report number 226-023
© BRE Certification Ltd 2007
Printed on environmentally friendly paper
The consequences of Laboratory fires are largely based on engineering judgement, with some statistics for injuries, and insurer’s data for building fabric and contents damage.
Minor Fire Serious Fire Major Fire
Risk Measure (& unit) Value Inaccuracy Value Inaccuracy Value Inaccuracy Notes
Deaths (people) 1.00E-04 100% 2.00E-04 100% 4.00E-04 100% a, b
Injuries (people) 2.50E-02 5% 5.00E-02 50% 1.00E-01 50% b, c
Building fabric (£) £3,000 50% £100,000 50% £500,000 50% d
Building contents (£) £5,000 50% £75,000 50% £150,000 50% e
Business Interruption (days) 2 100% 10 100% 50 100%
f
Environmental Damage (Eco-points) 1 100% 100 100% 2000 100%
g
Notes:
a) assumed similar to classroom fire in severity
b) engineering judgement used to estimate effect of serious fire = 2x effect of minor fire, etc
c) injuries based on statistics (for minor fire) therefore inaccuracy is low
d) values based on insurer’s estimates; nominal inaccuracy level
e) engineering judgement, with some support from insurer’s estimates
f) judgement; figures need to be reviewed. A suggestion is that a minor fire only closes the room of origin for the duration given, whereas other fires close the building.
g) based on a rough estimate on the amount of carbon dioxide released during the fire; other pollutants would also need to be taken into account, so values need future revision.
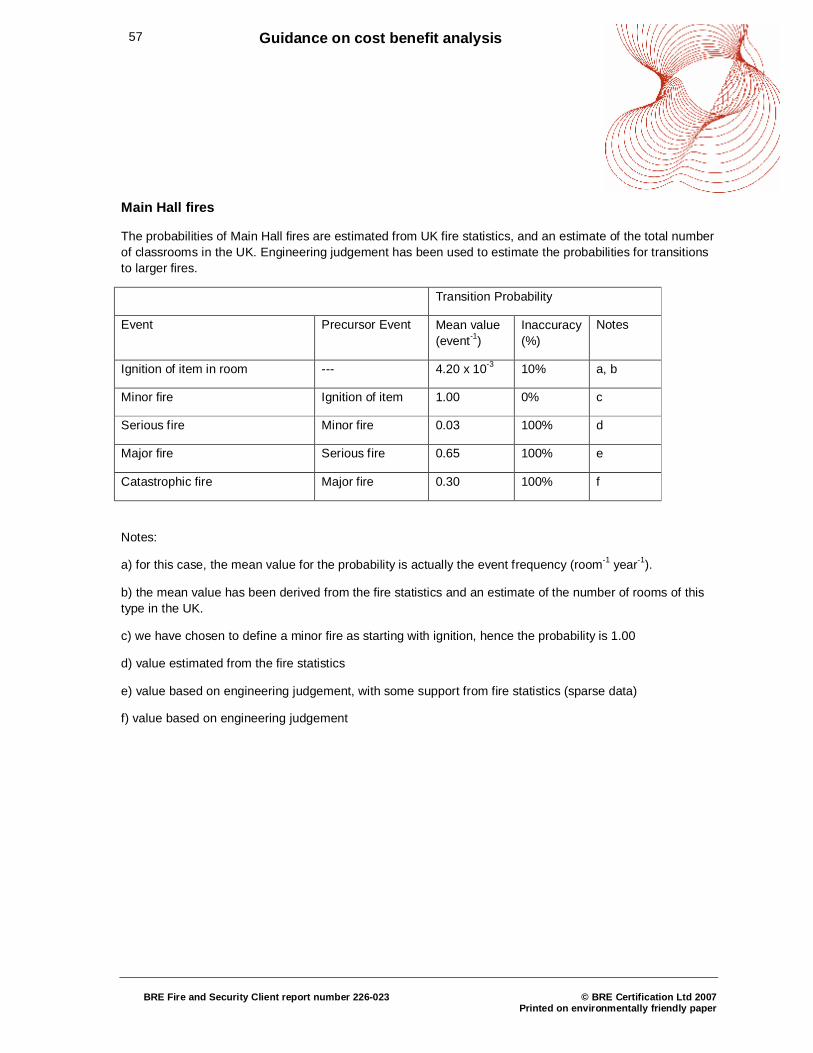
57 Guidance on cost benefit analysis
BRE Fire and Security Client report number 226-023
© BRE Certification Ltd 2007
Printed on environmentally friendly paper
Main Hall fires
The probabilities of Main Hall fires are estimated from UK fire statistics, and an estimate of the total number of classrooms in the UK. Engineering judgement has been used to estimate the probabilities for transitions to larger fires.
Transition Probability
Event Precursor Event Mean value (event-1)
Inaccuracy (%)
Notes
Ignition of item in room --- 4.20 x 10⁻³ 10% a, b
Minor fire Ignition of item 1.00 0% c
Serious fire Minor fire 0.03 100% d
Major fire Serious fire 0.65 100% e
Catastrophic fire Major fire 0.30 100% f
Notes:
a) for this case, the mean value for the probability is actually the event frequency (room-1 year-1).
b) the mean value has been derived from the fire statistics and an estimate of the number of rooms of this type in the UK.
c) we have chosen to define a minor fire as starting with ignition, hence the probability is 1.00
d) value estimated from the fire statistics
e) value based on engineering judgement, with some support from fire statistics (sparse data)
f) value based on engineering judgement
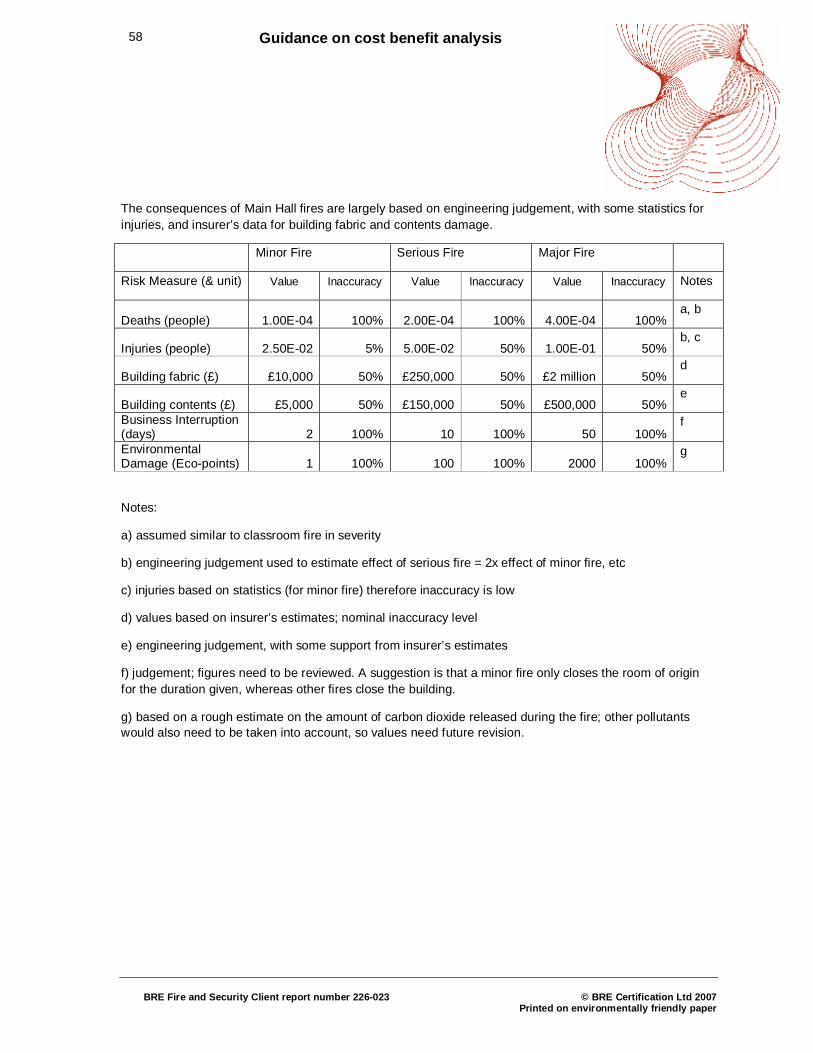
58 Guidance on cost benefit analysis
BRE Fire and Security Client report number 226-023
© BRE Certification Ltd 2007
Printed on environmentally friendly paper
The consequences of Main Hall fires are largely based on engineering judgement, with some statistics for injuries, and insurer’s data for building fabric and contents damage.
Minor Fire Serious Fire Major Fire
Risk Measure (& unit) Value Inaccuracy Value Inaccuracy Value Inaccuracy Notes
Deaths (people) 1.00E-04 100% 2.00E-04 100% 4.00E-04 100% a, b
Injuries (people) 2.50E-02 5% 5.00E-02 50% 1.00E-01 50% b, c
Building fabric (£) £10,000 50% £250,000 50% £2 million 50% d
Building contents (£) £5,000 50% £150,000 50% £500,000 50% e
Business Interruption (days) 2 100% 10 100% 50 100%
f
Environmental Damage (Eco-points) 1 100% 100 100% 2000 100%
g
Notes:
a) assumed similar to classroom fire in severity
b) engineering judgement used to estimate effect of serious fire = 2x effect of minor fire, etc
c) injuries based on statistics (for minor fire) therefore inaccuracy is low
d) values based on insurer’s estimates; nominal inaccuracy level
e) engineering judgement, with some support from insurer’s estimates
f) judgement; figures need to be reviewed. A suggestion is that a minor fire only closes the room of origin for the duration given, whereas other fires close the building.
g) based on a rough estimate on the amount of carbon dioxide released during the fire; other pollutants would also need to be taken into account, so values need future revision.
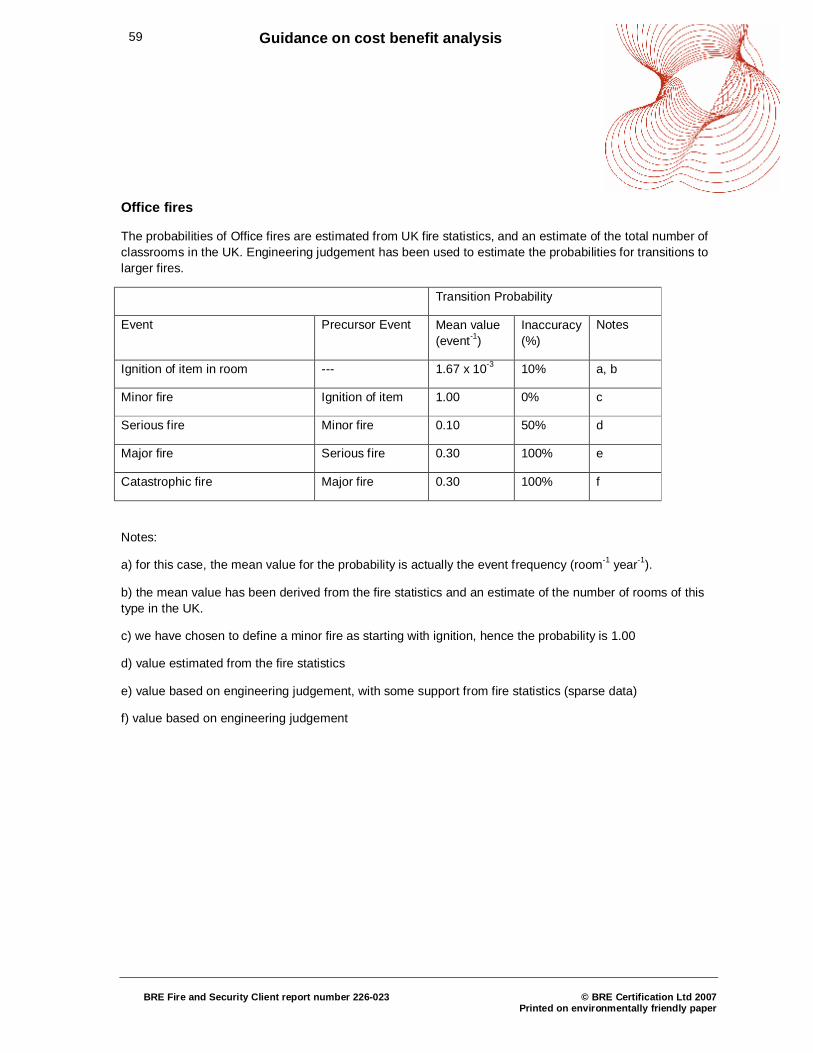
59 Guidance on cost benefit analysis
BRE Fire and Security Client report number 226-023
© BRE Certification Ltd 2007
Printed on environmentally friendly paper
Office fires
The probabilities of Office fires are estimated from UK fire statistics, and an estimate of the total number of classrooms in the UK. Engineering judgement has been used to estimate the probabilities for transitions to larger fires.
Transition Probability
Event Precursor Event Mean value (event-1)
Inaccuracy (%)
Notes
Ignition of item in room --- 1.67 x 10⁻³ 10% a, b
Minor fire Ignition of item 1.00 0% c
Serious fire Minor fire 0.10 50% d
Major fire Serious fire 0.30 100% e
Catastrophic fire Major fire 0.30 100% f
Notes:
a) for this case, the mean value for the probability is actually the event frequency (room-1 year-1).
b) the mean value has been derived from the fire statistics and an estimate of the number of rooms of this type in the UK.
c) we have chosen to define a minor fire as starting with ignition, hence the probability is 1.00
d) value estimated from the fire statistics
e) value based on engineering judgement, with some support from fire statistics (sparse data)
f) value based on engineering judgement

60 Guidance on cost benefit analysis
BRE Fire and Security Client report number 226-023
© BRE Certification Ltd 2007
Printed on environmentally friendly paper
The consequences of Office fires are largely based on engineering judgement, with some statistics for injuries, and insurer’s data for building fabric and contents damage.
Minor Fire Serious Fire Major Fire
Risk Measure (& unit) Value Inaccuracy Value Inaccuracy Value Inaccuracy Notes
Deaths (people) 1.00E-04 100% 2.00E-04 100% 4.00E-04 100% a, b
Injuries (people) 2.50E-02 5% 5.00E-02 50% 1.00E-01 50% b, c
Building fabric (£) £1,000 50% £25,000 50% £150,000 50% d
Building contents (£) £5,000 50% £75,000 50% £150,000 50% e
Business Interruption (days) 2 100% 10 100% 30 100%
f
Environmental Damage (Eco-points) 1 100% 100 100% 2000 100%
g
Notes:
a) assumed similar to classroom fire in severity
b) engineering judgement used to estimate effect of serious fire = 2x effect of minor fire, etc
c) injuries based on statistics (for minor fire) therefore inaccuracy is low
d) values based on insurer’s estimates; nominal inaccuracy level
e) engineering judgement, with some support from insurer’s estimates
f) judgement; figures need to be reviewed. A suggestion is that a minor fire only closes the room of origin for the duration given, whereas other fires close the building.
g) based on a rough estimate on the amount of carbon dioxide released during the fire; other pollutants would also need to be taken into account, so values need future revision.

61 Guidance on cost benefit analysis
BRE Fire and Security Client report number 226-023
© BRE Certification Ltd 2007
Printed on environmentally friendly paper
Store Room fires
The probabilities of store room fires are estimated from UK fire statistics, and an estimate of the total number of classrooms in the UK. Engineering judgement has been used to estimate the probabilities for transitions to larger fires.
Transition Probability
Event Precursor Event Mean value (event-1)
Inaccuracy (%)
Notes
Ignition of item in room --- 3.47 x 10⁻⁴ 10% a, b
Minor fire Ignition of item 1.00 0% c
Serious fire Minor fire 0.10 50% d
Major fire Serious fire 0.30 100% e
Catastrophic fire Major fire 0.30 100% f
Notes:
a) for this case, the mean value for the probability is actually the event frequency (room-1 year-1).
b) the mean value has been derived from the fire statistics and an estimate of the number of rooms of this type in the UK.
c) we have chosen to define a minor fire as starting with ignition, hence the probability is 1.00
d) value estimated from the fire statistics
e) value based on engineering judgement, with some support from fire statistics (sparse data)
f) value based on engineering judgement
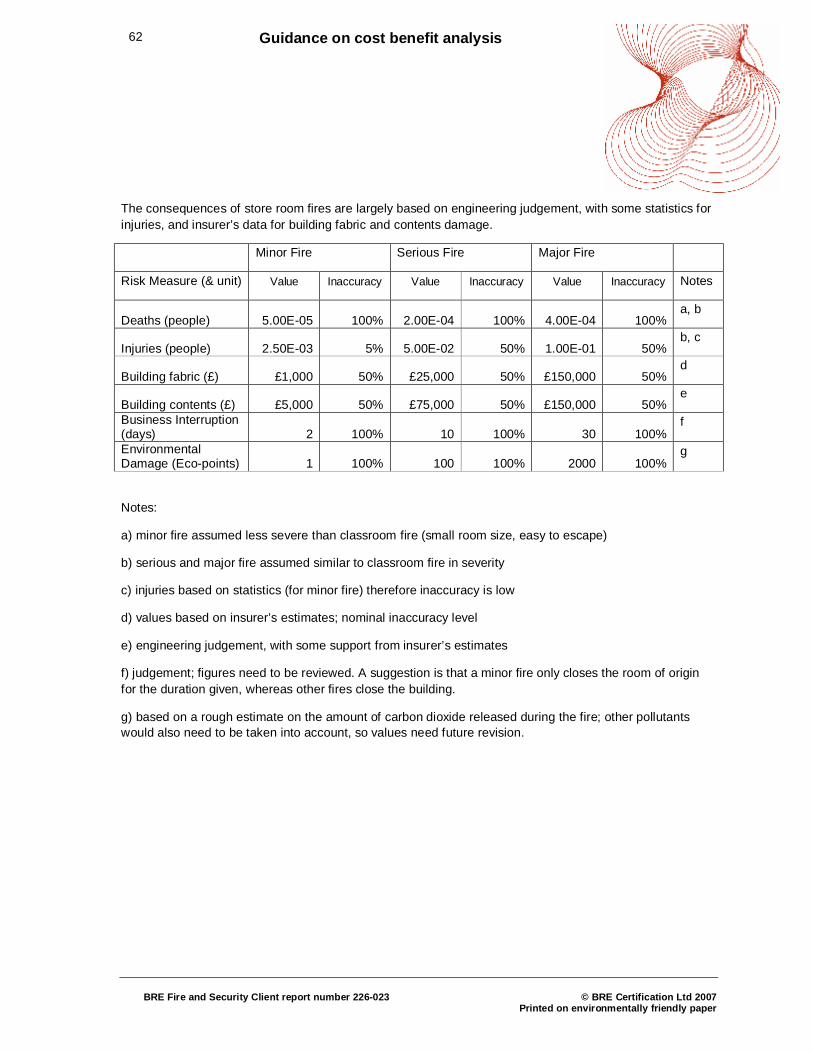
62 Guidance on cost benefit analysis
BRE Fire and Security Client report number 226-023
© BRE Certification Ltd 2007
Printed on environmentally friendly paper
The consequences of store room fires are largely based on engineering judgement, with some statistics for injuries, and insurer’s data for building fabric and contents damage.
Minor Fire Serious Fire Major Fire
Risk Measure (& unit) Value Inaccuracy Value Inaccuracy Value Inaccuracy Notes
Deaths (people) 5.00E-05 100% 2.00E-04 100% 4.00E-04 100% a, b
Injuries (people) 2.50E-03 5% 5.00E-02 50% 1.00E-01 50% b, c
Building fabric (£) £1,000 50% £25,000 50% £150,000 50% d
Building contents (£) £5,000 50% £75,000 50% £150,000 50% e
Business Interruption (days) 2 100% 10 100% 30 100%
f
Environmental Damage (Eco-points) 1 100% 100 100% 2000 100%
g
Notes:
a) minor fire assumed less severe than classroom fire (small room size, easy to escape)
b) serious and major fire assumed similar to classroom fire in severity
c) injuries based on statistics (for minor fire) therefore inaccuracy is low
d) values based on insurer’s estimates; nominal inaccuracy level
e) engineering judgement, with some support from insurer’s estimates
f) judgement; figures need to be reviewed. A suggestion is that a minor fire only closes the room of origin for the duration given, whereas other fires close the building.
g) based on a rough estimate on the amount of carbon dioxide released during the fire; other pollutants would also need to be taken into account, so values need future revision.
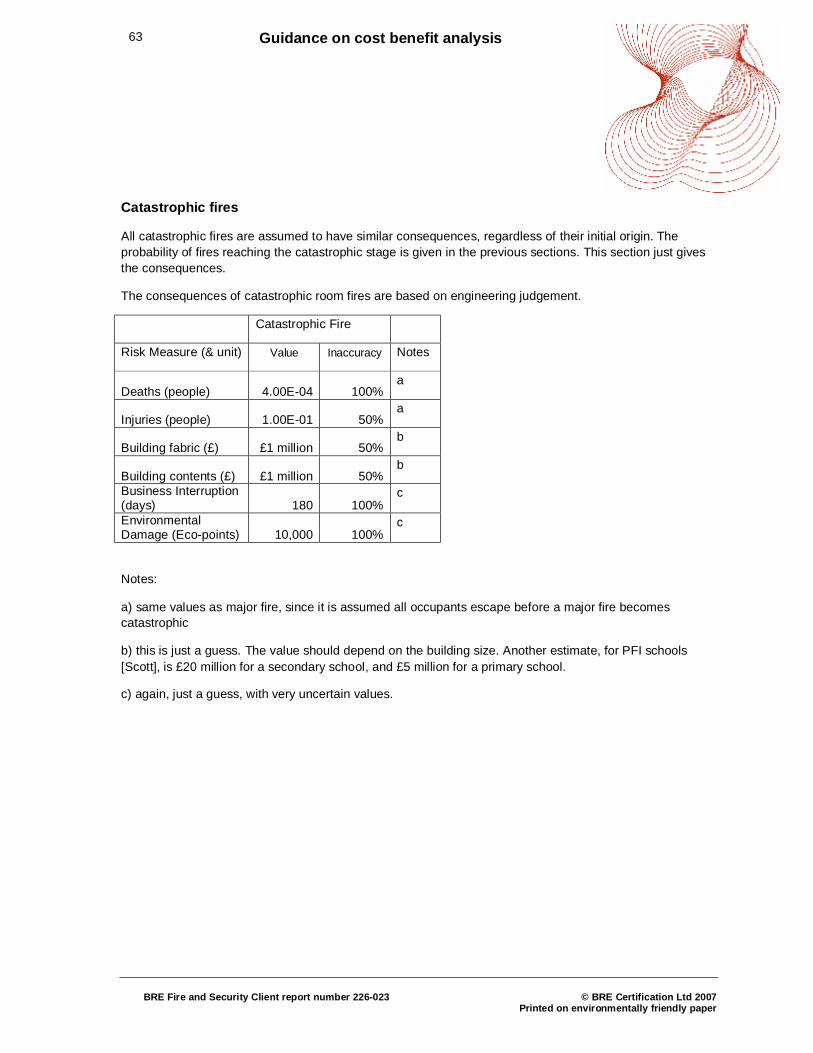
63 Guidance on cost benefit analysis
BRE Fire and Security Client report number 226-023
© BRE Certification Ltd 2007
Printed on environmentally friendly paper
Catastrophic fires
All catastrophic fires are assumed to have similar consequences, regardless of their initial origin. The probability of fires reaching the catastrophic stage is given in the previous sections. This section just gives the consequences.
The consequences of catastrophic room fires are based on engineering judgement.
Catastrophic Fire
Risk Measure (& unit) Value Inaccuracy Notes
Deaths (people) 4.00E-04 100% a
Injuries (people) 1.00E-01 50% a
Building fabric (£) £1 million 50% b
Building contents (£) £1 million 50% b
Business Interruption (days) 180 100%
c
Environmental Damage (Eco-points) 10,000 100%
c
Notes:
a) same values as major fire, since it is assumed all occupants escape before a major fire becomes catastrophic
b) this is just a guess. The value should depend on the building size. Another estimate, for PFI schools [Scott], is £20 million for a secondary school, and £5 million for a primary school.
c) again, just a guess, with very uncertain values.
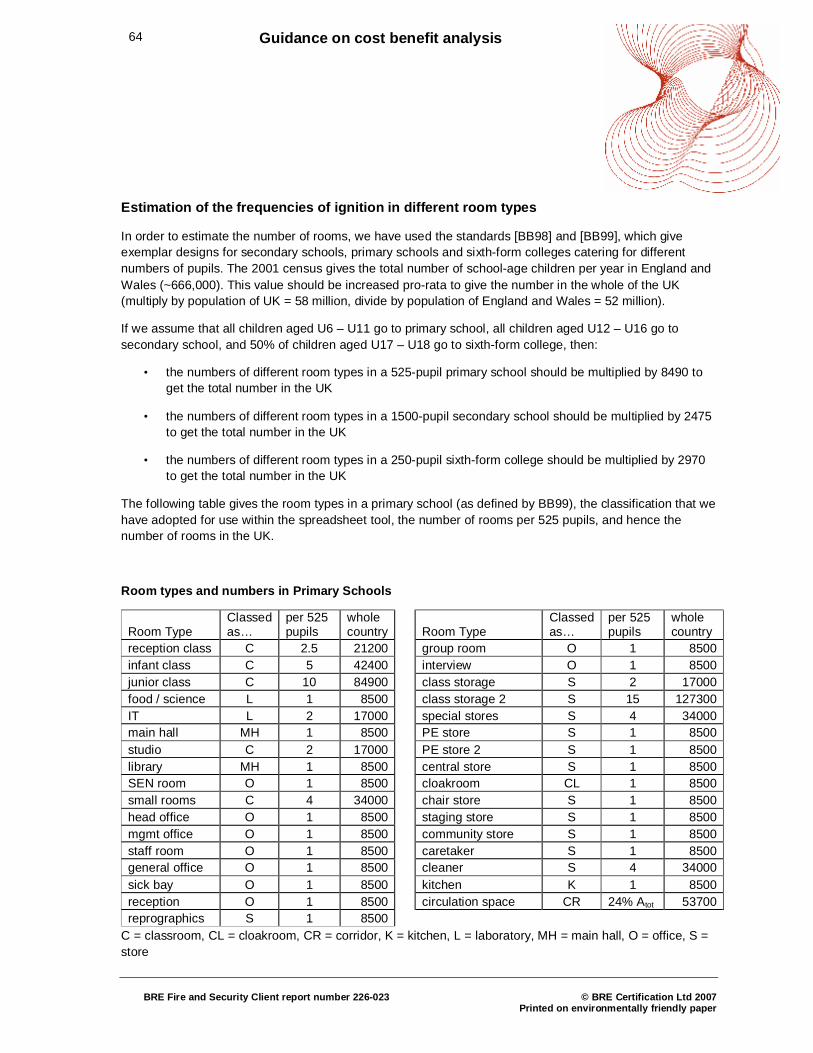
64 Guidance on cost benefit analysis
BRE Fire and Security Client report number 226-023
© BRE Certification Ltd 2007
Printed on environmentally friendly paper
Estimation of the frequencies of ignition in different room types
In order to estimate the number of rooms, we have used the standards [BB98] and [BB99], which give exemplar designs for secondary schools, primary schools and sixth-form colleges catering for different numbers of pupils. The 2001 census gives the total number of school-age children per year in England and Wales (~666,000). This value should be increased pro-rata to give the number in the whole of the UK (multiply by population of UK = 58 million, divide by population of England and Wales = 52 million).
If we assume that all children aged U6 – U11 go to primary school, all children aged U12 – U16 go to secondary school, and 50% of children aged U17 – U18 go to sixth-form college, then:
• the numbers of different room types in a 525-pupil primary school should be multiplied by 8490 to get the total number in the UK
• the numbers of different room types in a 1500-pupil secondary school should be multiplied by 2475 to get the total number in the UK
• the numbers of different room types in a 250-pupil sixth-form college should be multiplied by 2970 to get the total number in the UK
The following table gives the room types in a primary school (as defined by BB99), the classification that we have adopted for use within the spreadsheet tool, the number of rooms per 525 pupils, and hence the number of rooms in the UK.
Room types and numbers in Primary Schools
Room Type Classed as…
per 525 pupils
whole country
Room Type
Classed as…
per 525 pupils
whole country
reception class C 2.5 21200 group room O 1 8500 infant class C 5 42400 interview O 1 8500 junior class C 10 84900 class storage S 2 17000 food / science L 1 8500 class storage 2 S 15 127300 IT L 2 17000 special stores S 4 34000 main hall MH 1 8500 PE store S 1 8500 studio C 2 17000 PE store 2 S 1 8500 library MH 1 8500 central store S 1 8500 SEN room O 1 8500 cloakroom CL 1 8500 small rooms C 4 34000 chair store S 1 8500 head office O 1 8500 staging store S 1 8500 mgmt office O 1 8500 community store S 1 8500 staff room O 1 8500 caretaker S 1 8500 general office O 1 8500 cleaner S 4 34000 sick bay O 1 8500 kitchen K 1 8500 reception O 1 8500 circulation space CR 24% Atot 53700 reprographics S 1 8500
C = classroom, CL = cloakroom, CR = corridor, K = kitchen, L = laboratory, MH = main hall, O = office, S = store
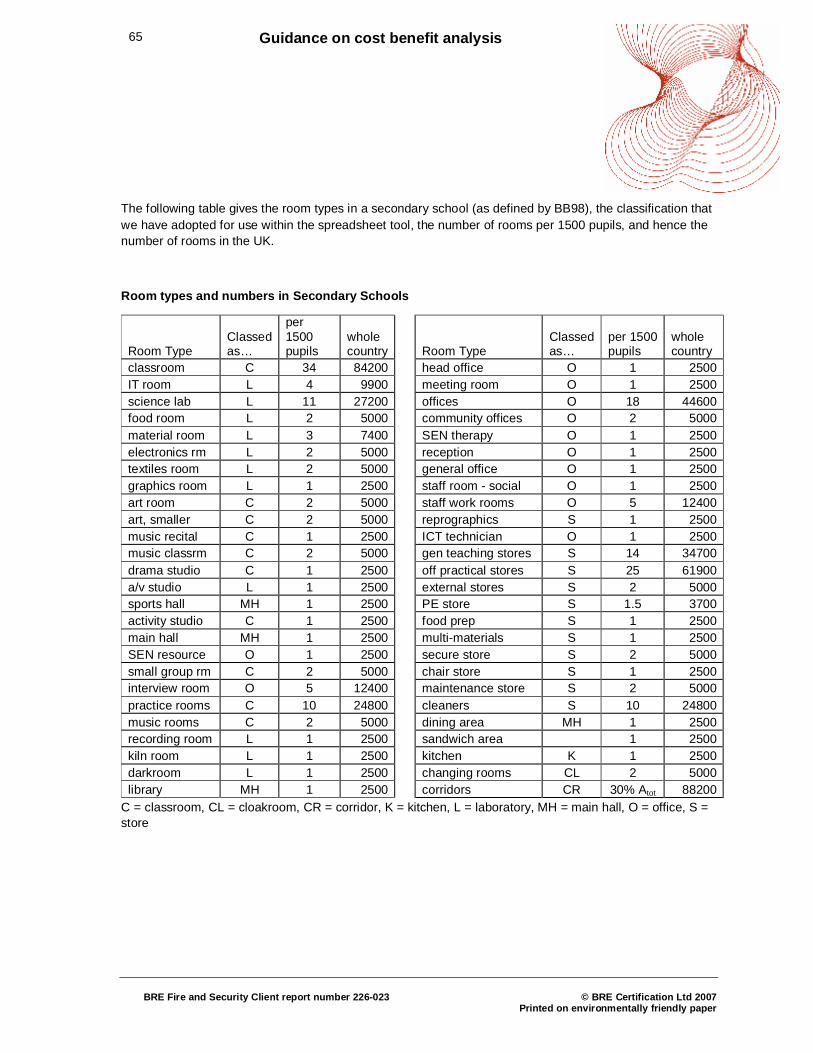
65 Guidance on cost benefit analysis
BRE Fire and Security Client report number 226-023
© BRE Certification Ltd 2007
Printed on environmentally friendly paper
The following table gives the room types in a secondary school (as defined by BB98), the classification that we have adopted for use within the spreadsheet tool, the number of rooms per 1500 pupils, and hence the number of rooms in the UK.
Room types and numbers in Secondary Schools
Room Type Classed as…
per 1500 pupils
whole country
Room Type Classed as…
per 1500 pupils
whole country
classroom C 34 84200 head office O 1 2500 IT room L 4 9900 meeting room O 1 2500 science lab L 11 27200 offices O 18 44600 food room L 2 5000 community offices O 2 5000 material room L 3 7400 SEN therapy O 1 2500 electronics rm L 2 5000 reception O 1 2500 textiles room L 2 5000 general office O 1 2500 graphics room L 1 2500 staff room - social O 1 2500 art room C 2 5000 staff work rooms O 5 12400 art, smaller C 2 5000 reprographics S 1 2500 music recital C 1 2500 ICT technician O 1 2500 music classrm C 2 5000 gen teaching stores S 14 34700 drama studio C 1 2500 off practical stores S 25 61900 a/v studio L 1 2500 external stores S 2 5000 sports hall MH 1 2500 PE store S 1.5 3700 activity studio C 1 2500 food prep S 1 2500 main hall MH 1 2500 multi-materials S 1 2500 SEN resource O 1 2500 secure store S 2 5000 small group rm C 2 5000 chair store S 1 2500 interview room O 5 12400 maintenance store S 2 5000 practice rooms C 10 24800 cleaners S 10 24800 music rooms C 2 5000 dining area MH 1 2500 recording room L 1 2500 sandwich area 1 2500 kiln room L 1 2500 kitchen K 1 2500 darkroom L 1 2500 changing rooms CL 2 5000 library MH 1 2500 corridors CR 30% Atot 88200
C = classroom, CL = cloakroom, CR = corridor, K = kitchen, L = laboratory, MH = main hall, O = office, S = store
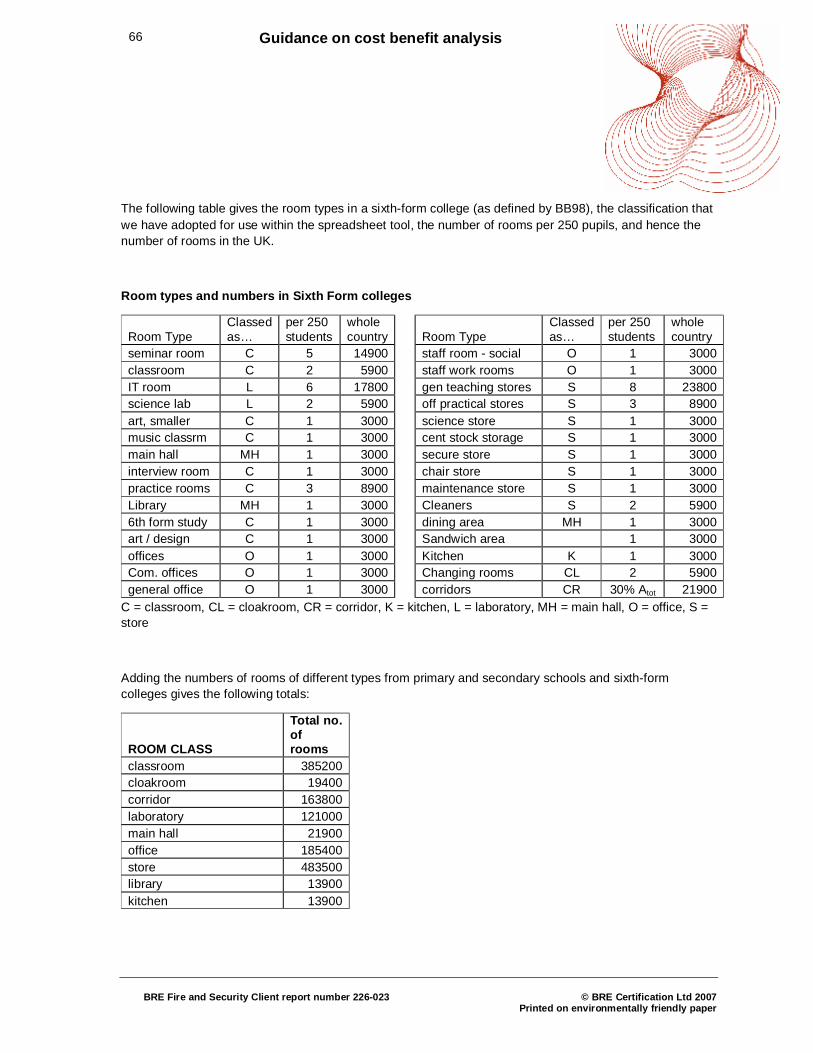
66 Guidance on cost benefit analysis
BRE Fire and Security Client report number 226-023
© BRE Certification Ltd 2007
Printed on environmentally friendly paper
The following table gives the room types in a sixth-form college (as defined by BB98), the classification that we have adopted for use within the spreadsheet tool, the number of rooms per 250 pupils, and hence the number of rooms in the UK.
Room types and numbers in Sixth Form colleges
Room Type Classed as…
per 250 students
whole country
Room Type
Classed as…
per 250 students
whole country
seminar room C 5 14900 staff room - social O 1 3000 classroom C 2 5900 staff work rooms O 1 3000 IT room L 6 17800 gen teaching stores S 8 23800 science lab L 2 5900 off practical stores S 3 8900 art, smaller C 1 3000 science store S 1 3000 music classrm C 1 3000 cent stock storage S 1 3000 main hall MH 1 3000 secure store S 1 3000 interview room C 1 3000 chair store S 1 3000 practice rooms C 3 8900 maintenance store S 1 3000 Library MH 1 3000 Cleaners S 2 5900 6th form study C 1 3000 dining area MH 1 3000 art / design C 1 3000 Sandwich area 1 3000 offices O 1 3000 Kitchen K 1 3000 Com. offices O 1 3000 Changing rooms CL 2 5900 general office O 1 3000 corridors CR 30% Atot 21900
C = classroom, CL = cloakroom, CR = corridor, K = kitchen, L = laboratory, MH = main hall, O = office, S = store
Adding the numbers of rooms of different types from primary and secondary schools and sixth-form colleges gives the following totals:
ROOM CLASS
Total no. of rooms
classroom 385200 cloakroom 19400 corridor 163800 laboratory 121000 main hall 21900 office 185400 store 483500 library 13900 kitchen 13900
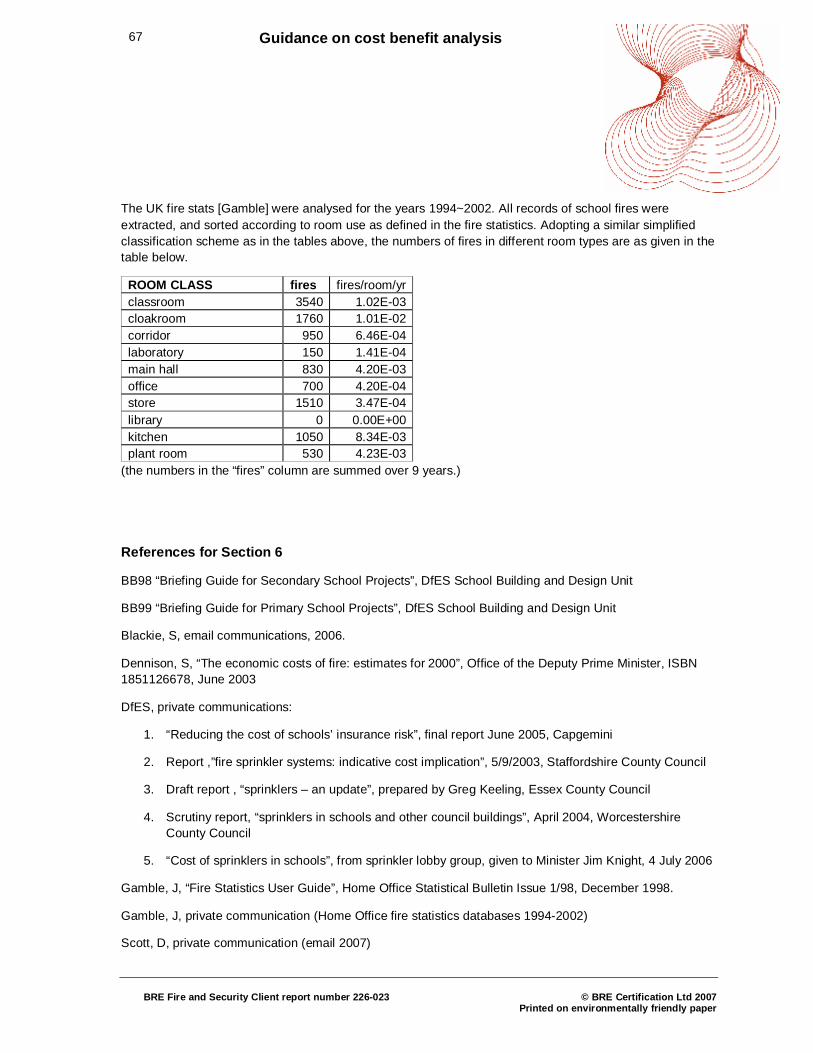
67 Guidance on cost benefit analysis
BRE Fire and Security Client report number 226-023
© BRE Certification Ltd 2007
Printed on environmentally friendly paper
The UK fire stats [Gamble] were analysed for the years 1994~2002. All records of school fires were extracted, and sorted according to room use as defined in the fire statistics. Adopting a similar simplified classification scheme as in the tables above, the numbers of fires in different room types are as given in the table below.
ROOM CLASS fires fires/room/yr classroom 3540 1.02E-03 cloakroom 1760 1.01E-02 corridor 950 6.46E-04 laboratory 150 1.41E-04 main hall 830 4.20E-03 office 700 4.20E-04 store 1510 3.47E-04 library 0 0.00E+00 kitchen 1050 8.34E-03 plant room 530 4.23E-03
(the numbers in the “fires” column are summed over 9 years.)
References for Section 6
BB98 “Briefing Guide for Secondary School Projects”, DfES School Building and Design Unit
BB99 “Briefing Guide for Primary School Projects”, DfES School Building and Design Unit
Blackie, S, email communications, 2006.
Dennison, S, “The economic costs of fire: estimates for 2000”, Office of the Deputy Prime Minister, ISBN 1851126678, June 2003
DfES, private communications:
1. “Reducing the cost of schools’ insurance risk”, final report June 2005, Capgemini
2. Report ,”fire sprinkler systems: indicative cost implication”, 5/9/2003, Staffordshire County Council
3. Draft report , “sprinklers – an update”, prepared by Greg Keeling, Essex County Council
4. Scrutiny report, “sprinklers in schools and other council buildings”, April 2004, Worcestershire County Council
5. “Cost of sprinklers in schools”, from sprinkler lobby group, given to Minister Jim Knight, 4 July 2006
Gamble, J, “Fire Statistics User Guide”, Home Office Statistical Bulletin Issue 1/98, December 1998.
Gamble, J, private communication (Home Office fire statistics databases 1994-2002)
Scott, D, private communication (email 2007)
68 Guidance on cost benefit analysis
BRE Fire and Security Client report number 226-023
© BRE Certification Ltd 2007
Printed on environmentally friendly paper
7 Fire prevention & mitigation systems: assumptions and data
Within the risk-cost tool, system effects are represented as either the probability of preventing the risk scenario from happening, given that the precursor event has occurred, or a reduction in the consequences of the risk scenario (given that the scenario has not been prevented).
Consider a simple example: if a system’s effectiveness at preventing a scenario happening in the first place is given by ep, and effectiveness at reducing consequences (given that the scenario has not been prevented) is given by ec, then the overall consequence will be
ep x 0 + (1 – ep).(1 – ec) x {baseline scenario consequence}
The apparent reduction in consequence is
ec ' = 1 – (1 – ep).(1 – ec)
If we say for example that ep = 80%, ec = 50%, then the overall reduction in consequence is
ec’ = 1 – 0.2 x 0.5 = 90%.
This explains why the values for system effectiveness at reducing consequences (given that the scenario has not been prevented) may seem lower than expected at first sight.
Note that system effectiveness will depend on the scenario, which is why this data is entered on the risk scenario sheets. In the sections below, data is provided for effects on “typical” minor, serious and major fires, as well as a single section for catastrophic fires (which does not depend on the room of fire origin). The notes suggest suitable variations from these typical values, for specific scenario locations.
Reliability is defined as the probability of the system operating when it is expected to. This will be a factor in determining what fraction of scenarios are prevented, and also by how much their consequences are reduced.
System costs are assumed to be some function of any or all of a cost per installation, a cost per room in which the system is fitted, and a cost per sq.m of area that the system protects. Costs are broken down into a one-off cost when the system is installed, plus annual costs for testing, maintenance, etc. The risk-cost tool will calculate the total costs, in the “User Workspace” section of each “system” sheet, using the cost components, and also numbers of rooms and their areas taken from the “Project Data” sheet. Alternatively the user can supply these totals directly (for example, if supplier’s quotes have been obtained).
The lifetime of the system is used to determine the annual discounted costs (see Capital Recovery Factor, Section 4).
A system may provide additional benefits, not directly related to fire prevention or mitigation. For example, improved security will reduce the probability of arson fires, and will also reduce losses from vandalism, theft, etc.
69 Guidance on cost benefit analysis
BRE Fire and Security Client report number 226-023
© BRE Certification Ltd 2007
Printed on environmentally friendly paper
Sprinklers
Sprinklers are a fire suppression system, and also a detection system (although generally not as sensitive as a smoke detector). Sprinklers react slowly to a fire that develops slowly, and such a fire can produce a lot of smoke but not much heat. However sprinklers react quickly to fast growing fires, for example those started with incendiary devices, petrol or similar accelerants; these are quite common fires in schools.
When the sprinkler heads are exposed to hot smoke, the head temperature rises. When the head has reached activation temperature (typically about 65 oC), the sprinkler head discharges. Note that each head must individually reach activation temperature to work – it is a common myth that a fire will set off all the sprinklers within a room or building. If the fire is small, or the room is relatively large, then the smoke may be cool by the time it gets to the sprinkler heads, and thus they will not reach the operating temperature. In general, however, if the fire is not hot or big enough to operate the sprinklers it is not hot or big enough to do much damage to the school.
If a sprinkler system is installed, it will normally be within all rooms of the building.
Reliability and System Lifetime
Quantity (and unit) Value Inaccuracy (%) Notes
Reliability (%) 95% 3% a
System lifetime (years) 25 5% b
Notes:
a) For a new system the reliability will be almost 100% [Budnick], although this reduces with time. One of the commonest causes of sprinkler failure is for the water supply to be turned off during maintenance, then not re-connected after the job is finished.
b) The value we have chosen has been based on advice from representatives of the sprinkler industry [Brinson, Ramachandran].
System effects: minor fires
Quantity (and unit) Value Inaccuracy (%) Notes
Fires prevented (%) 0% 0% a
Deaths prevented (%) 0% 0% a
Injuries prevented (%) 0% 0% a
Building damage reduction (%) 0% 0% a
Contents damage reduction (%) 0% 0% a
Business interruption reduct.n (%) 0% 0% a
70 Guidance on cost benefit analysis
BRE Fire and Security Client report number 226-023
© BRE Certification Ltd 2007
Printed on environmentally friendly paper
Environment damage reduct.n (%) 0% 0% a
Notes:
a) it is assumed that a minor fire generates insufficient heat for sprinklers to activate.
System effects: serious fires
Quantity (and unit) Value Inaccuracy (%) Notes
Fires prevented (%) 95% 5% a, b
Deaths prevented (%) 50% 100% c
Injuries prevented (%) 30% 100% d
Building damage reduction (%) 50% 100% e
Contents damage reduction (%) 50% 100% e
Business interruption reduct.n (%) 50% 100% e
Environment damage reduct.n (%) 50% 100% e
Notes:
a) rule of thumb for “normal” sized rooms [Fraser-Mitchell]
b) Main Hall has a value of 25% (inaccuracy 100%) as high ceiling and large volume make sprinkler activation less likely
c) engineering judgement, guided by estimates for the performance of residential sprinklers [Fraser-Mitchell, Williams] (but downgraded somewhat due to absence of sleeping occupants; awake occupants assumed to save themselves and thus be less reliant on sprinklers)
d) engineering judgement, along the same lines as note (c)
e) unknown, i.e. anywhere between 0~100%
System effects: major fires
Quantity (and unit) Value Inaccuracy (%) Notes
Fires prevented (%) 50% 100% a
Deaths prevented (%) 50% 100% b
Injuries prevented (%) 30% 100% b
Building damage reduction (%) 50% 100% c
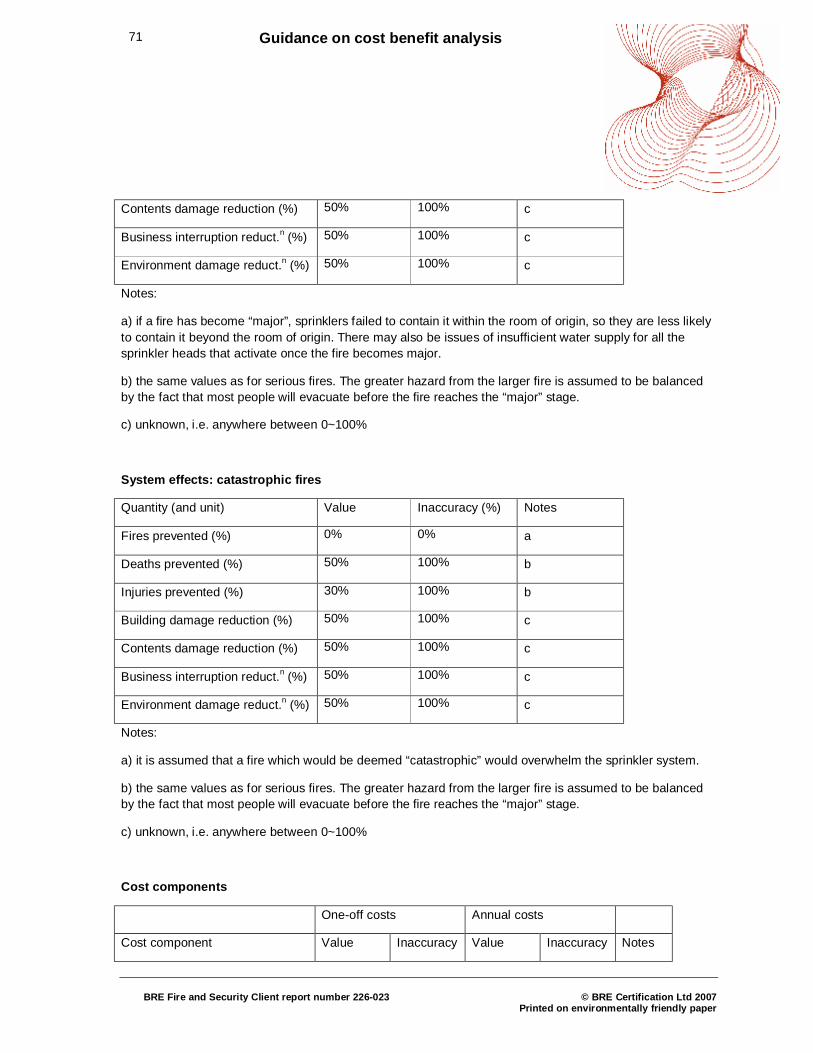
71 Guidance on cost benefit analysis
BRE Fire and Security Client report number 226-023
© BRE Certification Ltd 2007
Printed on environmentally friendly paper
Contents damage reduction (%) 50% 100% c
Business interruption reduct.n (%) 50% 100% c
Environment damage reduct.n (%) 50% 100% c
Notes:
a) if a fire has become “major”, sprinklers failed to contain it within the room of origin, so they are less likely to contain it beyond the room of origin. There may also be issues of insufficient water supply for all the sprinkler heads that activate once the fire becomes major.
b) the same values as for serious fires. The greater hazard from the larger fire is assumed to be balanced by the fact that most people will evacuate before the fire reaches the “major” stage.
c) unknown, i.e. anywhere between 0~100%
System effects: catastrophic fires
Quantity (and unit) Value Inaccuracy (%) Notes
Fires prevented (%) 0% 0% a
Deaths prevented (%) 50% 100% b
Injuries prevented (%) 30% 100% b
Building damage reduction (%) 50% 100% c
Contents damage reduction (%) 50% 100% c
Business interruption reduct.n (%) 50% 100% c
Environment damage reduct.n (%) 50% 100% c
Notes:
a) it is assumed that a fire which would be deemed “catastrophic” would overwhelm the sprinkler system.
b) the same values as for serious fires. The greater hazard from the larger fire is assumed to be balanced by the fact that most people will evacuate before the fire reaches the “major” stage.
c) unknown, i.e. anywhere between 0~100%
Cost components
One-off costs Annual costs
Cost component Value Inaccuracy Value Inaccuracy Notes
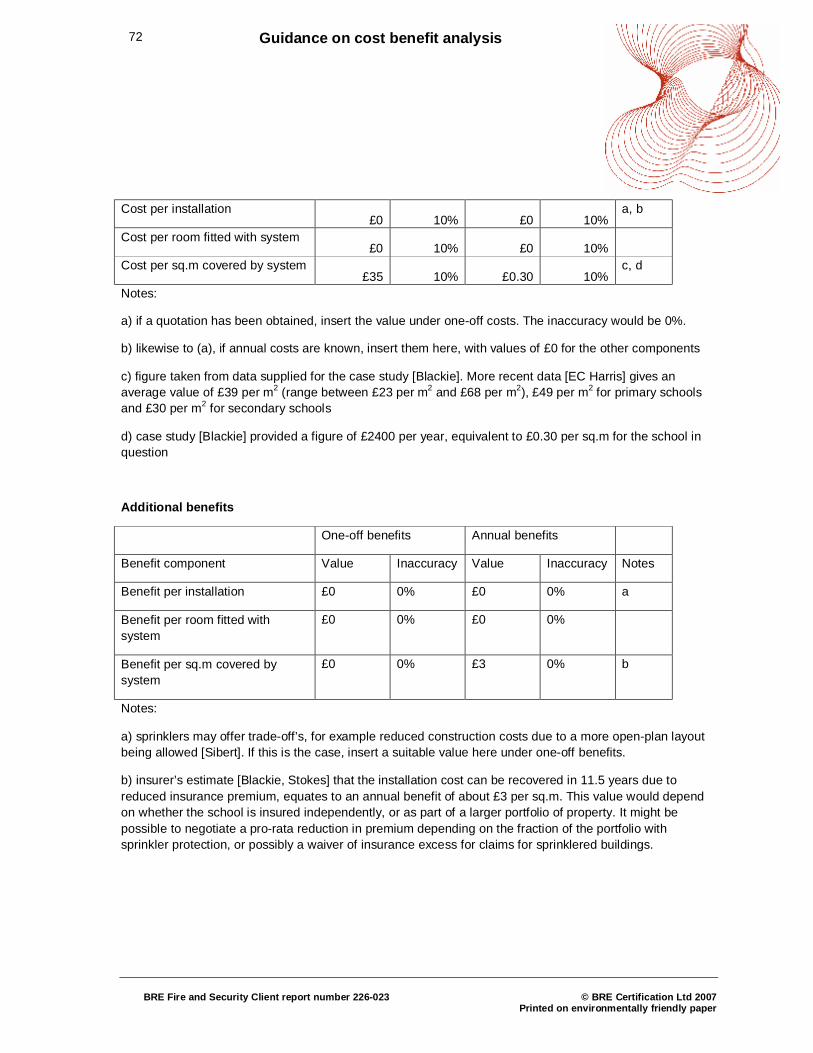
72 Guidance on cost benefit analysis
BRE Fire and Security Client report number 226-023
© BRE Certification Ltd 2007
Printed on environmentally friendly paper
Cost per installation
£0 10% £0 10% a, b
Cost per room fitted with system £0 10% £0 10%
Cost per sq.m covered by system £35 10% £0.30 10%
c, d
Notes:
a) if a quotation has been obtained, insert the value under one-off costs. The inaccuracy would be 0%.
b) likewise to (a), if annual costs are known, insert them here, with values of £0 for the other components
c) figure taken from data supplied for the case study [Blackie]. More recent data [EC Harris] gives an average value of £39 per m2 (range between £23 per m2 and £68 per m2), £49 per m2 for primary schools and £30 per m2 for secondary schools
d) case study [Blackie] provided a figure of £2400 per year, equivalent to £0.30 per sq.m for the school in question
Additional benefits
One-off benefits Annual benefits
Benefit component Value Inaccuracy Value Inaccuracy Notes
Benefit per installation £0 0% £0 0% a
Benefit per room fitted with system
£0 0% £0 0%
Benefit per sq.m covered by system
£0 0% £3 0% b
Notes:
a) sprinklers may offer trade-off’s, for example reduced construction costs due to a more open-plan layout being allowed [Sibert]. If this is the case, insert a suitable value here under one-off benefits.
b) insurer’s estimate [Blackie, Stokes] that the installation cost can be recovered in 11.5 years due to reduced insurance premium, equates to an annual benefit of about £3 per sq.m. This value would depend on whether the school is insured independently, or as part of a larger portfolio of property. It might be possible to negotiate a pro-rata reduction in premium depending on the fraction of the portfolio with sprinkler protection, or possibly a waiver of insurance excess for claims for sprinklered buildings.
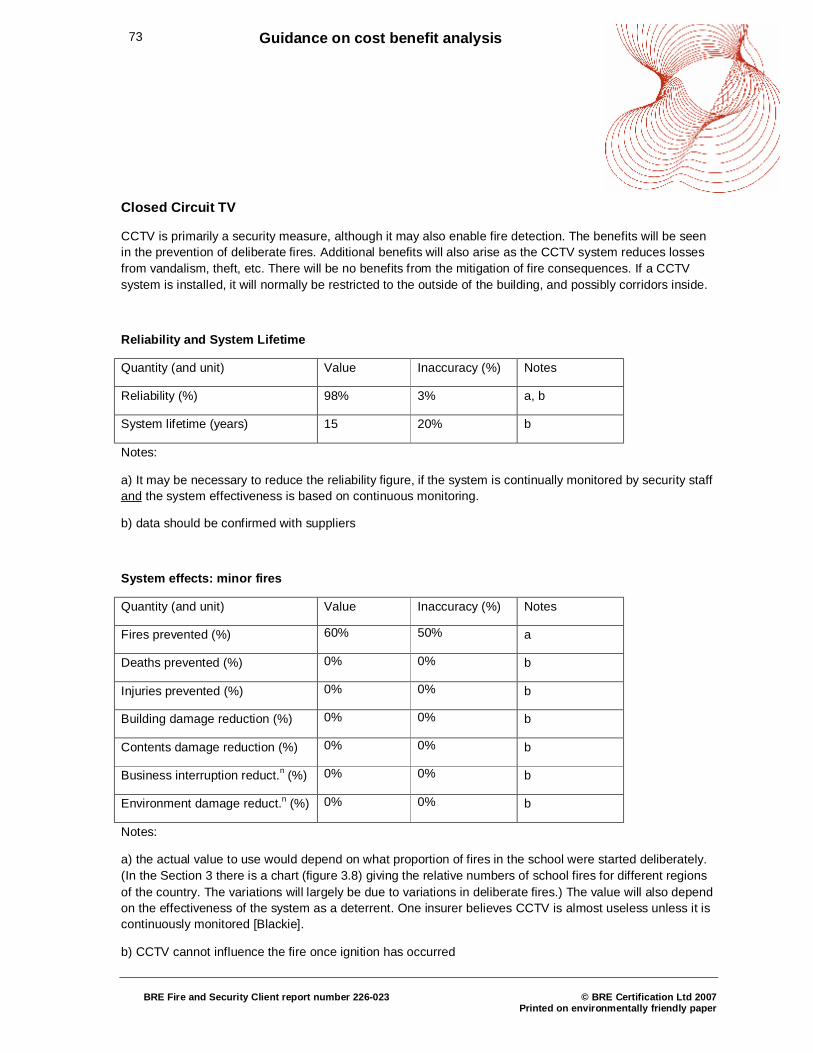
73 Guidance on cost benefit analysis
BRE Fire and Security Client report number 226-023
© BRE Certification Ltd 2007
Printed on environmentally friendly paper
Closed Circuit TV
CCTV is primarily a security measure, although it may also enable fire detection. The benefits will be seen in the prevention of deliberate fires. Additional benefits will also arise as the CCTV system reduces losses from vandalism, theft, etc. There will be no benefits from the mitigation of fire consequences. If a CCTV system is installed, it will normally be restricted to the outside of the building, and possibly corridors inside.
Reliability and System Lifetime
Quantity (and unit) Value Inaccuracy (%) Notes
Reliability (%) 98% 3% a, b
System lifetime (years) 15 20% b
Notes:
a) It may be necessary to reduce the reliability figure, if the system is continually monitored by security staff and the system effectiveness is based on continuous monitoring.
b) data should be confirmed with suppliers
System effects: minor fires
Quantity (and unit) Value Inaccuracy (%) Notes
Fires prevented (%) 60% 50% a
Deaths prevented (%) 0% 0% b
Injuries prevented (%) 0% 0% b
Building damage reduction (%) 0% 0% b
Contents damage reduction (%) 0% 0% b
Business interruption reduct.n (%) 0% 0% b
Environment damage reduct.n (%) 0% 0% b
Notes:
a) the actual value to use would depend on what proportion of fires in the school were started deliberately. (In the Section 3 there is a chart (figure 3.8) giving the relative numbers of school fires for different regions of the country. The variations will largely be due to variations in deliberate fires.) The value will also depend on the effectiveness of the system as a deterrent. One insurer believes CCTV is almost useless unless it is continuously monitored [Blackie].
b) CCTV cannot influence the fire once ignition has occurred
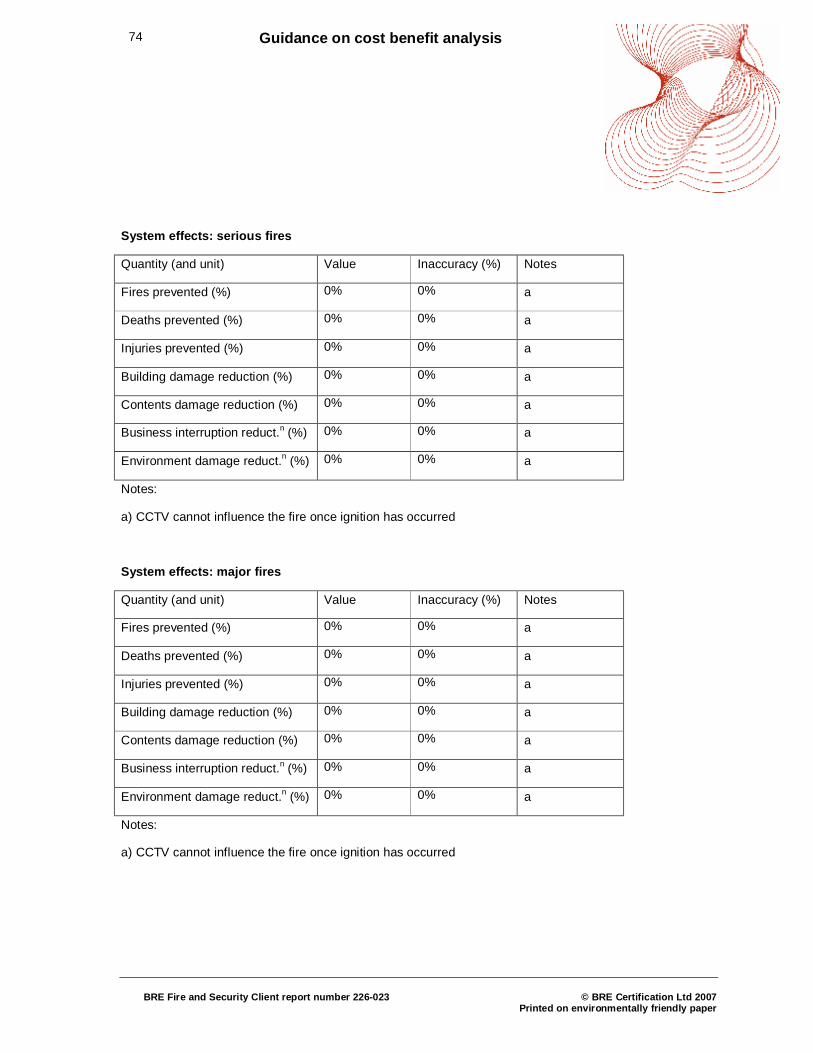
74 Guidance on cost benefit analysis
BRE Fire and Security Client report number 226-023
© BRE Certification Ltd 2007
Printed on environmentally friendly paper
System effects: serious fires
Quantity (and unit) Value Inaccuracy (%) Notes
Fires prevented (%) 0% 0% a
Deaths prevented (%) 0% 0% a
Injuries prevented (%) 0% 0% a
Building damage reduction (%) 0% 0% a
Contents damage reduction (%) 0% 0% a
Business interruption reduct.n (%) 0% 0% a
Environment damage reduct.n (%) 0% 0% a
Notes:
a) CCTV cannot influence the fire once ignition has occurred
System effects: major fires
Quantity (and unit) Value Inaccuracy (%) Notes
Fires prevented (%) 0% 0% a
Deaths prevented (%) 0% 0% a
Injuries prevented (%) 0% 0% a
Building damage reduction (%) 0% 0% a
Contents damage reduction (%) 0% 0% a
Business interruption reduct.n (%) 0% 0% a
Environment damage reduct.n (%) 0% 0% a
Notes:
a) CCTV cannot influence the fire once ignition has occurred
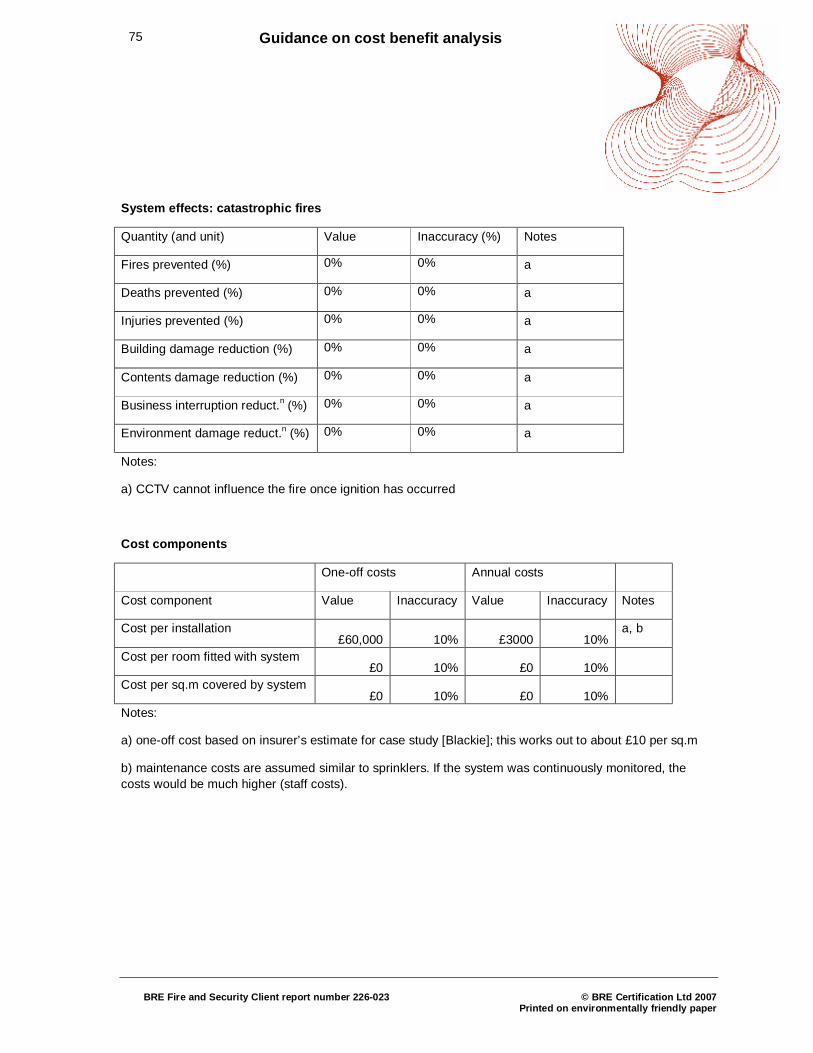
75 Guidance on cost benefit analysis
BRE Fire and Security Client report number 226-023
© BRE Certification Ltd 2007
Printed on environmentally friendly paper
System effects: catastrophic fires
Quantity (and unit) Value Inaccuracy (%) Notes
Fires prevented (%) 0% 0% a
Deaths prevented (%) 0% 0% a
Injuries prevented (%) 0% 0% a
Building damage reduction (%) 0% 0% a
Contents damage reduction (%) 0% 0% a
Business interruption reduct.n (%) 0% 0% a
Environment damage reduct.n (%) 0% 0% a
Notes:
a) CCTV cannot influence the fire once ignition has occurred
Cost components
One-off costs Annual costs
Cost component Value Inaccuracy Value Inaccuracy Notes
Cost per installation £60,000 10% £3000 10%
a, b
Cost per room fitted with system £0 10% £0 10%
Cost per sq.m covered by system £0 10% £0 10%
Notes:
a) one-off cost based on insurer’s estimate for case study [Blackie]; this works out to about £10 per sq.m
b) maintenance costs are assumed similar to sprinklers. If the system was continuously monitored, the costs would be much higher (staff costs).
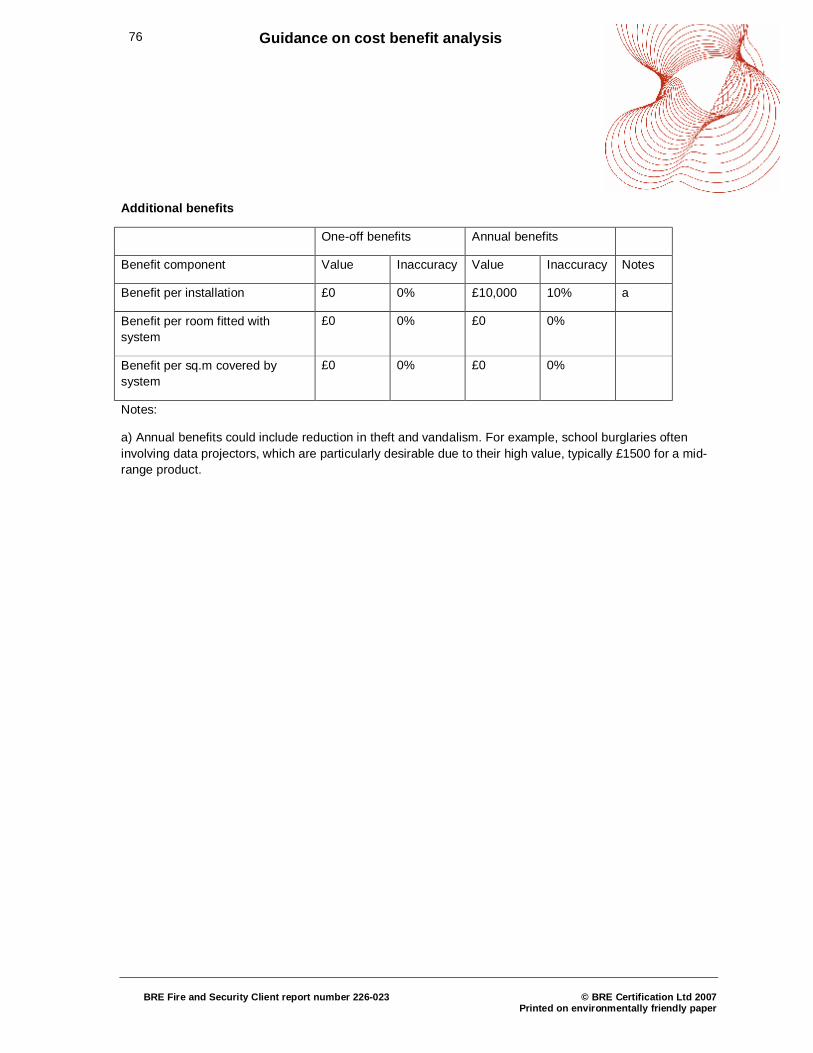
76 Guidance on cost benefit analysis
BRE Fire and Security Client report number 226-023
© BRE Certification Ltd 2007
Printed on environmentally friendly paper
Additional benefits
One-off benefits Annual benefits
Benefit component Value Inaccuracy Value Inaccuracy Notes
Benefit per installation £0 0% £10,000 10% a
Benefit per room fitted with system
£0 0% £0 0%
Benefit per sq.m covered by system
£0 0% £0 0%
Notes:
a) Annual benefits could include reduction in theft and vandalism. For example, school burglaries often involving data projectors, which are particularly desirable due to their high value, typically £1500 for a mid-range product.
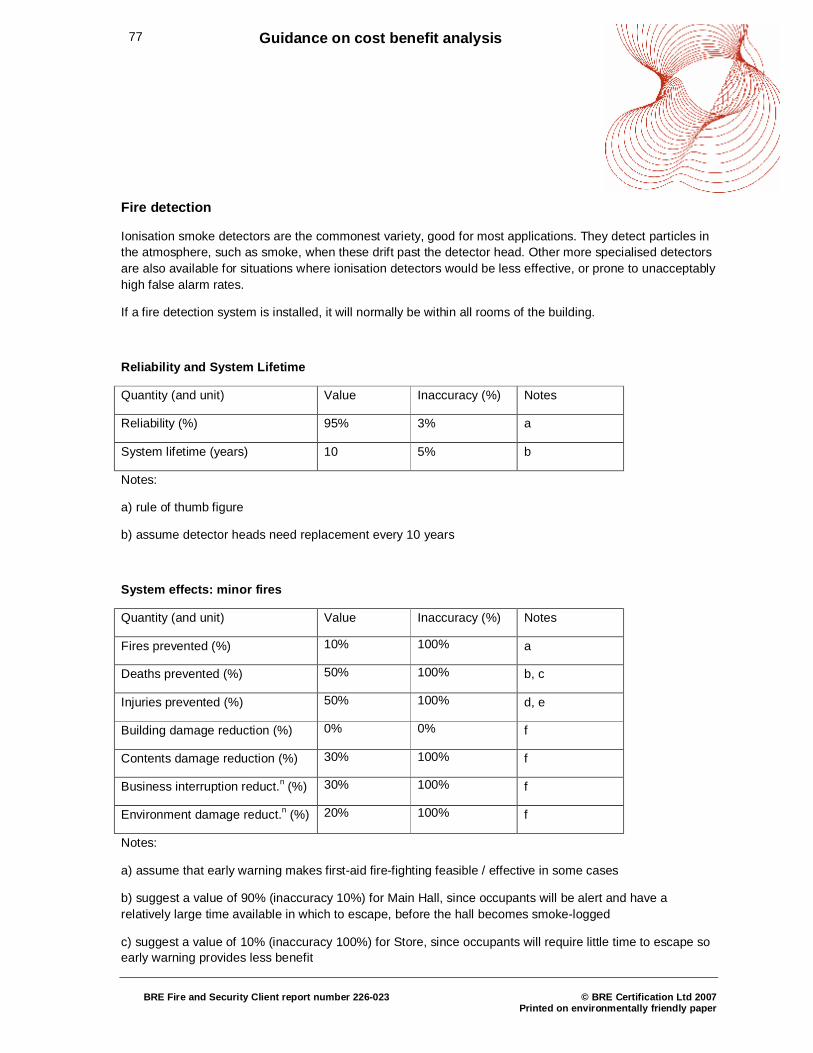
77 Guidance on cost benefit analysis
BRE Fire and Security Client report number 226-023
© BRE Certification Ltd 2007
Printed on environmentally friendly paper
Fire detection
Ionisation smoke detectors are the commonest variety, good for most applications. They detect particles in the atmosphere, such as smoke, when these drift past the detector head. Other more specialised detectors are also available for situations where ionisation detectors would be less effective, or prone to unacceptably high false alarm rates.
If a fire detection system is installed, it will normally be within all rooms of the building.
Reliability and System Lifetime
Quantity (and unit) Value Inaccuracy (%) Notes
Reliability (%) 95% 3% a
System lifetime (years) 10 5% b
Notes:
a) rule of thumb figure
b) assume detector heads need replacement every 10 years
System effects: minor fires
Quantity (and unit) Value Inaccuracy (%) Notes
Fires prevented (%) 10% 100% a
Deaths prevented (%) 50% 100% b, c
Injuries prevented (%) 50% 100% d, e
Building damage reduction (%) 0% 0% f
Contents damage reduction (%) 30% 100% f
Business interruption reduct.n (%) 30% 100% f
Environment damage reduct.n (%) 20% 100% f
Notes:
a) assume that early warning makes first-aid fire-fighting feasible / effective in some cases
b) suggest a value of 90% (inaccuracy 10%) for Main Hall, since occupants will be alert and have a relatively large time available in which to escape, before the hall becomes smoke-logged
c) suggest a value of 10% (inaccuracy 100%) for Store, since occupants will require little time to escape so early warning provides less benefit
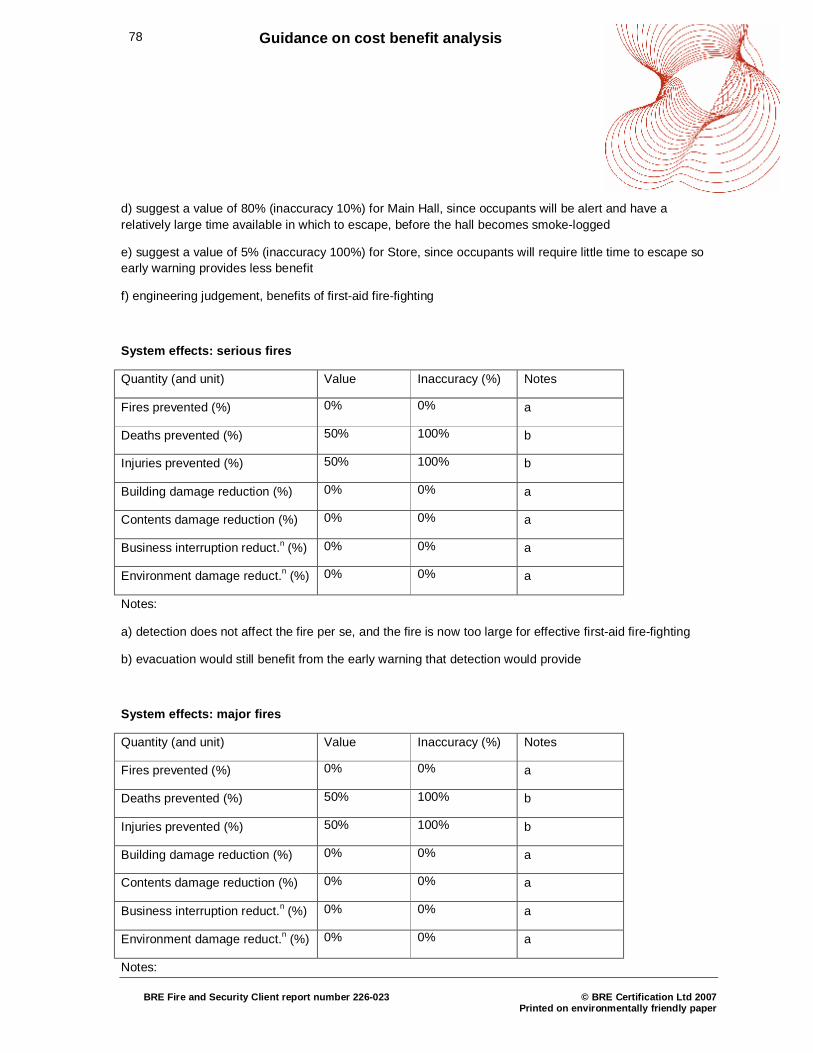
78 Guidance on cost benefit analysis
BRE Fire and Security Client report number 226-023
© BRE Certification Ltd 2007
Printed on environmentally friendly paper
d) suggest a value of 80% (inaccuracy 10%) for Main Hall, since occupants will be alert and have a relatively large time available in which to escape, before the hall becomes smoke-logged
e) suggest a value of 5% (inaccuracy 100%) for Store, since occupants will require little time to escape so early warning provides less benefit
f) engineering judgement, benefits of first-aid fire-fighting
System effects: serious fires
Quantity (and unit) Value Inaccuracy (%) Notes
Fires prevented (%) 0% 0% a
Deaths prevented (%) 50% 100% b
Injuries prevented (%) 50% 100% b
Building damage reduction (%) 0% 0% a
Contents damage reduction (%) 0% 0% a
Business interruption reduct.n (%) 0% 0% a
Environment damage reduct.n (%) 0% 0% a
Notes:
a) detection does not affect the fire per se, and the fire is now too large for effective first-aid fire-fighting
b) evacuation would still benefit from the early warning that detection would provide
System effects: major fires
Quantity (and unit) Value Inaccuracy (%) Notes
Fires prevented (%) 0% 0% a
Deaths prevented (%) 50% 100% b
Injuries prevented (%) 50% 100% b
Building damage reduction (%) 0% 0% a
Contents damage reduction (%) 0% 0% a
Business interruption reduct.n (%) 0% 0% a
Environment damage reduct.n (%) 0% 0% a
Notes:
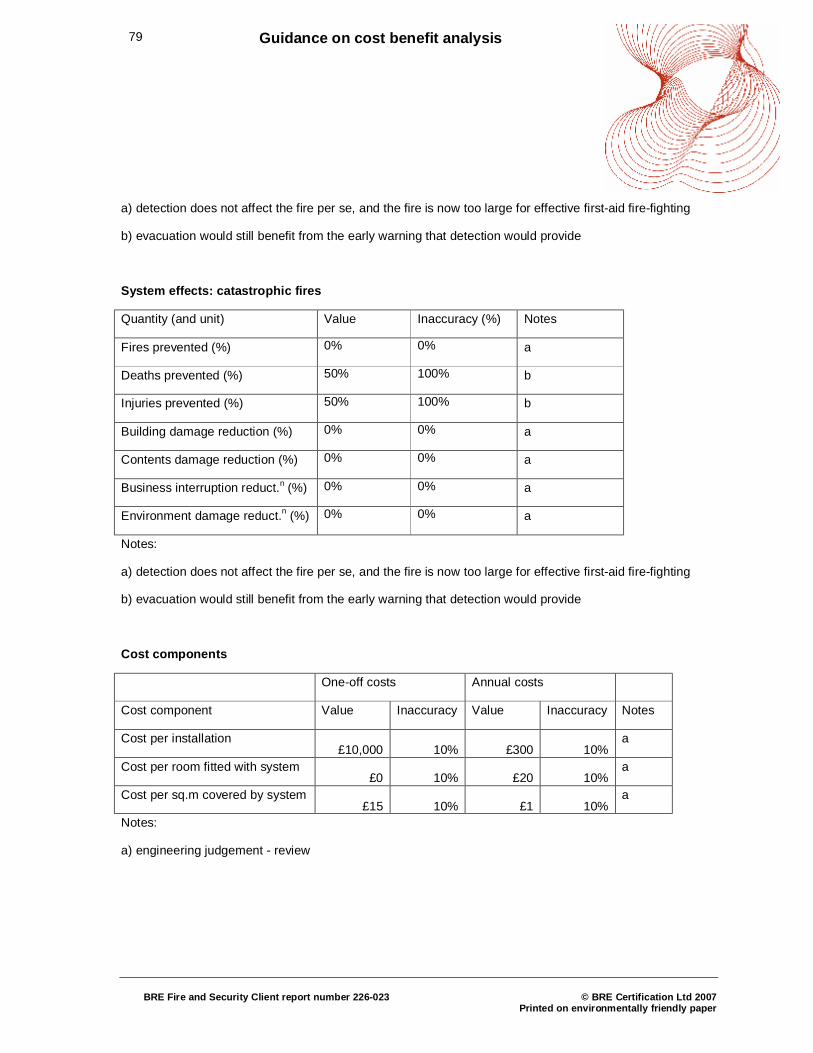
79 Guidance on cost benefit analysis
BRE Fire and Security Client report number 226-023
© BRE Certification Ltd 2007
Printed on environmentally friendly paper
a) detection does not affect the fire per se, and the fire is now too large for effective first-aid fire-fighting
b) evacuation would still benefit from the early warning that detection would provide
System effects: catastrophic fires
Quantity (and unit) Value Inaccuracy (%) Notes
Fires prevented (%) 0% 0% a
Deaths prevented (%) 50% 100% b
Injuries prevented (%) 50% 100% b
Building damage reduction (%) 0% 0% a
Contents damage reduction (%) 0% 0% a
Business interruption reduct.n (%) 0% 0% a
Environment damage reduct.n (%) 0% 0% a
Notes:
a) detection does not affect the fire per se, and the fire is now too large for effective first-aid fire-fighting
b) evacuation would still benefit from the early warning that detection would provide
Cost components
One-off costs Annual costs
Cost component Value Inaccuracy Value Inaccuracy Notes
Cost per installation £10,000 10% £300 10%
a
Cost per room fitted with system £0 10% £20 10%
a
Cost per sq.m covered by system £15 10% £1 10%
a
Notes:
a) engineering judgement - review
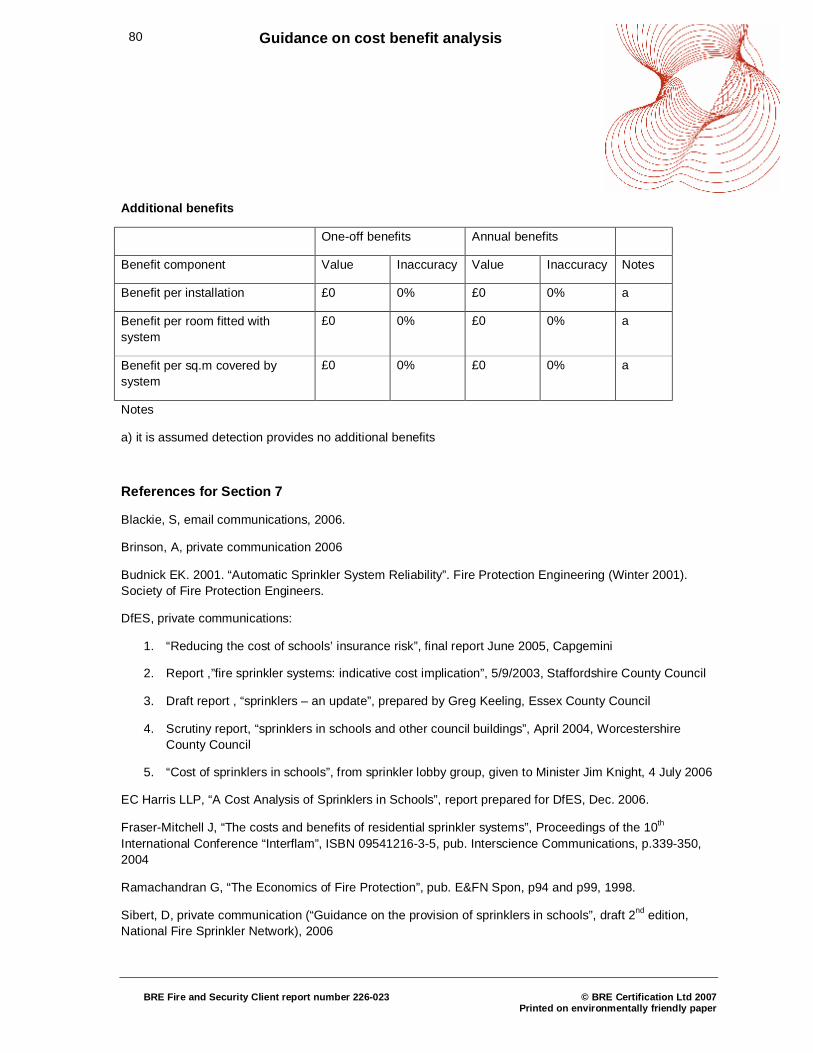
80 Guidance on cost benefit analysis
BRE Fire and Security Client report number 226-023
© BRE Certification Ltd 2007
Printed on environmentally friendly paper
Additional benefits
One-off benefits Annual benefits
Benefit component Value Inaccuracy Value Inaccuracy Notes
Benefit per installation £0 0% £0 0% a
Benefit per room fitted with system
£0 0% £0 0% a
Benefit per sq.m covered by system
£0 0% £0 0% a
Notes
a) it is assumed detection provides no additional benefits
References for Section 7
Blackie, S, email communications, 2006.
Brinson, A, private communication 2006
Budnick EK. 2001. “Automatic Sprinkler System Reliability”. Fire Protection Engineering (Winter 2001). Society of Fire Protection Engineers.
DfES, private communications:
1. “Reducing the cost of schools’ insurance risk”, final report June 2005, Capgemini
2. Report ,”fire sprinkler systems: indicative cost implication”, 5/9/2003, Staffordshire County Council
3. Draft report , “sprinklers – an update”, prepared by Greg Keeling, Essex County Council
4. Scrutiny report, “sprinklers in schools and other council buildings”, April 2004, Worcestershire County Council
5. “Cost of sprinklers in schools”, from sprinkler lobby group, given to Minister Jim Knight, 4 July 2006
EC Harris LLP, “A Cost Analysis of Sprinklers in Schools”, report prepared for DfES, Dec. 2006.
Fraser-Mitchell J, “The costs and benefits of residential sprinkler systems”, Proceedings of the 10th International Conference “Interflam”, ISBN 09541216-3-5, pub. Interscience Communications, p.339-350, 2004
Ramachandran G, “The Economics of Fire Protection”, pub. E&FN Spon, p94 and p99, 1998.
Sibert, D, private communication (“Guidance on the provision of sprinklers in schools”, draft 2nd edition, National Fire Sprinkler Network), 2006
81 Guidance on cost benefit analysis
BRE Fire and Security Client report number 226-023
© BRE Certification Ltd 2007
Printed on environmentally friendly paper
Stokes, L, private communication (“Why install sprinklers in schools? A cost-benefit analysis”, LS/CM v6-27.02.06), 2006
Williams C, Fraser-Mitchell J, Campbell S & Harrison R. “Effectiveness of sprinklers in residential premises”, BRE Report 204505, Feb 2004
82 Guidance on cost benefit analysis
BRE Fire and Security Client report number 226-023
© BRE Certification Ltd 2007
Printed on environmentally friendly paper
8 Extending the spreadsheet tool
Warning – this should only be attempted by users who are confident in the use of Excel, as well as this particular spreadsheet tool.
There are three main ways in which the tool can be extended:
i) Addition of more risk measures
ii) Addition of more risk scenarios (i.e. types of room)
iii) Addition of more protection systems.
This Section gives an outline of the steps to follow. It does not give guidance on suitable data values. It is the responsibility of the user to ensure that data values are appropriate for a particular application.
Warning – before starting, it is vital to make a back-up copy of the tool, so you can start again if you get in a muddle! It is also a good idea to save further copies at regular intervals, so you can restart without going all the way back to the beginning if you make a mistake.
Additional risk measure
“Basic Data” sheet
Add extra row(s) for the cost conversion factors, row 10+.
“Loss ~ <scenario>” sheet
For the consequences in rows 26+, the reduced consequences come from cell I83 (rather than I75) and the inaccuracy from cell J83 (rather than J75).
Monetary consequences use row 14+; use row 13 as a template, and in the formulae replace B25 by B26, C25 by C26, “Basic Data”!B9 by “Basic Data”!B10, “Basic Data”!C9 by “Basic Data”!C10
Proportion of <risk measure> affected – copy the block of cells A73:J79 to A81, and use the copied block as a template. Chance the name of <risk measure> in A82, and values in B83:C85.
Change data as appropriate.
Repeat this process for every “Loss ~ <scenario>” sheet.
83 Guidance on cost benefit analysis
BRE Fire and Security Client report number 226-023
© BRE Certification Ltd 2007
Printed on environmentally friendly paper
“Risk Summary (2)” sheet
Add extra rows for the additional risk measure in row 12+.
You will need another block of data for the new measure. Use the “environment” block (A204:G223) as a template – copy this to cell A235+. The loss data will come from “Loss ~ <scenario>”!B$14 and …I$14 for the first new measure, etc.
“Chart ~ risk contributions” sheet
This chart takes data from the “Risk Summary (2)” sheet, cells A5:B11 and E5:E11. Use the Excel Chart Wizard to extend the “series” range to include row 12+.
Additional risk scenarios
“Loss ~ <scenario>” sheet
Copy the “Loss ~ store” sheet and use as a template. Rename the copied sheet to reflect the new scenario.
Change the input data values as appropriate.
Repeat this process for every “Loss ~ <scenario>” sheet.
“Risk ~ <scenario>” sheet
Copy the “Risk ~ store” sheet and use as a template. Rename the copied sheet to reflect the new scenario. Do a global replace of “loss ~ store” to “loss ~ <new roomname>” on the copied sheet.
Change the input data values as appropriate.
“Risk Summary” sheet
use rows 43:46 as a template; copy and paste them to cell A47
Change “~ store” to “~ <new roomname>” in the newly-pasted rows only
Insert a blank row, then copy row 11 to use as a template in row 12. Change “~ store” to “~ <new roomname>” in the newly-pasted row only. Change the location name in cell A12.
84 Guidance on cost benefit analysis
BRE Fire and Security Client report number 226-023
© BRE Certification Ltd 2007
Printed on environmentally friendly paper
“Risk Summary (2)” sheet
Insert four blank rows after each risk metric block (cells A18:G47, etc). Use the four “store room (<i>) rows as a template, copy and paste these into the blank rows. Change “~ store” to “~ <new roomname>” in the newly-pasted rows only.
Make sure the SUM(…) formulae for each metric (see cells B5:B11 and E5:E11) include all the appropriate data.
Make sure the SUM(…) formulae for the total number of fires are correct too.
“Chart ~ risk vs location” sheet
This chart takes data from the “Risk Summary” sheet, cells A5:B11 and E5:E11. Use the Excel Chart Wizard to extend the “series” range to include row 12+.
Additional protection systems
If you do not want more than three systems in total, the easiest approach is to simply rename one of the existing systems (that you do not want to use, obviously!), and replace the input data with values appropriate to the new system. You will also need to change the system name on the “Cost Summary & CBA” sheet to avoid confusion.
If you want to mix and match from a list of four or more different systems, you will need to add a system, as follows. This is the most long-winded of the three extensions, but unfortunately the one you are most likely to want to use.
“System ~ <new name>” sheet
Make a copy of an existing system sheet, to use as a template. Rename the copied sheet, and change the input data as appropriate.
“Risk ~ <scenario>” sheet
Add extra rows beneath each block for the transition probabilities (eg. rows 38:43). Note: the first new system can use the row labelled “system 4”.
Copy the row above the new row, and paste into the new row to use as a template.
Change “~ detection” to “~ <new name>” in the new row
Change “…CBA’!B$14” to “…CBA’!B$15” in the new row.
Make sure the combined systems effect and inaccuracy include terms for the new system.
Repeat this for every “Risk ~ <scenario>” sheet.
85 Guidance on cost benefit analysis
BRE Fire and Security Client report number 226-023
© BRE Certification Ltd 2007
Printed on environmentally friendly paper
“Loss ~ <scenario>” sheets
Add extra rows beneath each block for the proportion of <risk measure> affected (eg. rows 34:39). Note: the first new system can use the row labelled “system 4”.
Copy the row above the new row, and paste into the new row to use as a template.
Change “~ detection” to “~ <new name>” in the new row
Change “…CBA’!B$14” to “…CBA’!B$15” in the new row.
Make sure the combined systems effect and inaccuracy include terms for the new system.
Repeat this for every “Loss ~ <scenario> (<i>)” sheet.
“Cost Summary and CBA” sheet
Add an extra system in row 15, using row 14 as a template
Change “~ detection” to “~ <new name>” in the new row.
Update the formulae for system costs (cell C4) and uncertainty (cell E4), also the additional benefits (cell C6) and its uncertainty (cell E6) to include the new system. Note: the uncertainties use Excel Array Formulae; you have to press CTRL+SHIFT+ENTER when you have finished editing these, rather than simply ENTER.