Embed Size (px)
Citation preview
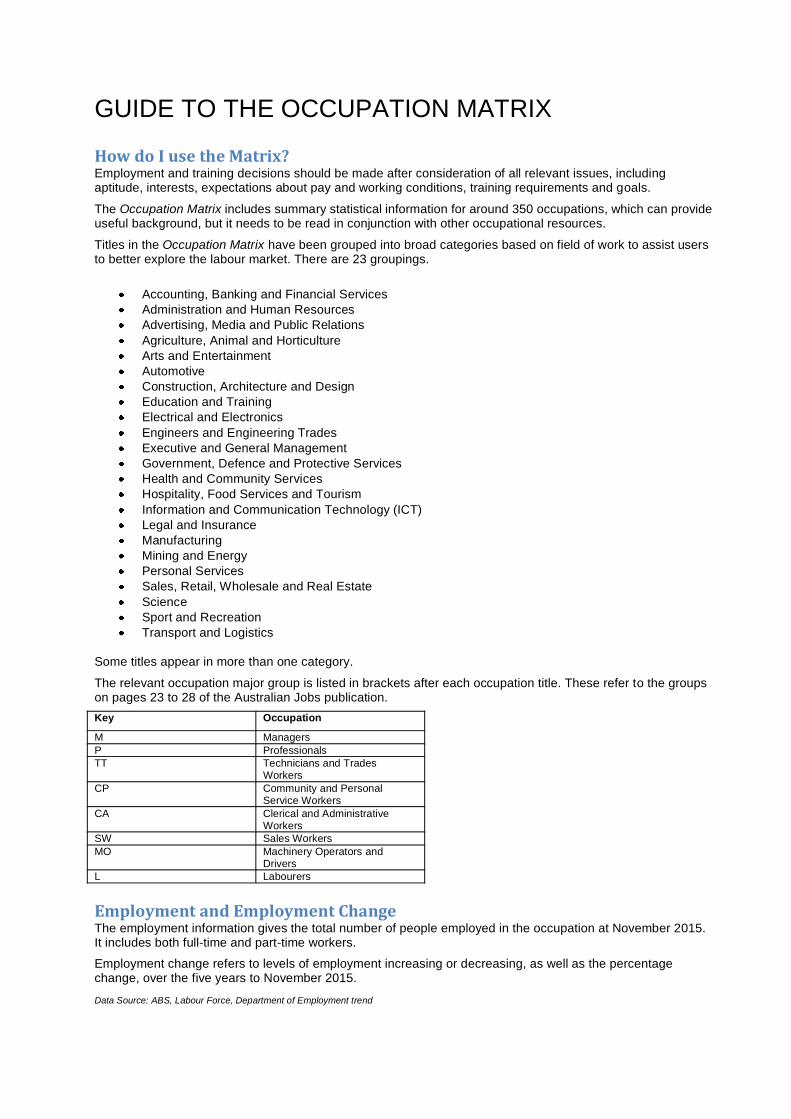
GUIDE TO THE OCCUPATION MATRIX
HowdoIusetheMatrix?Employment and training decisions should be made after consideration of all relevant issues, including aptitude, interests, expectations about pay and working conditions, training requirements and goals.
The Occupation Matrix includes summary statistical information for around 350 occupations, which can provide useful background, but it needs to be read in conjunction with other occupational resources.
Titles in the Occupation Matrix have been grouped into broad categories based on field of work to assist users to better explore the labour market. There are 23 groupings.
Accounting, Banking and Financial Services Administration and Human Resources Advertising, Media and Public Relations Agriculture, Animal and Horticulture Arts and Entertainment Automotive Construction, Architecture and Design Education and Training Electrical and Electronics Engineers and Engineering Trades Executive and General Management Government, Defence and Protective Services Health and Community Services Hospitality, Food Services and Tourism Information and Communication Technology (ICT) Legal and Insurance Manufacturing Mining and Energy Personal Services Sales, Retail, Wholesale and Real Estate Science Sport and Recreation Transport and Logistics
Some titles appear in more than one category.
The relevant occupation major group is listed in brackets after each occupation title. These refer to the groups on pages 23 to 28 of the Australian Jobs publication. Key Occupation
M Managers P Professionals TT Technicians and Trades
Workers CP Community and Personal
Service Workers CA Clerical and Administrative
Workers SW Sales Workers MO Machinery Operators and
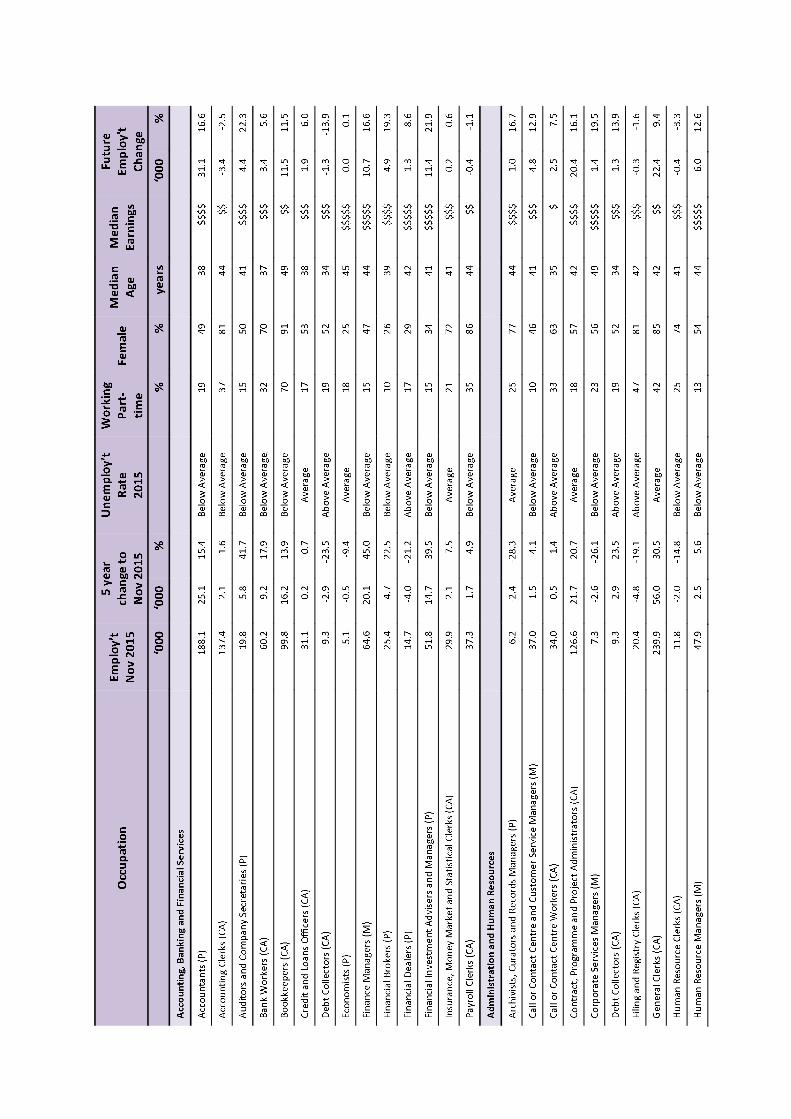
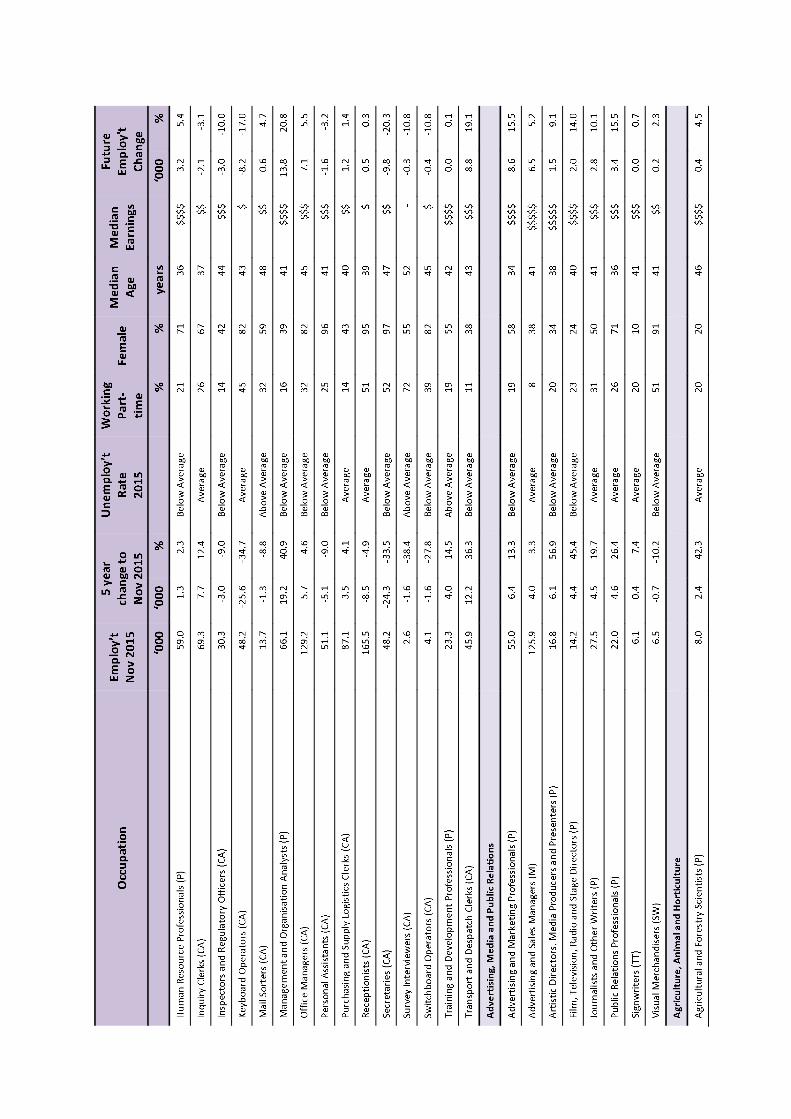
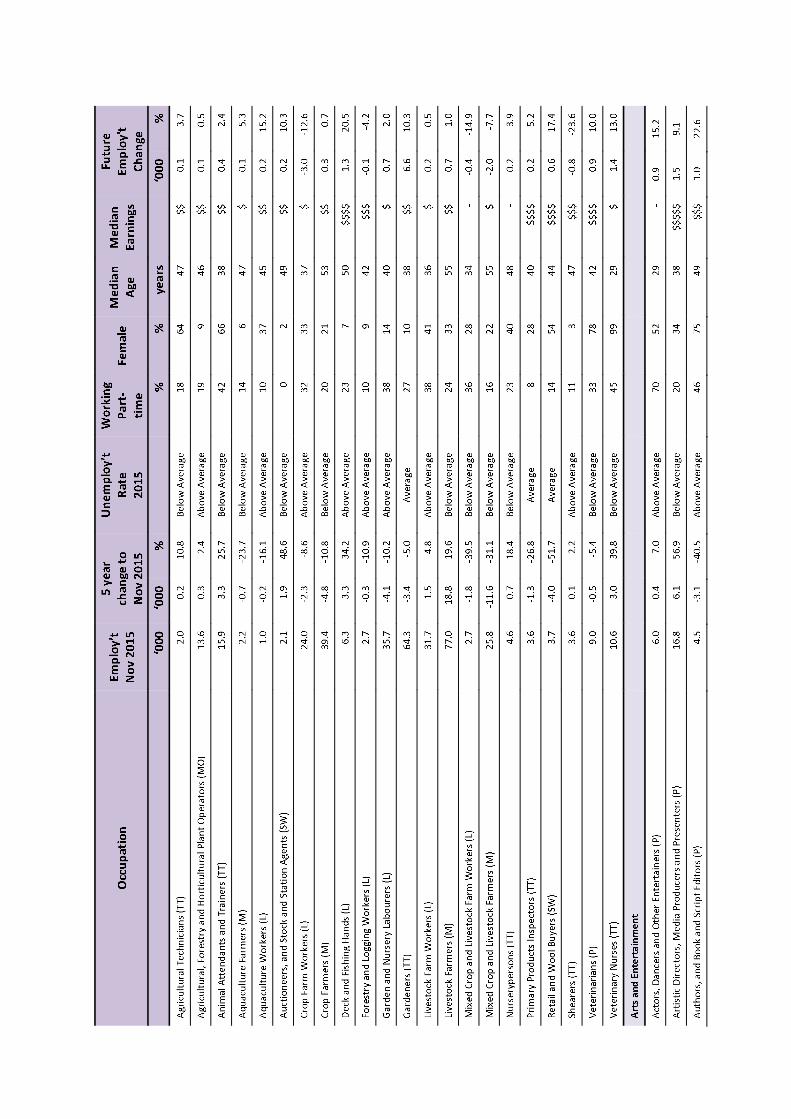
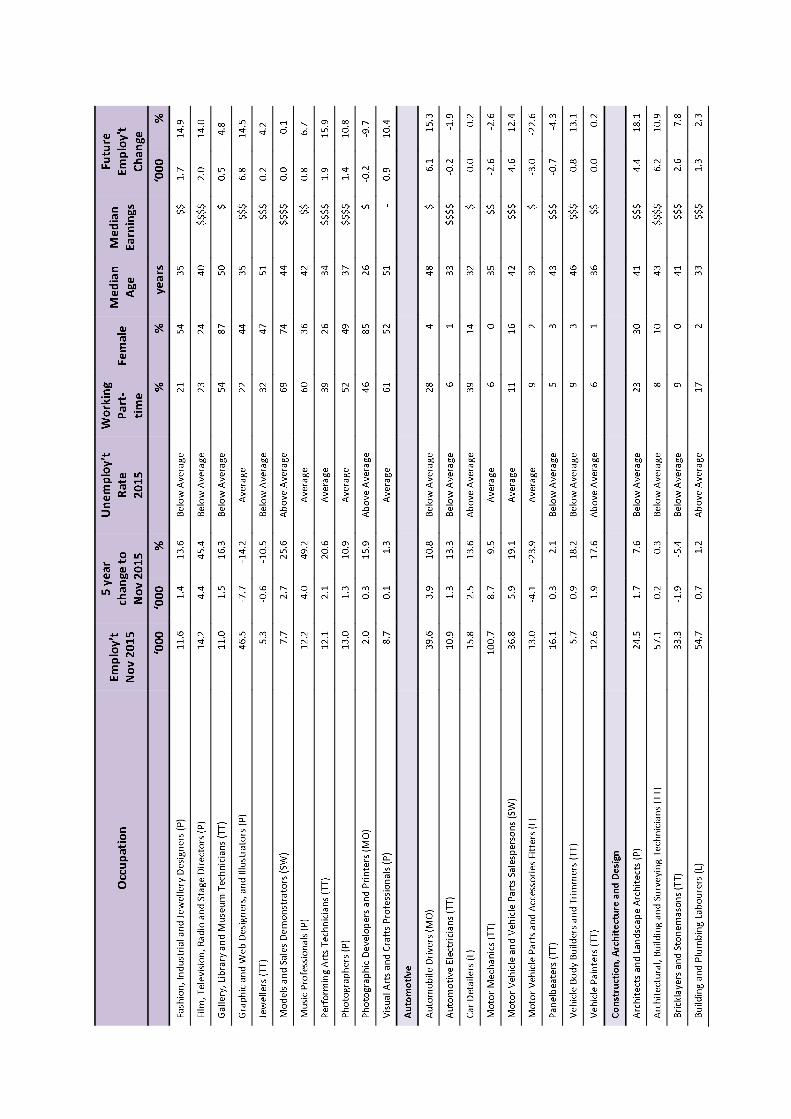
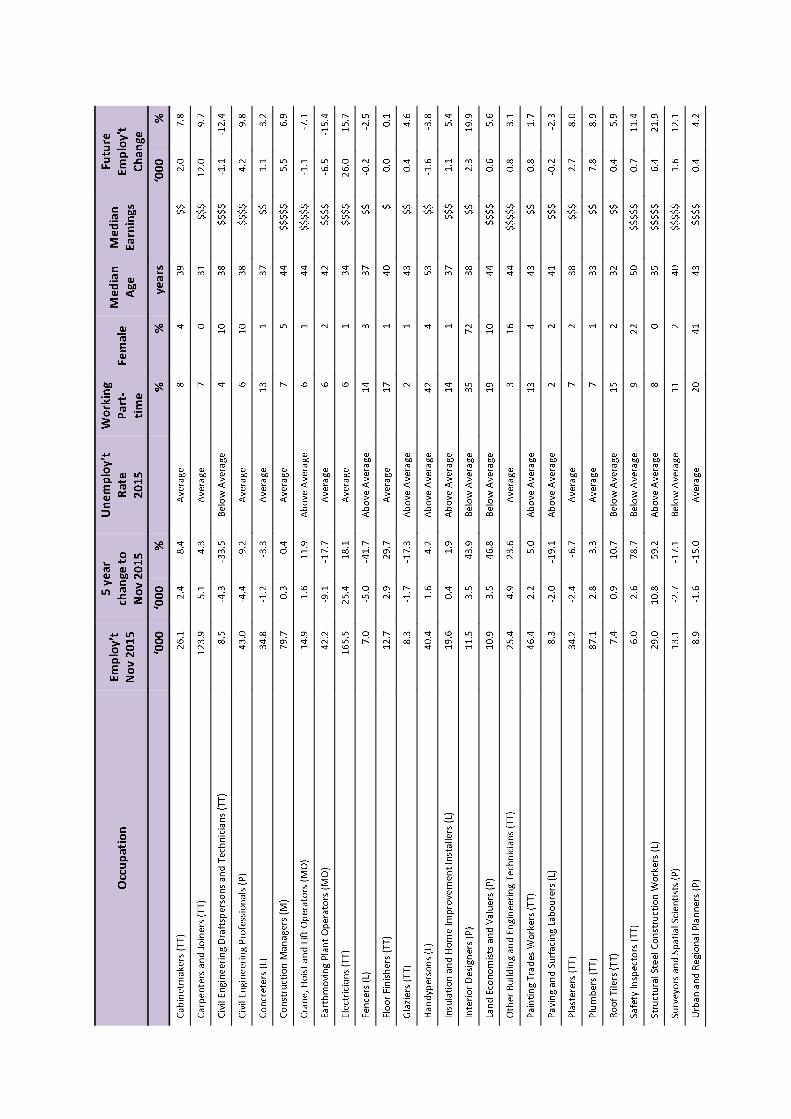
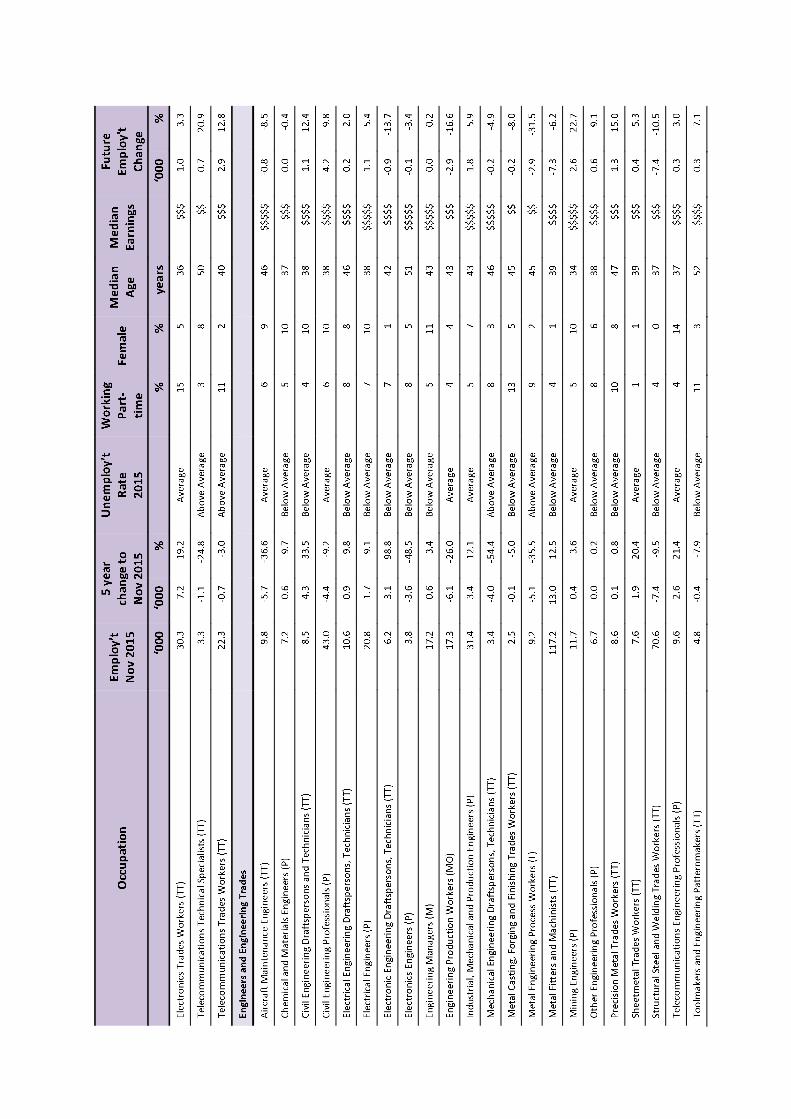
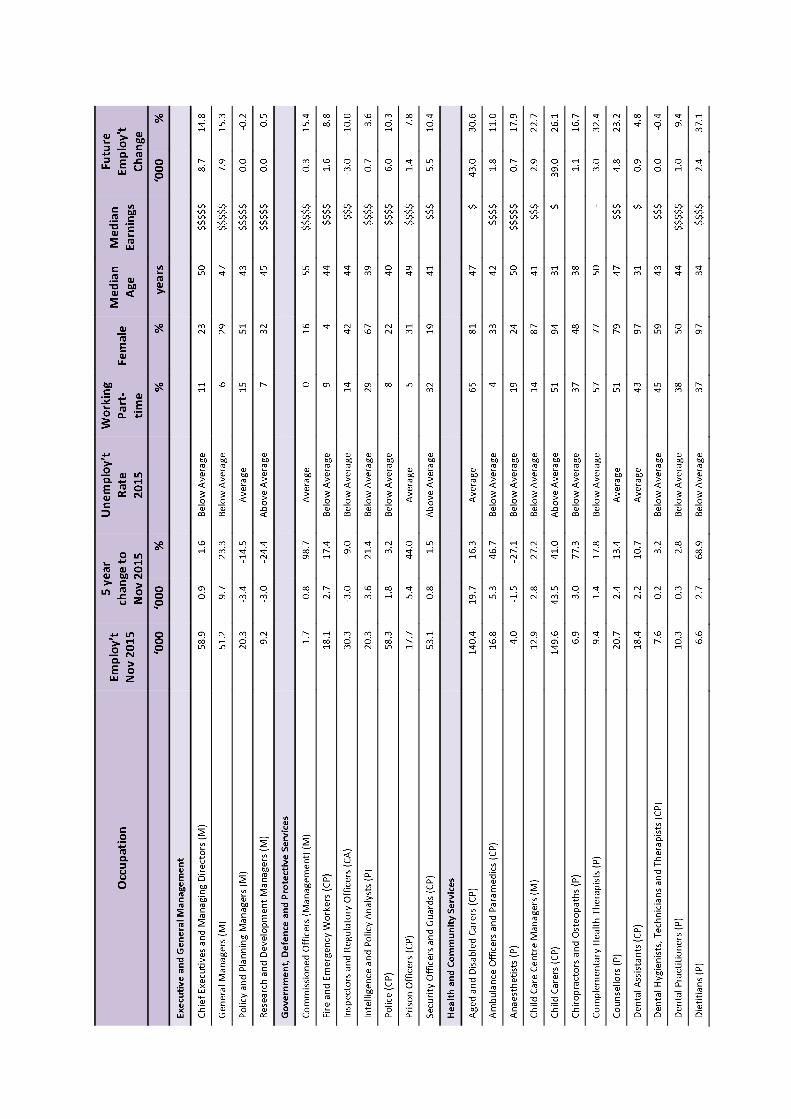
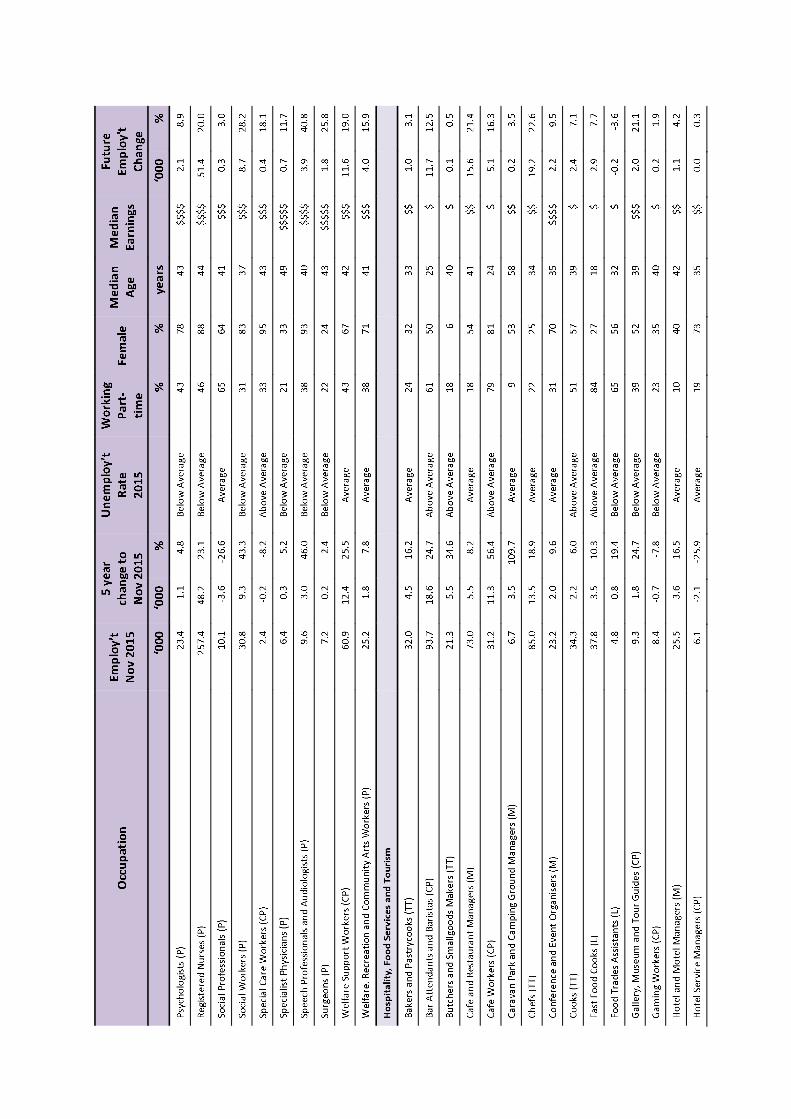
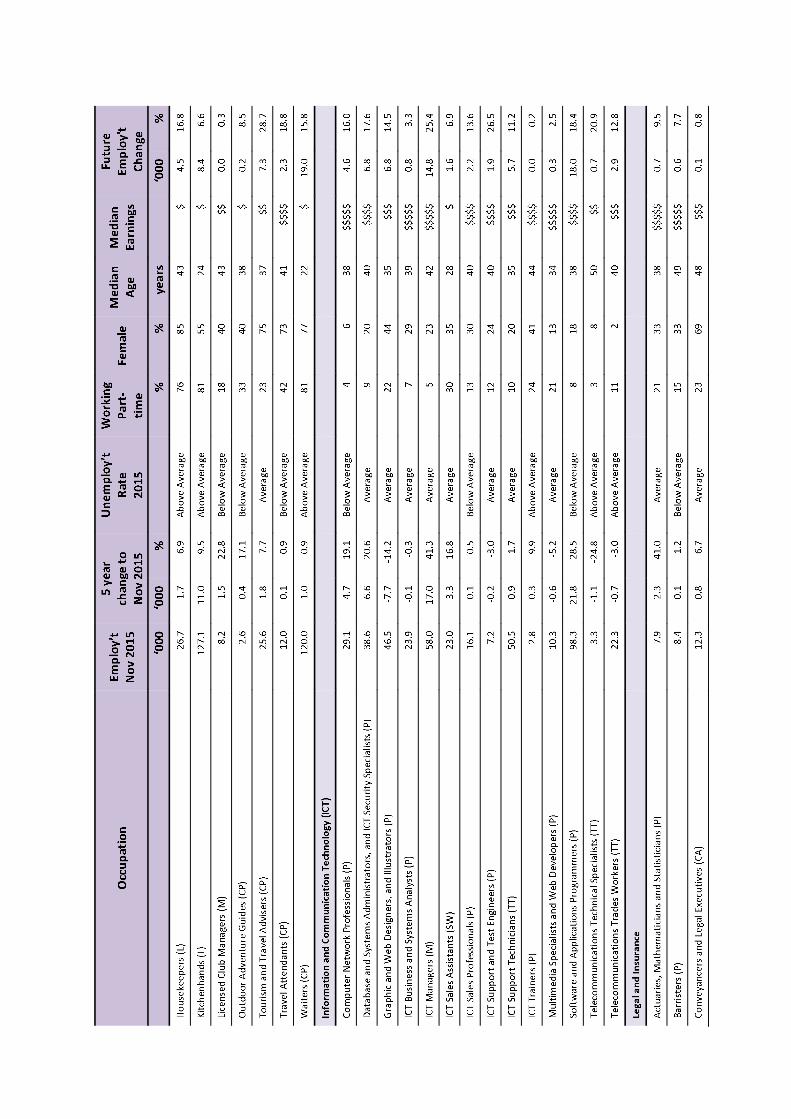
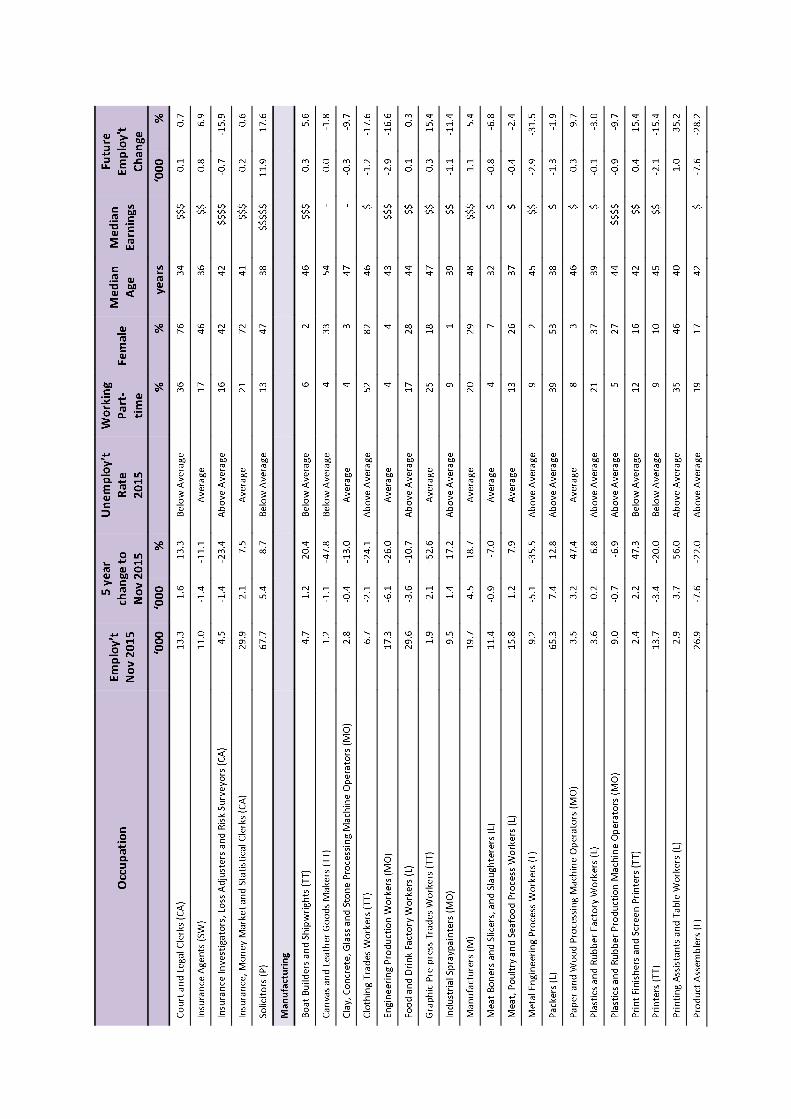
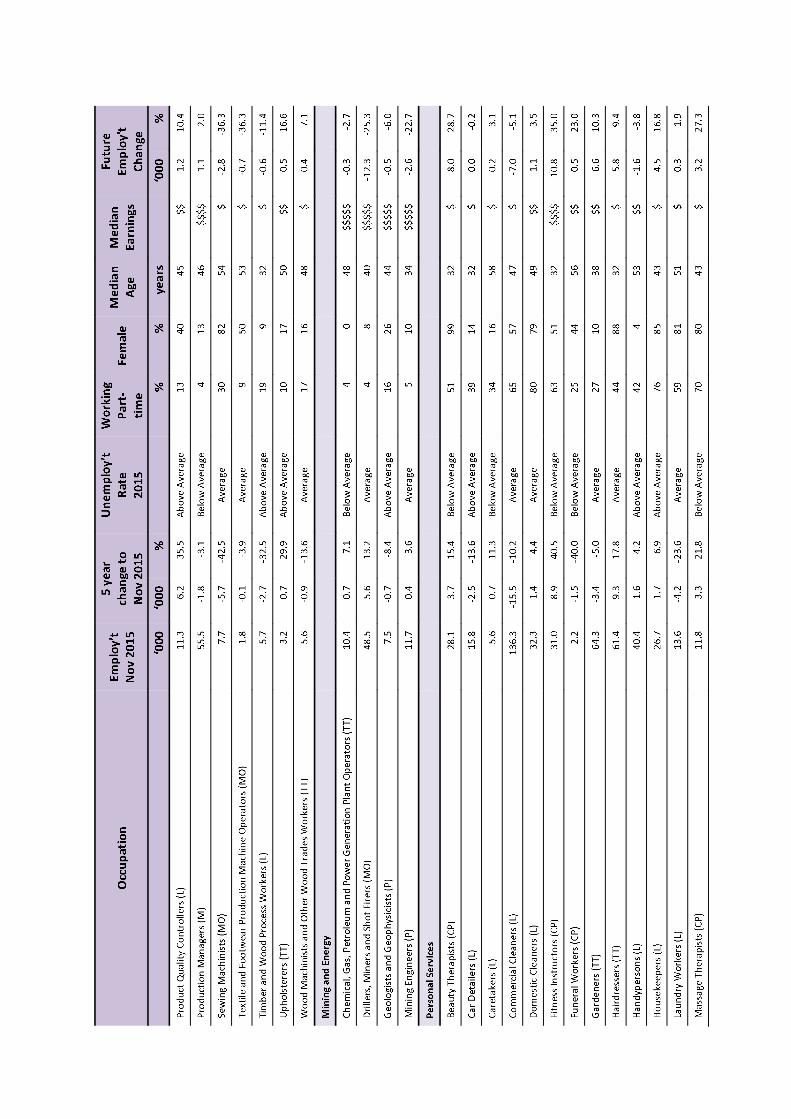
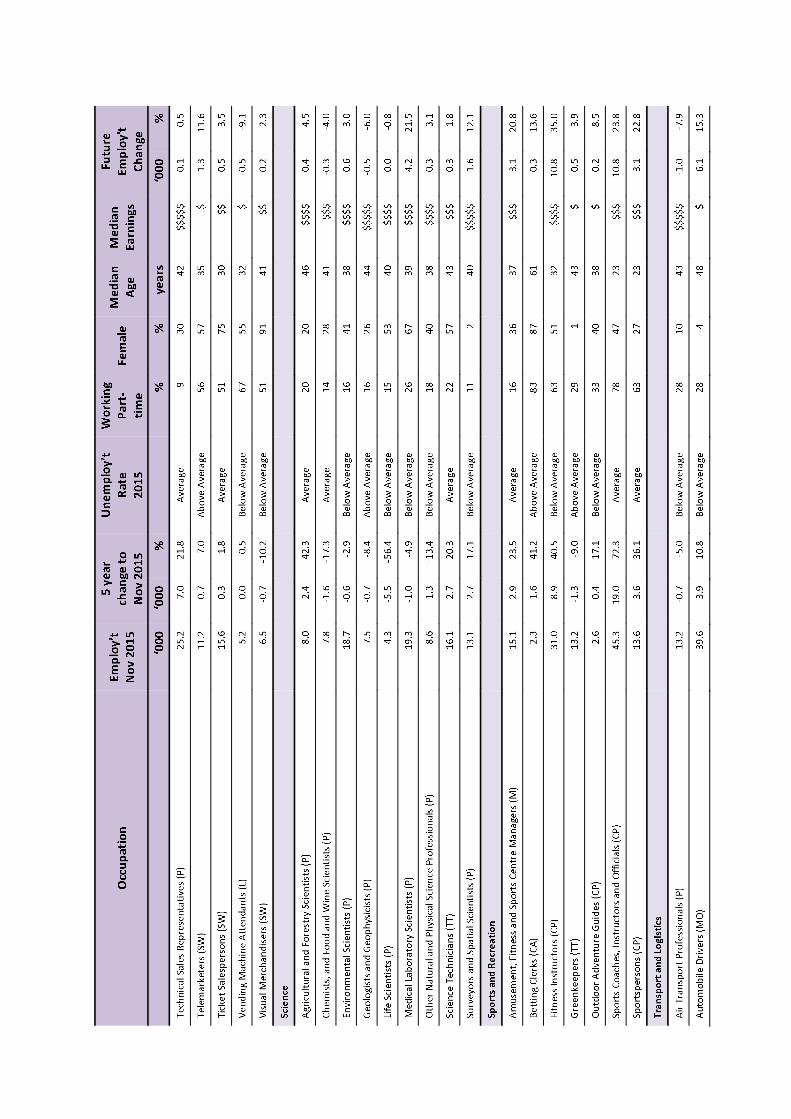
Drivers L Labourers EmploymentandEmploymentChangeThe employment information gives the total number of people employed in the occupation at November 2015. It includes both full-time and part-time workers.
Employment change refers to levels of employment increasing or decreasing, as well as the percentage change, over the five years to November 2015.
Data Source: ABS, Labour Force, Department of Employment trend
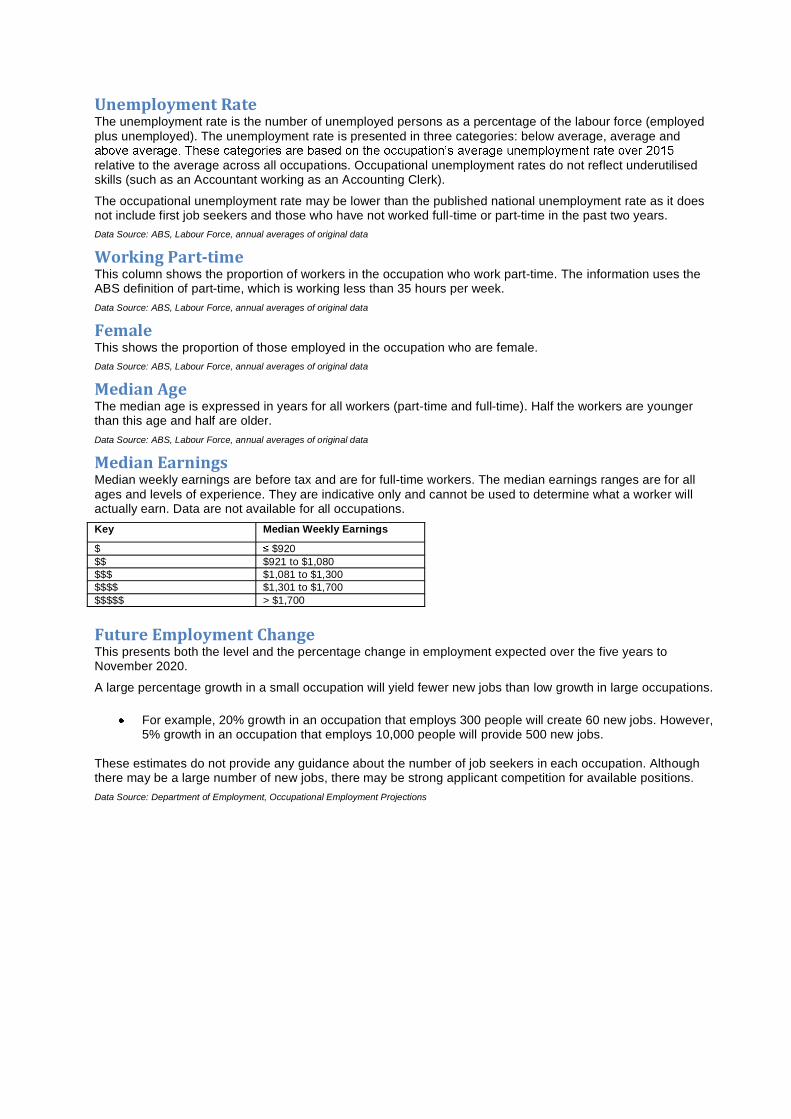
UnemploymentRateThe unemployment rate is the number of unemployed persons as a percentage of the labour force (employed plus unemployed). The unemployment rate is presented in three categories: below average, average and
relative to the average across all occupations. Occupational unemployment rates do not reflect underutilised skills (such as an Accountant working as an Accounting Clerk).
The occupational unemployment rate may be lower than the published national unemployment rate as it does not include first job seekers and those who have not worked full-time or part-time in the past two years. Data Source: ABS, Labour Force, annual averages of original data
WorkingPart-timeThis column shows the proportion of workers in the occupation who work part-time. The information uses the ABS definition of part-time, which is working less than 35 hours per week. Data Source: ABS, Labour Force, annual averages of original data
FemaleThis shows the proportion of those employed in the occupation who are female. Data Source: ABS, Labour Force, annual averages of original data
MedianAgeThe median age is expressed in years for all workers (part-time and full-time). Half the workers are younger than this age and half are older. Data Source: ABS, Labour Force, annual averages of original data
MedianEarningsMedian weekly earnings are before tax and are for full-time workers. The median earnings ranges are for all ages and levels of experience. They are indicative only and cannot be used to determine what a worker will actually earn. Data are not available for all occupations. Key Median Weekly Earnings
$ $920 $$ $921 to $1,080 $$$ $1,081 to $1,300 $$$$ $1,301 to $1,700 $$$$$ > $1,700 FutureEmploymentChangeThis presents both the level and the percentage change in employment expected over the five years to November 2020.
A large percentage growth in a small occupation will yield fewer new jobs than low growth in large occupations.
For example, 20% growth in an occupation that employs 300 people will create 60 new jobs. However, 5% growth in an occupation that employs 10,000 people will provide 500 new jobs.
These estimates do not provide any guidance about the number of job seekers in each occupation. Although there may be a large number of new jobs, there may be strong applicant competition for available positions. Data Source: Department of Employment, Occupational Employment Projections