Embed Size (px)
Citation preview
Gulf of Mexico low-frequency ocean soundscape impactedby airguns
Sean M. Wigginsa)
Scripps Institution of Oceanography, 9500 Gilman Drive, La Jolla, California 92093-0205, USA
Jesse M. Hall3354 Trumbull Street, San Diego, California 92106, USA
Bruce J. Thayre and John A. HildebrandScripps Institution of Oceanography, 9500 Gilman Drive, La Jolla, California 92093-0205, USA
(Received 12 February 2016; revised 6 June 2016; accepted 20 June 2016; published online 12 July2016)
The ocean soundscape of the Gulf of Mexico (GOM) has not been well-studied, although it is an
important habitat for marine mammals, including sperm and beaked whales, many dolphin species,
and a potentially endangered baleen whale species. The GOM is also home to high levels of
hydrocarbon exploration and extraction, heavily used commercial shipping ports, and significant
fishery industry activity, all of which are known contributors to oceanic noise. From 2010–2013,
the soundscape of three deep and two shallow water sites in the GOM were monitored over
10 – 1000 Hz. Average sound pressure spectrum levels were high, >90 dB re 1 lPa2/Hz at <40 Hz
for the deep water sites and were associated with noise from seismic exploration airguns. More
moderate sound pressure levels, <55 dB re 1 lPa2/Hz at >700 Hz, were present at a shallow water
site in the northeastern Gulf, removed from the zone of industrial development and bathymetrically
shielded from deep water anthropogenic sound sources. During passage of a high wind event
(Hurricane Isaac, 2012), sound pressure levels above 200 Hz increased with wind speed, but at
low frequencies (<100 Hz) sound pressure levels decreased owing to absence of noise from airguns.VC 2016 Author(s). All article content, except where otherwise noted, is licensed under a CreativeCommons Attribution (CC BY) license (http://creativecommons.org/licenses/by/4.0/).[http://dx.doi.org/10.1121/1.4955300]
[JAC] Pages: 176–183
I. INTRODUCTION
Ocean soundscapes have both anthropogenic and natural
sources, and often vary across frequencies, locations, and
time-periods (Hildebrand 2009). At low frequencies (i.e.,
10–1000 Hz), ship propulsion, seismic exploration, whale
calls, and wind are all common sound sources, but with dif-
ferent levels of occurrence and intensity depending on mea-
surement location and period. For example, at a deep-water
site in the northeastern Pacific it was shown that sound pres-
sure spectrum levels at 40 Hz have increased about 3 dB per
decade over the last 40 yr, attributed primarily to an increase
in commercial shipping and to the site’s deep-water expo-
sure to the Pacific Ocean basin (McDonald et al., 2006).
Conversely, at a nearby shallow-water site shielded from
deep ocean noise, 40 Hz sound pressure levels remained
relatively constant over the past 50 yr and were lower by
�20 dB (McDonald et al., 2008).
The ocean soundscape has been studied offshore of the
U.S. in the Pacific and Atlantic Oceans, showing that the
highest sound pressure levels are usually in the 10–100 Hz
band, and are typically dominated by commercial shipping
(Wenz, 1962); although in some regions, seismic exploration
also makes significant contributions to this band (Nieukirk
et al., 2004; Roth et al., 2012). At frequencies from �200 Hz
to 20 kHz, wind agitates the sea surface and is correlated
with ambient noise levels (Knudsen et al., 1948). While
these general relationships also hold for the soundscape in
the Gulf of Mexico (GOM), few measurements have been
reported for this important ocean basin.
During 2004–2005 in the GOM, Snyder (2007) recorded
ambient noise in the 10–1000 Hz band for over 1 yr at a site
approximately 300 km south of Panama City, FL at about
3000 m depth, near local shipping lanes. Spectrum levels
were computed in 1/3-octave bands from calibrated hydro-
phones. Mean sound pressure spectrum levels were approxi-
mately 90 dB re 1 lPa2/Hz at 25–50 Hz, �80 dB re 1 lPa2/
Hz at 100 Hz sloping down to about 60 dB re 1 lPa2/Hz near
1000 Hz with highest variability at 25 Hz and at frequencies
above �200 Hz. At the lowest frequencies, these high levels
are similar to sites with exposure to heavy commercial ship-
ping, both distant and local (Andrew et al., 2002; Chapman
and Price, 2011), and at the higher frequencies variability
was associated with local wind. Also, for approximately 1
month in 2001 in the northern GOM, Newcomb et al. (2002)
recorded similar sound pressure spectrum levels using simi-
lar equipment to Snyder (2007), although at shallower depths
on the continental slope at 600–1000 m. Their resultsa)Electronic mail: [email protected]
176 J. Acoust. Soc. Am. 140 (1), July 2016 VC Author(s) 2016.0001-4966/2016/140(1)/176/8

included sound pressure spectrum levels from periods
before, during, and after the passage of tropical storm Barry,
which showed variability associated with wind and sea state
at frequencies above 200 Hz, and ships and seismic explora-
tion below 100 Hz. While these studies are important as
apparently the only ones for documenting ambient noise
sound levels in the GOM, measurements from other loca-
tions throughout the Gulf are needed for comparison and to
provide a more complete picture of the GOM soundscape.
Starting in 2010, in response to the Deepwater Horizon
oil spill, autonomous acoustic recorders were deployed at
five sites around the northern and eastern GOM: three in deep
water (�1000 m) and two in shallow water (�100 – 250 m).
In this study, we compare low-frequency (10–1000 Hz) sound
pressure spectrum levels from over 3 yr of recordings and
show site-specific differences in levels and spectrum shape
along with similarities within each of the two site types: shal-
low and deep. Also, wind is shown to be well-correlated to
sound pressure levels at the higher end of our bandwidth,
including the passage of a hurricane. Airguns are a constant
source of noise in the GOM, and during the hurricane pas-
sage, low frequency sound pressure levels actually decreased
owing to the absence of seismic airgun activity.
II. METHODS
During 2010–2013, five high-frequency acoustic
recording packages (HARPs) sampling at 200 kHz continu-
ously were deployed for 2–9 months per deployment in the
GOM at sites with names based on the Bureau of Ocean
Energy Management (BOEM) lease blocks in which the sites
were located: Green Canyon (GC), Mississippi Canyon
(MC), Main Pass (MP), DeSoto Canyon (DC), and Dry
Tortugas (DT) (Fig. 1; Table I). Sites GC, MC, and DT were
deep water sites at 1100, 980, and 1300 m depths, respec-
tively; and MP and DC were shallow water sites at 90 and
260 m depths, respectively.
HARPs are seafloor-mounted, long-term autonomous
acoustic recorders consisting of a hydrophone tethered above
a data logger, batteries, flotation, acoustic release, and ballast
weight (Wiggins and Hildebrand, 2007). The frequency
response of each hydrophone electronics circuit board was
measured at Scripps Institution of Oceanography, and select
hydrophone/data logger pairs were full-system calibrated at the
U.S. Navy’s Transducer Evaluation Center in San Diego, CA.
The hydrophones were composed of two channels, one for
low-frequency (<2 kHz) and the other for high-frequency (>2
kHz), although we focus on only the low-frequency band for
this paper. Six Benthos AQ-1 lead-zirconium-titanate (PZT)
ceramic hydrophone elements (www.teledynebenthos.com)
were used for the low-frequency channel of each hydrophone.
Typical hydrophone sensitivity was measured to be �188 dB
re V/lPa with a single pole high-pass filter corner frequency
around 20 Hz. A 34 dB gain preamp and a four-pole low-pass
filter with a corner frequency around 2 kHz were added for sig-
nal conditioning. These calibrations were used to convert all
recordings to sound pressure levels. Signal clipping level was
around 160 dBpp re 1 lPa2 and the noise floor was approxi-
mately 54 dB re 1 lPa2/Hz at 10 Hz and 27 dB re 1 lPa2/Hz at
1000 Hz.
Acoustic data were recorded in a standard wav audio for-
mat and were processed and analyzed with Triton, a MATLAB-
based (www.mathworks.com) software package for large
acoustic data sets (Wiggins and Hildebrand, 2007). Because
the recordings were sampled at 200 000 samples s�1, the
waveforms were decimated by a factor of 100 to provide
compact files for ease of processing and an effective sample
rate of 2 kHz. Consecutive, 5 s waveforms were transformed
into sequential sound pressure spectral density estimates with
1 Hz bins using the Welch method (Welch, 1967). During
recording sessions, HARPs write sequential 75 s acoustic
records to standard laptop-style computer hard disk drives
such that there were 15, 5 s spectra for each 75 s acoustic
record. However, system self-noise can be present when the
HARP is writing to disk (12 s out of each 75 s record), so the
first three 5 s spectra were not used for averaging. Averages
were computed per day, with partial days and days with
deployment/recovery ships sounds or with known instrument
self-noise problems discarded. The sequential 5 s spectra
were further analyzed with custom MATLAB-based software to
provide average and percentile sound pressure spectrum
levels for the five sites over the study period in addition to
long-term spectrograms and sound pressure level time series
for specific frequency bands.
One-hour averaged wind speeds were obtained from the
National Oceanic and Atmospheric Administration (NOAA)
FIG. 1. HARP locations (see Table I) shown as squares with site names.
NOAA NDBC weather buoy station 42003 shown as triangle northwest of
site DT. GOM bathymetric map with contours at 100, 1000, 2000, and
3000 m depth.
TABLE I. HARP deployment location, depth and number of full days used
for sound pressure spectral averages.
Site Latitude (N) Longitude (W) Depth (m) Full daysa
GC 27� 33.40 91� 10.00 1100 1011
MC 28� 50.80 88� 27.90 980 1075
MP 29� 15.30 88� 17.80 90 957
DC 29� 03.20 86� 05.80 260 818
DT 25� 31.90 84� 38.20 1300 786
aNumber of complete recording days between May 2010 and October 2013.
J. Acoust. Soc. Am. 140 (1), July 2016 Wiggins et al. 177

National Data Buoy Center (NDBC) for station 42003
(26.0070N 85.6480W), located �115 km northwest of site DT
(Fig. 1) with anemometer height at 5 m above sea level
(http://www.ndbc.noaa.gov/station_page.php?station¼42003).
Corresponding 1 h averaged sound pressure levels were calcu-
lated with recordings from site DT at 40 and 900 Hz for wind
speed comparison over 5 days in August 2012 when tropical
storm/hurricane Isaac was present, and additional averaging
over 1 day was computed to compare wind speeds to sound
levels over a 1 yr period from 1 August 2012 through 31 July
2013. Tropical storm and hurricane positions and wind speeds
were provided by NOAA’s National Climate Data Center
(NCDC) International Best Tracks Archive for Climate
Stewardship (IBTrACS) (Knapp et al., 2010).
Daily averaged sound pressure levels at 40 Hz over the
deployment period were used to compare the temporal
variability of airgun activity at and between the five sites.
Example time series waveforms and spectrograms for two
periods at site GC, one with low and one with high sound
pressure levels, show how these sound levels relate to indi-
vidual airgun pulses.
III. RESULTS
Between 786 and 1075 daily averaged sound pressure
spectrum levels were used to compute long-term spectro-
grams over the deployment period for each of the five sites
(Table I and Fig. 2). Each site has unique sound pressure
spectrum characteristics with varying intensities in different
frequency bands and over various time intervals. For exam-
ple, at frequencies below 100 Hz, site DT shows a relatively
smooth decrease and then increase in levels over the whole
deployment period compared to site MP where sound pres-
sure levels increase and decrease over a greater range and
over shorter periods of about one week or less. The vertical
striations shown in all of the long-term spectrograms are
caused by discrete events, such as wind and storms for
frequencies above 200 Hz and airgun surveys for lower
frequencies.
Average deployment period sound pressure spectrum
levels (Fig. 3) show similar spectral shapes for the deep
water sites (GC, MC, and DT) over the entire band. The two
shallow water sites (MP and DC) likewise share similar
spectral levels below 30 Hz but diverge at higher frequen-
cies. In general, the deep water sites had higher levels than
the shallow water sites below 100 Hz (Figs. 2 and 3). All
sites have high average levels >90 dB re 1 lPa2/Hz at 10 Hz;
and at 100 Hz, sound pressure spectrum levels are around
80 dB re 1 lPa2/Hz for all sites except DC which is at 64 dB
re 1 lPa2/Hz. Also, the levels at the other shallow site, MP,
are 5–10 dB less than the deep water sites from 20 to 60 Hz
and the spectrum is concaved upward; whereas, the deep
water sites are convex over the same band.
At frequencies above 100 Hz, deep water sites GC and
MC are similar, and they include tonal signals around 150,
175, 200, 550, and 675 Hz, but the other deep water site, DT,
only shows a strong tone at �175 Hz and weaker tones
around 150 and 200 Hz (Fig. 3). Neither of the shallow water
sites have these distinct tones, but MP shows weak tonal
structure from about 60–200 Hz. Above 300 Hz, MP has
the highest sound pressure spectrum levels; whereas, the
other shallow water site, DC, has the lowest levels above
30 Hz.
FIG. 2. (Color online) Long-term spectrograms using daily average sound
pressure spectrum levels for each site over the deployment period. White
regions are gaps between the end of one recording cycle and the start of the
next, or due to instrument problems. Time ticks are the beginning of each
month with January ticks between “0” and “1” above year label.
FIG. 3. (Color online) Average sound pressure spectrum levels by site over
entire deployment period. See Table I for total number of days used for each
average.
178 J. Acoust. Soc. Am. 140 (1), July 2016 Wiggins et al.

Percentile plots for each site over the deployment period
show sound pressure spectrum levels that are approximately
normally distributed, except for the shallow water site MP
which is long-tailed at higher levels (Fig. 4). Both shallow
water sites, MP and DC, show the greatest variability
between the 1st and 99th percentiles, with 20–40 dB for MP
below 100 Hz and over 20 dB for DC above 200 Hz.
One year of daily averages of wind speed from NDBC
station 42003 and 900 Hz sound pressure levels from site DT
are well correlated (Pearson correlation 0.78, null hypothesis
p¼ 1� 10�75) with corresponding peaks and troughs,
including similar rates of change (Fig. 5). The highest daily
average wind speed and sound pressure level measured for
the August 2012–July 2013 period occurred in late August
and corresponded to the tropical storm and hurricane Isaac
which traveled northwest across the GOM from DT to
Louisiana (Fig. 6). Also, in early June, tropical storm Andrea
traveling from the deep water Gulf northeast over DC corre-
sponded to elevated wind speed and sound pressure levels.
Beginning at 0000 on 27 August 2012, southeast of site
DT, tropical storm Isaac’s wind speeds were measured to be
about 50 kts per IBTrACS (Knapp et al., 2010) and traveling
northwest increased to 55 kts at 1200 h above site DT
(Fig. 6). About 6 h later wind speeds had reached 60 kts near
NDBC station 42003. Isaac continued northwest with
increasing wind speeds to 65 kts, becoming a category 1 hur-
ricane at 1200 h on 28 August. Six hours later, Isaac wind
speeds reached 70 kts for about 12 h while passing site MC
before reaching Louisiana and reduced wind speeds back to
tropical storm status as it continued to head northwest over
land.
As with the yearlong comparison of wind speed and
sound pressure levels for station 42003 and site DT (Fig. 5),
hourly averaged wind speed and sound pressure levels at
900 Hz for the 5 days surrounding Isaac’s passage show the
highest positive correlation with a time lag of 4 h (Pearson
correlation 0.72, null hypothesis p¼ 1� 10�20), although
Isaac took 6 h to travel from DT to station 42003 and the
FIG. 4. Distribution of daily average
sound pressure spectrum levels as per-
centiles: 1 (lowest), 10, 50 (thick mid-
dle line), 90, and 99% (highest).
FIG. 5. One year of daily average
wind speed from NOAA NDBC station
42003 (top panel) and sound pressure
level at 900 Hz for site DT (bottom
panel) between 1 August 2012 and 31
July 2013. Peaks, troughs, and rate of
change of both measurements are well
correlated (Pearson correlation 0.78).
Hurricane Isaac appears as the peak at
end of August and tropical storm
Andrea as the peak in early June.
J. Acoust. Soc. Am. 140 (1), July 2016 Wiggins et al. 179

time difference between the two time series main peaks and
following troughs (i.e., eye of the storm) was about 6 h
(Figs. 6 and 7). Also, the shape of the wind speed and
900 Hz sound pressure level time series are different around
their respective lows. The 900 Hz sound pressure levels peak
sharply before the wide low trough and are lower after the
trough; whereas, the wind speed is about the same after the
low trough as before, and continues to increase for a few
more hours. Furthermore, the sound pressure levels at 40 Hz
(Fig. 7, third panel) are not correlated with the wind speed,
900 Hz sound levels, nor the storm directly; although, the
40 Hz low (81 dB re 1 lPa2) �1200 on 28 August was when
Isaac was about 6 h from passing site MC, during a period
when airgun actively was non-existent at all sites (Fig. 7,
bottom panel). Also, discrete periods of high sound pressure
levels from airgun activity lasting �12 h followed by a few
hours with lower levels before increasing again are apparent
at and in the band around 40 Hz (Fig. 7).
Daily sound pressure levels at 40 Hz over the deployment
period show long-term and short-term variability at and
between the five sites (Figs. 2 and 8). As with the average
deployment period sound pressure spectrum (Fig. 3), the three
deep water sites (GC, MC, and DT) show the highest sound
pressure levels at 40 Hz, but all sites show a minimum in the
middle of 2012 with increasing levels thereafter until the end
of the recordings. Sites MC and MP show a similar pattern
over the deployment due to their close proximity to each other,
although daily 40 Hz sound pressure levels at MP were about
10 dB lower than at MC. The highest sound pressure levels at
each site were investigated and were found to be from intense
airgun activity for all sites except MP whose levels above
90 dB re 1 lPa2 were found to be from mooring strum caused
by ocean currents and tides at this shallow water (�90 m) site.
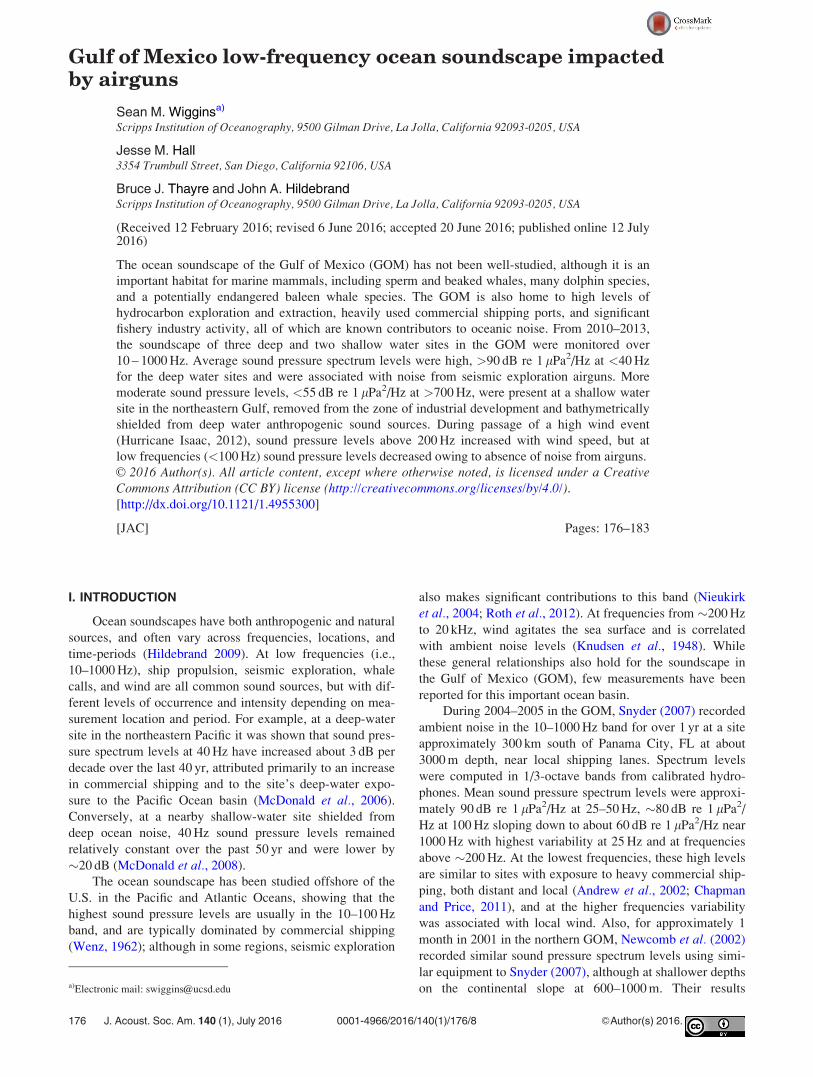
Example 1-min time series and spectrograms from peri-
ods of 40 Hz low sound pressure levels (86 dB re 1 lPa2, 4
June 2012) and high sound pressure levels (103 dB re 1 lPa2,
23 March 2013) from site GC show how the different inten-
sity and number of airgun pulses were related to the daily
averages (Figs. 8 and 9). The low sound pressure level re-
cording shows distant low frequency airgun pulses every 15
s; whereas, the high sound pressure level recording is more
complex with higher frequency (150 – 250 Hz) short pulses
every 10 s, and close (intense) and distant (moderate) low
frequency long pulses every 20 or 30 s.
IV. DISCUSSION
Deployment average sound pressure spectrum levels
were found to vary between sites across frequency, but site
similarities also were observed. The deep water sites were
FIG. 6. Tropical storm and hurricane Isaac’s track northwest through the
GOM 27–30 August 2012 with times (GMT) and wind speed (kts) next to
locations (black circles, diameters relative to wind speed). HARP site loca-
tions (squares) and weather buoy station (triangle) are also shown.
FIG. 7. (Color online) Hourly average
wind speed from NOAA NDBC station
42003 (top panel), sound pressure level
at 900 Hz (second panel), sound pres-
sure level at 40 Hz (third panel), and
spectrogram using 1 h average sound
pressure spectrum levels (bottom
panel) for site DT during period of
tropical storm and hurricane Isaac pas-
sage 25–30 August 2012. The storm
has �6 h time lag between site DT and
station 42003. The “eye” of the storm
is clearly shown as a low in both wind
speed and 900 Hz sound pressure lev-
els. The 40 Hz sound pressure levels
are largely uncorrelated with the storm,
but show over 10 dB of variability in
airgun activity over the 5 d.
180 J. Acoust. Soc. Am. 140 (1), July 2016 Wiggins et al.

most similar with the highest sound pressure levels below
100 Hz. Levels at site DT were similar to a deep water site to
the northwest described by Snyder (2007) with 1/3-octave
levels from 2005 within 1–2 dB those measured at DT, sug-
gesting minimal change in the eastern deep water GOM am-
bient soundscape over the 6–8 yr between measurements.
The GOM low frequency deep water ambient noise lev-
els reported here are among the highest measured averages
over long periods (Dahl et al., 2007). Below 100 Hz in most
regions of the world’s oceans, sound pressure levels are
dominated by surface ship noise, and deep water sites are
well-suited to receive distant ship sounds because of favor-
able sound propagation conditions, such as low frequency
low attenuation and down-slope conversion to the deep
sound channel (Ross, 1976). Furthermore, 10 of the top 13
highest ranked U.S. ports for total handled tonnage are on
the Gulf Coast, with the majority of the cargo transported
via bulk carriers (Strocko et al., 2014). While bulk carriers
travel at slower speeds than container and vehicle carriers,
their source levels are similar suggesting an overall larger
impact on the regional soundscape since the bulk carrier
sound levels will remain high for longer periods effectively
resulting in higher sound exposure levels (SEL) for a given
area (McKenna et al., 2012).
Even though ship traffic is high in the GOM and
contributes to the soundscape, airgun pulses from seismic
exploration are the dominate source of low frequency, high
sound levels in the deep water Gulf (Fig. 9). Nearby ship
sounds were observed in the acoustic records, but typically
their passages were shorter (�1 h) than airgun surveys
(>12 h) and were masked by the airgun sounds at frequen-
cies below 100 Hz. Airgun pulses were observed on the three
deep water site recordings on almost every day recorded.
Much of the seismic activity appeared distant as a constant
band of elevated energy around 10–100 Hz. Moderate
received level pulses �135 dBpp re 1 lPa2 occurred fre-
quently with energy extending up to 200–300 Hz; whereas,
other more intense pulses approached the recording system’s
clip level at 160 dBpp re 1 lPa2 and had elevated sound lev-
els up to 1000 Hz. Airgun arrays source levels are as high as
250 – 260 dBpp re 1 lPa2 at 1 m and are typically fired every
10 to 20 s (Hildebrand, 2009), suggesting that the surveys
with high received levels are within �100 km of the sensor,
assuming approximately spherical spreading transmission
loss {i.e., 20*log10(Range [meters])}. Low to moderate
level surveys are farther away, with the deep sound channel
allowing less transmission loss than spherical spreading
(Urick, 1983), although whether the survey is conducted in
deep water or in shallow water on the continental shelf will
also affect its received level owing to differing interaction
with the sea bottom. When Hurricane Isaac transited through
the GOM in late August, 2012 causing cessation of airgun
operations, low frequency sound pressure levels dropped at
the deep water sites by over 10 to �81 dB re 1 lPa2 at 40 Hz,
below their long-term one percentile level (Figs. 4 and 7). A
similar trend was observed in a separate study in 2001 when
sound pressure spectrum levels �40 Hz decreased during the
passage of tropical storm Barry and rebounded one week
later presumably caused by changes in shipping and seismic
exploration during and after the storm (Newcomb et al.,2002).
Also common at the deep water sites were tones in the
100 – 200 Hz band. The tones varied in intensity, frequency,
and bandwidth over time and were weakest at DT. The
origin of these tones is unknown, but they may be related to
petroleum extraction or exploration in the GOM. The tones
are not likely from ship propulsion because they often last
much longer (�12 h) than transiting ships (�1 h) and the
tones are typically without the blade-rate tonals and spectral-
temporal interference patterns that are usually observed from
nearby ships (Fig. 2).
The shape of the sound pressure spectrum levels for the
two shallow water sites (MP and DC) were much different
than the deep water sites, and they were only similar to each
other below 30 Hz. Above 100 Hz, levels at site MP were up
to 15 dB higher than site DC. MP was the shallowest (90 m)
site and was expected to have slightly higher sound pressure
levels than DC the deeper (260 m) site because of higher
tidal flow noise. However, the primary difference between
these sites was their proximity to local anthropogenic activ-
ity. The area around MP is a region heavily used by the
petroleum and fishery industries with a high level of local
vessel noise and many nearby ports in support of these activ-
ities; whereas, DC is not near the focus of these activities.
FIG. 8. Daily averaged sound pressure levels at 40 Hz by site (designated in
the right-hand upper corner of each panel) over the deployment period. A
and B arrows in the top panel (site GC) indicate periods used in Fig. 9 as
examples of low (86 dB re 1 lPa2) and high (103 dB re 1 lPa2) daily sound
pressure levels of airguns, respectively.
J. Acoust. Soc. Am. 140 (1), July 2016 Wiggins et al. 181
At both the eastern sites, DC and DT, the variability in
sound spectrum levels increased at frequencies above
100 Hz (Fig. 4) and were correlated with varying wind
speeds. Both sites are distant from anthropogenic activity as
found in the north-central Gulf, resulting in lower sound lev-
els at 200–1000 Hz. The shallower site DC had the greatest
variability (>25 dB at 1000 Hz) owing to its proximity to
wind-generated sea surface noise.
Wind speeds from tropical storm and hurricane Isaac
were correlated with sound pressure levels at 900 Hz from
site DT (Fig. 7), suggesting passive acoustic techniques as
another method for studying extreme weather events (e.g.,
Traer et al., 2008). A symmetric peak-trough-peak pattern
was observed with wind speed, but the 900 Hz sound pres-
sure levels were asymmetric with a high narrow peak
followed by a wide trough and moderate peak 5 dB less
than the initial peak. This asymmetry may be a result of the
storm’s wind direction as it passes the hydrophone. As the
counter-clockwise rotating storm approaches site DT, the
winds are blowing east-to-west which constructively built up
breaking sea surface waves in that direction. After the storm
passed the hydrophone, the wind direction was west-to-east
and in opposite direction of the previously built up seas
which reduced the breaking sea surface waves and lowered
sound pressure levels.
V. CONCLUSIONS
Multi-year passive acoustic monitoring in the GOM
showed high average sound pressure spectrum levels
(90–95 dB re 1 lPa2) for deep (�1000 m) water sites below
50 Hz, caused by a high density of seismic exploration and
shipping in the GOM. Two shallow water sites, one on the
shelf and the other on the shelf break, show much different
sound pressure spectrum levels compared to the deep water
sites and compared to each other, primarily a function of
proximity to anthropogenic activity.
Sound pressure levels at 900 Hz were well correlated
with local wind speeds including a hurricane event. The two
eastern Gulf sites showed high sound pressure spectrum
level variability above 200 Hz associated with wind events
in contrast to the three north-central Gulf sites which have
higher local anthropogenic activity.
ACKNOWLEDGMENTS
We thank S. Murawski and S. Gilbert of USF and L.
Garrison, K. Mullin, and M. Soldevilla of the SEFSC for
project assistance. We thank LUMCON and the crew of the
R/V Pelican, as well as I. Kerr and the crew of the R/V
Odyssey for assistance with HARP deployments. We thank
members of the SIO Whale Acoustic Laboratory including:
FIG. 9. (Color online) Airgun pulses in
1-min spectrogram (upper panel) and
time series (lower panel) from site GC
for 40 Hz at (A) low sound pressure
levels on 4 June 2012 and (B) high
sound pressure levels on 23 March
2013 (see Fig. 8, top panel).
Spectrograms are 2000 samples (1 Hz
bins) with 95% overlap and use the
same sound pressure spectrum level
color mapping. Note, time series
amplitudes in (B) are four times
(12 dB) greater than in (A).
182 J. Acoust. Soc. Am. 140 (1), July 2016 Wiggins et al.

T. Christianson, C. Garsha, B. Hurley, J. Hurwitz, J. Jones,
E. O’Neill, and E. Roth for assistance with HARP operations
and data processing, as well as M. McDonald of Whale
Acoustics LLC. Funding for HARP data collection and
analysis was provided by the Natural Resource Damage
Assessment partners (20105138), the U.S. Marine Mammal
Commission (20104755/E4061753), the Southeast Fisheries
Science Center under the Cooperative Institute for Marine
Ecosystems and Climate (NA10OAR4320156) with support
through Interagency Agreement #M11PG00041 between the
Bureau of Ocean Energy Management, Environmental
Studies Program and the National Marine Fisheries
Service, Southeast Fisheries Science Center, and the
CIMAGE Consortium of the BP/Gulf of Mexico Research
Initiative (SA 12-10/GoMRI-007). The analyses and opinions
expressed are those of the authors and not necessarily
those of the funding entities. The data used for this study
are archived at https://data.gulfresearchinitiative.org/data/
R4.x267.180:0009 maintained by the Gulf of Mexico
Research Initiative.
Andrew, R. K., Howe, B. M., Mercer, J. A., and Dzieciuch, M. A. (2002).
“Ocean ambient sound: Comparing the 1960s with the 1990s for a receiver
off the California coast,” Acoust. Res. Lett. Online 3, 65–70.
Chapman, N. R., and Price, A. (2011). “Low frequency deep ocean ambient
noise trend in the Northeast Pacific Ocean,” J. Acoust. Soc. Am. 129,
EL161–EL165.
Dahl, P. H., Miller, J. H., Cato, D. H., and Andrew, R. K. (2007).
“Underwater ambient noise,” Acoust. Today 3, 23–33.
Hildebrand, J. A. (2009). “Anthropogenic and natural sources of ambient
noise in the ocean,” Mar. Ecol. Prog. Ser. 395, 5–20.
Knapp, K. R., Kruk, M. C., Levinson, D. H., Diamond, H. J., and Neumann,
C. J. (2010). “The international best track archive for climate stewardship
(IBTrACS),” Bull. Am. Meteorol. Soc. 91, 363–376.
Knudsen, V. O., Alford, R. S., and Emling, J. W. (1948). “Underwater ambi-
ent noise,” J. Mar. Res. 7, 410–429.
McDonald, M. A., Hildebrand, J. A., and Wiggins, S. M. (2006). “Increases
in deep ocean ambient noise in the Northeast Pacific west of San Nicolas
Island, California,” J. Acoust. Soc. Am. 120, 711–718.
McDonald, M. A., Hildebrand, J. A., Wiggins, S. M., and Ross, D. (2008).
“A 50 year comparison of ambient ocean noise near San Clemente Island:
A bathymetrically complex coastal region off Southern California,”
J. Acoust. Soc. Am. 124, 1985–1992.
McKenna, M. F., Ross, D., Wiggins, S. M., and Hildebrand, J. A. (2012).
“Underwater radiated noise from modern commercial ships,” J. Acoust.
Soc. Am. 131, 92–103.
Newcomb, J., Fisher, R., Field, R., Rayborn, G., Kuczaj, S., Ioup, G., Ioup,
J., and Turgut, A. (2002). “Measurements of ambient noise and sperm
whale vocalizations in the northern Gulf of Mexico using near bottom
hydrophones,” in OCEANS’02 MTS/IEEE, Vol. 1363, pp. 1365–1371.
Nieukirk, S. L., Stafford, K. M., Mellinger, D. K., Dziak, R. P., and Fox, C.
G. (2004). “Low-frequency whale and seismic airgun sounds recorded in
the mid-Atlantic Ocean,” J. Acoust. Soc. Am. 115, 1832–1843.
Ross, D. (1976). Mechanics of Underwater Noise (Pergamon, New York), p.
375.
Roth, E. H., Hildebrand, J. A., Wiggins, S. M., and Ross, D. (2012).
“Underwater ambient noise on the Chukchi Sea continental slope from
2006–2009,” J. Acoust. Soc. Am. 131, 104–110.
Snyder, M. A. (2007). “Long-term ambient noise statistics in the Gulf of
Mexico,” Theses and Dissertations, University of New Orleans, p. 151.
Strocko, E., Sprung, M., Nguyen, L., Rick, C., and Sedor, J. (2014). “Freight
facts and figures 2013” (U.S. Department of Transportation, Federal
Highway Administration, Office of Freight Management and Operations),
p. 92.
Traer, J., Gerstoft, P., Bromirski, P. D., Hodgkiss, W. S., and Brooks, L. A.
(2008). “Shallow-water seismoacoustic noise generated by tropical storms
Ernesto and Florence,” J. Acoust. Soc. Am. 124, EL170–EL176.
Urick, R. J. (1983). Principles of Underwater Sound (McGraw-Hill, New
York), p. 423.
Welch, P. D. (1967). “The use of fast Fourier transform for the estimation of
power spectra: A method based on time averaging over short, modified
periodograms,” IEEE Trans. Audio Electroacoust. 15, 70–73.
Wenz, G. M. (1962). “Acoustic ambient noise in the ocean: Spectra and
sources,” J. Acoust. Soc. Am. 34, 1936–1956.
Wiggins, S. M., and Hildebrand, J. A. (2007). “High-frequency acoustic re-
cording package (HARP) for broad-band, long-term marine mammal mon-
itoring,” in International Symposium on Underwater Technology 2007 andInternational Workshop on Scientific Use of Submarine Cables & RelatedTechnologies 2007 (IEEE, Tokyo, Japan), pp. 551–557.
J. Acoust. Soc. Am. 140 (1), July 2016 Wiggins et al. 183