Embed Size (px)
Citation preview
GBD-MAPS - Emissions and Air Pollution Modeling in India
Dr. Sarath GuttikundaUrbanEmissions.Info
Dr. Chandra Venkatramanand Team
@ Center for Climate StudiesIIT, Mumbai, India
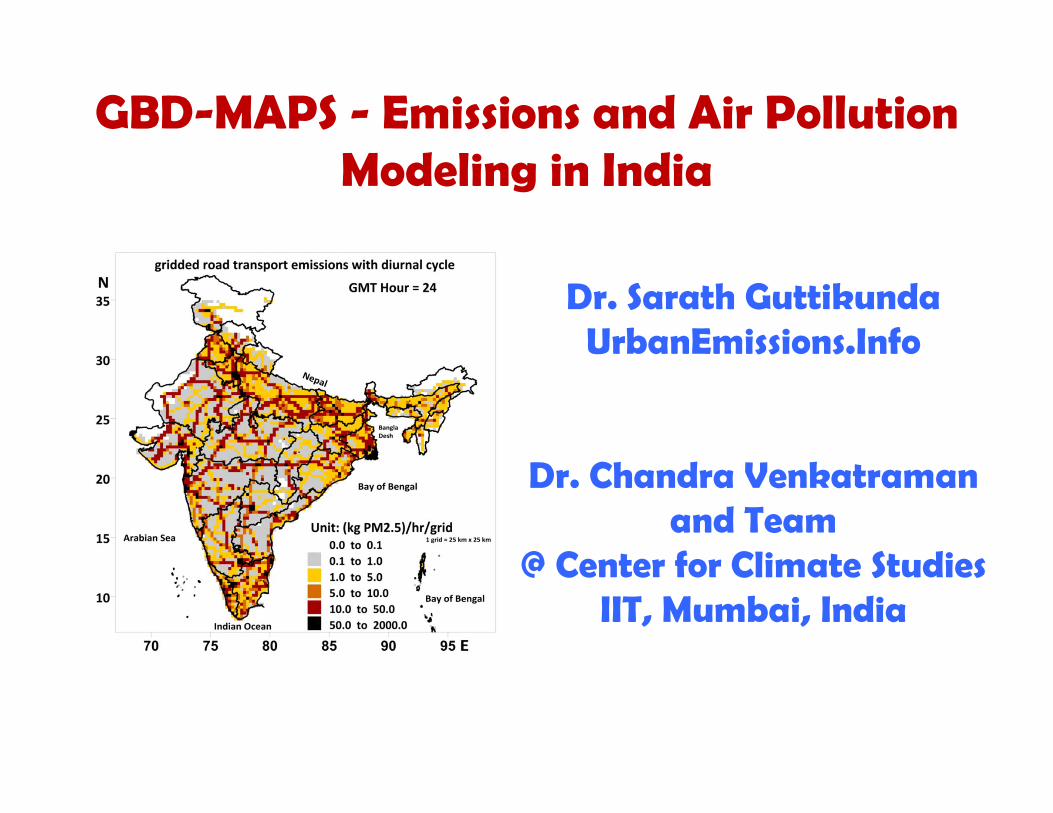
550
All manual stations
30‐40% collection
Limited CAMS
Limited PM2.5
Limited access
Manual Stations under the national ambient monitoring program (NAMP)
On‐Ground Monitoring
60 Continuous monitoring stations
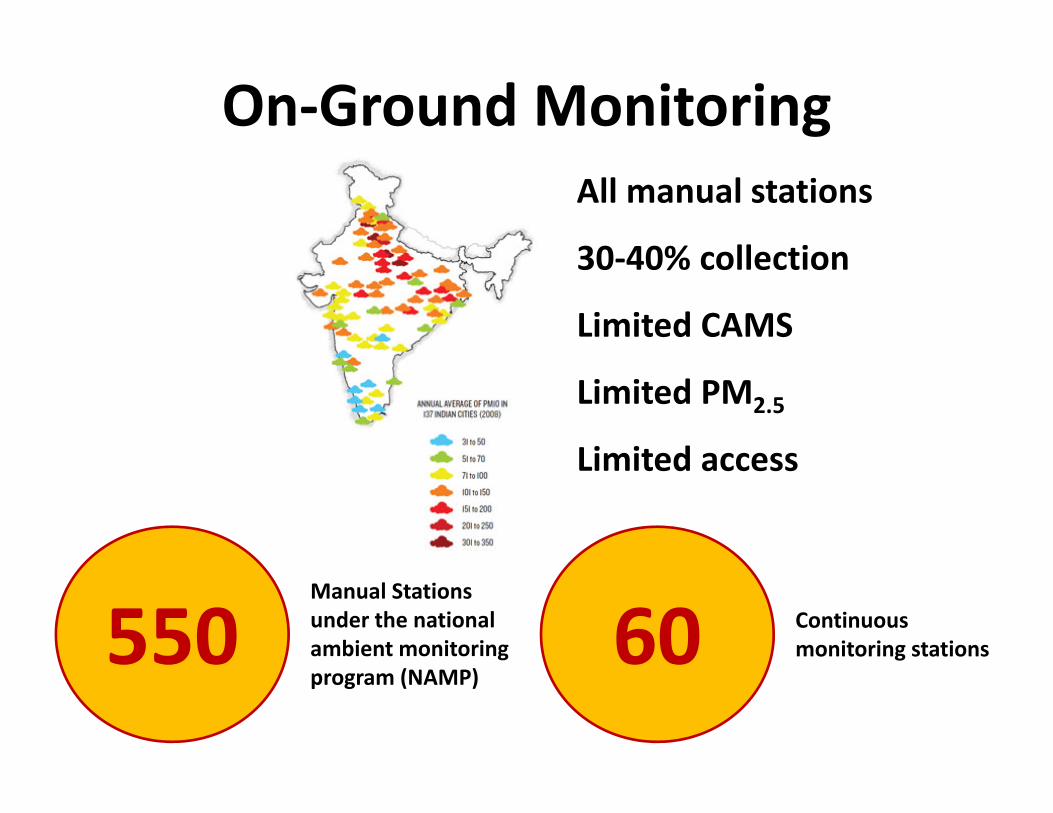
Modeling Emissions and Pollution is a Must
New open data fields are helping us do this better and faster
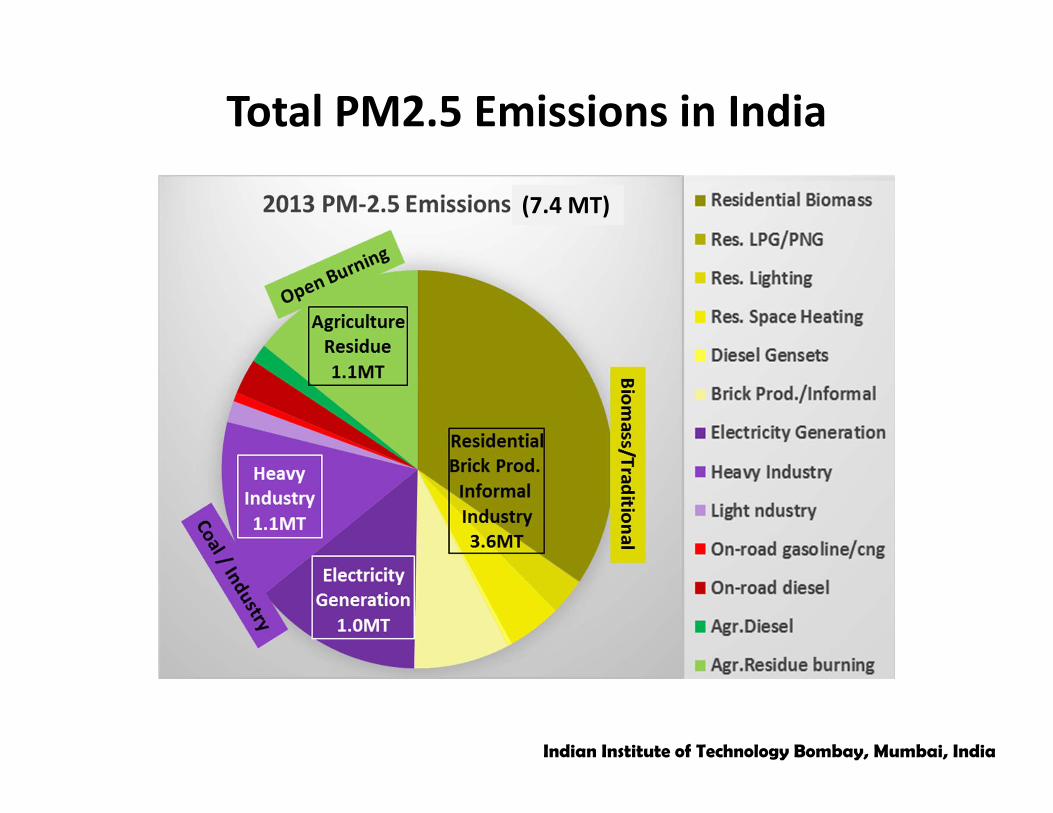
(7.4 MT)
Total PM2.5 Emissions in India
Indian Institute of Technology Bombay, Mumbai, India
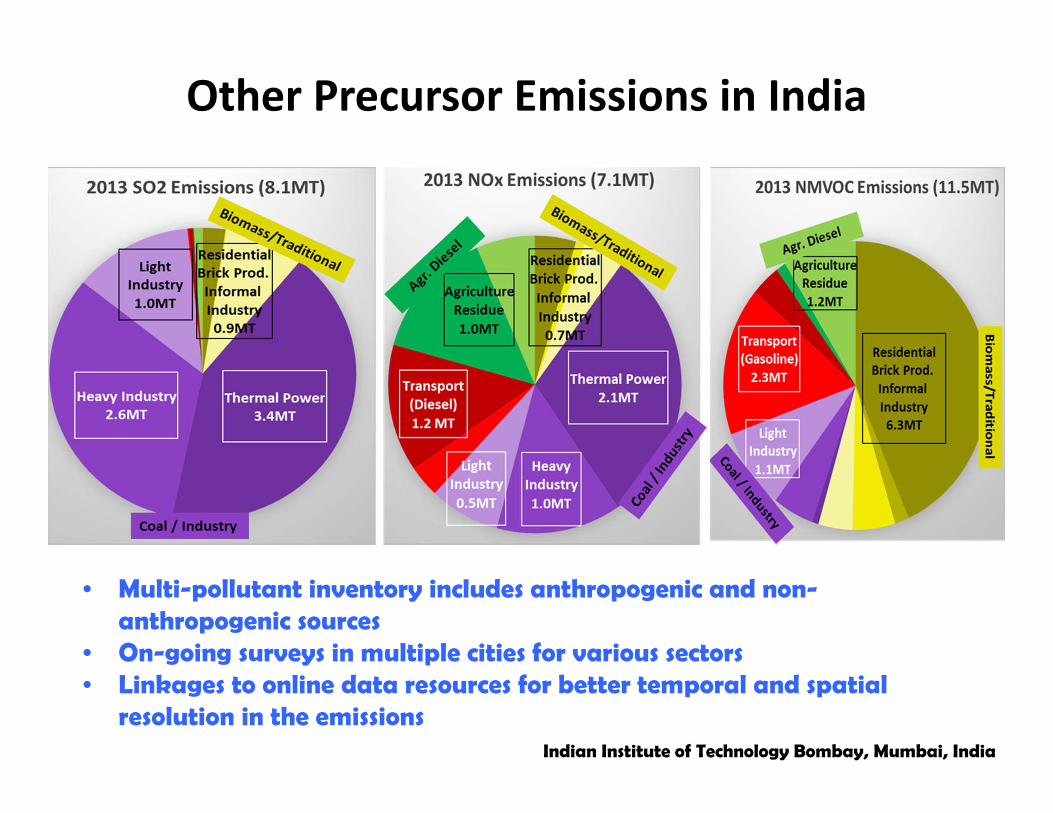
Other Precursor Emissions in India
Indian Institute of Technology Bombay, Mumbai, India
• Multi-pollutant inventory includes anthropogenic and non-anthropogenic sources
• On-going surveys in multiple cities for various sectors• Linkages to online data resources for better temporal and spatial
resolution in the emissions
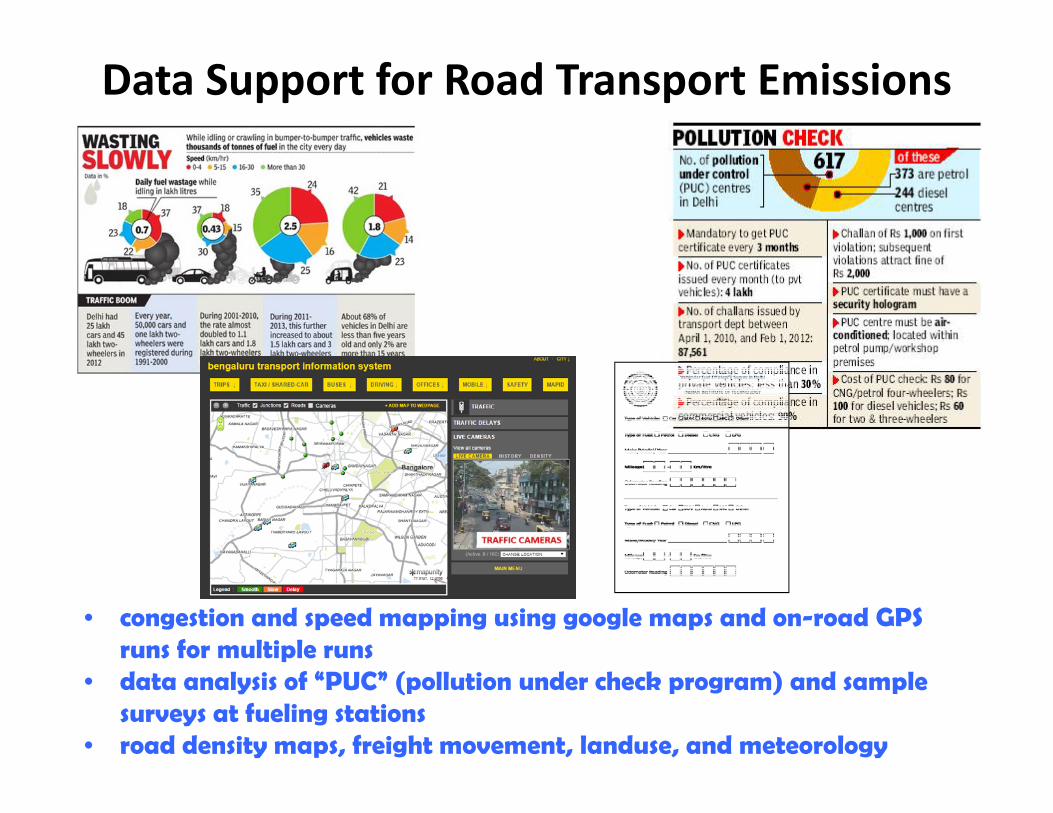
Data Support for Road Transport Emissions
• congestion and speed mapping using google maps and on-road GPS runs for multiple runs
• data analysis of “PUC” (pollution under check program) and sample surveys at fueling stations
• road density maps, freight movement, landuse, and meteorology
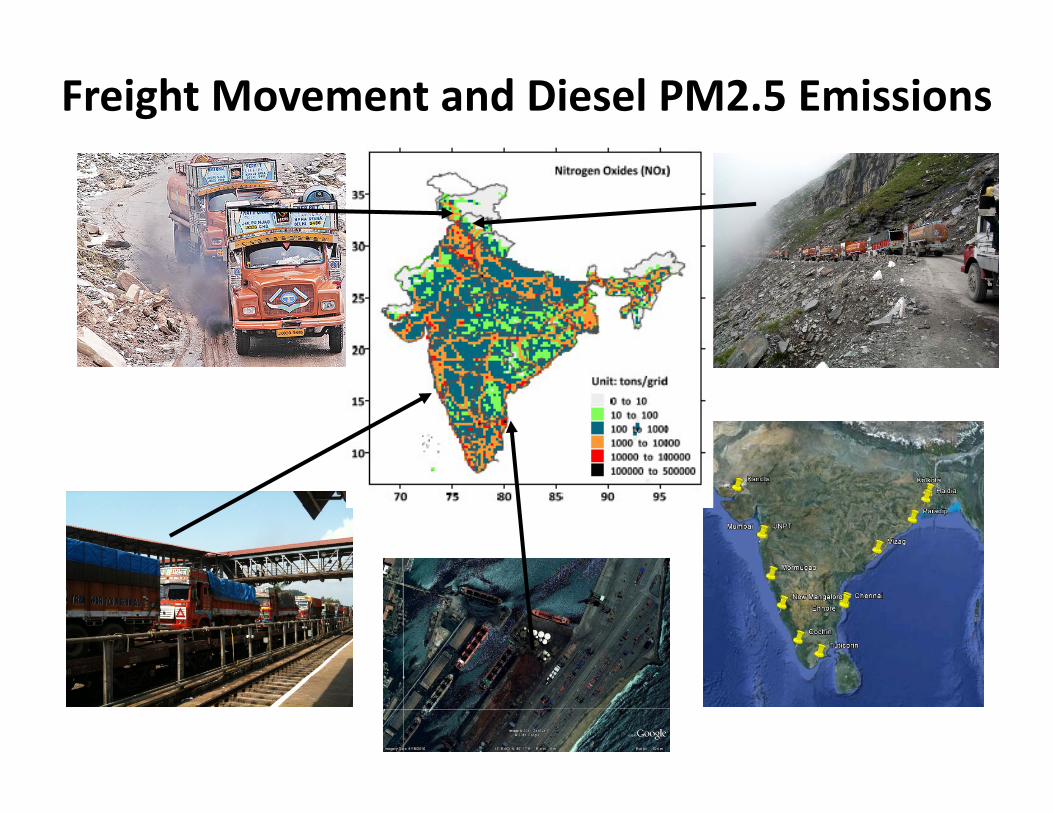
Freight Movement and Diesel PM2.5 Emissions
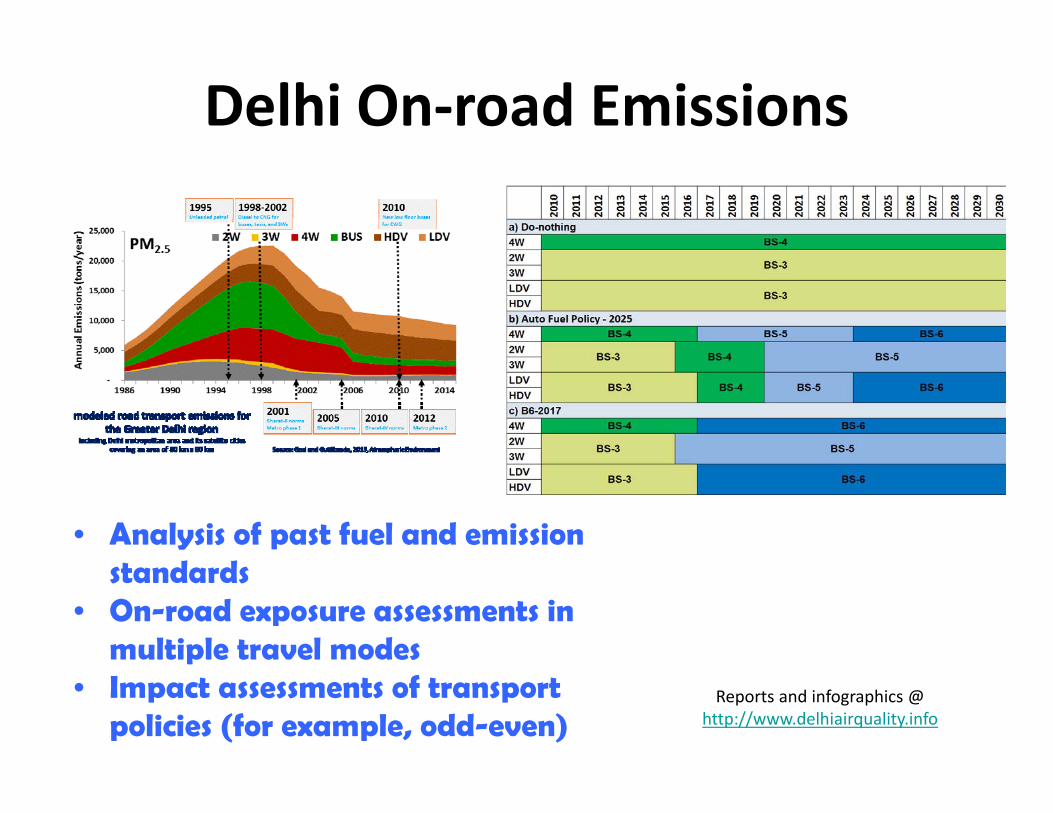
Delhi On‐road Emissions
Reports and infographics @ http://www.delhiairquality.info
• Analysis of past fuel and emission standards
• On-road exposure assessments in multiple travel modes
• Impact assessments of transport policies (for example, odd-even)
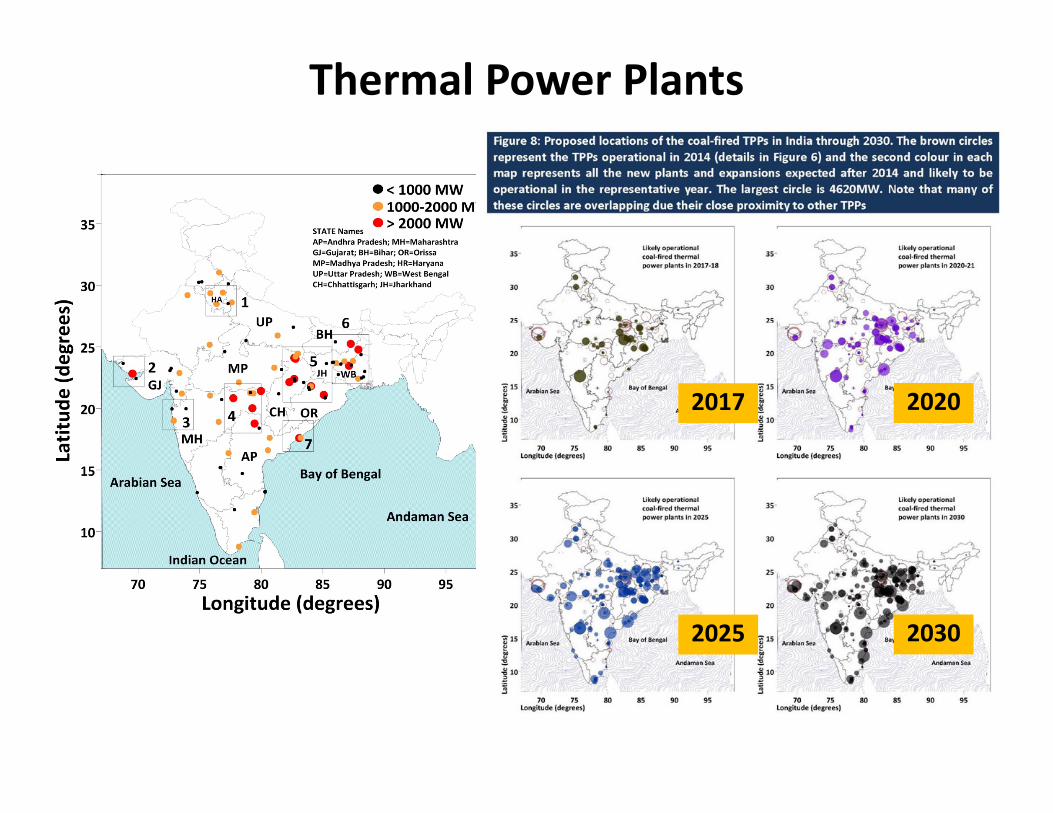
2017 2020
2025 2030
Thermal Power Plants
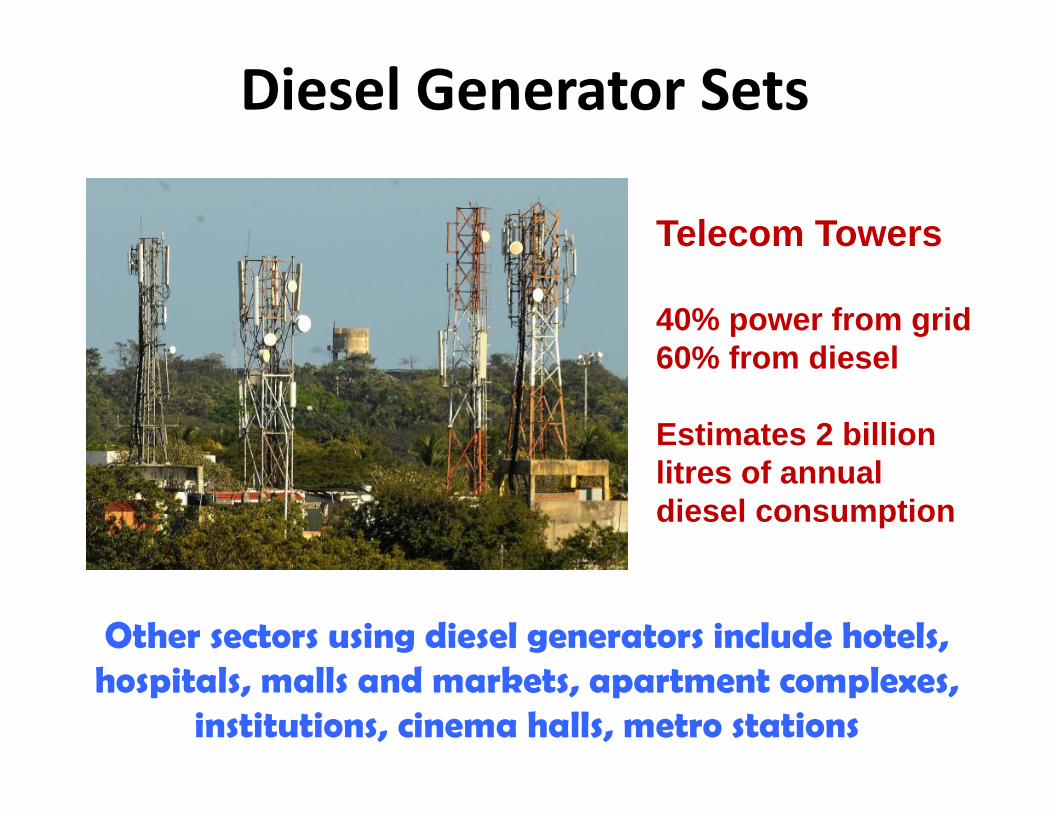
Diesel Generator Sets
Telecom Towers
40% power from grid60% from diesel
Estimates 2 billion litres of annual diesel consumption
Other sectors using diesel generators include hotels, hospitals, malls and markets, apartment complexes,
institutions, cinema halls, metro stations
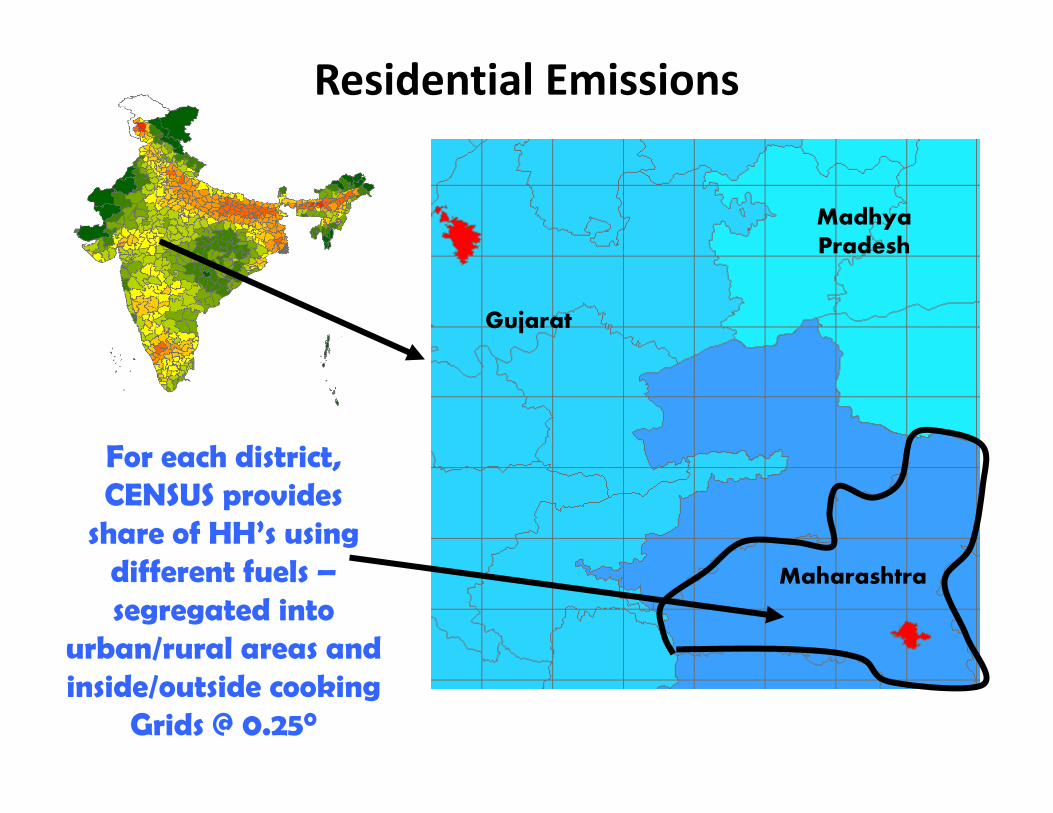
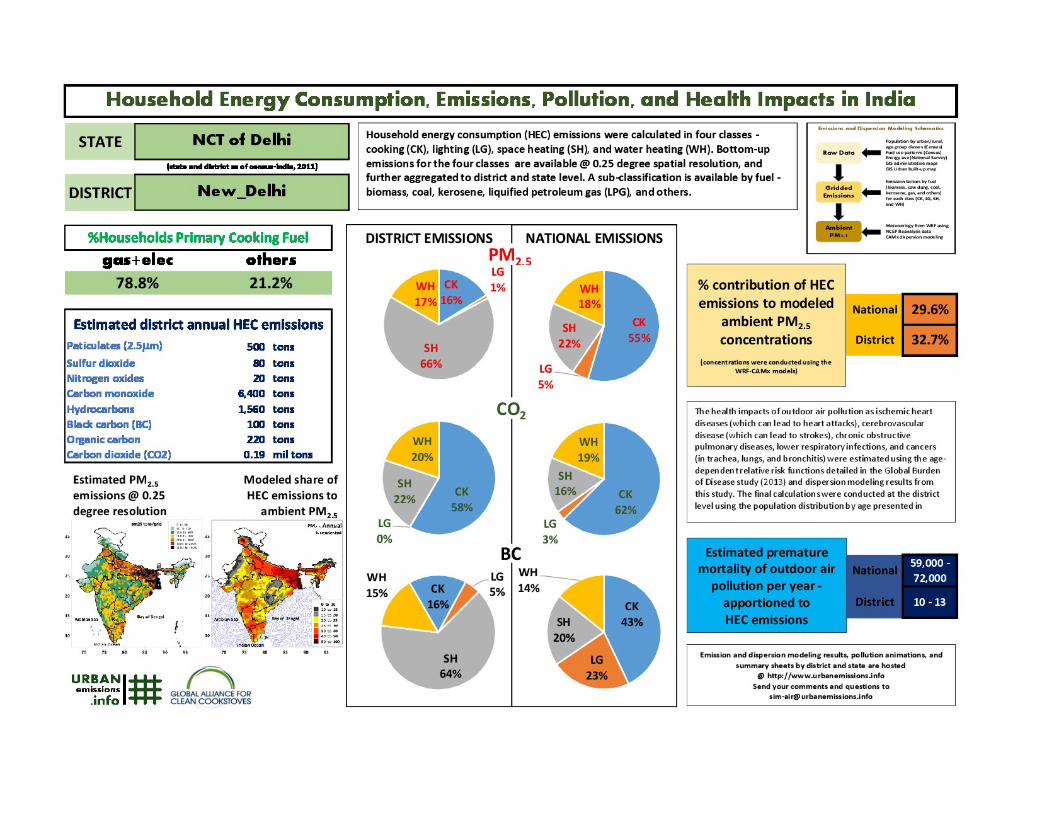
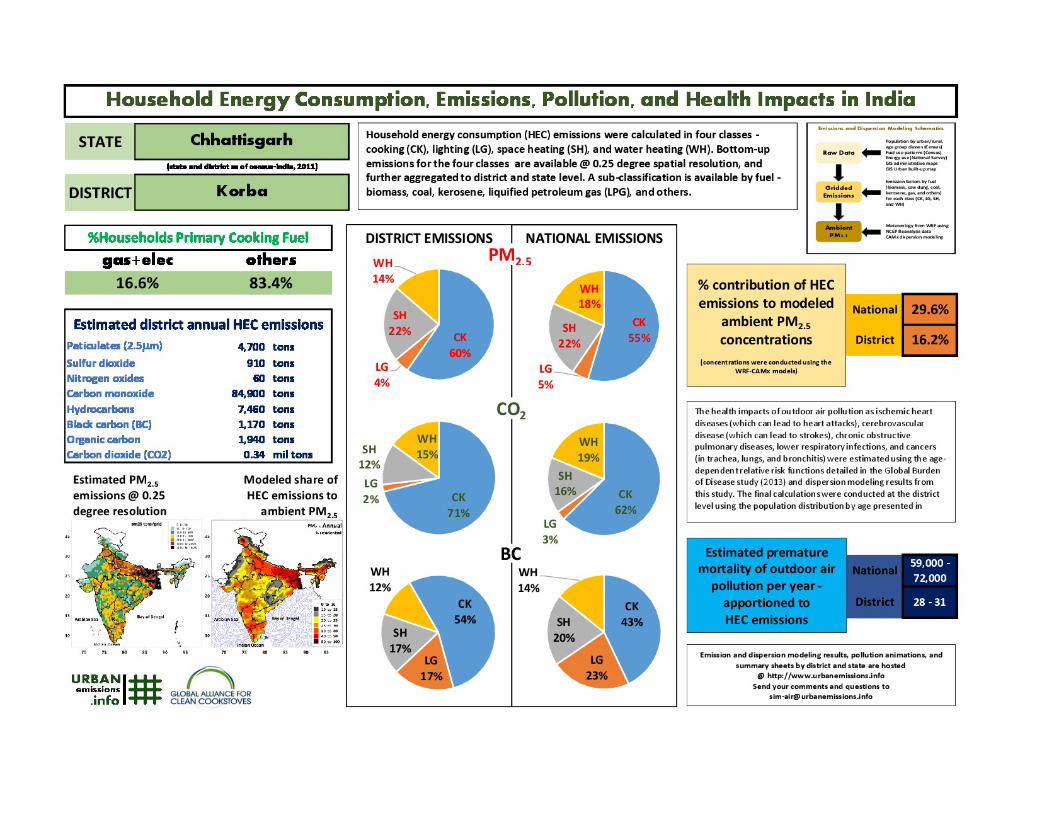
For each district, CENSUS provides
share of HH’s using different fuels –segregated into
urban/rural areas and inside/outside cooking
Grids @ 0.250
Gujarat
Madhya Pradesh
Maharashtra
Residential Emissions
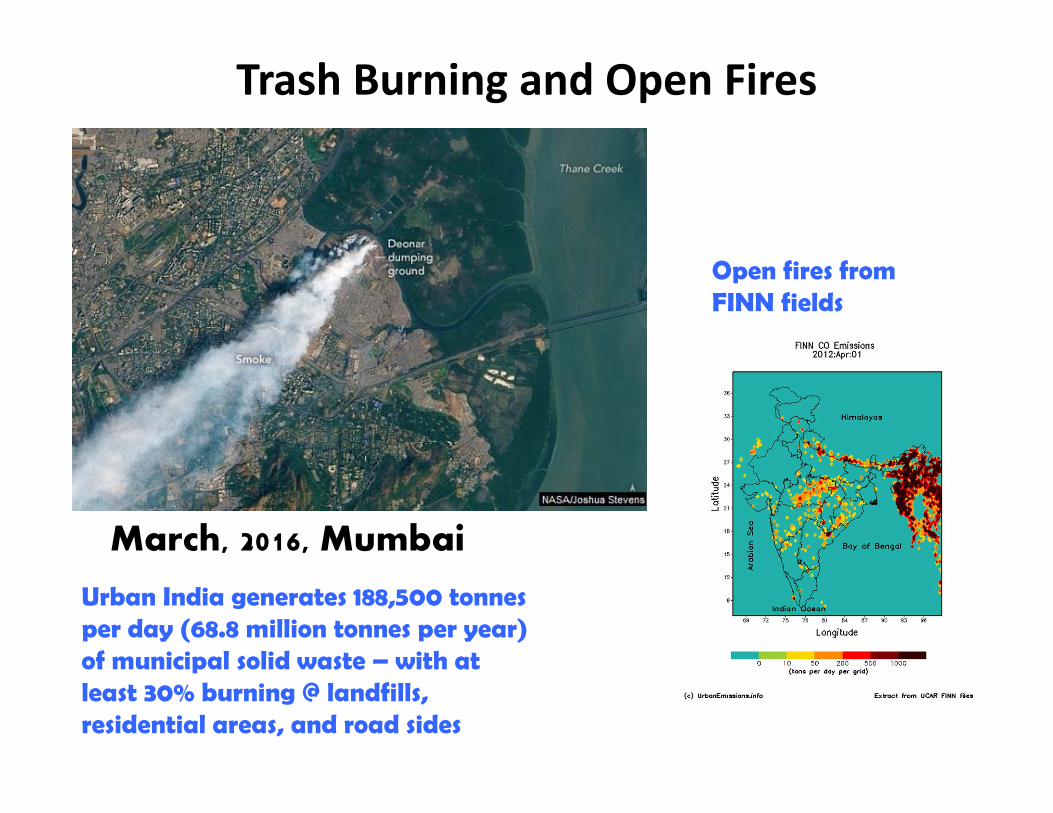
Trash Burning and Open Fires
March, 2016, Mumbai
Urban India generates 188,500 tonnes per day (68.8 million tonnes per year) of municipal solid waste – with at least 30% burning @ landfills, residential areas, and road sides
Open fires from FINN fields
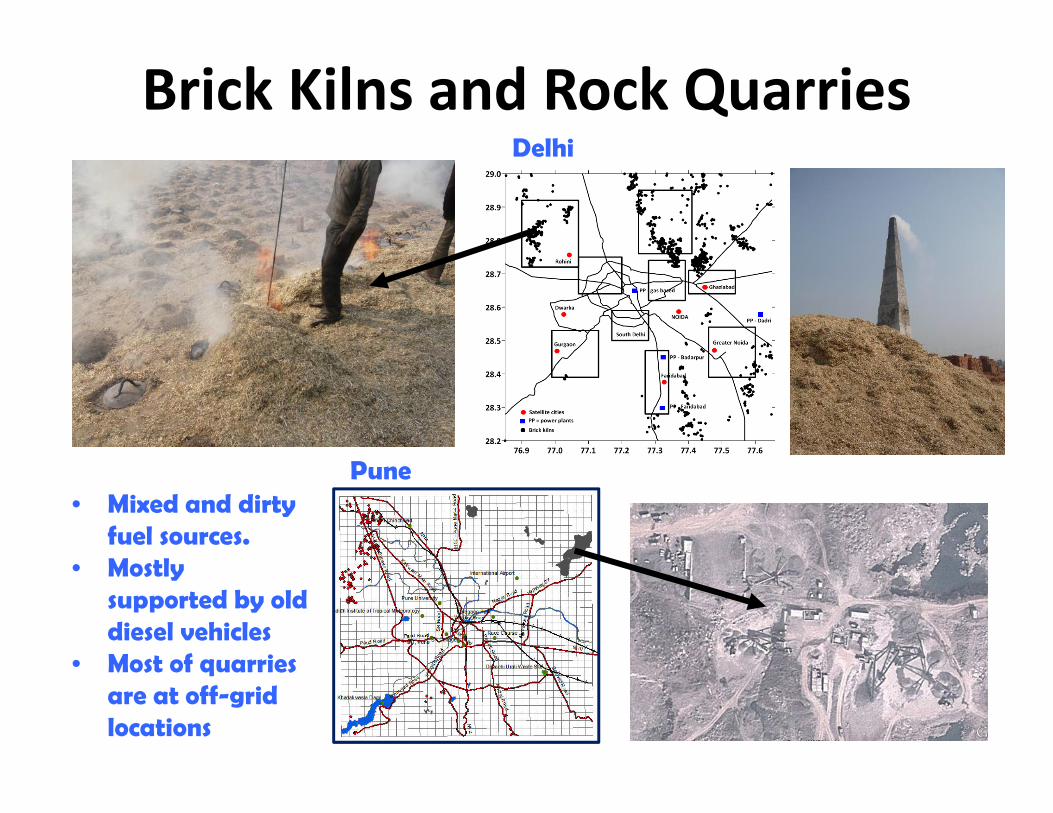
Brick Kilns and Rock QuarriesDelhi
Pune• Mixed and dirty
fuel sources.• Mostly
supported by old diesel vehicles
• Most of quarries are at off-grid locations
1
7.4
16.9
9.9
7.4
1.3
7.4
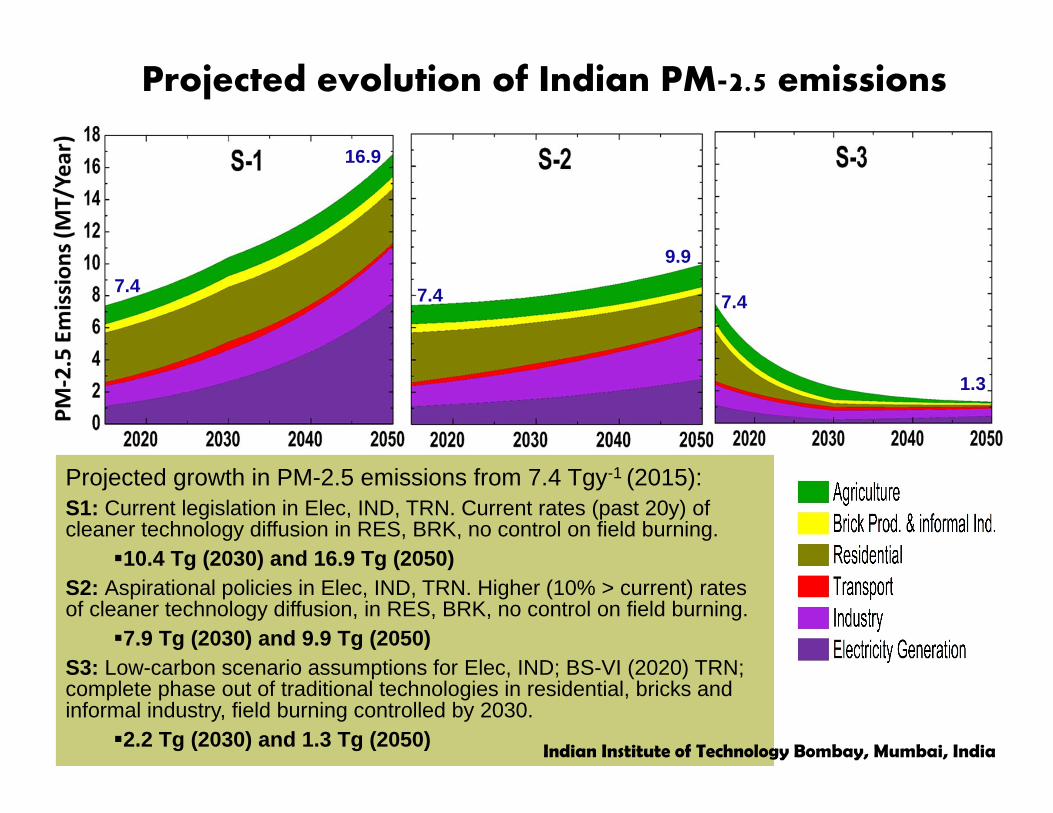
Projected growth in PM-2.5 emissions from 7.4 Tgy-1 (2015):S1: Current legislation in Elec, IND, TRN. Current rates (past 20y) of cleaner technology diffusion in RES, BRK, no control on field burning.
10.4 Tg (2030) and 16.9 Tg (2050)S2: Aspirational policies in Elec, IND, TRN. Higher (10% > current) rates of cleaner technology diffusion, in RES, BRK, no control on field burning.
7.9 Tg (2030) and 9.9 Tg (2050)S3: Low-carbon scenario assumptions for Elec, IND; BS-VI (2020) TRN; complete phase out of traditional technologies in residential, bricks and informal industry, field burning controlled by 2030.
2.2 Tg (2030) and 1.3 Tg (2050)
Projected evolution of Indian PM-2.5 emissions
Indian Institute of Technology Bombay, Mumbai, India
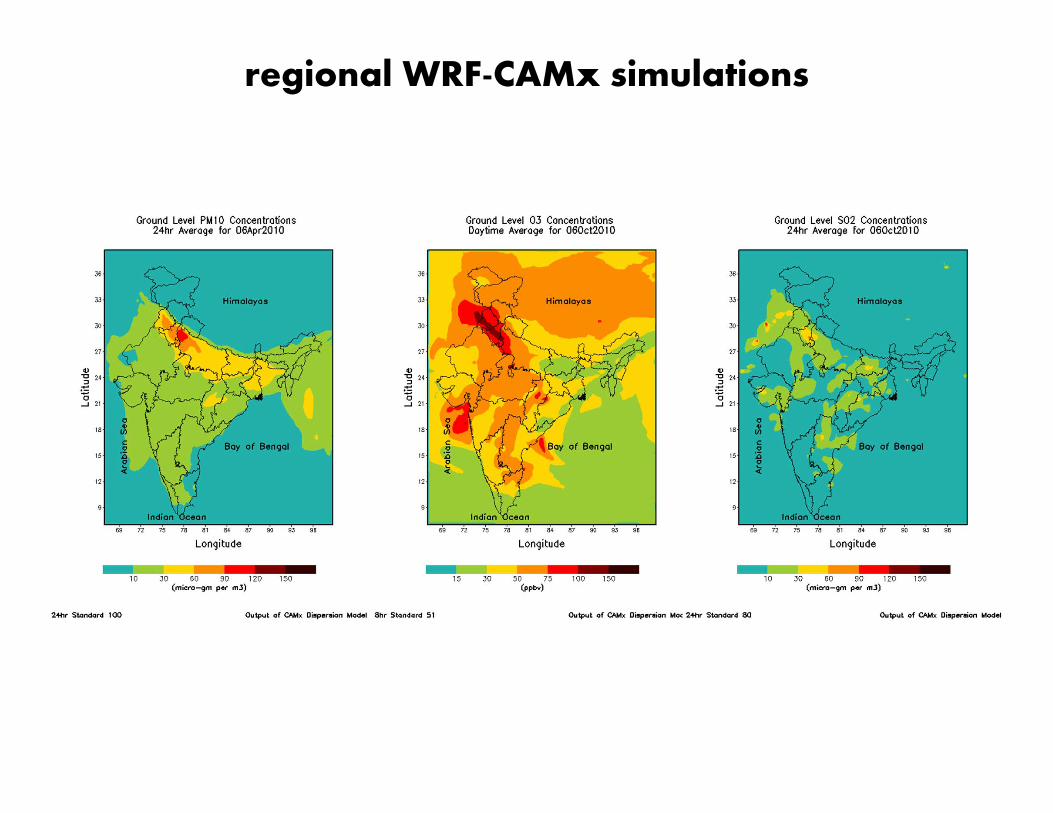
regional WRF-CAMx simulations
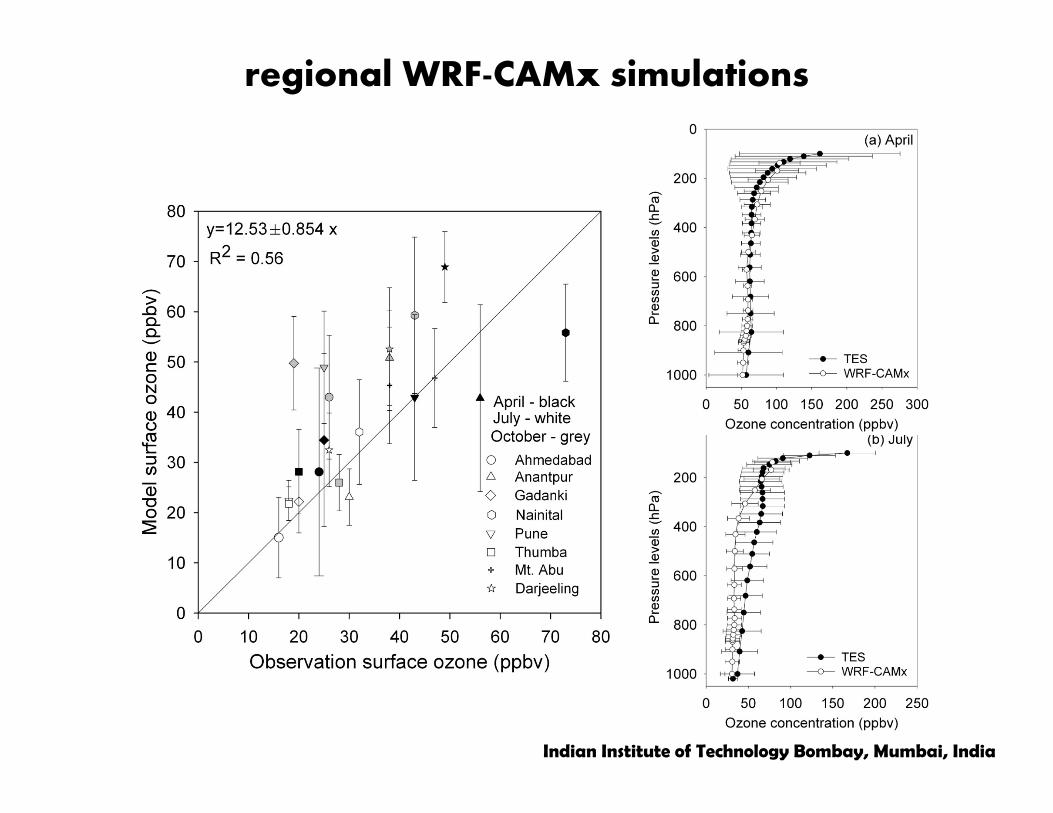
regional WRF-CAMx simulations
Indian Institute of Technology Bombay, Mumbai, India
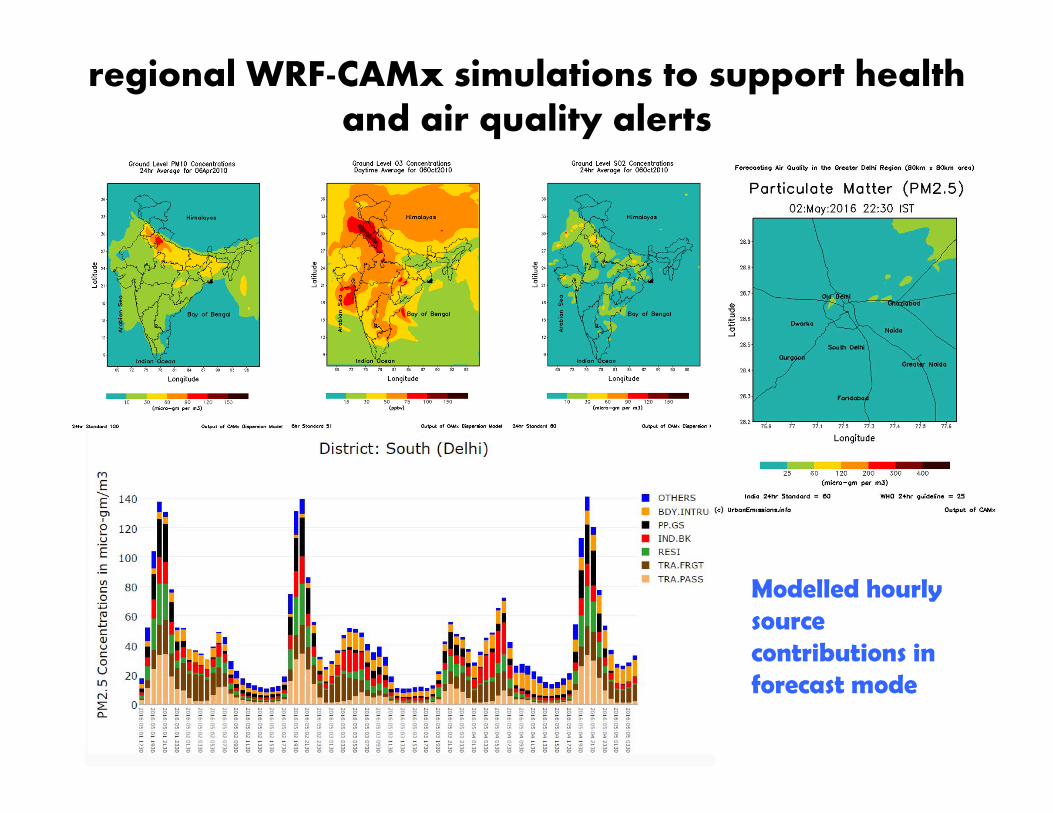
regional WRF-CAMx simulations to support health and air quality alerts
Modelled hourly source contributions in forecast mode
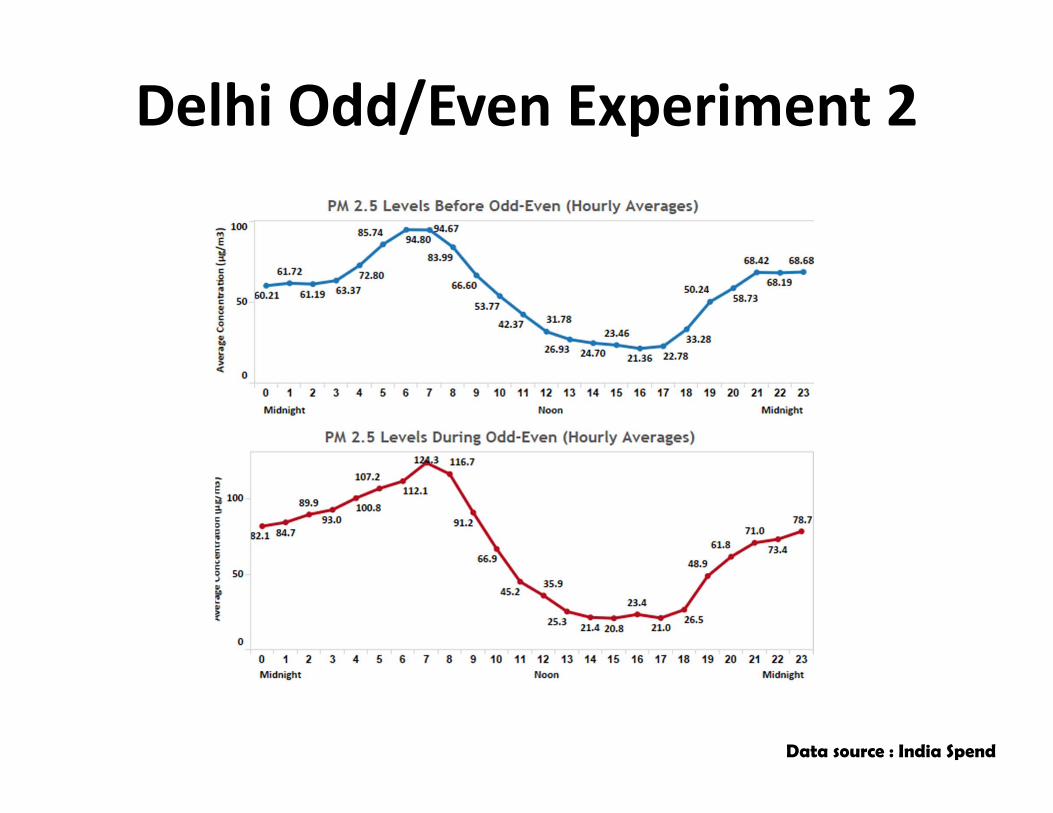
Delhi Odd/Even Experiment 2
Data source : India Spend
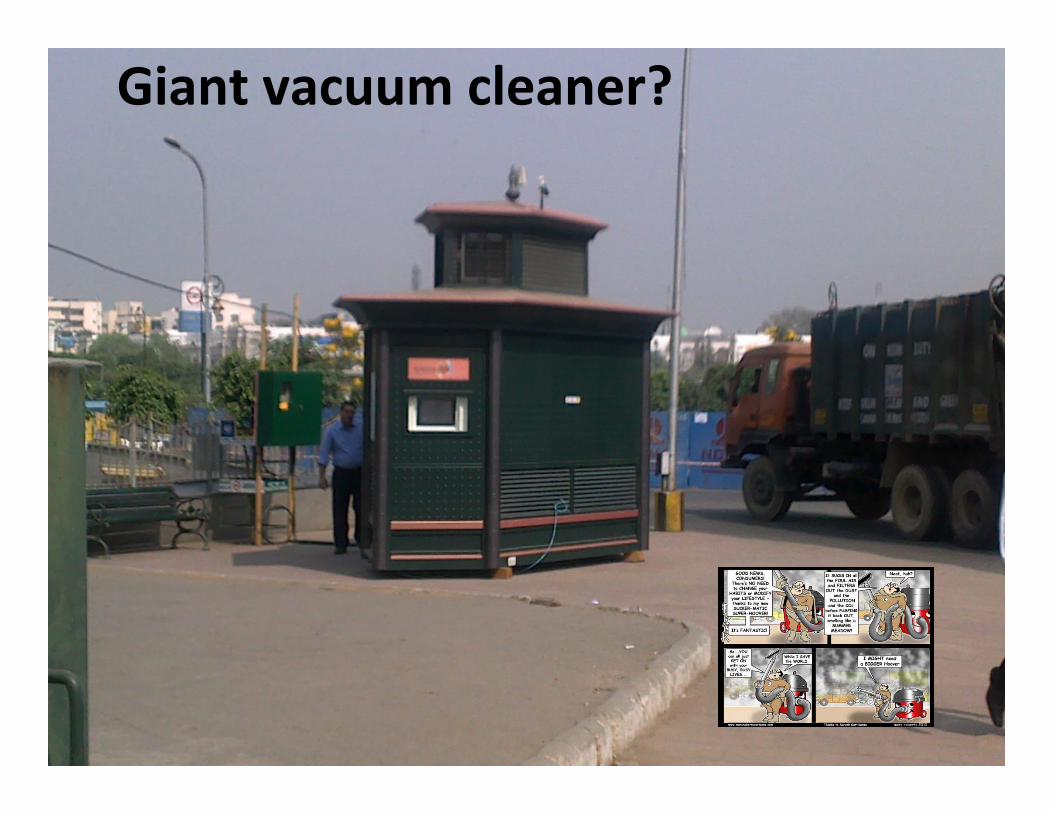
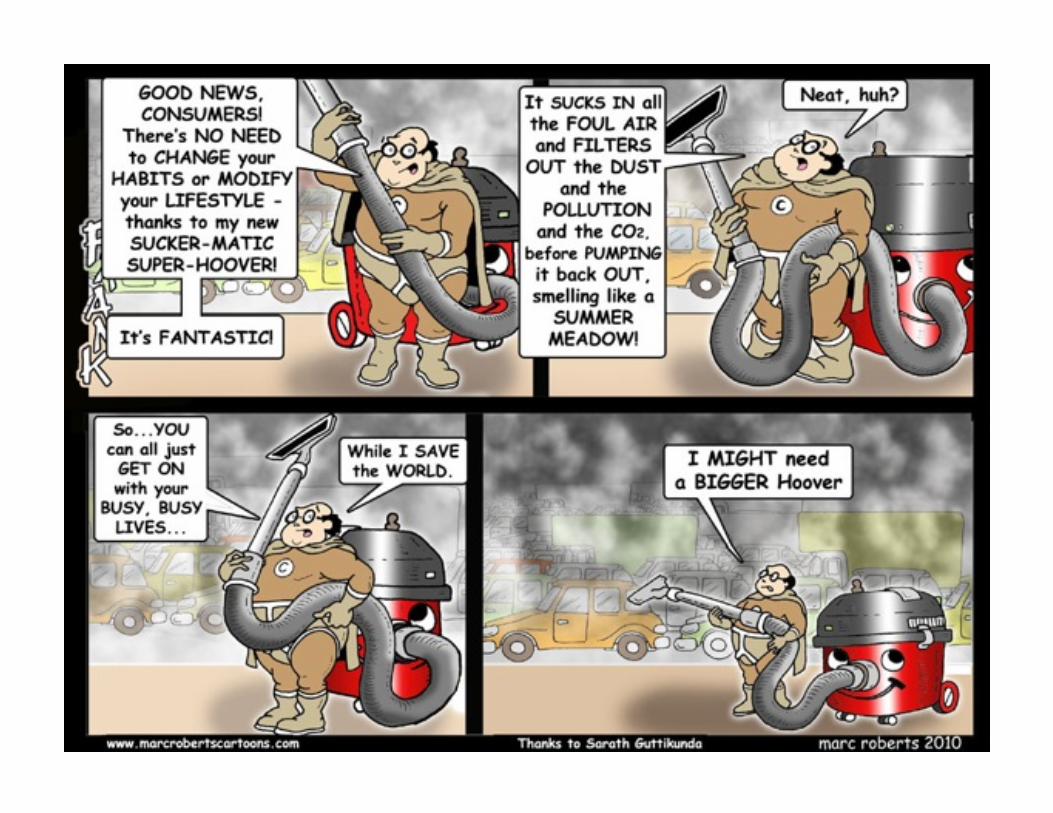
Giant vacuum cleaner?
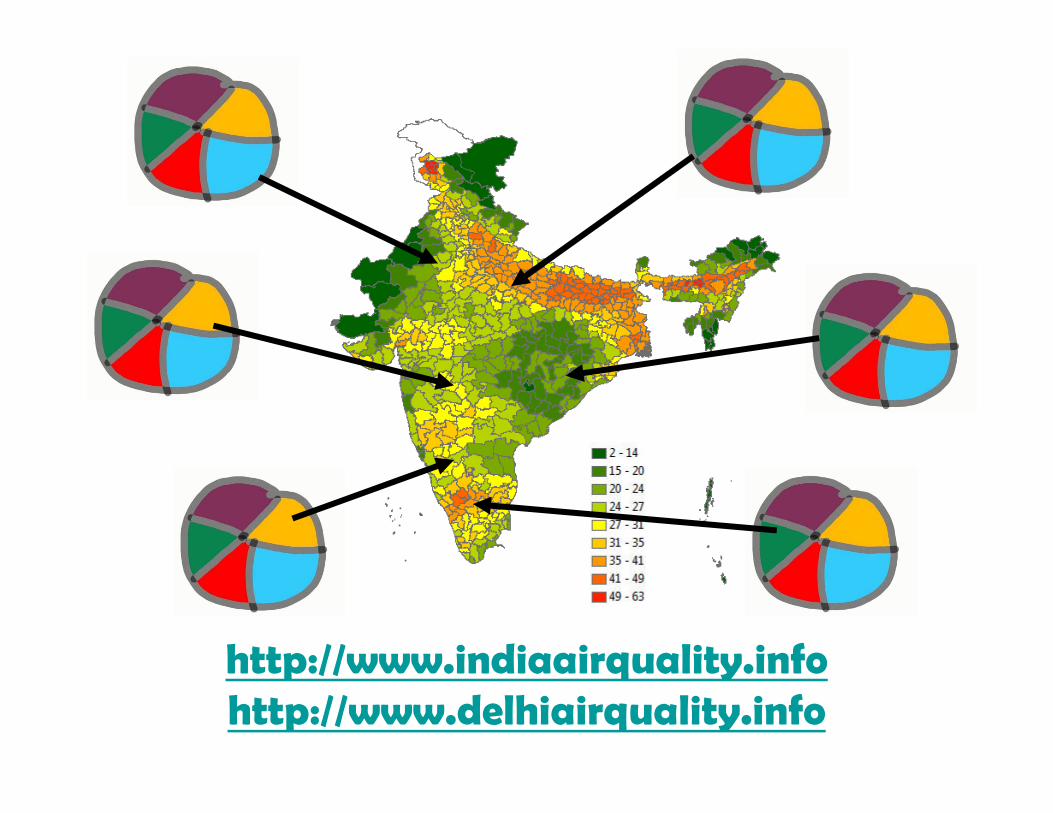
http://www.indiaairquality.infohttp://www.delhiairquality.info