Embed Size (px)
Citation preview

GxE 2020 Field Experiment SOP v.3.1 Released June, 2020
Visit the www.genomes2fields.org for the latest SOP and information updates.
Contact Alejandro Castro, 608-218-0903, [email protected], with any questions.
1
GxE Field Experiment 2020 SOP v.3.1 Visit the GxE website for the latest SOP and information updates:
www.genomes2fields.org
About this document:
1. Some changes to the weather station information have been made.
Our goal is to collect the most “raw” and meaningful data possible, to be collated in a centralized
database and shared with the public. Raw data will give us the most power to analyze and
leverage insights from the data. It is a difficult and time-consuming task to assimilate all this
information into one place in a consistent format. Therefore, we ask that you pay close attention to
the form of data types collected in terms of units, formatting, etc.
Please note that Alejandro Castro Aviles, [email protected], is serving as the new G2F
Coordinator. Any questions or concerns that you previously contacted Naser AlKhalifah about
should now be directed to him.
Lastly, we would like to thank you, our cooperators, for your monumental efforts and
unprecedented collaborative spirit. Without you, the Genomes to Fields GxE Project would not
be possible.
Thank you!
GxE 2020 Field Experiment SOP v.3.1 Released June, 2020
Visit the www.genomes2fields.org for the latest SOP and information updates.
Contact Alejandro Castro, 608-218-0903, [email protected], with any questions.
2
Document Contents I. GxE Field Experiment 2020 Checklist 3 II. Field Layout for 2020 Season 4
III. WatchDog 2700 Weather Station Configuration 6 IV. Seed Information 6 V. Field Metadata Collection 6 VI. Phenotype and Performance Data Collection 7
VII. Uploading Data to CyVerse 8 Appendix A: Phenotyping Handbook 9 Appendix B: Soil Sampling Handbook 15 Appendix C: Additional Weather Station Resources 16
GxE 2020 Field Experiment SOP v.3.1 Released June, 2020
Visit the www.genomes2fields.org for the latest SOP and information updates.
Contact Alejandro Castro, 608-218-0903, [email protected], with any questions.
3
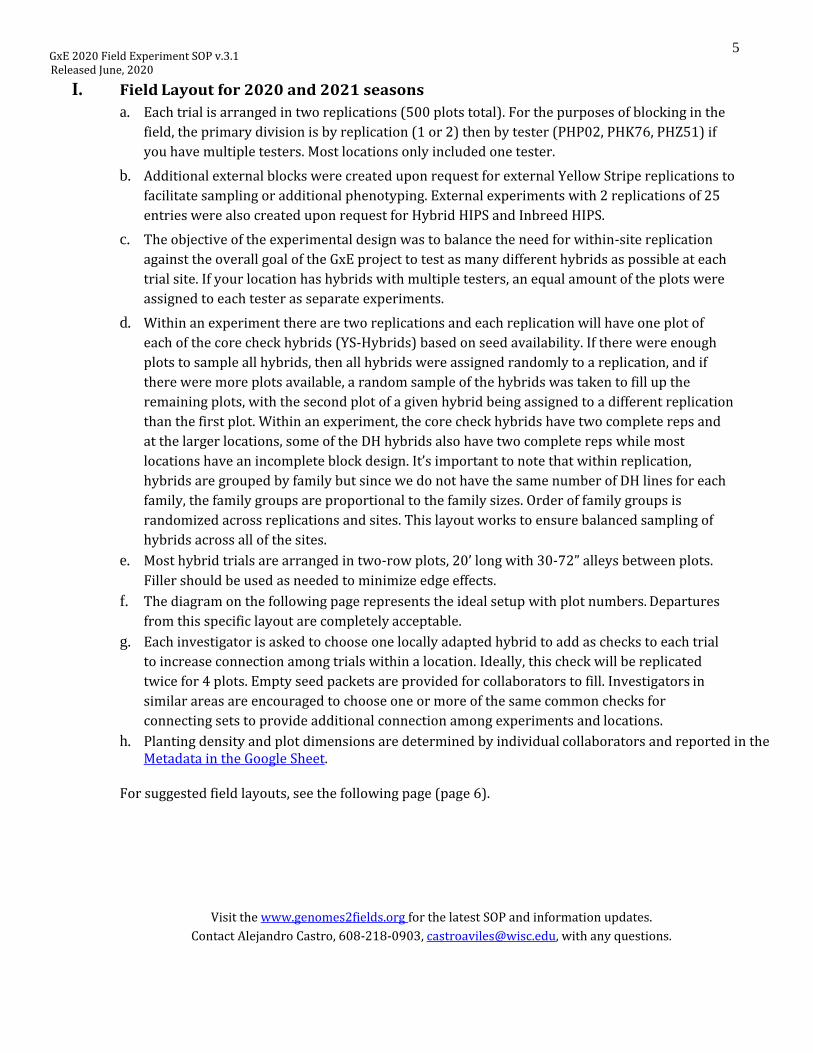
GxE Field Experiment 2020 Checklist Preseason:
For new cooperators only: Email Alejandro Castro at [email protected] to get started
For all cooperators (including new): Order weather station components with assistance of Iowa Corn Promotion Board (David Ertl at [email protected]) Communicate seed packaging and shipping requirements with Alejandro Castro at [email protected] Perform annual maintenance on weather station and clear existing data Begin work on Google Sheets location folder through your personalized link
At Planting: ___ Install weather station in field (ideally one day before planting, if possible) Ensure external instruments are in correct port:
(soil moisture - port A, soil temperature - port B, solar radiation - port C) Collect and record the GPS coordinates of weather station Collect weather station serial number [m2700s0XXXX] on card inside weather station Perform weather station setup tasks and activate weather station recording
Collect soil sample and send to Ward Laboratories in Kearney, NE (Appendix B) Record planting date in fieldbook provided through your personalized link Update Google Sheets metadata with:
Weather station serial number and GPS coordinates Date weather station was placed in the field GPS coordinates of field corners, starting at corner of plot 1
In-Season:
Create and upload field map to Google folder. Notify Alejandro, of any field/planting issues or adjustments to original field map
Perform weather station in-season checks at each field visit. Download data monthly, if possible Record the following phenotypic data in the fieldbook:
Flowering dates Plant height Ear height If damaging winds occur, cooperators may choose to record green snap and date of event Stand count
Record the following field information in the Google Sheets agronomic information: Pesticides and herbicides: type and amount applied Fertilizer: date, type, and amount applied Irrigation schedule: date and amount applied (if applicable) Fertigation schedule: date and amount applied (if applicable) Notes on field anomalies, phenotyping errors and any other issues
At Harvest: Record the following performance data in the fieldbook:
Root lodging Stalk lodging Plot weight Plot moisture Test weight

GxE 2020 Field Experiment SOP v.3.1 Released June, 2020
Visit the www.genomes2fields.org for the latest SOP and information updates.
Contact Alejandro Castro, 608-218-0903, [email protected], with any questions.
4
Post-Season:
Verify information in Google Sheets metadata Upload final field information, phenotype and performance data to Google Sheet Download weather station data and upload unedited SWD files to Google folder
GxE 2020 Field Experiment SOP v.3.1 Released June, 2020
Visit the www.genomes2fields.org for the latest SOP and information updates.
Contact Alejandro Castro, 608-218-0903, [email protected], with any questions.
5
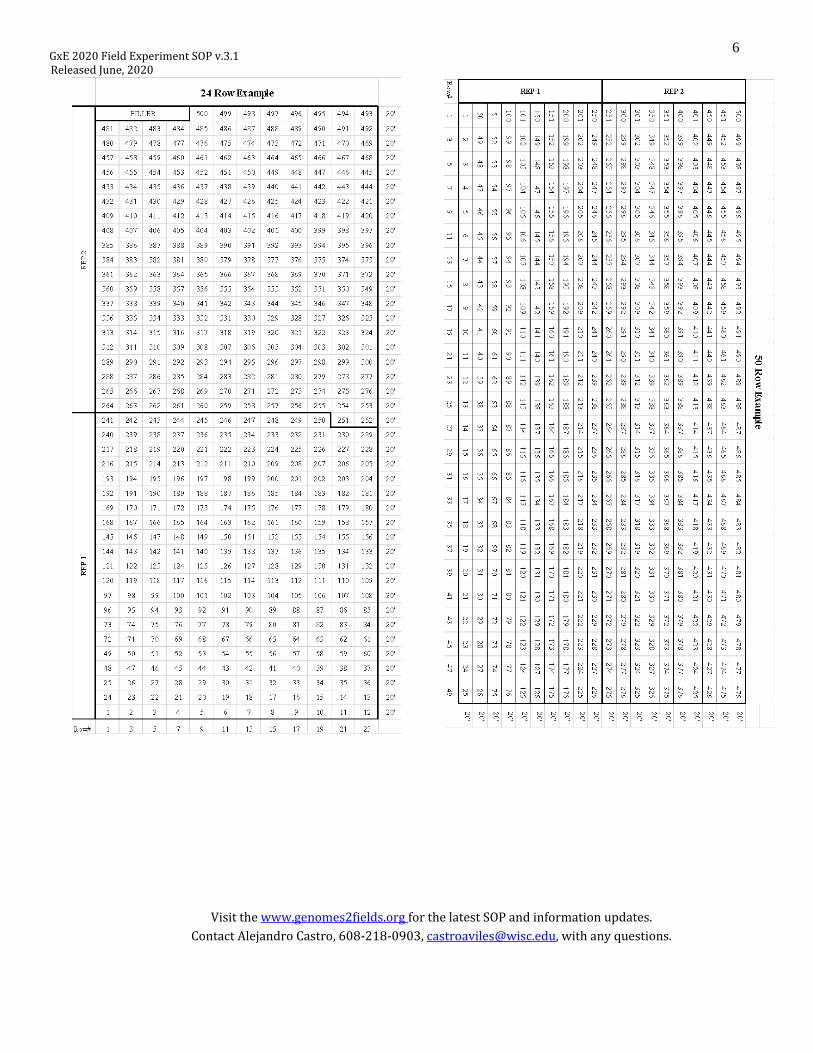
I. Field Layout for 2020 and 2021 seasons
a. Each trial is arranged in two replications (500 plots total). For the purposes of blocking in the
field, the primary division is by replication (1 or 2) then by tester (PHP02, PHK76, PHZ51) if
you have multiple testers. Most locations only included one tester.
b. Additional external blocks were created upon request for external Yellow Stripe replications to
facilitate sampling or additional phenotyping. External experiments with 2 replications of 25
entries were also created upon request for Hybrid HIPS and Inbreed HIPS.
c. The objective of the experimental design was to balance the need for within-site replication
against the overall goal of the GxE project to test as many different hybrids as possible at each
trial site. If your location has hybrids with multiple testers, an equal amount of the plots were
assigned to each tester as separate experiments.
d. Within an experiment there are two replications and each replication will have one plot of
each of the core check hybrids (YS-Hybrids) based on seed availability. If there were enough
plots to sample all hybrids, then all hybrids were assigned randomly to a replication, and if
there were more plots available, a random sample of the hybrids was taken to fill up the
remaining plots, with the second plot of a given hybrid being assigned to a different replication
than the first plot. Within an experiment, the core check hybrids have two complete reps and
at the larger locations, some of the DH hybrids also have two complete reps while most
locations have an incomplete block design. It’s important to note that within replication,
hybrids are grouped by family but since we do not have the same number of DH lines for each
family, the family groups are proportional to the family sizes. Order of family groups is
randomized across replications and sites. This layout works to ensure balanced sampling of
hybrids across all of the sites.
e. Most hybrid trials are arranged in two-row plots, 20’ long with 30-72” alleys between plots.
Filler should be used as needed to minimize edge effects.
f. The diagram on the following page represents the ideal setup with plot numbers. Departures
from this specific layout are completely acceptable.
g. Each investigator is asked to choose one locally adapted hybrid to add as checks to each trial
to increase connection among trials within a location. Ideally, this check will be replicated
twice for 4 plots. Empty seed packets are provided for collaborators to fill. Investigators in
similar areas are encouraged to choose one or more of the same common checks for
connecting sets to provide additional connection among experiments and locations.
h. Planting density and plot dimensions are determined by individual collaborators and reported in the Metadata in the Google Sheet.
For suggested field layouts, see the following page (page 6).
GxE 2020 Field Experiment SOP v.3.1 Released June, 2020
Visit the www.genomes2fields.org for the latest SOP and information updates.
Contact Alejandro Castro, 608-218-0903, [email protected], with any questions.
6
GxE 2020 Field Experiment SOP v.3.1 Released June, 2020
Visit the www.genomes2fields.org for the latest SOP and information updates.
Contact Alejandro Castro, 608-218-0903, [email protected], with any questions.
7
Collaborators will record the following metadata in the appropriate location on a location-specific Google Sheet through the link that was shared.
II. WatchDog 2700 Weather Station Configuration
a. For investigators with multiple GxE trial fields, weather stations should be located within ¼ mile of
all trial fields. For trials > ¼ mile apart, or for trials with varying water treatments, request a
second micro weather station to measure soil moisture differences.
b. In order to maintain consistency and adhere to meteorological measurement standards, the
weather station should be placed at a height of 2 meters (~6 ft). Purchase a 1 ⅜” wide x 10’ 6” long
top rail fence post similar to one found here: https://goo.gl/40KoTW. This will replace the 3 ft. post
that comes with the tripod. Cut the post at the non-tapered end so you’re left with 7 ft.
c. Complete annual maintenance prior to the field season using checklist in Appendix C Part A
d. Complete weather station setup the day before planting, using checklist in Appendix C Part B
e. Throughout the field season, use Appendix C Part C to conduct weather station checks at each
field visit. Record date and time of check in on location-specific Google Sheet
f. Record irrigation amounts and dates in on location-specific Google Sheet
g. Remove the station from the field after harvest using instructions in Appendix C Part D
h. Collect data and upload to Google Sheets using Appendix C Part E
III. Seed Information
a. Hybrid seed will be sent to most collaborators (excluding Southern locations) in early April.
All seed has been chemically treated with Cruiser Extreme 250.
IV. Field Metadata Collection:
At Planting:
i. Planting dates [MM/DD/YY]
ii. Collect soil sample for basic analysis at Ward Laboratories. See Appendix B for
detailed instructions.
iii. Weather station serial number [m2700s0XXXX]
iv. Latitude/longitude (GPS coordinates) of field location
v. Row spacing and plot dimensions
vi. Map of field layout with cardinal heading of first pass (i.e. the direction of pass 1
looking toward the end of the field). Need help figuring out cardinal direction? Visit
http://acscdg.com/. Locate your field, draw a line from plot 1 parallel with rows and
record Azimuth number.
vii. Local hybrid checks (5 total)
viii. Previous crop
GxE 2020 Field Experiment SOP v.3.1 Released June, 2020
Visit the www.genomes2fields.org for the latest SOP and information updates.
Contact Alejandro Castro, 608-218-0903, [email protected], with any questions.
8
ix. Tillage method
x. Weather station documents irrigation? (if applicable) [Y/N]
xi. Notes on planting errors, field anomalies, equipment, etc.
In-Season:
xii. Pesticides and herbicides: type and amount applied
xiii. Fertilizer: date, type, and amount applied
xiv. Irrigation schedule: date and amount applied (if applicable)
xv. Fertigation schedule: date and amount applied (if applicable)
xvi. Notes on field anomalies, phenotyping errors and issues
At Harvest:
xvii. Harvest dates [MM/DD/YY]
xviii. Notes on field anomalies, whole-field issues, equipment and technical issues, or
harvesting issues
V. Phenotype and Performance Data Collection:
Evaluate hybrids for the following traits. See Appendix A for specific measurement instructions.
In-Season:
i. Stand Count – may be taken as juveniles and at harvest
ii. Anthesis [MM/DD/YY]
iii. Silking [MM/DD/YY]
iv. Plant Height (cm)
v. Ear Height (cm)
vi. If damaging winds occur, cooperators may choose to record green snap and date
of event
At Harvest:
vii. Stalk Lodging – plant count (NOT percentage)
viii. Root Lodging – plant count (NOT percentage)
ix. Stand Count – plant count
x. Plot Weight (lbs)
xi. Grain Moisture (%)
xii. Test Weight (lbs/bu)
GxE 2020 Field Experiment SOP v.3.1 Released June, 2020
Visit the www.genomes2fields.org for the latest SOP and information updates.
Contact Alejandro Castro, 608-218-0903, [email protected], with any questions.
9
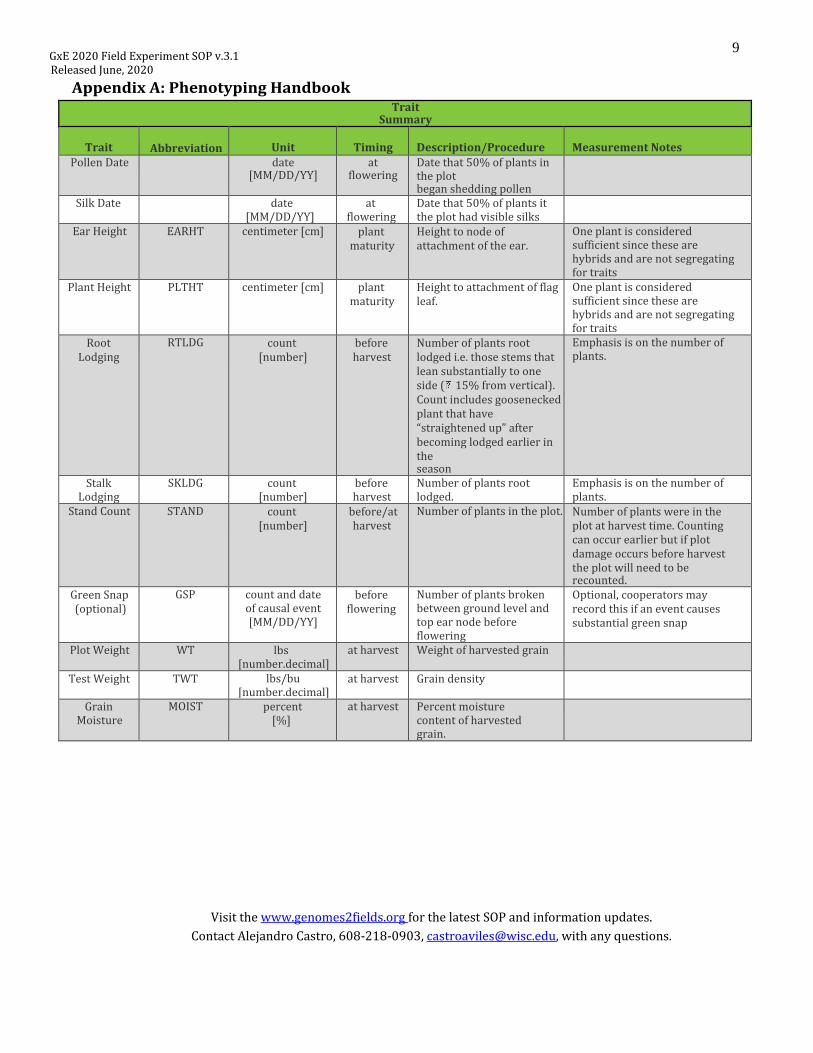
Appendix A: Phenotyping Handbook Trait
Summary
Trait Abbreviation
Unit
Timing
Description/Procedure
Measurement Notes
Pollen Date date [MM/DD/YY]
at flowering
Date that 50% of plants in the plot began shedding pollen
Silk Date date [MM/DD/YY]
at flowering
Date that 50% of plants it the plot had visible silks
Ear Height EARHT centimeter [cm] plant maturity
Height to node of attachment of the ear.
One plant is considered sufficient since these are hybrids and are not segregating for traits
Plant Height PLTHT centimeter [cm] plant maturity
Height to attachment of flag leaf.
One plant is considered sufficient since these are hybrids and are not segregating for traits
Root Lodging
RTLDG count [number]
before harvest
Number of plants root lodged i.e. those stems that lean substantially to one side ( 15% from vertical). Count includes goosenecked plant that have “straightened up” after becoming lodged earlier in the season
Emphasis is on the number of plants.
Stalk Lodging
SKLDG count [number]
before harvest
Number of plants root lodged.
Emphasis is on the number of plants.
Stand Count STAND count [number]
before/at harvest
Number of plants in the plot. Number of plants were in the plot at harvest time. Counting can occur earlier but if plot damage occurs before harvest the plot will need to be recounted.
Green Snap (optional)
GSP count and date of causal event [MM/DD/YY]
before flowering
Number of plants broken between ground level and top ear node before flowering
Optional, cooperators may record this if an event causes substantial green snap
Plot Weight WT lbs [number.decimal]
at harvest Weight of harvested grain
Test Weight TWT lbs/bu [number.decimal]
at harvest Grain density
Grain Moisture
MOIST percent [%]
at harvest Percent moisture content of harvested grain.
GxE 2020 Field Experiment SOP v.3.1 Released June, 2020
Visit the www.genomes2fields.org for the latest SOP and information updates.
Contact Alejandro Castro, 608-218-0903, [email protected], with any questions.
10
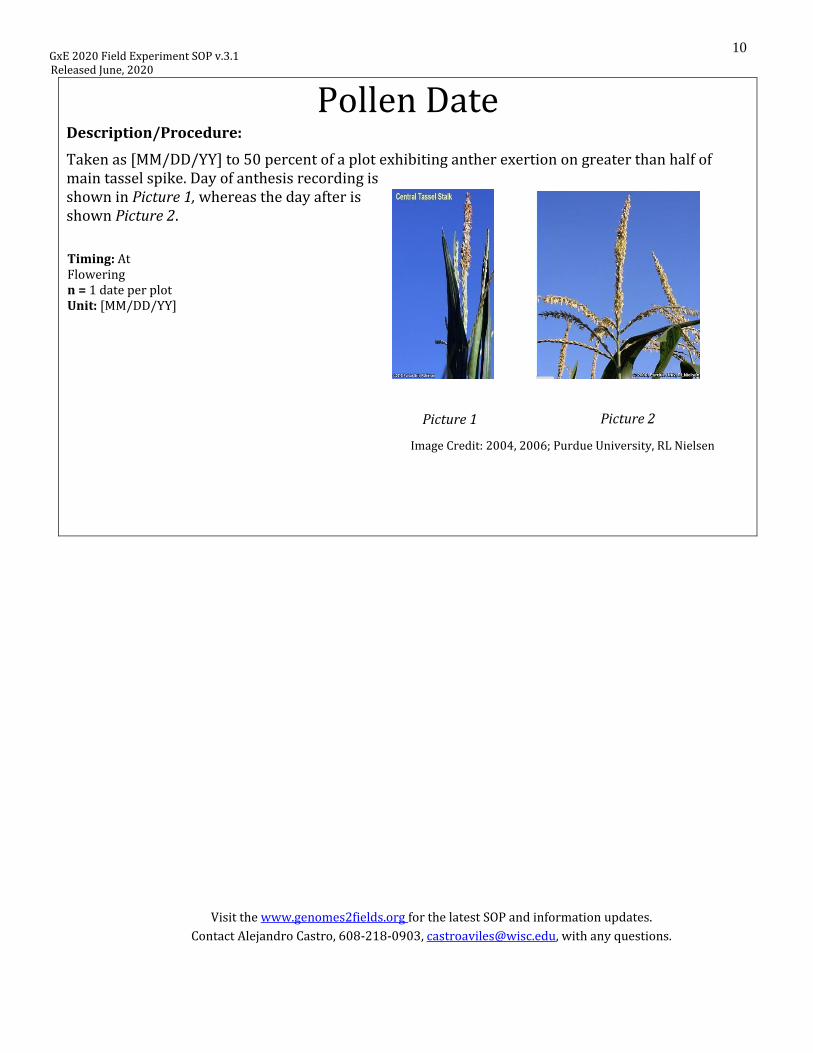
Pollen Date Description/Procedure:
Taken as [MM/DD/YY] to 50 percent of a plot exhibiting anther exertion on greater than half of main tassel spike. Day of anthesis recording is shown in Picture 1, whereas the day after is shown Picture 2.
Timing: At Flowering n = 1 date per plot Unit: [MM/DD/YY]
Picture 1 Picture 2
Image Credit: 2004, 2006; Purdue University, RL Nielsen
GxE 2020 Field Experiment SOP v.3.1 Released June, 2020
Visit the www.genomes2fields.org for the latest SOP and information updates.
Contact Alejandro Castro, 608-218-0903, [email protected], with any questions.
11
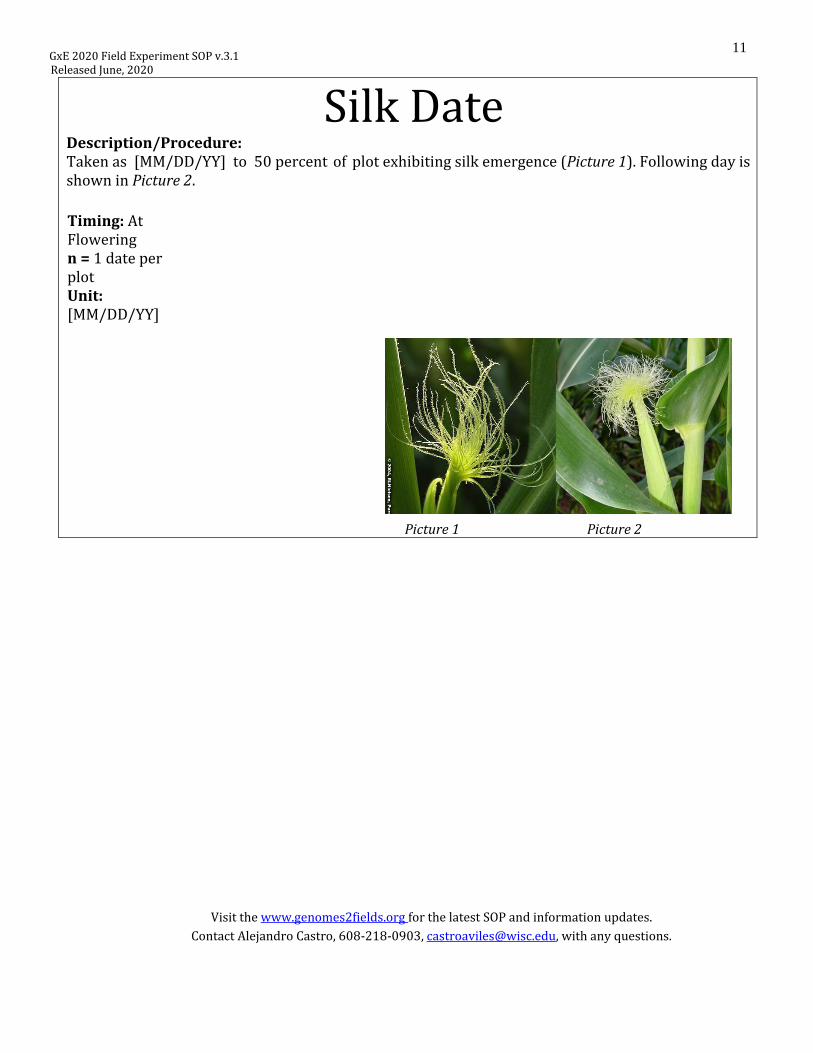
Silk Date Description/Procedure: Taken as [MM/DD/YY] to 50 percent of plot exhibiting silk emergence (Picture 1). Following day is shown in Picture 2.
Timing: At Flowering n = 1 date per plot Unit: [MM/DD/YY]
Picture 1 Picture 2
GxE 2020 Field Experiment SOP v.3.1 Released June, 2020
Visit the www.genomes2fields.org for the latest SOP and information updates.
Contact Alejandro Castro, 608-218-0903, [email protected], with any questions.
12
Picture 1
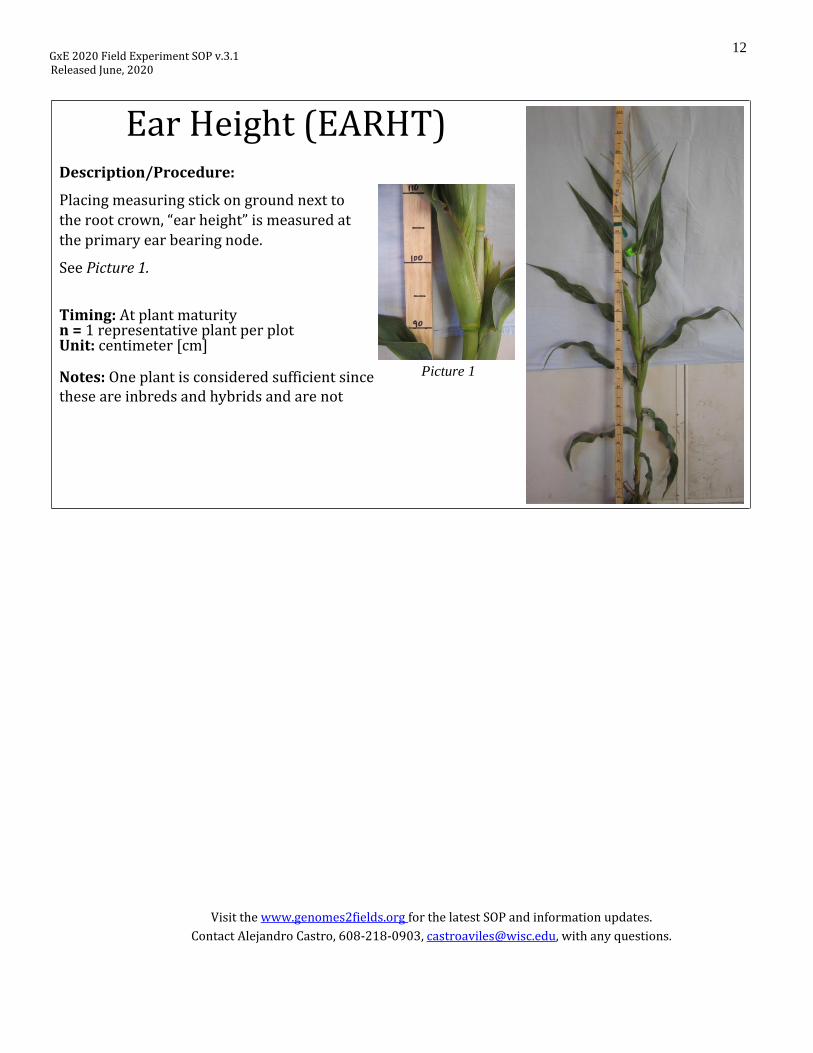
Timing: At plant maturity n = 1 representative plant per plot Unit: centimeter [cm]
Notes: One plant is considered sufficient since these are inbreds and hybrids and are not segregating for traits.
Ear Height (EARHT) Description/Procedure:
Placing measuring stick on ground next to the root crown, “ear height” is measured at
the primary ear bearing node.
See Picture 1.
GxE 2020 Field Experiment SOP v.3.1 Released June, 2020
Visit the www.genomes2fields.org for the latest SOP and information updates.
Contact Alejandro Castro, 608-218-0903, [email protected], with any questions.
13
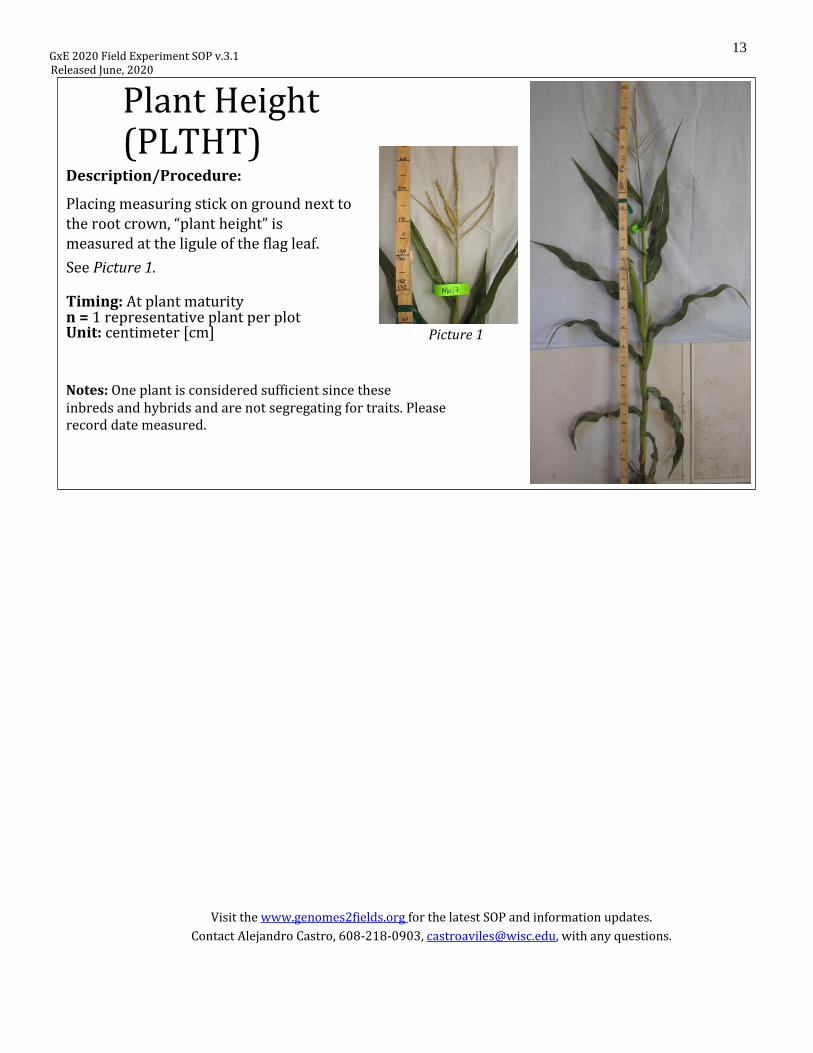
inbreds and hybrids and are not segregating for traits. Please record date measured.
Picture 1
Notes: One plant is considered sufficient since these are
Plant Height (PLTHT)
Description/Procedure:
Placing measuring stick on ground next to the root crown, “plant height” is measured at the ligule of the flag leaf.
See Picture 1.
Timing: At plant maturity n = 1 representative plant per plot Unit: centimeter [cm]
GxE 2020 Field Experiment SOP v.3.1 Released June, 2020
Visit the www.genomes2fields.org for the latest SOP and information updates.
Contact Alejandro Castro, 608-218-0903, [email protected], with any questions.
14
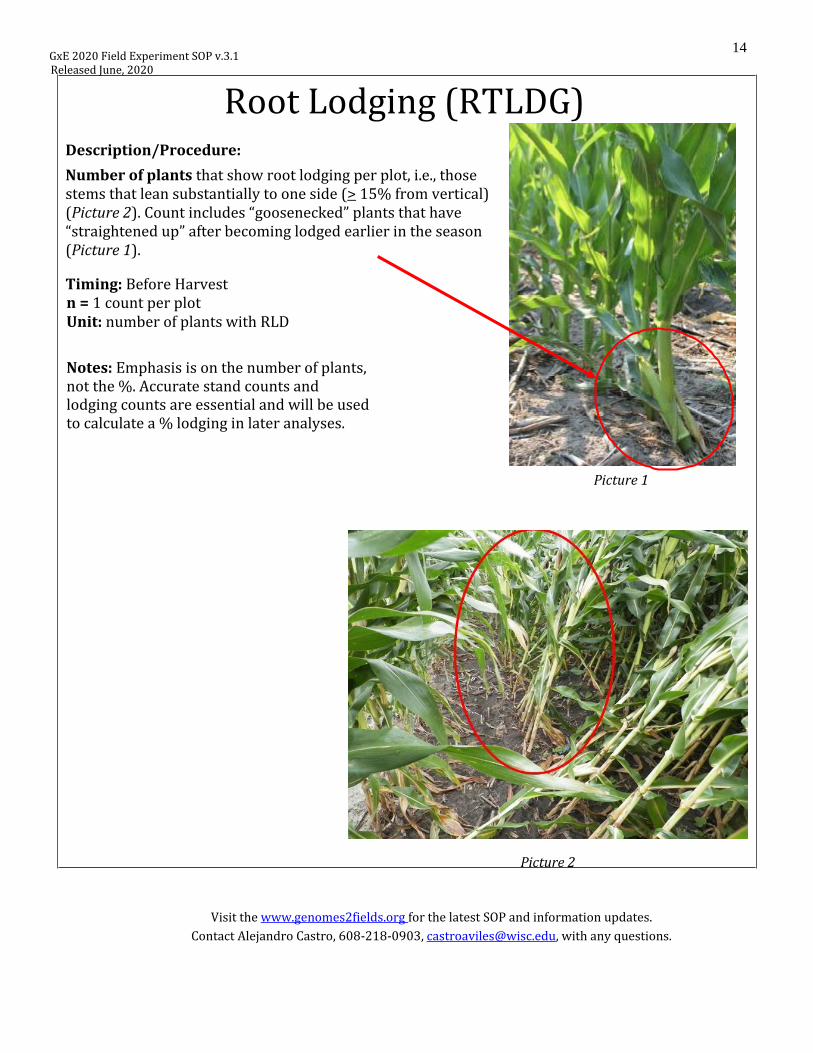
Root Lodging (RTLDG) Description/Procedure:
Number of plants that show root lodging per plot, i.e., those stems that lean substantially to one side (> 15% from vertical) (Picture 2). Count includes “goosenecked” plants that have “straightened up” after becoming lodged earlier in the season (Picture 1).
Timing: Before Harvest n = 1 count per plot Unit: number of plants with RLD
Notes: Emphasis is on the number of plants, not the %. Accurate stand counts and lodging counts are essential and will be used to calculate a % lodging in later analyses.
Picture 1
Picture 2
GxE 2020 Field Experiment SOP v.3.1 Released June, 2020
Visit the www.genomes2fields.org for the latest SOP and information updates.
Contact Alejandro Castro, 608-218-0903, [email protected], with any questions.
15
Picture 1
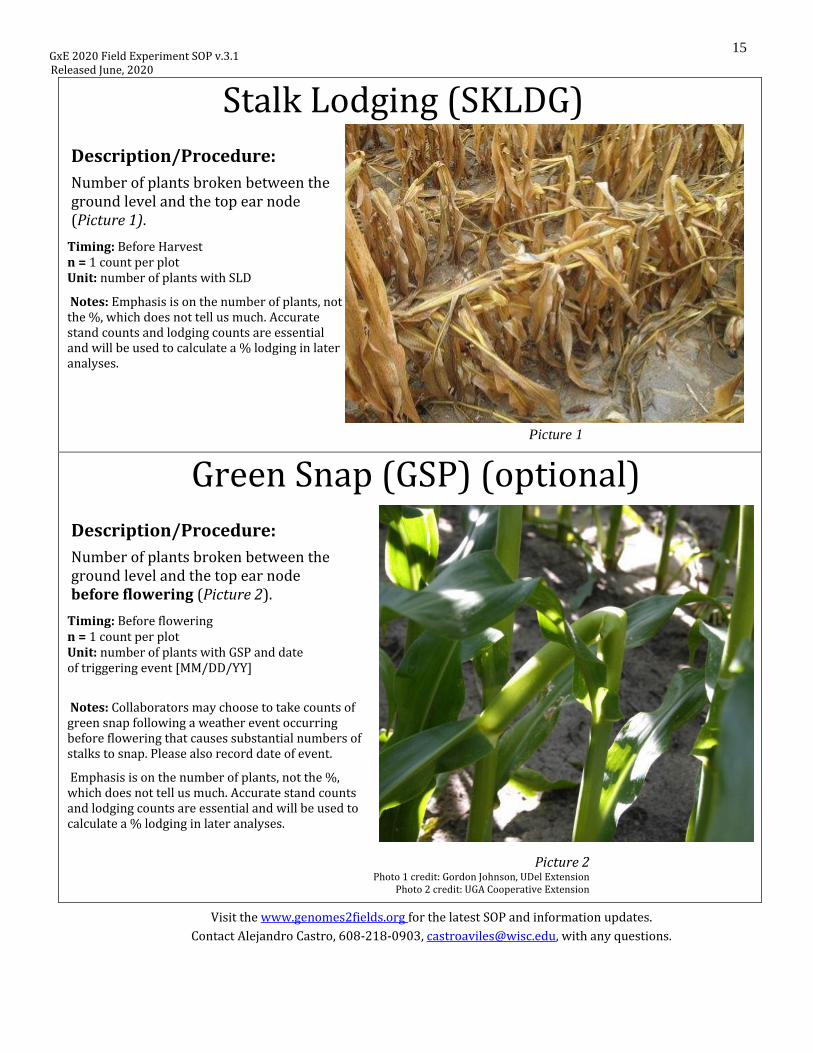
Stalk Lodging (SKLDG)
Description/Procedure:
Number of plants broken between the ground level and the top ear node (Picture 1).
Timing: Before Harvest n = 1 count per plot Unit: number of plants with SLD
Notes: Emphasis is on the number of plants, not the %, which does not tell us much. Accurate stand counts and lodging counts are essential and will be used to calculate a % lodging in later analyses.
Green Snap (GSP) (optional)
Description/Procedure:
Number of plants broken between the ground level and the top ear node before flowering (Picture 2).
Timing: Before flowering n = 1 count per plot Unit: number of plants with GSP and date of triggering event [MM/DD/YY]
Notes: Collaborators may choose to take counts of green snap following a weather event occurring before flowering that causes substantial numbers of stalks to snap. Please also record date of event.
Emphasis is on the number of plants, not the %, which does not tell us much. Accurate stand counts and lodging counts are essential and will be used to calculate a % lodging in later analyses.
Picture 2
Photo 1 credit: Gordon Johnson, UDel Extension Photo 2 credit: UGA Cooperative Extension
GxE 2020 Field Experiment SOP v.3.1 Released June, 2020
Visit the www.genomes2fields.org for the latest SOP and information updates.
Contact Alejandro Castro, 608-218-0903, [email protected], with any questions.
16
Stand Count (STAND) Description/Procedure:
Number of plants per plot at harvest.
Timing:At Harvest n = 1 count per plot Unit: count
Notes: Main consideration is how many plants were in the plot at harvest time. Accurate stand counts and lodging counts are essential and will be used to calculate a % lodging in later analyses. Counting can occur earlier but if a plot damage occurs before harvest they will need to be recounted.
Plot Weight (WT) Test Weight (TWT) Plot Weight Test Weight
Description/Procedure: Description/Procedure:
Shelled grain weight per plot Shelled grain weight per bushel
Timing: At Harvest Timing: At Harvest n = 1 n = 1 weight per plot weight per plot Unit: lbs Unit: lbs/bu
Grain Moisture (MOIST)
Description/Procedure: Water content in grain at harvest.
Timing: At Harvest n = 1 measure per plot Unit: percent [%]

GxE 2020 Field Experiment SOP v.3.1 Released June, 2020
Visit the www.genomes2fields.org for the latest SOP and information updates.
Contact Alejandro Castro, 608-218-0903, [email protected], with any questions.
17
Appendix B: Soil Sampling Handbook
a. Soil Sampling Instructions for GxE 2020
1. Each sample should be made up of a minimum of 10 cores to ensure accurate
representation of the field, ideally 20 or more cores. Cores should be taken to a depth of
30cm.
2. For uniform fields: When gathering soil cores to make a composite sample, collect cores in
a uniform pattern over the whole trial area.
3. For fields with known clines/variants: Sample in order to get an accurate representation
of the majority of the field. If significant differences exist in areas of the field, sample
areas separately and submit multiple, clearly labeled samples.
4. Thoroughly mix the cores before placing approximately 2 cups in the sample bag. This
can be a sample bag, or a regular Ziploc bag.
5. Label the bag with PI name and experiment name.
6. Complete a sample submittal form. 7. Secure samples for shipping and send to:
Ward Laboratories, Inc.
4007 Cherry Ave, PO Box 788
Kearney, Nebraska 68848-0788
(308) 234-2418 Fax (308) 234-1940
www.wardlab.com
Use UW Madison Agronomy UPS Account: 55W1X6
8. SOIL SAMPLES FROM REGULATED/FOREIGN AREAS (TX, GA, GE, ON, NC, SC): All
samples need to be shipped in sturdy, leak proof containers which preclude spillage or pest
escape in transit and while awaiting processing. Sealed tubes, vials or cans placed in sealed
coolers or sturdy boxes are acceptable shipping containers. All regulated or foreign soil
must be shipped via Fedex, see account # above. All samples need to have a copy of the Soil
Permit inside and affixed to the outside. For foreign soils, a copy of PPQ Form 330 goes on
the outside of the box.
This requirement applies to samples from TX, GA, NC, SC, Ontario and Germany.

GxE 2020 Field Experiment SOP v.3.1 Released June, 2020
Visit the www.genomes2fields.org for the latest SOP and information updates.
Contact Alejandro Castro, 608-218-0903, [email protected], with any questions.
18
Appendix C: Additional Weather Station Resources
For weather station issues, contact: Hardware: David Ertl [email protected]
Software/Technical Support: Octavio Valle [email protected]
515-225-9242 815-436-4440 (mention Iowa Corn), or
800-248-8873 and ask for Terri or Tech Support
a. Annual Watchdog 2700 Pre-Season Tasks
i. Check that all sensors are reading correctly on LCD screen. See item (f) for specific
instructions regarding the calibration/troubleshooting of individual instruments.
ii. Rearrange the external instruments to the following ports:
1. Soil moisture - Port A
2. Soil temperature - Port B
3. Solar radiation - Port C
4. PAR sensor - Port D
iii. Using the SpecWare software with the station connected, delete the data from the logger
(Logger > WatchDog Manager > Advanced > Clear > OK)
iv. Using the SpecWare software with the station connected, turn off unused ports and verify
instrument port location (Logger > WatchDog Manager > Properties > uncheck Enabled box
for unused ports and correct Sensor/Units > OK)
v. Replace batteries - 4 AA.
vi. Check for inhibitors or damage to the sensors:
1. Waste in rain gauge
2. Damaged sensor wires
3. Damaged external parts
4. Dirt on sensors
vii. Inspect fasteners and ensure all are tight.
viii. Check for moisture damage & corrosion. Inspect circuit board if there are signs of
water damage or corrosion.
GxE 2020 Field Experiment SOP v.3.1 Released June, 2020
Visit the www.genomes2fields.org for the latest SOP and information updates.
Contact Alejandro Castro, 608-218-0903, [email protected], with any questions.
19
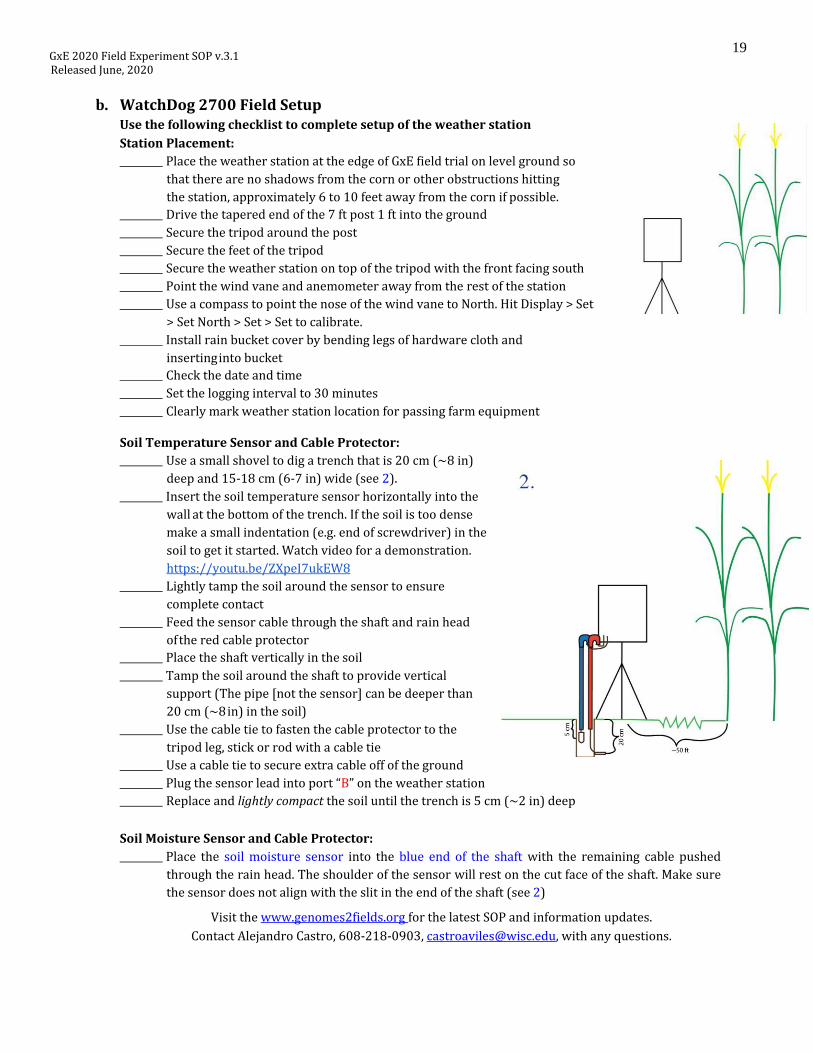
b. WatchDog 2700 Field Setup Use the following checklist to complete setup of the weather station
Station Placement:
Place the weather station at the edge of GxE field trial on level ground so
that there are no shadows from the corn or other obstructions hitting
the station, approximately 6 to 10 feet away from the corn if possible.
Drive the tapered end of the 7 ft post 1 ft into the ground
Secure the tripod around the post
Secure the feet of the tripod
Secure the weather station on top of the tripod with the front facing south
Point the wind vane and anemometer away from the rest of the station
Use a compass to point the nose of the wind vane to North. Hit Display > Set
> Set North > Set > Set to calibrate.
Install rain bucket cover by bending legs of hardware cloth and
inserting into bucket
Check the date and time
Set the logging interval to 30 minutes
Clearly mark weather station location for passing farm equipment
Soil Temperature Sensor and Cable Protector:
Use a small shovel to dig a trench that is 20 cm (~8 in)
deep and 15-18 cm (6-7 in) wide (see 2).
Insert the soil temperature sensor horizontally into the
wall at the bottom of the trench. If the soil is too dense
make a small indentation (e.g. end of screwdriver) in the
soil to get it started. Watch video for a demonstration.
https://youtu.be/ZXpeI7ukEW8
Lightly tamp the soil around the sensor to ensure
complete contact
Feed the sensor cable through the shaft and rain head
of the red cable protector
Place the shaft vertically in the soil
Tamp the soil around the shaft to provide vertical
support (The pipe [not the sensor] can be deeper than
20 cm (~8 in) in the soil)
Use the cable tie to fasten the cable protector to the
tripod leg, stick or rod with a cable tie
Use a cable tie to secure extra cable off of the ground
Plug the sensor lead into port “B” on the weather station
Replace and lightly compact the soil until the trench is 5 cm (~2 in) deep
Soil Moisture Sensor and Cable Protector:
Place the soil moisture sensor into the blue end of the shaft with the remaining cable pushed
through the rain head. The shoulder of the sensor will rest on the cut face of the shaft. Make sure
the sensor does not align with the slit in the end of the shaft (see 2)
GxE 2020 Field Experiment SOP v.3.1 Released June, 2020
Visit the www.genomes2fields.org for the latest SOP and information updates.
Contact Alejandro Castro, 608-218-0903, [email protected], with any questions.
20
Loosen the soil using a soil probe to make a hole to insert the prove. Refill the hole with loose soil.
Push the sensor gently into the soil so the top of the sensor is even with the soil in the trench. DO
NOT push hard, the sensor is breakable!! Watch this video for a demonstration.
https://youtu.be/ZXpeI7ukEW8
Tamp the remaining soil around the outside of the shaft to divert surface water and support the shaft.
Use a cable tie to secure extra cable off the ground
Plug the sensor into port “A” on the weather station
c. In-Field WatchDog 2700 Maintenance
Weather station checks should take place at each field visit. Note the date and time of station
check in metadata sheet to allow proper data cleaning.
Anemometer:
Clean dirt/debris from the wind cups
Check display values to ensure the sensor is still working (Display > Current > Current > Up Arrow)
Ensure the cups still spin freely
Wind vane:
Clean dirt/debris from the wind vane
Check display values to ensure the sensor is still working (Display > Current > Current > Up Arrow)
Rain bucket:
Remove debris from the top of the bucket, both on and beneath hardware cloth cover
Unscrew the top and lift lid
Remove dirt/debris from inside the bucket
Set the display to view rain values (Display > Current > Current > Up Arrow > Down Arrow) and
tip the bucket to ensure the sensor is still working
Replace the lid and cover for rain bucket
Solar radiation sensor:
Remove dirt/debris from the solar radiation sensor
Check display values to ensure the sensor is still working
properly (Display > Current > Current > Up Arrow (x8 for
Port C))
Soil temperature sensor:
Check display values to ensure the sensor is still working
properly (Display > Current > Current > Up Arrow (x7 for
Port A))
Soil moisture sensor:
Check display values to ensure the sensor is still working
properly (Display > Current > Current > Up Arrow (x6 for
GxE 2020 Field Experiment SOP v.3.1 Released June, 2020
Visit the www.genomes2fields.org for the latest SOP and information updates.
Contact Alejandro Castro, 608-218-0903, [email protected], with any questions.
21
Port A))
All cables:
Check all sensor cables for exposed wires/breakages
d. Post-Field Season WatchDog 2700 Removal
After the field is harvested, the weather station should be carefully removed to increase longevity.
Unplug the soil temperature and soil moisture sensors from the weather station Remove the soil temperature and soil moisture sensors by carefully digging them out with a shovel
Replace the soil for the trench
Clean soil from the cable protectors and fold up sensor cables taking care to avoid sharp bends
Take down the weather station Remove the 7 ft post from the soil and remove packed soil from the end
Transferring SWD files / data
To transfer files, i.e., to consolidate data from multiple locations and computers, you can download your
WatchDog weather station data and upload it to CyVerse by doing the following:
i. Connect the weather station to the computer and open SpecWare to transfer data
ii. Select Logger > Get WatchDog 1000/2000 Data
iii. Navigate to your SpecWare folder on the C-drive
iv. Open the folder for the desired station
v. Select all .SWD files and upload to the Weather folder using the location-specific Google Sheet link
that was shared
e. Additional Links to Resources:
1. Software Setup: SpecWare9 Quick Start Guide
2. Complete Watchdog Weather Station Manual
3. Additional Spectrum Technology manuals
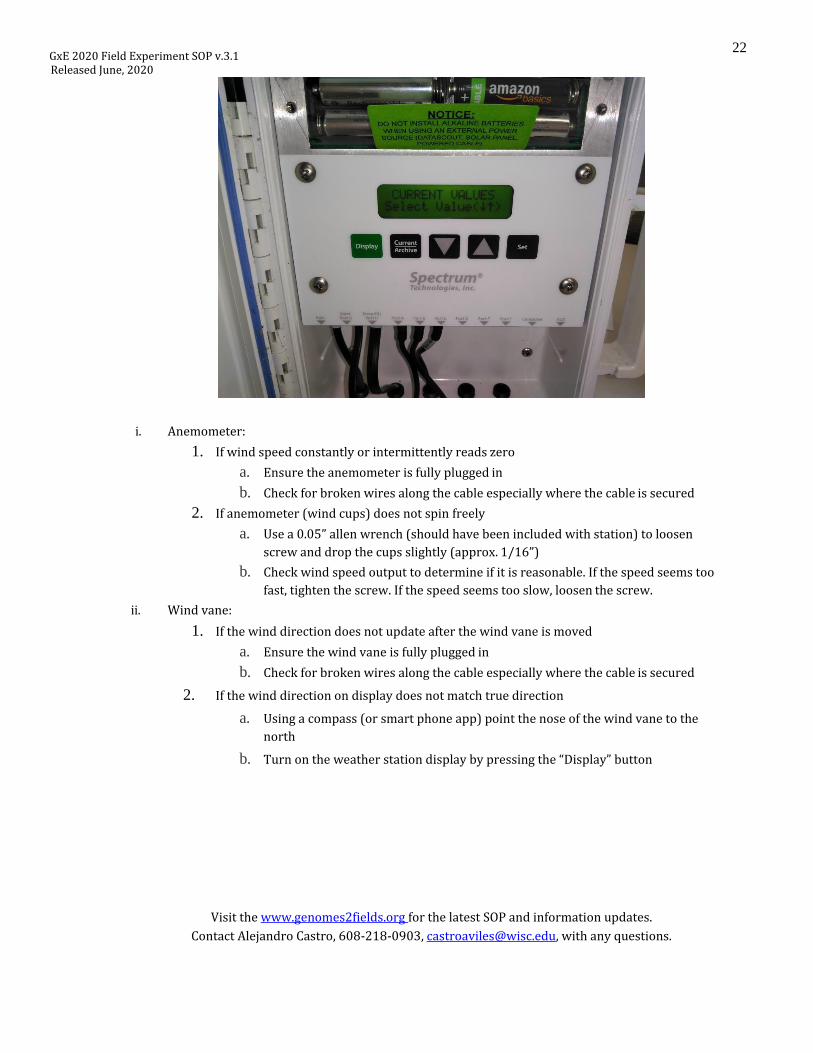
f. WatchDog Troubleshooting and Calibration Methods
To test the weather station, press the “Display” button to turn on the display. Press the “Current/Archive”
button until the display reads “Current Values”. Then use the arrow keys to step through the various
instrument readings and test the output. Please wait up to 30 seconds for the display to update the current
conditions.
GxE 2020 Field Experiment SOP v.3.1 Released June, 2020
Visit the www.genomes2fields.org for the latest SOP and information updates.
Contact Alejandro Castro, 608-218-0903, [email protected], with any questions.
22
i. Anemometer:
1. If wind speed constantly or intermittently reads zero
a. Ensure the anemometer is fully plugged in
b. Check for broken wires along the cable especially where the cable is secured
2. If anemometer (wind cups) does not spin freely
a. Use a 0.05” allen wrench (should have been included with station) to loosen
screw and drop the cups slightly (approx. 1/16”)
b. Check wind speed output to determine if it is reasonable. If the speed seems too
fast, tighten the screw. If the speed seems too slow, loosen the screw.
ii. Wind vane:
1. If the wind direction does not update after the wind vane is moved
a. Ensure the wind vane is fully plugged in
b. Check for broken wires along the cable especially where the cable is secured
2. If the wind direction on display does not match true direction
a. Using a compass (or smart phone app) point the nose of the wind vane to the
north
b. Turn on the weather station display by pressing the “Display” button
GxE 2020 Field Experiment SOP v.3.1 Released June, 2020
Visit the www.genomes2fields.org for the latest SOP and information updates.
Contact Alejandro Castro, 608-218-0903, [email protected], with any questions.
23
c. Hit the “Set” button
d. Use the arrows until the display reads “Set North” then push “Set”
e. Point the nose of the wind vane to north and press “Set” again. The weather
station will calibrate north and return to the “Current” display
iii. Rain bucket:
1. If the rain bucket is not collecting data when the bucket is tipped
a. Loosen 4 screws at base of rain bucket twist the black bucket to the right about
½”, and lift lid
b. Remove dirt or debris that could be preventing the bucket from tipping
c. Manually move the bucket back and forth several times. Each tip is one one-
hundredth of an inch (or 0.254 millimeters).
d. Check the display to determine if the proper amount of rain was recorded
2. If the LCD is not showing any or all of the manual tips of the spoon
a. The magnetic sensor on the tipping spoon may be too far from the read switch or
the sensor cable is bad. There are 2 cams on the base of the rain collector that can
be rotated to move the tipping spoon closer to or further away from the read
switch. Make this adjustment and check if the LCD shows that the logger can detect
manual tips of the spoon. If so, proceed to step 3. If not, the sensor may need to be
sent in for service.
3. If all the tips are being counted
a. Replace the rain bucket and trickle a known amount of water into the bucket.
CAUTION: The rain bucket is self-emptying so be sure there are no
electronics/important papers near the station while completing this task. 84 ml of
water should register 0.1 inches of water (2.5 mm). This is equivalent to 10 tips of
the tipping spoon. The best results are attained when the water is added slowly. It is
recommended that the water be put in a ziplock bag which is then punctured with a
pin to allow the water to slowly enter the rain bucket. If the reading on the LCD is
slightly high or slightly low, the sensor can be calibrated. When the spoon tips, it
lands on screws on either side. If sensor is reading high, lower the screws. If it is
reading low, raise the screws. It is recommended to adjust the screws a quarter turn
and again run a known amount of water through the bucket to determine if
additional adjustment is necessary.
iv. Thermometer/Relative Humidity:
1. If the temperature or humidity on the display seems unusually high/low
a. Ensure the sensor is fully plugged in
b. Check for broken or exposed wires along the cable
GxE 2020 Field Experiment SOP v.3.1 Released June, 2020
Visit the www.genomes2fields.org for the latest SOP and information updates.
Contact Alejandro Castro, 608-218-0903, [email protected], with any questions.
24
v. Soil thermometer:
1. If the soil thermometer display does not register or varies significantly from the air
temperature
a. Ensure the units on the display match the intended units. If the units do not match
use the “Set” button to set the sensor type. Use the arrow keys to select to
appropriate port and hit “Set”. Use the arrow keys again to select the correct sensor
and hit “Set” again.
b. Ensure the cable is fully plugged in.
c. Check for broken or exposed wires along the cable.
vi. Soil moisture sensor:
1. If the sensor display reads anything other than 0% VWC in air
a. Ensure the sensor is fully plugged in
b. Check for broken or exposed wires along the cable
2. If the sensor seems fine in air, but season data has issues
a. Place the sensor in distilled water. If the sensor does not read ~55% VWC it may
need to be calibrated/replaced.
vii. Solar radiation sensor:
1. If the solar radiation sensor display reads zero
a. Ensure the sensor is fully plugged in
b. Check for broken or exposed wires along the cable
c. Ensure the units on the display match the intended units. If the units do not match
use the “Set” button to set the sensor type. Use the arrow keys to select to
appropriate port and hit “Set”. Use the arrow keys again to select the correct sensor
and hit “Set” again.
2. If the solar radiation display reads a very low number (<500 W/m2)
a. Repeat steps a-c in item 1 above
b. If it is sunny take the weather station outside to see if the numbers improve.
The solar constant is 1400 W/m2 so you shouldn’t have any values greater
than that

GxE 2020 Field Experiment SOP v.3.1 Released June, 2020
Visit the www.genomes2fields.org for the latest SOP and information updates.
Contact Alejandro Castro, 608-218-0903, [email protected], with any questions.
25