Embed Size (px)
DESCRIPTION
Methods for Testing GxE Interaction and Effects Nonlinear Epigenetics Chicago April 18-19 2014 Peter Molenaar The Pennsylvania State University. - PowerPoint PPT Presentation
Citation preview
Methods for Testing GxE Interactionand
Effects Nonlinear Epigenetics
Chicago April 18-19 2014
Peter MolenaarThe Pennsylvania State University
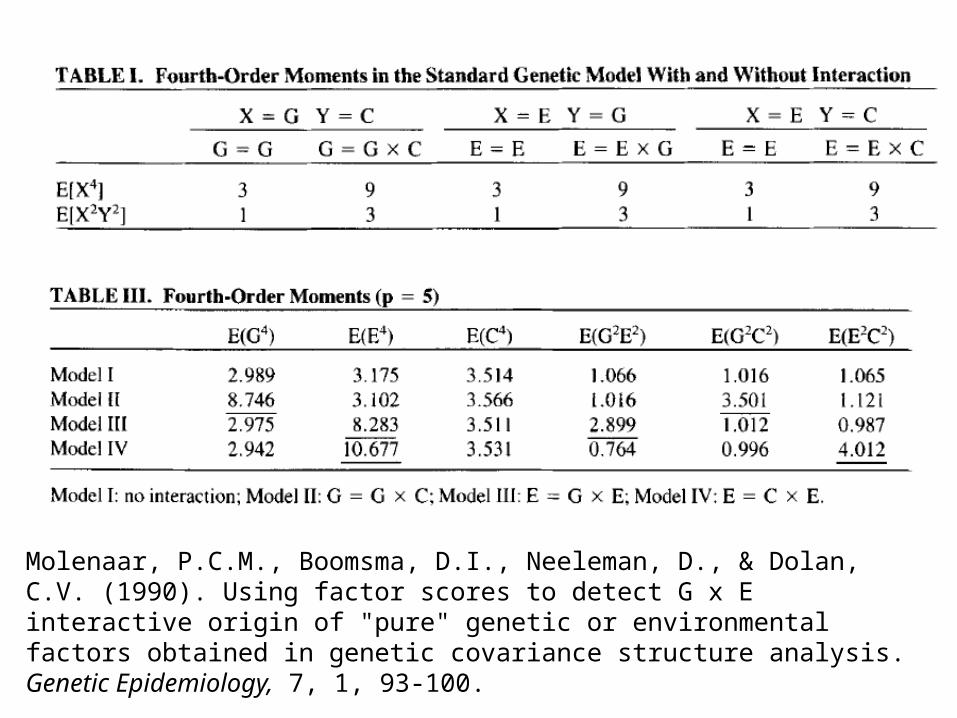
Molenaar, P.C.M., Boomsma, D.I., Neeleman, D., & Dolan, C.V. (1990). Using factor scores to detect G x E interactive origin of "pure" genetic or environmental factors obtained in genetic covariance structure analysis. Genetic Epidemiology, 7, 1, 93-100.
Epigenetic Origins of Heterogeneity across subjects
Molenaar, P.C.M., Boomsma, D.I., & Dolan, C.V. (1993). A third source of developmental differences. Behavior Genetics, 23, 519-524.
Molenaar (2007). On the implications of the classical ergodic theorems: Analysis of developmental processes has to focus on intra-individual variation. Developmental Psychobiology, 50, 60-69.
4
5
Subject-Specific Heritabilities
Molenaar, P.C.M., Smit, D.J.A., Boomsma, D.I., & Nesselroade, J.R. (2012). Estimation of subject-specific heritabilities from intra-individual variation: iFACE.
Twin Research and Human Genetics, 15, 393-400.
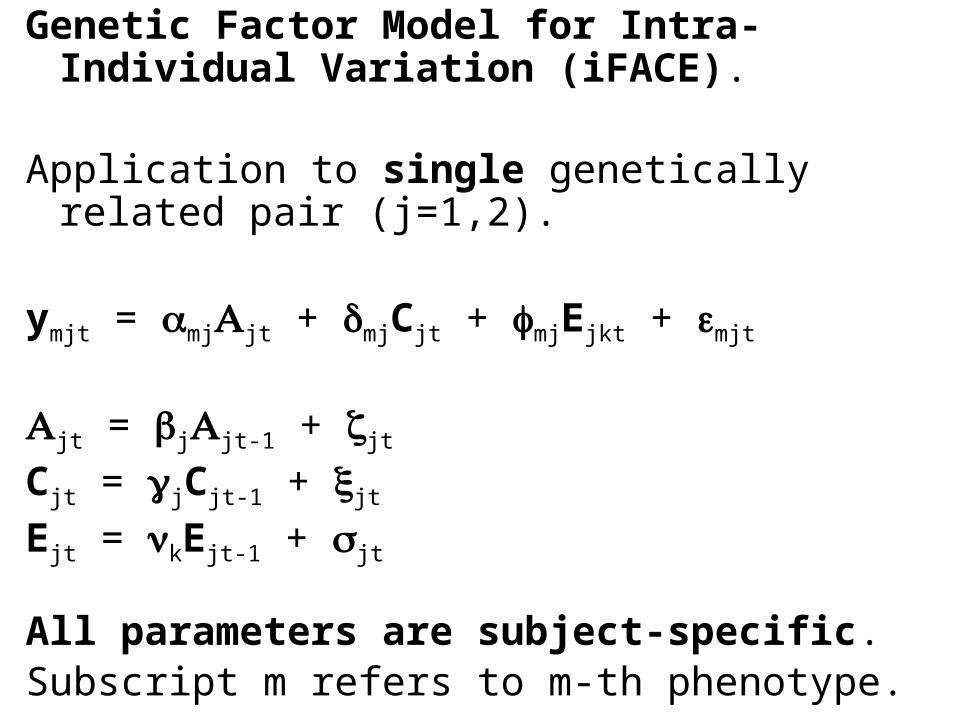
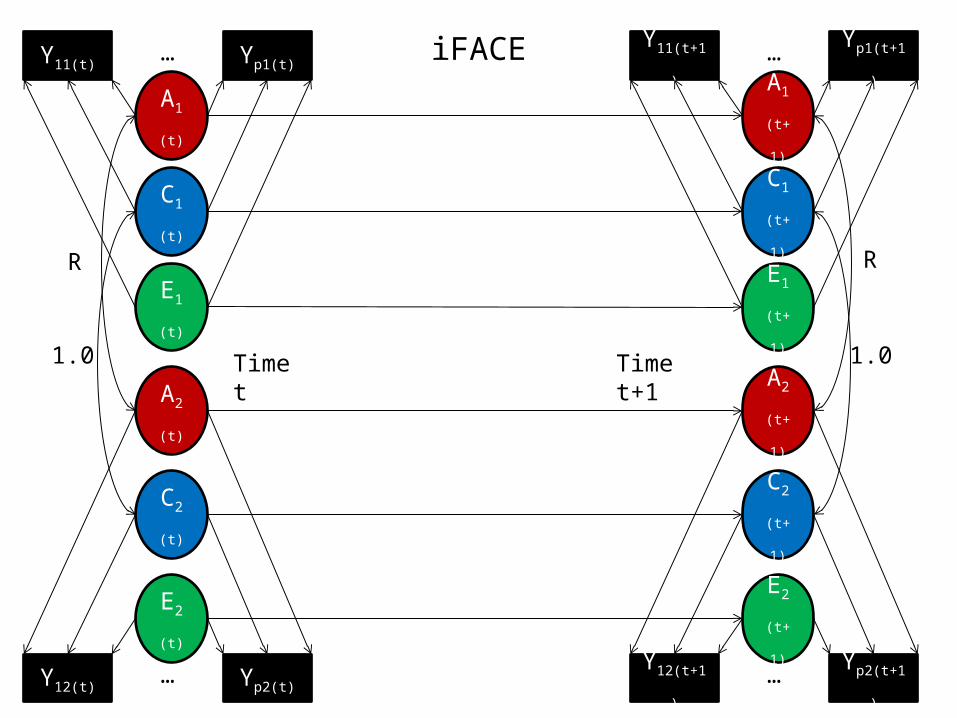
Genetic Factor Model for Intra-Individual Variation (iFACE).
Application to single genetically related pair (j=1,2).
ymjt = mjjt + mjCjt + mjEjkt + mjt
jt = jjt-1 + jt
Cjt = jCjt-1 + jt
Ejt = kEjt-1 + jt
All parameters are subject-specific.Subscript m refers to m-th phenotype.
A1
(t+1)
C1
(t+1)
E1
(t+1)
A2
(t+1)
C2
(t+1)
E2
(t+1)
A1
(t)
C1
(t)
E1
(t)
A2
(t)
C2
(t)
E2
(t)
iFACEY11(t) Yp1(t) Y11(t+1) Yp1(t+1)… …
R
1.0
Y12(t) Yp2(t) Y12(t+1) Yp2(t+1)……
R
1.0Time t Time t+1

Preliminary Application iFACE to Multi-Lead EEG Data Obtained in Oddball Task
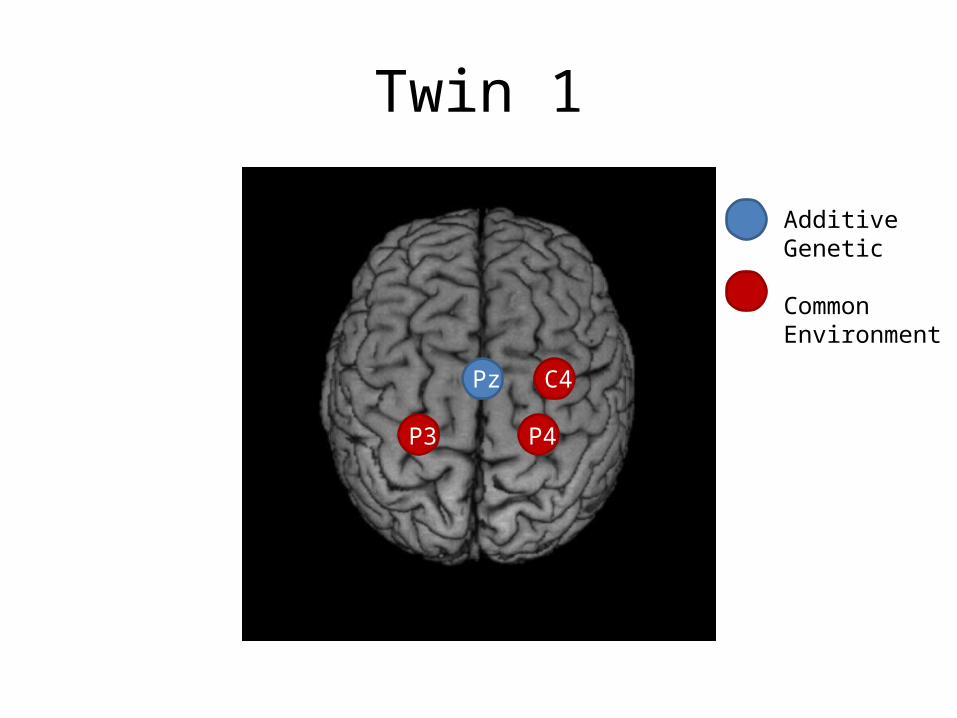
Twin 1
Pz
Additive Genetic
Common Environment
P3
C4
P4
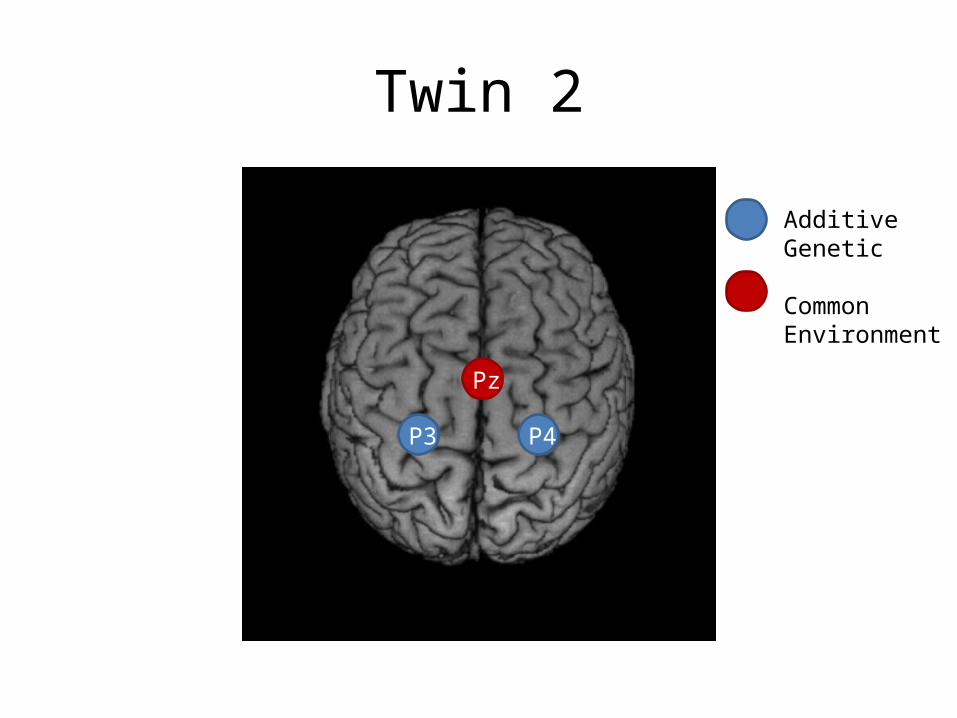
Twin 2
Pz
Additive Genetic
Common Environment
P3 P4
Heritability is high for a few leads which differ across subjects (Pz for twin 1; P3 and P4 for twin 2)
The effects of common environment are high for leads neighboring the ones with high heritability (P3 and P4 for twin 1; Pz for twin 2), possibly due to A x C interaction (Molenaar et al., Genetic Epidemiology, 1990)
Analogous results are obtained for other individual DZ twin pairs