Embed Size (px)
Citation preview
How Competition Affects Contributions to Open Source Platforms:
Evidence from OpenStreetMap and Google Maps
Abhishek Nagaraj
UC Berkeley-Haas
Henning Piezunka
INSEAD
February 29, 2020
Abstract
Open source platforms often face competition from commercial alternatives and yet we lack an understanding of whether and how commercial competition affects contributions to open source platforms. We study how contributions to OpenStreetMap, a widely-used open source mapping platform, changed following the competitive entry of Google Maps. We exploit the phased entry of Google Maps in different countries over time to isolate the effect of competition. We find that the entry of Google Maps has a negative effect on contributions to OpenStreetMap, illustrating that commercial competition plays an important role in shaping open source contributions. We then examine if different contributors react differently to competitive entry, finding that new contributors (those who are contributing for the first time) decrease their contributions while pre-existing contributors (those who contributed before competitive entry) increase their contributions. We find that the reduction in new contributors seems to be driven by a reduction in consumption of the open source platform. The increase in contributions by pre-existing contributors seems to be associated with their attachment to the platform, which is anchored in their ideological inclination towards open source and to a lesser extent, the social interaction it offers with their fellow contributors.
Over the last thirty years, individual contributions to open source platforms have produced
impressive results, from Wikipedia's vast encyclopedia to Linux's operating system (Greenstein and Nagle
2014; Jeppesen and Lakhani 2010; Nagle 2017). A voluminous literature has examined why individuals
voluntarily contribute to these projects, identifying individual and group level factors that are associated
with such contributions (Butler 2001; Lakhani and Wolf 2005; Gallus 2017; Kraut and Resnick 2012).
While this work has significantly enriched our understanding of the determinants of volunteer
contributions, it has largely overlooked the fact that open source platforms do not exist in isolation.
Rather, they often face external competition from commercial alternatives. Wikipedia, for example,
competes with Encyclopedia Britannica online, and Linux competes with Microsoft Windows. While
open source platforms and commercial alternatives differ in the way they organize, they often offer
largely similar products and features, thereby competing for the same consumers. While a large body of
research has examined how open source and commercial platforms compare and contrast (e.g., Almirall
and Casadesus-Masanell 2010; Greenstein and Zhu 2014; Giles 2005), our knowledge of whether and
how they affect one another is limited.
Given the emphasis in the literature on internal factors that affect contributions, no empirical
research has looked at the topic of competition. We thus do not know whether competition has any
meaningful role to play in shaping contributions. Even if competition shapes contributions, we do not
know whether its effect is negative or positive. For example, commercial competition has the potential to
reduce the pool of contributors as well as their motivation, thereby reducing contributions. On the other,
contributors might have a sense of attachment to the open source platform and might increase
contributions in order to preserve it. Given the lack of research on this topic, we do not yet know which
mechanisms are at play, and to what degree and to whom they apply. Motivated by this gap, we examine
whether and how commercial competition affects voluntary contributions to open source platforms.
Our interest in this question is echoed by prior work which has pointed out the potentially
important theoretical and practical implications of studying the role of competition in shaping
contributions to open source platforms and has called for more research in this area (Lerner and Tirole
2002). Understanding the effect of commercial competition is important because competition may
substantially affect the viability of open source platforms. Investigating this question is methodologically
challenging, however, as it requires a comparable set of open source communities where only some are
exposed to competition. Further, competition can arise endogenously since a commercial competitor is
likely to enter against those communities that are easiest to compete with. It is empirically challenging to
tease apart the effect of competition from these endogenous factors.
We develop a research design that addresses these challenges. We analyze the effect of the
competitive entry of Google Maps on contributions to OpenStreetMap, one of the largest open source
platforms on the web with about half the number of active members as Wikipedia (Maher 2016). Even
though OpenStreetMap is a single, global open source project, it is maintained by distinct country-based
communities, providing us with a population of distinct but comparable communities within a single
overarching platform. While OpenStreetMap launched globally in 2004, Google Maps started in only a
handful of countries and expanded on a country-by-country basis after its inception in 2005. We suggest
that this phased roll-out, while not explicitly random, can reliably be exploited to evaluate whether and
how commercial competition affects contributions to OpenStreetMap across the distinct country-based
communities (cf. Seamans and Zhu 2014, 2017). We pair this variation in Google Maps with a novel 1
quantitative dataset capturing over 2.4 million contributions between 2004 and 2015 made by 89,000
members of the OpenStreetMap communities in 87 countries in order to investigate our research question.
1 Note that it might seem like we are lumping unrelated countries in one group and examining the effect of competition among them. However, in this research design, we include country fixed effects and so essentially we are examining how contributions in a country changes as compared to itself after competitive entry. The differential timing is helpful in allowing us to include time fixed effects to control for platform-wide dynamics.
We also consider a specification that relies on a sample of 160 countries (79 in our main sample for which
we found a match to a set of 81 control countries).
In the absence of clear theoretical predictions on the effect of commercial competition on
contributions, we present empirical estimates of the effect of competition by Google Maps on
contributions to OpenStreetMap. We analyze detailed information at the level of the individual, the
country-level community, and the community’s broader national context to explore various mechanisms
through which commercial competition could affect contributions. Accordingly, our goal in this paper is
to provide the first systematic and large-scale evidence of the possible role of competition in shaping
contributions to open source platforms and to rule in potential mechanisms that will guide future
theoretical work in this area.
Our results suggest that commercial competition has a substantial effect on contributions to open
source platforms. Specifically, we find that the entry of Google Maps in a country decreases contributions
to OpenStreetMap by 51% in the average quarter after entry. This finding illustrates how detrimental
commercial competition can be to open source platforms. More broadly, the finding that competition does
have an effect on contributions reinforces our motivation that it is not enough to compare and contrast
open source and commercial alternatives; rather, we must examine the effect that they have on one
another.
Having established the important role of competition in shaping contributions, we then examine
heterogeneity in the overall response to commercial competition within and across communities. To do
this, we analyze separately contributions from pre-existing contributors (contributors who joined prior to
the market entry of Google Maps) and contributions from new contributors (those who start contributing
for the first time in a particular quarter). In other words, for a country j in quarter t, contributions from
pre-existing contributors are defined as the total number of contributions made by all contributors i who
made their first contribution before the competitive entry of Google Maps. Contributions from new
contributors are defined as total contributions made by all contributors i whose contributions before the
focal quarter t equal zero. Therefore, we contrast the effect of competition on the fixed set of pre-existing
contributors with its effect on first time contributors in every country-quarter. We find that total
contributions per quarter from pre-existing contributors increases after the entry of Google Maps.
However, the total contributions per quarter from new contributors decreases after the entry of Google
Maps. While prior work points out that contributors differ in their motivations, and that the key drivers
underlying their motivations change over time (e.g., Shah 2006), we present what is, to the best of our
knowledge, the first evidence that distinct groups of contributors respond very differently to commercial
competition.
Further, we provide an exploratory examination of what underlies the different responses by new
and pre-existing users. Because new contributors are not a fixed group but are defined relative to the
quarter under study, the finding that the total number of contributions per quarter from new contributors
goes down could be because there are fewer new contributors, because each new contributor makes fewer
contributions on average, or both. Our findings suggest that the first effect might be stronger than the
second. Contributions from new contributors decrease largely because the commercial competitor acts as
a substitute, reducing the number of consumers of the open platform. Because consumption often
precedes contributions (Kane and Ransbotham 2016), this reduction in consumption results in fewer new
contributors. Competition also appears to reduce the motivation of new users: the average number of
contributions each new contributor makes in their first quarter of contributing is higher before Google
Maps enters than the average number of contributions each new contributor makes in their first quarter of
contributing after Google Maps enters. However, this effect is small compared to the decline in the
number of new contributors. In contrast, pre-existing contributors increase their average number of
contributions in the face of competition due to their attachment to the open source platform. By
attachment, we refer to the extent to which contributors identify with the organization and feel a cognitive
and emotional connection to it (Paxton and Moody 2003; Hassan 2012; Ashforth and Mael 1989). We
consider two possible drivers of attachment that have been theorized in the context of open source
contributions (Ren et al. 2012), finding that attachment driven by ideological inclinations seems to drive
this positive response, although attachment driven by the social interaction among contributors matters to
a smaller extent.
Taken together, these results indicate that the key mechanisms at play when an open source
platform is faced with competition is that it attracts fewer new contributors than before but it receives
more contributions from pre-existing contributors who are driven by their ideological attachment to the
platform to increase their contributions in order to preserve it. In the context of OpenStreetMap, the
increase of contributions by pre-existing contributors does not compensate for the decrease in new
contributors and their average contributions, resulting in an overall negative effect.
We add to the research on what motivates individuals to contribute to open source platforms by
looking beyond intra-community determinants of contributions, focusing instead on the role of ecological
factors. Our findings illustrate the substantial effect of competition, perhaps the most prominent
ecological factor, on people’s tendency to become contributors and to contribute. Further, by studying
competition and the mechanisms through which it affects contributions, we also answer the call to look
beyond the micro-factors that shape individual motivation and start examining how individual motivation
is enhanced or dampened by macro-factors (von Krogh et al. 2012). Our finding that competition has a
heterogeneous effect—reducing the number of new contributors and their contributions while increasing
contributions from pre-existing contributors—points to the intricate relationship between the
macro-environment and people’s motivation to contribute to open source.
We also contribute by helping to develop a better understanding of the competition between open
source platforms and commercial competition following the call by Lerner and Tirole (2002, 2005).
While prior work has provided a rich qualitative account (Gaudeul 2007) and developed formal theory
(Baake and Wichman 2003; Bitzer and Schröder 2006; Casadesus-Masanell and Ghemawat 2006; Athey
and Ellison 2014), our study is to the best of our knowledge the first that provides systematic large-scale
empirical evidence on the effect of commercial competition on open source alternatives. Our findings
demonstrate that commercial competition can have a substantial negative effect on open source platforms,
rendering them less viable. The difference in response by new and pre-existing contributors illustrates that
external competition can change the internal composition of the open source community as engagement
from pre-existing contributors increases while engagement from new contributors decreases.
Theoretical Background
Contributions from unpaid volunteers are the lifeblood of open source platforms. Research into
what motivates people to contribute focuses largely on individual- and community-level factors (Butler
2001; Lakhani and Wolf 2005, Gallus 2017; von Hippel 2017). This research largely focuses on the level
of the contributing individuals and their peers. Given the breadth of that literature, rather than summarize
the entirety of this work, we focus on aspects we consider to be directly relevant to understand the effect
competition may have. Research in this domain examines the process of how people start to contribute.
Kane and Ransbotham (2016) and Gorbatai (2014) find that the process typically begins with people who
use the open source platform themselves and then contribute when they identify a need or potential to
improve the platform (e.g., they encounter a bug or missing information). Subsequent research finds that
people continue to contribute because they become attached to the platform (Ren et al. 2012; Bateman,
Gray, and Butler 2011). Contributors form bonds with their peers and enjoy interacting with them (Zhang
and Zhu 2010; Shriver, Nair, and Hofstetter 2013). They also tend to adopt the ideology of open
source—that knowledge should be freely distributed and accessible to everyone—and this becomes an
important motivator (Shah 2006). That ideology is fundamentally distinct from commercial platforms,
and the difference between them is a source of contributors’ motivation to contribute to open source
(Stewart and Gosain, 2006).
While this rich body of research has examined in great detail individual-level factors and
individuals' immediate environment, there has been little research on how ecological factors affect
people’s motivation to contribute. As Hill and Shaw (2019) state, “Established approaches to the
comparative study of online community success have almost exclusively looked inside communities”
(emphasis added). As a result, we know little about whether and how macro-factors enable or constrain
these micro-factors (von Krogh et al. 2012). We address this lacuna by focusing on perhaps one of the
most salient of environmental factors that affects organizations, namely whether it exists in isolation or
whether it faces competition from a similar alternative. Specifically, we focus on whether an open source
platform faces competition from a commercial alternative. While there has been a wide-ranging debate on
how open source and commercial platforms compare to one another (e.g., Almirall and
Casadesus-Masanell 2010; Greenstein and Zhu 2014; Giles 2005), there has been little research on how
the two types of platforms affect one another. Understanding the effect of commercial competition on
contributions is important because it allows us to better understand how ecological factors shape the
development of open source platforms and thus helps us to predict and to understand when open source
platforms are likely to thrive, prevail, or fail.
We are not the first to point out the need to study competition. Lerner and Tirole (2005, 107)
write, “While the relative merits of open source and proprietary software are discussed in a number of
contributions, direct competition between the two paradigms has received little attention.” The few
studies in this area are largely theoretical, do not focus directly on competition and even when they do,
how competition affects contributions is an assumption of the model, not a result. For instance, Baake and
Wichman (2003) model the competition between two commercial software firms when one firm makes
part of the software open source. They assume that open sourcing a part of the commercial software will
reduce development costs by attracting volunteers while competition raises coding expenditures due to
increased demand for coders. They assume competition has no effect on encouraging or discouraging
volunteers. Athey and Ellison (2014) use a formal model to examine the dynamics of an open source
project, assuming that a commercial competitor offers an “outside option” and lowers the supply of
volunteers to the open source project. Gaudeul (2007) qualitatively studies the dynamics of the open
source software (LA)TEX, focusing on how competition changes the internal dynamics of contributor
activity and the type of contribution. Taken together, the few theoretical attempts in this area rely on
different and sometimes contradictory assumptions about how competition shifts contribution activity. An
empirical examination of whether and how competition affects contributions has the potential to
discipline existing theory and inspire an integrated and generalizable theoretical framework for the role of
competition in shaping open source contributions.
The lack of prior research makes it difficult to deduct clear hypotheses on the effect of
commercial competition on open source contributions. The literature studying the motivation to contribute
to open source has not studied the effect of commercial competition, and the literature on paradigmatic
competition has not studied the effect of competition on the motivation of voluntary contributors. In other
words, the linkage between macro-competition and micro-motivation has been neglected. While prior
research does not allow for a clear theoretical prediction on the effect of competition, it does allow us to
speculate about the effect that commercial competition may have on contributions to open source
platforms. We build on the rich body of work on the motivation to contribute (Butler 2001, Lakhani and
Wolf, 2005, Gallus 2017), and focus on theoretical mechanisms we consider to be directly relevant to
understand the effect competition may have.
It seems plausible that commercial competition results in a decrease of contributions.
Commercial competition provides a substitute for the open source platform and so can be expected,
ceteris paribus, to reduce the consumption of the open source platform. Reduced consumption can be
expected to decrease contributions via two mechanisms. First, prior research suggests that consumption
often precedes contributions (Kane and Ransbotham 2016). A competition-induced reduction of
consumption would thus reduce the number of potential new contributors by reducing the number of
consumers; consumers may simply not become aware of the open source platform and the opportunity to
contribute. Second, consumption matters because contributors care about the impact their contributions
have (Lerner and Tirole 2002; Boudreau and Jeppesen 2015; Fershtman and Gandal 2007; Blasco et al.
2019). Contributors may be less motivated when a commercial competitor achieves substantial market
share because their contributions now benefit fewer people. Taken together, competition might reduce
both the pool of potential contributors and the number of contributions made by each contributor.
It is, however, also plausible that competition results in an increase in contributions. Lerner and
Tirole (2002, 228) speculate that “open source projects gain momentum when facing a battle against a
dominant firm,” although they clarify that this proposition assumes that “this is an empirical fact, which
remains to be established.” A potential mechanism why commercial competition may lead contributors to
increase their contributions is contributors' attachment to the open source platform, that is, the degree to
which contributors identify with the organization and feel a cognitive and emotional connection to it
(Paxton and Moody 2003; Hassan 2012; Ashforth and Mael 1989; Pratt 1998). Prior research suggests
that attached stakeholders increase their support when the organization to which they are attached is under
threat (Zavyavola et al. 2016). Attachment is a generally an important driver of people’s motivation to
contribute to open source (Ren et al. 2012; Bateman, Gray, and Butler 2011). It may be particularly
important after competitive entry because attached contributors are likely to be concerned that
competition may ultimately lead to the open source platform's demise. Contributors may wish to prevent
this outcome given their attachment for two different reasons. One, they might miss the social interactions
with fellow contributors that are meaningful to them (Zhang and Zhu 2010; Shriver, Nair, and Hofstetter
2013). Two, they might be concerned that dominance of a commercial platform will overshadow the open
source ideology that they subscribe to (Stewart and Gosain 2006; Murray 2010). In addition to
attachment, contributors might also increase the number of contributions they make to preserve their

standing within the community (Johnson 2002; Chen et al. 2010). Regardless of which of these factors is
at play, contributors might be concerned about the demise of their platform and may thus increase their
contributions in order to help the open source platform thrive.
Finally, while we have outlined the reasons for a competition-induced increase or decrease, it is
of course also plausible that competition has no effect on contributions. Research has long documented
that contributors to open source projects are intrinsically motivated through factors such as enjoyment and
intellectual satisfaction (Lakhani and Wolf 2005). For example, in a survey of contributors to user
innovation projects, von Hippel (2017, p.29) documents that more than 55% of participants are motivated
to contribute for “fun and learning.” Contributors might therefore be largely unaware or unconcerned
about the external competitive environment, which would lead to the finding that competition has a
limited role to play in explaining contributions to open source projects.
Given that a decrease, an increase, or no effect on contributions all seem equally plausible a
priori, it is difficult to speculate from prior theory about the potential effect of commercial competition on
contributions. Therefore, to make progress on this question, we adopt an empirical approach, providing
the first quantitative examination of the impact of commercial competition on open source contributions.
This examination helps us uncover if commercial competition does indeed influence contributions and if
so, in what direction. Our data also help us shed light on the specific mechanisms through which
commercial competition affects contributors and their contributions, setting the stage for future theory in
this area. Accordingly, we now turn to describing our setting, research design, and data.
Setting and Data
There exist hundreds of open source projects that offer alternatives to commercial counterparts in
areas as diverse as online encyclopedias, operating systems, gaming, graphic applications, networking
tools, web development tools, databases, and servers. For example, Octave is an open-source alternative
to the commercial mathematical computing platform MATLAB; MySQL provides an open-source
database alternative to Oracle9i; OpenOffice is an open-source word processing platforms that rivals
Microsoft Word; and GNU Image Manipulation Program (GIMP) provides an alternative to commercial
image editing programs such as Adobe Photoshop. In each of these examples, the open source platform
and its commercial competitor offer very similar products and therefore address the needs of a similar
customer segment. We are interested in the effects of this type of direct commercial competition on
contributions to open source platforms.
Despite the plethora of examples and significant theoretical interest in the question of competition
between commercial and open source platforms, quantitative empirical work has yet to examine this
topic. An ideal experiment would consider a set of comparable open source communities and identify
random variation in competitive entry to examine the causal impact of competition on open source
contributions. However, in reality open source platforms are not directly comparable; there are too many
variables to make such a comparison valid. One cannot compare contributions to OpenOffice after
Microsoft Word enters to contributions on Wikipedia after Encyclopedia Britannica enters given the stark
differences in the nature of contributions and the types of contributors to these two communities.
Furthermore, competition may be endogenous: commercial providers might enter precisely where open
source communities have few contributions, and therefore it is unclear if lower contributions are caused
by competition or whether competitive pressures are realized in the face of lower contributions.
We devise a research design that tackles these challenges. Our key insight is to consider relatively
distinct contributor communities within a single open source project and then examine the effects of
exogenous variation in competition within a project but across communities. Specifically, we examine the
response of contributors to country-based OpenStreetMap open source communities to the competitive
entry of Google Maps in countries around the world. The entry of Google Maps provides a valid construct
for examining the role of competition given that Google Maps and OpenStreetMap offer virtually the
same functionality and target the same set of use cases, i.e. looking up directions and places on a global
web map. Before Google Maps' entry, OpenStreetMap was usually the only online map provider in a
country. After Google Maps entered, OpenStreetMap faced direct competition from a stronger and
better-known rival. Importantly, as we will show, the variation in the exposure to competition is likely to
be unrelated to the strength of contributor communities in different countries, making this a useful
research design to tease out the effect of competition on contributions. Finally, this case is of substantial
interest in itself, given that OpenStreetMap and Google Maps represent the two leading platforms in the
web-based mapping industry and since maps have long been recognized as one of the most valuable
forms of knowledge (Harley et al. 1987; Nagaraj 2018; Nagaraj and Stern 2020). In what follows, we
provide a brief overview of the two mapping platforms and describe our research design and data.
The Open Source and Commercial Competitors
OpenStreetMap was launched in 2004. Inspired by Wikipedia, it aims to provide an open source,
online map for the entire globe (Coast 2015). At its core, OpenStreetMap is a database of geographic
information that can be modified by any community member after a free and simple registration process
(Coast 2015). Even though it is a non-commercial project, it is steeped in its own forms of legal
restrictions and contracts—such as the requirement to publish openly any derivative work. Figure 1
provides an overview of the editing process, showing how a member can add a building or a street to an
existing map. To collect information, community members often survey neighborhoods with GPS devices
or trace features from satellite images. As of February 2020, OpenStreetMap had over six million
registered community members around the world. To focus our research on countries where Google 2
Maps competition is plausibly exogenous, our main analysis uses 89,000 contributors in 87 countries
mainly from the developing world. In some robustness analyses we do include data from a wider set of
160 countries.
[Insert Figure 1 Here]
OpenStreetMap's main competitor is Google Maps, a rival web-based mapping service launched
2 https://wiki.openstreetmap.org/wiki/Stats
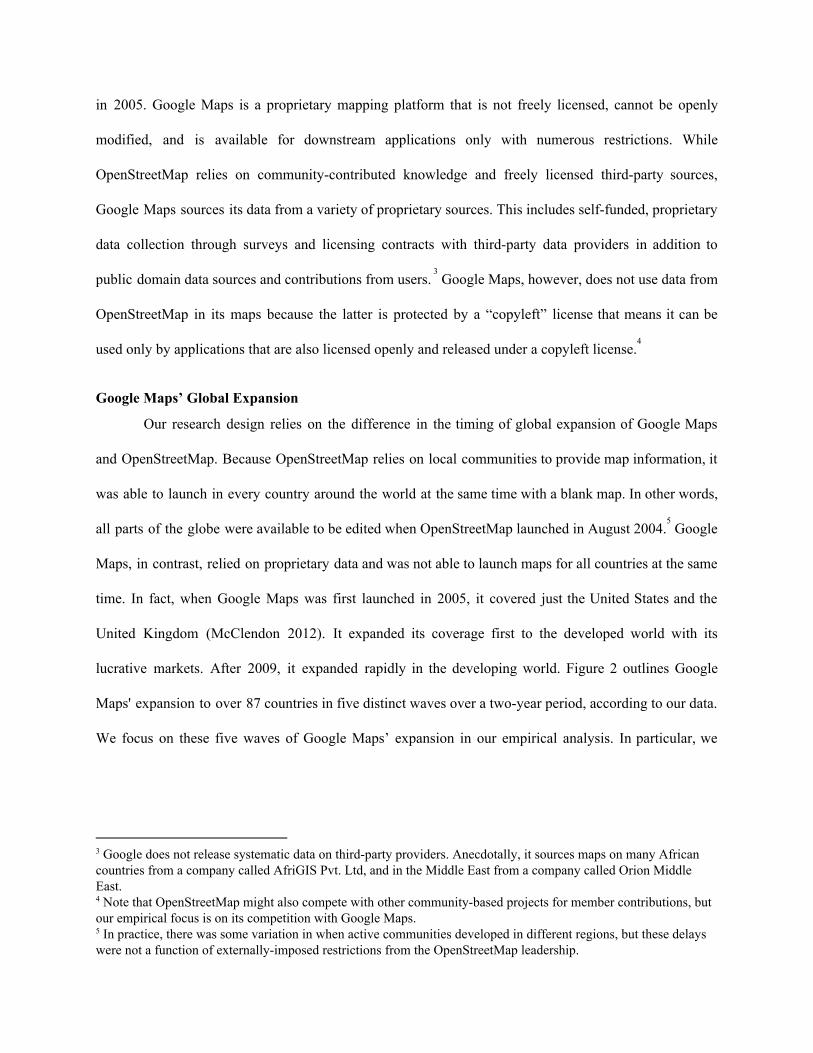
in 2005. Google Maps is a proprietary mapping platform that is not freely licensed, cannot be openly
modified, and is available for downstream applications only with numerous restrictions. While
OpenStreetMap relies on community-contributed knowledge and freely licensed third-party sources,
Google Maps sources its data from a variety of proprietary sources. This includes self-funded, proprietary
data collection through surveys and licensing contracts with third-party data providers in addition to
public domain data sources and contributions from users. Google Maps, however, does not use data from 3
OpenStreetMap in its maps because the latter is protected by a “copyleft” license that means it can be
used only by applications that are also licensed openly and released under a copyleft license. 4
Google Maps’ Global Expansion
Our research design relies on the difference in the timing of global expansion of Google Maps
and OpenStreetMap. Because OpenStreetMap relies on local communities to provide map information, it
was able to launch in every country around the world at the same time with a blank map. In other words,
all parts of the globe were available to be edited when OpenStreetMap launched in August 2004. Google 5
Maps, in contrast, relied on proprietary data and was not able to launch maps for all countries at the same
time. In fact, when Google Maps was first launched in 2005, it covered just the United States and the
United Kingdom (McClendon 2012). It expanded its coverage first to the developed world with its
lucrative markets. After 2009, it expanded rapidly in the developing world. Figure 2 outlines Google
Maps' expansion to over 87 countries in five distinct waves over a two-year period, according to our data.
We focus on these five waves of Google Maps’ expansion in our empirical analysis. In particular, we
3 Google does not release systematic data on third-party providers. Anecdotally, it sources maps on many African countries from a company called AfriGIS Pvt. Ltd, and in the Middle East from a company called Orion Middle East. 4 Note that OpenStreetMap might also compete with other community-based projects for member contributions, but our empirical focus is on its competition with Google Maps. 5 In practice, there was some variation in when active communities developed in different regions, but these delays were not a function of externally-imposed restrictions from the OpenStreetMap leadership.
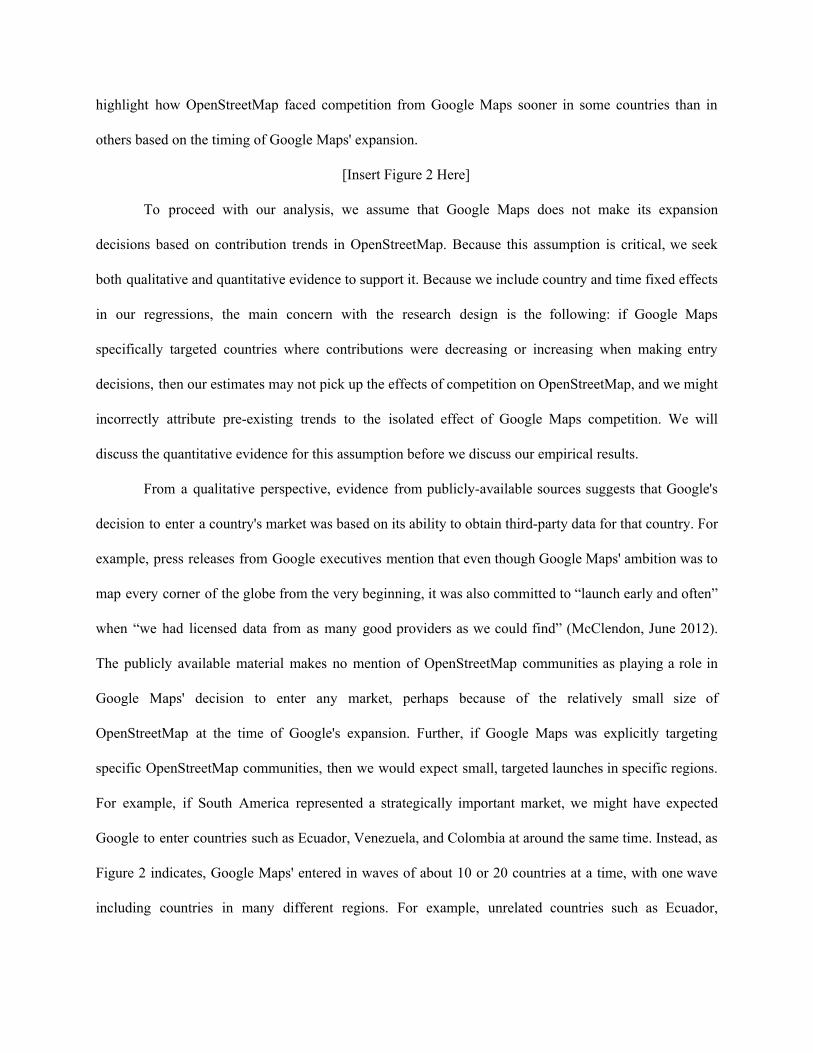
highlight how OpenStreetMap faced competition from Google Maps sooner in some countries than in
others based on the timing of Google Maps' expansion.
[Insert Figure 2 Here]
To proceed with our analysis, we assume that Google Maps does not make its expansion
decisions based on contribution trends in OpenStreetMap. Because this assumption is critical, we seek
both qualitative and quantitative evidence to support it. Because we include country and time fixed effects
in our regressions, the main concern with the research design is the following: if Google Maps
specifically targeted countries where contributions were decreasing or increasing when making entry
decisions, then our estimates may not pick up the effects of competition on OpenStreetMap, and we might
incorrectly attribute pre-existing trends to the isolated effect of Google Maps competition. We will
discuss the quantitative evidence for this assumption before we discuss our empirical results.
From a qualitative perspective, evidence from publicly-available sources suggests that Google's
decision to enter a country's market was based on its ability to obtain third-party data for that country. For
example, press releases from Google executives mention that even though Google Maps' ambition was to
map every corner of the globe from the very beginning, it was also committed to “launch early and often”
when “we had licensed data from as many good providers as we could find” (McClendon, June 2012).
The publicly available material makes no mention of OpenStreetMap communities as playing a role in
Google Maps' decision to enter any market, perhaps because of the relatively small size of
OpenStreetMap at the time of Google's expansion. Further, if Google Maps was explicitly targeting
specific OpenStreetMap communities, then we would expect small, targeted launches in specific regions.
For example, if South America represented a strategically important market, we might have expected
Google to enter countries such as Ecuador, Venezuela, and Colombia at around the same time. Instead, as
Figure 2 indicates, Google Maps' entered in waves of about 10 or 20 countries at a time, with one wave
including countries in many different regions. For example, unrelated countries such as Ecuador,
Afghanistan, Honduras, and Saudi Arabia were all included in the fifth wave of Google Maps' expansion,
while Venezuela and Colombia were a part of the fourth wave. This is reassuring because it suggests that
Google Maps did not target specific regions at particular points in time, but launched in different
countries when it was possible to do so. The quantitative tests that we perform, which are reported in the
Results section, along with this qualitative evidence make us feel confident in using Google Maps' entry
as an exogenous shock to competition for OpenStreetMap, allowing us to estimate the quantitative impact
of competition on community members' contributions.
Data
To estimate the impact of Google Maps' entry on OpenStreetMap, we use three primary data
sources. First, we collect data on contributions to OpenStreetMap from its "changeset file," which
contains metadata on every contribution ever made to the OpenStreetMap database. Second, we collect 6
the date of Google Maps' entry in each of the countries in our dataset from the Google Maps blog. 7
Finally, we rely on demographic and economic indicator data from the World Bank as control variables as
well as to help us perform robustness checks. Our main analysis focuses on the set of 87 countries that
faced Google Maps competition in five waves between 2009 and 2011. We also run our analyses with a
larger set of 160 countries for robustness.
Our key dependent variable is the total number of contributions to OpenStreetMap at the
country-quarter level. In other words, for country i in the quarter t, we count the total number of
contributions and label this Total-Contributionsit to form our main dependent variable. In order to make a
contribution, an individual must create an account or login with their username (anonymous edits are not
permitted), make an addition or a change to the map, and then upload this change. Every time a set of new
or modified information is uploaded to OpenStreetMap, we infer that a contribution has been made. 8
6 Available at http://planet.openstreetmap.org/ 7 In practice, we code Google's Lat-Long blog announcements announcing Google's entry into different markets. 8 In OpenStreetMap parlance, we focus on changesets rather than edits as our measure of contributions.
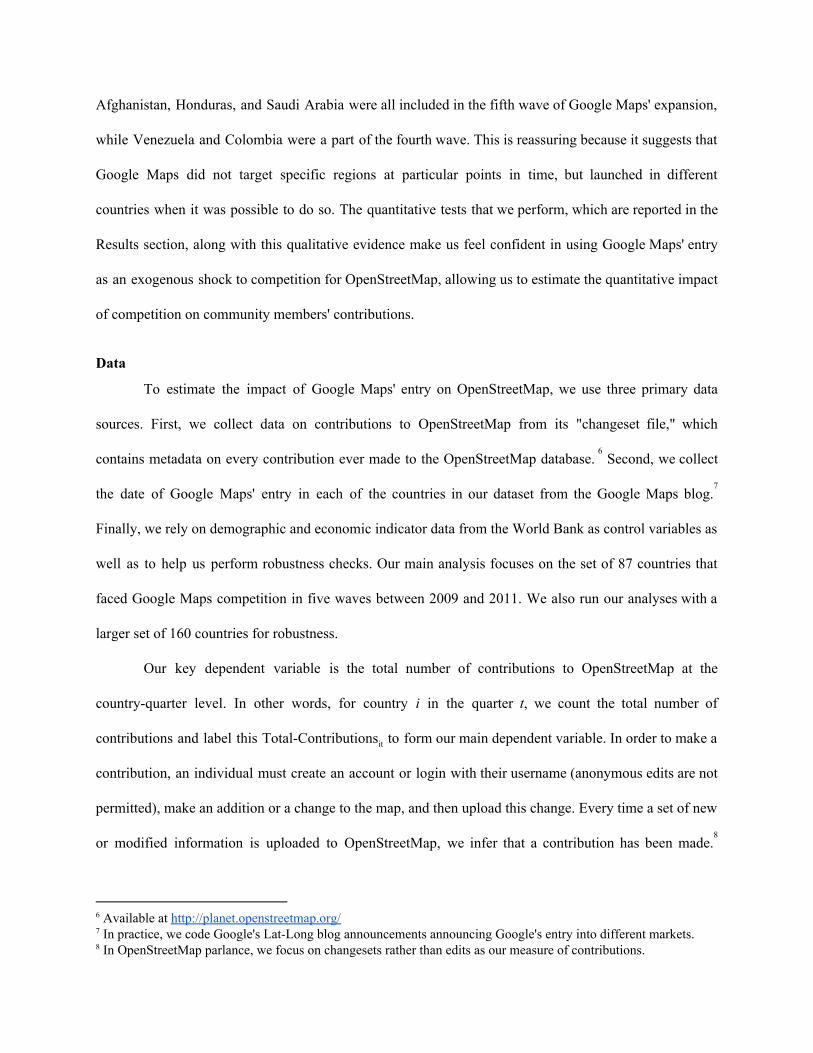
There were 2.4 million contributions made to maps of the 87 countries we study in our time period of
2006 to 2014. For each contribution, the file provides the username of the community member, the date 9
and time the change was submitted, and the average latitude and longitude of all objects added or
modified in a given contribution. We do not possess data on the nature of the contribution itself. Using the
latitude and longitude, we wrote scripts that placed each edit within a country's borders to identify the
location of each contribution. Using this location and timing information, we are able to measure the 10
total number of contributions in a given country-quarter between 2006 and 2014 and estimate the impact 11
of Google Maps entry on this key variable. Note that the contribution is the final step in a process that
might begin with a person casually browsing OpenStreetMap as a consumer, then registering for an
account and then making her first edit. We are unable to collect data on this broader “risk set”, but we
measure contributions after an account has contributed at least once.
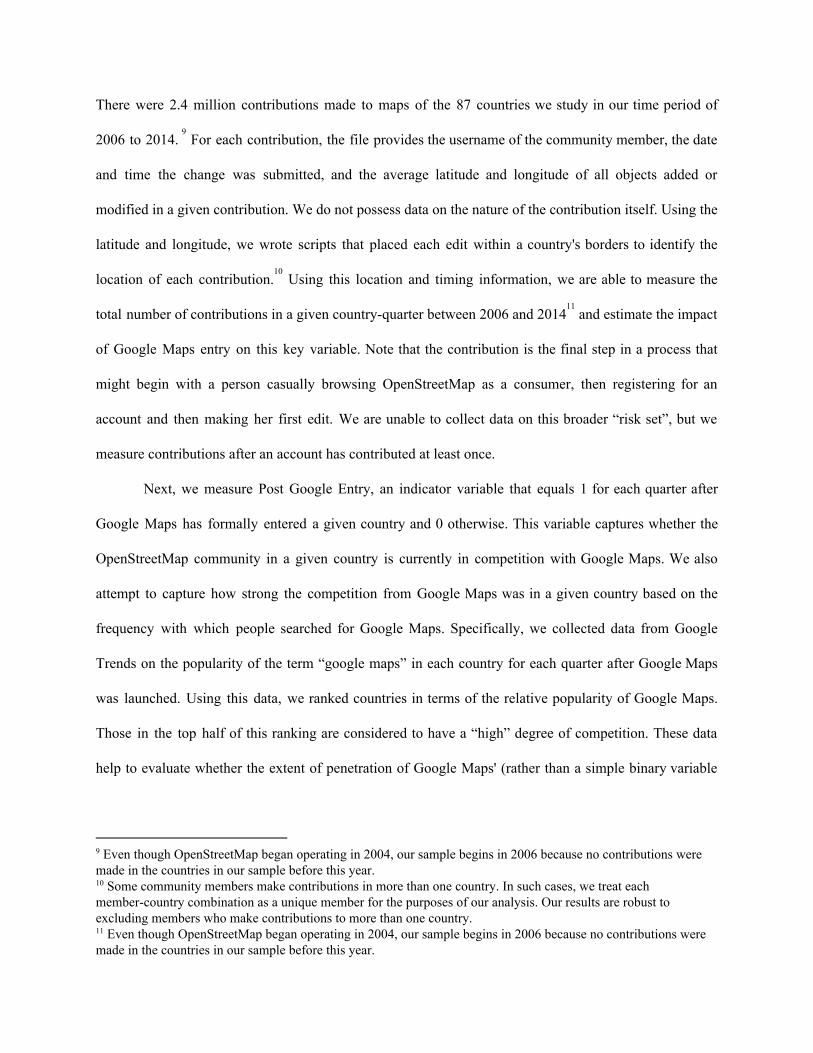
Next, we measure Post Google Entry, an indicator variable that equals 1 for each quarter after
Google Maps has formally entered a given country and 0 otherwise. This variable captures whether the
OpenStreetMap community in a given country is currently in competition with Google Maps. We also
attempt to capture how strong the competition from Google Maps was in a given country based on the
frequency with which people searched for Google Maps. Specifically, we collected data from Google
Trends on the popularity of the term “google maps” in each country for each quarter after Google Maps
was launched. Using this data, we ranked countries in terms of the relative popularity of Google Maps.
Those in the top half of this ranking are considered to have a “high” degree of competition. These data
help to evaluate whether the extent of penetration of Google Maps' (rather than a simple binary variable
9 Even though OpenStreetMap began operating in 2004, our sample begins in 2006 because no contributions were made in the countries in our sample before this year. 10 Some community members make contributions in more than one country. In such cases, we treat each member-country combination as a unique member for the purposes of our analysis. Our results are robust to excluding members who make contributions to more than one country. 11 Even though OpenStreetMap began operating in 2004, our sample begins in 2006 because no contributions were made in the countries in our sample before this year.
for the presence of competition) in a given country is related to changes in contributions on
OpenStreetMap.
We also collect a number of country-year specific variables to help us control for unobserved
variation across countries over time. While nonparametric fixed effects control for most unobserved
variation, it is possible that Google Maps' entry is determined by local economic conditions. For example,
if Google Maps enters a country when it is becoming more prosperous or more technologically advanced,
and if such conditions also make people in those countries more or less likely to contribute to
OpenStreetMap, then we might confound the effect of competition with the effect of economic or
technology changes. Fortunately we can employ detailed, county-year level data on economic indicators
as well as technology adoption to control for these factors directly. In particular, at the country-year level
we measure the population, GDP per capita, internet penetration, mobile penetration, and income class.
For these data we rely on the World Bank World Development Indicators (WDI) database. Population is
measured in millions, while GDP per capita is adjusted for purchasing-power-parity (PPP) and is
indicated in hundreds of US dollars. Internet penetration and mobile penetration are measured as internet
users per 100 inhabitants and mobile cellular subscriptions per 100 inhabitants, respectively. The income
class variable categorizes countries as high income, upper-middle income, lower-middle income, or low
income based on the country's gross national income per person.
Armed with these data, on total contributions, Google Maps entry timing and a host of control
variables we are able to estimate whether and how competition from a commercial competitor affects
open source contributions. We now turn to discussing the empirical specification and resulting estimates.
Results
Summary statistics for our variables at the country-quarter level can be found in Table 1. The
mean value of total contributions is 692.3 and the median is 79 for a given country-quarter. The mean
value of our main independent variable, Post Google Entry, is 0.6, indicating that 40% of our
country-quarter observations are pre-entry and 60% are post-entry.
[Insert Table 1 Here]
Estimation Approach
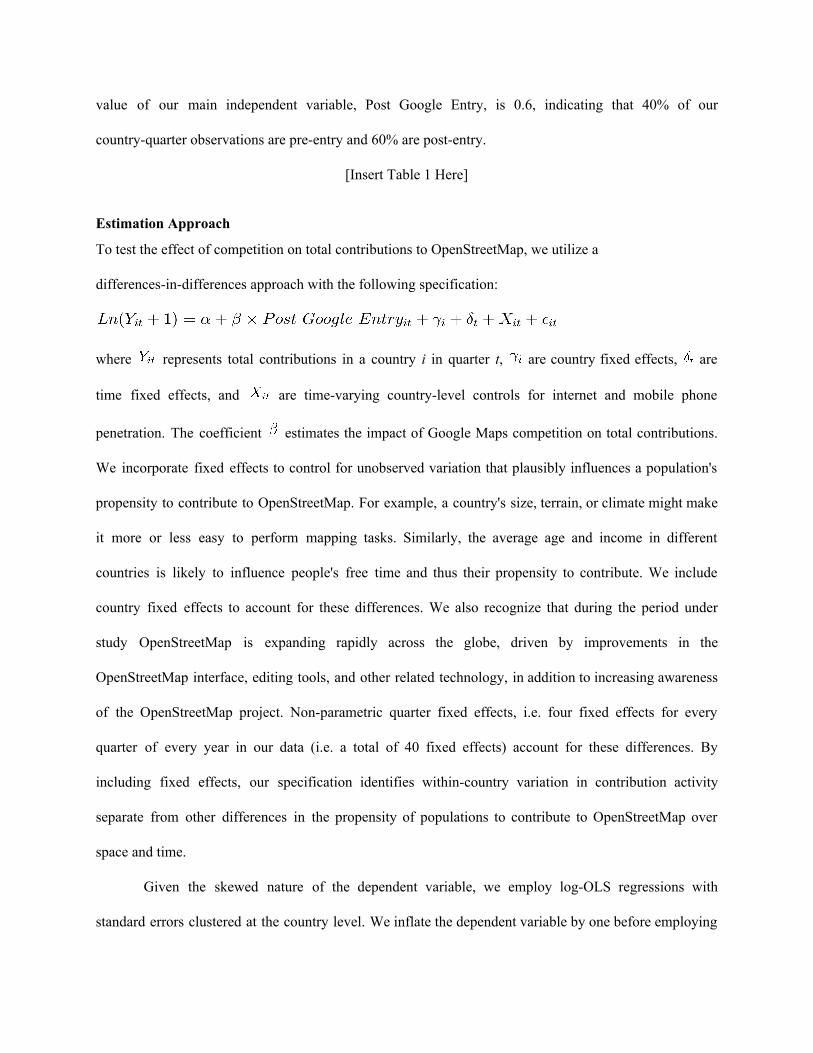
To test the effect of competition on total contributions to OpenStreetMap, we utilize a
differences-in-differences approach with the following specification:
where represents total contributions in a country i in quarter t, are country fixed effects, are
time fixed effects, and are time-varying country-level controls for internet and mobile phone
penetration. The coefficient estimates the impact of Google Maps competition on total contributions.
We incorporate fixed effects to control for unobserved variation that plausibly influences a population's
propensity to contribute to OpenStreetMap. For example, a country's size, terrain, or climate might make
it more or less easy to perform mapping tasks. Similarly, the average age and income in different
countries is likely to influence people's free time and thus their propensity to contribute. We include
country fixed effects to account for these differences. We also recognize that during the period under
study OpenStreetMap is expanding rapidly across the globe, driven by improvements in the
OpenStreetMap interface, editing tools, and other related technology, in addition to increasing awareness
of the OpenStreetMap project. Non-parametric quarter fixed effects, i.e. four fixed effects for every
quarter of every year in our data (i.e. a total of 40 fixed effects) account for these differences. By
including fixed effects, our specification identifies within-country variation in contribution activity
separate from other differences in the propensity of populations to contribute to OpenStreetMap over
space and time.
Given the skewed nature of the dependent variable, we employ log-OLS regressions with
standard errors clustered at the country level. We inflate the dependent variable by one before employing
logs. We also present robustness of these estimates to an alternate Poisson quasi-MLE specification
(Azoulay, Graff Zivin, and Wang 2010) to test the sensitivity of our analysis to specific assumptions
about the functional form.
Testing the Validity of the Research Design
Before presenting the results, it is important to confirm the validity of our difference-in-difference
research design. In particular, while we include country and quarter fixed effects, which helps to control
for a vast number of alternate explanations, there is still the concern that the timing of Google Maps' entry
is related to OpenStreetMap's evolution in a certain country. In particular, if Google Maps enters precisely
in those countries where OpenStreetMap is struggling, then our results would be driven by reverse
causality, i.e., decreased contributions are causing Google Maps to enter and not the other way around.
In addition to our qualitative discussion of this concern in the previous section, we provide here
an additional empirical test of our assumption that Google Maps' entry is uncorrelated with contribution
dynamics on OpenStreetMap. As is common in difference-in-difference studies, we estimate a model of
Google Maps' entry and examine whether we can predict entry based on OpenStreetMap contribution
patterns. In particular, we build a country-level sample and regress the timing of Google Maps' entry on a
variety of country characteristics. Results from this specification are presented in Appendix Table A1. A
negative coefficient implies that a higher value of a covariate leads to faster entry in a given country. As
shown in Column (2) it seems that Google Maps tends to enter countries with higher population and
higher internet penetration earlier and richer countries later, although only the coefficient on the internet
penetration variable is statistically significant. We then add in the variable that captures the growth in
contributions in a country before Google Maps' entry. In particular, we measure the change in the total
number of contributions in the quarter of Google Maps' entry and the first quarter when a country was
active on OpenStreetMap and divide this growth by the number of elapsed quarters to arrive at an
estimate of average quarterly growth. Including this variable in the regression shows that contribution
growth is not statistically related to the timing of Google Maps' entry, which is reassuring. It does not
seem to be the case that Google Maps' is entering precisely in the countries where OpenStreetMap
contributions are already declining.
Estimation Results
Table 2 reports results from our estimates. The first column presents a baseline specification
examining the determinants of contributions on OpenStreetMap. The strongest predictors of contributions
are country and time fixed effects, but time-varying measures of population and mobile penetration also
seem to be associated with contribution activity.
We now add in our key independent variable for competition, first without controls (Column 2)
and then with some or all controls (Columns 3 and 4). The coefficient on in all three models is negative
and statistically significant. Because these coefficients are obtained from log-OLS models, they express
the percent change in the outcome variable for one unit of change in the independent variable. Thus in
Column 3, the coefficient of -0.51 represents a decrease in contributions of about 51% in a country after it
has experienced entry from Google Maps, a significant change, after controlling for country fixed effects,
year fixed effects, GDP, population, and internet and mobile penetration.
In Column 5, we interact the Post Google Entry variable with an indicator variable for
High-Competition. Our expectation is that competition matters not only by its mere presence, but also by
the extent of penetration: i.e the degree to which Google Maps gains popularity in a given country. While
the impact of competition on contributions is negative in all specifications, the effect seems to be even
more negative when the competitive pressure from Google Maps is particularly high. However, this
interaction variable is not statistically significant, making this result only suggestive. However, if taken
seriously, this estimate suggests that it is not simply Google Maps' entry that matters, but also the extent
to which the competitor is used in a given country.
Overall, these results are striking because they offer the first quantitative evidence that
contributors to open source communities are significantly affected by the competitive environment. In
particular, it seems like competition from Google Maps has a negative effect on total contributions to
OpenStreetMap.
[Insert Table 2 Here]
Examining Pre-Trends
In order to explore the dynamics of our baseline result and provide a stronger test for the validity
of our quasi-experimental design, we examine the difference in trends between treated and
yet-to-be-treated countries before Google Maps’ entry using our baseline regression framework. If Google
Maps enters where OpenStreetMap contributions are already decreasing, we would see a negative
pre-trend before the quarter of entry. If the negative trend starts after the entry event, we can be relatively
confident that it is the competitive entry that causes a reduction in contributions and not the other way
around. Further, by estimating how and when contributions start decreasing we can understand the
dynamics of the overall negative effect of competition on contributions. Accordingly, we estimate
difference-in-difference regressions (similar to the baseline analysis), except we estimate the effect of
competition separately for every quarter before and after Google Maps' entry. separately, rather than
simply one average estimate for the Post Google Entry variable. Specifically, we estimate regressions of
the form:
where f represents the Poisson or log-OLS functional form and represents the “lag,” or the quarters
relative to a “zero quarter,” which marks the quarter when a country first faced competition from Google
Maps. The variable is therefore equal to -1 a quarter before Google Maps enters a country and is equal
to +1 the quarter after Google Maps has entered. If the parallel trends assumption is justified, we should
find estimates of where to be relatively similar, suggesting no overall trends in contribution
activity before Google Maps enters a given country. We test this proposition graphically in Figure 3. As
the chart makes clear, the pre-trends assumption seems to hold: it does not appear that contributions are
changing before OpenStreetMap faces commercial competition. This finding significantly helps to
increase confidence in the research design. Further, these results show that the negative effect of
competition kicks in immediately after Google Maps’ entry and its magnitude keeps growing over time.
Note that for all these graphical results, we employ the log-OLS functional form and we present estimates
from this specification in tabular form.
[Insert Figure 3 Here]
Robustness Checks
Alternate Specifications: In addition to our main regressions, the entry model and the graphical
analysis, we also evaluate the robustness of our specification to alternate modeling assumptions in Table 5
(Cols 1-3). In the first model, we employ a Poisson quasi-maximum likelihood specification for the count
dependent variable, i.e. number of contributions. Second, we estimate our regressions with region-specific
time trends. Specifically, we classify countries depending on the World Bank Income Classification (high
income or low/middle income) and then include separate quarterly time-trends for each of these two
income categories. This specification allows us to control for the possibility that OpenStreetMap is
evolving differently in richer countries as compared to poorer ones. As the estimates on Post Google
Entry in Columns 1 and 2 indicate, the impact of competition on overall contributions remains negative
and significant in both models.
Next, we implement a “placebo” regression to identify whether our results are driven purely by
the structure of our setup or data rather than the specific timing of Google Maps' entry. In the spirit of
Bertrand et al. (2004), we randomly assign each country to one of the five quarters in which Google Maps
entered and use this entry time to estimate a new Post Google Entryit variable that we employ in the
regression testing the baseline specification. For example, if a country experiences Google Maps entry 12
in the first quarter of 2009 (the first wave), we might randomly assign it to the fourth quarter of 2010 (the
fifth wave) and assign a country from the fifth wave to the second wave, et cetera. As shown in Column 3,
the estimates from this regression are no significantly different than zero, suggesting that our results are
not driven by mechanical artifacts of our setup or variable definitions, but are indeed driven by the
specific timing of Google Maps' entry.
Coarsened-Exact-Matching (CEM) Sample: Finally, note that our specifications so far have
looked at the variation in Google Maps' entry within the set of 87 countries in our sample. In this research
design, the counterfactual for communities that face competition in a given year t1 are communities that
will face competition in a future year t2 where t2 >t1. Note however, that our baseline sample does not
include any countries that never face competition as the counterfactual group. It has been shown that such
a design with no “never treated” units is valid in the event study context as long as the pattern of effects is
the same for all “treatment cohorts” (Abraham and Son 2020, Goodman-Bacon 2019). Another benefit of
such an approach is that it limits the analysis to a homogenous set of countries that differ only in their
timing of competition. However, as a further robustness check, we estimate our main specifications on a
parallel sample of 160 countries (79 who ever experience entry in our data and 81 control). These
countries are chosen using a coarsened-exact-matching (CEM) procedure based on a coarsened matching
of countries' GDP, population, income category, region and internet and mobile phone penetration (Iacus
et. al 2012). The one important caveat with this sample, is that we do not know for sure whether and when
Google Maps' entered the control counties. Since Google Maps is available globally as of 2019, it is quite
likely that OpenStreetMap in these countries do experience competition, but we do not possess the exact
date on which such competition might have begun. Our estimates here are therefore likely to be
conservative if some of the countries in the control sample also face competition. Acknowledging this
12 We do not implement many permutations of the placebo inference just one of the many possible combinations set using a randomly chosen seed.
caveat, we present results from this alternate sample in Table A3. The first column uses the baseline
specification with a fixed effect for every matched country pair and a quarter fixed effect. The next
column is similar except it includes an income X quarter fixed effect instead of the quarter fixed effect.
As is clear from these results, the negative effect of Google Maps' competition on total OpenStreetMap
contributions remains in this broader sample as well, although these are relatively imprecisely estimated.
Taken together, our robustness checks and the CEM sample help to establish the validity of our
baseline finding that competition has a significant and negative effect on total contribution within
OpenStreetMap.
Mechanisms Driving Changes in Contributions
Our finding that commercial competition has an important effect on contributions to
OpenStreetMap. This result provides the first empirical response to calls in past research to study the
potentially important role of commercial competition in shaping contributions to open source. More
generally, our results encourage future research looking to adopt an ecological approach to unpack the
drivers of contributions to open source platforms.
We find in our context that the entry of Google Maps has a negative effect on driving
contributions to OpenStreetMap. From a phenomenological perspective this finding has important
implications for both researchers and managers looking to understand the impact of commercial
competition on an open source competitor. For example, our research helps to explain the variance in
people’s tendency to contribute to different open source platforms and the circumstances in which open
source platforms are likely to thrive, prevail, or fail.
However, the implications for a more general theory of competition in open source platforms are
less clear. The negative effect we find could mean that theoretical mechanisms predicting a positive effect
are invalid. However, it is also plausible that, in this case, the mechanisms predicting a negative effect
outweigh the mechanisms predicting a positive effect and that both types of mechanisms have some
validity under different conditions. To build a more generalizable theory, it is important to explore the
moderators of the effect of competition in order to understand the conditions in which the negative effect
we find gets stronger or weaker. In addition to establishing the potentially important role of competition,
our setup therefore offers the opportunity to explore whether the effect of competition is homogeneous or
heterogeneous across different subgroups of contributors and set the stage for future theoretical work in
this area.
The Heterogeneous Effect of Competition: New vs. pre-existing contributors
In order to unpack the negative effect on contributions that we find, we follow the approach of
prior studies that examine how an effect varies across subgroups (e.g., Zavyalova et al. 2016). Doing so
may allow us uncover heterogeneous treatment effects and to partially isolate the mechanisms at play.
Specifically, we examine two groups of contributors. The first group of pre-existing contributors are
those who joined OpenStreetMap before 2009, when Google Maps began expanding in the 87 markets we
look at. These contributors therefore were motivated to contribute to OpenStreetMap when it was the only
online navigation tool available. The second group we look at, new contributors, are individuals who are 13
making a contribution for the first time in a specific quarter starting in 2009q1. The group of new
contributors therefore changes each quarter. This differentiation is interesting because new and
pre-existing contributors are likely to differ along various dimensions, most notably their awareness of
and their attachment to OpenStreetMap. They may thus differ in the degree to which the mechanisms we
speculated about affect them. We thus use this differentiation to learn about the different mechanisms via
which commercial competition affects contributions to open source.
We speculated that commercial competition could result in a decrease of contribution because it
constitutes a substitute and may thus reduce consumption of the open source platform. Such a
13 Note that we use contributors who were active before 2009, i.e. before Google Maps starts expanding in any country to be our sample of pre-existing contributors. Our results are not sensitive to this choice and go through if this sample was constructed based on contributors who were active before the specific data in which Google Maps enters their country.
competition-induced reduction of consumption can be expected to affect particularly contributions from
new contributors because consumption often precedes contributions. So, if competition reduces
consumption, less people start to contribute (i.e., less contributors). The commercial competition has the
effect that consumption decreases and so potential new contributors may simply never become aware of
the open source platform and the opportunity to contribute to it. We also speculated that commercial
competition could result in an increase of contributions because of the interaction between contributors’
attachment to the open source platform and commercial competition. Such an effect would only affect
pre-existing contributors because to become attached to the open source platform implies to form a
cognitive and emotional connection to the platform (Ashforth and Mael, 1989). Only pre-existing
contributors can have formed such a connection prior to Google’s entry. The suggested mechanism
underlying an increase of contributions in response to competition is thus more likely to affect
pre-existing contributors.
In order to examine whether pre-existing contributors respond differently to competition than
potential new contributors, we split the sample into contributions from pre-existing contributors and new
contributors. For the first analysis, we identify the population of 2,127 pre-existing community members
who were active in our set of 87 countries before Google Maps started expanding (i.e., before 2009) and
we record observations at the member-quarter level between 2006 and 2015. In other words, our main
dependent variable, Contributionsijt, captures the number of contributions made by contributor i in time t
in country j where contributor i must have made a contribution before 2009. In the second analysis, the
main dependent variable is Contributionsjt, which is the number of contributions in country j in quarter t
made by new contributors, i.e., those contributors whose contributions in all time periods before t equals
zero. The key question is whether these two groups respond any differently to competition.
The results from these analyses are presented in Table 3 (pre-existing contributors) and Table 4
(new contributors). In both tables, Column 1 presents estimates without a term for Google Maps’ Entry
and the following columns add in the key independent variable and controls. All models include country
and time fixed effects. Interestingly, the coefficients on all four models in Table 3 (Columns 2–5) are
positive and statistically significant. The main coefficients remain significant even when the
specifications include over 2000 fixed effects (one for each pre-existing contributor), which tends to
increase the size of the standard errors and so decreases significance. Overall, the estimates indicate 14
about a 1.8-2% increase in contributions per quarter from pre-existing contributors after the entry of
Google Maps. Collectively, across all pre-existing contributors, this translates into a sizable increase in
the total number of contributions.
Table 4 presents the results from our analysis of new contributors. This estimation uses the same
sample and research design as the baseline regression, but now we estimate the impact of Google Maps
on new member contributions instead of total contributions. We find that it is the new contributors who
have a negative response in the face of commercial competition and are driving the overall effect. Column
4, which provides estimates with all controls, suggests that commercial competition reduces contributions
from new contributors by about 55% per quarter. Put another way, if new contributors made 100
contributors in the last quarter of 2008, in the first quarter of 2009 they made only 45 contributions.
[INSERT TABLE 3 & TABLE 4 HERE]
Figure 4 presents a striking comparison of these results. In this figure, we provide a similar
analysis to the “pre-trends” analysis in Figure 3. However, we run this analysis separately for new
contributors (Panel A) and pre-existing contributors (Panel B). As Panel A makes clear, contributions
from new contributors decline each quarter after Google Maps enters, but not before. Panel B, meanwhile,
shows a rather different pattern. There, change in contributions from pre-existing contributors hovers
around 0 until Google Maps enters, and then contributions increase each quarter. Quantitative estimates
can be found in Table 6 (Columns 3–6).
14 Note that since we include fixed effects for each pre-existing contributor, we are also controlling for any country-level differences between countries.
[INSERT FIGURE 4 HERE]
Finally, in line with the robustness checks we conducted for the baseline analysis, we present
robustness to these findings as well in Table 5 (Columns 4–9) and Table A3 (Columns 4–6). These results
seem to hold for Poisson specifications, differential time trends, and a CEM matched sample, and they are
robust to the placebo exercise we conducted before. Further, our results for new member contributions is
based on the number of contributors who are making their first contribution in a given quarter. This
definition of new user is admittedly arbitrary and so in Table A2 we examine alternate definitions of new
users (those who have been active in the previous 2 quarters or the previous 6 quarters), and we find that
the negative effect on contributions remains robust. In other words, it does not matter if we measure new
contributors are those making their first contribution in a given quarter, or those who are “relatively new”
(having contributed in the last few quarters for the first time). The effect of competition on contributions
for this group is still negative.
Our findings reveal that Google Maps negatively affects OpenStreetMap’s ability to attract
contributions from potential new contributors but positively affects its ability to attract contributions from
pre-existing contributors. This is a significant finding because it suggests that theoretical mechanisms that
predict a positive response to competition and those that predict a negative response both have merit. A
general theory of the role of competition should therefore help us understand the conditions under which
one response is more likely than the other. With a view to informing such a theory, we delve deeper into
the mechanisms underlying the response of new and pre-existing contributors in response to competition.
We first evaluate the question of why new contributors might reduce contributions and then turn to the
reasons shaping pre-existing contributors’ positive response to competition. Our goal is not to provide a
complete theory of the role of competition, but to arbitrate potential channels that might be important
building blocks of such a theory.
Mechanisms Driving the Reduction in Contributions from New Contributors
We start by exploring what drives the decrease in contributions from new contributors. We
speculated earlier that a decrease in contributions could result if fewer people use the open source
platform after the entry of a competitor. This could negatively affect contributions (1) by reducing the
pool of potential new contributors because consuming often precedes contributing, or (2) by reducing the
motivation of new contributors and thus the average number of contributions per new contributor because
they perceive the impact of their contributions isn't that meaningful in the presence of a commercial
competitor. 15
To gain more insight, we decompose the negative effect of competition on new member
contributions along these two margins. We employ the baseline specification but now the main dependent
variable is either the total number of unique new contributors in a given quarter or the average number of
contributions made in that quarter by a new contributor (contributions by new contributors/new
contributors). Columns 1 and 2 in Table 7 presents estimates from this analysis. These results show that
competition reduces both the flow of new users and the average number of contributions per new user.
However, in percent terms, the effect on the number of new contributors is much larger: following
competitive entry, the number of new contributors decreases by about 30% while the number of
contributions per new user decreases by about 16%. Thus, we have suggestive evidence that both
mechanisms could be at work: the pool of potential new contributors decreases and the motivation of new
contributors declines. In the context of Google Maps, it appears that the decrease in the pool of potential
new contributors is the more important mechanism.
[INSERT TABLE 7 HERE]
15 Another possibility is that a user might register to contribute but never make a single contribution in the face of competition. However, we are not able to quantify the risk set of registered users who do not contribute since we cannot match a user to a country without data on the location of their contribution.
Another test for the role of the reduced pool for potential new contributors in explaining the
negative effect would exploit the High Competition variable we discussed before. Since greater traffic to
Google Maps will reduce the flow of consumers, and thus potential new contributors to OpenStreetMap,
we should expect that the negative effect of competition should be larger in regions experiencing a higher
degree of competition. Col (5) of Table 4 presents these estimates suggesting that the effect is more
negative in regions experiencing a higher degree of competition (although the interaction is not
significant). Overall, the results therefore suggest that reducing the pool of potential new contributors is a
relatively important channel through which competition affects contributions to open source platforms.
Mechanisms Driving the Increase in Contributions from Pre-Existing Contributions
Next, we investigate potential mechanisms driving the increase in contributions from pre-existing
contributors. Interestingly, this positive response does not change much even when competition from
Google Maps is particularly intense. In fact, as shown in Table 3, Column 5, the coefficient on the High
Competition variable is quite small and close to zero. This result suggests the level of competition from a
commercial alternative is not a factor in the mechanism leading existing contributors to increase their
contributions.
Prior work on open source platforms identifies attachment as an important source of motivation
for contributors (e.g., Shah 2006; Ren et al. 2012). Because of this attachment, pre-existing contributors
may be concerned about the demise of the platform in the face of competition (Zavyalova et al. 2016) and
so may increase their contributions in order to keep the platform alive and vibrant. As Gaudeul (2007,
250) describes in her examination of LaTeX, “Dynamism was highest when LaTeX was under the highest
threat of losing market share to its alternatives.” Our finding that pre-existing contributors increase
contributions is consistent with the argument that attached contributors are likely to increase contributions
in the face of competition.
To further investigate this mechanism we turn to past work that has investigated the sources of
contributor attachment in open source platforms (Ren et al. 2012). We focus on two factors that prior
work has found to be critical in explaining contributor attachment: ideology and social interaction. By
ideology, we refer to a strong belief in the core tenets of open source, that everyone has the opportunity to
contribute knowledge to the platform and that the resulting knowledge is made freely available (Lakhani
and Wolf 2005; Shah 2006; Stewart and Gosain 2006; Koh, Kim, Butler, and Bock 2007; Belenzon and
Schankerman 2015). Ideology may be particularly salient when the open source platform faces a
commercial competitor, which reflects a very different value system. The entrance of a commercial
competitor renders the ideological difference more salient. Contributors may be concerned that the
commercial competition leads to the demise of the open source platform, and the dominance of a
commercial ideology. The stronger the ideological motivation of contributors, the stronger their
attachment, and the stronger we therefore expect their response to be in the face of commercial
competition. This mechanism appeared to operate when the commercial company DuPont entered the
field of gene-sequencing, which made the “open” ideology more salient to members of the open source
gene-sequencing community. This community then increased their efforts aimed at defending the
scientific logic (Murray, 2010).
Another basis of attachment is the social interactions that contributors engage in with their fellow
contributors either electronically or face-to-face. Research shows that contributors often form strong
bonds with other contributors and that these bonds positively affect their motivation to contribute (Zhang
and Zhu 2010; Ren et al. 2012). While the social interaction with fellow peers generally motivates people
to contribute, it may be particularly important when the open source platform faces competition.
Contributors may be concerned that the competition might lead to the demise of the platform, and that as
a result they will lose their valued relationships to their fellow contributors. In the absence of social
interaction, competition may render the already challenging task of building the open source platform
seem insurmountable and leave contributors directionless. Thus, an attachment to the open source
platform that is anchored in social interaction may make people increase their contributions when the
platform faces competition.
It is also possible that some pre-existing contributors are affected more than others through
channels other than attachment. In particular, research suggests that contributors are motivated by their
standing and derive benefits from having a high standing in the community (Johnson 2002; Chen et al.
2010). For example, contributors of high standing may enjoy high status in the community so that other
members may defer to them and they may leverage their standing in an open source community into
career opportunities. Given that having a high standing on a platform that is in demise is likely to count
for little, contributors with high standing may increase their contributions to preserve the platform more
than other contributors.
We now turn to quantitatively examining the relative importance of attachment (through ideology
and social interaction) and standing in shaping the response of pre-existing contributors to commercial
competition. Because our analysis is based on indirectly measured variables, our tests here should be
considered preliminary and unlike our analysis so far do not have a causal interpretation. Our hope is that
these results inspire more empirically robust analyses of the mechanisms through which competition
affects contribution activity.
With that caveat, we first test the role of ideology-based attachment. We do not possess any direct
or individual level measures of the extent to which contributors might be attached to the open source
community due to its ideology. Instead, we develop two proxies at the country level that measure the
extent to which individuals contribute and consume open source. To measure contributions, first, we
count the average number of Github contributions (or “pushes”) per capita in each country. This measure
provides an indication of ideological motivations since it counts the number of times an average
individual contributes to an open source software development platform. Second, to measure open source
consumption, we measure the market share of the open source browser Mozilla Firefox in each country
relative to its commercial competitors, which may express the population's ideological commitment to
open source software even when strong, commercial alternatives are available. While our measure of
Github contributions comes from 2018, we are able to measure the relative share of Firefox in 2009, just
before Google Maps started its global expansion, providing a more contemporaneous measure of
ideological motivations.
Table 8, Columns 1 and 2 report the results from the regression analysis that incorporates these
measures. We create a binary variable "High-Ideology" that we code as 1 if a contributor lives in a
country with above-median Github contributions or above-median Firefox share. As the results show,
while the coefficient on the main effect is not significant (though still positive), contributors living in
countries with a strong open source ideology have a greater positive (statistically significant) response to
competition than contributors in countries with a weaker open source ideology. Contributions increase by
2.3% when ideology is measured by Github and 1.5% when measured by the share of Firefox in the local
market. These results provide preliminary empirical evidence that ideology-based attachment may be one
important reason why pre-existing contributors increase their contributions in response to commercial
competition.
Next, we turn to evaluating the role of attachment drive by social interaction. We collect data on
the extent of social interaction in country-based OpenStreetMap communities by manually collecting
information on the presence of mailing lists, a type of online interaction, and social events, an offline
interaction, as of 2014. The existence of country-specific mailing lists is not automatic—a community
member needs to request that a new list be created—suggesting that members desire greater community
interaction. In addition to mailing lists, OpenStreetMap has a long tradition of hosting community events
called “mapping parties” to “get together to do some mapping, socialise, and chat about making a free
map of the world!” A significant portion of these events are documented in a global database that we use 16
to code whether a country has ever hosted community events. Note that we do not have accurate data on 17
the timing of when mailing lists were created or when the first mapping party was held. Instead, our data
on the presence of a mailing list and the existence of community events help us code two indicator
variables that equal zero or one depending on whether local communities are characterized by online and
offline social interaction among their contributors.
Table 8, Columns 3 and 4 report the results from the regression incorporating our measures of
social interaction. As with the results on ideology, the coefficient on the main effect is not statistically
significant (though still positive). However, contributors living in countries with a mailing list or local
events have a greater positive and significant response to competition as compared to contributors who do
not. In countries with a mailing list, contributions from pre-existing contributors increase by 2.0% while
contributions increase by 1.6% in countries with local social events.
Finally, we test the impact of a pre-existing contributor's standing, shown in Columns 5 and 6 of
Table 8. We code pre-existing contributors as having high standing if they ranked in the top five
contributors, or have made 10 or more independent contributions in a given country when Google Maps
enters. We find little support for the proposition that pre-existing contributors with a high standing in the
community respond by increasing their contributions more than other pre-existing contributors. In fact, if
anything, there is some evidence of reversion to the mean since the coefficient on this term is negative.
Further, the presence of a mailing list or an event could be seen as validating the standing of a community
member. In other words, the reason that measures of social interaction predict a positive response, is not
because of the social benefits per se, but because they reinforce the standing of key contributors. Our
results using the direct measures of standing rule out such a story. More generally, since we do not find
any variation in the response depending on the number of contributions made by pre-existing members we
16 http://wiki.openstreetmap.org/wiki/Mapping_parties 17 http://wiki.openstreetmap.org/wiki/Current_events
can also rule out the story that personal value from OpenStreetMap is driving the reaction of pre-existing
contributors since those who make the most modifications are the ones who have personalized
OpenStreetMap the most to their personal benefit.
Finally, in Table 8 column 7 we combine all three measures we have developed to evaluate which
one most strongly predicts the positive response to competition by pre-existing contributors. We measure
social interaction using the presence of a mailing list and ideology using Github contributions for this
analysis (but the results are not sensitive to the particular combination of measures that we choose).
Overall, it seems that the ideological variables have the strongest and most robust effect on the positive
response of pre-existing contributors. The coefficient on the social interaction variable is still positive but
loses significance and reduces in size to about 0.7%. As before, the coefficient on the standing variable is
still negative and not significant. Therefore, of the two drivers of attachment, it seems that ideology might
matter more in shaping pre-existing contributor's response to competition.
Given that the analysis so far should be seen as associative rather than causal, as an additional test
of our results we do one more robustness analysis using a matched sample analysis. Specifically, we
matched 512 contributors in countries that rank above-the-median in terms of ideology (as measured by
Github contributions) with 512 contributors in countries that rank below-the-median on a variety of
dimensions including: the total number of annual contributions in 2006, 2007 and 2008; the quarter when
they were exposed to Google Maps entry; the income category of the country, and the region of the world
where the country is located. Results from the matched analysis are presented in Table A4. As before, we
find that users who are in above-median countries in terms of ideology-based attachment (measured using
Github contributions in Column 1 and Firefox share in Column 2) are the ones who respond positively to
Google Maps competition. As before, this result holds even when we include variables for contributor
standing and opportunities for social interaction. This additional analysis thus provides some further
empirical evidence that ideology may be the dominant mechanism causing pre-existing contributors to
increase contributions, although this claim should be examined further in subsequent research.
[INSERT TABLE 8 HERE]
Overall, our empirical analysis provides preliminary insight into which mechanisms explain the
increase in contributions among contributors who are already attached to the community. Our analysis
suggests that an ideological attachment to open source seems to matter most while attachment for the
social interaction within communities are also important. Notably, standing in the community does not
seem to be associated with the positive response. Our finding is consistent with prior research on
competition and ideology. The detailed account by Murray (2010) shows how it may require the entrance
of a competitor who operates according to an alternative logic, to render people aware of the ideological
difference. This finding is also consistent with public statements by members of the open source
community. In an article published in the Guardian with the title “Why the world needs OpenStreetMap”,
the author Serge Wroclawski (2014), a contributor to OpenStreetMap, points out:
“Every time I tell someone about OpenStreetMap, they inevitably ask "Why not use Google Maps?" From a practical standpoint, it's a reasonable question, but ultimately this is not just a matter of practicality, but of what kind of society we want to live in. [...] no one company should have a monopoly on place”.
Discussion
In this paper we analyze the effect of commercial competition on contributions to open source
platforms by studying the effect of the competitive entry of Google Maps on contributions to
OpenStreetMap. We find competition to have a meaningful effect on contributions. In particular, the
overall effect on contributions is negative. When we analyze contributions from potential new and
pre-existing contributors separately, we find that the former decrease while the latter increase. We then
explore possible mechanisms that cause these heterogeneous effects. Our evidence suggests that
contributions from new contributors go down because competition causes consumption of OpenStreetMap
to go down, and contributors are usually consumers first. When exploring what causes the increase in
contributions by pre-existing members, our evidence suggests that open source ideology and social
interactions stemming from the platform play important roles.
Tendency to Contribute to Open Source
Our primary contribution is to look beyond the intra-community determinants of contributions to
open source by examining the role of commercial competition. We answer the call for research to go
beyond examining the micro-factors that underlie people’s tendency to contribute to open source, and to
investigate the role of macro-factors in an open source platform’s environment (Von Krogh et al. 2012;
Hill and Shaw 2019). We show how the macro-environment of an open source platform, specifically the
competition it faces, affects its contributors’ tendency to contribute. The interaction of competition
(macro) with the mechanisms driving contributors’ attachment, specifically ideological inclination
(micro) and social interaction (micro), illustrates that macro-factors affect the tendency to contribute via
micro-factors. Our finding that competition can have a negative or a positive effect points to the intricate
relationship between the macro-environment and people’s motivation to contribute to open source. Our
results thus underscore the need and promise of taking an ecological perspective.
Beyond illustrating the importance of macro-factors such as competition, these findings also
inform our understanding of micro-factors. Prior research has pointed to the important role of ideology
and social interaction (e.g., Shah, 2006, Kraut et al. 2012, Ren et al. 2012) our study suggests that they are
particularly relevant in the presence of competition. These findings also have methodological implications
for future research on micro-factors: our findings suggest that research on micro-factors should account
for macro-factors so as to avoid biased estimates. For example, if research on ideology focused
exclusively on open source platforms that face competition, it may result in biased estimates of the effect
of ideology.
Another contribution is highlighting the importance of awareness and consumption of the open
source platform in fostering contributions. While prior work has often pointed out that the number of
consumers is an important motivator because contributors care about the impact their contributions have
(e.g., Jeppesen and Frederiksen 2006; Boudreau and Jeppesen 2014), we illustrate that the more important
mechanism could be a reduction in the consumption of the platform in the face of competition. The
overall negative effect of commercial competition on contributions to open source platforms is mostly due
to the competition-induced reduction of awareness and consumption. Prior literature on the tendency to
contribute may have underrepresented this effect because researchers often study the motivation of people
who have already contributed, not of potential new contributors. Our research illustrates the need to focus
more on potential new contributors.
Competition between Open Source and Commercial
We contribute by making a foray into our understanding of the competition between open source
and commercial platforms. We answer the call for more research on competition between these two
paradigms (Lerner and Tirole 2002, 2005). Prior work on the effect of commercial competition on open
source provided rich accounts through qualitative accounts (Gaudeul 2007) or by developing formal
models (Baake and Wichman 2003; Casadesus-Masanell and Ghemawat 2006; Athey and Ellison 2014),
but fell short of providing systematic evidence on the effect of commercial competition on contributions
to open source. The evidence we provide shows that competition does have an effect on contributions.
The finding that competition does have an effect is important as it implies that it is not enough to
compare and contrast open source and commercial, but that one must examine the effect they have on one
another. This insight informs a long-lasting debate among researchers and practitioners asking whether
open source or commercial is superior (e.g., Giles 2005). The finding that the two affect one another
cautions against oversimplified answers to that question. Even if commercial platforms are found to be
superior, that superiority may in part result from how they affect open source platforms. In other words, in
the presence of commercial competition, open source may just not be able to reach its full potential.
Our study also helps to explain the contradictory assumptions about the effect of competition in
prior work. Casadesus-Masanell and Ghemawat (2006) as well as Athey and Ellison (2014) assume
competition has a negative effect, whereas Lerner and Tirole (2002, 2005) as well as Gaudeul (2007)
propose it has a positive effect. Our findings support both viewpoints. While we found in our setting
competition has a negative effect in the aggregate, our analysis across different types of contributors
showed that contributions from potential new contributors decreased while contributions from
pre-existing contributors increased. Our research explores some of the mechanisms that explain why
competition may be associated with a decrease or an increase of contributions.
Our research also illustrates how the external force of competition can change the internal
composition of a platform. Commercial competition affects from whom the open source platform receives
contributions. In our setting competition led to fewer contributions from new contributors but more
contributions from pre-existing contributors. This differential, and in our case even divergent, effect
reveals that the effect of commercial competition is contingent on the state of the open source platform. If
the open source platform already has a substantial number of pre-existing contributors, competition may
have a positive effect in aggregate.
Policy and Managerial Implications
Our study is highly relevant for actors who are dependent on or are considering building an open
source platform. It directs them to take into account factors such as the share of pre-existing contributors,
the social fabric among them, and the general ideological inclination to more accurately predict how an
open source platform may evolve in terms of future contributions. It also suggests that open source
managers may help render their platform robust against competition by fostering consumption of their
platform and sponsoring social interactions via events and mailings. Our study is also relevant for
managers of commercial platforms who must decide which markets to enter and when. Commercial
platforms could exploit our finding that open source platforms are particularly vulnerable if they still
depend on recruiting new contributors, if there is little interaction among contributors, or if the population
is not inclined towards open source. Finally, our research is also informative for managers of commercial
firms that consider leveraging open source to act upon their value chain. For example, Gambardella and
von Hippel (2019; also see Baake and Wichman 2003) develop a formal model of downstream firms
co-developing an open source platform for upstream inputs that would foster upstream competition and
lower their dependence on the proprietary upstream supplier they currently rely on. Our study illustrates
that downstream firms are likely to struggle to recruit new voluntary contributors given the commercial
competition the open source platform would face. Downstream firms would need to undertake the
development themselves. Taken together, our study informs managers operating in ecosystems that are or
could be shaped by open source platforms.
Boundary Conditions, Limitations, and Future Research
Our work is also subject to boundary conditions. We study the competition between open source
platforms and commercial alternatives using the case of OpenStreetMap versus Google Maps. We want to
be careful in generalizing from this case as there is an enormous variety among open source platforms and
commercial alternatives, thus competition may play out differently for other open source platforms. One
particularity is that Google Maps constituted a formidable competitor. At the time of the launch, Google
enjoyed a high amount of trust, which may have made people more comfortable with the commercial
alternative than they would have been had another tech giant provided it (Microsoft, for instance, enjoyed
much less trust at the time). Also, Google Maps was freely available. If Google had instead charged for
Google Maps, people may have been more eager to consume and contribute to OpenStreetMap in order to
ensure there was a free alternative. While these characteristics may bound our finding regarding the
negative effect of competition on contributions, they also make this a conservative setting in which to
examine whether competition can, under certain circumstances, have a positive effect. Further to some
extent, “competition” might mean different things in our context including sowing confusion about which
platform will reign, a loss of hope in the existing project along with the more traditional explanation of
altering outside options. In fact, competition might mean an ideological threat to pre-existing users, while
to new users it might simply be a functional substitute. We are unable to tease apart these fine grained
distinctions. Our findings on the theoretical mechanisms that cause competition to have a positive effect
are thus likely to hold broadly. Another particularity is that map-related information is of crucial
importance with widespread implications (Nagaraj 2018, Nagaraj and Stern 2020). The ideological
motivation to contribute in order to make sure that map-related information continues to be open source
even if there is a functional substitute available may be stronger than in other settings.
Our research is subject to limitations. Most notably, while our research design provides us with an
instrument to estimate the effect of competition on contributions, we lack instruments for the mechanisms
we study. For example, we do not have a quasi-random assignment of ideological inclination towards
open source. Also, our measures are only proxies (e.g., usage of open source browsers as an
operationalization of ideological inclination towards open source). Given these limitations our empirical
findings may serve as the basis of propositions that can be empirically tested by future work. For
example, we propose based on our findings that ideological inclination towards open source fosters a
stronger response to commercial competition. Future work could find a way to overcome the outlined
limitations. An ideal test would randomize ideological inclination and commercial competition.
Ideological inclination could vary among contributors due to varying exposure in ideological information
(e.g., email newsletter, participation in seminars) or may vary for historical reasons (cp. Giorcelli and
Moser, 2019). Combining such a design with a quasi-random variation in competition would allow the
outlined proposition to be tested.
Future research may also advance our understanding of competition between commercial and
open source more broadly. One promising avenue is to explore alternative dimensions and different
stakeholders. For example, future research may explore how stakeholders’ perception of open source and

commercial alternatives varies in terms of accountability and reliability. Specifically, researchers could
examine when actors choose open source or commercial platforms. There is rich anecdotal evidence—for
example, the decision by the city of Munich to adopt Linux instead of Microsoft—but to the best of our
knowledge no systematic evidence on how stakeholders perceive these alternatives and how it shapes
their choice. Future research may also explore empirically the strategies that open source and commercial
platforms deploy to compete with one another (see Sen 2007 and Sacks 2015 for formal theory). While
our study illustrates that this competition constitutes a crucial challenge for open source platforms,
commercial platform developers are also highly concerned about the competition. For example, former
Microsoft CEO Steve Ballmer states, “Non-commercial software products in general and Linux in
particular present a competitive challenge for us and our entire industry and they require our concentrated
focus and attention” (quoted in Darrow 2003). Ideally, researchers find a setting where platforms are
exposed to comparable competitive challenges but pursue divergent strategies to allow for the
examination of the antecedents and consequences of these strategies.
Overall, our paper illustrates the potentially large and hereto understudied effect that commercial
competition has on open source platforms. It is not enough to compare and contrast the performance of
these two paradigms, but rather we must understand how they are likely to affect one another. Such an
understanding is likely to help us better appreciate the dynamics of open source communities and
competitive strategy in markets with open source products. Our paper provides one small step in this
direction.
References
Abraham, Sarah, and Liyang Sun. 2020. “Estimating Dynamic Treatment Effects in Event Studies With Heterogeneous Treatment Effects.” SSRN Electronic Journal.
Almirall, Esteve, and Ramon Casadesus-Masanell. 2010. “Open versus Closed Innovation: A Model of Discovery and Divergence.” The Academy of Management Review 35 (1): 27–47.
Ashforth, Blake E., and Fred Mael. 1989. “Social Identity Theory and the Organization.” The Academy of Management Review 14 (1): 20–39.
Athey, Susan, and Glenn Ellison. 2014. “Dynamics of Open Source Movements.” Journal of Economics & Management Strategy 23 (2): 294–316.
Azoulay, P., J.S. Graff Zivin, and J. Wang. 2010. “Superstar Extinction.” The Quarterly Journal of Economics 125 (2): 549–589.
Baake, Pio, and Thorsten Wichmann. 2003. “Open Source Software, Competition and Potential Entry.” Berlecon Research Papers 005.
Bateman, Patrick J., Peter H. Gray, and Brian S. Butler. 2011. “Research Note —The Impact of Community Commitment on Participation in Online Communities.” Information Systems Research 22 (4): 841–54
Belenzon, Sharon, and Mark Schankerman. 2015. “Motivation and Sorting of Human Capital in Open Innovation.” Strategic Management Journal 36 (6): 795–820.
Bertrand, Marianne, Esther Duflo, and Sendhil Mullainathan. 2004. “How Much Should We Trust Differences-In-Differences Estimates?” The Quarterly Journal of Economics 119 (1): 249–75.
Bitzer, Jürgen, and Philipp J. H. Schröder. 2006. The Economics of Open Source Software Development. USA: Elsevier Science Inc.
Blasco, Andrea, Olivia S. Jung, Karim R. Lakhani, and Michael Menietti. 2016. “Motivating Effort in Contributing to Public Goods inside Organizations: Field Experimental Evidence.” National Bureau of Economic Research. http://www.nber.org/papers/w22189.
Boudreau, Kevin J, and Lars Bo Jeppesen. 2015. “Unpaid Crowd Complementors: The Platform Network Effect Mirage.” Strategic Management Journal 36 (12): 1761–77.
Butler, Brian S. 2001. “Membership Size, Communication Activity, and Sustainability: A Resource-Based Model of Online Social Structures.” Information Systems Research 12 (4): 346–62.
Casadesus-Masanell, Ramon, and Pankaj Ghemawat. 2006. “Dynamic Mixed Duopoly: A Model Motivated by Linux vs. Windows.” Management Science 52 (7): 1072–1084.
Coast, Steve. 2015. The Book of OSM. Charleston, USA: CreateSpace Independent Publishing Platform. Darrow, Barbara. 2003. “Ballmer Memo Cites Linux Threat, ‘Challenging’ Environment, Longhorn
Response.” CRN. June 4, 2003. https://www.crn.com/news/applications-os/18830283/ballmer-memo-cites-linux-threat-challenging-environment-longhorn-response.htm.
Fershtman, Chaim, and Neil Gandal. 2007. “Open Source Software: Motivation and Restrictive Licensing.” International Economics and Economic Policy 4 (2): 209–225.
Gallus, Jana. 2016. “Fostering Public Good Contributions with Symbolic Awards: A Large-Scale Natural Field Experiment at Wikipedia.” Management Science 63 (12): 3999–4015.
Gambardella, Alfonso, and Eric von Hippel. 2019. “Open Sourcing as a Profit-Maximizing Strategy for Downstream Firms.” Strategy Science 4 (1): 41–57.
Gaudeul, Alex. 2007. “Do Open Source Developers Respond to Competition? The LATEX Case Study.” Review of Network Economics 6 (2).
Giorcelli, Michela, and Petra Moser. 2019. “Copyrights and Creativity: Evidence from Italian Operas.” Available at SSRN 2505776.
Giles, Jim. 2005. Internet Encyclopaedias Go Head to Head. Nature Publishing Group. http://www.nature.com/nature/journal/v438/n7070/full/438900a.html.
“Goodman-Bacon - 2018 - Difference-in-Differences with Variation in Treatm.Pdf.” n.d. Accessed February 28, 2020. https://cdn.vanderbilt.edu/vu-my/wp-content/uploads/sites/2318/2019/07/29170757/ddtiming_7_29_2019.pdf.
Goodman-Bacon, Andrew. 2019. “Difference-in-Differences with Variation in Treatment Timing.” w25018. Cambridge, MA: National Bureau of Economic Research.
Gorbatai, Andreea D. 2014. “The Paradox of Novice Contributions to Collective Production: Evidence from Wikipedia.” https://papers.ssrn.com/sol3/papers.cfm?abstract_id=1949327.
Greenstein, Shane, and Frank Nagle. 2014. “Digital Dark Matter and the Economic Contribution of Apache.” Research Policy 43 (4): 623–631.
Greenstein, Shane, and Feng Zhu. 2012. “Is Wikipedia Biased?” American Economic Review 102 (3): 343–48.
Harley, John Brian, David Woodward, G. Malcolm Lewis, and Mark S. Monmonier. 1987. The History of Cartography. Vol. 1. University of Chicago Press Chicago.
Hassan, Shahidul. 2012. “Employee Attachment to Workplace: A Review of Organizational and Occupational Identification and Commitment.” International Journal of Organization Theory & Behavior 15 (3): 383–422.
Hill, Benjamin Mako, and Aaron Shaw. 2019. “Modeling the Ecological Dynamics of Online Organizations.” NSF Proposal. https://mako.cc/academic/nsf-ecology_proposal-2019.pdf.
Hippel, E. von. 1987. “Cooperation between Rivals: Informal Know-How Trading.” Research Policy 16 (6): 291–302.
Iacus, Stefano M., Gary King, and Giuseppe Porro. 2012. “Causal Inference without Balance Checking: Coarsened Exact Matching.” Political Analysis 20 (1): 1–24.
Jeppesen, Lars Bo, and Lars Frederiksen. 2006. “Why Do Users Contribute to Firm-Hosted User Communities? The Case of Computer-Controlled Music Instruments.” Organization Science 17 (1): 45–66.
Jeppesen, Lars Bo, and Karim R. Lakhani. 2010. “Marginality and Problem-Solving Effectiveness in Broadcast Search.” Organization Science 21 (5): 1016–1033.
Johnson, Justin Pappas. 2002. “Open Source Software: Private Provision of a Public Good.” Journal of Economics & Management Strategy 11 (4): 637–662.
Kane, Gerald C., and Sam Ransbotham. 2016. “Content as Community Regulator: The Recursive Relationship between Consumption and Contribution in Open Collaboration Communities.” Organization Science 27 (5): 1258–74.
Koh, Joon, Young-Gul Kim, Brian Butler, and Gee-Woo Bock. 2007. “Encouraging Participation in Virtual Communities.” Communications of the ACM 50 (2): 68–73.
Kraut, Robert E., Moira Burke, John Riedl, and Paul Resnick. 2012. “The Challenges of Dealing with Newcomers.” In Building Successful Online Communities, edited by Robert E. Kraut and Paul Resnick. The MIT Press.
Kraut, Robert E., and Paul Resnick. 2012. Building Successful Online Communities: Evidence-Based Social Design. MIT Press.
Lakhani, Karim R., and Robert G. Wolf. 2005. “Why Hackers Do What They Do: Understanding Motivation and Effort in Free/Open Source Software Projects.” In Perspectives on Free and Open Source Software, edited by Joe Feller, Brian Fitzgerald, Scott Hissam, and Karim R. Lakhani. Cambridge, MA: MIT Press.
Lerner, Josh, and Jean Tirole. 2002. “Some Simple Economics of Open Source.” Journal of Industrial Economics, no. 2: 197–234.
———. 2005. “The Economics of Technology Sharing: Open Source and Beyond.” Journal of Economic Perspectives 19 (3): 99–120.
Maher, Katherine. 2016. “Keynote Katherine Maher Wikimedia.” July 23. https://www.youtube.com/. McClendon, Brian. 2012. “The Next Dimension of Google Maps.” June 6.
https://www.youtube.com/watch?v=HMBJ2Hu0NLw&feature=youtu.be&t=430. Murray, Fiona. 2010. “The Oncomouse That Roared: Hybrid Exchange Strategies as a Source of
Distinction at the Boundary of Overlapping Institutions.” American Journal of Sociology 116 (2): 341–88.
Nagaraj, Abhishek. 2018. “The Private Impact of Public Maps—Landsat Satellite Imagery and Gold Exploration.” Working Paper.
Nagaraj, Abhishek, and Scott Stern. 2020. “The Economics of Maps.” Journal of Economic Perspectives 34 (1): 196–221.
Nagle, Frank. 2017. “Open Source Software and Firm Productivity.” Management Science. Paxton, Pamela, and James Moody. 2003. “Structure and Sentiment: Explaining Emotional Attachment to
Group.” Social Psychology Quarterly 66 (1): 34–47. Ren, Yuqing, F. Maxwell Harper, Sara Drenner, Loren G. Terveen, Sara B. Kiesler, John Riedl, and
Robert E. Kraut. 2012. “Building Member Attachment in Online Communities: Applying Theories of Group Identity and Interpersonal Bonds.” Mis Quarterly 36 (3): 841–864.
Sacks, Michael. 2015. “Competition between Open Source and Proprietary Software: Strategies for Survival.” Journal of Management Information Systems 32 (3): 268–295.
Seamans, Robert, and Feng Zhu. 2014. “Responses to Entry in Multi-Sided Markets: The Impact of Craigslist on Local Newspapers.” Management Science 60 (2): 476–493.
———. 2017. “Repositioning and Cost-Cutting: The Impact of Competition on Platform Strategies.” Strategy Science 2 (2): 83–99.
Sen, Ravi. 2007. “A Strategic Analysis of Competition between Open Source and Proprietary Software.” Journal of Management Information Systems 24 (1): 233–57.
Shah, Sonali K. 2006. “Motivation, Governance, and the Viability of Hybrid Forms in Open Source Software Development.” Management Science 52 (7): 1000–1014.
Shriver, Scott K., Harikesh S. Nair, and Reto Hofstetter. 2013. “Social Ties and User-Generated Content: Evidence from an Online Social Network.” Management Science 59 (6): 1425–43.
Stewart, Katherine J., and Sanjay Gosain. 2006. “The Impact of Ideology on Effectiveness in Open Source Software Development Teams.” MIS Quarterly, 291–314.
Von Krogh, Georg, Stefan Haefliger, Sebastian Spaeth, and Martin W. Wallin. 2012. “Carrots and Rainbows: Motivation and Social Practice in Open Source Software Development.” MIS Quarterly 36 (2): 649–676.
Wroclawski, Serge. 2014. “Why the World Needs OpenStreetMap.” The Guardian, January 14, 2014, sec. Technology. https://www.theguardian.com/technology/2014/jan/14/why-the-world-needs-openstreetmap.
Zavyalova, Anastasiya, Michael D. Pfarrer, Rhonda K. Reger, and Timothy D. Hubbard. 2016. “Reputation as a Benefit and a Burden? How Stakeholders’ Organizational Identification Affects the Role of Reputation Following a Negative Event.” Academy of Management Journal 59 (1): 253–76.
Zhang, Michael, and Feng Zhu. 2011. “Group Size and Incentives to Contribute: A Natural Experiment at Chinese Wikipedia.” American Economic Review 101 (4): 1601–15.
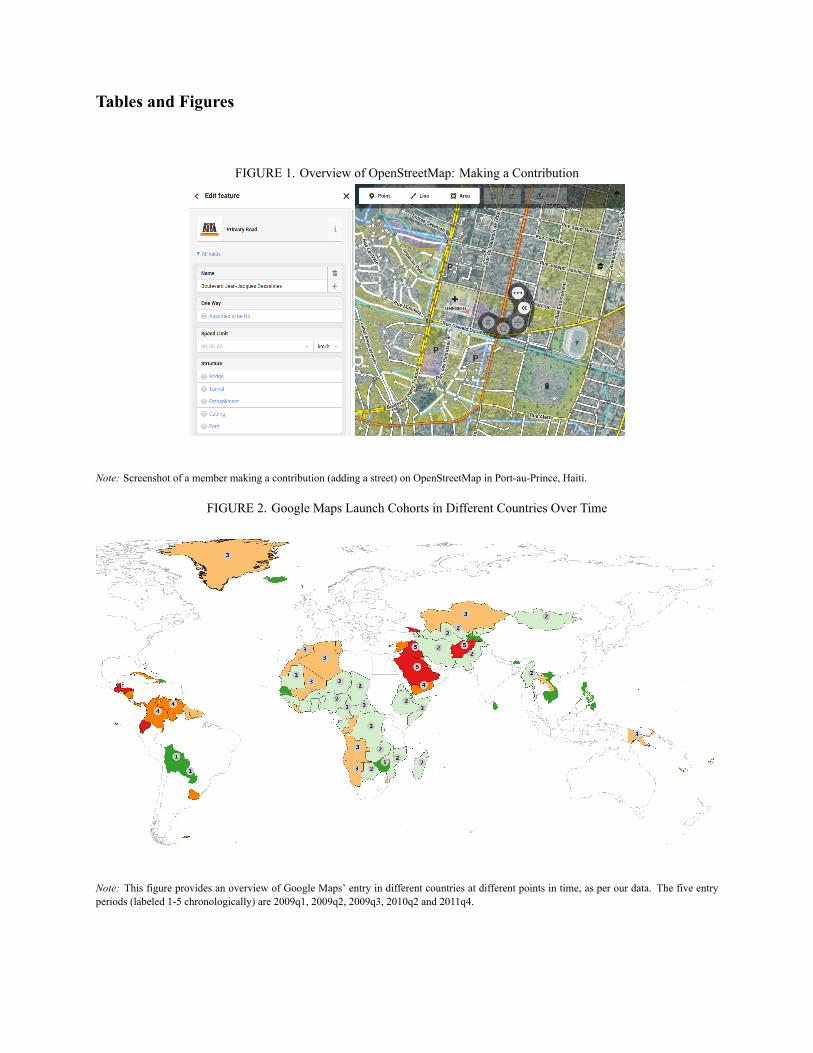
Tables and Figures
FIGURE 1. Overview of OpenStreetMap: Making a Contribution
Note: Screenshot of a member making a contribution (adding a street) on OpenStreetMap in Port-au-Prince, Haiti.
FIGURE 2. Google Maps Launch Cohorts in Different Countries Over Time
Note: This figure provides an overview of Google Maps’ entry in different countries at different points in time, as per our data. The five entryperiods (labeled 1-5 chronologically) are 2009q1, 2009q2, 2009q3, 2010q2 and 2011q4.
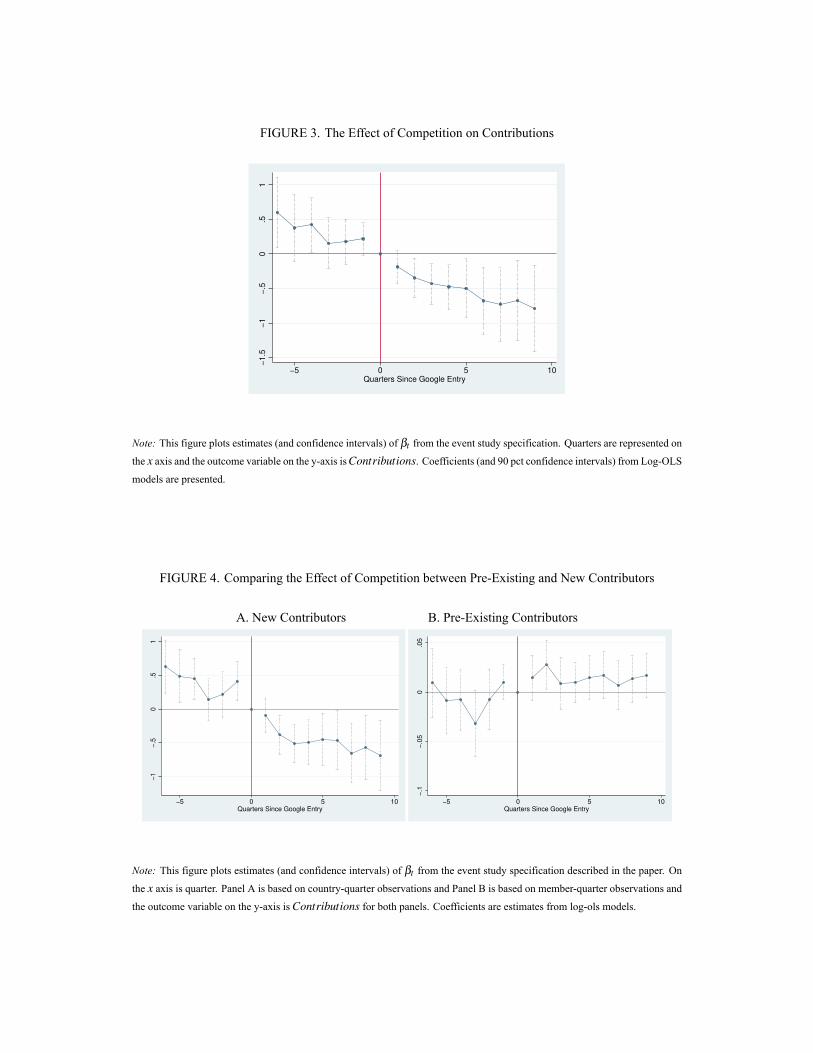
FIGURE 3. The Effect of Competition on Contributions
−1.5
−1
−.5
0.5
1
−5 0 5 10Quarters Since Google Entry
Note: This figure plots estimates (and confidence intervals) of βt from the event study specification. Quarters are represented on
the x axis and the outcome variable on the y-axis isContributions. Coefficients (and 90 pct confidence intervals) from Log-OLS
models are presented.
FIGURE 4. Comparing the Effect of Competition between Pre-Existing and New Contributors
A. New Contributors B. Pre-Existing Contributors
−1
−.5
0.5
1
−5 0 5 10Quarters Since Google Entry
−.1
−.0
50
.05
−5 0 5 10Quarters Since Google Entry
Note: This figure plots estimates (and confidence intervals) of βt from the event study specification described in the paper. On
the x axis is quarter. Panel A is based on country-quarter observations and Panel B is based on member-quarter observations and
the outcome variable on the y-axis isContributions for both panels. Coefficients are estimates from log-ols models.
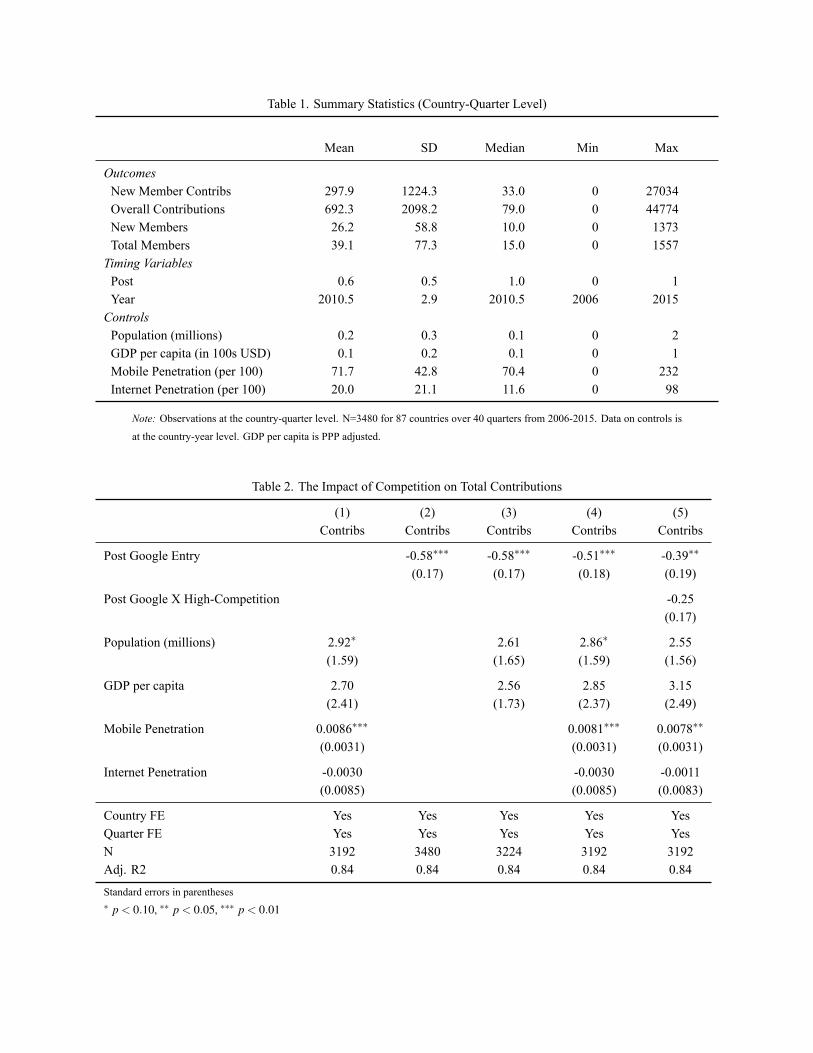
Table 1. Summary Statistics (Country-Quarter Level)
Mean SD Median Min Max
OutcomesNew Member Contribs 297.9 1224.3 33.0 0 27034Overall Contributions 692.3 2098.2 79.0 0 44774New Members 26.2 58.8 10.0 0 1373Total Members 39.1 77.3 15.0 0 1557
Timing VariablesPost 0.6 0.5 1.0 0 1Year 2010.5 2.9 2010.5 2006 2015
ControlsPopulation (millions) 0.2 0.3 0.1 0 2GDP per capita (in 100s USD) 0.1 0.2 0.1 0 1Mobile Penetration (per 100) 71.7 42.8 70.4 0 232Internet Penetration (per 100) 20.0 21.1 11.6 0 98
Note: Observations at the country-quarter level. N=3480 for 87 countries over 40 quarters from 2006-2015. Data on controls is
at the country-year level. GDP per capita is PPP adjusted.
Table 2. The Impact of Competition on Total Contributions
(1) (2) (3) (4) (5)Contribs Contribs Contribs Contribs Contribs
Post Google Entry -0.58∗∗∗ -0.58∗∗∗ -0.51∗∗∗ -0.39∗∗
(0.17) (0.17) (0.18) (0.19)
Post Google X High-Competition -0.25(0.17)
Population (millions) 2.92∗ 2.61 2.86∗ 2.55(1.59) (1.65) (1.59) (1.56)
GDP per capita 2.70 2.56 2.85 3.15(2.41) (1.73) (2.37) (2.49)
Mobile Penetration 0.0086∗∗∗ 0.0081∗∗∗ 0.0078∗∗
(0.0031) (0.0031) (0.0031)
Internet Penetration -0.0030 -0.0030 -0.0011(0.0085) (0.0085) (0.0083)
Country FE Yes Yes Yes Yes YesQuarter FE Yes Yes Yes Yes YesN 3192 3480 3224 3192 3192Adj. R2 0.84 0.84 0.84 0.84 0.84
Standard errors in parentheses∗ p < 0.10, ∗∗ p < 0.05, ∗∗∗ p < 0.01
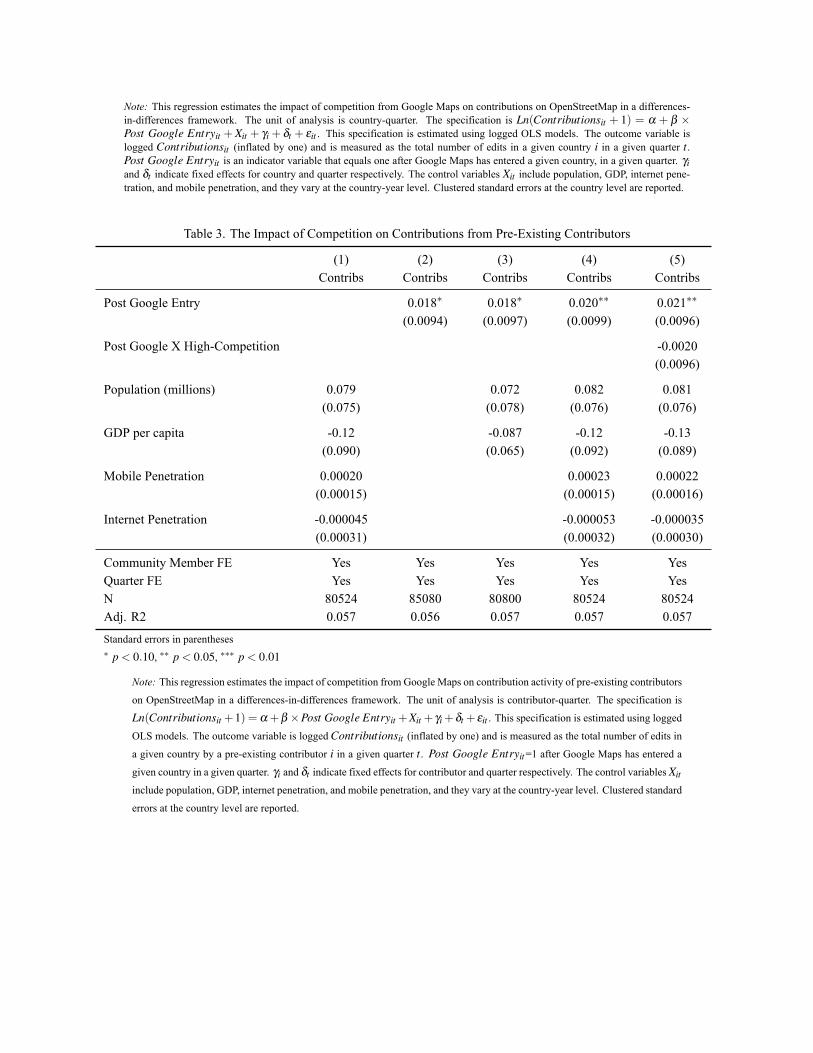
Note: This regression estimates the impact of competition from Google Maps on contributions on OpenStreetMap in a differences-in-differences framework. The unit of analysis is country-quarter. The specification is Ln(Contributionsit + 1) = α + β ×Post Google Entryit +Xit + γi + δt + εit . This specification is estimated using logged OLS models. The outcome variable islogged Contributionsit (inflated by one) and is measured as the total number of edits in a given country i in a given quarter t .Post Google Entryit is an indicator variable that equals one after Google Maps has entered a given country, in a given quarter. γiand δt indicate fixed effects for country and quarter respectively. The control variables Xit include population, GDP, internet pene-tration, and mobile penetration, and they vary at the country-year level. Clustered standard errors at the country level are reported.
Table 3. The Impact of Competition on Contributions from Pre-Existing Contributors
(1) (2) (3) (4) (5)Contribs Contribs Contribs Contribs Contribs
Post Google Entry 0.018∗ 0.018∗ 0.020∗∗ 0.021∗∗
(0.0094) (0.0097) (0.0099) (0.0096)
Post Google X High-Competition -0.0020(0.0096)
Population (millions) 0.079 0.072 0.082 0.081(0.075) (0.078) (0.076) (0.076)
GDP per capita -0.12 -0.087 -0.12 -0.13(0.090) (0.065) (0.092) (0.089)
Mobile Penetration 0.00020 0.00023 0.00022(0.00015) (0.00015) (0.00016)
Internet Penetration -0.000045 -0.000053 -0.000035(0.00031) (0.00032) (0.00030)
Community Member FE Yes Yes Yes Yes YesQuarter FE Yes Yes Yes Yes YesN 80524 85080 80800 80524 80524Adj. R2 0.057 0.056 0.057 0.057 0.057
Standard errors in parentheses∗ p < 0.10, ∗∗ p < 0.05, ∗∗∗ p < 0.01
Note: This regression estimates the impact of competition from Google Maps on contribution activity of pre-existing contributors
on OpenStreetMap in a differences-in-differences framework. The unit of analysis is contributor-quarter. The specification is
Ln(Contributionsit +1) = α +β ×Post Google Entryit +Xit + γi +δt +εit . This specification is estimated using logged
OLS models. The outcome variable is loggedContributionsit (inflated by one) and is measured as the total number of edits in
a given country by a pre-existing contributor i in a given quarter t . Post Google Entryit=1 after Google Maps has entered a
given country in a given quarter. γi and δt indicate fixed effects for contributor and quarter respectively. The control variables Xit
include population, GDP, internet penetration, and mobile penetration, and they vary at the country-year level. Clustered standard
errors at the country level are reported.
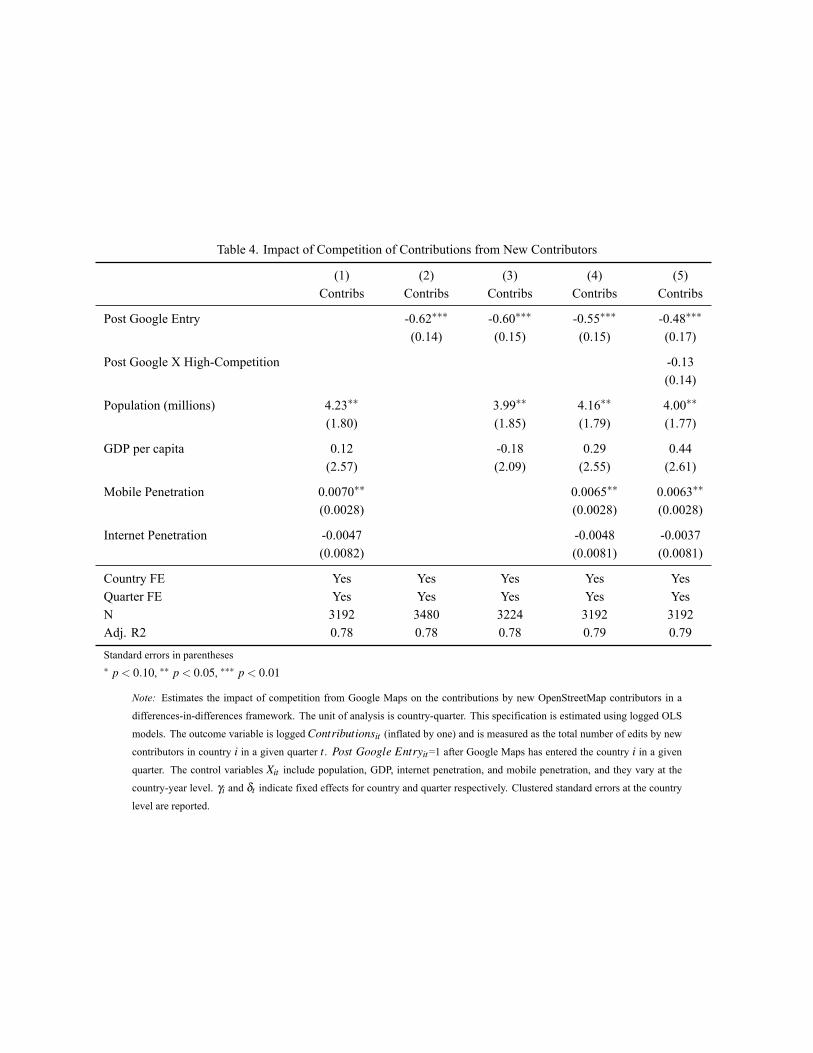
Table 4. Impact of Competition of Contributions from New Contributors
(1) (2) (3) (4) (5)Contribs Contribs Contribs Contribs Contribs
Post Google Entry -0.62∗∗∗ -0.60∗∗∗ -0.55∗∗∗ -0.48∗∗∗
(0.14) (0.15) (0.15) (0.17)
Post Google X High-Competition -0.13(0.14)
Population (millions) 4.23∗∗ 3.99∗∗ 4.16∗∗ 4.00∗∗
(1.80) (1.85) (1.79) (1.77)
GDP per capita 0.12 -0.18 0.29 0.44(2.57) (2.09) (2.55) (2.61)
Mobile Penetration 0.0070∗∗ 0.0065∗∗ 0.0063∗∗
(0.0028) (0.0028) (0.0028)
Internet Penetration -0.0047 -0.0048 -0.0037(0.0082) (0.0081) (0.0081)
Country FE Yes Yes Yes Yes YesQuarter FE Yes Yes Yes Yes YesN 3192 3480 3224 3192 3192Adj. R2 0.78 0.78 0.78 0.79 0.79
Standard errors in parentheses∗ p < 0.10, ∗∗ p < 0.05, ∗∗∗ p < 0.01
Note: Estimates the impact of competition from Google Maps on the contributions by new OpenStreetMap contributors in a
differences-in-differences framework. The unit of analysis is country-quarter. This specification is estimated using logged OLS
models. The outcome variable is loggedContributionsit (inflated by one) and is measured as the total number of edits by new
contributors in country i in a given quarter t . Post Google Entryit=1 after Google Maps has entered the country i in a given
quarter. The control variables Xit include population, GDP, internet penetration, and mobile penetration, and they vary at the
country-year level. γi and δt indicate fixed effects for country and quarter respectively. Clustered standard errors at the country
level are reported.
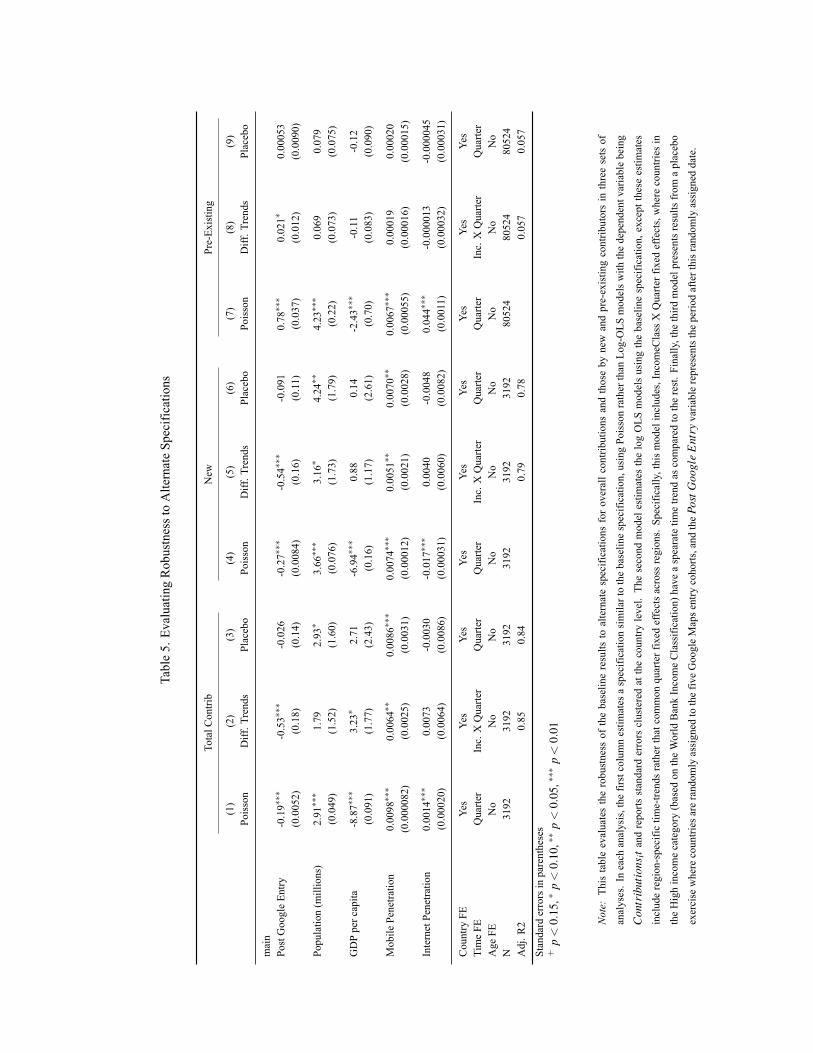
Table5.EvaluatingRobustnesstoAlternateSpecifications
TotalC
ontrib
New
Pre-Existing
(1)
(2)
(3)
(4)
(5)
(6)
(7)
(8)
(9)
Poisson
Diff.T
rends
Placebo
Poisson
Diff.T
rends
Placebo
Poisson
Diff.T
rends
Placebo
main
PostGoogleEntry
-0.19∗
∗∗-0.53∗
∗∗-0.026
-0.27∗
∗∗-0.54∗
∗∗-0.091
0.78
∗∗∗
0.021∗
0.00053
(0.0052)
(0.18)
(0.14)
(0.0084)
(0.16)
(0.11)
(0.037)
(0.012)
(0.0090)
Population(millions)
2.91
∗∗∗
1.79
2.93
∗3.66
∗∗∗
3.16
∗4.24
∗∗4.23
∗∗∗
0.069
0.079
(0.049)
(1.52)
(1.60)
(0.076)
(1.73)
(1.79)
(0.22)
(0.073)
(0.075)
GDPpercapita
-8.87∗
∗∗3.23
∗2.71
-6.94∗
∗∗0.88
0.14
-2.43∗
∗∗-0.11
-0.12
(0.091)
(1.77)
(2.43)
(0.16)
(1.17)
(2.61)
(0.70)
(0.083)
(0.090)
Mobile
Penetration
0.0098
∗∗∗
0.0064
∗∗0.0086
∗∗∗
0.0074
∗∗∗
0.0051
∗∗0.0070
∗∗0.0067
∗∗∗
0.00019
0.00020
(0.000082)
(0.0025)
(0.0031)
(0.00012)
(0.0021)
(0.0028)
(0.00055)
(0.00016)
(0.00015)
InternetPenetration
0.0014
∗∗∗
0.0073
-0.0030
-0.017
∗∗∗
0.0040
-0.0048
0.044∗
∗∗-0.000013
-0.000045
(0.00020)
(0.0064)
(0.0086)
(0.00031)
(0.0060)
(0.0082)
(0.0011)
(0.00032)
(0.00031)
CountryFE
Yes
Yes
Yes
Yes
Yes
Yes
Yes
Yes
Yes
TimeFE
Quarter
Inc.XQuarter
Quarter
Quarter
Inc.XQuarter
Quarter
Quarter
Inc.XQuarter
Quarter
Age
FENo
No
No
No
No
No
No
No
No
N3192
3192
3192
3192
3192
3192
80524
80524
80524
Adj.R
20.85
0.84
0.79
0.78
0.057
0.057
Standarderrorsinparentheses
+p<
0.15,∗
p<
0.10,∗
∗p<
0.05,∗
∗∗p<
0.01
Note:
Thistableevaluatestherobustnessof
thebaselineresults
toalternatespecifications
foroverallcontributions
andthoseby
newandpre-existingcontributorsinthreesetsof
analyses.Ineach
analysis,the
firstcolumnestim
atesaspecificationsimilartothebaselinespecification,usingPoissonratherthan
Log-OLS
modelsw
iththedependentvariablebeing
Con
trib
utio
nsitandreports
standard
errorsclusteredatthecountry
level.Thesecond
modelestim
ates
thelogOLS
modelsusingthebaselinespecification,excepttheseestim
ates
includeregion-specific
time-trendsratherthatcommon
quarterfixed
effectsacrossregions.Specifically,thismodelincludes,Incom
eClassXQuarterfixed
effects,wherecountriesin
theHighincomecategory(based
ontheWorldBankIncomeClassification)have
aspearatetim
etrend
ascomparedtotherest.F
inally,the
third
modelpresentsresults
from
aplacebo
exercisewherecountriesarerandom
lyassigned
tothefiveGoogleMapsentrycohorts,and
the
Post
Goo
gle
Ent
ryvariablerepresentstheperiodafterthisrandomlyassigned
date.
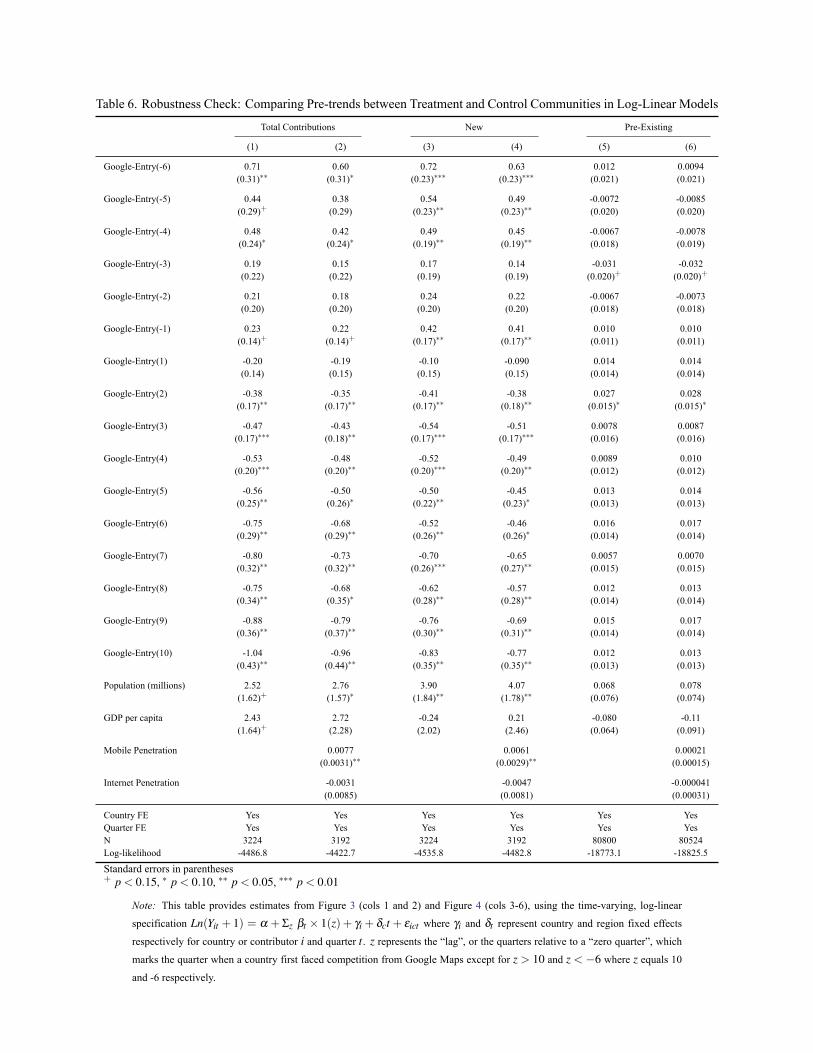
Table 6. Robustness Check: Comparing Pre-trends between Treatment and Control Communities in Log-Linear Models
Total Contributions New Pre-Existing
(1) (2) (3) (4) (5) (6)
Google-Entry(-6) 0.71 0.60 0.72 0.63 0.012 0.0094(0.31)∗∗ (0.31)∗ (0.23)∗∗∗ (0.23)∗∗∗ (0.021) (0.021)
Google-Entry(-5) 0.44 0.38 0.54 0.49 -0.0072 -0.0085(0.29)+ (0.29) (0.23)∗∗ (0.23)∗∗ (0.020) (0.020)
Google-Entry(-4) 0.48 0.42 0.49 0.45 -0.0067 -0.0078(0.24)∗ (0.24)∗ (0.19)∗∗ (0.19)∗∗ (0.018) (0.019)
Google-Entry(-3) 0.19 0.15 0.17 0.14 -0.031 -0.032(0.22) (0.22) (0.19) (0.19) (0.020)+ (0.020)+
Google-Entry(-2) 0.21 0.18 0.24 0.22 -0.0067 -0.0073(0.20) (0.20) (0.20) (0.20) (0.018) (0.018)
Google-Entry(-1) 0.23 0.22 0.42 0.41 0.010 0.010(0.14)+ (0.14)+ (0.17)∗∗ (0.17)∗∗ (0.011) (0.011)
Google-Entry(1) -0.20 -0.19 -0.10 -0.090 0.014 0.014(0.14) (0.15) (0.15) (0.15) (0.014) (0.014)
Google-Entry(2) -0.38 -0.35 -0.41 -0.38 0.027 0.028(0.17)∗∗ (0.17)∗∗ (0.17)∗∗ (0.18)∗∗ (0.015)∗ (0.015)∗
Google-Entry(3) -0.47 -0.43 -0.54 -0.51 0.0078 0.0087(0.17)∗∗∗ (0.18)∗∗ (0.17)∗∗∗ (0.17)∗∗∗ (0.016) (0.016)
Google-Entry(4) -0.53 -0.48 -0.52 -0.49 0.0089 0.010(0.20)∗∗∗ (0.20)∗∗ (0.20)∗∗∗ (0.20)∗∗ (0.012) (0.012)
Google-Entry(5) -0.56 -0.50 -0.50 -0.45 0.013 0.014(0.25)∗∗ (0.26)∗ (0.22)∗∗ (0.23)∗ (0.013) (0.013)
Google-Entry(6) -0.75 -0.68 -0.52 -0.46 0.016 0.017(0.29)∗∗ (0.29)∗∗ (0.26)∗∗ (0.26)∗ (0.014) (0.014)
Google-Entry(7) -0.80 -0.73 -0.70 -0.65 0.0057 0.0070(0.32)∗∗ (0.32)∗∗ (0.26)∗∗∗ (0.27)∗∗ (0.015) (0.015)
Google-Entry(8) -0.75 -0.68 -0.62 -0.57 0.012 0.013(0.34)∗∗ (0.35)∗ (0.28)∗∗ (0.28)∗∗ (0.014) (0.014)
Google-Entry(9) -0.88 -0.79 -0.76 -0.69 0.015 0.017(0.36)∗∗ (0.37)∗∗ (0.30)∗∗ (0.31)∗∗ (0.014) (0.014)
Google-Entry(10) -1.04 -0.96 -0.83 -0.77 0.012 0.013(0.43)∗∗ (0.44)∗∗ (0.35)∗∗ (0.35)∗∗ (0.013) (0.013)
Population (millions) 2.52 2.76 3.90 4.07 0.068 0.078(1.62)+ (1.57)∗ (1.84)∗∗ (1.78)∗∗ (0.076) (0.074)
GDP per capita 2.43 2.72 -0.24 0.21 -0.080 -0.11(1.64)+ (2.28) (2.02) (2.46) (0.064) (0.091)
Mobile Penetration 0.0077 0.0061 0.00021(0.0031)∗∗ (0.0029)∗∗ (0.00015)
Internet Penetration -0.0031 -0.0047 -0.000041(0.0085) (0.0081) (0.00031)
Country FE Yes Yes Yes Yes Yes YesQuarter FE Yes Yes Yes Yes Yes YesN 3224 3192 3224 3192 80800 80524Log-likelihood -4486.8 -4422.7 -4535.8 -4482.8 -18773.1 -18825.5
Standard errors in parentheses+ p < 0.15, ∗ p < 0.10, ∗∗ p < 0.05, ∗∗∗ p < 0.01
Note: This table provides estimates from Figure 3 (cols 1 and 2) and Figure 4 (cols 3-6), using the time-varying, log-linear
specification Ln(Yit + 1) = α + Σz βt × 1(z) + γi + δct + εict where γi and δt represent country and region fixed effects
respectively for country or contributor i and quarter t . z represents the “lag”, or the quarters relative to a “zero quarter”, which
marks the quarter when a country first faced competition from Google Maps except for z > 10 and z < −6 where z equals 10
and -6 respectively.
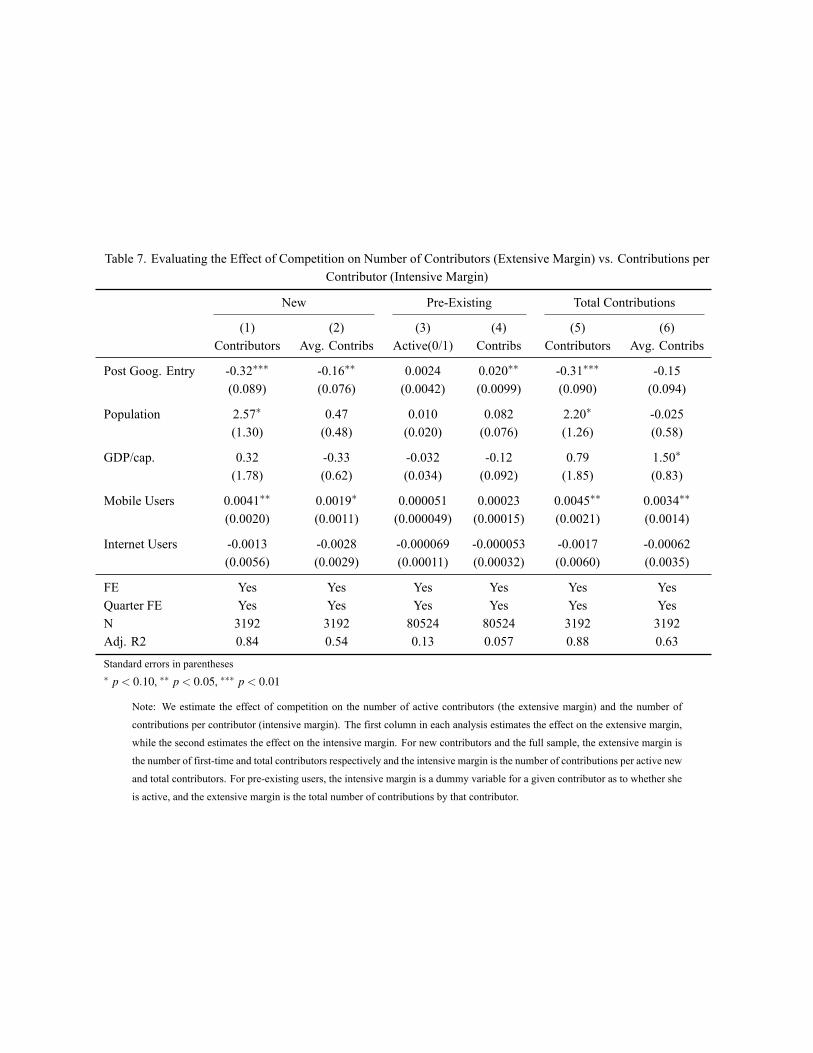
Table 7. Evaluating the Effect of Competition on Number of Contributors (Extensive Margin) vs. Contributions perContributor (Intensive Margin)
New Pre-Existing Total Contributions
(1) (2) (3) (4) (5) (6)Contributors Avg. Contribs Active(0/1) Contribs Contributors Avg. Contribs
Post Goog. Entry -0.32∗∗∗ -0.16∗∗ 0.0024 0.020∗∗ -0.31∗∗∗ -0.15(0.089) (0.076) (0.0042) (0.0099) (0.090) (0.094)
Population 2.57∗ 0.47 0.010 0.082 2.20∗ -0.025(1.30) (0.48) (0.020) (0.076) (1.26) (0.58)
GDP/cap. 0.32 -0.33 -0.032 -0.12 0.79 1.50∗
(1.78) (0.62) (0.034) (0.092) (1.85) (0.83)
Mobile Users 0.0041∗∗ 0.0019∗ 0.000051 0.00023 0.0045∗∗ 0.0034∗∗
(0.0020) (0.0011) (0.000049) (0.00015) (0.0021) (0.0014)
Internet Users -0.0013 -0.0028 -0.000069 -0.000053 -0.0017 -0.00062(0.0056) (0.0029) (0.00011) (0.00032) (0.0060) (0.0035)
FE Yes Yes Yes Yes Yes YesQuarter FE Yes Yes Yes Yes Yes YesN 3192 3192 80524 80524 3192 3192Adj. R2 0.84 0.54 0.13 0.057 0.88 0.63
Standard errors in parentheses∗ p < 0.10, ∗∗ p < 0.05, ∗∗∗ p < 0.01
Note: We estimate the effect of competition on the number of active contributors (the extensive margin) and the number of
contributions per contributor (intensive margin). The first column in each analysis estimates the effect on the extensive margin,
while the second estimates the effect on the intensive margin. For new contributors and the full sample, the extensive margin is
the number of first-time and total contributors respectively and the intensive margin is the number of contributions per active new
and total contributors. For pre-existing users, the intensive margin is a dummy variable for a given contributor as to whether she
is active, and the extensive margin is the total number of contributions by that contributor.
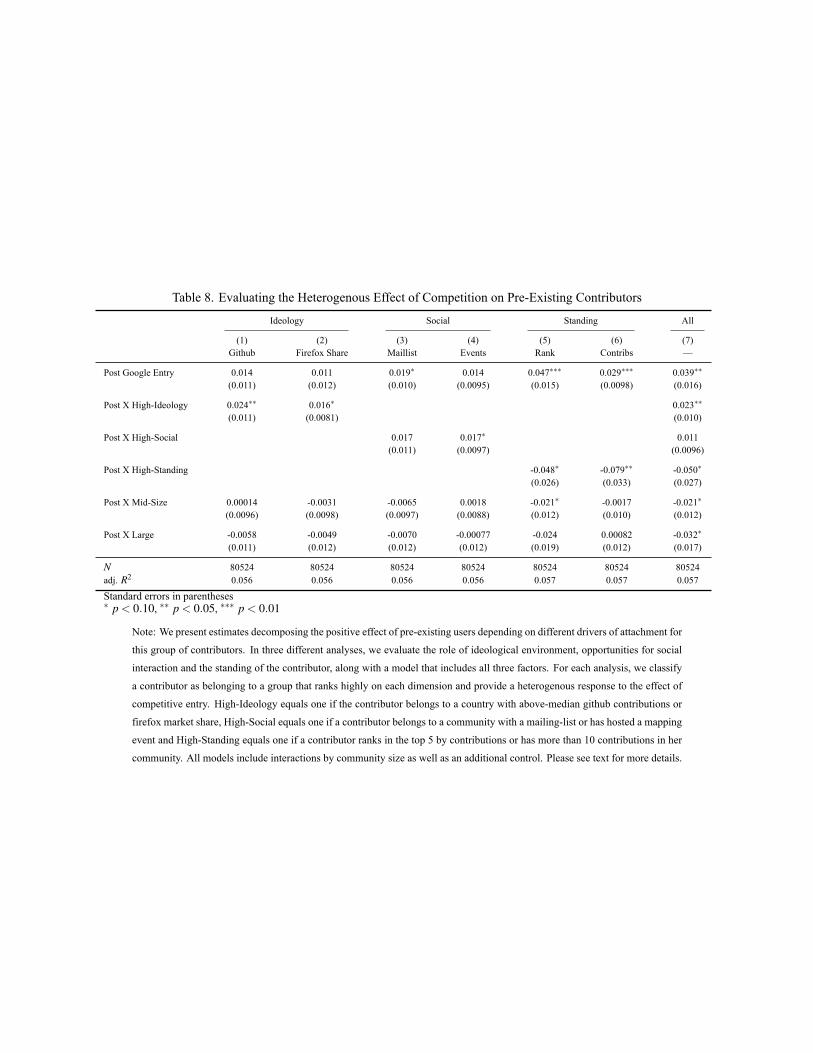
Table 8. Evaluating the Heterogenous Effect of Competition on Pre-Existing Contributors
Ideology Social Standing All
(1) (2) (3) (4) (5) (6) (7)Github Firefox Share Maillist Events Rank Contribs —
Post Google Entry 0.014 0.011 0.019∗ 0.014 0.047∗∗∗ 0.029∗∗∗ 0.039∗∗
(0.011) (0.012) (0.010) (0.0095) (0.015) (0.0098) (0.016)
Post X High-Ideology 0.024∗∗ 0.016∗ 0.023∗∗
(0.011) (0.0081) (0.010)
Post X High-Social 0.017 0.017∗ 0.011(0.011) (0.0097) (0.0096)
Post X High-Standing -0.048∗ -0.079∗∗ -0.050∗
(0.026) (0.033) (0.027)
Post X Mid-Size 0.00014 -0.0031 -0.0065 0.0018 -0.021∗ -0.0017 -0.021∗
(0.0096) (0.0098) (0.0097) (0.0088) (0.012) (0.010) (0.012)
Post X Large -0.0058 -0.0049 -0.0070 -0.00077 -0.024 0.00082 -0.032∗
(0.011) (0.012) (0.012) (0.012) (0.019) (0.012) (0.017)
N 80524 80524 80524 80524 80524 80524 80524adj. R2 0.056 0.056 0.056 0.056 0.057 0.057 0.057
Standard errors in parentheses∗ p < 0.10, ∗∗ p < 0.05, ∗∗∗ p < 0.01
Note: We present estimates decomposing the positive effect of pre-existing users depending on different drivers of attachment for
this group of contributors. In three different analyses, we evaluate the role of ideological environment, opportunities for social
interaction and the standing of the contributor, along with a model that includes all three factors. For each analysis, we classify
a contributor as belonging to a group that ranks highly on each dimension and provide a heterogenous response to the effect of
competitive entry. High-Ideology equals one if the contributor belongs to a country with above-median github contributions or
firefox market share, High-Social equals one if a contributor belongs to a community with a mailing-list or has hosted a mapping
event and High-Standing equals one if a contributor ranks in the top 5 by contributions or has more than 10 contributions in her
community. All models include interactions by community size as well as an additional control. Please see text for more details.
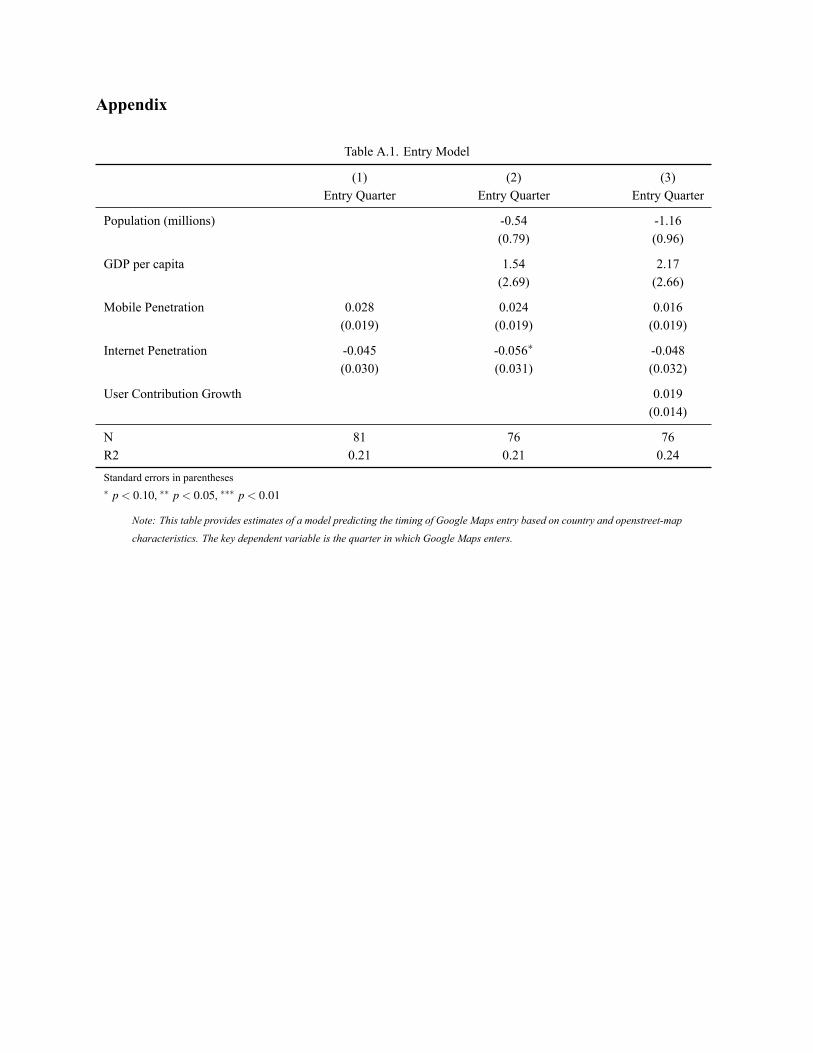
Appendix
Table A.1. Entry Model
(1) (2) (3)Entry Quarter Entry Quarter Entry Quarter
Population (millions) -0.54 -1.16(0.79) (0.96)
GDP per capita 1.54 2.17(2.69) (2.66)
Mobile Penetration 0.028 0.024 0.016(0.019) (0.019) (0.019)
Internet Penetration -0.045 -0.056∗ -0.048(0.030) (0.031) (0.032)
User Contribution Growth 0.019(0.014)
N 81 76 76R2 0.21 0.21 0.24
Standard errors in parentheses∗ p < 0.10, ∗∗ p < 0.05, ∗∗∗ p < 0.01
Note: This table provides estimates of a model predicting the timing of Google Maps entry based on country and openstreet-map
characteristics. The key dependent variable is the quarter in which Google Maps enters.
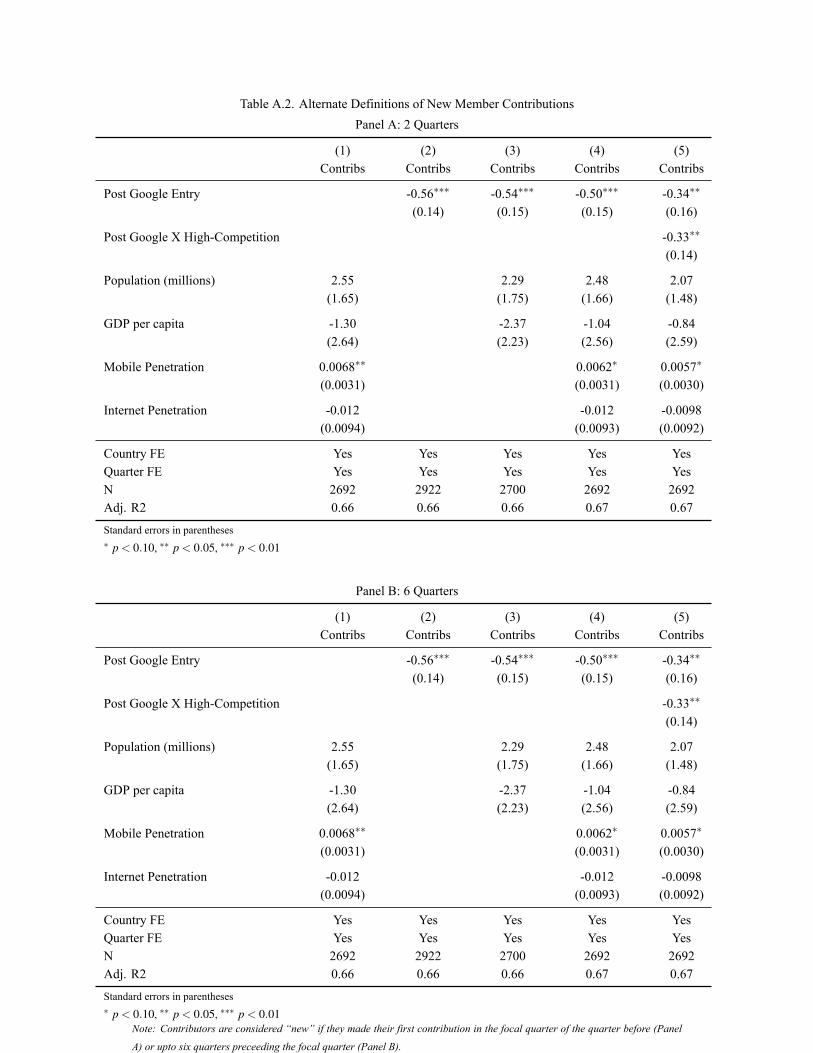
Table A.2. Alternate Definitions of New Member ContributionsPanel A: 2 Quarters
(1) (2) (3) (4) (5)Contribs Contribs Contribs Contribs Contribs
Post Google Entry -0.56∗∗∗ -0.54∗∗∗ -0.50∗∗∗ -0.34∗∗
(0.14) (0.15) (0.15) (0.16)
Post Google X High-Competition -0.33∗∗
(0.14)
Population (millions) 2.55 2.29 2.48 2.07(1.65) (1.75) (1.66) (1.48)
GDP per capita -1.30 -2.37 -1.04 -0.84(2.64) (2.23) (2.56) (2.59)
Mobile Penetration 0.0068∗∗ 0.0062∗ 0.0057∗
(0.0031) (0.0031) (0.0030)
Internet Penetration -0.012 -0.012 -0.0098(0.0094) (0.0093) (0.0092)
Country FE Yes Yes Yes Yes YesQuarter FE Yes Yes Yes Yes YesN 2692 2922 2700 2692 2692Adj. R2 0.66 0.66 0.66 0.67 0.67
Standard errors in parentheses∗ p < 0.10, ∗∗ p < 0.05, ∗∗∗ p < 0.01
Panel B: 6 Quarters
(1) (2) (3) (4) (5)Contribs Contribs Contribs Contribs Contribs
Post Google Entry -0.56∗∗∗ -0.54∗∗∗ -0.50∗∗∗ -0.34∗∗
(0.14) (0.15) (0.15) (0.16)
Post Google X High-Competition -0.33∗∗
(0.14)
Population (millions) 2.55 2.29 2.48 2.07(1.65) (1.75) (1.66) (1.48)
GDP per capita -1.30 -2.37 -1.04 -0.84(2.64) (2.23) (2.56) (2.59)
Mobile Penetration 0.0068∗∗ 0.0062∗ 0.0057∗
(0.0031) (0.0031) (0.0030)
Internet Penetration -0.012 -0.012 -0.0098(0.0094) (0.0093) (0.0092)
Country FE Yes Yes Yes Yes YesQuarter FE Yes Yes Yes Yes YesN 2692 2922 2700 2692 2692Adj. R2 0.66 0.66 0.66 0.67 0.67
Standard errors in parentheses∗ p < 0.10, ∗∗ p < 0.05, ∗∗∗ p < 0.01
Note: Contributors are considered “new” if they made their first contribution in the focal quarter of the quarter before (Panel
A) or upto six quarters preceeding the focal quarter (Panel B).
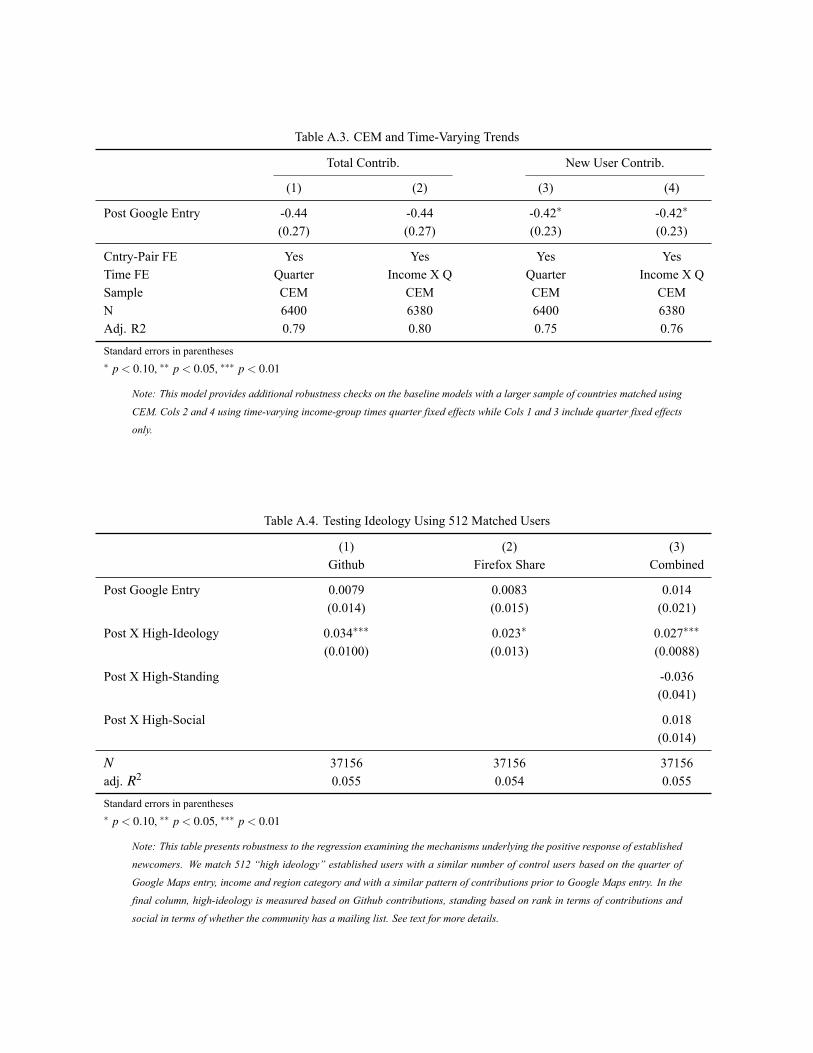
Table A.3. CEM and Time-Varying Trends
Total Contrib. New User Contrib.
(1) (2) (3) (4)
Post Google Entry -0.44 -0.44 -0.42∗ -0.42∗
(0.27) (0.27) (0.23) (0.23)
Cntry-Pair FE Yes Yes Yes YesTime FE Quarter Income X Q Quarter Income X QSample CEM CEM CEM CEMN 6400 6380 6400 6380Adj. R2 0.79 0.80 0.75 0.76
Standard errors in parentheses∗ p < 0.10, ∗∗ p < 0.05, ∗∗∗ p < 0.01
Note: This model provides additional robustness checks on the baseline models with a larger sample of countries matched using
CEM. Cols 2 and 4 using time-varying income-group times quarter fixed effects while Cols 1 and 3 include quarter fixed effects
only.
Table A.4. Testing Ideology Using 512 Matched Users
(1) (2) (3)Github Firefox Share Combined
Post Google Entry 0.0079 0.0083 0.014(0.014) (0.015) (0.021)
Post X High-Ideology 0.034∗∗∗ 0.023∗ 0.027∗∗∗
(0.0100) (0.013) (0.0088)
Post X High-Standing -0.036(0.041)
Post X High-Social 0.018(0.014)
N 37156 37156 37156adj. R2 0.055 0.054 0.055
Standard errors in parentheses∗ p < 0.10, ∗∗ p < 0.05, ∗∗∗ p < 0.01
Note: This table presents robustness to the regression examining the mechanisms underlying the positive response of established
newcomers. We match 512 “high ideology” established users with a similar number of control users based on the quarter of
Google Maps entry, income and region category and with a similar pattern of contributions prior to Google Maps entry. In the
final column, high-ideology is measured based on Github contributions, standing based on rank in terms of contributions and
social in terms of whether the community has a mailing list. See text for more details.