Embed Size (px)
Citation preview

H2EH2E http://www.h2e-http://www.h2e-
online.orgonline.org
Providing Practical Providing Practical Solutions to Today’s Solutions to Today’s
Environmental ChallengesEnvironmental Challenges
2
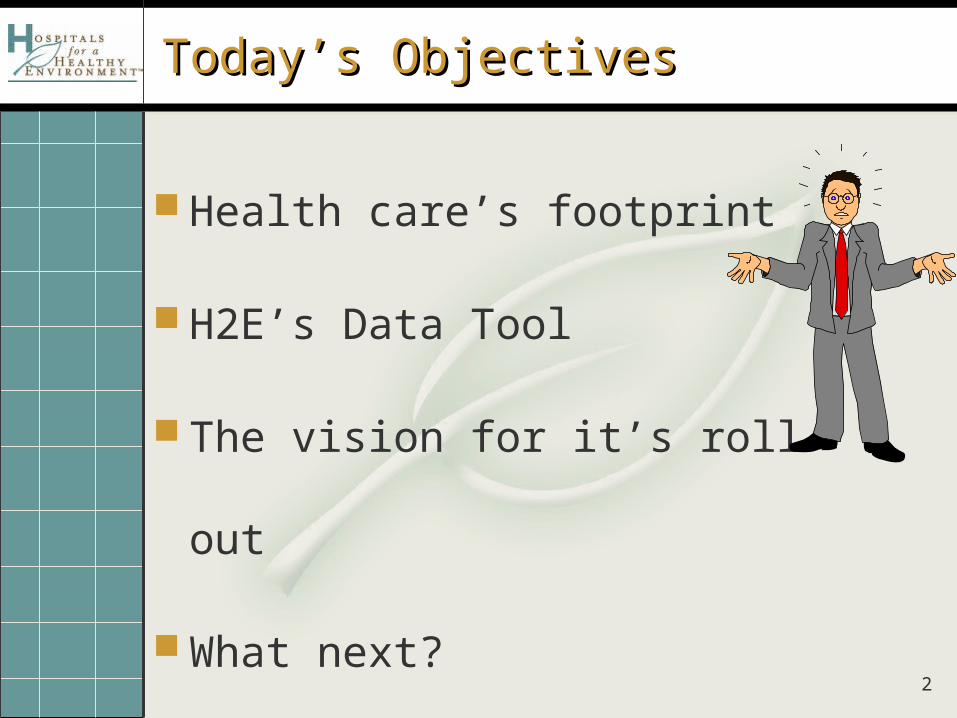
Today’s Objectives Today’s Objectives
Health care’s footprint
H2E’s Data Tool
The vision for it’s roll-out
What next?

3
You want me to do what???You want me to do what???
4
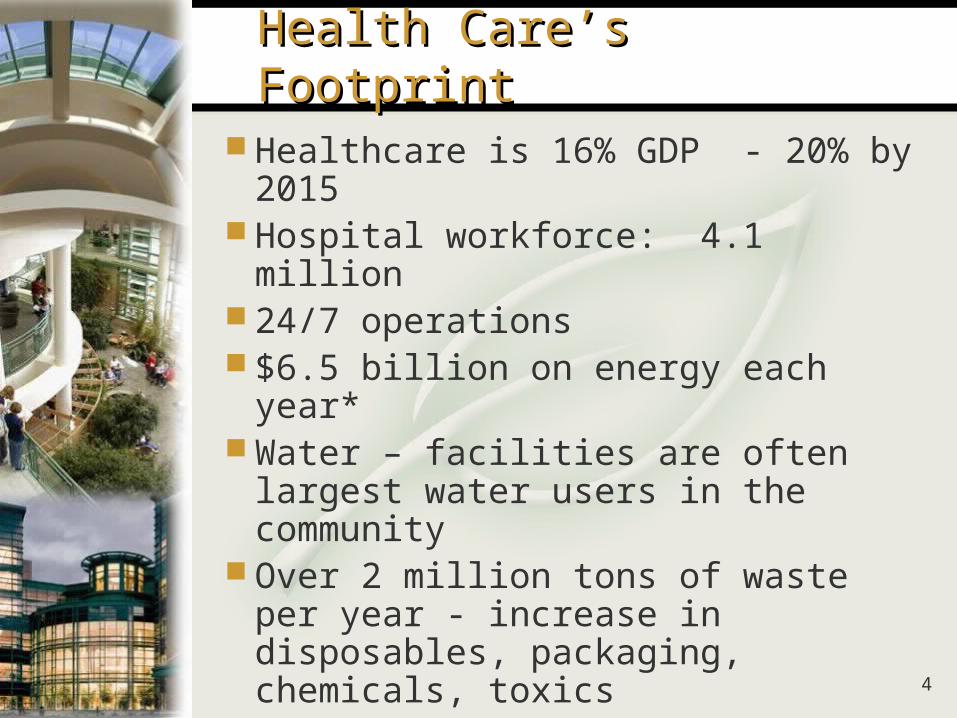
Health Care’s FootprintHealth Care’s Footprint
Healthcare is 16% GDP - 20% by 2015
Hospital workforce: 4.1 million 24/7 operations $6.5 billion on energy each year* Water – facilities are often largest
water users in the community Over 2 million tons of waste per
year - increase in disposables, packaging, chemicals, toxics
5
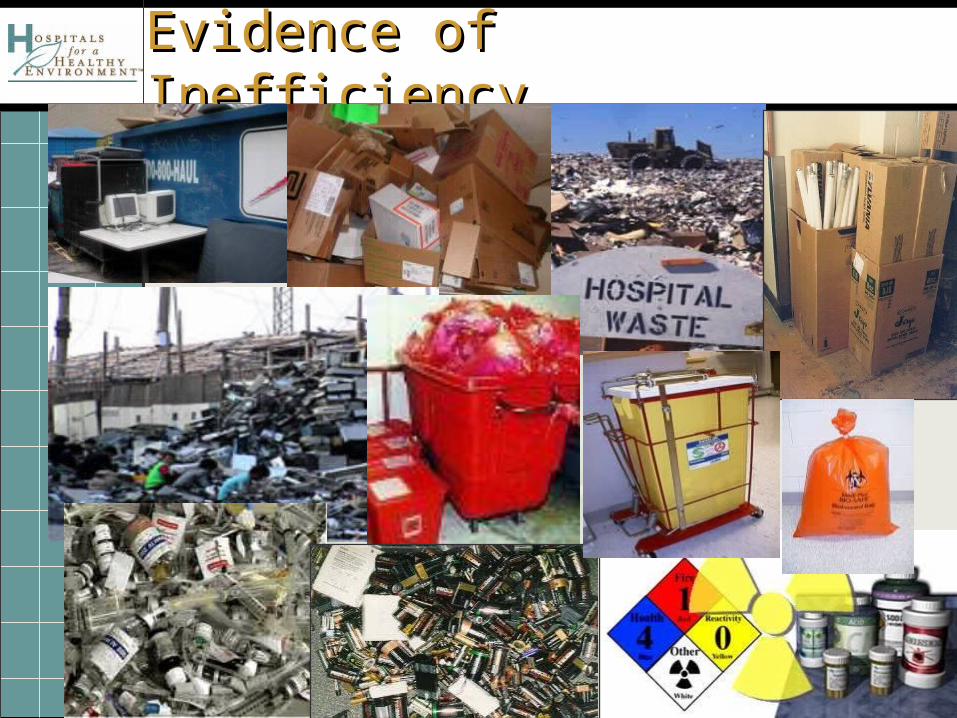
Evidence of InefficiencyEvidence of Inefficiency
6
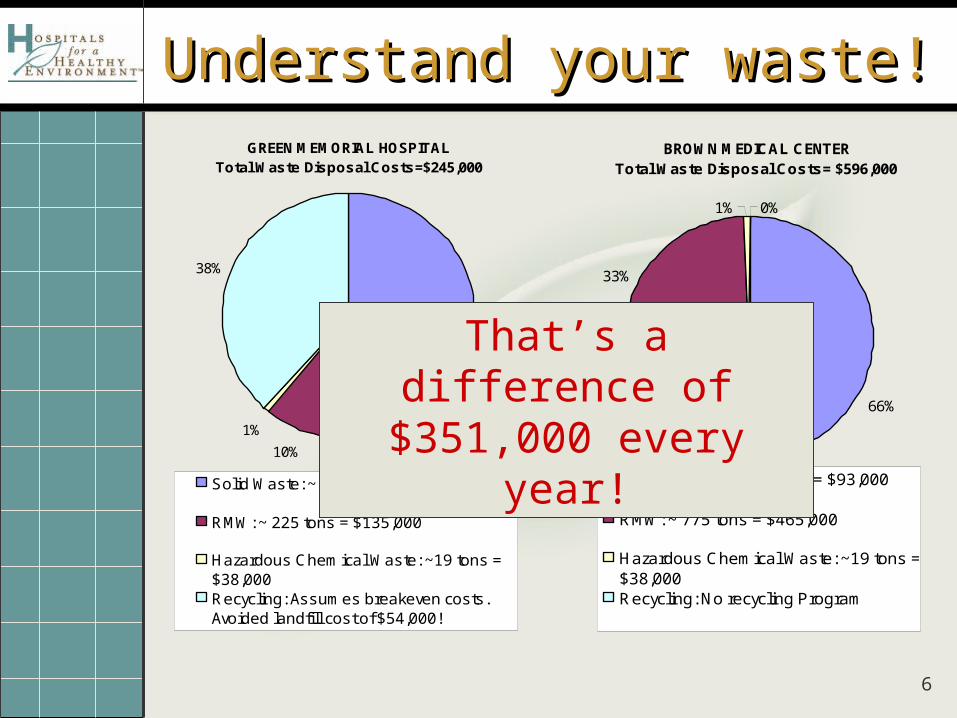
Understand your waste!Understand your waste!BROWN MEDICAL CENTER
Total Waste Disposal Costs= $596,000
66%
33%
1% 0%
Solid Waste: ~ 1550 tons = $93,000
RMW: ~ 775 tons = $465,000
Hazardous Chemical Waste: ~19 tons =$38,000Recycling: No recycling Program
GREEN MEMORIAL HOSPITALTotal Waste Disposal Costs=$245,000
51%
10%
1%
38%
Solid Waste: ~ 1200 tons = $72,000
RMW: ~ 225 tons = $135,000
Hazardous Chemical Waste: ~19 tons =$38,000Recycling: Assumes breakeven costs.Avoided landfill cost of $54,000!
That’s a difference of $351,000 every year!
7
BIOHAZARD
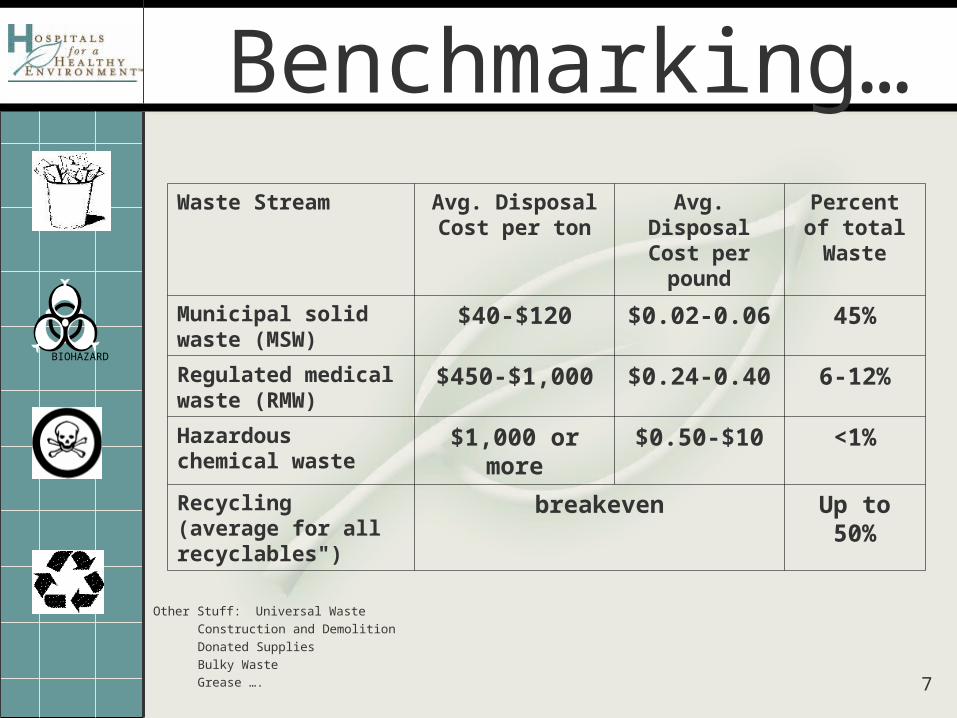
Benchmarking…Waste Stream Avg. Disposal Cost
per tonAvg. Disposal
Cost per poundPercent of
total Waste
Municipal solid waste (MSW)
$40-$120 $0.02-0.06 45%
Regulated medical waste (RMW)
$450-$1,000 $0.24-0.40 6-12%
Hazardous chemical waste
$1,000 or more $0.50-$10 <1%
Recycling (average for all recyclables")
breakeven Up to 50%
Other Stuff: Universal Waste
Construction and Demolition
Donated Supplies
Bulky Waste
Grease ….
8
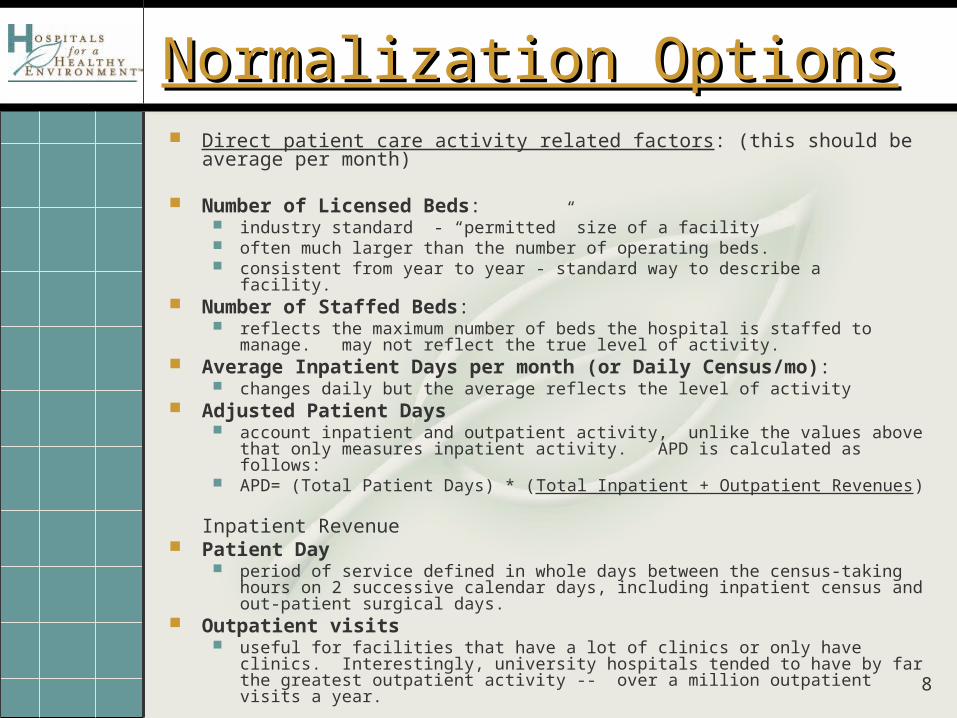
Normalization OptionsNormalization Options Direct patient care activity related factors: (this should be average per month)
Number of Licensed Beds: industry standard - “permitted” size of a facility often much larger than the number of operating beds. consistent from year to year - standard way to describe a facility.
Number of Staffed Beds: reflects the maximum number of beds the hospital is staffed to manage. may not
reflect the true level of activity. Average Inpatient Days per month (or Daily Census/mo):
changes daily but the average reflects the level of activity Adjusted Patient Days
account inpatient and outpatient activity, unlike the values above that only measures inpatient activity. APD is calculated as follows:
APD= (Total Patient Days) * (Total Inpatient + Outpatient Revenues) Inpatient Revenue Patient Day
period of service defined in whole days between the census-taking hours on 2 successive calendar days, including inpatient census and out-patient surgical days.
Outpatient visits useful for facilities that have a lot of clinics or only have clinics. Interestingly,
university hospitals tended to have by far the greatest outpatient activity -- over a million outpatient visits a year.
9
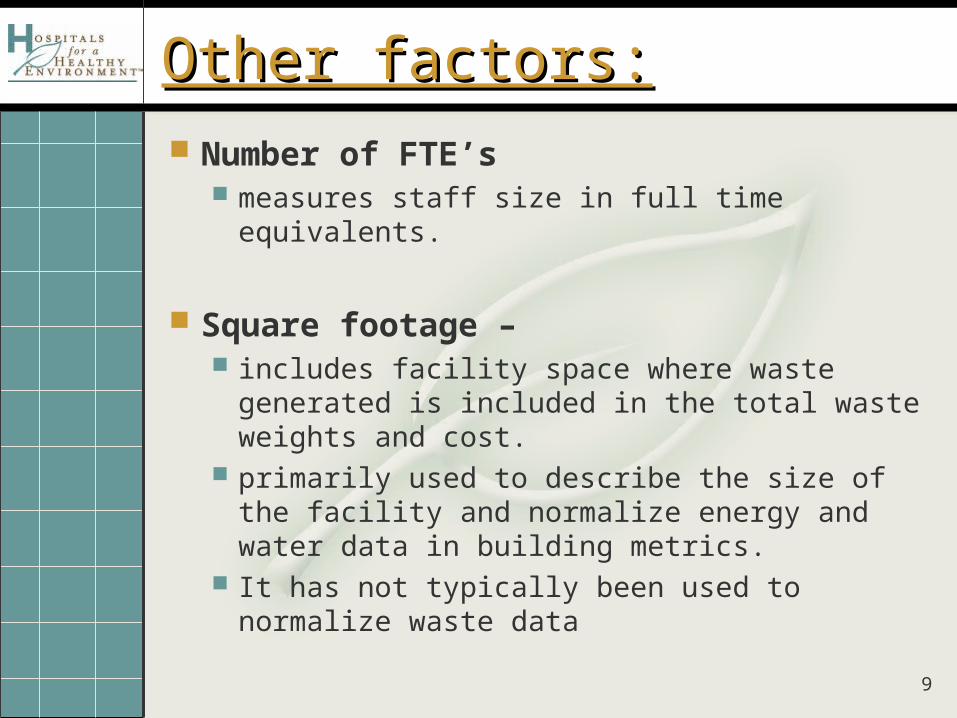
Other factors:Other factors:
Number of FTE’s measures staff size in full time equivalents.
Square footage –
includes facility space where waste generated is included in the total waste weights and cost.
primarily used to describe the size of the facility and normalize energy and water data in building metrics.
It has not typically been used to normalize waste data
10
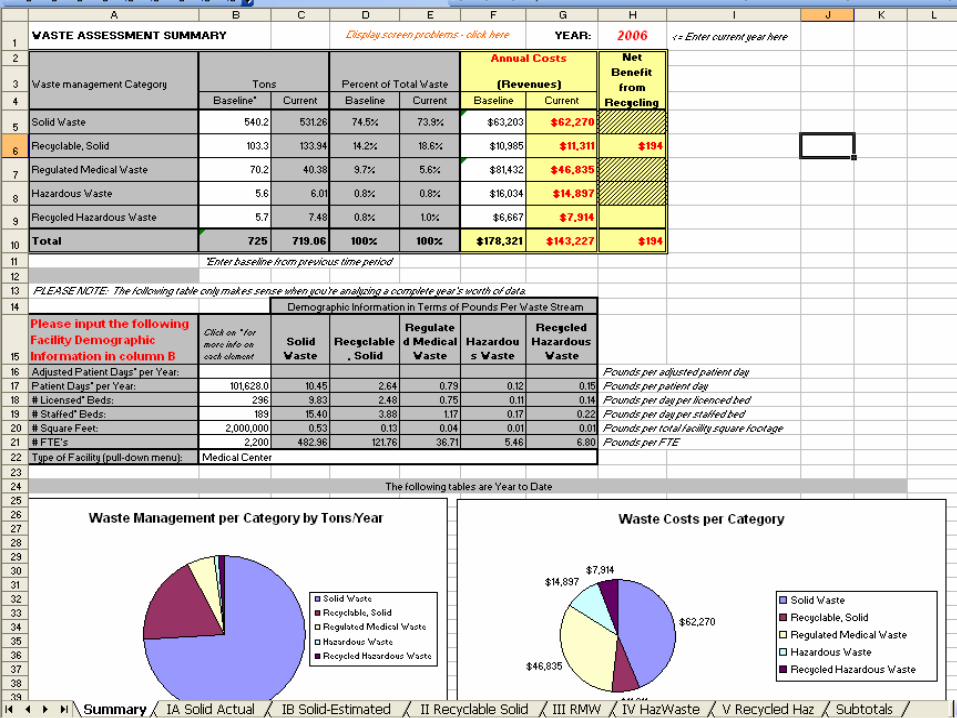
The ToolThe Tool
11
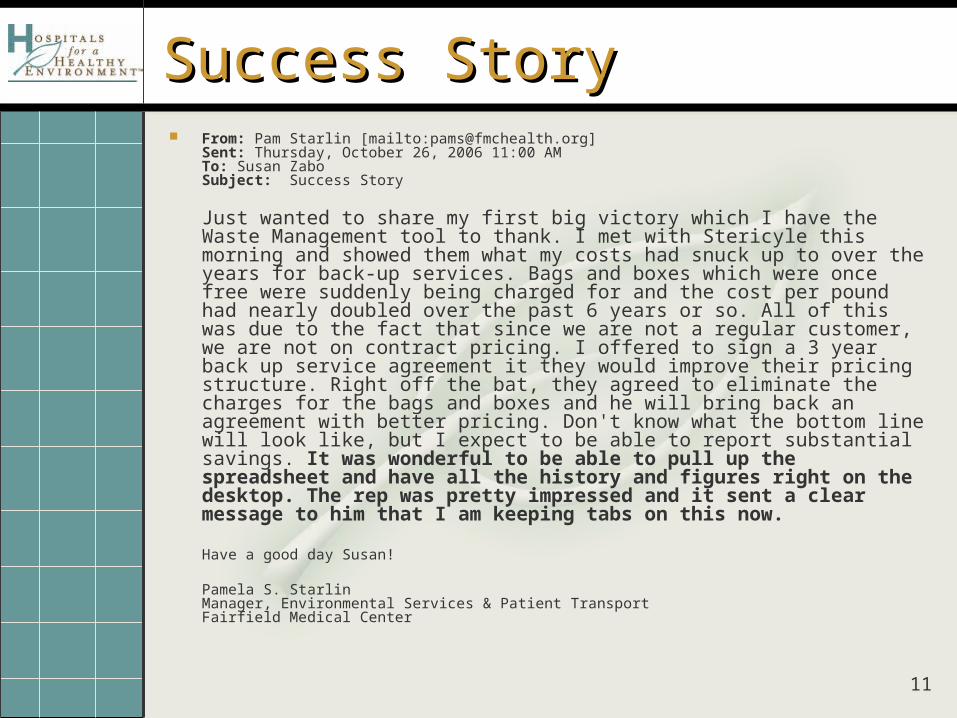
Success Story Success Story From: Pam Starlin [mailto:[email protected]]
Sent: Thursday, October 26, 2006 11:00 AMTo: Susan ZaboSubject: Success Story
Just wanted to share my first big victory which I have the Waste Management tool to thank. I met with Stericyle this morning and showed them what my costs had snuck up to over the years for back-up services. Bags and boxes which were once free were suddenly being charged for and the cost per pound had nearly doubled over the past 6 years or so. All of this was due to the fact that since we are not a regular customer, we are not on contract pricing. I offered to sign a 3 year back up service agreement it they would improve their pricing structure. Right off the bat, they agreed to eliminate the charges for the bags and boxes and he will bring back an agreement with better pricing. Don't know what the bottom line will look like, but I expect to be able to report substantial savings. It was wonderful to be able to pull up the spreadsheet and have all the history and figures right on the desktop. The rep was pretty impressed and it sent a clear message to him that I am keeping tabs on this now.
Have a good day Susan!
Pamela S. Starlin Manager, Environmental Services & Patient Transport Fairfield Medical Center
12
Early Pilot – 12 hospitals Did not have a process to
track and trend our waste streams Numerous waste streams to
manage and collect data Value of Stewardship
Wheaton Franciscan HealthcareWheaton Franciscan HealthcareWheaton Franciscan HealthcareWheaton Franciscan Healthcare
13
Metro Hospital – Grand Rapids MIMetro Hospital – Grand Rapids MI
Saved $40,000 first year “Asked our data your questions It gave us a loud and clear response We acted and won’t stop asking and
listening”
14
Questions to ask of your Questions to ask of your Solid Waste ProgramSolid Waste Program
Where does your waste go? Have you had a recent waste stream analysis?
What types of solid do you generate? Assessing your fees. Do you
understand them? Container sizes? Hauling frequency? Opportunities for Improvement?
15
Questions to ask of your Regulated Questions to ask of your Regulated Medical Waste (RMW)Medical Waste (RMW)
One of the largest opportunities to save money
GOAL: Hospitals should be at about 6-12% and or a RMW generation rate or 1 pound per adjusted patient day…
Does your clinical staff understand what qualifies as RMW?
How is your waste treated? Waste treatment and COST is critical to any successful program
Hauler negotiations. How are you charged? Per pound? Per tub?
What is your pick up frequency?
BIOHAZARD
16
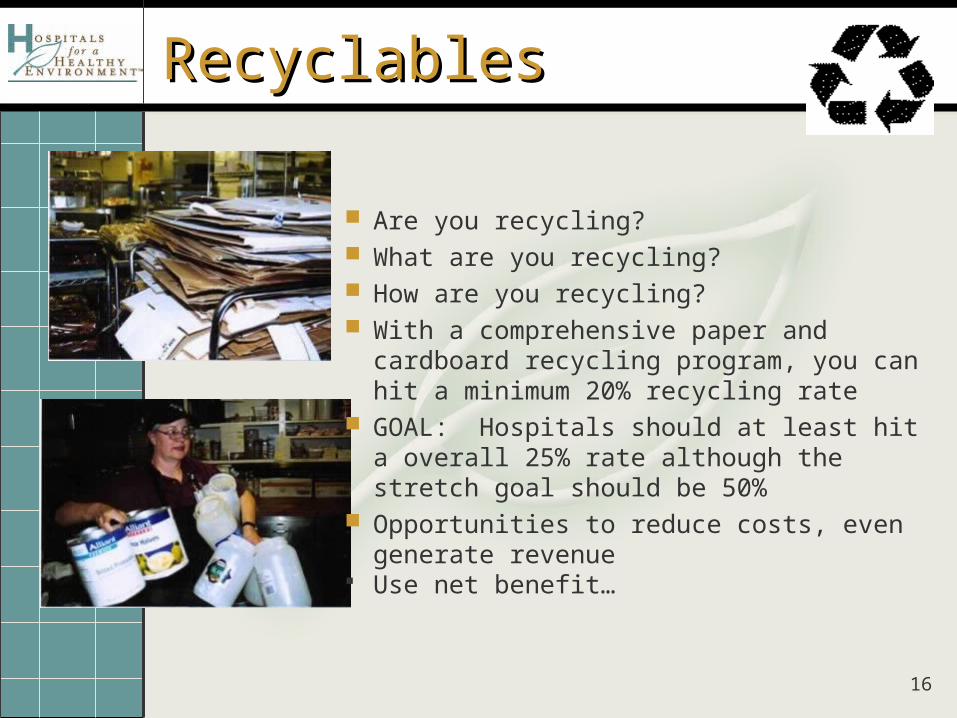
RecyclablesRecyclables
Are you recycling? What are you recycling? How are you recycling? With a comprehensive paper and cardboard
recycling program, you can hit a minimum 20% recycling rate
GOAL: Hospitals should at least hit a overall 25% rate although the stretch goal should be 50%
Opportunities to reduce costs, even generate revenue
Use net benefit…
17
Hazardous WasteHazardous Waste Do you generate hazardous waste? What
type? If yes, do you know where and how it is
disposed of? Is it recycled? Electronic scrap is the most rapidly growing
recycling problem in the world E-scrap is not only a crisis of quantity, but of a
toxic content due to toxins such as lead and mercury.
Solvent recovery – xylene, formalin, alcohol Biggest volume of HW in an acute care hospital
with a lab.
18
System goal to become mercury free and reduce RMW by 50%
Needed to understand problem to then set goals, short and long term
Lack of system wide recycling Identify opportunities for improvement Identify cost savings and efficiencies System compliance, vendor compliance and
contracts Celebrate successes
Why Wheaton participated?Why Wheaton participated?Why Wheaton participated?Why Wheaton participated?
19
20
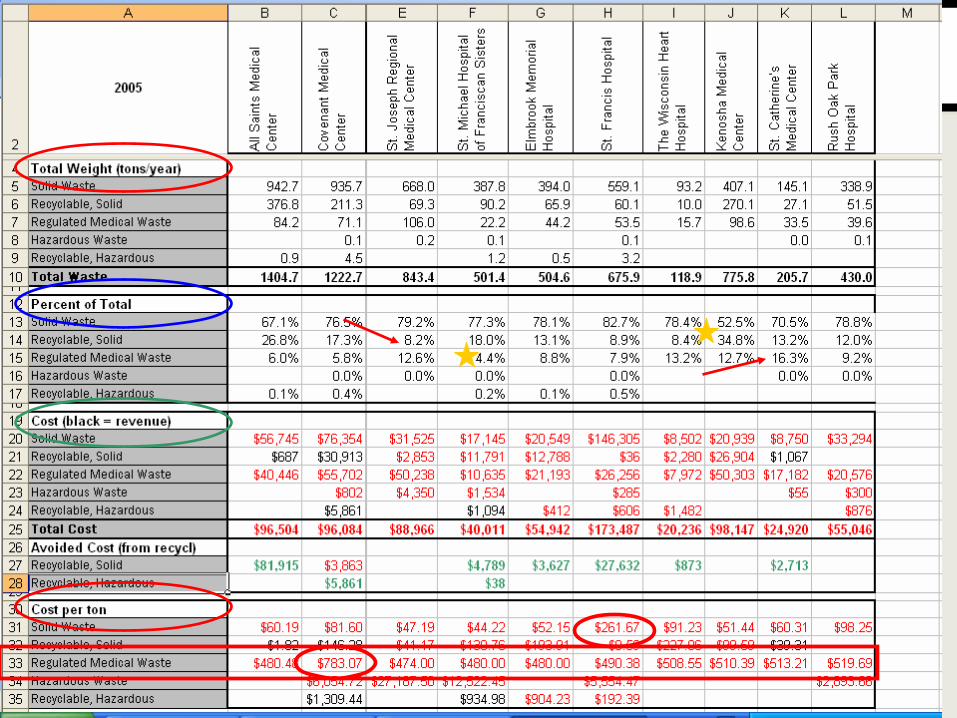
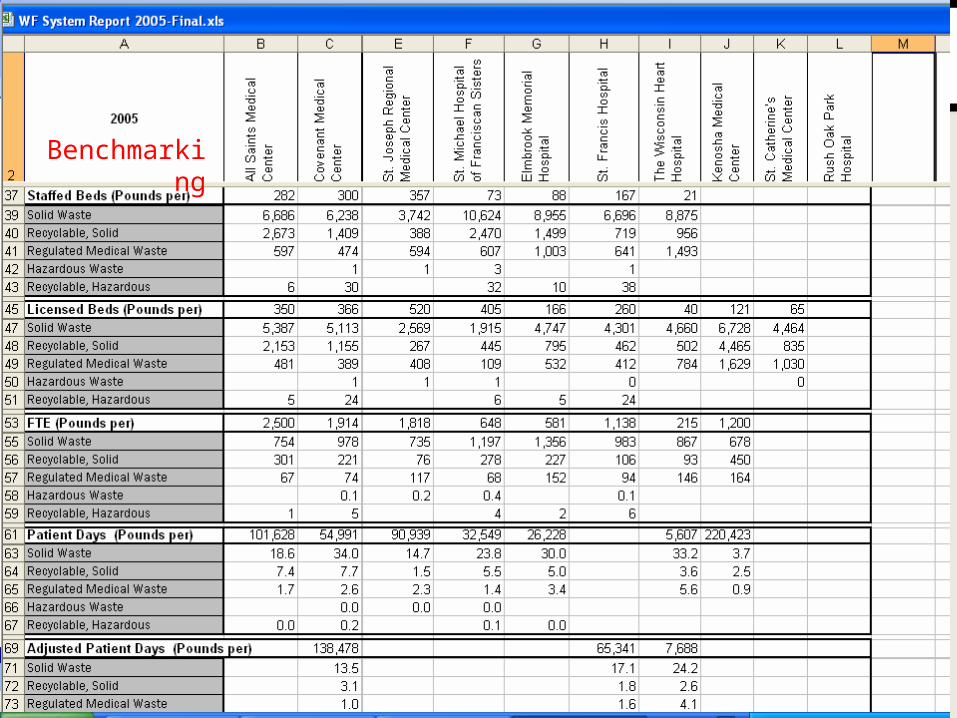
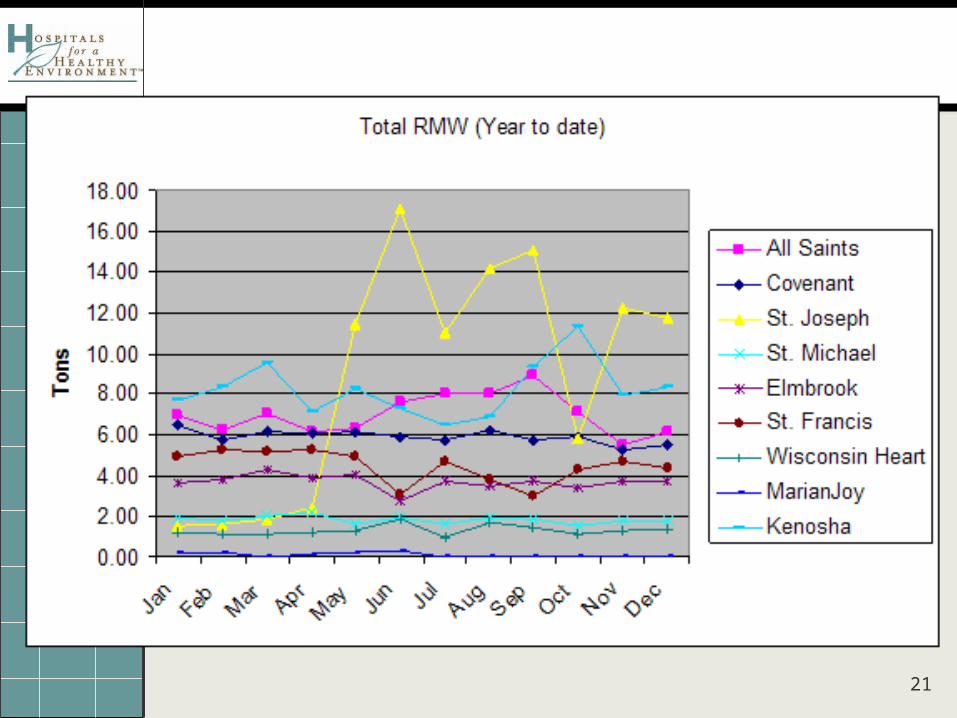
Benchmarking
21
22
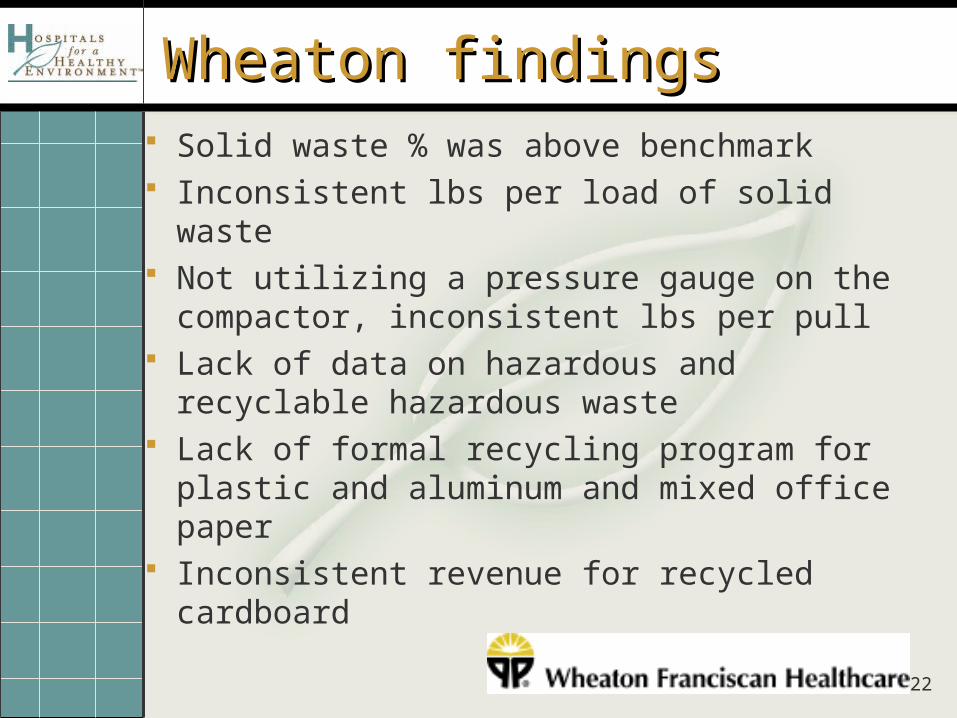
Wheaton findingsWheaton findings Solid waste % was above benchmark Inconsistent lbs per load of solid waste Not utilizing a pressure gauge on the
compactor, inconsistent lbs per pull Lack of data on hazardous and recyclable
hazardous waste Lack of formal recycling program for plastic
and aluminum and mixed office paper Inconsistent revenue for recycled cardboard
23
(continued)(continued)
Cardboard recycling is sub contracted and they did not receive any revenue
Receive 50% of mixed paper revenue, although this has not been verified
Shred all paper Lack of a commingled program
24
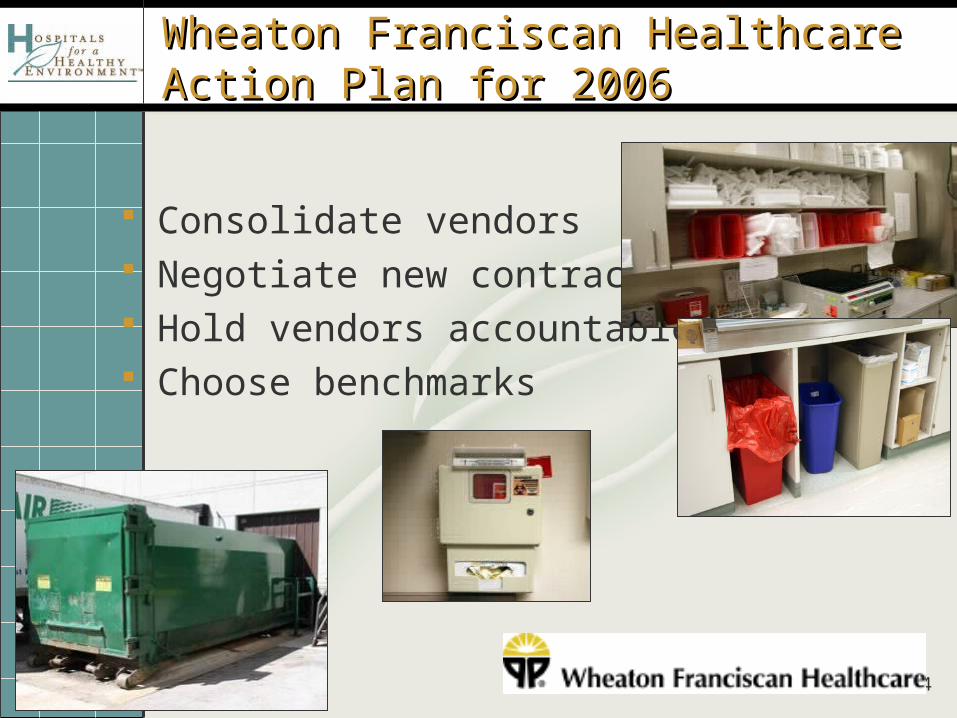
Wheaton Franciscan Healthcare Action Wheaton Franciscan Healthcare Action Plan for 2006Plan for 2006
Consolidate vendors Negotiate new contracts Hold vendors accountable Choose benchmarks
25
Wheaton Franciscan Healthcare Action Wheaton Franciscan Healthcare Action Plan Update and AccomplishmentsPlan Update and Accomplishments
RMW and Recycling contracts are in negotiations Neptune System Bio Systems (3 pilots)
Consolidated to one RMW vendor Vendors are being held accountable by
Corporate Materials and on-site management
Utilizing the H2E guidelines as the benchmark
26
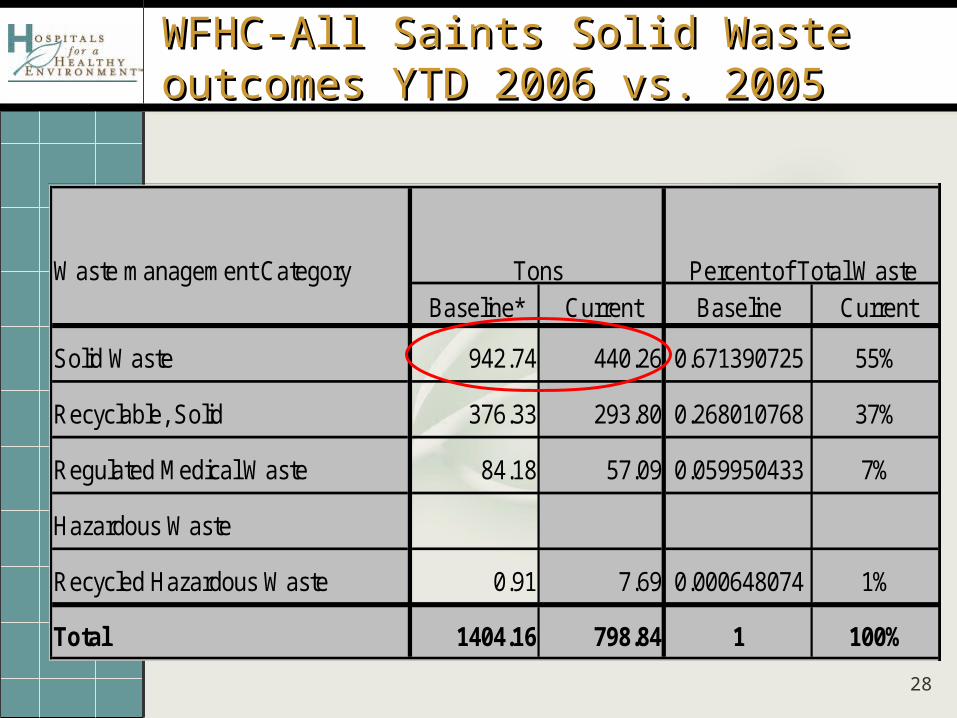
WFHC-All Saints Solid Waste outcomes WFHC-All Saints Solid Waste outcomes YTD 2006 vs. 2005YTD 2006 vs. 2005
Reduced solid waste from 67% of the waste stream to 55% (YTD June 2006)
Moved from a set pull to a requested pull
Then requested Waste Link System Re-calibrated compactors
27
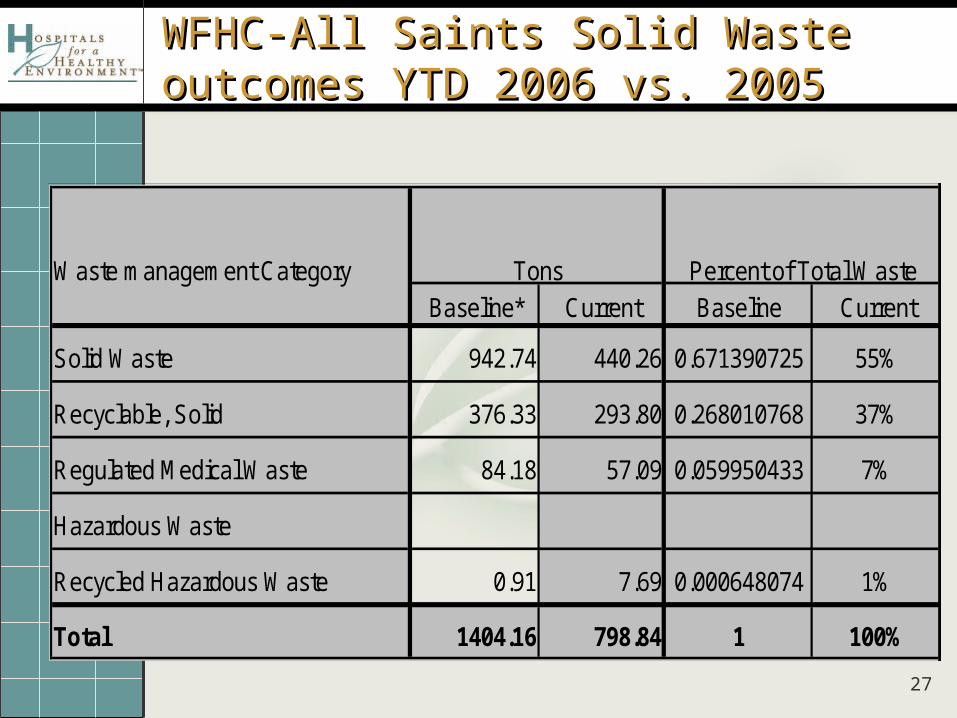
WFHC-All Saints Solid Waste outcomes WFHC-All Saints Solid Waste outcomes YTD 2006 vs. 2005YTD 2006 vs. 2005
Waste management Category
Baseline* Current Baseline Current
Solid Waste 942.74 440.26 0.671390725 55%
Recyclable, Solid 376.33 293.80 0.268010768 37%
Regulated Medical Waste 84.18 57.09 0.059950433 7%
Hazardous Waste
Recycled Hazardous Waste 0.91 7.69 0.000648074 1%
Total 1404.16 798.84 1 100%
Tons Percent of Total Waste
28
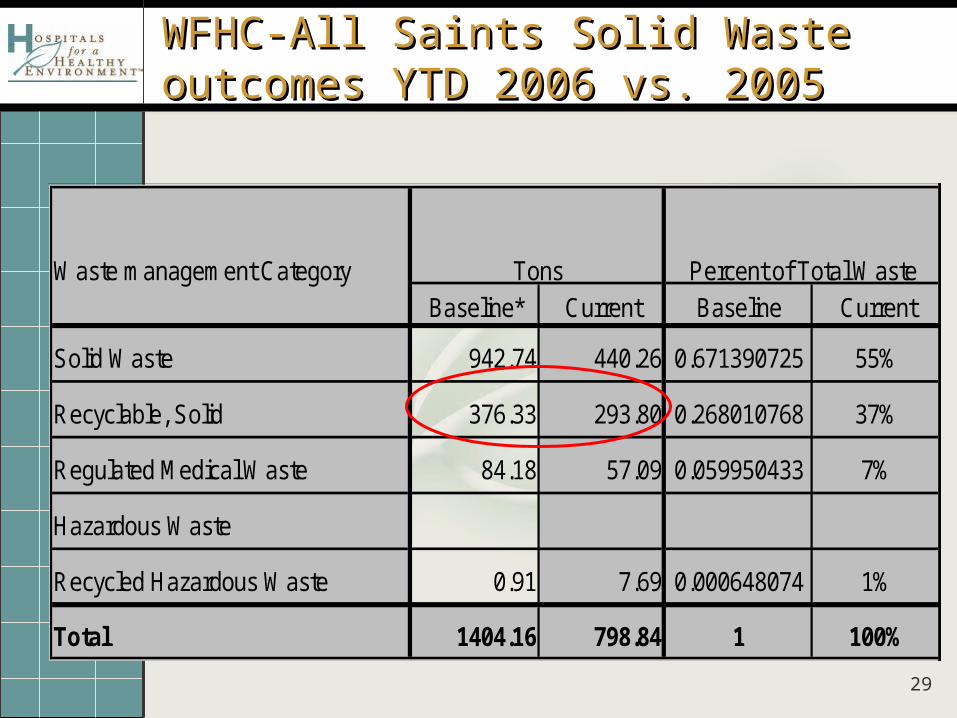
WFHC-All Saints Solid Waste outcomes WFHC-All Saints Solid Waste outcomes YTD 2006 vs. 2005YTD 2006 vs. 2005
Waste management Category
Baseline* Current Baseline Current
Solid Waste 942.74 440.26 0.671390725 55%
Recyclable, Solid 376.33 293.80 0.268010768 37%
Regulated Medical Waste 84.18 57.09 0.059950433 7%
Hazardous Waste
Recycled Hazardous Waste 0.91 7.69 0.000648074 1%
Total 1404.16 798.84 1 100%
Tons Percent of Total Waste
29
WFHC-All Saints Solid Waste outcomes WFHC-All Saints Solid Waste outcomes YTD 2006 vs. 2005YTD 2006 vs. 2005
Waste management Category
Baseline* Current Baseline Current
Solid Waste 942.74 440.26 0.671390725 55%
Recyclable, Solid 376.33 293.80 0.268010768 37%
Regulated Medical Waste 84.18 57.09 0.059950433 7%
Hazardous Waste
Recycled Hazardous Waste 0.91 7.69 0.000648074 1%
Total 1404.16 798.84 1 100%
Tons Percent of Total Waste
30
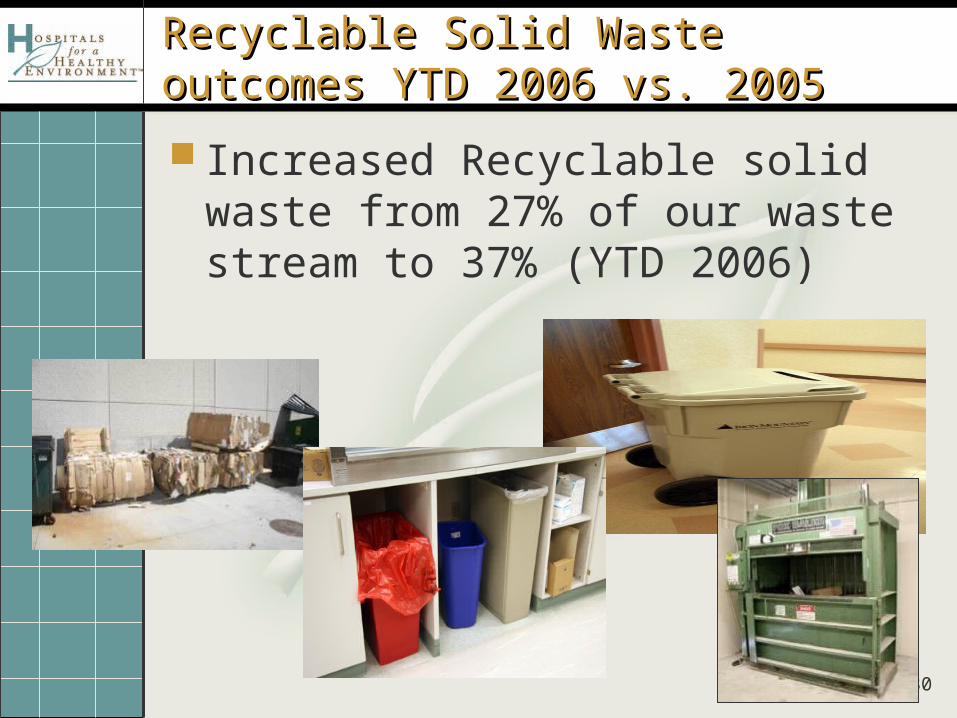
Recyclable Solid Waste outcomes YTD Recyclable Solid Waste outcomes YTD 2006 vs. 20052006 vs. 2005
Increased Recyclable solid waste from 27% of our waste stream to 37% (YTD 2006)
31
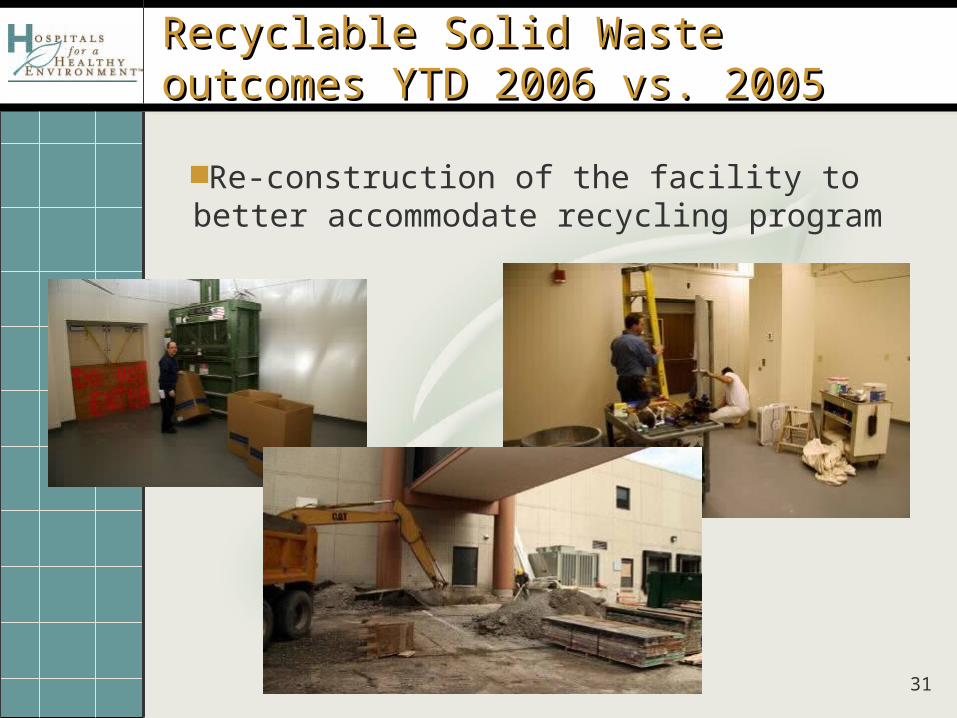
Recyclable Solid Waste outcomes YTD Recyclable Solid Waste outcomes YTD 2006 vs. 20052006 vs. 2005
Re-construction of the facility to better accommodate recycling program
32
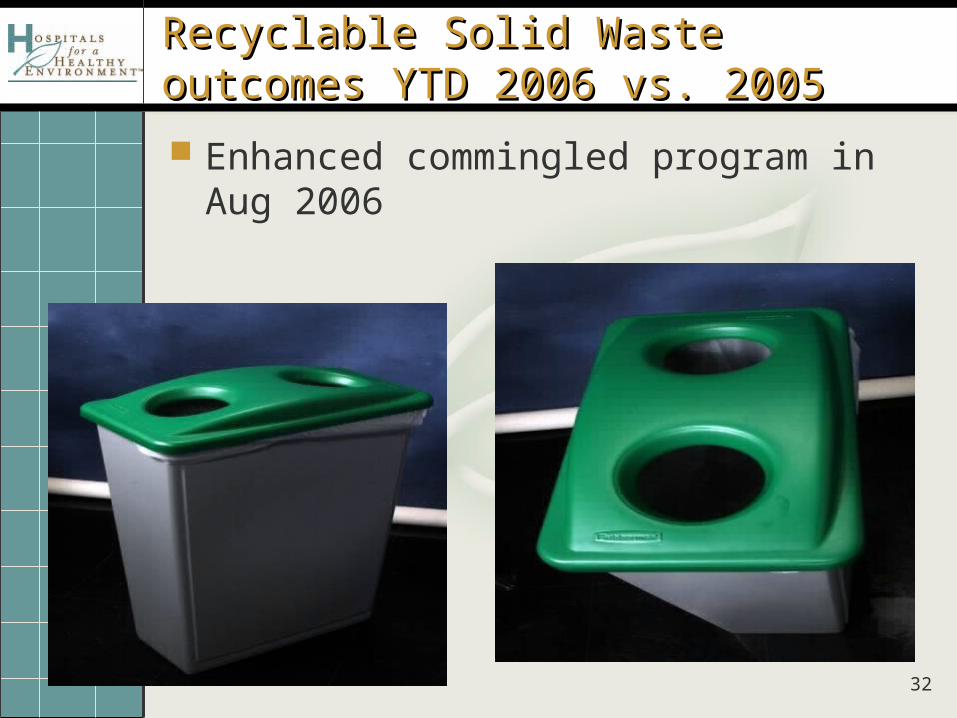
Recyclable Solid Waste outcomes YTD Recyclable Solid Waste outcomes YTD 2006 vs. 20052006 vs. 2005
Enhanced commingled program in Aug 2006
33
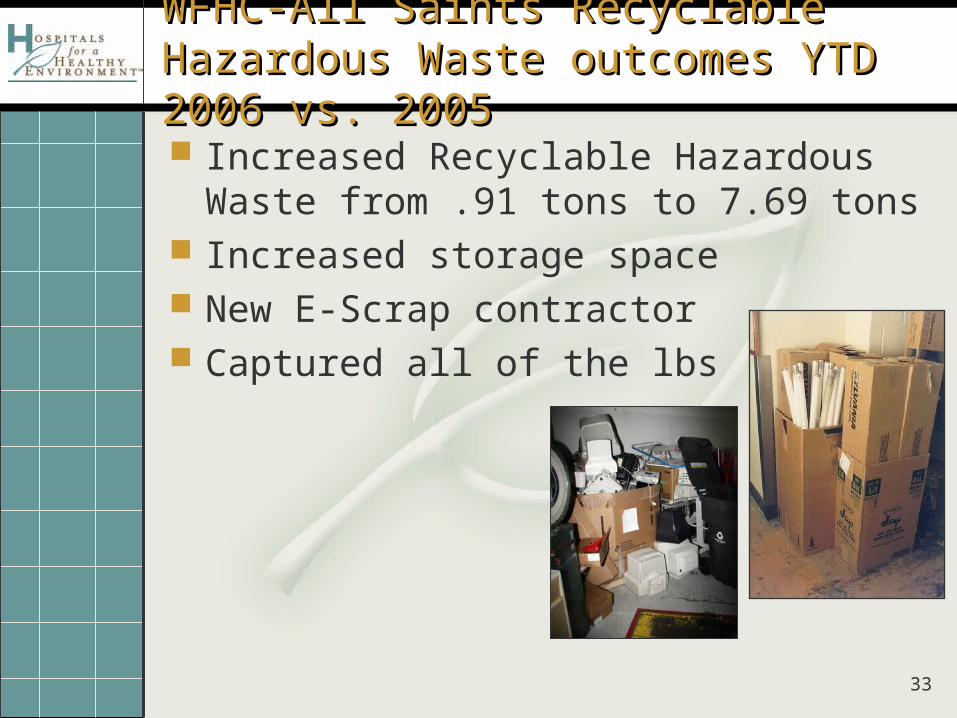
WFHC-All Saints Recyclable Hazardous WFHC-All Saints Recyclable Hazardous Waste outcomes YTD 2006 vs. 2005Waste outcomes YTD 2006 vs. 2005
Increased Recyclable Hazardous Waste from .91 tons to 7.69 tons
Increased storage space New E-Scrap contractor Captured all of the lbs
34
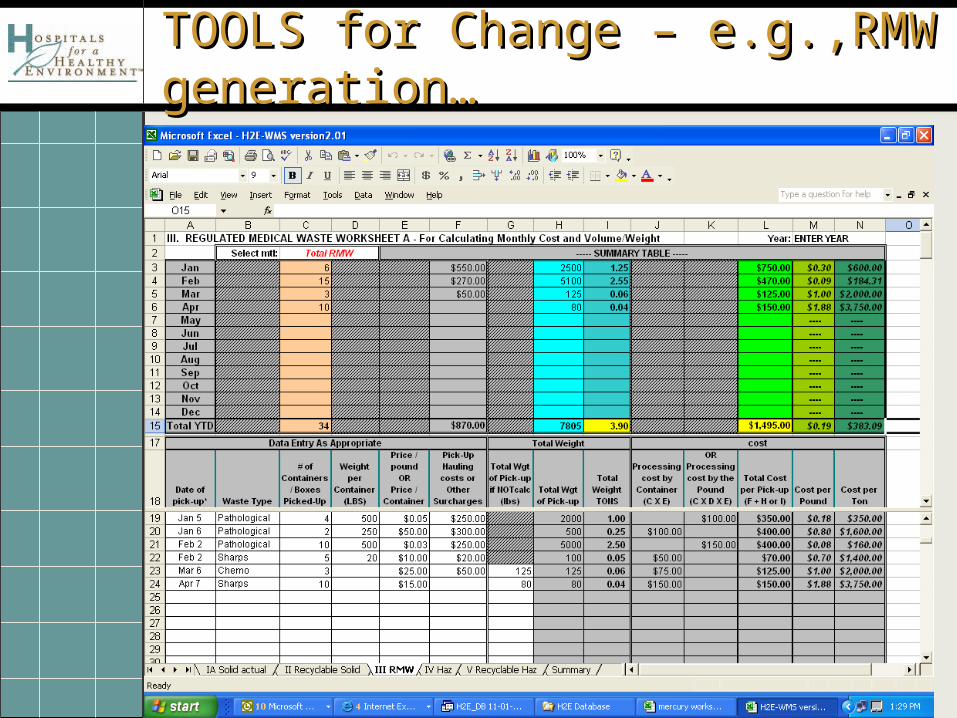
TOOLS for Change – e.g.,RMW TOOLS for Change – e.g.,RMW generation…generation…
35
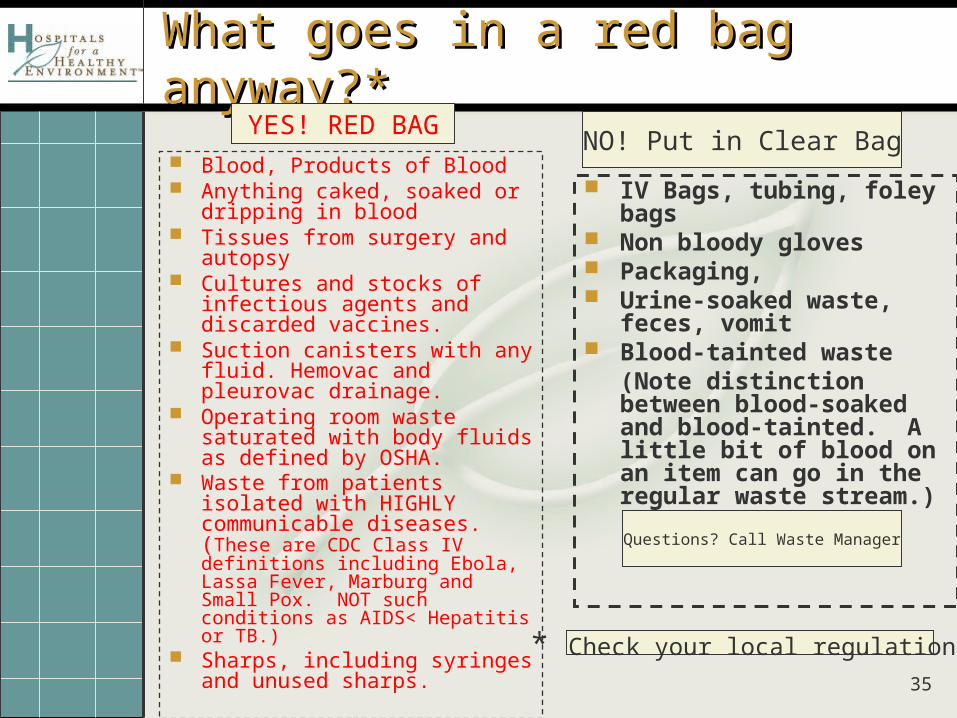
What goes in a red bag anyway?*What goes in a red bag anyway?*
Blood, Products of Blood Anything caked, soaked or
dripping in blood Tissues from surgery and
autopsy Cultures and stocks of
infectious agents and discarded vaccines.
Suction canisters with any fluid. Hemovac and pleurovac drainage.
Operating room waste saturated with body fluids as defined by OSHA.
Waste from patients isolated with HIGHLY communicable diseases. (These are CDC Class IV definitions including Ebola, Lassa Fever, Marburg and Small Pox. NOT such conditions as AIDS< Hepatitis or TB.)
Sharps, including syringes and unused sharps.
IV Bags, tubing, foley bags Non bloody gloves Packaging, Urine-soaked waste, feces,
vomit Blood-tainted waste
(Note distinction between blood-soaked and blood-tainted. A little bit of blood on an item can go in the regular waste stream.)
YES! RED BAGNO! Put in Clear Bag
* Check your local regulations
Questions? Call Waste Manager
36
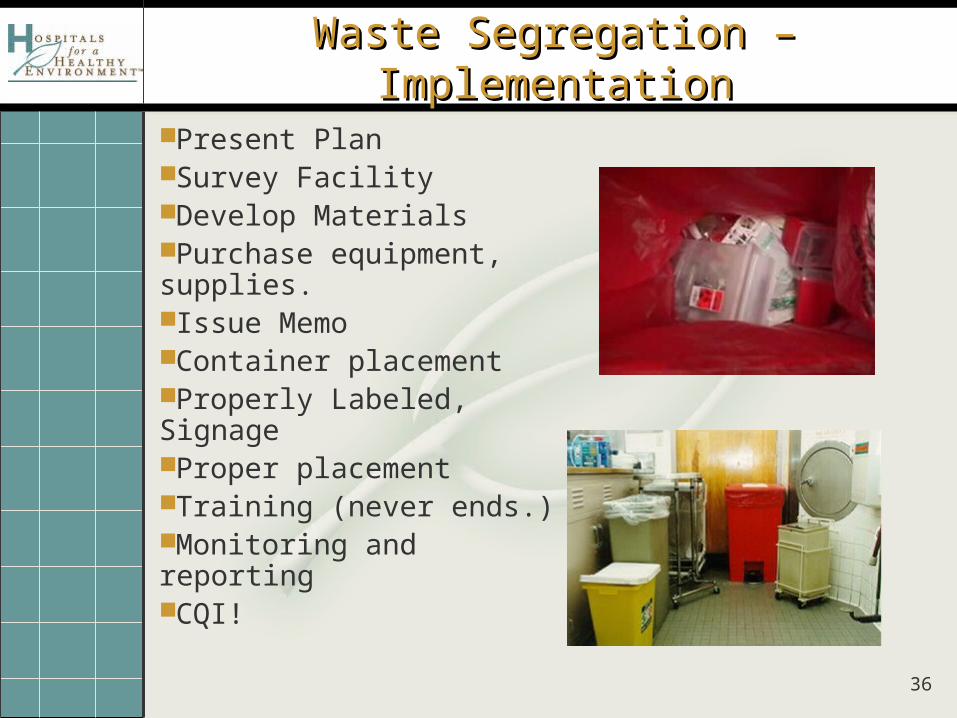
Waste Segregation – ImplementationWaste Segregation – Implementation
Present PlanSurvey FacilityDevelop MaterialsPurchase equipment, supplies.Issue MemoContainer placementProperly Labeled, SignageProper placementTraining (never ends.)Monitoring and reportingCQI!
37
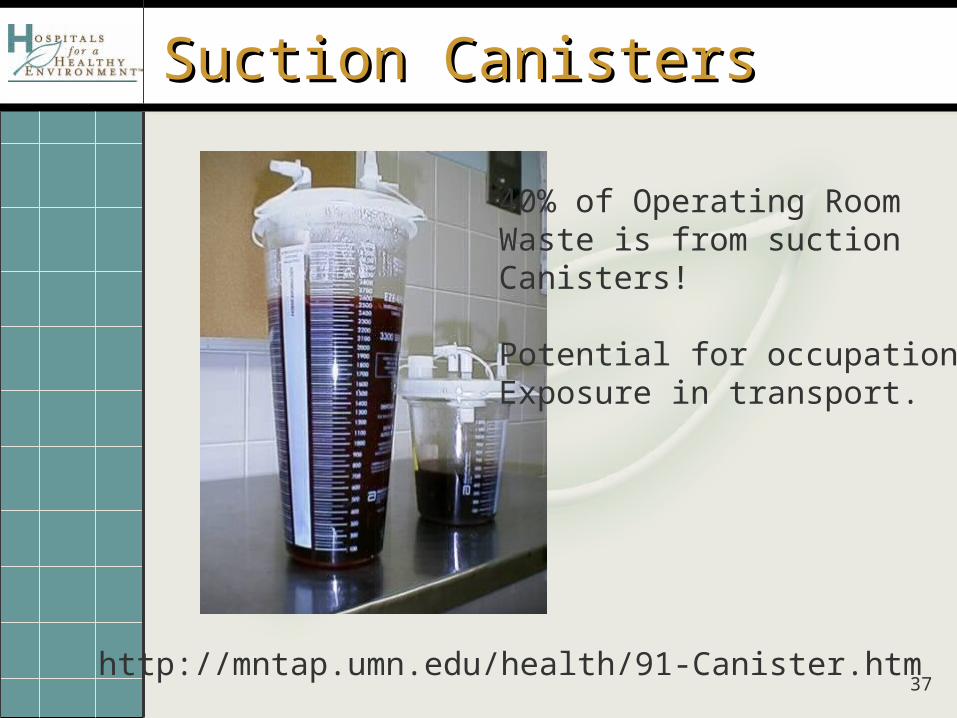
Suction CanistersSuction Canisters
http://mntap.umn.edu/health/91-Canister.htm
40% of Operating Room Waste is from suction Canisters!
Potential for occupationalExposure in transport.
38
39
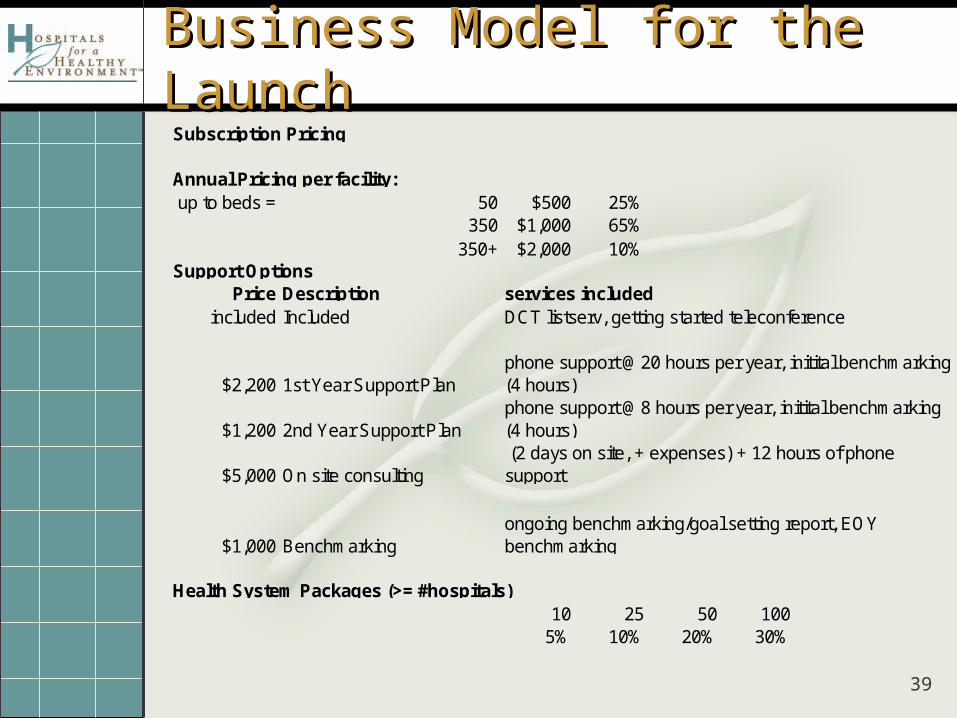
Business Model for the LaunchBusiness Model for the LaunchSubscription Pricing
Annual Pricing per facility:up to beds = 50 $500 25%
350 $1,000 65%350+ $2,000 10%
Support OptionsPrice Description services included
included Included DCT listserv, getting started teleconference
$2,200 1st Year Support Plan
$1,200 2nd Year Support Plan
$5,000 On site consulting
$1,000 Benchmarking
Health System Packages (>= #hospitals)10 25 50 100
5% 10% 20% 30%
phone support @20 hours per year, initital benchmarking (4 hours)phone support @8 hours per year, initital benchmarking (4 hours) (2 days on site, + expenses) + 12 hours of phone support
ongoing benchmarking/goal setting report, EOY benchmarking
40
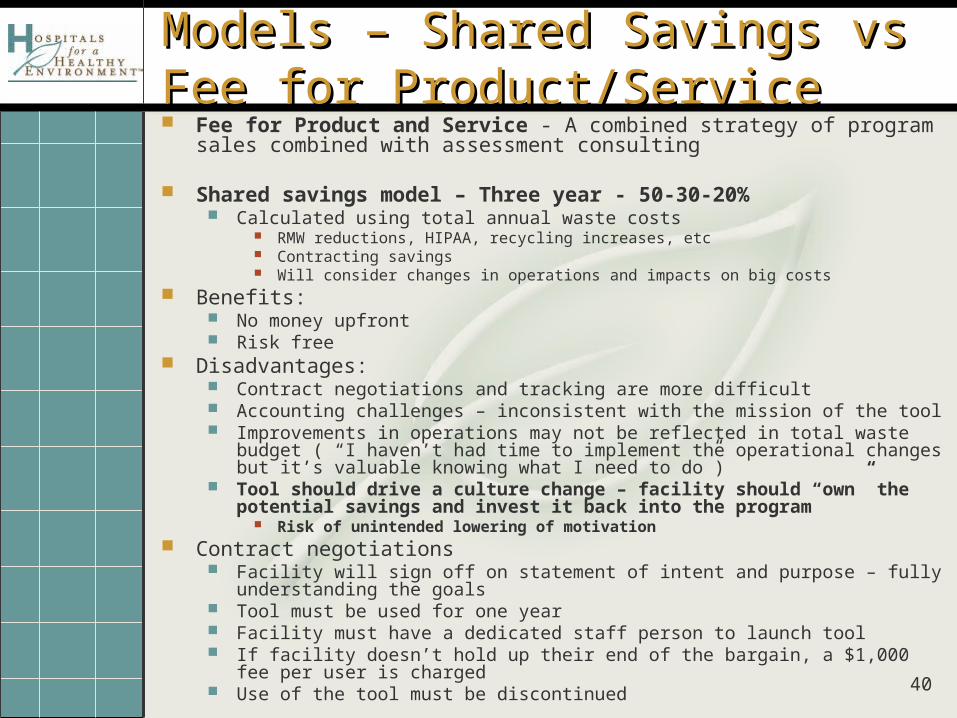
Models – Shared Savings vs Fee for Models – Shared Savings vs Fee for Product/ServiceProduct/Service Fee for Product and Service - A combined strategy of program sales
combined with assessment consulting
Shared savings model – Three year - 50-30-20% Calculated using total annual waste costs
RMW reductions, HIPAA, recycling increases, etc Contracting savings Will consider changes in operations and impacts on big costs
Benefits: No money upfront Risk free
Disadvantages: Contract negotiations and tracking are more difficult Accounting challenges – inconsistent with the mission of the tool Improvements in operations may not be reflected in total waste budget ( “I haven’t
had time to implement the operational changes but it’s valuable knowing what I need to do”)
Tool should drive a culture change – facility should “own” the potential savings and invest it back into the program
Risk of unintended lowering of motivation Contract negotiations
Facility will sign off on statement of intent and purpose – fully understanding the goals Tool must be used for one year Facility must have a dedicated staff person to launch tool If facility doesn’t hold up their end of the bargain, a $1,000 fee per user is charged Use of the tool must be discontinued

41
Next Steps - Next Steps -
New Features Additional modules Benchmarking
42
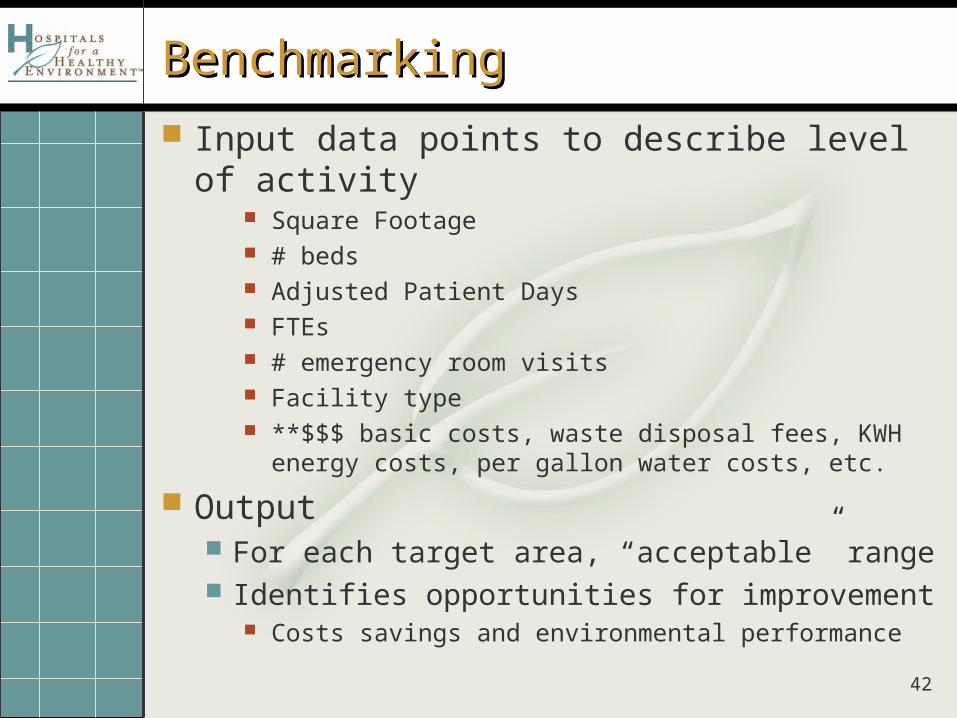
BenchmarkingBenchmarking
Input data points to describe level of activity Square Footage # beds Adjusted Patient Days FTEs # emergency room visits Facility type **$$$ basic costs, waste disposal fees, KWH energy
costs, per gallon water costs, etc.
Output For each target area, “acceptable” range Identifies opportunities for improvement
Costs savings and environmental performance
43
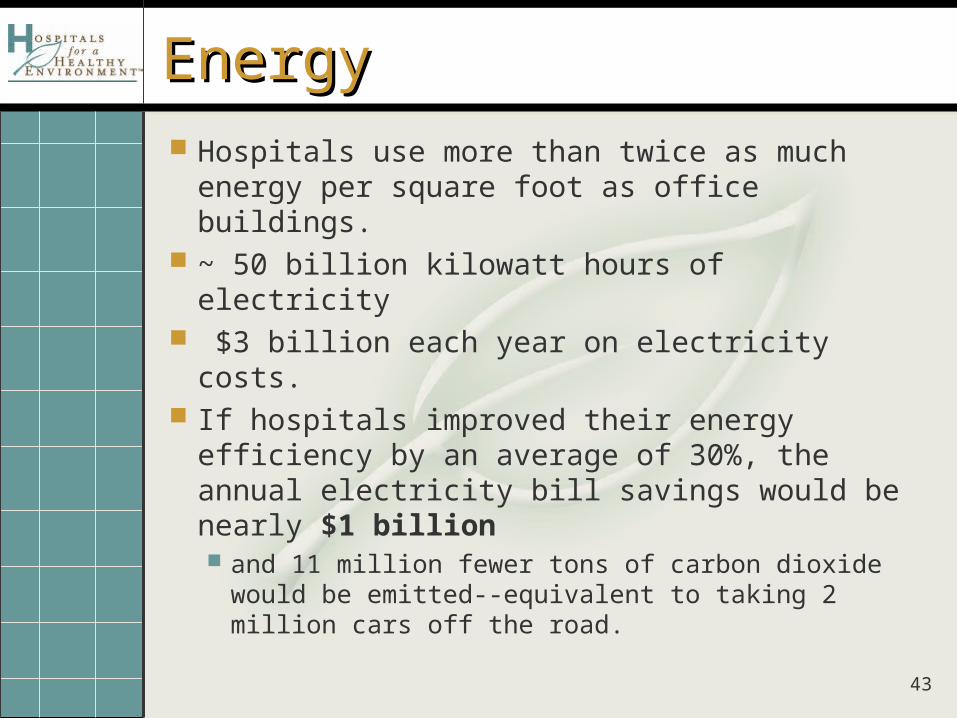
EnergyEnergy
Hospitals use more than twice as much energy per square foot as office buildings.
~ 50 billion kilowatt hours of electricity $3 billion each year on electricity costs. If hospitals improved their energy efficiency
by an average of 30%, the annual electricity bill savings would be nearly $1 billion and 11 million fewer tons of carbon dioxide
would be emitted--equivalent to taking 2 million cars off the road.
44
0
1,000
2,000
3,000
4,000
5,000
6,000
Jan Feb Mar Apr May Jun Jul Aug Sep Oct Nov Dec
kgal
s/m
onth
$0
$10,000
$20,000
$30,000
$40,000
$50,000
$60,000
$/m
onth
2001 kgals
2002 kgals
2003 kgals
2001 $
2002 $
2003 $
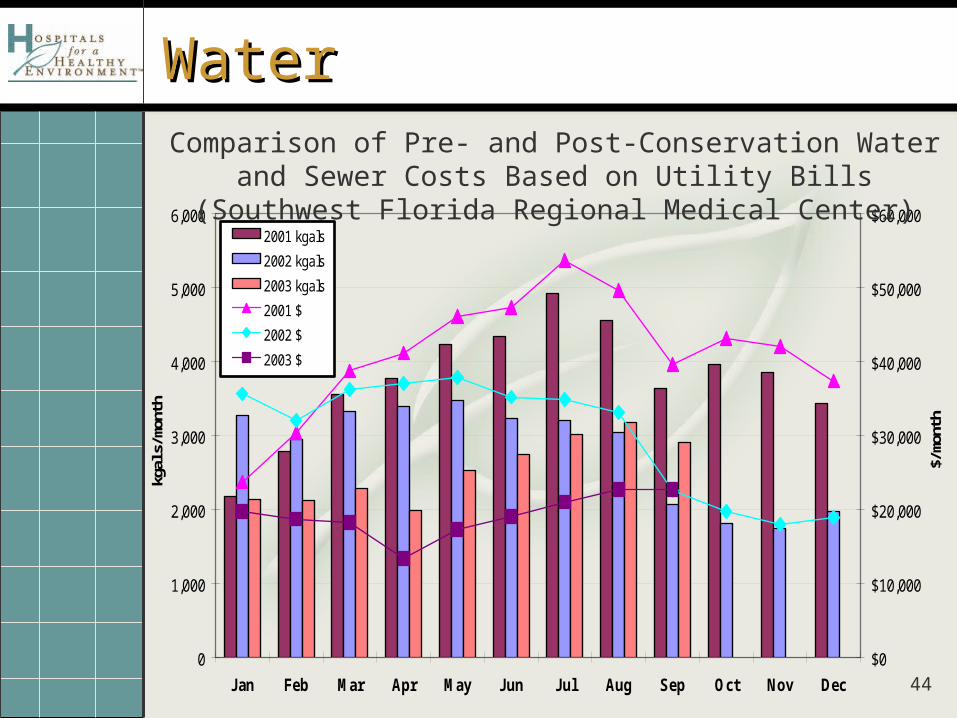
Comparison of Pre- and Post-Conservation Water and Sewer Costs Based on Utility Bills (Southwest Florida Regional Medical Center)
WaterWater
45
Next StepsNext Steps
Launch Tool in 2007 with systems and state groups
Gather benchmarking data How can we work together? HELP US FIND A NAME:
H2E Waste Data Compactor H2E WOW Strategies – (working on
waste) H2E Sustainable Strategies for
Environmental Programs H2E Environmental Excellence
Strategies
46
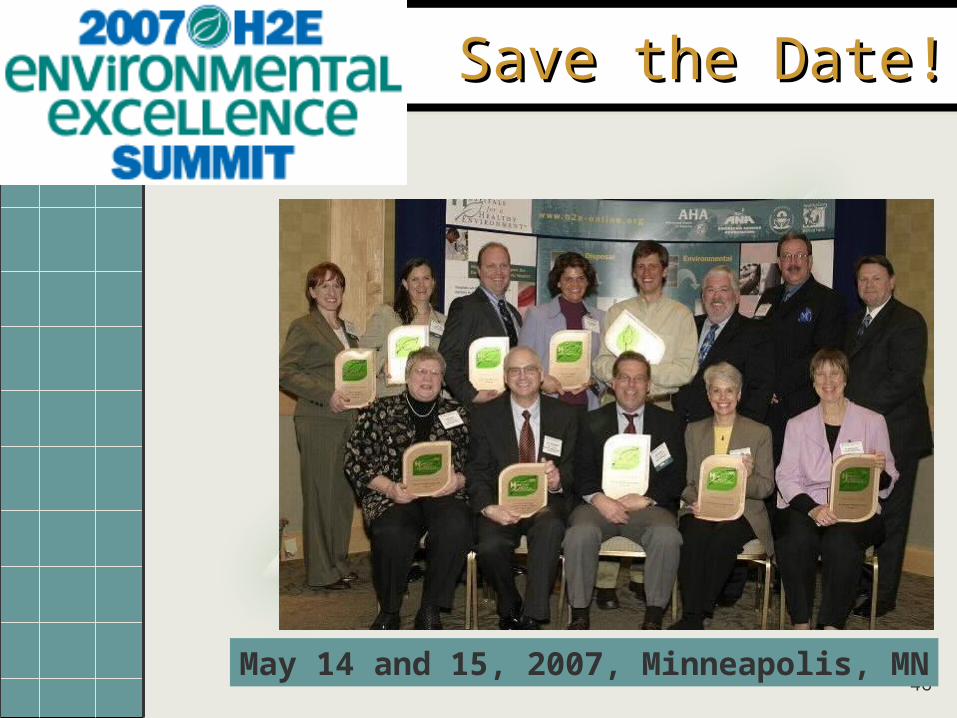
Save the Date!Save the Date!
May 14 and 15, 2007, Minneapolis, MN
47
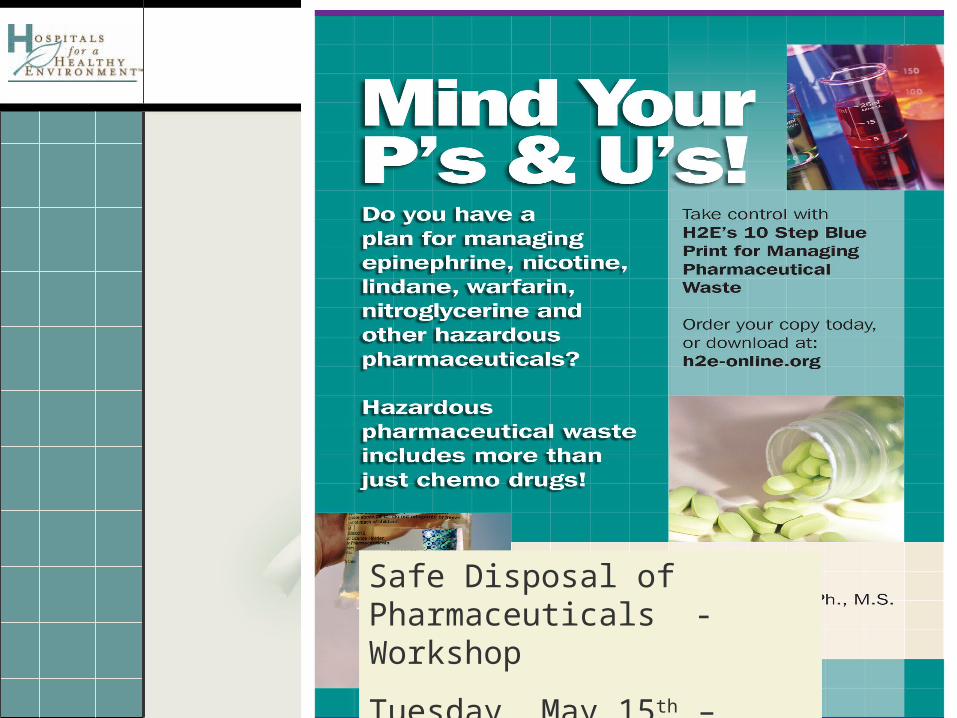
Safe Disposal of Pharmaceuticals - Workshop
Tuesday, May 15th – Minn. MN