Embed Size (px)
Citation preview
Earth Syst. Sci. Data, 12, 2695–2703, 2020https://doi.org/10.5194/essd-12-2695-2020© Author(s) 2020. This work is distributed underthe Creative Commons Attribution 4.0 License.
Half-hourly changes in intertidal temperature at ninewave-exposed locations along the Atlantic Canadian
coast: a 5.5-year study
Ricardo A. Scrosati, Julius A. Ellrich, and Matthew J. FreemanDepartment of Biology, St. Francis Xavier University, Antigonish, Nova Scotia B2G 2W5, Canada
Correspondence: Ricardo A. Scrosati ([email protected])
Received: 18 June 2020 – Discussion started: 2 July 2020Revised: 20 September 2020 – Accepted: 1 October 2020 – Published: 9 November 2020
Abstract. Intertidal habitats are unique because they spend alternating periods of submergence (at high tide)and emergence (at low tide) every day. Thus, intertidal temperature is mainly driven by sea surface tempera-ture (SST) during high tides and by air temperature during low tides. Because of that, the switch from highto low tides and vice versa can determine rapid changes in intertidal thermal conditions. On cold-temperateshores, which are characterized by cold winters and warm summers, intertidal thermal conditions can alsochange considerably with seasons. Despite this uniqueness, knowledge on intertidal temperature dynamics ismore limited than for open seas. This is especially true for wave-exposed intertidal habitats, which, in addi-tion to the unique properties described above, are also characterized by wave splash being able to moderateintertidal thermal extremes during low tides. To address this knowledge gap, we measured temperature everyhalf hour during a period of 5.5 years (2014–2019) at nine wave-exposed rocky intertidal locations spanning415 km of the Atlantic coast of Nova Scotia, Canada. This data set is freely available from the figshare onlinerepository (Scrosati and Ellrich, 2020a; https://doi.org/10.6084/m9.figshare.12462065.v1). We summarize themain properties of this data set by focusing on location-wise values of daily maximum and minimum temper-ature and daily SST, which we make freely available as a separate data set in figshare (Scrosati et al., 2020;https://doi.org/10.6084/m9.figshare.12453374.v1). Overall, this cold-temperate coast exhibited a wide annualSST range, from a lowest overall value of −1.8 ◦C in winter to a highest overall value of 22.8 ◦C in summer.In addition, the latitudinal SST trend along this coast experienced a reversal from winter (when SST increasedsouthwards) to summer (when SST decreased southwards), seemingly driven by alongshore differences in sum-mer coastal upwelling. Daily temperature maxima and minima were more extreme, as expected from their oc-currence during low tides, ranging from a lowest overall value of−16.3 ◦C in winter to a highest overall value of41.2 ◦C in summer. Daily maximum temperature in summer varied little along the coast, while daily minimumtemperature in winter increased southwards. This data set is the first of its kind for the Atlantic Canadian coastand exemplifies in detail how intertidal temperature varies in wave-exposed environments on a cold-temperatecoast.
1 Introduction
Rocky intertidal habitats are those occurring on marinerocky shores between the highest and lowest elevationsreached by tides. These environments are unique becausethey spend alternating periods of submergence (during hightides) and emergence (during low tides) every day (Raffaelli
and Hawkins, 1999; Menge and Branch, 2001). Thus, on theone hand, intertidal conditions are influenced by the seasonalchanges in sea surface temperature (SST), which can be pro-nounced on temperate shores, which display warm waters insummer and cold waters in winter. On the other hand, aneven greater degree of thermal variation can occur at hourlyscales once intertidal habitats become exposed to the air at
Published by Copernicus Publications.
2696 R. A. Scrosati et al.: Intertidal temperature changes along the Atlantic Canadian coast
low tide, especially on hot days in spring and summer (Wattand Scrosati, 2013; Lathlean et al., 2014; Umanzor et al.,2017) and cold days in winter (Scrosati and Ellrich, 2018a).
Temperature is a major factor influencing the distribu-tion and abundance of species (Pörtner, 2002; Körner et al.,2016; Lancaster and Humphreys, 2020). Thus, SST plays animportant ecological role in intertidal habitats during hightides (Sanford, 2014), while high (Somero, 2007) and low(Braby, 2007) air temperatures are ecologically relevant dur-ing low tides. In addition, not only is average temperatureecologically important, but its temporal variability is as well(Bennedetti-Cecchi et al., 2006). Overall, then, having de-tailed temperature data across periods of low and high tideis important for intertidal ecology and for making biogeo-graphic predictions based on climate change expectations(Wethey et al., 2011).
Temperature data are available for surface ocean watersworldwide (Fay and McKinley, 2014; Banzon et al., 2016;Freeman and Lovenduski, 2016; Aulicino et al., 2018; Yun etal., 2019). However, data on intertidal temperature are con-siderably less common in terms of both spatial and tempo-ral coverage (Lathlean et al., 2014; Umanzor et al., 2017;Scrosati and Ellrich, 2018a). This is especially true for wave-exposed intertidal habitats, as remote sensing methods thatare commonly used for open waters (e.g., satellites) cannotcapture the quick, localized temperature changes caused bytides and waves. Waves can also damage equipment deployedin situ to measure intertidal temperature. For wave-exposedintertidal habitats, temperature data between consecutive lowand high tides can also be used to infer physical aspects of theenvironment such as wave action itself (Harley and Helmuth,2003).
Wave-exposed rocky intertidal habitats are common alongthe Canadian coast in Nova Scotia, as this coast faces theopen Atlantic Ocean. Several studies have investigated theecology of these environments (Minchinton and Scheib-ling, 1991; Hunt and Scheibling, 1998, 2001; Scrosati andHeaven, 2007; Arribas et al., 2014; Molis et al., 2015; Ell-rich and Scrosati, 2016; Scrosati and Ellrich, 2018b, 2019;Scrosati, 2020a, b). However, because of their research goals,intertidal temperature was either not measured or analyzedfor a few locations or for limited time periods. Therefore,there is a knowledge gap on broad spatiotemporal patterns inintertidal temperature for wave-exposed environments alongthis coast. To address this gap, this paper discusses a data setconsisting of intertidal temperature values measured everyhalf hour at nine wave-exposed locations along the Atlanticcoast of Nova Scotia spanning a period of 5.5 years.
2 Methods
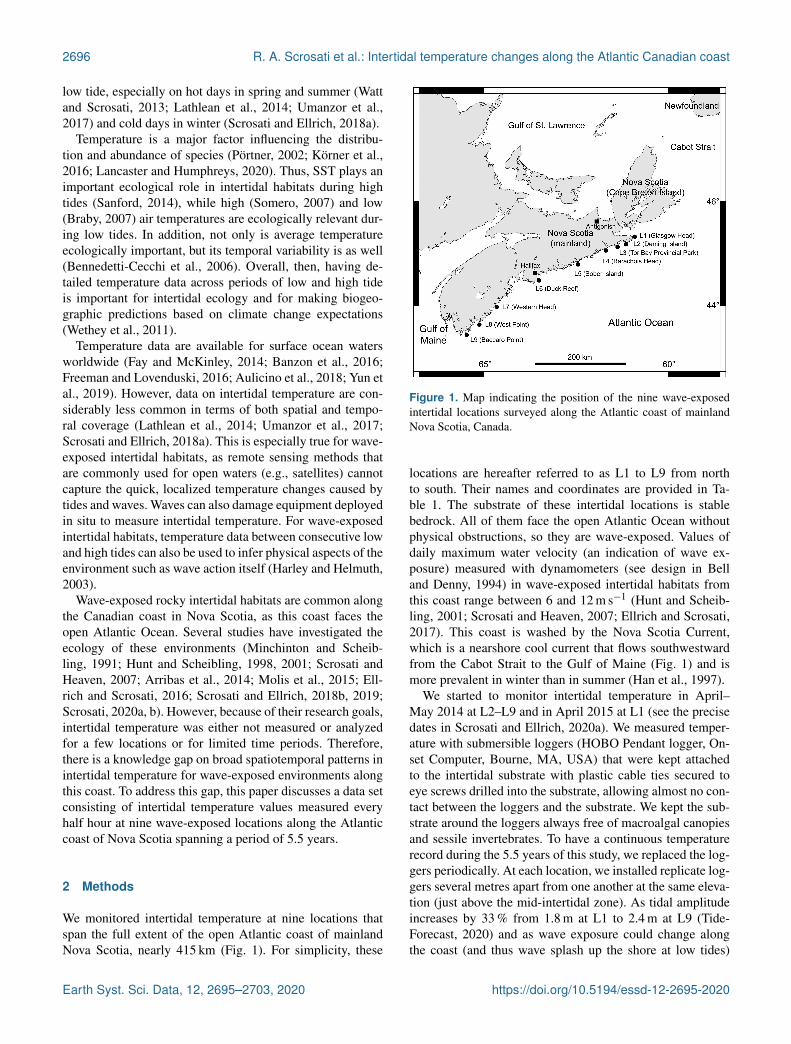
We monitored intertidal temperature at nine locations thatspan the full extent of the open Atlantic coast of mainlandNova Scotia, nearly 415 km (Fig. 1). For simplicity, these
Figure 1. Map indicating the position of the nine wave-exposedintertidal locations surveyed along the Atlantic coast of mainlandNova Scotia, Canada.
locations are hereafter referred to as L1 to L9 from northto south. Their names and coordinates are provided in Ta-ble 1. The substrate of these intertidal locations is stablebedrock. All of them face the open Atlantic Ocean withoutphysical obstructions, so they are wave-exposed. Values ofdaily maximum water velocity (an indication of wave ex-posure) measured with dynamometers (see design in Belland Denny, 1994) in wave-exposed intertidal habitats fromthis coast range between 6 and 12 m s−1 (Hunt and Scheib-ling, 2001; Scrosati and Heaven, 2007; Ellrich and Scrosati,2017). This coast is washed by the Nova Scotia Current,which is a nearshore cool current that flows southwestwardfrom the Cabot Strait to the Gulf of Maine (Fig. 1) and ismore prevalent in winter than in summer (Han et al., 1997).
We started to monitor intertidal temperature in April–May 2014 at L2–L9 and in April 2015 at L1 (see the precisedates in Scrosati and Ellrich, 2020a). We measured temper-ature with submersible loggers (HOBO Pendant logger, On-set Computer, Bourne, MA, USA) that were kept attachedto the intertidal substrate with plastic cable ties secured toeye screws drilled into the substrate, allowing almost no con-tact between the loggers and the substrate. We kept the sub-strate around the loggers always free of macroalgal canopiesand sessile invertebrates. To have a continuous temperaturerecord during the 5.5 years of this study, we replaced the log-gers periodically. At each location, we installed replicate log-gers several metres apart from one another at the same eleva-tion (just above the mid-intertidal zone). As tidal amplitudeincreases by 33 % from 1.8 m at L1 to 2.4 m at L9 (Tide-Forecast, 2020) and as wave exposure could change alongthe coast (and thus wave splash up the shore at low tides)
Earth Syst. Sci. Data, 12, 2695–2703, 2020 https://doi.org/10.5194/essd-12-2695-2020
R. A. Scrosati et al.: Intertidal temperature changes along the Atlantic Canadian coast 2697
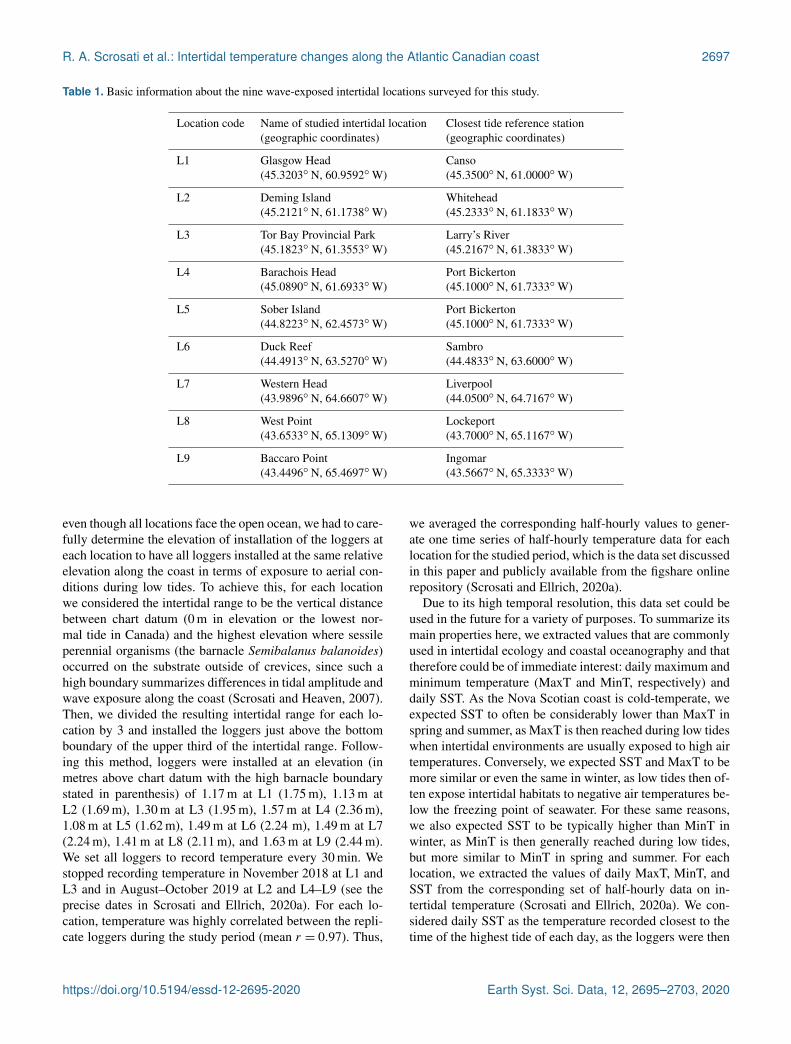
Table 1. Basic information about the nine wave-exposed intertidal locations surveyed for this study.
Location code Name of studied intertidal location(geographic coordinates)
Closest tide reference station(geographic coordinates)
L1 Glasgow Head(45.3203◦ N, 60.9592◦W)
Canso(45.3500◦ N, 61.0000◦W)
L2 Deming Island(45.2121◦ N, 61.1738◦W)
Whitehead(45.2333◦ N, 61.1833◦W)
L3 Tor Bay Provincial Park(45.1823◦ N, 61.3553◦W)
Larry’s River(45.2167◦ N, 61.3833◦W)
L4 Barachois Head(45.0890◦ N, 61.6933◦W)
Port Bickerton(45.1000◦ N, 61.7333◦W)
L5 Sober Island(44.8223◦ N, 62.4573◦W)
Port Bickerton(45.1000◦ N, 61.7333◦W)
L6 Duck Reef(44.4913◦ N, 63.5270◦W)
Sambro(44.4833◦ N, 63.6000◦W)
L7 Western Head(43.9896◦ N, 64.6607◦W)
Liverpool(44.0500◦ N, 64.7167◦W)
L8 West Point(43.6533◦ N, 65.1309◦W)
Lockeport(43.7000◦ N, 65.1167◦W)
L9 Baccaro Point(43.4496◦ N, 65.4697◦W)
Ingomar(43.5667◦ N, 65.3333◦W)
even though all locations face the open ocean, we had to care-fully determine the elevation of installation of the loggers ateach location to have all loggers installed at the same relativeelevation along the coast in terms of exposure to aerial con-ditions during low tides. To achieve this, for each locationwe considered the intertidal range to be the vertical distancebetween chart datum (0 m in elevation or the lowest nor-mal tide in Canada) and the highest elevation where sessileperennial organisms (the barnacle Semibalanus balanoides)occurred on the substrate outside of crevices, since such ahigh boundary summarizes differences in tidal amplitude andwave exposure along the coast (Scrosati and Heaven, 2007).Then, we divided the resulting intertidal range for each lo-cation by 3 and installed the loggers just above the bottomboundary of the upper third of the intertidal range. Follow-ing this method, loggers were installed at an elevation (inmetres above chart datum with the high barnacle boundarystated in parenthesis) of 1.17 m at L1 (1.75 m), 1.13 m atL2 (1.69 m), 1.30 m at L3 (1.95 m), 1.57 m at L4 (2.36 m),1.08 m at L5 (1.62 m), 1.49 m at L6 (2.24 m), 1.49 m at L7(2.24 m), 1.41 m at L8 (2.11 m), and 1.63 m at L9 (2.44 m).We set all loggers to record temperature every 30 min. Westopped recording temperature in November 2018 at L1 andL3 and in August–October 2019 at L2 and L4–L9 (see theprecise dates in Scrosati and Ellrich, 2020a). For each lo-cation, temperature was highly correlated between the repli-cate loggers during the study period (mean r = 0.97). Thus,
we averaged the corresponding half-hourly values to gener-ate one time series of half-hourly temperature data for eachlocation for the studied period, which is the data set discussedin this paper and publicly available from the figshare onlinerepository (Scrosati and Ellrich, 2020a).
Due to its high temporal resolution, this data set could beused in the future for a variety of purposes. To summarize itsmain properties here, we extracted values that are commonlyused in intertidal ecology and coastal oceanography and thattherefore could be of immediate interest: daily maximum andminimum temperature (MaxT and MinT, respectively) anddaily SST. As the Nova Scotian coast is cold-temperate, weexpected SST to often be considerably lower than MaxT inspring and summer, as MaxT is then reached during low tideswhen intertidal environments are usually exposed to high airtemperatures. Conversely, we expected SST and MaxT to bemore similar or even the same in winter, as low tides then of-ten expose intertidal habitats to negative air temperatures be-low the freezing point of seawater. For these same reasons,we also expected SST to be typically higher than MinT inwinter, as MinT is then generally reached during low tides,but more similar to MinT in spring and summer. For eachlocation, we extracted the values of daily MaxT, MinT, andSST from the corresponding set of half-hourly data on in-tertidal temperature (Scrosati and Ellrich, 2020a). We con-sidered daily SST as the temperature recorded closest to thetime of the highest tide of each day, as the loggers were then
https://doi.org/10.5194/essd-12-2695-2020 Earth Syst. Sci. Data, 12, 2695–2703, 2020
2698 R. A. Scrosati et al.: Intertidal temperature changes along the Atlantic Canadian coast
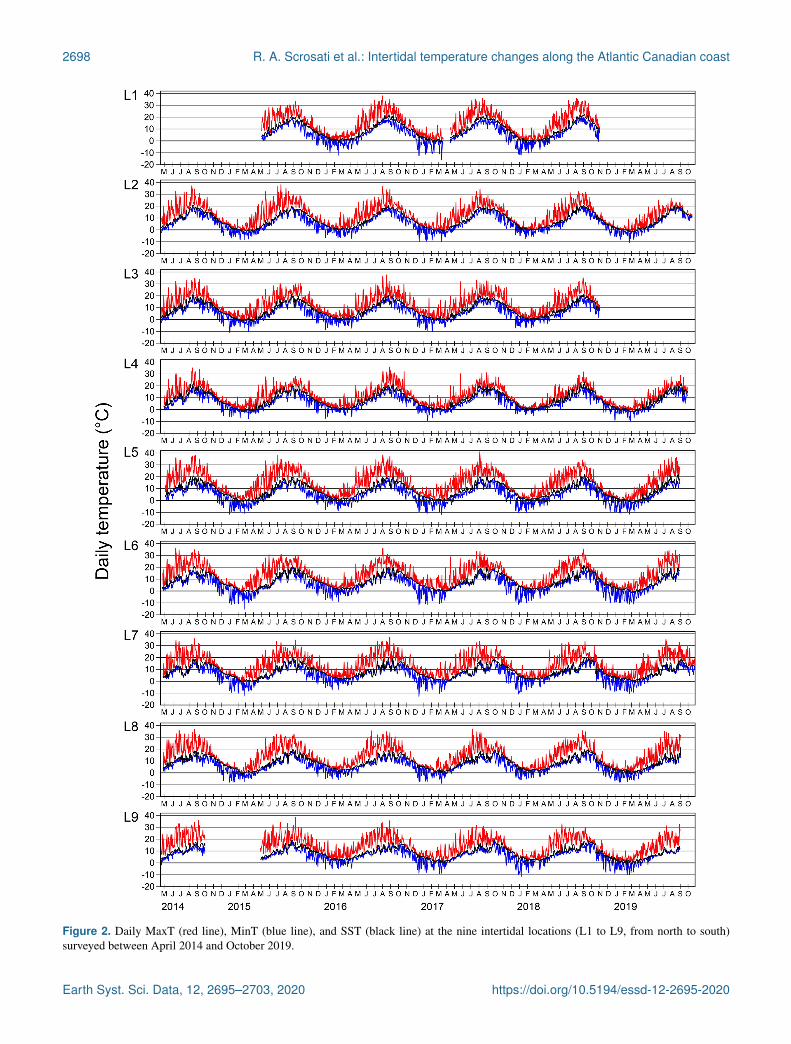
Figure 2. Daily MaxT (red line), MinT (blue line), and SST (black line) at the nine intertidal locations (L1 to L9, from north to south)surveyed between April 2014 and October 2019.
Earth Syst. Sci. Data, 12, 2695–2703, 2020 https://doi.org/10.5194/essd-12-2695-2020
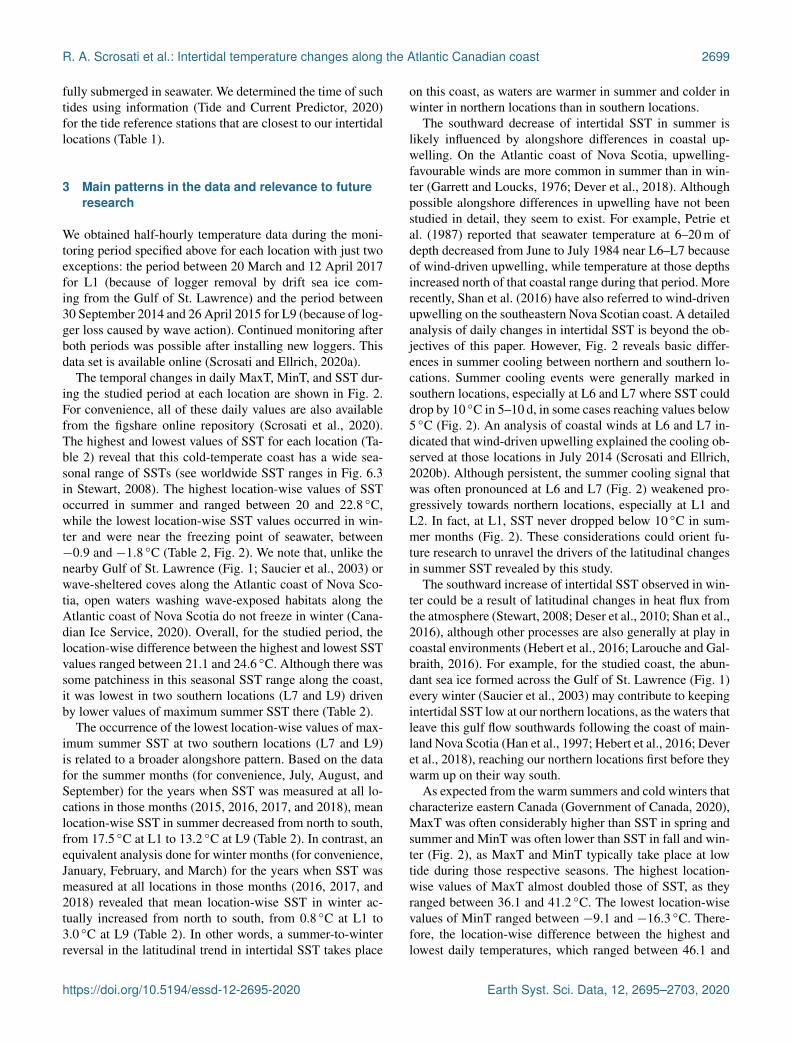
R. A. Scrosati et al.: Intertidal temperature changes along the Atlantic Canadian coast 2699
fully submerged in seawater. We determined the time of suchtides using information (Tide and Current Predictor, 2020)for the tide reference stations that are closest to our intertidallocations (Table 1).
3 Main patterns in the data and relevance to futureresearch
We obtained half-hourly temperature data during the moni-toring period specified above for each location with just twoexceptions: the period between 20 March and 12 April 2017for L1 (because of logger removal by drift sea ice com-ing from the Gulf of St. Lawrence) and the period between30 September 2014 and 26 April 2015 for L9 (because of log-ger loss caused by wave action). Continued monitoring afterboth periods was possible after installing new loggers. Thisdata set is available online (Scrosati and Ellrich, 2020a).
The temporal changes in daily MaxT, MinT, and SST dur-ing the studied period at each location are shown in Fig. 2.For convenience, all of these daily values are also availablefrom the figshare online repository (Scrosati et al., 2020).The highest and lowest values of SST for each location (Ta-ble 2) reveal that this cold-temperate coast has a wide sea-sonal range of SSTs (see worldwide SST ranges in Fig. 6.3in Stewart, 2008). The highest location-wise values of SSToccurred in summer and ranged between 20 and 22.8 ◦C,while the lowest location-wise SST values occurred in win-ter and were near the freezing point of seawater, between−0.9 and −1.8 ◦C (Table 2, Fig. 2). We note that, unlike thenearby Gulf of St. Lawrence (Fig. 1; Saucier et al., 2003) orwave-sheltered coves along the Atlantic coast of Nova Sco-tia, open waters washing wave-exposed habitats along theAtlantic coast of Nova Scotia do not freeze in winter (Cana-dian Ice Service, 2020). Overall, for the studied period, thelocation-wise difference between the highest and lowest SSTvalues ranged between 21.1 and 24.6 ◦C. Although there wassome patchiness in this seasonal SST range along the coast,it was lowest in two southern locations (L7 and L9) drivenby lower values of maximum summer SST there (Table 2).
The occurrence of the lowest location-wise values of max-imum summer SST at two southern locations (L7 and L9)is related to a broader alongshore pattern. Based on the datafor the summer months (for convenience, July, August, andSeptember) for the years when SST was measured at all lo-cations in those months (2015, 2016, 2017, and 2018), meanlocation-wise SST in summer decreased from north to south,from 17.5 ◦C at L1 to 13.2 ◦C at L9 (Table 2). In contrast, anequivalent analysis done for winter months (for convenience,January, February, and March) for the years when SST wasmeasured at all locations in those months (2016, 2017, and2018) revealed that mean location-wise SST in winter ac-tually increased from north to south, from 0.8 ◦C at L1 to3.0 ◦C at L9 (Table 2). In other words, a summer-to-winterreversal in the latitudinal trend in intertidal SST takes place
on this coast, as waters are warmer in summer and colder inwinter in northern locations than in southern locations.
The southward decrease of intertidal SST in summer islikely influenced by alongshore differences in coastal up-welling. On the Atlantic coast of Nova Scotia, upwelling-favourable winds are more common in summer than in win-ter (Garrett and Loucks, 1976; Dever et al., 2018). Althoughpossible alongshore differences in upwelling have not beenstudied in detail, they seem to exist. For example, Petrie etal. (1987) reported that seawater temperature at 6–20 m ofdepth decreased from June to July 1984 near L6–L7 becauseof wind-driven upwelling, while temperature at those depthsincreased north of that coastal range during that period. Morerecently, Shan et al. (2016) have also referred to wind-drivenupwelling on the southeastern Nova Scotian coast. A detailedanalysis of daily changes in intertidal SST is beyond the ob-jectives of this paper. However, Fig. 2 reveals basic differ-ences in summer cooling between northern and southern lo-cations. Summer cooling events were generally marked insouthern locations, especially at L6 and L7 where SST coulddrop by 10 ◦C in 5–10 d, in some cases reaching values below5 ◦C (Fig. 2). An analysis of coastal winds at L6 and L7 in-dicated that wind-driven upwelling explained the cooling ob-served at those locations in July 2014 (Scrosati and Ellrich,2020b). Although persistent, the summer cooling signal thatwas often pronounced at L6 and L7 (Fig. 2) weakened pro-gressively towards northern locations, especially at L1 andL2. In fact, at L1, SST never dropped below 10 ◦C in sum-mer months (Fig. 2). These considerations could orient fu-ture research to unravel the drivers of the latitudinal changesin summer SST revealed by this study.
The southward increase of intertidal SST observed in win-ter could be a result of latitudinal changes in heat flux fromthe atmosphere (Stewart, 2008; Deser et al., 2010; Shan et al.,2016), although other processes are also generally at play incoastal environments (Hebert et al., 2016; Larouche and Gal-braith, 2016). For example, for the studied coast, the abun-dant sea ice formed across the Gulf of St. Lawrence (Fig. 1)every winter (Saucier et al., 2003) may contribute to keepingintertidal SST low at our northern locations, as the waters thatleave this gulf flow southwards following the coast of main-land Nova Scotia (Han et al., 1997; Hebert et al., 2016; Deveret al., 2018), reaching our northern locations first before theywarm up on their way south.
As expected from the warm summers and cold winters thatcharacterize eastern Canada (Government of Canada, 2020),MaxT was often considerably higher than SST in spring andsummer and MinT was often lower than SST in fall and win-ter (Fig. 2), as MaxT and MinT typically take place at lowtide during those respective seasons. The highest location-wise values of MaxT almost doubled those of SST, as theyranged between 36.1 and 41.2 ◦C. The lowest location-wisevalues of MinT ranged between −9.1 and −16.3 ◦C. There-fore, the location-wise difference between the highest andlowest daily temperatures, which ranged between 46.1 and
https://doi.org/10.5194/essd-12-2695-2020 Earth Syst. Sci. Data, 12, 2695–2703, 2020
2700 R. A. Scrosati et al.: Intertidal temperature changes along the Atlantic Canadian coast
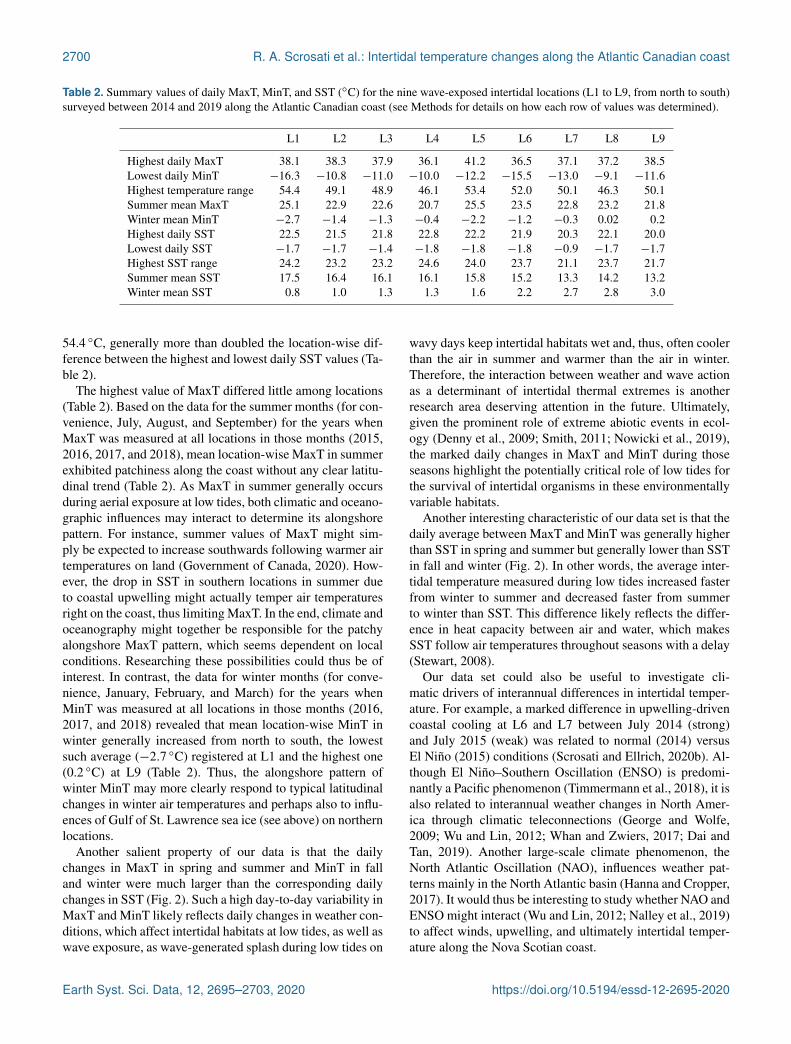
Table 2. Summary values of daily MaxT, MinT, and SST (◦C) for the nine wave-exposed intertidal locations (L1 to L9, from north to south)surveyed between 2014 and 2019 along the Atlantic Canadian coast (see Methods for details on how each row of values was determined).
L1 L2 L3 L4 L5 L6 L7 L8 L9
Highest daily MaxT 38.1 38.3 37.9 36.1 41.2 36.5 37.1 37.2 38.5Lowest daily MinT −16.3 −10.8 −11.0 −10.0 −12.2 −15.5 −13.0 −9.1 −11.6Highest temperature range 54.4 49.1 48.9 46.1 53.4 52.0 50.1 46.3 50.1Summer mean MaxT 25.1 22.9 22.6 20.7 25.5 23.5 22.8 23.2 21.8Winter mean MinT −2.7 −1.4 −1.3 −0.4 −2.2 −1.2 −0.3 0.02 0.2Highest daily SST 22.5 21.5 21.8 22.8 22.2 21.9 20.3 22.1 20.0Lowest daily SST −1.7 −1.7 −1.4 −1.8 −1.8 −1.8 −0.9 −1.7 −1.7Highest SST range 24.2 23.2 23.2 24.6 24.0 23.7 21.1 23.7 21.7Summer mean SST 17.5 16.4 16.1 16.1 15.8 15.2 13.3 14.2 13.2Winter mean SST 0.8 1.0 1.3 1.3 1.6 2.2 2.7 2.8 3.0
54.4 ◦C, generally more than doubled the location-wise dif-ference between the highest and lowest daily SST values (Ta-ble 2).
The highest value of MaxT differed little among locations(Table 2). Based on the data for the summer months (for con-venience, July, August, and September) for the years whenMaxT was measured at all locations in those months (2015,2016, 2017, and 2018), mean location-wise MaxT in summerexhibited patchiness along the coast without any clear latitu-dinal trend (Table 2). As MaxT in summer generally occursduring aerial exposure at low tides, both climatic and oceano-graphic influences may interact to determine its alongshorepattern. For instance, summer values of MaxT might sim-ply be expected to increase southwards following warmer airtemperatures on land (Government of Canada, 2020). How-ever, the drop in SST in southern locations in summer dueto coastal upwelling might actually temper air temperaturesright on the coast, thus limiting MaxT. In the end, climate andoceanography might together be responsible for the patchyalongshore MaxT pattern, which seems dependent on localconditions. Researching these possibilities could thus be ofinterest. In contrast, the data for winter months (for conve-nience, January, February, and March) for the years whenMinT was measured at all locations in those months (2016,2017, and 2018) revealed that mean location-wise MinT inwinter generally increased from north to south, the lowestsuch average (−2.7 ◦C) registered at L1 and the highest one(0.2 ◦C) at L9 (Table 2). Thus, the alongshore pattern ofwinter MinT may more clearly respond to typical latitudinalchanges in winter air temperatures and perhaps also to influ-ences of Gulf of St. Lawrence sea ice (see above) on northernlocations.
Another salient property of our data is that the dailychanges in MaxT in spring and summer and MinT in falland winter were much larger than the corresponding dailychanges in SST (Fig. 2). Such a high day-to-day variability inMaxT and MinT likely reflects daily changes in weather con-ditions, which affect intertidal habitats at low tides, as well aswave exposure, as wave-generated splash during low tides on
wavy days keep intertidal habitats wet and, thus, often coolerthan the air in summer and warmer than the air in winter.Therefore, the interaction between weather and wave actionas a determinant of intertidal thermal extremes is anotherresearch area deserving attention in the future. Ultimately,given the prominent role of extreme abiotic events in ecol-ogy (Denny et al., 2009; Smith, 2011; Nowicki et al., 2019),the marked daily changes in MaxT and MinT during thoseseasons highlight the potentially critical role of low tides forthe survival of intertidal organisms in these environmentallyvariable habitats.
Another interesting characteristic of our data set is that thedaily average between MaxT and MinT was generally higherthan SST in spring and summer but generally lower than SSTin fall and winter (Fig. 2). In other words, the average inter-tidal temperature measured during low tides increased fasterfrom winter to summer and decreased faster from summerto winter than SST. This difference likely reflects the differ-ence in heat capacity between air and water, which makesSST follow air temperatures throughout seasons with a delay(Stewart, 2008).
Our data set could also be useful to investigate cli-matic drivers of interannual differences in intertidal temper-ature. For example, a marked difference in upwelling-drivencoastal cooling at L6 and L7 between July 2014 (strong)and July 2015 (weak) was related to normal (2014) versusEl Niño (2015) conditions (Scrosati and Ellrich, 2020b). Al-though El Niño–Southern Oscillation (ENSO) is predomi-nantly a Pacific phenomenon (Timmermann et al., 2018), it isalso related to interannual weather changes in North Amer-ica through climatic teleconnections (George and Wolfe,2009; Wu and Lin, 2012; Whan and Zwiers, 2017; Dai andTan, 2019). Another large-scale climate phenomenon, theNorth Atlantic Oscillation (NAO), influences weather pat-terns mainly in the North Atlantic basin (Hanna and Cropper,2017). It would thus be interesting to study whether NAO andENSO might interact (Wu and Lin, 2012; Nalley et al., 2019)to affect winds, upwelling, and ultimately intertidal temper-ature along the Nova Scotian coast.
Earth Syst. Sci. Data, 12, 2695–2703, 2020 https://doi.org/10.5194/essd-12-2695-2020
R. A. Scrosati et al.: Intertidal temperature changes along the Atlantic Canadian coast 2701
4 Data availability
The full data set on half-hourly temperature measured at thenine intertidal locations between 2014 and 2019 is availablefrom the figshare online repository (Scrosati and Ellrich,2020a; https://doi.org/10.6084/m9.figshare.12462065.v1).The daily values of MaxT, MinT, and SST for these lo-cations during this time period are also available fromthe figshare online repository (Scrosati et al., 2020;https://doi.org/10.6084/m9.figshare.12453374.v1).
5 Conclusions
This is a unique data set because it describes intertidal tem-perature with a high temporal resolution during a period of5.5 years at nine wave-exposed locations spanning the fullextent of the Atlantic coast of mainland Nova Scotia. Themain patterns described above have revealed previously un-known latitudinal and seasonal trends in intertidal tempera-ture on this coast. The above considerations on the possiblemechanisms underlying these patterns should help orient fu-ture research on the drivers of thermal variation in these in-tertidal environments. Because of the temporal and spatialscales of this data set, future research using these data couldlead to theoretical advances in coastal oceanography and in-tertidal thermal ecology. Ultimately, this data set represents adetailed baseline on which to study the influence of climaticand oceanographic change on intertidal temperature variationon this cold-temperate coast.
Author contributions. RAS designed the study and wrote the pa-per. RAS and JAE led the field work and JAE and MJF the datacuration. JAE and MJF reviewed the paper before submission.
Competing interests. The authors declare that they have no con-flict of interest.
Acknowledgements. We thank Alexis Catalán, Carmen Denfeld,Willy Petzold, and Maike Willers for field assistance and two re-viewers for constructive comments on an earlier version of this pa-per.
Financial support. This study was funded by grants awarded toRicardo A. Scrosati by the Natural Sciences and Engineering Re-search Council of Canada (NSERC Discovery Grant no. 311624),the Canada Research Chairs program (CRC grant no. 210283),and the Canada Foundation for Innovation (CFI Leaders Opportu-nity Grant no. 202034) and by a postdoctoral fellowship awardedto Julius A. Ellrich by the German Academic Exchange Service(DAAD fellowship no. 91617093).
Review statement. This paper was edited by Giuseppe M. R.Manzella and reviewed by two anonymous referees.
References
Arribas, L. P., Donnarumma, L., Palomo, M. G., and Scrosati, R.A.: Intertidal mussels as ecosystem engineers: their associatedinvertebrate biodiversity under contrasting wave exposures, Mar.Biodiv., 44, 203–211, 2014.
Aulicino, G., Cotroneo, Y., Ansorge, I., van den Berg, M., Cesarano,C., Belmonte Rivas, M., and Olmedo Casal, E.: Sea surface salin-ity and temperature in the southern Atlantic Ocean from SouthAfrican icebreakers, 2010–2017, Earth Syst. Sci. Data, 10, 1227–1236, https://doi.org/10.5194/essd-10-1227-2018, 2018.
Banzon, V., Smith, T. M., Chin, T. M., Liu, C., and Hank-ins, W.: A long-term record of blended satellite and in situsea-surface temperature for climate monitoring, modeling andenvironmental studies, Earth Syst. Sci. Data, 8, 165–176,https://doi.org/10.5194/essd-8-165-2016, 2016.
Bell, E. C. and Denny, M. W.: Quantifying “wave exposure”: a sim-ple device for recording maximum velocity and results of its useat several field sites, J. Exp. Mar. Biol. Ecol., 181, 9–29, 1994.
Bennedetti-Cecchi, L., Bertocci, I., Vaselli, S., and Maggi, E.: Tem-poral variance reverses the impact of high mean intensity ofstress in climate change experiments, Ecology, 87, 2489–2499,2006.
Braby, C. E.: Cold stress, in: Encyclopedia of Tidepools and RockyShores, edited by: Denny, M. W. and Gaines, S. D., University ofCalifornia Press, Berkeley, 148–150, 2007.
Canadian Ice Service: Ice forecasts and observations, avail-able at: https://www.canada.ca/en/environment-climate-change/services/ice-forecasts-observations.html, last access: 3 Novem-ber 2020.
Dai, Y. and Tan, B.: On the role of the Eastern Pacific teleconnec-tion in ENSO impacts on wintertime weather over East Asia andNorth America, J. Clim., 32, 1217–1234, 2019.
Denny, M. W., Hunt, L. J. H., Miller, L. P., and Harley, C. D. G.: Onthe prediction of extreme ecological events, Ecol. Monogr., 79,397–421, 2009.
Deser, C., Alexander, M. A., Xie, S. P., and Phillips, A. S.: Seasurface temperature variability: patterns and mechanisms, Annu.Rev. Mar. Sci., 2, 115–143, 2010.
Dever, M., Skagseth, Ø., Drinkwater, K., and Hebert, D.: Frontal dy-namics of a buoyancy-driven coastal current: quantifying buoy-ancy, wind, and isopycnal tilting influence on the Nova Scotiacurrent, J. Geophys. Res.-Oceans, 123, 4988–5003, 2018.
Ellrich, J. A. and Scrosati, R. A.: Water motion modulates preda-tor nonconsumptive limitation of prey recruitment, Ecosphere, 7,e01402, https://doi.org/10.1002/ecs2.1402, 2016.
Ellrich, J. A. and Scrosati, R. A.: Maximum water velocities inwave-exposed rocky intertidal habitats from Deming Island,Atlantic coast of Nova Scotia, Canada, Pangaea, Data set,https://doi.pangaea.de/10.1594/pangaea.880722, 2017.
Fay, A. R. and McKinley, G. A.: Global open-ocean biomes: meanand temporal variability, Earth Syst. Sci. Data, 6, 273–284,https://doi.org/10.5194/essd-6-273-2014, 2014.
Freeman, N. M. and Lovenduski, N. S.: Mapping the Antarctic Po-lar Front: weekly realizations from 2002 to 2014, Earth Syst.
https://doi.org/10.5194/essd-12-2695-2020 Earth Syst. Sci. Data, 12, 2695–2703, 2020
2702 R. A. Scrosati et al.: Intertidal temperature changes along the Atlantic Canadian coast
Sci. Data, 8, 191–198, https://doi.org/10.5194/essd-8-191-2016,2016.
Garrett, C. J. R. and Loucks, R. H.: Upwelling along the Yarmouthshore of Nova Scotia, J. Fish. Res. Board Can., 33, 116–117,1976.
George, S. S. and Wolfe, S. A.: El Niño stills winter winds acrossthe southern Canadian Prairies, Geophys. Res. Lett., 36, L23806,https://doi.org/10.1029/2009GL041282, 2009.
Government of Canada: Past weather and climate, Historical data,available at: http://climate.weather.gc.ca/historical_data/search_historic_data_e.html, last access: 3 November 2020.
Han, G., Hannah, C. G., Loder, J. W., and Smith, P. C.: Seasonalvariation of the three-dimensional mean circulation over the Sco-tian Shelf, J. Geophys. Res., 102, 1011–1025, 1997.
Hanna, E. and Cropper, T. E.: North Atlantic Oscillation, OxfordResearch Encyclopedia of Climate Science, Oxford UniversityPress, https://doi.org/10.1093/acrefore/9780190228620.013.22,2017.
Harley, C. D. G. and Helmuth, B. S. T.: Local- and regional-scaleeffects of wave exposure, thermal stress, and absolute versuseffective shore level on patterns of intertidal zonation, Limnol.Oceanogr., 48, 1498–1508, 2003.
Hebert, D., Pettipas, R., Brickman, D., and Dever, M.: Meteorolog-ical, sea ice, and physical oceanographic conditions on the Sco-tian Shelf and in the Gulf of Maine during 2015, DFO Can. Sci.Advis. Sec. Res. Doc. 2016/083, 2016.
Hunt, H. L. and Scheibling, R. E.: Effects of whelk (Nucella lapillus(L.)) predation on mussel (Mytilus trossulus (Gould), M . edulis(L.)) assemblages in tidepools and on emergent rock on a wave-exposed rocky shore in Nova Scotia, Canada, J. Exp. Mar. Biol.Ecol., 226, 87–113, 1998.
Hunt, H. L. and Scheibling, R. E.: Patch dynamics of mussels onrocky shores: integrating process to understand pattern, Ecology,82, 3213–3231, 2001.
Körner, C., Basler, D., Hoch, G., Kollas, C., Lenz, A., Randin, C.F., Vitasse, Y., and Zimmermann, N. E.: Where, why and how?Explaining the low-temperature range limits of temperate treespecies, J. Ecol., 104, 1076–1088, 2016.
Lancaster, L. T. and Humphreys, A. M.: Global variation in the ther-mal tolerances of plants, P. Natl. Acad. Sci. USA, 117, 13580–13587, 2020.
Larouche, P. and Galbraith, P. S.: Canadian coastal seas and GreatLakes sea surface temperature climatology and recent trends,Can. J. Remote Sens., 42, 243–258, 2016.
Lathlean, J. A., Ayre, D. J., and Minchinton, T. E.: Estimating latitu-dinal variability in extreme heat stress on rocky intertidal shores,J. Biogeogr., 41, 1478–1491, 2014.
Menge, B. A. and Branch, G. M.: Rocky intertidal communities, in:Marine Community Ecology, edited by: Bertness, M. D., Gaines,S. D., and Hay, M. H., Sinauer, Sunderland, 221–251, 2001.
Minchinton, T. E. and Scheibling, R. E.: The influence of larvalsupply and settlement on the population structure of barnacles,Ecology, 72, 1867–1879, 1991.
Molis, M., Scrosati, R. A., El-Belely, E. F., Lesniowski, T., andWahl, M.: Wave-induced changes in seaweed toughness entailplastic modifications in snail traits maintaining consumption ef-ficacy, J. Ecol., 103, 851–859, 2015.
Nalley, D., Adamowski, J., Biswas, A., Gharabaghi, B., and Hu,W.: A multiscale and multivariate analysis of precipitation and
streamflow variability in relation to ENSO, NAO, and PDO, J.Hydrol., 574, 288–307, 2019.
Nowicki, R., Heithaus, M., Thomson, J., Burkholder, D., Gastrich,K., and Wirsing, A.: Indirect legacy effects of an extreme cli-matic event on a marine megafaunal community, Ecol. Monogr.,89, e01365, https://doi.org/10.1002/ecm.1365, 2019.
Petrie, B., Topliss, B. J., and Wright, D. G.: Coastal upwelling andeddy development off Nova Scotia, J. Geophys. Res., 29, 12979–12991, 1987.
Pörtner, H. O.: Climate variations and the physiological basis oftemperature-dependent biogeography: systemic to molecular hi-erarchy of thermal tolerance in animals, Comp. Biochem. Phys-iol. Part A: Mol. Integr. Physiol., 132, 739–761, 2002.
Raffaelli, D. and Hawkins, S.: Intertidal Ecology, Chapman & Hall,London, 1999.
Sanford, E.: The biogeography of marine communities, in: MarineCommunity Ecology and Conservation, edited by: Bertness, M.D., Bruno, J. F., Silliman, B. R., and Stachowicz, J. J., Sinauer,Sunderland, 131–163, 2014.
Saucier, F. J., Roy, F., Gilbert, D., Pellerin, P., and Ritchie, H.: Mod-eling the formation and circulation processes of water masses andsea ice in the Gulf of St. Lawrence, Canada, J. Geophys. Res.,108, 3269, https://doi.org/10.1029/2000JC000686, 2003.
Scrosati, R. A.: Upwelling spike and marked SST drop after thearrival of cyclone Dorian to the Atlantic Canadian coast, J. SeaRes., 159, 101888, https://doi.org/10.1016/j.seares.2020.101888,2020a.
Scrosati, R. A.: Cyclone-driven coastal upwelling and cooling de-pend on location relative to the cyclone’s path: evidence fromDorian’s arrival to Atlantic Canada, Front. Mar. Sci., 7, 651,https://doi.org/10.3389/fmars.2020.00651, 2020b.
Scrosati, R. A. and Ellrich, J. A.: Thermal moderation of the inter-tidal zone by seaweed canopies in winter, Mar. Biol., 165, 115,https://doi.org/10.1007/s00227-018-3374-3, 2018a.
Scrosati, R. A. and Ellrich, J. A.: Benthic-pelagic cou-pling and bottom-up forcing in rocky intertidal communi-ties along the Atlantic Canadian coast, Ecosphere, 9, e02229,https://doi.org/10.1002/ecs2.2229, 2018b.
Scrosati, R. A. and Ellrich, J. A.: A 5-year study (2014–2018) ofthe relationship between coastal phytoplankton abundance andintertidal barnacle size along the Atlantic Canadian coast, PeerJ,7, e6892, https://doi.org/10.7717/peerj.6892, 2019.
Scrosati, R. A. and Ellrich, J. A.: Half-hourly temperature data mea-sured at nine wave-exposed intertidal locations along the Atlanticcoast of Nova Scotia, Canada (2014–2019), figshare data set,https://doi.org/10.6084/m9.figshare.12462065.v1, 2020a.
Scrosati, R. A. and Ellrich, J. A.: Marked contrast in wind-drivenupwelling on the southeastern Nova Scotia coast in July of twoyears differing in ENSO conditions, Oceanol. Hydrobiol. Stud.,49, 81–87, 2020b.
Scrosati, R. A., Ellrich, J. A., and Freeman, M. J.: DailySST, maximum temperature, and minimum temperature atnine wave-exposed intertidal locations along the Atlanticcoast of Nova Scotia, Canada (2014–2019), figshare data set,https://doi.org/10.6084/m9.figshare.12453374.v1, 2020.
Scrosati, R. and Heaven, C.: Spatial trends in community rich-ness, diversity, and evenness across rocky intertidal environmen-tal stress gradients in eastern Canada, Mar. Ecol. Prog. Ser., 342,1–14, 2007.
Earth Syst. Sci. Data, 12, 2695–2703, 2020 https://doi.org/10.5194/essd-12-2695-2020
R. A. Scrosati et al.: Intertidal temperature changes along the Atlantic Canadian coast 2703
Shan, S., Sheng, J., Ohashi, K., and Dever, M.: Assessing the perfor-mance of a multi-nested ocean circulation model using satelliteremote sensing and in-situ observations, Satell. Oceanogr. Mete-orol., 1, 39–59, 2016.
Smith, M. D.: An ecological perspective on extreme climatic events:a synthetic definition and framework to guide future research, J.Ecol., 99, 656–663, 2011.
Somero, G.: Heat stress, in: Encyclopedia of Tidepools and RockyShores, edited by: Denny, M. W. and Gaines, S. D., University ofCalifornia Press, Berkeley, 266–270, 2007.
Stewart, R. H.: Introduction to physical oceanography, Open Text-book Library, available at: https://open.umn.edu/opentextbooks/textbooks/introduction-to-physical-oceanography (last access:3 November 2020), 2008.
Tide and Current Predictor: Tidal height and current site selection,available at: http://tbone.biol.sc.edu/tide/index.html, last access:3 November 2020.
Tide-Forecast: Tide times and tide charts worldwide, available at:http://www.tide-forecast.com, last access: 3 November 2020.
Timmermann, A., An, S., Kug, J. S., Jin, F. F., Cai, W., Capotondi,A., Cobb, K., Lengaigne, M., McPhaden, M. J., Stuecker, M. F.,Stein, K., Wittenberg, A. T., Yun, K. S., Bayr, T., Chen, H. C.,Chikamoto, Y., Dewitte, B., Dommenget, D., Grothe, P., Guil-yardi, E., Ham, Y. G., Hayashi, M., Ineson, S., Kang, D., Kim,S., Kim, W., Lee, J. Y., Li, T., Luo, J. J., McGregor, S., Planton,Y., Power, S., Rashid, H., Ren, H. L., Santoso, A., Takahashi, K.,Todd, A., Wang, G., Wang, G., Xie, R., Yang, W. H., Yeh, S. W.,Yoon, J., Zeller, E., and Zhang, X.: El Niño–Southern Oscillationcomplexity, Nature, 559, 535–545, 2018.
Umanzor, S., Ladah, L., Calderón-Aguilera, L. E., and Zertuche-González, J. A.: Intertidal macroalgae influence macroinverte-brate distribution across stress scenarios, Mar. Ecol. Prog. Ser.,584, 67–77, 2017.
Watt, C. A. and Scrosati, R. A.: Bioengineer effects on understoryspecies richness, diversity, and composition change along an en-vironmental stress gradient: experimental and mensurative evi-dence, Estuar. Coast. Shelf Sci., 123, 10–18, 2013.
Wethey, D. S., Woodin, S. A., Hilbish, T. J., Jones, S. J., Lima, F.P., and Brannock, P. M.: Response of intertidal populations toclimate: effects of extreme events versus long term change, J.Exp. Mar. Biol. Ecol., 400, 132–144, 2011.
Whan, K. and Zwiers, F.: The impact of ENSO and the NAO on ex-treme winter precipitation in North America in observations andregional climate models, Clim. Dynam., 48, 1401–1411, 2017.
Wu, Z. and Lin, H.: Interdecadal variability of the ENSO–NorthAtlantic Oscillation connection in boreal summer, Q. J. Roy. Me-teor. Soc., 138, 1668–1675, 2012.
Yun, X., Huang, B., Cheng, J., Xu, W., Qiao, S., and Li, Q.:A new merge of global surface temperature datasets since thestart of the 20th century, Earth Syst. Sci. Data, 11, 1629–1643,https://doi.org/10.5194/essd-11-1629-2019, 2019.
https://doi.org/10.5194/essd-12-2695-2020 Earth Syst. Sci. Data, 12, 2695–2703, 2020