Embed Size (px)
Citation preview

Half Year Financial Report
June 30, 2010

AREVA Half Year Financial Report June 30, 2010
2
General notes
This financial report contains statements on the objectives, prospects and growth areas for the AREVA group. This information is not historical data and must not be taken as a guarantee that the facts and data set out will be realized, or that the objectives will be attained. The statements of prospects in this financial report also address known and unknown risks, uncertainties and other factors that may, if they happen, have the effect that future income, performance and achievements of the AREVA group might be significantly different from the objectives set and put forward. These factors may in particular include changes in the international economic and commercial environment and the risk factors set out in the 2.1 section. AREVA has no obligation to update the information on prospects contained in this document, subject to the ongoing disclosure obligations applicable to companies whose stock is admitted to trading on regulated markets.
This is a free translation into English from AREVA group’s half year 2010 financial report, which is issued in the French language and is provided solely for the convenience of English speaking readers.
Rapport financier semestriel AREVA 30 juin 2010
3
SOMMAIRE
1 Person responsible ............................................................................................................... 4
1.1 Person responsible for the half year report ....................................................................... 4
1.2 Certification of the half year report by the person responsible........................................... 4
2 Half year business report...................................................................................................... 5
2.1 Significant events.............................................................................................................. 5
2.2 Summary data .................................................................................................................. 8
2.3 Segment reporting .......................................................................................................... 11
2.4 Backlog........................................................................................................................... 12
2.5 Income statement ........................................................................................................... 13
2.6 Cash flow........................................................................................................................ 19
2.7 Balance sheet items ....................................................................................................... 22
2.8 Review by business ........................................................................................................ 25
2.9 Events subsequent to closing ......................................................................................... 28
2.10 Outlook........................................................................................................................... 29
3 Statutory Auditors’ report on the 2010 half-year financial information – For the period January 1 to June 30, 2010 ....................................................................................................... 30
4 Condensed consolidated financial statement at June 30, 2010.......................................... 32
4.1 Consolidated income statement...................................................................................... 32
4.2 Consolidated comprehensive income ............................................................................. 34
4.3 Consolidated balance sheet............................................................................................ 35
4.4 Consolidated cash flow statement................................................................................... 37
4.5 Statement of change in consolidated shareholders' equity.............................................. 39
4.6 Segment information....................................................................................................... 41
4.7 Notes to the consolidated financial statements for the period ending June 30, 2010....... 45

AREVA Half Year Financial Report June 30, 2010
4
1 Person responsible
1.1 Person responsible for the half year report
Mrs. Anne Lauvergeon, Chief Executive Officer of AREVA
1.2 Certification of the half year report by the person responsible
"I certify, to the best of my knowledge, that the condensed financial statements for the first half of 2010 are prepared in accordance with applicable accounting standards and give a true and fair view of the net worth, financial position and income of the company and all the companies included in consolidation, and that the half year financial report herewith presents a fair view of the major events that occurred during the first six months of the fiscal year, of their effect on the financial statements and of the main transactions between related parties and gives a description of the main risks and main uncertainties for the remaining six months of the financial year.
Paris, July 30, 2010
Mrs. Anne Lauvergeon Chief Executive Officer of AREVA

Rapport financier semestriel AREVA 30 juin 2010
5
2 Half year business report
2.1 Significant events
2.1.1 Highlights of the period
Concerning business strategy and shareholding struc ture
� The AREVA group signed an agreement setting out the legal and financial terms and conditions for the disposal of its Transmission & Distribution business. The agreement took effect June 7, 2010 following the approval of the competition authorities and the decree following the recommendation of the French Commission des Participations et des Transferts, the administration in charge of approving sales of government-owned assets.
� AREVA adopted a new organization for its nuclear and renewable operations that strengthens the synergies between the group’s professions and enhances customer satisfaction.
� The Eramet shareholders’ agreement between Sorame-Ceir and AREVA was renewed for a six-month period starting July 1, 2010.
� The Supervisory Board appointed Christophe Behar as a member to replace Philippe Pradel, who has stepped down. It also appointed René Ricol to replace Thierry Desmarest, who has stepped down. René Ricol will co-chair the Audit Committee with Guylaine Saucier, who has been appointed Chairman of the End-of-Life-Cycle Obligations Monitoring Committee, where she replaces François David.
� AREVA and JAEC signed a mining agreement for the uranium resources in Central Jordan. This announcement follows the agreement signed between AREVA and JAEC in October 2008 for the joint exploration of this area.
� AREVA CEO Anne Lauvergeon and Sang Soo Kim, CEO of the Korea Electric Power Corporation (KEPCO), signed an agreement for the Korean group to become a shareholder in the Imouraren mine in Niger.
� The US Department of Energy (DOE) granted a 2 billion dollar loan guarantee to AREVA to facilitate financing of its uranium enrichment plant near Idaho Falls in the United States.
� At the Franco-Italian bilateral summit co-chaired by French President Nicolas Sarkozy and Italian Prime Minister Silvio Berlusconi, AREVA CEO Anne Lauvergeon signed three cooperative agreements in the field of nuclear energy with the group's industrial and academic partners.
� The US Nuclear Regulatory Commission (NRC) has authorized the installation of AREVA's digital instrumentation & control system upgrade in a US nuclear power station. AREVA is the first and only supplier to receive NRC approval for full application of a safety-related digital I&C system.
� ATMEA announced the signature of an agreement with French nuclear safety authority ASN for a review of the safety options of ATMEA1TM, the 1,100 MWe pressurized water reactor developed by the joint venture.
� AREVA acquired Ausra, a US corporation based in Mountain View, California. The company's name was changed to AREVA Solar. AREVA Solar offers concentrated solar power solutions for power generation and industrial steam production. With this acquisition, AREVA expands its portfolio of renewable energy solutions and becomes a world leader in concentrated solar thermal energy.
� AREVA acquired the remaining 49% of Multibrid, a German wind turbine manufacturer, which

AREVA Half Year Financial Report June 30, 2010
6
becomes AREVA Wind, a wholly-owned subsidiary of the group. This acquisition will raise its production capacity in response to the growth of this burgeoning industry. This new platform will also include the rotor blade manufacturing division, formerly PN Rotor.
In the industrial arena
� AREVA inaugurated the first seawater desalination plant in Namibia, located 30 kilometers north of Swakopmund on the Atlantic coast. The inauguration marks the beginning of drinking water production at the plant and is a major breakthrough in the development of AREVA's mining project in Namibia.
� The AREVA-Siemens consortium submitted an operational schedule to its Finnish customer TVO, the future operator of the generation III+ Olkiluoto 3 (OL3) reactor, for the last phase of construction up to the loading of the fuel at the end of 2012.
� Construction of the OL3 EPR™ reactor in Finland has reached a new symbolic milestone with the installation of the reactor vessel in the reactor building.
� The first concrete has been poured for the second EPR™ reactor, under construction at the Taishan site in Guangdong province, southern China, by the Chinese utility CGNPC.
In the commercial arena
� INB (Industrias Nucleares do Brasil) and AREVA have signed a five-year conversion services supply contract for the Angra nuclear power complex in Brazil, including units 1 and 2 and soon unit 3.
� AREVA and VNIIAES1, a subsidiary of the Russian state nuclear corporation Rosatom, signed a contract for delivery of the Teleperm XS safety-related instrumentation & control systems for one of the two new 1200 MWe reactors to be built at the site.
� A consortium comprising AREVA and Siemens Energy was chosen to supply digital instrumentation & controls systems for supervision and protection of units 3 and 4 of the Mochovce nuclear power plant in Slovakia. Slovenské Elektrárne, a subsidiary of the Enel Group, is completing the construction of two VVER reactors (a type of pressurized water reactor technology).
� AREVA and Fresno Nuclear Energy Group (FNEG) announced that they have signed a memorandum of understanding to develop a clean energy park near Fresno, California, which will use the most advanced technologies, in particular nuclear power and renewable energies.
� AREVA signed a contract to supply MOX fuel to unit 3 of the Tomari nuclear power plant in Japan operated by Hokkaido Electric Power Company.
� AREVA and EDF have reached an agreement covering the transportation, treatment and recycling of used nuclear fuel.
� AREVA entered into an agreement with Sellafield Limited to design, supply and install a new fuel rod fabrication line for the Sellafield MOX Plant (SMP). AREVA will also supply related inspection equipment.
� AREVA announced the signature of three contracts totaling 260 million euros in the bioenergy sector in Brazil and Thailand.

Rapport financier semestriel AREVA 30 juin 2010
7
2.1.2 Transactions with related parties
Details of the main transactions with related parties are given in note 14 of the Notes to the Consolidated Financial Statements in this half year report.
2.1.3 Risk factors
The significant risks and uncertainties that the group faces are set out in Section 4 “Risk factors” of the 2009 Reference Document filed with the Autorité des Marchés Financiers and available on latter's website (www.amf-france.org.) as well as on the company’s website (www.areva.com). This description of the main risks remains valid as of the date of publication of this Report for the evaluation of major risks and uncertainties that could affect the group at the end of the current financial year. No significant risks or uncertainties are anticipated other than those set out in the Reference Document.

AREVA Half Year Financial Report June 30, 2010
8
2.2 Summary data
2.2.1 Financial indicators
(millions of euros) H1 2010 H1 2009 2010/2009 Change
Backlog 44,062 42,909 +2.7%
Revenue 4,158 3,908 +6.4%
Gross margin 390 240 +62.9%
Percentage of revenue 9.4% 6.1% +3.3 pts
Earnings before interest, taxes, depreciation and amortization (EBITDA) 215 248 -13.2%
Percentage of revenue 5.2% 6.3% -1.1 pt
Operating income (485) (170) (315)
Percentage of revenue -11.7% -4.4% -7.3 pts
Net financial income (172) 230 (402)
Net income attributable to owners of the parent 843 161 +682
Percentage of revenue 20.3% 4.1% +16.2 pts
Net operating Capex (985) (469) (516)
Operating cash flow before tax (1,084) (805) (279)
Dividends paid (302) (308) +6
(millions of euros) June 30. 2009 December 31. 2009
Net debt (-) / Net cash (+) at the end of the period (5,152) (6,193) +1,041

Rapport financier semestriel AREVA 30 juin 2010
9
2.2.2 Definitions of financial indicators
> Operating working capital requirement
Operating working capital requirement (OWCR) represents all of the current assets and liabilities related directly to operations. It includes the following items:
� inventories and work-in-process;
� trade accounts receivable and related accounts;
� non interest-bearing advances;
� other accounts receivable, accrued income and prepaid expenses;
� currency hedges on operating WCR;
� less: trade accounts payable and related accounts, trade advances and prepayments received (excluding interest-bearing advances), other operating liabilities, accrued expenses, and deferred income.
NOTE: OWCR does not include non-operating receivables and payables such as income tax liabilities, amounts receivable on the sale of non-current assets, and liabilities in respect of the purchase of non-current assets.
> Backlog
The backlog is valued based on economic conditions at the end of the period. It includes firm orders and excludes unconfirmed options. Orders in foreign currencies that are hedged are valued at the hedge exchange rate. Orders in foreign currencies that are not hedged are valued at the exchange rate as of the last date of the period. The backlog reported for long-term contracts recognized under the percentage of completion method and partially performed as of the reporting date is equal to the difference between (a) the projected revenue from the contract at completion and (b) the revenue already recognized for this contract. Accordingly, the backlog takes into account escalation and price revision assumptions used by the group to determine the projected revenue at completion.
> Free operating cash flow
This indicator represents cash flows generated by operating activities, before income tax. It is equal to the sum of the following items:
� EBITDA, excluding end-of-life-cycle operations;
� plus losses or minus gains on disposals of assets included in operating income;
� plus the decrease or minus the increase in operating working capital requirement between the beginning and the end of the period (excluding reclassifications, currency translation adjustments and changes in consolidation scope);
� minus acquisitions of property, plant & equipment and intangible assets, net of changes in accounts payable related to fixed assets;
� plus sales of property, plant & equipment and intangible assets included in operating income, net of changes in receivables on the sale of fixed assets;
� plus prepayments received from customers during the period on non-current assets;
� plus acquisitions or minus disposals of consolidated companies (excluding equity associates), net of cash acquired.

AREVA Half Year Financial Report June 30, 2010
10
> Net debt
This heading includes current and non-current borrowings, which include interest-bearing advances received from customers and put options by minority shareholders, less cash and cash equivalents and other current financial assets. Shares classified as “available-for-sale securities” are excluded from the calculation of net debt or (cash).
> Earnings before income tax, depreciation and amortization (EBITDA)
EBITDA is equal to operating income plus net amortization, depreciation and operating provisions (except for provisions for impairment of working capital items). EBITDA is adjusted to exclude the costs of end-of-life-cycle operations for nuclear facilities (dismantling, waste retrieval and packaging) carried out during the year, as well as the full and final payments paid or to be paid to third parties for facility dismantling. It should be noted that the cash flows linked to end-of-life-cycle operations are presented separately.
> Cash flows from end-of-life-cycle operations
This indicator encompasses all of the cash flows linked to end-of-life-cycle operations and to assets earmarked to cover those operations. It is equal to the sum of the following items:
� income from the portfolio of earmarked assets,
� cash from the sale of earmarked assets;
� minus acquisitions of earmarked assets;
� minus cash spent during the period on end-of-life-cycle operations;
� full and final payments received for facility dismantling;
� minus full and final payments made for facility dismantling.

Rapport financier semestriel AREVA 30 juin 2010
11
2.3 Segment reporting
A new organization for Nuclear and Renewables operations was established effective January 28, 2010. Accordingly, AREVA group segment reporting for the first half of 2010 presents data for the Mining/Front End, Reactors & Services, Back End and Renewable Energies Business Groups (excluding discontinued operations).
For all reporting periods, income items from discontinued operations are presented in the income statement under a separate heading, “Net income from discontinued operations”.
First half 2010 (contributions to the group)
(millions of euros) Mining/ Front End
Reactors & Services
Back End
Renewable Energies
Corporate & other Total
Revenue 1,593 1,543 897 47 78 4,158
EBITDA 310 (199) 267 (44) (118) 215
Percentage of revenue 19.4% -12.9% 29.7% -93.3% -152.2% 5.2%
Operating income (133) (391) 167 (59) (69) (485)
Percentage of revenue -8.3% -25.3% 18.6% -127.0% -88.5% -11.7%
Change in operating WCR 146 (108) (122) (58) (149) (291)
Net operating Capex (645) (113) (41) (170) (16) (985)
Free operating cash-flow before tax (210) (420) 102 (272) (284) (1,084)

AREVA Half Year Financial Report June 30, 2010
12
First half 2009 (contributions to the group)
(millions of euros) Mining/ Front End
Reactors & Services
Back End
Renewable Energies
Corporate & other Total
Revenue 1,556 1,382 843 49 78 3,908
EBITDA 438 (292) 198 (50) (46) 248
Percentage of revenue 28.1% -21.1% 23.5% -102.4% -59.7% 6.3%
Operating income 348 (552) 150 (58) (58) (170)
Percentage of revenue 22.4% -40.0% 17.8% -119.4% -75.0% -4.4%
Change in operating WCR (212) (121) (88) 32 (24) (413)
Net operating Capex (235) (151) (50) (9) (24) (469)
Free operating cash-flow before tax (179) (565) 60 (27) (94) (805)
2.4 Backlog
The group’s backlog at June 30, 2010 rose to 44.1 billion euros, an increase of 761 million euros from December 31, 2009 and of 1.2 billion euros compared with the backlog at June 30, 2009. The increase in backlog was fueled by strong year-on-year commercial activity in recurring operations, particularly in the Mining/Front End Business Group (BG) and in Renewable operations.

Rapport financier semestriel AREVA 30 juin 2010
13
2.5 Income statement
(millions of euros) H1 2010 H1 2009 2009
Revenue 4,158 3,908 8,529
Gross margin 390 240 1,082
Research and development expenses (162) (163) (346)
Marketing and sales expenses (145) (135) (286)
General and administrative expenses (284) (304) (620)
Other operating expenses (355) (80) (157)
Other operating income 71 272 423
Operating income (485) (170) 97
Net financial income (172) 230 187
Income tax 242 (34) 138
Share in net income of associates 46 (163) (152)
Net income from continuing operations (369) (137) 270
Net income from discontinued operations 1,240 144 267
Net income for the period 871 7 537
Minority interests 29 (154) (15)
Net income attributable to owners of the parent 843 161 552
Comprehensive income 1,530 (528) 341
It should be noted that Business Group revenues and contributions to consolidated income may vary significantly from one half year to the next in the nuclear businesses. Accordingly, half year data should not be viewed as a reliable indicator of annual trends.

AREVA Half Year Financial Report June 30, 2010
14
2.5.1 Revenue
Consolidated revenue amounted to 4.158 billion euros in the first half of 2010, up 6.4% from the same period in 2009. On a like-for-like basis, revenue grew by 5.6%.
(millions of euros) H1 2010 H1 2009 2010/2009 Change
Contribution to consolidated revenue 4,158 3,908 +6.4%
Mining/Front End BG 1,593 1,556 +2.4%
Reactors & Services BG 1,543 1,382 +11.6%
Back End BG 897 843 +6.4%
Renewable Energies BG 47 49 -3.7%
Revenue increased in all nuclear Business Groups compared with the same period in 2009, with growth of 11.6% in the Reactors & Services BG, 6.4% in the Back End BG and 2.4% in the Mining/Front End BG. Revenue was down slightly in the Renewable Energies BG (-3.7%). Foreign exchange had a positive impact of 43 million euros, primarily in the Mining/Front End BG. The impact of changes in consolidation scope was negligible during the period. Internationally, revenue was up 2.4% compared with the first half of 2009 to 2.376 billion euros and represented 57% of total revenue.
2.5.2 Gross margin
The group's gross margin came to 390 million euros for the first half of 2010 (9.4% of revenue), compared with 240 million euros for the first half of 2009 (6.1% of revenue), driven mainly by gross margin improvement in the Reactors & Services BG.
(millions of euros) H1 2010 H1 2009 2010/2009 Change
Gross margin 390 240 +62.9%
Percentage of revenue 9.4% 6.1% +3.3 pts
2.5.3 Research and development
The group’s research and development costs are recorded on the balance sheet if they meet the criteria for fixed assets under IAS 38, and are expensed if they do not.
In the income statement, research and development expenses appear below gross margin and represent non-capitalizable expenses incurred exclusively by the group; the expenses relating to programs funded wholly or partly by customers, together with projects carried out in partnership where AREVA has commercial rights of use of the results, are recognized in the cost of sales.

Rapport financier semestriel AREVA 30 juin 2010
15
All research and development costs, whether capitalized or expensed during the period, constitute the total research and development expenditure.
H1 2010 H1 2009
(millions of euros) (millions of euros)
Percentage of revenue
(millions of euros)
Percentage of revenue
Income statement: Research and development expenses 162 3.9% 163 4.2%
Other (including capitalized R&D) 258 6.2% 266 6.8%
Total research and development expenditure 420 10.1% 429 11.0%
Taking into account all expenses incurred on research and development, the research and development expenditure amounted to 420 million euros for the first half of 2010, representing 10.1% of revenue for the period, essentially unchanged from the 429 million euros of the first half of 2009 (11.0% of revenue).
2.5.4 General and administrative, marketing and sales expenses
Marketing and sales expenses and general and administrative expenses totaled 429 million euros in the first half of 2010, or 10.3% of revenue, slightly down compared with the 11.2% of the first half of 2009.
2.5.5 Other operating income, other operating expenses
� Other operating expenses came to 355 million euros, compared with expenses of 80 million euros for the first half of 2009. These expenses include the accounting adjustment of 300 million euros corresponding to impairment in the amount of approximately 6% of the net carrying amount of some mining assets. This impairment is reversible.
� Other operating income totaled 71 million euros, compared with 272 million euros for the first half of 2009. This includes income related to disposals and new partners in Mining/Front End BG subsidiaries in the amount of 247 million euros in 2009 and income from disposals in Mining/Front End BG subsidiaries totaling 19 million euros in 2010.

AREVA Half Year Financial Report June 30, 2010
16
2.5.6 Operating income
To facilitate comparisons of AREVA's underlying performance from one year to the next, the group has chosen to isolate the following particular items:
� gains on disposals and dilution gains related to new partners in the Mining/Front End BG in the amount of 247 million euros in 2009 and 19 millions euros in 2010;
� a non-cash reversible accounting adjustment to the value of certain mining assets for -300 million euros;
� additional provisions for revised income on completion of projects in the Reactors & Services BG totaling -417 million euros in 2010 and -562 millions in 2009 (including 367 million euros in 2010 and 550 million euros in 2009 on the OL3 project).
These items are isolated for analysis of “operating income excluding particular items”.
(millions of euros) H1 2010 H1 2009 2010/2009 change
Operating income excluding particular items 213 145 +€68m Percentage of revenue 5.1% 3.7% +1.4 pts Disposals & new partners - Mining/Front End assets 19 247 - Additional provisions - Reactors & Services projects (417) (562) - Reversible accounting adjustment on mining assets (300) - - Reported operating income (485) (170) €(315)m
Operating income excluding particular items came to 213 million euros, up 68 million euros compared with the first half of 2009, reflecting strong performance in recurring business. This was particularly true in the Mining/Front End BG, the Back End BG and the Installed Base Services operations. In the Renewable Energies BG, performance was essentially stable compared with the same period in 2009, with operating income of -59 million euros.
The group recognized additional provisions for income to completion totaling 417 million euros for projects in `the Reactors & Services BG in the first half of 2010, compared with 562 million euros in the first half of 2009, including 367 million euros for the OL3 reactor project in Finland. Physical completion of the OL3 reactor progressed significantly in the first half, including completion of most civil works, installation of the reactor vessel and rampup of piping work. A new schedule was announced which provides for nuclear startup of the reactor at the end of 2012. It is subject to certain conditions, duly reported to TVO, regarding completion of the final phases of construction. This new schedule led to a change in the estimated income to completion of the project, therefore requiring an additional provision.
The group’s review of prospective uranium market data led to the recognition of 300 million euros in impairment of some of its mining assets, in accordance with IFRS accounting standards. This accounting adjustment, which represents approximately 6% of the net carrying amount of the group’s mining assets, is non-cash and subject to reversal.
Based on these items, the group’s operating income came to -485 million euros for the first half of 2010, compared with -170 million euros for the same period in 2009 (including -550 million euros for additional provisions on OL3 and +247 million euros in gains related to new partners in the share capital of Mining/Front End BG subsidiaries).
Besides discussions with EDF regarding conditions for the Georges Besse I plant shutdown are ongoing. They could affect the full year’s operating income.

Rapport financier semestriel AREVA 30 juin 2010
17
2.5.7 Net financial income
(millions of euros) H1 2010 H1 2009
Net borrowing costs (81) (40)
Other financial income and expenses (90) 271
Share related to end-of-life-cycle operations (11) 29
Income from the earmarked financial portfolio 61 47
Income from receivables and discount reversal on earmarked assets 46 76
Discounting reversal expenses on end-of-life-cycle operations (118) (95)
Share not related to end-of-life-cycle operations (80) 242
Income from disposals of securities and change in value of securities held for trading
(1) 242
Financial income from pensions and other employee benefits (38) (40)
Dividends received 18 49
Other financial income and expenses (59) (11)
Net financial income (172) 230
Financial income came to -172 million euros in the first half of 2010, compared with +230 million euros in the first half of 2009, which benefitted from gains on the disposal of Total and GDF-Suez securities.
2.5.8 Income tax
AREVA recognized 242 million euros in tax income for the first half of 2010, compared with a tax expense of 34 million euros in the first half of 2009. Tax income at June 30 was determined by multiplying the before-tax income generated in each country by the corresponding effective tax rate estimated for 2010. The estimated effective tax rate for the year reflects the reversal of deferred tax liabilities corresponding to the impairment of mining rights recognized at June 30, 2010 in the amount of 102 million euros.
2.5.9 Share in net income of associates
(millions of euros) H1 2010 H1 2009 2009
STMicroelectronics 18 (124) (112)
Eramet 26 (39) (39)
Other 2 0 (1)
Total 46 (163) (152)

AREVA Half Year Financial Report June 30, 2010
18
The share in net income of associates totaled 46 million euros in the first half of 2010, compared with -163 million euros in the first half of 2009, reflecting improved performance at STMicroelectronics and Eramet.
The group may recognize net income from STMicroelectronics and Eramet that differs from the income reported by those companies:
� STMicroelectronics’ interim financial statements are prepared according to US GAAP and are in US dollars. The group converts them into euros and adjusts them for IFRS. STMicroelectronics does not publish half year financial statements under IFRS.
� With regard to Eramet, income is calculated based on interim results. Any differences between Eramet’s interim and final financial statements are recognized in the financial statements for the following period.
2.5.10 Minority interests
The share of net income allocated to minority interests rose to 18 million euros for the first half of 2010 from -175 million euros for the first half of 2009. This change is explained by Siemens's withdrawal as an AREVA NP shareholder. The share of net income corresponding to Siemens’ 34% share in AREVA NP SAS amounted to -166 million euros for the first half of 2009.
2.5.11 Net income and comprehensive income
Net income attributable to owners of the parent for the first half of 2010 was 843 million euros, up 682 million euros in relation to the first half of 2009, mainly due to the 1.27 billion euro gain on the sale of the Transmission & Distribution business.
Comprehensive income attributable to owners of the parent amounted to 1.53 billion euros in the first half of 2010, compared with a loss of 528 million euros for the first half of 2009. Aside from the increase in net income attributable to owners of the parent, the change in the value of available-for-sale financial assets went from -493 million euros in the first half of 2009 to +176 million euros in the first half of 2010.

Rapport financier semestriel AREVA 30 juin 2010
19
2.6 Cash flow
2.6.1 Change in net debt
(millions of euros) H1 2010
Net debt at beginning of period (December 31, 2009) (6,193)
EBITDA 215
Percentage of revenue 5.2%
Gains/losses on disposals of operating assets and other non-cash items (23)
Change in operating WCR (291)
Net operating Capex (985)
Free operating cash-flow before tax (1,084)
Cash flows for end-of-life-cycle operations (6)
Dividends paid (302)
Other (net financial assets, taxes, non-operating WCR and net cash from discontinued operations) 2,433
Change in net debt 1,041
June 30, 2010
Net debt (-) / Net cash (+) at the end of the period (including put options of minority interests) (5,152)
2.6.2 Free operating cash flows of the Group
(millions of euros) H1 2010 H1 2009
EBITDA 215 248
Percentage of revenue 5.2% 6.3%
Gains/losses on disposals of operating assets and other non-cash items (23) (171)
Change in operating WCR (291) (413)
Net operating Capex (985) (469)
Free operating cash-flow before tax (1,084) (805)

AREVA Half Year Financial Report June 30, 2010
20
2.6.3 Free operating cash flows by business
EBITDA Change in operating WCR
Net operating Capex
Free operating cash-flow before tax
(millions of euros) H1 2010 H1 2009 H1 2010 H1 2009 H1 2010 H1 2009 H1 2010 H1 2009
Mining/Front End BG 310 438 146 (212) (645) (235) (210) (179)
Reactors & Services BG (199) (292) (108) (121) (113) (151) (420) (565)
Back End BG 267 198 (122) (88) (41) (50) 102 60
Renewable Energies BG (44) (50) (58) 32 (170) (9) (272) (27)
Corporate and other (118) (46) (149) (24) (16) (24) (284) (94)
Group Total 215 248 (291) (413) (985) (469) (1,084) (805)
EBITDA for the first half of 2010 came to 215 million euros, compared with 248 million euros in the first half of 2009. This change is explained by:
� the 195 million euro increase in EBITDA, excluding particular items recognized in the Mining/Front End BG, which came to196 million euros in the first half of 2010;
� the 228 million euro decrease in gains on asset disposals and new partners in the share capital of Mining/Front End BG subsidiaries.
The change in operating working capital requirement corresponds to a use of 291 million euros of cash in the first half of 2010, compared with a use of 413 million euros in the first half of 2009.
Operating cash flow before Capex was -99 million euros, an increase of 237 million euros compared with the first half of 2009.
Gross capital expenditure excluding external growth went from 797 million euros in the first half of 2009 to 872 million euros in the first half of 2010, reflecting ongoing deployment of development programs in Mining and Enrichment. Acquisitions in Renewable Energies came to 158 million euros, bringing total Capex to 1.03 billion euros for the first half of 2010.
Net Capex was 985 million euros in the first half of 2010, compared with 469 million euros in the first half of 2009 (which included 310 million euros in cash generated by disposal of equity shares in the Mining/Front End BG).
The change in EBITDA and WCR and the continuation of the capital expenditure program translated into free operating cash flow before tax of -1.084 billion euros in the first half of 2010, compared with -805 million euros in the first half of 2009.

Rapport financier semestriel AREVA 30 juin 2010
21
2.6.4 Cash flows for end-of-life-cycle operations
To meet its dismantling commitments, the group constituted a dedicated portfolio to fund expenses relating to these operations. It is the group’s policy to offset negative cash flows associated with end-of-life-cycle operations with positive cash flows from dividends or sales of securities held in the portfolio.
In the first half of 2010, cash flows related to end-of-life-cycle operations came to an outflow of 6 million euros, against an outflow of 33 million euros at June 30, 2009. The main transactions were as follows:
� disbursements relating to end-of-life-cycle operations totaling -100 million euros, essentially unchanged compared with the first half of 2009 (-93 million euros);
� dividends received in the amount of 27 million euros, compared with 40 million euros at June 30, 2009.
2.6.5 Other cash flows
Other cash inflows came to 2.435 billion euros, compared with 231 million euros in the first half of 2009, mainly due to discontinued operations in the amount of 3.133 billion euros.

AREVA Half Year Financial Report June 30, 2010
22
2.7 Balance sheet items
The assets and liabilities that constitute the working capital requirement and deferred taxes are offset in the simplified balance sheet; this is not the case in the detailed balance sheet presented in section 4.3.
(millions of euros) June 30, 2010 December 31, 2009
Net goodwill 4,749 4,366
Property, plant and equipment (PP&E) and intangible assets 9,541 8,576
Assets earmarked for end-of-life-cycle operations 5,552 5,626
Equity associates 1,844 1,635
Other non-current financial assets 1,113 860
Operating working capital requirement 352 (62)
Net assets from discontinued operations 0 1,964
Total assets of the simplified balance sheet 23,151 22,965
Equity and minority interests 8,672 7,574
Provisions for end-of-life-cycle operations 5,786 5,660
Other provisions 2,000 1,791
Other assets and liabilities 1,541 1,748
Net borrowings 5,152 6,193
Total liabilities and equity of the simplified bala nce sheet 23,151 22,965
2.7.1 Fixed assets, excluding assets earmarked to finance end-of-life-cycle operations
Goodwill on consolidated companies was up 383 million euros, mainly because of the first time consolidation of AUSRA in 2010. The increase in goodwill pursuant to this acquisition is temporary and may be subject to change at a later date.

Rapport financier semestriel AREVA 30 juin 2010
23
2.7.2 Assets and provisions for end-of-life-cycle operations
The change in the balance sheet from December 31, 2009 to June 30, 2010 with regard to assets and liabilities for end-of-life cycle operations is summarized in the table below.
(millions of euros) June 30, 2010 December 31, 2009
ASSETS
End-of-life-cycle assets 490 422
AREVA share (to be amortized in future years) 222 147
Third party share 268 275
Earmarked financial assets 5,284 5,351
LIABILITIES
Provisions for end-of-life-cycle operations 5,786 5,660
Provisions to be funded by AREVA 5,517 5,385
Provisions to be funded by third parties 268 275
Provisions for end-of-life-cycle operations at June 30, 2010 came to 5.786 billion euros, compared with 5.66 billion euros at December 31, 2009.
Earmarked assets relating to these operations came to 5.552 billion euros at June 30, 2010, including “third party receivables” of 268 million euros and 5.284 billion euros in financial assets earmarked by AREVA to fund these operations (including receivables).
At June 30, 2010, AREVA's coverage of activities subject to the French law of June 28, 2006 was 98%. The ratio for all AREVA group activities was 96%.
The nature of the commitments and the calculation of the provision are presented in note 7 to the consolidated financial statements.
2.7.3 Operating working capital requirement
The group's operating working capital requirement came to 352 million euros at the end of the first half of 2010, compared with -62 millions euro at December 31, 2009. Compared with June 30, 2009, the operating WCR fell by 53 million euros, driven by optimization activities led in every Business Group.
2.7.4 Net debt at the end of the period
The group’s consolidated net debt stood at 5.152 billion euros at June 30, 2010, compared with 6.193 billion euros at the end of 2009. This reduction of 1.041 billion euros is due to the cash generated by the disposal of the

AREVA Half Year Financial Report June 30, 2010
24
Transmission & Distribution business, which funded the negative free operating cash flow described above and the dividend payment of 302 million euros.
2.7.5 Equity
The increase in equity, which rose from 7.574 billion euros at December 31, 2009 to 8.672 billion euros at June 30, 2009, is mainly explained by the comprehensive income contribution of 1.53 billion euros in the first half of 2010, minus the payment of dividends in the amount of 340 million euros.
Changes in equity are presented in detail in the consolidated financial statements.
2.7.6 Other provisions
The main change in other provisions is due to the 199 million euro increase in current provisions from December 31, 2009 to June 30, 2010, for a total of 2.0 billion euros. In particular, this change includes the change in the provision for losses to completion pertaining to the OL3 contract in Finland (TVO).
The description of other provisions may be found in note 12 to the consolidated financial statements.
2.7.7 Off balance-sheet commitments
(millions of euros) June 30, 2010 December 31, 2009
Commitments given 2,986 2,260
Commitments received 680 852
Reciprocal commitments 5,760 5,775
A detailed table of off-balance sheet commitments is presented in note 15 to the consolidated financial statements.

Rapport financier semestriel AREVA 30 juin 2010
25
2.8 Review by business
2.8.1 Mining/Front End BG
(contribution to the group, in millions of euros) H1 2010 H1 2009 2010/2009 Change
Backlog 28,590 27,055 +5.7%
Revenue 1,593 1,556 +2.4%
Operating income (133) 348 -€481m
Percentage of revenue -8.3% 22.4% -30.7 pts
Operating cash flow before tax (210) (179) -€32m
First half 2010 Performance
Mining/Front End BG
The backlog for the Mining/Front End BG came to 28.59 billion euros at the end of June 2010. Contracts won in the first half of 2010 include the following:
� a contract to supply natural uranium to US utility FirstEnergy;
� a contract with Industrias Nucleares do Brazil (INB) to supply conversion services needed to fabricate the fuel for the Angra nuclear complex for the next five years;
� contracts to supply uranium enrichment services to US, European and African utilities.
Revenue for the Mining/Front End BG came to 1.593 billion euros for the first half of 2010, for 2.4% growth compared with the first half of 2009 (up 1.0% like-for-like). Foreign exchange had a positive impact of 36 million euros, reflecting for the most part the favorable effect of the group’s hedging policy.
Significant developments:
� revenue was up in Mining, with increased quantities delivered and an improvement in the average AREVA uranium sales price over the period;
� revenue from the Fuel business was impacted by the postponement by several months of some deliveries to EDF.
Operating income excluding particular items for the Mining/Front End BG was 148 million euros (9.3% of revenue), compared with 101 million euros in the first half of 2009 (6.5% of revenue). This 47% improvement is due to an increase in quantities delivered and in the average AREVA uranium sales price, in addition to a 13% reduction in Mining production costs. However, the postponement of some fuel deliveries to EDF had a negative impact on operating income.
After taking into account 300 million euros in impairment on some mining assets and disposal gains / dilution related to new partners in the share capital of BG subsidiaries, the operating loss was 133 million euros in the first half of 2010, compared with operating income of 348 million euros in the first half of 2009.
Free operating cash flow before tax for the Mining/Front End BG came to a negative 210 million euros in the first half of 2010, compared with a negative 179 million euros in the first half of 2009. This change is attributable to an increase in net Capex, offset in part by improvement in the working capital requirement due to inventory

AREVA Half Year Financial Report June 30, 2010
26
optimization.
2.8.2 Reactors & Services BG
(contribution to the group, in millions of euros) H1 2010 H1 2009 2010/2009 Change
Backlog 7,964 8,269 -3.7%
Revenue 1,543 1,382 +11.6%
Operating income (391) (552) +€162m
Percentage of revenue -25.3% -40.0% +14.7 pts
Operating cash flow before tax (420) (565) +€145m
First half 2010 Performance
The backlog for the Reactors & Services BG came to 7.964 billion euros at June 30, 2010. The main new orders for the first half of 2010 were as follows:
� EDF awarded a services contract to replace 900 MWe plant steam generators and a supply contract for a trio of steam generators.
� The AREVA-Siemens consortium signed a contract with Enel’s Slovak subsidiary for the supply of digital instrumentation & control systems to monitor and protect units 3 and 4 of the Mochovce nuclear power plant in Slovakia.
Revenue for the Reactors & Services BG was up 11.6% to 1.543 billion euros (up 11.4% like-for-like).
� Revenue was up in the New Builds business, boosted by the Flamanville 3 project in France and the Taishan 1 and 2 projects in China.
� Installed Base Services revenue was up as well, reflecting buoyant business in France and the United States.
The BG had operating income excluding particular items of 26 million euros in the first half of 2010, compared with 10 million euros in the first half of 2009. This improvement is the outcome of good performance in the Installed Base Services business, the deployment of strengthened overhead and marketing cost reduction plans, and control of R&D expenses.
After taking into account 417 million euros in additional provisions for revision of income to contract completion, including 367 million euros for the OL3 construction project in Finland, the BG had an operating loss of 391 million euros, compared with a loss of 552 million euros in the first half of 2009.
Free operating cash flow before tax for the Reactors & Services BG was negative in the first half of 2010, at -420 million euros, compared with -565 million euros in the first half of 2009. This change reflects the following trends:
� improved EBITDA on strong performance of Installed Base Services;
� a reduction in operating working capital requirement due to the use of customer advances as major reactor projects progressed (change in operating WCR of -108 million euros for the six-month period);
� the slight decrease in Capex over the period.

Rapport financier semestriel AREVA 30 juin 2010
27
2.8.3 Back End BG
(contribution to the group, in millions of euros) H1 2010 H1 2009 2010/2009 Change
Backlog 6,268 7,327 -14.5%
Revenue 897 843 +6.4%
Operating income 167 150 +11.0%
Percentage of revenue 18.6% 17.8% +0.8 pt
Operating cash flow before tax 102 60 +69.3%
First half 2010 Performance
The backlog for the Back End BG came to 6.268 billion euros at June 30, 2010. Among the most significant contracts won in the first half were:
� several contracts with European utilities to supply MOX fuel assemblies and return shipments of waste vitrified using the cold crucible process;
� a contract to supply MOX fuel to unit 3 of the Tomari nuclear power plant in Japan operated by Hokkaido;
� a contract with Sellafield Limited for the design, supply and installation of a new fuel rod production line for the Sellafield MOX plant (SMP), including associated inspection equipment.
Revenue for the Back End BG was up 6.4% on both a reported and like-for-like basis to 897 million euros. This change is attributable to increased production at the La Hague plant compared with the first half of 2009.
The Back End BG recognized operating income of 167 million euros, up from 150 million euros in the first half of 2009. Operating margin came to 18.6%, compared with 17.8% a year earlier.
Free operating cash flow for the Back End BG came to 102 million euros in the first half of 2010, compared with 60 million euros in the first half of 2009. The improvement in EBITDA was offset in part by the negative change in WCR as certain customer down payments were postponed to the second half of the year. However, the BG’s working capital remained largely positive at the end of the period. Capital expenditure remained stable year-on-year.
2.8.4 Renewable Energies BG
(contribution to the group, in millions of euros) H1 2010 H1 2009 2010/2009 Change
Backlog 1,135 136 +€1.0bn
Revenue 47 49 -3.7%
Operating income (59) (58) -2.4%
Percentage of revenue -127.0% -119.4% -7.6 pts
Operating cash flow before tax (272) (27) -€245m

AREVA Half Year Financial Report June 30, 2010
28
First half 2010 Performance
The backlog for the Renewable Energies BG reached 1.135 billion euros at June 30, 2010. In the first half of the year, the BG signed a framework agreement with Bolognesi Participacoes, the main shareholder of the independent Brazilian power producer Hidrotérmica, to modernize ten biomass power plants. The first implementation project at Seresta (Brazil) was recognized in the backlog for the period.
First half 2010 revenue for the Renewable Energies BG came to 47 million euros, essentially unchanged from the first half of 2009. It was down 13.2% like-for-like on a lesser contribution from Biomass operations during the six-month period due to temporary financing difficulties experienced by customers in late 2009 / early 2010.
The Renewable Energies BG's operating loss of 59 million euros was essentially unchanged from the same period in 2009 due to:
� development costs related to rampup of the Renewables business, particularly in the AREVA Solar business unit following the acquisition of Ausra, a concentrated solar energy company based in California;
� costs associated with the replacement of gearboxes at the Alpha Ventus offshore wind farm due to technical issues related to the use of substandard materials.
Free operating cash flow generated by the BG in the first half of 2010 was -272 million euros, compared with -27 million euros at the end of June 2009. This change is attributable to increased capital spending with the acquisition of Ausra and the acquisition of the remaining shares of Multibrid, i.e. 49% in the wind business.
2.8.5 Corporate and other
(contribution to the group, in millions of euros) H1 2010 H1 2009 2010/2009 Change
Revenue 78 78 -
Operating income (69) (58) -€11m
Operating cash flow before tax (284) (94) -€189m
The operating loss for Corporate rose from 58 million euro to 69 million euros between the first half of 2009 and the first half of 2010.
2.9 Events subsequent to closing
The main events subsequent to June 30, 2010 closing are described below:
On the strategic level
� AREVA, the province of New Brunswick and the utility New Brunswick Power, signed a letter of intent to develop a clean energy park near the Point Lepreau nuclear power plant in Canada. This will be the third clean energy park in the world to be developed by AREVA.
Marketing and Sales
� Sellafield Limited awarded a contract to AREVA as a member of the HALEF partnership with AMEC and Balfour Beatty for the design and construction of a high-level liquid effluent storage facility.
� In early July 2010, AREVA and EDF signed the treatment-recycling contract for the 2008-2012 period.

Rapport financier semestriel AREVA 30 juin 2010
29
2.10 Outlook
For the full year of 2010, the group anticipates:
� substantial revenue and backlog growth;
� an increase in operating income, excluding particular items;
� negative operating income;
� a strong increase in net income attributable to owners of the parent, which includes the capital gain on disposal of the Transmission & Distribution business.

AREVA Half Year Financial Report June 30, 2010
30
3 Statutory Auditors’ report on the 2010 half-year financial information – For the period January 1 to June 30, 2010
The Statutory Auditors’ report includes information specifically required by French law in such reports, whether qualified or not. Such report should be read in conjunction with and construed in accordance with French law and French auditing professional standards.
To the Shareholders,
In accordance with our appointment as statutory auditors at your Annual General Meeting and in compliance with Article L. 451-1-2 of the French Monetary and Financial Code (Code monétaire et financier), we hereby report to you on:
� the limited review of the condensed consolidated financial statements of AREVA for the period January 1 to June 30, 2010, as attached to this report;
� the verification of the information provided in the half-year management report.
These condensed half-year consolidated financial statements have been prepared under the responsibility of the Executive Board. Our role is to express a conclusion on these financial statements based on our limited review.
3.1 I. Conclusion on the financial statements
We have conducted our limited review in accordance with professional standards applicable in France. A limited review consists primarily in inquiries of members of the executive management team responsible for the accounting and financial matters, and the implementation of analytical procedures. These inquiries are substantially less in scope than an audit conducted in accordance with professional standards applicable in France. Accordingly, a limited review provides a moderate assurance that the financial statements taken as a whole are free of material misstatement to a lesser extent than would result from an audit.
Based on our limited review, nothing has come to our attention that causes us to believe that the condensed half-year consolidated financial statements are not prepared, in all material respects, in accordance with IAS 34 accounting standard - IFRS as adopted by the European Union for interim financial information.
Without qualifying the above conclusion, we draw your attention to the following items set forth in the notes to the condensed half-year consolidated financial statements:
� note 1.2 which describes the changes in accounting methods resulting from the application of the new standards revised IFRS 3 “Business Combinations” and revised IAS 27 “Consolidated and Separate Financial Statements”, which were endorsed by the European Union and became effective as of January 1, 2010;

Rapport financier semestriel AREVA 30 juin 2010
31
� note 7 which describes the procedures for measuring end-of-life cycle liabilities. This assessment, which is based on Management’s best estimates, is sensitive to assumptions adopted with regard to cost estimates, timing of cash outflows and discount rates;
� Note 12 which describes the performance conditions of the OL3 contract and the sensitivity of profit and loss at completion to contractual risks, the effective implementation in accordance with agreed operating procedures for piping installation and inspection operations as well as the testing and commissioning phases including the Instrumentation and Control systems;
� Notes 13 and 16 which describes the procedure for determining the price of the AREVA NP put option exercised by Siemens on January 27, 2009, the uncertainty relating to this procedure and the accounting treatment adopted as of June 30, 2010 for the financial liability relating to this option.
3.2
3.3 II. Specific procedures
We have also verified the information provided in the half-year management report in respect of the condensed half-year consolidated financial information, which were subject to our limited review. We have no matters to report on the fairness of this information and its consistency with the condensed half-year consolidated financial statements.
Courbevoie and Neuilly-sur-Seine, July 30, 2010
The Statutory Auditors
MAZARS
Juliette Decoux Jean-Luc Barlet
DELOITTE & ASSOCIES
Patrice Choquet Etienne Jacquemin

AREVA Half Year Financial Report June 30, 2010
32
4 Condensed consolidated financial statements at June 30, 2010
4.1 Consolidated income statement
in millions of euros Note 1st Half 2010 1st Half 2009
Full Year 2009
Revenue 4 158 3 908 8 529
Other income from operations 12 38 61
Cost of sales (3 780) (3 706) (7 508)
Gross margin 390 240 1 082
Research and development expenses -162 -163 -346
Marketing and sales expenses -145 -135 -286
General and administrative expenses -284 -304 -620 Other operating expenses 3 -355 -80 -157 Other operating income 3 71 272 423
Operating income -485 -170 97
Income from cash and cash equivalents 17 4 14
Gross borrowing costs -98 -45 -128
Net borrowing costs -81 -40 -113
Other financial expenses -223 -179 -362
Other financial income 133 450 662
Other financial income and expenses -90 271 301
Net financial income 4 -172 230 187
Income tax 5 242 -34 138
Net income of consolidated businesses -415 26 422
Share in net income of associates 8 46 -163 -152
Net income from continuing operations -369 -137 270

Rapport financier semestriel AREVA 30 juin 2010
33
Net income from discontinued operations 11 1 240 144 267
Net income for the period 871 7 537
Attributable:
To the Group:
Net income from continuing operations -387 38 329
Net income from discontinued operations 1 230 123 223
Net income attributable to owners of the parent 843 161 552
To minority interests:
Net income from continuing operations 18 -175 -59
Net income from discontinued operations 10 21 44
Net income attributable to minority interests 29 -154 -15
Number of AREVA shares outstanding 35 442 701 35 442 701 35 442 701
Average number of treasury shares 73 159 38 604 52 921
Average number of AREVA shares outstanding, excluding treasury shares 35 369 542 35 404 097 35 389 780
Earnings per share from continuing operations attributable to the group (euros) (10.94) 1.08 9.29 Basic earnings per share 23.82 4.55 15.59
Diluted earnings per share(1) 23.82 4.55 15.59
(1) AREVA has not issued any instruments with a dilutive impact on share capital
* : In accordance with IFRS 5, net income after tax from discontinued operations is presented under a separate heading in the income statement. Accordingly, the consolidated income statements for the first half of 2009 were restated for data published in the previous year (see notes 2 and 11).

AREVA Half Year Financial Report June 30, 2010
34
4.2 Consolidated comprehensive income
(millions of euros)
1st half 2010
1st half 2009
Full year
2009
Net income 871 7 537
Other comprehensive income items
Currency translation adjustments on consolidated companies 172 (13) (2)
change in value of available-for-sale financial assets 176 (493) (111)
Change in value of cash flow hedges 27 (44) (12)
Tax impact of these items 120 72 (68)
Other comprehensive income items related to discontinued operations
15 39 52
Share in other net comprehensive income items from associates 149 (96) (55)
Total other comprehensive income items (after tax) 659 (535) (196)
Comprehensive income 1,530 (528) 341
- Attributable to the Group 1,430 (338) 390
- Attributable to minority interests 101 (190) (49)

Rapport financier semestriel AREVA 30 juin 2010
35
4.3 Consolidated balance sheet
ASSETS
(millions of euros) Note June 30, 2010 December 31,
2009
Non-current assets 23,829 21,875
Goodwill on consolidated companies 6 4,749 4,366
Intangible assets 6 3,586 3,282
Property, plant and equipment 5,955 5,294
End-of-life-cycle assets (third party share) 7 268 275
Assets earmarked to finance end-of-life-cycle operations 7 5,284 5,351
Investments in associates 8 1,844 1,635
Other non-current financial assets 9 1,113 860
Pension fund assets 1 0
Deferred tax assets 1,029 811
Current assets 9,662 14,175
Inventories and work-in-process 2,908 2,699
Trade accounts receivable and related accounts 2,789 2,161
Other operating receivables 2,063 1,838
Current tax assets 75 121
Other non-operating receivables 207 158
Cash and cash equivalents 10 1,413 1,409
Other current financial assets 207 139
Assets of operations held for sale 11 - 5,649
Total assets 33,492 36,050

AREVA Half Year Financial Report June 30, 2010
36
LIABILITIES AND EQUITY
(millions of euros) Note June 30, 2010
December 31, 2009
Equity and minority interests 8,672 7,574
Share capital 1,347 1,347
Consolidated premiums and reserves 5,056 4,749
Deferred unrealized gains and losses on financial instruments
364 155
Currency translation reserves 218 (155)
Net income attributable to equity holders of the parent 843 552
Minority interests 844 926
Non-current liabilities 13,584 13,408
Employee benefits 1,118 1,121
Provisions for end-of-life-cycle operations 7 5,786 5,660
Other non-current provisions 12 105 94
Long-term borrowings 13 6,059 5,872
Deferred tax liabilities 516 661
Current liabilities 11,236 15,068
Current provisions 12 1,895 1,696
Short-term borrowings 13 713 1,869
Advances and prepayments received 3,933 3,893
Trade accounts payable and related accounts 1,732 1,567
Other operating liabilities 2,806 2,270
Current tax liabilities 65 35
Other non-operating liabilities 91 53
Liabilities of operations held for sale 11 - 3,685
Total liabilities and equity 33,492 36,050

Rapport financier semestriel AREVA 30 juin 2010
37
4.4 Consolidated cash flow statement
(millions of euros)
1st half 2010
1st half 2009*
Full year 2009
Net income before minority interests 871 7 537
Less: income from discontinued operations (1,240) (144) (267)
Net income from continuing operations (369) (137) 270
Share in net income of associates (46) 163 152
Net amortization, depreciation and impairment of PP&E and intangible assets and marketable securities maturing in more than 3 months 555 243 504
Goodwill impairment losses - - -
Net increase in provisions 50 85 (228)
Net effect of reverse discounting of assets and provisions 157 136 255
Income tax expense (current and deferred) (242) 34 (138)
Net interest included in borrowing costs 76 42 117
Loss (gain) on disposals of fixed assets and marketable securities maturing in more than 3 months; change in fair value (28) (284) (436)
Other non-cash items (102) (206) (364)
Cash flow from operations before interest and taxes 53 75 132
Net interest received (paid) (12) (33) (15)
Income tax paid** (20) 24 0
Cash flow from operations after interest and tax 21 67 117
Change in working capital requirement (WCR) (286) (410) 43
NET CASH FROM OPERATING ACTIVITIES (265) (344) 160
Investment in PP&E and intangible assets (871) (778) (1,780)
Loans granted and acquisitions of non-current financial assets (206) (271) (1,039)
Acquisitions of shares of consolidated companies, net of acquired cash (132) (143) (162)

AREVA Half Year Financial Report June 30, 2010
38
Disposals of PP&E and intangible assets 17 63 83
Loan repayments and disposals of non-current financial assets 1,032 879 2,200
Disposals of shares of consolidated companies, net of disposed cash 37 265 265
Dividends from equity associates 32 54 56
NET CASH USED IN INVESTING ACTIVITIES (91) 69 (379)
Share issues subscribed by minority shareholders in consolidated subsidiaries and purchase of treasury shares (4) 15 178
Transactions with minority shareholders. (27)
Dividends paid to shareholders of the parent company (250) (250) (250)
Dividends paid to minority shareholders of consolidated companies (52) (58) (59)
Increase (decrease) in borrowings (1,823) 545 1,246
NET CASH USED IN FINANCING ACTIVITIES (2,156) 252 1,116
Decrease (increase) in marketable securities maturing in more than 3 months (5) (18) (77)
Impact of foreign exchange movements 14 (4) 3
NET CASH FLOW FROM DISCONTINUED OPERATIONS 2,252 (396) (219)
INCREASE (DECREASE) IN NET CASH (251) (442) 603
Net cash at the beginning of the year 1,481 877 877
Cash at the end of the year 1,413 622 1,409
Less: short-term bank facilities and non-trade current accounts (credit balances) (183) (187) (129)
Net cash from discontinued operations 200
Net cash at the end of the year 1,230 436 1,481
* : In accordance with IFRS 5, the change in net cash from discontinued operations is presented under a separate heading in the cash flow statement. Accordingly, the consolidated cash flow statement for the first half of 2009 was restated for data published in the previous year (see notes 2 and 11).

Rapport financier semestriel AREVA 30 juin 2010
39
** : As of the first half of 2010, the income tax paid does not include reimbursements for the research tax credit. For information, the income tax paid at December 31, 2009 and June 30, 2009 included +60 million euros in research tax credit reimbursements. “Net cash” taken into account in establishing the C ash Flow Statement consists of:
• “Cash and cash equivalents” (see note 10), which includes: o cash balances and non-trade current accounts, and o risk-free marketable securities initially maturing in less than three months, and money market funds;
• after deduction of short-term bank facilities and non-trade current accounts included in short-term borrowings (see note 13). • The two preceding items from discontinued operations.
4.5 Statement of change in consolidated shareholders’ e quity
(millions of euros)
Number of
shares and
investment certificates
Share capital
Premiums and
consolidated reserves
Currency translation reserves
Deferred unrealized gains and losses on financial
instruments
Total
shareholders' equity
attributable to owners of the
parent
Minority interests
Total equity
December 31, 2008 35,442,701 1,347 5,044 (131) 287 6,547 745 7,292
Net income for the first half of 2009 161 161 (154) 7
Other comprehensive income items (24) (59) (416) (499) (36) (535)
Comprehensive income 137 (59) (416) (338) (190) (528)
Dividends paid (*) (250) (250) (63) (313)
Purchase of treasury shares (66,350) (40) (40) (40)
Other transactions with shareholders 4 4 278 282
June 30, 2009 35,376,351 1,347 4,895 (190) (129) 5 923 769 6,693
December 31, 2009 35,372,531 1 347 5,301 (155) 155 6,648 926 7,574
Net income for the first half of 2010 843 843 29 871
Other comprehensive income items 5 373 209 587 72 659
Comprehensive income 848 373 209 1,430 101 1,530
Dividends paid (*) (250) (250) (90) (340)

AREVA Half Year Financial Report June 30, 2010
40
Purchase of treasury shares (8,420) (4) (4) (4)
Other transactions with shareholders 4 4 (92) (88)
June 30, 2010 35,364,111 1,347 5,899 218 364 7,828 844 8,672
(*) Dividend paid out per share (in euros):
in 2009 from 2008 net income
in 2010 from 2009 net income
7.05
7.06

Rapport financier semestriel AREVA 30 juin 2010
41
4.6 Segment information
On January 28, 2010, AREVA announced the establishment of a new organization for its Nuclear and Renewables operations. The foundation of the Group’s operating organization consists of four Business Groups (excluding discontinued operations): Mining / Front End, Reactors & Services, Back End and Renewables.
Segment reporting for the first half of 2010 is consistent with the new organization. The periods used for comparison were restated to match the new organization.
For all reporting periods, income items from discontinued operations are presented in the income statement under a separate heading, “Net income from discontinued operations”. Therefore, data from discontinued operations is not included in the information below.
BY OPERATING SEGMENT
1st half 2010
(millions of euros Mining/ Front End
Reactors & Services
Back End Renewable Energies
Other and eliminations
Total
Group
Gross sales revenue 1,615 1,559 1,000 47 (63) 4,158
Intercompany sales (22) (16) (103) - 141 0
Contrib. to consolidated revenue 1,593 1,543 897 47 78 4,158
Operating income (133) (391) 166 (59) (69) (485)
Inco
me
stat
emen
t
% of gross revenue (8.2)% (25.1)% 16.6 % (126.1)% n.a. (11.7) %
1st half 2009
(millions of euros Mining/ Front End
Reactors & Services
Back End Renewable Energies
Other and eliminations
Total
Group
Gross sales revenue 1,571 1,462 1,014 51 (191) 3,908
Intercompany sales (16) (79) (171) (3) 269 0
Contrib. to consolidated revenue 1,556 1,382 843 49 78 3,908
Operating income 348 (554) 156 (58) (62) (170)
Inco
me
stat
emen
t
% of gross revenue 22.1% (37.9)% 15.4% (113.0)% 32.5% (4.4)%

AREVA Half Year Financial Report June 30, 2010
42
Full year 2009
(millions of euros Mining/ Front End
Reactors & Services
Back End Renewable Energies
Other and eliminations
Total
Group
Gross sales revenue 3,502 3,288 1,972 174 (407) 8,529
Intercompany sales (31) (180) (335) (6) 552 0
Contrib. to consolidated revenue 3,471 3,108 1,637 168 145 8,529
Operating income 659 (575) 238 (60) (165) 97
Inco
me
stat
emen
t
% of gross revenue 18.8% (17.5)% 12.1% (34.7)% 40.6% 1.1%
“Other” includes Corporate and Consulting & Information Systems operations.
More than 10% of the group’s consolidated revenue is received from a specific customer.
Rapport financier semestriel AREVA 30 juin 2010
43
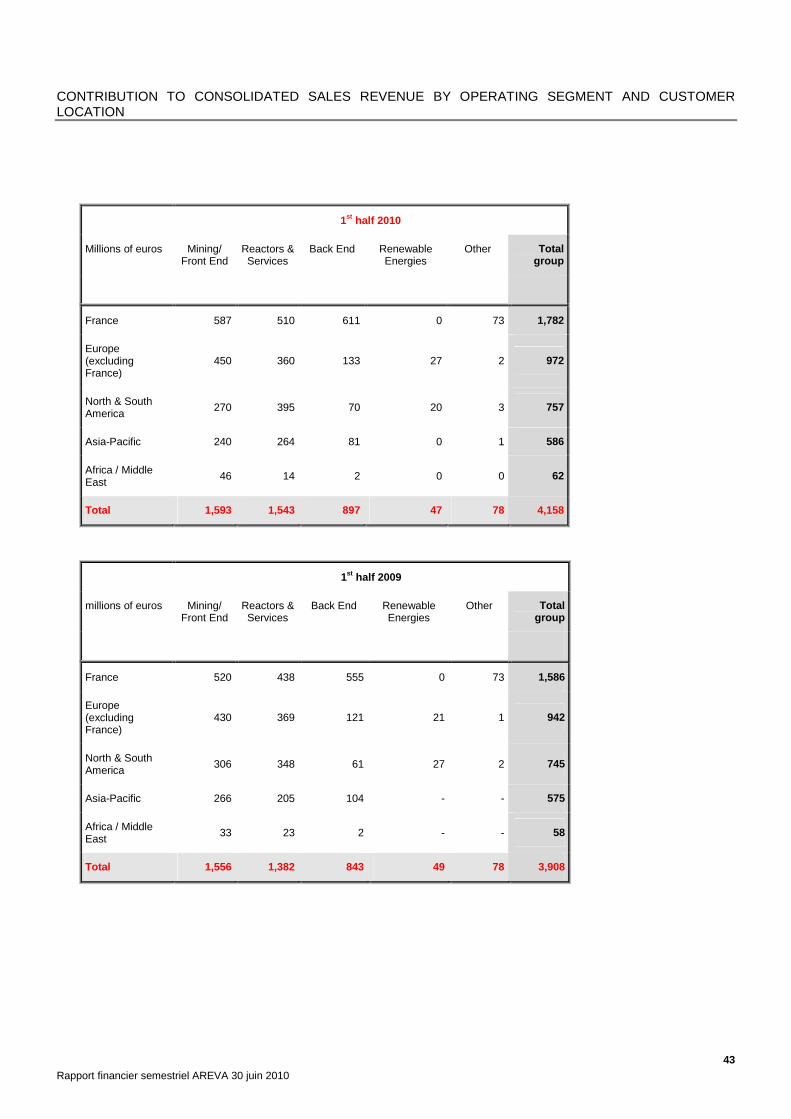
CONTRIBUTION TO CONSOLIDATED SALES REVENUE BY OPERATING SEGMENT AND CUSTOMER LOCATION
1st half 2010
Millions of euros Mining/ Front End
Reactors & Services
Back End Renewable Energies
Other Total group
France 587 510 611 0 73 1,782
Europe (excluding France)
450 360 133 27 2 972
North & South America 270 395 70 20 3 757
Asia-Pacific 240 264 81 0 1 586
Africa / Middle East 46 14 2 0 0 62
Total 1,593 1,543 897 47 78 4,158
1st half 2009
millions of euros Mining/ Front End
Reactors & Services
Back End Renewable Energies
Other Total group
France 520 438 555 0 73 1,586
Europe (excluding France)
430 369 121 21 1 942
North & South America 306 348 61 27 2 745
Asia-Pacific 266 205 104 - - 575
Africa / Middle East 33 23 2 - - 58
Total 1,556 1,382 843 49 78 3,908

AREVA Half Year Financial Report June 30, 2010
44
Full year 2009
millions of euros Mining/ Front End
Reactors & Services
Back End Renewable Energies
Other Total group
France 1,169 1,021 938 0 138 3,266
Europe (excluding France) 901 841 328 95 2 2,168
North & South America 786 708 123 73 4 1,694
Asia-Pacific 525 493 244 - - 1,263
Africa / Middle East 90 45 3 - - 138
Total 3,471 3,109 1,637 168 145 8,529

Rapport financier semestriel AREVA 30 juin 2010
45
4.7 Notes to the consolidated financial statements for the period ending June 30, 2010
All amounts are presented in millions of euros unless otherwise indicated. Certain totals may include rounding differences.
4.8 NOTE 1 – ACCOUNTING PRINCIPLES
.1 PREPARATION OF THE FINANCIAL STATEMENTS
The consolidated financial statements for the period ending June 30, 2010 were prepared in accordance with the accounting standard IAS 34 on interim financial data. These summary financial statements do not contain all of the information to be provided for year-end financial statements prepared in accordance with International Financial Reporting Standards (IFRS). They must be read in conjunction with the consolidated financial statements for the year ending December 31, 2009.
Material events for the period are described in the half-year activity report.
.2 ACCOUNTING PRINCIPLES
Accounting principles used to prepare the summary financial statements for the period ending June 30, 2010 are identical to those described in note 1 to the financial statements for the year ended December 31, 2009, except for the following points resulting from first-time adoption of amended IFRS 3, Business Combinations, and amended IAS 27, Consolidated Financial Statements:
The revised standards, which apply prospectively, have the following consequences:
- Changes in rules for recognition of business combinations: o the expenses related to these transactions are not recognized as part of the acquisition cost but are
expensed through operating profit and loss; o contingent price clauses (“earn-outs”) must be valued within 12 months of the date of acquisition;
subsequent adjustments must be recognized through profit and loss.
- Two methods are available for valuing goodwill when less than 100% of a company has been acquired: o the partial goodwill method, which is the only method allowed under previous IFRS rules, recognizes
goodwill based on the acquired percentage; o the full goodwill method recognizes 100% of the goodwill based on the fair value of minority interests.
The choice of method is made transaction by transaction.
- Changes in the rules for recognition of acquisitions and sales of minority interests in fully consolidated subsidiaries: These transactions are deemed intercompany transactions with the shareholders of the subsidiaries and are recognized directly in equity (Equity attributable to owners of the parent vs. Minority interests). As a result:
o acquisitions of minority interests do not generate additional goodwill but result in a reduction of equity attributable to owners of the parent;
o sales of minority interests or shares issued to minority shareholders in subsidiaries do not generate a capital gain or a dilution gain in operating income, but result in an increase in equity attributable to owners of the parent.

AREVA Half Year Financial Report June 30, 2010
46
- Changes in the rules regarding the recognition of put options held by minority interest holders in fully consolidated subsidiaries: For options granted on or after January 1, 2010, the difference between the option value at inception and the corresponding minority interests will no longer be recognized as goodwill but as a decrease in equity attributable to owners of the parent. Subsequent changes in the valuation of these options will be recognized through profit and loss or in equity, as determined by the IFRS Interpretations Committee, where this issue is currently under review. The accounting treatment for options granted before January 1, 2010 remains unchanged: subsequent changes in the fair value of these options are recognized against goodwill, without time limitation.
The impacts of amended IFRS 3 and amended IAS 27 standards on AREVA’s consolidated financial statements at June 30, 2010 are follows:
- 2 million euros in costs associated with the acquisition of new subsidiaries in the first half of 2010 were recognized in expenses;
- acquisitions of minority interests during the period resulted in a reduction of equity attributable to owners of the parent in the amount of 42 million euros.
In addition, AREVA applies the methodology prescribed in IAS 34 to calculate expenses related to retirement obligations, other employee benefits and income taxes for the interim period.
- Interim period expenses related to retirement obligations and other employee benefits are based on the discount rate used at the end of the previous year, adjusted to reflect material changes in market conditions since that date and reductions, liquidations and other non-recurring material events. Accordingly, AREVA calculated first half 2010 expenses using the discount rate established at December 31, 2009. The use of a discount rate updated as of June 30, 2010 would have no material impact on the amount of the provision for employee benefits or on net income for the period.
- The AREVA group calculated its income tax expense for the interim period by applying the estimated average tax rate for the year to before-tax income. However, a different tax rate was used for income items subject to a specific tax rate, such as gains on disposals of securities eligible for long-term capital gain tax treatment.
4.9 NOTE 2 – CONSOLIDATION SCOPE
Goodwill recognized for first half 2010 acquisitions is provisional and may be adjusted in the second half of 2010 or the first half of 2011.
Sale of the Transmission & Distribution business
On January 20, 2010, the agreement on the legal and financial terms for the sale of the AREVA group’s Transmission & Distribution business to the Alstom/Schneider consortium was signed. The agreement took effect

Rapport financier semestriel AREVA 30 juin 2010
47
June 7, 2010 following the approval of the competition authorities and the decree following the recommendation of the French Commission des Participations et des Transferts, the administration in charge of approving sales of government-owned assets.
As a result, the IFRS 5 accounting standard on discontinued operations applies at December 31, 2009 and June 30, 2010.
For all reporting periods, net income from these operations is presented on a specific line of the income statement, “Net income from discontinued operations”, and the cash flow statement was restated.
The assets and liabilities of the discontinued operations are reported under separate headings of the Group’s balance sheet at December 31, 2009, unadjusted for previous periods, excluding the receivables and liabilities of those operations with other entities of the group, which continue to be eliminated on consolidation in accordance with IAS 27. For this reason, the net value of assets and liabilities of discontinued operations reported on the balance sheet at December 31, 2009 is not representative of AREVA T&D equity as of that date, which comes to 990 million euros before elimination of the shares (see note 11).
The main changes in the scope of consolidation during the first half of 2010 are described hereunder.
AREVA SOLAR
In March 2010, AREVA acquired Ausra, a US corporation based in Mountain View, California. The company's name was changed to AREVA Solar. AREVA Solar offers concentrated solar power solutions for power generation and industrial steam production. With this acquisition, AREVA expands its portfolio of renewable energy solutions and becomes a world leader in concentrated solar thermal energy. AREVA Solar had 70 employees in 2009. The purchase price came to 250 million dollars and includes a contingent price provision for an additional 75 million dollars. Provisional goodwill before allocation of the purchase price came to 211 million dollars.
MULTIBRID
In April 2010, AREVA acquired the remaining shares held by minority interest holders in the German offshore wind turbine manufacturing company Multibrid, i.e. 49%, for 27 million euros.
COMIN USA
In January 2010, AREVA closed the sale of its Comin mining subsidiary to Uranium One for 27 million dollars. AREVA decided to sell Comin in order to optimize the group’s mining portfolio.
The gain on the sale came to 19 million euros before tax.

AREVA Half Year Financial Report June 30, 2010
48
4.10 NOTE 3 – OTHER OPERATING EXPENSES AND OTHER OPERATI NG INCOME
Other operating expenses
(millions of euros) 1st half 2010
1st half 2009
Full year 2009
Restructuring and early retirement costs (6) (9) (18)
Goodwill impairment losses - - -
Impairment of other assets (300) - (7)
Other operating expenses (49) (71) (132)
Total other operating expenses (355) (80) (157)
Other operating income
(millions of euros) 1st half 2010
1st half 2009
Full year 2009
Dilution income and gains on disposals of assets other than financial assets 21 232 369
Other operating income 50 40 55
Total other operating income 71 272 423
The group recognized 300 million euros in mining rights impairment at June 30, 2010 (see note 6).
At June 30, 2009 and December 31, 2009, dilution income and gains on disposals of assets other than financial assets include income from third party acquisitions of minority interests in consolidated AREVA group companies.

Rapport financier semestriel AREVA 30 juin 2010
49
4.11 NOTE 4 – NET FINANCIAL INCOME
(millions of euros) 1st half
2010 1st half
2009 Full year
2009
Net borrowing costs (81) (40) (113)
Income from cash and cash equivalents 17 4 14
Gross borrowing costs (98) (45) (128)
Other financial income and expenses (90) 271 301
Share related to end-of-life-cycle operations (11) 29 10
Income from disposal of securities earmarked for end-of-life-cycle operations 28 7 20
Dividends received 33 40 42
Income from receivables and discount reversal on earmarked assets 46 76 122
Impairment of securities - - -
Impact of revised schedules - - 2
Discounting reversal expenses on end-of-life-cycle operations (118) (95) (176)
Share not related to end-of-life-cycle operation s (80) 242 291
Foreign exchange gain (loss) (2) 11 14
Income from disposals of securities and change in value of securities held for trading (1) 242 381
Dividends received 18 49 51
Impairment of financial assets (6) (3) (1)
Interest income on prepayments received (Back End contracts) (17) (8) (31)
Other financial expenses (41) (34) (74)
Other financial income 7 23 29
Financial income from pensions and other employee benefits (38) (40) (79)
Net financial income (172) 230 187

AREVA Half Year Financial Report June 30, 2010
50
First half 2009 and full year 2009 income from disposals of securities not related to end-of-life-cycle operations mainly include the gain on the disposal of Total and GDF Suez shares.
4.12 NOTE 5 – INCOME TAX
Tax income at June 30 (+242 million euros) was determined by multiplying the income before tax generated in each country by the corresponding effective tax rate estimated for 2010 (+239 million euros). Two elements are added to this total: (i) the income tax on sales of consolidated shares closed on or before June 30, 2010 (-1 million euros), except for the income tax on the sale of T&D shares included in income from discontinued operations, and (ii) the change in provisions for tax audit (+4 million euros).
The estimated effective tax rate for the year reflects the reversal of deferred tax liabilities corresponding to the impairment of mining rights recognized at June 30, 2010 (+102 million euros).
The change in deferred taxes for the first half of 2010 resulting from changes in the fair value of financial instruments recognized in transferable equity was recorded directly in equity in the amount of 17 million euros.
4.13 NOTE 6 – GOODWILL AND INTANGIBLE ASSETS
GOODWILL
Goodwill as of 6/30/2010 was as follows:
(millions of euros)
December 31, 2009
Additions
Disposals
Minority interest put
options
Currency translation adjustments and other
June 30, 2010
Nuclear operations 4,242 - - - 174 4,416
Renewable Energies operations
124 155 - 33 21 333
TOTAL 4,366 155 - 33 195 4,749
The change in goodwill for Renewable Energies operations comes primarily from the acquisition of AREVA Solar.
In accordance with IFRS 3, the fair value of identifiable assets and liabilities acquired during business combinations and the acquisition cost containing earn-out clauses may be adjusted during a 12-month period following the date

Rapport financier semestriel AREVA 30 juin 2010
51
of acquisition. Accordingly, goodwill recognized on acquisitions made during the second half of 2009 and the first half of 2010 is tentative and may be adjusted at a later date.
An impairment test was performed for the uranium mining CGU on June 30, 2010. This test did not lead to the recognition of any impairment.
Since there was no indication of goodwill impairment, no goodwill impairment tests were performed at June 30, 2010.
INTANGIBLE ASSETS
(millions of euros)
NCA as of
December 31, 2009 Additions
Net increase in depreciation / Impairment
Currency translation
adjustments Other
changes
NCA as of
June 30, 2010
Pre-mining expenses 840 106 (30) 124 (9) 1,031
R&D expenses 435 71 (14) 40 0 531
Mineral rights 1 302 10 (300) 194 0 1,205
Other 706 43 (22) 9 82 818
TOTAL 3,282 230 (366) 367 73 3,586
A review of prospective uranium market data led the AREVA group to recognize 300 million euros in impairment on certain mining rights, in accordance with IFRS. The impairment is subject to reversal since the assets in question are eligible for depreciation. For the long term, the group maintains its assessment of the value for its mining portfolio, which is considered to be a strategic asset.
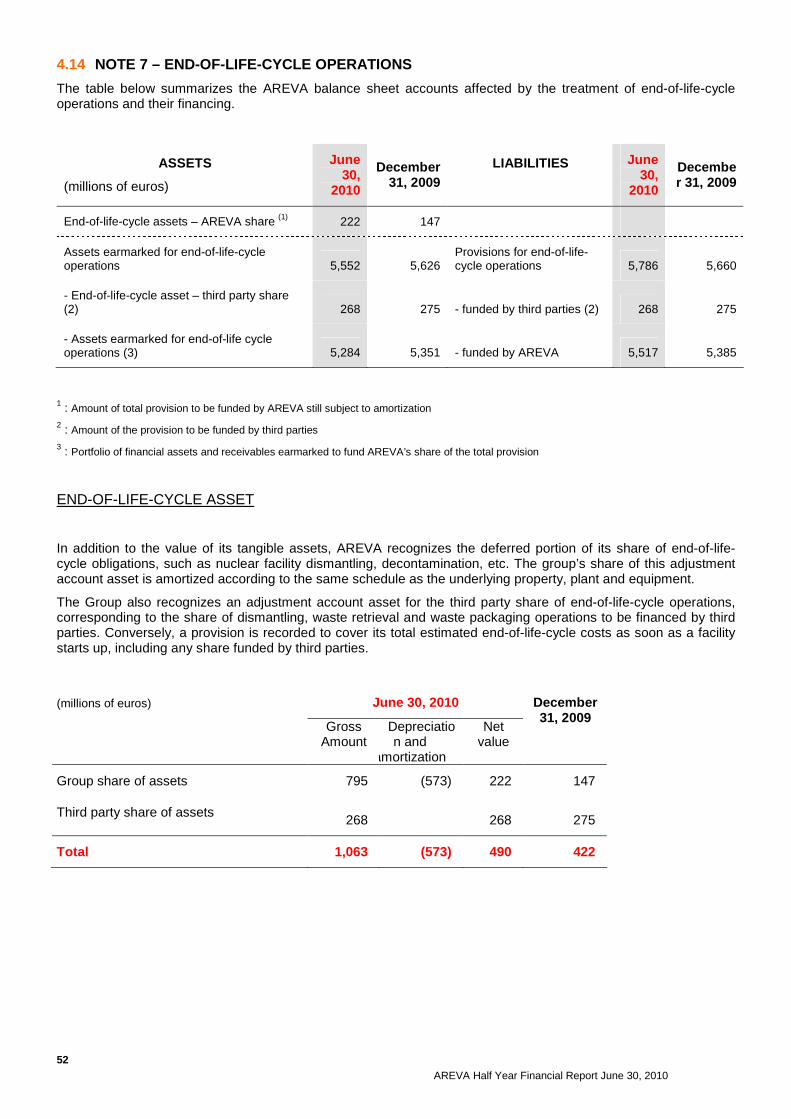
AREVA Half Year Financial Report June 30, 2010
52
4.14 NOTE 7 – END-OF-LIFE-CYCLE OPERATIONS
The table below summarizes the AREVA balance sheet accounts affected by the treatment of end-of-life-cycle operations and their financing.
ASSETS
(millions of euros)
June 30,
2010
December 31, 2009
LIABILITIES
June 30,
2010
December 31, 2009
End-of-life-cycle assets – AREVA share (1) 222 147
Assets earmarked for end-of-life-cycle operations 5,552 5,626
Provisions for end-of-life-cycle operations 5,786 5,660
- End-of-life-cycle asset – third party share (2) 268 275 - funded by third parties (2) 268 275
- Assets earmarked for end-of-life cycle operations (3) 5,284 5,351 - funded by AREVA 5,517 5,385
1 : Amount of total provision to be funded by AREVA still subject to amortization
2 : Amount of the provision to be funded by third parties 3 : Portfolio of financial assets and receivables earmarked to fund AREVA’s share of the total provision
END-OF-LIFE-CYCLE ASSET
In addition to the value of its tangible assets, AREVA recognizes the deferred portion of its share of end-of-life-cycle obligations, such as nuclear facility dismantling, decontamination, etc. The group’s share of this adjustment account asset is amortized according to the same schedule as the underlying property, plant and equipment.
The Group also recognizes an adjustment account asset for the third party share of end-of-life-cycle operations, corresponding to the share of dismantling, waste retrieval and waste packaging operations to be financed by third parties. Conversely, a provision is recorded to cover its total estimated end-of-life-cycle costs as soon as a facility starts up, including any share funded by third parties.
(millions of euros) June 30, 2010
Gross
Amount Depreciation and
amortization Net
value
December 31, 2009
Group share of assets 795 (573) 222 147
Third party share of assets 268 268 275
Total 1,063 (573) 490 422

Rapport financier semestriel AREVA 30 juin 2010
53
The third party share in end-of-life-cycle assets mainly corresponds to the funding expected from the CEA for its share of the commitment for the Pierrelatte site. This heading increases based on discounting reversals and decreases based on work performed by AREVA.
ASSETS EARMARKED FOR END-OF-LIFE-CYCLE OPERATIONS
This heading consists of the following:
(millions of euros) June 30, 2010 December 31,
2009
Receivables related to end-of-life-cycle operations
1,879 1,830
Earmarked assets 3,405 3,521
Total 5,284 5,351
Receivables related to end-of-life-cycle operations correspond chiefly to (i) receivables from the CEA resulting from the signature in December 2004 of an agreement confirming the CEA’s responsibility for a share of the costs of dismantling the La Hague and Cadarache plants and of the costs to retrieve and package waste at the UP2-400 plant, and (ii) a receivable from EDF resulting from the signature in December 2008 of the memorandum of understanding between EDF and AREVA on the principles governing Back End contracts for the post-2007 period.
The schedule for the payment of the amount due by EDF was defined in an agreement signed in July 2009. The payment will be made in several installments through June 2011.
The portfolio of assets earmarked to fund end-of-life-cycle expenses includes the following:
(millions of euros) June 30, 2010 December 31, 2009
At market value
Publicly traded shares 659 690
Equity mutual funds 698 720
Bond and money market mutual funds 2,048 2,111
Total 3,405 3,521

AREVA Half Year Financial Report June 30, 2010
54
PROVISIONS FOR END-OF-LIFE-CYCLE OPERATIONS
(millions of euros) June 30,
2010 December 31,
2009
Dismantling of nuclear facilities 4,181 4,092
Waste retrieval and packaging 1,605 1,568
Provisions for end-of-life-cycle operations 5,786 5,660
As an operator of nuclear facilities, the AREVA group has a legal obligation to secure and dismantle its facilities when they are shut down permanently. The group must also retrieve and package the various waste types generated by operating activities which could not be processed during treatment, in accordance with prevailing standards. Group facilities subject to these obligations include facilities in the front end of the fuel cycle, in particular the Pierrelatte and Eurodif enrichment plants and the fuel fabrication facilities, but they are predominantly facilities in the back end of the fuel cycle, including the treatment plants at La Hague and the Melox and Cadarache MOX fuel fabrication plants.
The change in provisions for end-of-life-cycle operations between December 31, 2009 and June 30, 2010 reflects a change in dismantling cost estimates for the Eurodif enrichment plant in Pierrelatte.

Rapport financier semestriel AREVA 30 juin 2010
55
4.15 NOTE 8 – INVESTMENTS IN ASSOCIATES
June 30, 2010 December 31, 2009
(millions of euros) % of control
Share in net income of
equity associates
Investment in associates, excluding goodwill
Goodwill
Investment in associates (including goodwill)
Investment in associates, including goodwill
STMicroelectronics 14.22% 18 954 - 954 805
Eramet 25.79% 26 675 35 710 662
MNF 30.00% - 55 79 134 109
Other equity associates 2 41 5 46 59
Total 46 1,725 119 1,844 1,635
4.16 NOTE 9 – OTHER NON-CURRENT FINANCIAL ASSETS
(millions of euros) June 30,
2010 December 31, 2009
Available-for-sale securities 948 682
Loans to equity associates 74 82
Other non-current financial assets 82 83
Derivatives on financing activities 10 13
Total 1,113 860
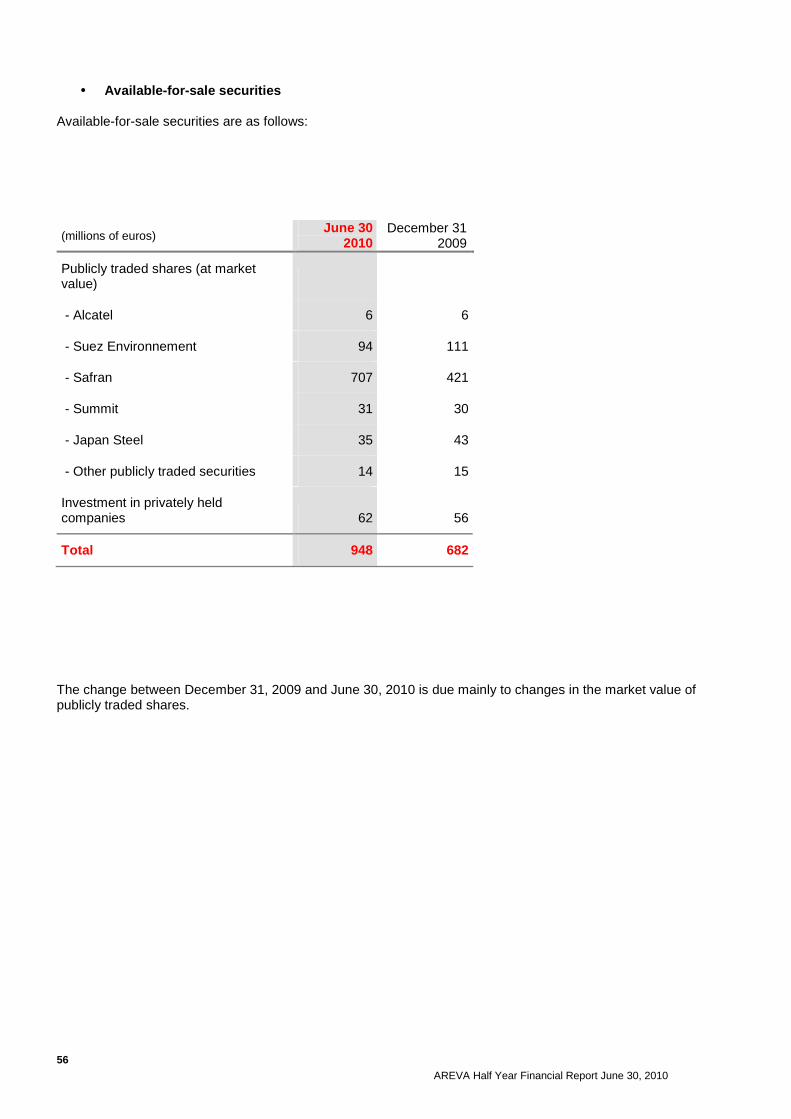
AREVA Half Year Financial Report June 30, 2010
56
• Available-for-sale securities
Available-for-sale securities are as follows:
(millions of euros) June 30 2010
December 31 2009
Publicly traded shares (at market value)
- Alcatel 6 6
- Suez Environnement 94 111
- Safran 707 421
- Summit 31 30
- Japan Steel 35 43
- Other publicly traded securities 14 15
Investment in privately held companies 62 56
Total 948 682
The change between December 31, 2009 and June 30, 2010 is due mainly to changes in the market value of publicly traded shares.

Rapport financier semestriel AREVA 30 juin 2010
57
4.17 NOTE 10 – CASH AND CASH EQUIVALENTS
(millions of euros) June 30,
2010 December 31, 2009
Cash equivalents 1,162 1,265
Cash and current accounts 251 144
Net value 1,413 1,409
Cash equivalents consist chiefly of short-term marketable securities and mutual funds.
4.18 NOTE 11 – NET INCOME, ASSETS AND LIABILITIES, AND C ASH FLOW FROM DISCONTINUED OPERATIONS
Net income from discontinued operations for the first half of 2010 corresponds to the following items:
(millions of euros) June 30, 2010
Net income from discontinued operations (T&D) for the January 1 - June 7, 2010 period
(30)
After tax capital gain* 1,270
Net income from discontinued operations 1,240
* : Including release to income of currency translation reserves and deferred unrealized gains and losses

AREVA Half Year Financial Report June 30, 2010
58
The contribution to consolidated net income of the Transmission & Distribution business in the first half of 2010, the first half of 2009 and the full year 2009 is presented hereunder.
(millions of euros) January 1,
2010 to the date of
disposal* 1st half 2009 2009
Revenue 2,008 2,614 5,474
Operating income (24) 186 405
Net financial income (24) (18) (47)
Income taxes 18 (24) (90)
Net income for the period (30) 144 267
Minority interests 10 21 (44)
Net income attributable to owners of the parent (41) 123 223
* : see note 2
Income data for the first half of 2010 and the first half of 2009 for the T&D business include expenses billed by AREVA SA (rent, holding fees and financial expenses).
In 2009, these expenses amounted to 72 million euros. In the first half of 2010, they amounted to 36 million euros.

Rapport financier semestriel AREVA 30 juin 2010
59
Assets and liabilities of discontinued operations at December 31, 2009:
Non-current assets 1,734
Goodwill on consolidated companies 656
Property, plant and equipment and intangible assets 870
Other non-current financial assets 31
Pension fund assets 2
Deferred tax assets 175
Current assets 3,915
Inventories and work-in-process 814
Trade receivables and other operating receivables 2,806
Current tax assets 46
Other non-operating receivables 7
Cash and cash equivalents 238
Other current financial assets 4
Total assets of discontinued operations 5,649
Non-current liabilities 284
Employee benefits 208
Other non-current provisions 39
Long-term borrowings 12
Deferred tax liabilities 26
Current liabilities 3,402
Current provisions 329
Short-term borrowings 223
Trade payables and other operating liabilities 2,778
Current tax liabilities 70
Other non-operating liabilities 2
Total liabilities and equity of discontinued operat ions 3,686
The contribution to equity attributable to owners of the parents from the T&D business came to 990 million euros at December 31, 2009, before elimination of the value of the shares.

AREVA Half Year Financial Report June 30, 2010
60
Net cash from discontinued operations
At June 30, 2010, this item includes:
(millions of euros) June 30, 2010
Sales price for T&D securities, net of disposal expenses 2,254
T&D contrib. to cash position at 1/1/10, transferred upon disposal of the T&D business (2)
Net value 2,252
In addition to the purchase price of T&D shares on June 8, 2010, AREVA collected on liabilities and financial debt owed to it by T&D. These items are included for the most part under “Loan repayments and disposals of non-current financial assets” in the cash flow statement.
Contribution of the T&D business to consolidated cash flow for the first half of 2010:
(millions of euros)
June 30, 2010
NET CASH FROM OPERATING ACTIVITIES 22
NET CASH USED IN INVESTING ACTIVITIES (115)
NET CASH USED IN FINANCING ACTIVITIES 109
Other changes (18)
INCREASE (DECREASE) IN NET CASH (2)

Rapport financier semestriel AREVA 30 juin 2010
61
4.19 NOTE 12 – OTHER PROVISIONS
(millions of euros) June 30,
2010 December
31, 2009
Restoration of mining sites and mill decommissioning 104 93
Other 1 1
Other non-current provisions 105 94
Restructuring and layoff plans 26 27
Provisions for ongoing cleanup 100 97
Provisions for customer warranties 85 86
Provisions for losses to completion 805 726
Accrued costs 594 552
Other 285 208
Current provisions 1,895 1,696
Total other provisions 2,000 1,791
Contract to build the Olkiluoto 3 EPRTM reactor
A key milestone was met in the first half of 2010 when the reactor vessel was moved into the reactor building on June 18.
Construction is nearing completion as scheduled.
Piping work, which had stopped in the preceding half year, was restarted under a unilateral procedure for on-site construction and inspection. Additional staff was brought in to offset the initial schedule impact of this phase of work going forward.
Joint meetings were held with the customer, the safety authorities, the CSF consortium, and inspection and regulation bodies to define rules for the transfer of the systems at the end of the construction period. These meetings resulted in the adoption of an implementation memorandum, issued at the end of April. In June, TVO indicated that it had not submitted the implementation memorandum to the safety authority for approval. The consortium nonetheless intends to implement the memorandum unilaterally to avoid any delay that might be detrimental to the project.

AREVA Half Year Financial Report June 30, 2010
62
The final architecture of the instrumentation and control system was approved by TVO at the beginning of the year and was accepted by the safety authorities at the beginning of June.
Based on these elements, the consortium (CSF) submitted a schedule to TVO for the period ending with the loading of the fuel, set for December 2012. This goal is contingent on TVO meeting certain previously defined conditions.
From that date on, TVO will be in charge of nuclear operations, startup and power ramp-up after commissioning. Accordingly, the consortium is not in a position to make a commitment on a provisional date for the transfer of ownership.
Based on this new schedule, and considering the related risks of execution, AREVA recognized 367 million euros in additional provisions at June 30, 2010, for a grand total of 2.6 billion euros.
Regarding arbitration proceedings started on December 5, 2008, and considering the lack of an amicable resolution, the consortium maintains the claim for extension of time and compensation of costs borne by it through the fault of TVO amounting to 1 billion euros for the 2004-2006 period alone. AREVA has not recognized any income in respect of this claim.
In April 2009, TVO revised the amount of the claim it submitted against the consortium down to 1.4 billion euros. No provision was made in this regard, as the consortium and its counsel consider the allegations made in the counterclaim to be unfounded and without merit under Finnish law.
The remaining uncertainties regarding the amount of income at completion of the project therefore relate, among others, to the contract risks, the customer’s effective implementation of piping installation and inspection operations in accordance with the agreed-upon procedures, as well as the testing and startup phases, including the instrumentation and control system.

Rapport financier semestriel AREVA 30 juin 2010
63
4.20 NOTE 13 – BORROWINGS
(millions of euros) Long-term
borrowings Short-term
borrowings June 30,
2010 December 31,
2009
Put options of minority shareholders 45 45 17
Debt to Siemens for exercise of put option 2,097 2,097 2,080
Interest-bearing advances 82 82 81
Loans from financial institutions 695 214 909 2,274
Bond issues 3,061 96 3,157 3,006
Short-term bank facilities and non-trade current accounts (credit balances) 183 183 129
Financial instruments 210 210 56
Miscellaneous debt 79 10 89 99
Total Borrowings 6,059 713 6,772 7,741
The reduction in loans from financial institutions in the first half of 2010 reflects the repayment of a loan in US dollars secured at the time of UraMin’s acquisition.
• Debt to Siemens for exercise of put option
On January 27, 2009, Siemens decided to exercise the put option for its equity share in AREVA NP. The procedure to determine the option’s exercise price began in February 2009, as contemplated in the shareholders’ agreement. The procedure provided that, if the parties are unable to reach an agreement on the price for exercising the option, each party shall designate an investment bank to establish the value. Given the difference in each bank’s valuation and the inability of the parties to reach an agreement, the Institute of Chartered Accountants in England and Wales designated an expert to determine the amount to be paid by AREVA to Siemens for the shares on or before January 30, 2012, pursuant to the shareholders’ agreement. This debt shall bear interest at a variable rate from the date of notice of exercise of the option to the date of the actual payment by AREVA.
Given the uncertainty concerning the future exercise price that will result from this procedure, AREVA decided to maintain the same amount in its balance sheet at June 30, 2010 as at December 31, 2007, December 31, 2008 and December 31, 2009.

AREVA Half Year Financial Report June 30, 2010
64
4.21 NOTE 14 – RELATED PARTY TRANSACTIONS
Transactions between the parent company and its subsidiaries, which are related parties, were eliminated on consolidation and are not presented in this note.
Transactions between the group and other important related parties are presented below.
(millions of euros) CEA
June 30, 2010 December 31, 2009
Sales 175 650
Purchasing 44 106
Loans to/receivables from related parties 800 860
Borrowings from related parties 140 134
Relations with government-owned companies
The group has business relationships with French government-owned companies, in particular EDF. Transactions with EDF include sales of uranium, enrichment services and nuclear fuel, maintenance and sales of equipment for nuclear reactors, and used fuel transportation, storage, treatment and recycling services.

Rapport financier semestriel AREVA 30 juin 2010
65
4.22 NOTE 15 – COMMITMENTS GIVEN OR RECEIVED
Off-balance sheet commitments
(millions of euros)
June 30, 2010 December 31, 2009
COMMITMENTS GIVEN 2,986 2,260
Contract guarantees given 1,976 1,264
Other operating guarantees 344 340
Financing commitments given 19 30
Other commitments given 647 626
COMMITMENTS RECEIVED 680 852
Operating commitments received 671 593
Commitments received on collateral 1 1
Other commitments received 8 258
RECIPROCAL COMMITMENTS 5,760 5,775
The amounts above only include commitments that the group considers valid as of the date of closing. Accordingly, these commitments do not include construction contracts currently under negotiation.
Commitments given
Operating commitments represent almost 78% of all commitments given. The majority of these commitments relate to performance guarantees.
In addition, the group gave a parent company guarantee to TVO for the full value of the contract for the construction of an EPR™ reactor in Finland. The group received a counter-guarantee from Siemens corresponding to this supplier’s share of the TVO contract. The net commitment given by the group is in the range of 1.5 billion to 2 billion euros. This amount is not included in the summary table.
AREVA gave a specific guarantee in respect of ownership of FCI shares sold to Bain Capital. This amount, which is capped at the sale price of 582 million euros, is not included in the summary table.

AREVA Half Year Financial Report June 30, 2010
66
Reciprocal commitments
In February 2007, the Group established a 2 billion euro revolving line of credit available in euros and dollars until February 2014. This line had not been used at June 30, 2010.
Confirmed bilateral banking lines of credit were established in the second half of 2009 in the amount of 1.3 billion euros. These lines had not been used as of June 30, 2010. They mature in July 2010 (1.15 billion euros) and December 2010 (150 million euros).
4.23 NOTE 16 – OTHER INFORMATION
POTENTIAL LITIGATION AND LIABILITIES
• Siemens’ withdrawal as AREVA NP shareholder
In January 2009, Siemens notified AREVA of its wish to end its 34% interest in the corporate joint venture AREVA NP by exercising its put for convenience.
In the weeks that followed, Siemens announced that it had entered into negotiations with Russia’s State Atomic Energy Corporation Rosatom (“Rosatom”) to create a new corporate joint venture active in the construction of nuclear power plants throughout the world. In March 2009, AREVA notified Siemens that it was exercising its call for breach based on breach of Siemens’ contractual obligations, most notably of the non-competition clause stipulated in the shareholders’ agreement binding the two parties. On April 14, 2009, AREVA supplemented its notice by initiating arbitration proceedings before the International Chamber of Commerce, requesting that Siemens' breach of its contractual obligations be recognized, that breach of contract having caused a discount from par in the purchase price for the shares held by Siemens in AREVA NP, as provided in the shareholders’ agreement, and damages in an amount as yet to be determined. In May and June 2009, Siemens re-qualified the exercise of its put option as a put for breach, supplemented by its response aimed at rejecting AREVA's requests and at receiving the premium on the sale price of its shares provided in this case under the contract.
On November 17, 2009, the arbitration tribunal responded favorably to the request filed by AREVA for conservatory measures aimed at imposing emergency restrictions on Siemens in its negotiations with Rosatom until such time as the tribunal has pronounced its judgment.
The procedure was ongoing at June 30, 2010, as provided in the schedule agreed upon between the parties and the tribunal.
In addition to these proceedings, Siemens filed a claim against AREVA before the European Commission, alleging that the non-competition clause is null and void. The Commission decided to investigate the claim on an emergency basis and initiated formal proceedings against both parties on May 21, 2010. It should be noted that the start of proceedings before the European Commission is not indicative of the validity of the clauses under investigation.
• Negotiation with EDF regarding economic terms for t he shut-down of the GB1 plant in Pierrelatte

Rapport financier semestriel AREVA 30 juin 2010
67
Technical conditions to optimize shut-down operations at Eurodif’s GB1 plant were clarified, particularly as regards nuclear safety. Eurodif and EDF continue their discussions on economic terms and conditions for Eurodif’s operations through 2012.
NOTE 17 – EVENTS SUBSEQUENT TO THE END OF THE PERIOD
There was no event subsequent to the end of the period that might have a major impact on the Group’s financial statements.
At the beginning of July 2010, AREVA and EDF signed the nuclear fuel treatment and recycling contract for the period 2008-2012.

AREVA Half Year Financial Report June 30, 2010
68
FINANCIAL COMMUNICATIONS DEPARTMENT
33, rue La Fayette – F-75442 Paris Cedex 09 – Franc e – Tel: +33 1 34 96 47 – Fax: +33 1 34 96 00 01