Embed Size (px)
Citation preview
Handbook of Mycological Methods Project GCP/INT/743/CFC
Handbook of Mycological Methods
1. Introduction No method is perfect. A methodology is a good methodology if it is repeatable, robust, practical, a thorough understanding of its strengths and weaknesses exists and it is applied appropriately. A result can only be interpreted through understanding the method: what it measures, what it does not measure, how it measures, ways in which it may go wrong and ways in which it certainly can not have failed. This sensitivity of results to their method of acquisition also means that a comparison between two or more results is only valid if the methods employed are the same, hence standardization, especially in a geographically broad study, is essential. The methods described in this document were developed specifically for the study of coffee and the fungal ecology of coffee production from the starting point of the methods for food analysis recommended by the International Commission of Food Mycology (Samson and Pitt, 1985,'92). They can be taken as ‘best practice’ having been developed, as they have, based on experience in various conditions in several producer countries and having consistently yielded useful results. There may well be further improvement, but in the interests of standardization, perceived improvements must not be adopted unilaterally nor in an ad hoc manner. On the other hand, circumstances will inevitably arise that are not accounted for in standard practice, whether in respect of available equipment or special circumstances calling for analysis. For this reason, the handbook contains discussion, explanation and background so operators will be equipped to make the best possible innovation where it is necessary to deviate from standard methods. We have also included specific information about the fungi that are undoubtedly most involved with the production of OTA in coffee since this must necessarily be a focus of the project’s research activities.
2. Types of analyses
2.1. Fruit, parchments and beans The basic protocol (Figure 1), which can be referred to as 'three-part analysis', is applied to ripe, passo (cherries that are over-ripe but still able to be pulped) and boia (cherries that are black and substantially dried on the tree) coffee cherries. Analysis of other coffee products represents a simplification of this basic procedure. It is designed to give a comprehensive mycological picture by physically separating different but physically close niches. If a sample is repeatedly sub-sampled during drying, for example, the changes in numbers and species found in the respective niches can provide important information on dynamics and adaptation of the fungal communities to the niches during, in this case, drying. A description of the niches and the code we have adopted for naming them to simplify reporting can be found in Table 1. Table 2 (next section) contains details of the materials referred to in the text. Fifty cherries are shaken in 100ml of sterile diluent in a 250ml Duran-type bottle to wash off the external community. The washate is considered the neat concentration and diluted to 10-4 (see Table 2). It is essential to use a fresh pipette with each dilution step. Depending on the availability of materials, either the last two or three of
Handbook of Mycological Methods – Project GCP/INT/743/CFC Page 2 of 33
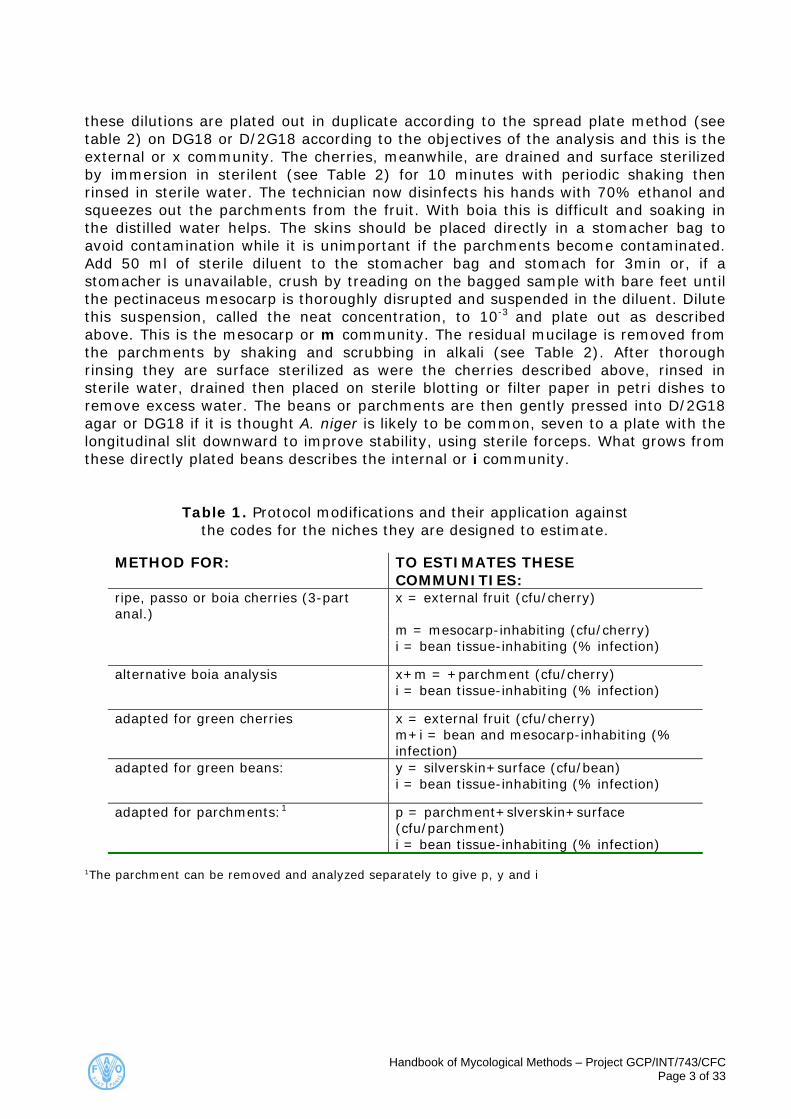
these dilutions are plated out in duplicate according to the spread plate method (see table 2) on DG18 or D/2G18 according to the objectives of the analysis and this is the external or x community. The cherries, meanwhile, are drained and surface sterilized by immersion in sterilent (see Table 2) for 10 minutes with periodic shaking then rinsed in sterile water. The technician now disinfects his hands with 70% ethanol and squeezes out the parchments from the fruit. With boia this is difficult and soaking in the distilled water helps. The skins should be placed directly in a stomacher bag to avoid contamination while it is unimportant if the parchments become contaminated. Add 50 ml of sterile diluent to the stomacher bag and stomach for 3min or, if a stomacher is unavailable, crush by treading on the bagged sample with bare feet until the pectinaceus mesocarp is thoroughly disrupted and suspended in the diluent. Dilute this suspension, called the neat concentration, to 10-3 and plate out as described above. This is the mesocarp or m community. The residual mucilage is removed from the parchments by shaking and scrubbing in alkali (see Table 2). After thorough rinsing they are surface sterilized as were the cherries described above, rinsed in sterile water, drained then placed on sterile blotting or filter paper in petri dishes to remove excess water. The beans or parchments are then gently pressed into D/2G18 agar or DG18 if it is thought A. niger is likely to be common, seven to a plate with the longitudinal slit downward to improve stability, using sterile forceps. What grows from these directly plated beans describes the internal or i community.
Table 1. Protocol modifications and their application against the codes for the niches they are designed to estimate.
METHOD FOR: TO ESTIMATES THESE
COMMUNITIES: ripe, passo or boia cherries (3-part anal.)
x = external fruit (cfu/cherry)
m = mesocarp-inhabiting (cfu/cherry) i = bean tissue-inhabiting (% infection)
alternative boia analysis x+m = +parchment (cfu/cherry) i = bean tissue-inhabiting (% infection)
adapted for green cherries x = external fruit (cfu/cherry) m+i = bean and mesocarp-inhabiting (% infection)
adapted for green beans: y = silverskin+surface (cfu/bean) i = bean tissue-inhabiting (% infection)
adapted for parchments:1 p = parchment+slverskin+surface (cfu/parchment)
i = bean tissue-inhabiting (% infection)
1The parchment can be removed and analyzed separately to give p, y and i
Handbook of Mycological Methods – Project GCP/INT/743/CFC Page 3 of 33
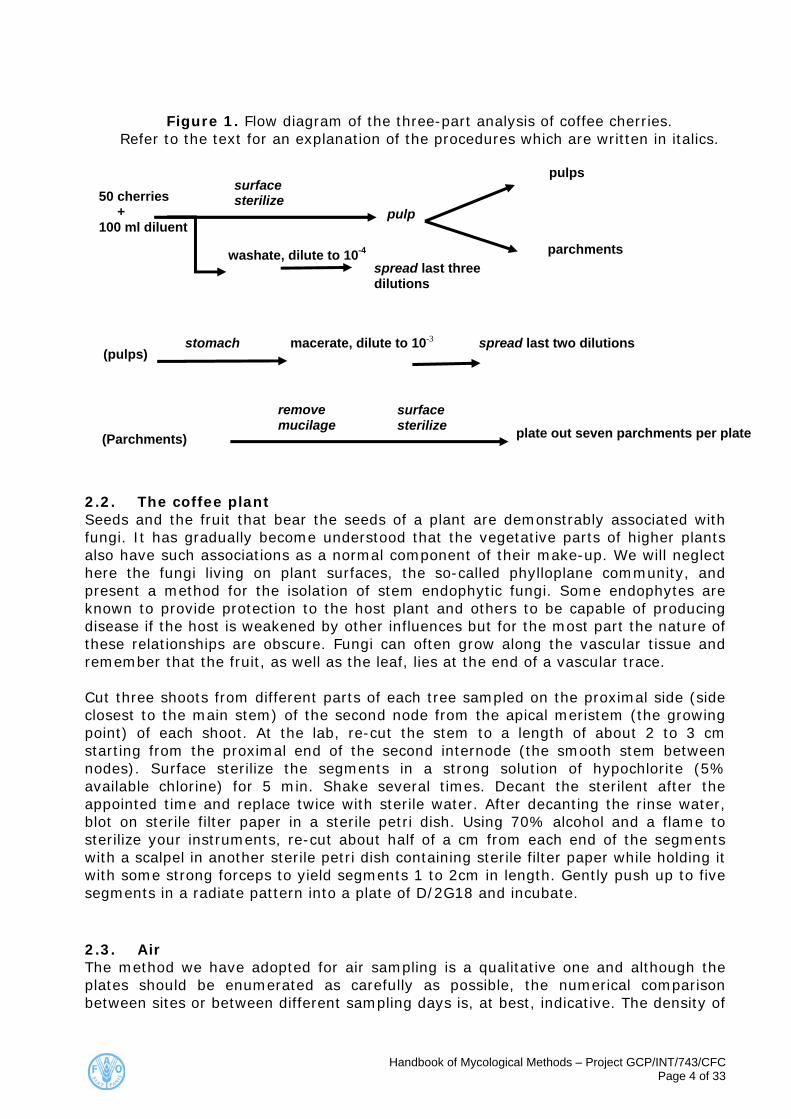
Figure 1. Flow diagram of the three-part analysis of coffee cherries. Refer to the text for an explanation of the procedures which are written in italics.
50 cherries + 100 ml diluent
surface sterilize
washate, dilute to 10-4
pulp
macerate, dilute to 10-3
remove mucilage
surfacesterilize plate out seven parchments per plate
spread last two dilutions (pulps)
stomach
(Parchments)
spread last threedilutions
parchments
pulps
2.2. The coffee plant Seeds and the fruit that bear the seeds of a plant are demonstrably associated with fungi. It has gradually become understood that the vegetative parts of higher plants also have such associations as a normal component of their make-up. We will neglect here the fungi living on plant surfaces, the so-called phylloplane community, and present a method for the isolation of stem endophytic fungi. Some endophytes are known to provide protection to the host plant and others to be capable of producing disease if the host is weakened by other influences but for the most part the nature of these relationships are obscure. Fungi can often grow along the vascular tissue and remember that the fruit, as well as the leaf, lies at the end of a vascular trace. Cut three shoots from different parts of each tree sampled on the proximal side (side closest to the main stem) of the second node from the apical meristem (the growing point) of each shoot. At the lab, re-cut the stem to a length of about 2 to 3 cm starting from the proximal end of the second internode (the smooth stem between nodes). Surface sterilize the segments in a strong solution of hypochlorite (5% available chlorine) for 5 min. Shake several times. Decant the sterilent after the appointed time and replace twice with sterile water. After decanting the rinse water, blot on sterile filter paper in a sterile petri dish. Using 70% alcohol and a flame to sterilize your instruments, re-cut about half of a cm from each end of the segments with a scalpel in another sterile petri dish containing sterile filter paper while holding it with some strong forceps to yield segments 1 to 2cm in length. Gently push up to five segments in a radiate pattern into a plate of D/2G18 and incubate. 2.3. Air The method we have adopted for air sampling is a qualitative one and although the plates should be enumerated as carefully as possible, the numerical comparison between sites or between different sampling days is, at best, indicative. The density of
Handbook of Mycological Methods – Project GCP/INT/743/CFC Page 4 of 33
the air spora shows diurnal changes and also is affected, not surprisingly, by wind and proximity to past rainfall. Quantitative methods of air sampling yield data in units of viable propagules per litre of air and requires air to be drawn past an agar surface at a specific velocity to ensure particles of a particular mass will impact on the surface. The velocity for sampling bacteria is much different to that for fungal spores, for example. The method we have adopted reflects the actual spore load depending, as it does, on passive settling but the kinds of fungi present is more significant in this study. If a sample is taken on a drying yard, we see what fungal spores are falling on the coffee but we are also very likely seeing what fungal spores are arising on the drying coffee and being distributed by air. The difference between this sample and one taken up-wind from the drying yard will establish to what extent this may be true. In general, species of Cladosporium are very numerous in air, particularly at sites with copious amounts of foliage as in shaded coffee. This makes the detection of proportionately uncommon, but potentially more significant, fungi very difficult. The medium DC03 is designed to strongly select against Cladosporium allowing for a much extended sampling time and therefore a better chance of recruiting the other components of the air spora. Use plates of DG18 in combination with DC03 for this procedure. No other equipment aside from an empty box or some other means of keeping the plate from direct contact with the ground is necessary. You will remove the lids from the plates and replace them after the appropriate passage of time. Two or three exposure periods in at least duplicate for each medium should be sampled at each sampling location since it is impossible to know the optimum exposure period: the time it will take to allow 50 viable propagules to settle on the plates. Under-exposed plates are perfectly acceptable but less informative while plates with too many colonies will underestimate or eliminate species that are either slow growing or whose spores are slow to germinate. As a rule of thumb, 2 min and 5 min exposure of DG18 outdoors on a calm day is usually satisfactory and this can be increased to 8min and 15 min for DC03. In a coffee store or factory in which there has recently been little activity these times can be tripled but if the indoor environment is dusty, exposure must be reduced dramatically since dust settles much faster than free spores. Open pulping facilities should be sampled for a period between the indoor and outdoor recommendations. Once experience has been gained with the method, adjustments to local conditions can be made. Label the plates as to site and exposure period and if an insect settles on the plate, a common occurrence at the drying yard, do not discard the plate but rather note the instance. As alluded to above, this method of air sampling reflects both what is settling and what spores are being produced, mainly, local to the sampling site. If a fungus is significant to coffee production but is primarily a soil organism, there must be a mechanism for its introduction to coffee production. Air dispersal is one possibility and the imaginative construction of air sampling experiments would be expected to yield direct evidence of this if it is the case.
Handbook of Mycological Methods – Project GCP/INT/743/CFC Page 5 of 33
2.4. Soil Although commonly employed, taking a single ‘grab sample’ of soil is not a very useful activity. Any two samples whether separated by a meter or a kilometer will be different because they cannot be the same. What is of interest is not the fact of the difference but ascribing the difference to some feature of ecological significance. The protocol described below allows the observed differences to be attributed to the influence of the coffee rhizosphere or, put more rigourously, it is a sampling experiment that tests the proposition that species adapted to the coffee rhizosphere disappear away from this environment. Use a strong spatula to remove about 20g of soil into a sterile bottle of an appropriate size after brushing away loose material and the uppermost layer of soil (usually 1 to 3 cm) until the small fibrous roots are exposed. Sample the soil around these roots. Away from the coffee stem sample at the same depth as the '0' sample. To sample in the orchard, the first sample, labeled ‘0’, is taken within 10 cm of the main stem of a coffee plant, the second, labeled ‘1’, is taken below the edge of the foliage of the same plant and the third, labeled ‘2’, is taken along the line defined by the first two but at a point such that it is as far as possible away from any coffee plant but still within the plantation system. A fourth sample (label ‘3’) may be taken near to but outside of the plantation for reference. If the samples are not to be analyzed immediately, they should be air-dried for storage and the analysis completed as soon as possible. The analysis consists of standard spread plate dilution on DG18 or both DG18 and DC03. Suspend either 1g in 9ml of diluent or 10g in 90ml and shake vigourously. Allow the suspension to settle for about a minute so that the larger particles settle. Make two further dilutions to 10-3 and triplicate spread plates from the 10-2 and 10-3 dilutions. 2.5. Surfaces Cement, brick or plastic sheeting as well as surfaces of processing equipment or fermentation vats can be sampled in this way. Compacted earth and cow-dung plaster drying yards can also be sampled in this way. Use sterile cotton swabs in wooden sticks and 10ml volumes of diluent to take the samples. For the purposes of the project, an estimated area of 5cm2 in place of the traditional sterile mask to control area sampled will suffice. Determine what samples are relevant and where you will take them. Label a bottle of diluent unambiguously and wet a swab. Swab about 5cm2 systematically in two directions at 90o to one another while slowly rotating the swab around its long axis. Now place the cotton end into the diluent bottle and snap off the end so that it falls into the bottle. Keep the sample as cold as possible until analysis on the same day, keeping in mind that a sample maintained at room temperature will overestimate yeast since yeast will begin multiplying immediately while fungal spores and hyphal fragments will not. Once back at the lab complete the analysis by dilution plating, after thorough agitation of the swab, onto DG18 or DG18 and DC03, as indicated by the objectives of your study. It is very difficult to predict colonization densities but turbidity is often a good guide. A yeast or spore suspension just visibly turbid represents about 104 cfu/ml. Note the dilution in which turbidity persists, allow for some contribution of inanimate material and calculate the dilution at which you would expect to get 50 to
Handbook of Mycological Methods – Project GCP/INT/743/CFC Page 6 of 33
100 colonies per plate (50 for moulds, 150 to 200 for yeast). Select two other dilutions around this and plate in at least duplicate. 2.6. Insects We have used a quantitative qualitative method for this analysis depending on the objective. To qualitatively assess the impact of an insect associated with coffee, capture some of the live animals and release them onto an appropriate number of petri dishes containing an enumeration medium. After some time, once plenty of footprints and feces have been deposited, incubate the plates. Clearly, fungi growing from the feces have been ingested and survived the passage through the gut or constitute part of the gut flora whereas that from the footprints represents the exoskeleton-related fungi in combination with fungal propagules picked up from wherever the insect had last been. Total mycological load can be estimated by capturing a few insects and putting about three, for insects of the size of the coffee berry borer, per 1ml of diluent into the corner of a stomacher bag. Using something like a cylindrical knurled nut, thoroughly crush the insects. Dilute with a further 9 ml, mix and dilute to 10-2, plating out the last two dilutions. 3. Media and Materials The list of media has been kept as short as possible. Most fungi can grow on most plant extracts but growth per se is not the objective in selecting media. The list contains enumeration media, the ‘work horse’ medium, malt extract agar which is also useful for distinguishing species of Aspergillus and Penicillium, other media used in the identification of specific genera and a maintenance medium for storing isolates over one to three years. The importance of selecting the right medium for the job at hand and making it accurately can not be emphasized too strongly. First, an enumeration medium is employed. Fungi recruited in this step must be isolated and purified on an isolation medium. By this stage an approximate identification is required to allow the selection of the media that will facilitate final identification. One or more media are employed to characterize the fungus according to what media have been used by taxonomists responsible for establishing the accepted identification system for the relevant genera. Significant isolates and a proportion of routinely recruited isolates should be maintained in storage for reference purposes or for use in a programme of further physiological or biochemical studies. In the context of a working research laboratory this can be done on agar slopes of a maintenance medium, maintained at 4oC. Unlike most bacteria and yeasts, fungi grow by spreading. The ideal enumeration medium would restrict spreading so that the maximum number of colonies could be accommodated on the surface of a petri dish while at the same time, not preventing any fungal species from growing altogether. DG18 uses reduced water activity and an anti-fungal agent (dichloran) to approach this ideal. A medium used for enumeration that does not inhibit growth, is one that preferentially selects fast-growing species and is in that important sense selective. There are other enumeration media containing rose bengal or rose bengal in combination with dichloran that can also produce good
Handbook of Mycological Methods – Project GCP/INT/743/CFC Page 7 of 33
results but the medium is relatively unstable and can become very inhibitory under certain ill-defined conditions. The materials list reflects the recommendations arrived at for the project’s activities in laboratory development. A variety of types of glassware are currently used in the laboratories of the producer countries but the system of glassware found in these recommendations is better in practice and often economically superior if a medium term view is adopted. Full details are available elsewhere.
For 9ml diluents, McCartney bottles with plastic screw caps [vol~22ml] For 90ml diluents, 100ml Duran-style bottles with screw caps For 100ml diluents (x analysis), 250ml Duran-style bottles with screw caps For storage of isolates, bijoux bottles with plastic screw caps [volume~4ml] For autoclaving agars, 0.5 and 1.0 l Duran-style bottles with screw caps Plastic, disposable, pre-sterilized petri dishes1 For dilutions, plastic, disposable 1ml pipettes1 Nalgaware measuring cylinders [0.1, 0.5, 1.0 and 2.0 l]
1 Pending inquiries on cost and availability
Handbook of Mycological Methods – Project GCP/INT/743/CFC Page 8 of 33
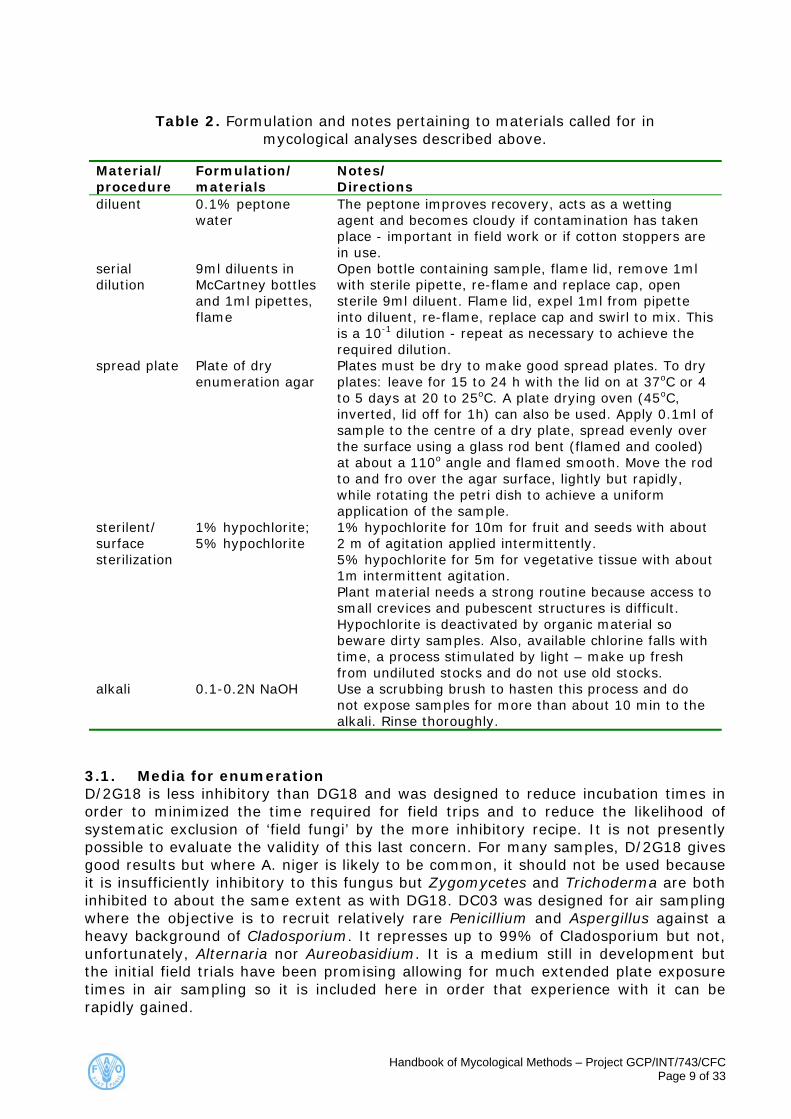
Table 2. Formulation and notes pertaining to materials called for in mycological analyses described above.
Material/ procedure
Formulation/ materials
Notes/ Directions
diluent 0.1% peptone water
The peptone improves recovery, acts as a wetting agent and becomes cloudy if contamination has taken place - important in field work or if cotton stoppers are in use.
serial dilution
9ml diluents in McCartney bottles and 1ml pipettes, flame
Open bottle containing sample, flame lid, remove 1ml with sterile pipette, re-flame and replace cap, open sterile 9ml diluent. Flame lid, expel 1ml from pipette into diluent, re-flame, replace cap and swirl to mix. This is a 10-1 dilution - repeat as necessary to achieve the required dilution.
spread plate Plate of dry enumeration agar
Plates must be dry to make good spread plates. To dry plates: leave for 15 to 24 h with the lid on at 37oC or 4 to 5 days at 20 to 25oC. A plate drying oven (45oC, inverted, lid off for 1h) can also be used. Apply 0.1ml of sample to the centre of a dry plate, spread evenly over the surface using a glass rod bent (flamed and cooled) at about a 110o angle and flamed smooth. Move the rod to and fro over the agar surface, lightly but rapidly, while rotating the petri dish to achieve a uniform application of the sample.
sterilent/ surface sterilization
1% hypochlorite; 5% hypochlorite
1% hypochlorite for 10m for fruit and seeds with about 2 m of agitation applied intermittently. 5% hypochlorite for 5m for vegetative tissue with about 1m intermittent agitation. Plant material needs a strong routine because access to small crevices and pubescent structures is difficult. Hypochlorite is deactivated by organic material so beware dirty samples. Also, available chlorine falls with time, a process stimulated by light – make up fresh from undiluted stocks and do not use old stocks.
alkali 0.1-0.2N NaOH Use a scrubbing brush to hasten this process and do not expose samples for more than about 10 min to the alkali. Rinse thoroughly.
3.1. Media for enumeration D/2G18 is less inhibitory than DG18 and was designed to reduce incubation times in order to minimized the time required for field trips and to reduce the likelihood of systematic exclusion of ‘field fungi’ by the more inhibitory recipe. It is not presently possible to evaluate the validity of this last concern. For many samples, D/2G18 gives good results but where A. niger is likely to be common, it should not be used because it is insufficiently inhibitory to this fungus but Zygomycetes and Trichoderma are both inhibited to about the same extent as with DG18. DC03 was designed for air sampling where the objective is to recruit relatively rare Penicillium and Aspergillus against a heavy background of Cladosporium. It represses up to 99% of Cladosporium but not, unfortunately, Alternaria nor Aureobasidium. It is a medium still in development but the initial field trials have been promising allowing for much extended plate exposure times in air sampling so it is included here in order that experience with it can be rapidly gained.
Handbook of Mycological Methods – Project GCP/INT/743/CFC Page 9 of 33
DG18 (recalculated to make approximately 1 litre) Glycerol 176g = 140ml Glucose 8.0g Peptone 4.0g KH2PO4 0.80g MgSO4.7 H2O 0.40g Water 800ml Agar 15g 2 ml of antibiotic stock solution (Comprising: 750mg of chloramphenicol + 20mg of dichloran in 20.0ml of 70% ethanol. Important: add to tempered agar after autoclaving) D/2G18
Made exactly as DG18 but use an antibiotic stock solution containing 10mg of dichloran in place of the 20mg called for above.
DC03
Made as DG18 but add 1ml of a second antibiotic stock solution containing 6mg of carbendazim in 20ml of 70% ethanol (if carbendazim is compounded with an adjuvent, adjust amount so that 6mg of active ingredient (a.i.) is provided).
3.2. Media for isolation and purification Several media have been employed in this role, however, recent observations on the stability of hyphomycetes in pure culture has lead to the suggestion that rich sugary media increases strain degeneration. Media that incorporates a lot of sugar and peptone such as Saubouraud’s or Blakeslee’s recipe of malt extract should be abandoned for routine culture handling and used only when called for in specific taxonomic treatments. Oatmeal agar is to be preferred to malt extract agar for isolation of Fusarium although its use is not absolutely necessary, unless further purification is indicated.
Malt extract agar Malt extract (Oxoid L39) 20g Agar 15g Water 1 litre Adjust pH to about 6.8 with 1M NaOH Oatmeal agar Porridge oats 30g
Water 1 litre (Simmer for 2 hours, filter out solids through muslin, make up to 1 litre)
Agar 15g
3.3. Media for identification of Aspergillus and Penicillium Methods for Aspergillus and Penicillium are similar according to several taxonomic treatments. It is an area for specialists and non-specialists can never have absolute confidence in their identifications. For this reason it is essential that workers take great care to follow the methods and record the observations so that there is a
Handbook of Mycological Methods – Project GCP/INT/743/CFC Page 10 of 33
thorough record of the isolate supporting any name that might be assigned. It may have to be amended in future. The coffee fungus taxonomic guide simplifies the taxonomic situation but cannot be seen as definitive since it presents a simplified version aimed at non-specialists. Systems for Penicillium identification include Pitt’s (1975) who utilizes a different formulation of malt extract agar and a medium called G25N in addition to Czapek yeast extract agar (CYA). Frisvad and Filtenborg (1989) find creatin agar useful and along with Samson (1985) advocates CYA but employs the malt extract formulation adopted here above. Frisvad and Filtrnborg also advocates the use of secondary metabolite profiles as expressed on Yeast extract sucrose agar (YES) and characterized by TLC or HPLC (if available). The classical Penicillium taxonomy on which the modern treatments are based (Raper and Thom) uses Czapek agar (CZ) and Blakeslee’s malt extract formulation. We have found no advantage in including CYA in addition to CZ for distinguishing Aspergillus species so here we propose to apply only CZ and the malt extract agar described above for this purpose.
Czapek agar Czapek's concentrate 10ml K2HPO4 1.0g Sucrose 30.0g Agar 15g Water 990ml Czapek's concentrate: (stopper tightly and store at room temperature; a precipitate will slowly form so suspend before dispensing) NaNO3 30.0g MgSO4 5.00g KCl 5.00g FeSO4 0.10g Water 100ml Czapek yeast extract agar Add Yeast extract to Czapek's agar at a rate of 5g/l.
3.4. Media for short and medium term storage of isolates Although freeze-drying is a very successful preservation method for bacteria, fungi are more fastidious and generally suffer a large reduction in viability when treated in this way. Many culture collections, by care and optimized methods use it successfully but it is best left to these specialist institutions. For short to medium term storage (i.e. 1 to 3 years) slopes, sealed to prevent them drying out and kept refrigerated is a low cost, reliable and convenient technology. Malt extract, for miscellaneous fungi, Czapek agar for Penicillium and Aspergillus and potato sucrose agar for Fusarium are traditional, but years of experience with the weak medium given below has shown it to be generally superior than any of these. About 3ml of the molten medium is dispensed into bijoux bottles autoclaved then allowed to cool on a slope such that the
Handbook of Mycological Methods – Project GCP/INT/743/CFC Page 11 of 33
top is well below the lid and the base has a slight butt. To use, inoculate with a small block of agar retaining hyphal tips from the purified culture of the isolate of interest. Incubate with the cap loose (this is very important since lack of oxygen can inhibit growth and prevent sporulation) for up to five days or until significant sporulation can be observed. Screw the cap down and store at 4oC being certain that the label, in indelible pen, contains a date of culture and corresponds to clear notes on the isolate. This medium is not suitable for xerophiles such as Wallemia and many species of Eurotium.
Mick’s Maintenance Medium Malt extract 8.0g Yeast extract 2.0g Sucrose 5.0g Agar 18.0g Water 1 litre (Adjust pH to about neutrality)
3.5. Media for the characterization of yeast isolates: This is a specialized area but a little effort can improve the non-specialist’s understanding and usefully distinguish some of the members of this important group from one another. Details are given in the project taxonomic handbook but pour plates of Gorodkowa’s medium thickly because they may require incubation for up to 6 weeks. In the dalmau plate method, a corn meal agar plate is streaked thickly with a purified yeast isolate using a microbiologists loop and a sterile glass cover slip is placed over a part of the streak (two isolates can be accommodated per plate). The plate is examined directly on a microscope each day for about three days through the cover glass and any tendancy to produce hyphae, pseudo-hyphae or conidia is noted.
Gorodkowa's medium (for the production of ascospores) Glucose 2.50g NaCl 5.20g Beef extract 10.0g Agar 10.0g Water 1 litre
Cornmeal agar (or use Oxoid CM103)
Cornmeal 100g Water 1 litre (simmer for 1h, filter out solids through muslin, adjust to 1 litre) Tween 80 10g (when for use with yeasts in the Dalmau plate procedure) Agar 15g
Handbook of Mycological Methods – Project GCP/INT/743/CFC Page 12 of 33
4. Primer on OTA-Producing Fungi in Coffee
4.1. Ochraceus group (Circumdati) aspergilli Members of this section of the genus Aspergillus are widely distributed but rarely common. They are associated with various tree and cereal crops but are also commonly isolated from soil and are recorded in the literature from a bewildering number of substrates. Amongst its members are the prime suspects for OTA production in several products of tropical and sub-tropical origin. The general state of taxonomy can be characterized as confused and there is only partial consensus amongst specialists as to how to delimit the species of the group, numbering not many fewer than 20. There are a couple of technical reasons for this confusion. Firstly, Raper and Fennel’s classic treatment relied heavily on the nature of a vegetative structure called the sclerotium and the colour of the conidial mass. In point of fact, most isolates do not appear capable of producing sclerotia thus depriving the worker, nine times out of ten, of the clearest means of distinguishing the most important species. The colour of the conidial mass only varies from shades of gold through bright yellow, pale yellow, buff, to tan, the colour changes as the culture matures and is sensitive to the medium and these colours are very difficult to distinguish and to describe (a young culture of A. terreus could be mistaken for an ochre group species but for the distinctive, small, columnar conidial heads visible with a dissecting microscope – all ochraceus species have spherical heads, though often falling into bunches with age.). Secondly, the microscopic features tend to be uniform throughout the group such as conidial size and texture or relatively uniform in comparison with the variation that can be observed in one isolate or between isolates accepted as representing a single species. As a consequence, it is not possible for the non-specialist to be absolutely confident of an identification. So where does the real interest in diagnosing an isolate to the level of species lie? We want to know what species an isolate is in order to know something about its properties. Whether it could produce OTA, grow at low water activity, produce heat resistant spores, produce off tastes, produce plant disease and so forth. The two most commonly isolated representatives of this group are A. ochraceus and A. melleus. Although the situation with respect to OTA production is not absolutely settled, at present it appears that some 60% to 80% of A. ochraceus isolates produce OTA and that A. melleus is not a producer. We hope to produce a reliable means for non-specialists to distinguish these two species but this is not possible at present. A. sulphureus almost always produces large amounts of OTA and it is probable that A. ostianus and A. alliaceus (the only representative of the group with a known perfect stage) can produce this toxin and what scant evidence there is indicates A. elegans also produces. 4.2. Niger group (Nigri) aspergilli The niger group is one of the most commercially important groups of fungi both because representatives are widely used in production of organic acids and because others are the most common and widespread food spoilage fungi. These species are not soil organisms, neither do they seem to have a natural history outside of man’s food systems. These fungi may well be the fungal equivalent to dogs, cats and rats, successful as long as man is successful.
Handbook of Mycological Methods – Project GCP/INT/743/CFC Page 13 of 33
The niger group can not be diagnosed into species based on macroscopic characters but, unlike the ochraceus group, the species important to the project are fairly easily distinguished based on other criteria. The main problem is making a preparation well enough to be able to see the necessary features. The spore mass of all members of the group are chocolate brown to dark purple-brown to black. There is usually no reverse colour although sometimes a diffusable yellow pigment is produced but has little diagnostic value. Use a dissecting scope in good light on ten day old cultures grown on Czapek agar to describe the colour. Most isolates are distinctly brown under these conditions although they may appear black to the unaided eye. If a member of this sub-species is uniseriate [vesicles bearing phialides only, no metulae], it is either A. japonicus or A. aculeatus. A. japonicus has somewhat smaller vesicles [25 - 60 µm] on shorter stipes than A. aculeatus [50-80 µm] although there is overlap in the two ranges of dimensions. All other species of the sub-genus are biseriate [phialides borne on metulae]. The four other species we will concern ourselves with are A. niger, by far the most common member of the group, A. carbonarius, by far the most important OTA producer of the group, A. awamori, considered by some to be a sub-species of A. niger and A. foetidus. A. niger is typically dark brown with spherical to sub-spherical conidia of 3.5 to 5 µm decorated with deeply pigmented warts, ridges and spine-like protuberances when mature. It is important to base these observations on mature spores, smooth spores can readily be observed near to the phialide even in well-grown cultures. It is characteristic for the spores to form persistent chains held together by easily seen thickened collars. Occasionally A. niger isolates will form sclerotia, very occasionally to the near exclusion of conidia. A. awamori can be thought of as a smooth-spored A. niger. A. foetidus also has smooth globose conidia but grows more slowly [40mm in 7 days] and the spore mass is olive brown to grayish brown. A. carbonarius is easily identified by its very large [mostly 8 to 10µm] and strongly decorated conidia [blunt spines when mature]. It is generally slightly slower growing and blacker than A. niger. A. niger is overwhelmingly the most common representative of this group, it is fast growing and aggressive. There is no fungus found so frequently as virtually the only fungus in commodity samples. In this respect it is fortunate that it rarely produces mycotoxins or strong taints. It appears that something of the order of 1% of A. niger isolates are weak OTA producers. A much greater proportion of A. carbonarius isolates produce significant mounts of OTA and, as far as the niger group is concerned, this is the species that should attract most of our attention in the project. It is not clear whether the other species mentioned above commonly produce OTA due to their rarity and retention of isolates of these species for further examination, when isolated, is important. 4.3. Further notes Other fungi have been demonstrated to produce OTA, in particular Penicillium verrucosum and A. glaucus, the anamorph of Eurotium herbariorum. This latter species is closely related to and difficult to distinguish from species commonly isolated from coffee, Eurotium rubrum and E. repens and all are strongly xerophillic. Some of these fungi also produce geosmin so could be responsible for the mouldy taste defect of the cup.
Handbook of Mycological Methods – Project GCP/INT/743/CFC Page 14 of 33
There is an indication that the production of OTA by A. carbonarius is relatively labile and both temperatures above 35oC and Aw below 0.9 (greatly reduced at 0.94) prevented significant OTA production on coffee (H. Joosten, pers.comm.). A. ochraceus, on the other hand is capable of producing OTA at 37oC and at Aw levels around 0.85, perhaps lower. The real world situation, though, admits of other mitigating circumstances such as the activity of other micro-organisms inhibiting growth and OTA production or degrading OTA that has already been produced. Biologically active compounds such as caffeine, theobromine and perhaps chlorogenic acids also can have an influence in toxin production. The whole area of environmental influence, which should be understood not as 'response to physical features', rather as bio-physical interaction, is well worth serious study. It is within physiological and adaptive properties and within the ecological net of interaction, in short, the natural history of these fungi within the coffee-related environment where we may expect to find the means of controlling their success in coffee and finding HACCP-based strategies for OTA control. 5. Enumeration Mycological enumeration is generally based on viable counts although methods exist for ergosterol, chitin, direct counting, 'electronic nose' (volatile metabolite detection) and antigen agglutination approaches amongst others. The interpretation of enumeration data can not be done in an incontrovertible manner, there are too many uncertainties regarding the source of a colony-forming unit or any of the units of measurement produced by the other methods. This is not to say enumeration is useless, rather that gaining an understanding of how the method works and the several ways in which it can yield misleading results is all the more important. Allied to a good sampling programme and a set of carefully framed questions which the analysis has been designed to answer, a great deal of useful information can be derived. Equally, an understanding of fungal distribution, reproductive properties and ecological adaptation is required to accurately interpret this data. The conditions on a petri dish are wildly different from anything to which a fungus could have evolved. One is entitled to expect that what grows from a well integrated community adapted to a variable, low nutrient environment when placed on a petri dish of uniform, stable, wet and nutritious agar will not necessarily accurately reflect the in situ community. The term 'colony-forming unit' (cfu) could equally represent a spore, a clump of spores, a hyphal fragment or one or a clump of vegetative cells if yeasts are involved. A length of hyphae or mycelial mass can produce a variable number of viable fragments depending on the method used for suspending the sample in combination with the physiological condition of the fungus and inherent properties of that species. We consider homogenization and dilution plating of coffee beans (or other particulate commodities) to be essentially uninterpretable and therefore ask that this procedure not be used in this project. In a direct plating method, it must be remembered that a contaminated bean may represent a large fungal biomass or almost none and produce the same outcome, i.e. there is growth or there is not. Often several species can be seen to grow out from a single bean, however, fungi can exist in close physical association in the coffee bean (figure 2) and potentially, species slower to grow out could be killed by faster growing neighbours or simply go unobserved by being obscured by them.
Handbook of Mycological Methods – Project GCP/INT/743/CFC Page 15 of 33
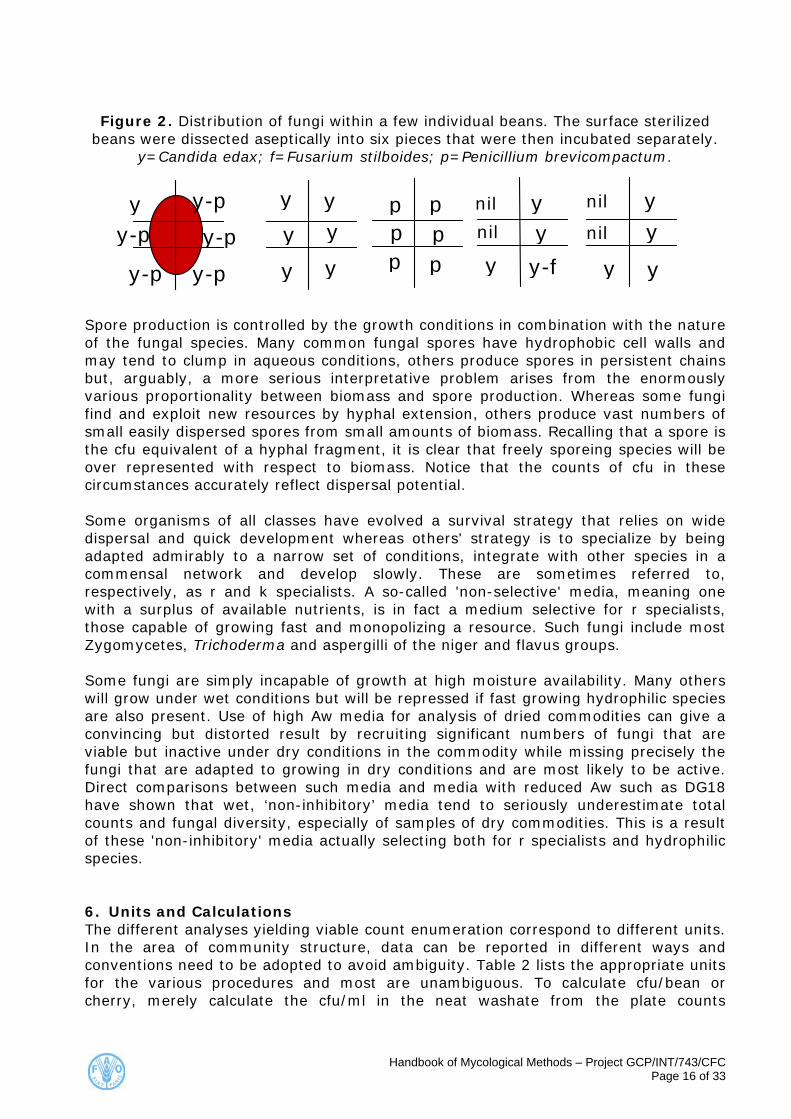
Figure 2. Distribution of fungi within a few individual beans. The surface sterilized beans were dissected aseptically into six pieces that were then incubated separately.
y=Candida edax; f=Fusarium stilboides; p=Penicillium brevicompactum.
y-p
y-p
y-py-p
y-py y
y
y y
yy p p
ppp p
yy
yy
nil
nil
y-f
yy
ynilnil
Spore production is controlled by the growth conditions in combination with the nature of the fungal species. Many common fungal spores have hydrophobic cell walls and may tend to clump in aqueous conditions, others produce spores in persistent chains but, arguably, a more serious interpretative problem arises from the enormously various proportionality between biomass and spore production. Whereas some fungi find and exploit new resources by hyphal extension, others produce vast numbers of small easily dispersed spores from small amounts of biomass. Recalling that a spore is the cfu equivalent of a hyphal fragment, it is clear that freely sporeing species will be over represented with respect to biomass. Notice that the counts of cfu in these circumstances accurately reflect dispersal potential. Some organisms of all classes have evolved a survival strategy that relies on wide dispersal and quick development whereas others' strategy is to specialize by being adapted admirably to a narrow set of conditions, integrate with other species in a commensal network and develop slowly. These are sometimes referred to, respectively, as r and k specialists. A so-called 'non-selective' media, meaning one with a surplus of available nutrients, is in fact a medium selective for r specialists, those capable of growing fast and monopolizing a resource. Such fungi include most Zygomycetes, Trichoderma and aspergilli of the niger and flavus groups. Some fungi are simply incapable of growth at high moisture availability. Many others will grow under wet conditions but will be repressed if fast growing hydrophilic species are also present. Use of high Aw media for analysis of dried commodities can give a convincing but distorted result by recruiting significant numbers of fungi that are viable but inactive under dry conditions in the commodity while missing precisely the fungi that are adapted to growing in dry conditions and are most likely to be active. Direct comparisons between such media and media with reduced Aw such as DG18 have shown that wet, ‘non-inhibitory’ media tend to seriously underestimate total counts and fungal diversity, especially of samples of dry commodities. This is a result of these 'non-inhibitory' media actually selecting both for r specialists and hydrophilic species. 6. Units and Calculations The different analyses yielding viable count enumeration correspond to different units. In the area of community structure, data can be reported in different ways and conventions need to be adopted to avoid ambiguity. Table 2 lists the appropriate units for the various procedures and most are unambiguous. To calculate cfu/bean or cherry, merely calculate the cfu/ml in the neat washate from the plate counts
Handbook of Mycological Methods – Project GCP/INT/743/CFC Page 16 of 33
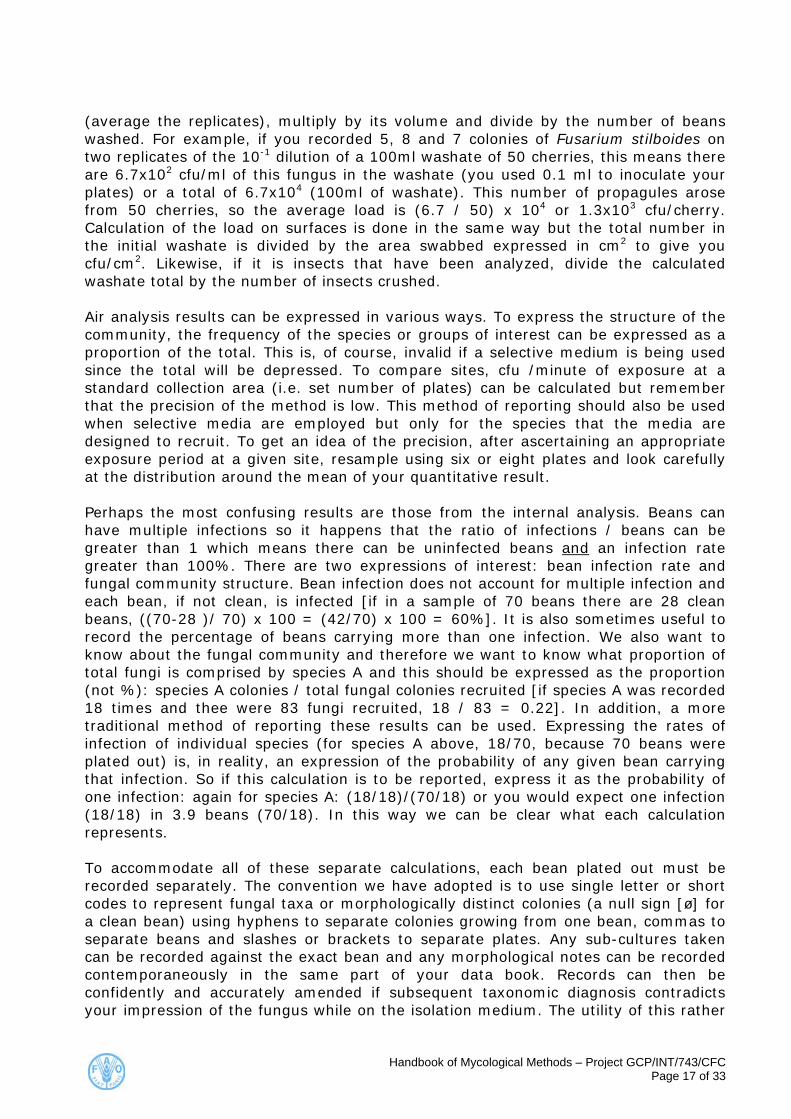
(average the replicates), multiply by its volume and divide by the number of beans washed. For example, if you recorded 5, 8 and 7 colonies of Fusarium stilboides on two replicates of the 10-1 dilution of a 100ml washate of 50 cherries, this means there are 6.7x10² cfu/ml of this fungus in the washate (you used 0.1 ml to inoculate your plates) or a total of 6.7x10⁴ (100ml of washate). This number of propagules arose from 50 cherries, so the average load is (6.7 / 50) x 104 or 1.3x10³ cfu/cherry. Calculation of the load on surfaces is done in the same way but the total number in the initial washate is divided by the area swabbed expressed in cm2 to give you cfu/cm2. Likewise, if it is insects that have been analyzed, divide the calculated washate total by the number of insects crushed. Air analysis results can be expressed in various ways. To express the structure of the community, the frequency of the species or groups of interest can be expressed as a proportion of the total. This is, of course, invalid if a selective medium is being used since the total will be depressed. To compare sites, cfu /minute of exposure at a standard collection area (i.e. set number of plates) can be calculated but remember that the precision of the method is low. This method of reporting should also be used when selective media are employed but only for the species that the media are designed to recruit. To get an idea of the precision, after ascertaining an appropriate exposure period at a given site, resample using six or eight plates and look carefully at the distribution around the mean of your quantitative result. Perhaps the most confusing results are those from the internal analysis. Beans can have multiple infections so it happens that the ratio of infections / beans can be greater than 1 which means there can be uninfected beans and an infection rate greater than 100%. There are two expressions of interest: bean infection rate and fungal community structure. Bean infection does not account for multiple infection and each bean, if not clean, is infected [if in a sample of 70 beans there are 28 clean beans, ((70-28 )/ 70) x 100 = (42/70) x 100 = 60%]. It is also sometimes useful to record the percentage of beans carrying more than one infection. We also want to know about the fungal community and therefore we want to know what proportion of total fungi is comprised by species A and this should be expressed as the proportion (not %): species A colonies / total fungal colonies recruited [if species A was recorded 18 times and thee were 83 fungi recruited, 18 / 83 = 0.22]. In addition, a more traditional method of reporting these results can be used. Expressing the rates of infection of individual species (for species A above, 18/70, because 70 beans were plated out) is, in reality, an expression of the probability of any given bean carrying that infection. So if this calculation is to be reported, express it as the probability of one infection: again for species A: (18/18)/(70/18) or you would expect one infection (18/18) in 3.9 beans (70/18). In this way we can be clear what each calculation represents. To accommodate all of these separate calculations, each bean plated out must be recorded separately. The convention we have adopted is to use single letter or short codes to represent fungal taxa or morphologically distinct colonies (a null sign [ø] for a clean bean) using hyphens to separate colonies growing from one bean, commas to separate beans and slashes or brackets to separate plates. Any sub-cultures taken can be recorded against the exact bean and any morphological notes can be recorded contemporaneously in the same part of your data book. Records can then be confidently and accurately amended if subsequent taxonomic diagnosis contradicts your impression of the fungus while on the isolation medium. The utility of this rather
Handbook of Mycological Methods – Project GCP/INT/743/CFC Page 17 of 33
detailed record is that any patterns of co-occurrence can be revealed and this is the reason why a table recording merely the number of occurrences vs. taxa falls short of requirements. You may like to, draw up a data table from this record such that the rows represent taxa and the columns represent plates to simplify the calculations and this format could form part of a spreadsheet. 7. Recording and Reporting In recording the results of an experiment, it is critical to make a contemporaneous record of the study, not just the data but anything that strikes the investigator. Even things that may seem (and often eventually prove ) to be immaterial should be noted. These notes can and should include ideas that occur to the investigator in the field or observations of those involved in coffee production on site. They must include information on anything that causes a deviation to the proposed procedure or, like unusual weather or the occurrence of plant disease is likely to effect the outcome. The normal case in field work is for the unexpected to occur, the weather to be uncooperative, everything to take longer than expected, so often, with the best of intentions, it proves impossible to follow ‘plan A’. It is imperative to record what has actually been done - it is the only way of being in a position to interpret the data. If the intention is to collect samples on Monday and set up analyses on Tuesday but a problem prevents the analysis being set up for three days, this must be recorded. It may be that the delay has ruined the experiment or it may lead to a valuable piece of information but only by recording what was really done can the data be assessed. Counting colonies is an important part of the data set but the identity of the species and their numbers relative to each other is, if anything, more important. As discussed above, the great advantage of enumeration medium is that it restricts growth of moulds greatly improving the reliability of enumeration. Its weakness is that in restricting growth it makes identification of the fungi more difficult. With experience, quite a few fungi can be identified with confidence either to species, sub-generic group or genus. With the aid of a dissecting microscope or hand lens, niger or ochraceus group aspergilli, mucoraceous fungi, Cladosporium, and several other more or less precise diagnoses can be made with confidence. Bear in mind that identification to species is not always necessary, depending on the objectives of the work at hand, and often something as grossly imprecise as ‘mucoraceous mould’ is enough. In other taxonomic areas even the sub-species level as ‘niger group’ or ‘ochraceus group’ do not provide enough precision since these groups include OTA producing and non-producing species. Your recording procedure must be flexible but robust enough to prevent confusion in light of subsequent observations, so adopt a means of recording counts of colonies against an unambiguous descriptor so that can later attribute the counts to, for example, the name of a species. You must also be able to link any isolates to the original isolate, the niche and sample of origin, the treatment the sample had received and any notes that you may have taken at the time. To take an example, you may notice a ‘fast niger’, a ‘low niger’ (meaning one with short conidiophores) and a ‘big-headed niger’ in one sample. They will require sub-culturing to diagnose and they may prove to represent one, two or three species so only a complete record will permit you to subsequently clarify the situation. This should not be interpreted as a suggestion to subculture every isolate, though. Exercise a sense of balance. You will also note a large number of isolates that can not be diagnosed because they lack features and these introduce another layer of potential confusion to your data set.
Handbook of Mycological Methods – Project GCP/INT/743/CFC Page 18 of 33
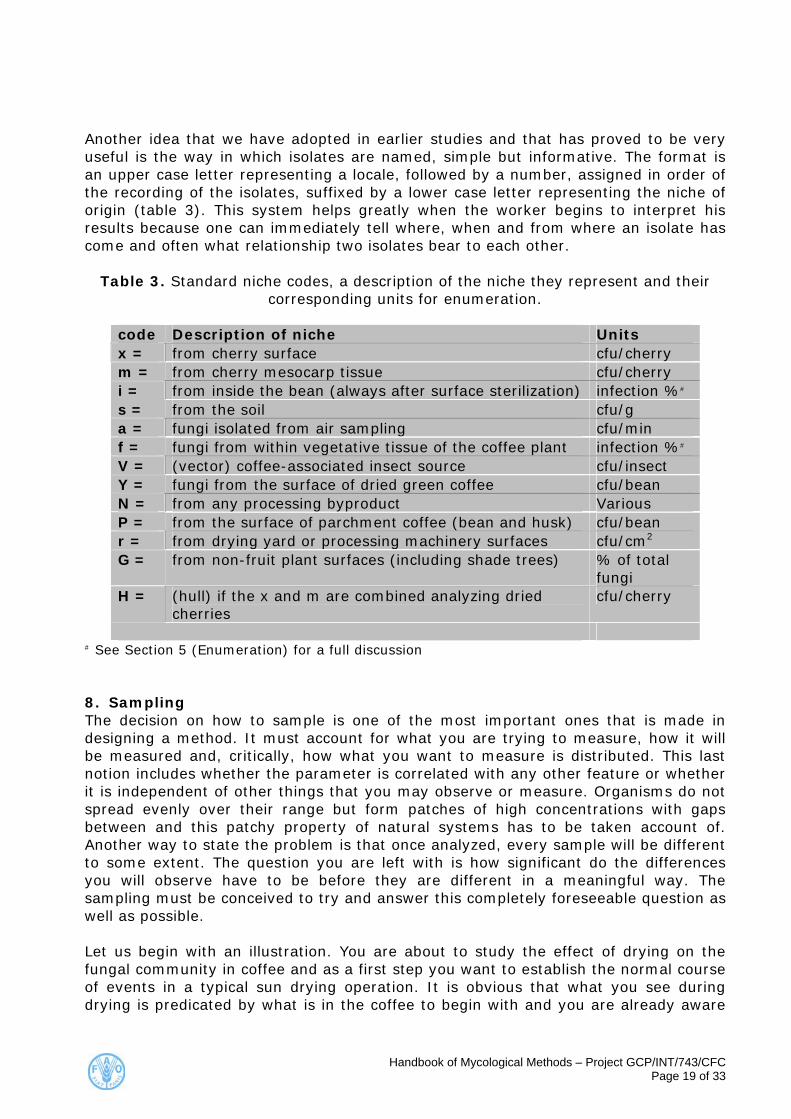
Another idea that we have adopted in earlier studies and that has proved to be very useful is the way in which isolates are named, simple but informative. The format is an upper case letter representing a locale, followed by a number, assigned in order of the recording of the isolates, suffixed by a lower case letter representing the niche of origin (table 3). This system helps greatly when the worker begins to interpret his results because one can immediately tell where, when and from where an isolate has come and often what relationship two isolates bear to each other.
Table 3. Standard niche codes, a description of the niche they represent and their corresponding units for enumeration.
code Description of niche Units x = from cherry surface cfu/cherry m = from cherry mesocarp tissue cfu/cherry i = from inside the bean (always after surface sterilization) infection %#
s = from the soil cfu/g a = fungi isolated from air sampling cfu/min f = fungi from within vegetative tissue of the coffee plant infection %#
V = (vector) coffee-associated insect source cfu/insect Y = fungi from the surface of dried green coffee cfu/bean N = from any processing byproduct Various P = from the surface of parchment coffee (bean and husk) cfu/bean r = from drying yard or processing machinery surfaces cfu/cm2
G = from non-fruit plant surfaces (including shade trees) % of total fungi
H = (hull) if the x and m are combined analyzing dried cherries
cfu/cherry
# See Section 5 (Enumeration) for a full discussion 8. Sampling The decision on how to sample is one of the most important ones that is made in designing a method. It must account for what you are trying to measure, how it will be measured and, critically, how what you want to measure is distributed. This last notion includes whether the parameter is correlated with any other feature or whether it is independent of other things that you may observe or measure. Organisms do not spread evenly over their range but form patches of high concentrations with gaps between and this patchy property of natural systems has to be taken account of. Another way to state the problem is that once analyzed, every sample will be different to some extent. The question you are left with is how significant do the differences you will observe have to be before they are different in a meaningful way. The sampling must be conceived to try and answer this completely foreseeable question as well as possible. Let us begin with an illustration. You are about to study the effect of drying on the fungal community in coffee and as a first step you want to establish the normal course of events in a typical sun drying operation. It is obvious that what you see during drying is predicated by what is in the coffee to begin with and you are already aware
Handbook of Mycological Methods – Project GCP/INT/743/CFC Page 19 of 33
that samples from different farms are not the same. So immediately you know that several farms, a number based on available resources and the ‘law of diminishing returns’, and preferably at some distance from each other, need to be included in the study. The focus of the study may be on certain species identified as of particular importance as they respond in a background of other organisms while their mutual environment becomes dryer and intermittently hotter. This environment is not inert rather it is a viable plant organ that itself responds to both the microbial community and the physical conditions. Inevitably, some species will benefit from the change, some will not. So the species of interest need to be present, obvious but not necessarily easy to fulfill depending on their rarity. They may respond differently to drying depending on what other fungi accompany them. The result documents how components of the fungal community succeed relative to the other species present as water becomes less available, temperatures reach higher temporary levels and the plant tissue changes its properties accordingly. So you have selected some number of farms for the study. One way you could sample is to go to a farm take some fresh cherries, take some that has been dried for one day, three days, six days and 12 days. The validity of this sampling plan will rest both with the uniformity of the drying conditions and the uniformity of fungi around the orchard since different days harvest represent different locations in the orchard. The initial conditions may therefore be different and later harvests may have missed wet weather, for example, so the differences you will see between the samples may not be attributable to what you are trying to study – effect of drying. There may be an unresolvable ambiguity, the observed differences produced by a summation of effects including those of location and non-uniform physical factors. Of course, if you can demonstrate uniformity, these objections disappear. A better experiment would probably be to return to the farm periodically and re-sample the same day’s harvest. But how good is a sample of 50 or 100 cherries (or parchments) from, say, the 1000kg that were harvested on that day? So perhaps two or three kg separated aside and thoroughly mixed before each sampling would be a better design. If you had been trying to establish how the actual day’s harvest changed then this would not be preferable, though. It would be more convenient, of course, to remove these few Kg from each farm to a mock up drying yard next to the lab. On the other hand, if you thought that some organisms were introduced to the coffee during drying via the farm air or from the drying yard surface, then this would not be satisfactory. From this example it is hoped that the impact of sampling method on an experimental procedure and how close consideration of sampling can lead to improved experimental design has been illustrated. In the same way, how an understanding of the sampling benefits the interpretation of results and, indeed, directs attention to gaps in current knowledge. During the pilot study, considerable effort was devoted to characterizing distribution of fungi in coffee production specifically to inform decisions on sampling and some helpful generalizations follow. If you were to sample the fruit of different branches separately, you would find considerable variation. Likewise, samples from different trees within a single block of an orchard vary noticeably. Attempts to attribute this variation to an external physical cause such as exposure to sun and wind on one side of the tree or at the edge of the planting, coincidence with disease or tree ill-thrift or to proximity to the soil, have been tested and failed to turn up any consistent bias. The impact of this scenario on the methodology of making a sample from the orchard is that fruit from several non-
Handbook of Mycological Methods – Project GCP/INT/743/CFC Page 20 of 33
adjacent trees should be sampled each from a few different branches and mixed. It may be that there is no more variation between trees in a block than between trees in different blocks but in an orchard of size, with a hilly topography, the differences between sites could be large and this hypothesis would seem unlikely to be true. An unmistakable feature of coffee is the extent to which ripening of the fruit is uneven. The unripe cherry, ripe cherry , the passo cherry and boia coexist often on the same trees throughout much of the harvest and they vary greatly in the qualitative and quantitative aspects of the fungal communities they bear. Depending on the experimental design, it could be legitimate to analyze these classes together but often they should be analyzed separately or a single type selected for the analysis. Information about the relative frequencies of the stages of cherry maturity can be an important piece of information. The most common fungi in fresh cherries, world wide, are Fusarium stilboides, Candida edax and Penicillium brevicompactum although the latter species seems to be absent in some regions. Cladosporium sp. is ubiquitous and can be numerically important on occasion. The same may be said of Cryptococcus albidus and Aureobasidium although all of these three are more common in the x and g niches. The fungal community in its quantitative aspect of ‘how many’ varies locally to the same extent as internationally. In its qualitative aspect of ‘what is there’, regional variation is greater, meaning that there are greater similarities between regions of countries in different continents than between some regions within one producer country. The implication here is that the origin of a sample must be known at least to district, preferably to farm. Distinguishing the fungal community associated with Coffea canephora from that of C. arabica has proved to be remarkably difficult. Part of the reason for this is that regional differences within the plantation of either species can be quite large and usually any given region grows either robusta or arabica. So it is problematic whether to ascribe the observed differences to the difference in region or to the difference between host species. In places like Karnataka state, India, where both species are grown on single farms or East Java, where farms grow one or the other, the differences are not large. This question needs further attention. Aspergillus ochraceus seems to occur, overall, at a frequency of something like 0.5% in the beans of fresh cherries but is more frequently recovered in the coffee rhizosphere, the air around the drying yard and storage facilities. We have some evidence that there are farms or parts of farms where it has become established and occurs in up to 30 or 40% of the beans at harvest. Despite this, OTA is not invariably produced according to the quality of the drying conditions. Niger group aspergilli are usually absent in the beans of fresh cherries but in certain locales can be very numerous in this niche. The species of this group apparently find success in the drying commodity since they are much more usual in dried or partly dried coffee and the air around coffee in these conditions. They are absent from soil except in that of bare earth drying yards if sampled under the coffee. It is a useful generalization that Aspergillus and Eurotium increase during drying while the yeasts and Fusarium decrease and one can predict that total bean infection will fall during drying if yeasts and Fusarium predominate at the commencement of drying but increase if Aspergillus and Eurotium are predominant.
Handbook of Mycological Methods – Project GCP/INT/743/CFC Page 21 of 33

Handbook of Mycological Methods – Project GCP/INT/743/CFC Page 22 of 33
9. Bibliography
9.1. Taxonomic works Christensen, M., 1982. The Aspergillus ochraceus group: two new species from western soils and a synoptic key. Mycologia 74: 210-225. Domsch, K.H. and W. Gams, 1980. Compendium of Soil Fungi. Academic Press. New York, U.S.A. Klich, M.A. and J.I. Pitt, 1988. A Laboratory Guide to Common Aspergillus Species and Their Teleomorphs. CSIRO, Div. of Food Processing, North Ryde, N.S.W., Australia. ISBN: 0-643-04866-9 Pitt, John I., 1979. The Genus Penicillium and its Teleomorphic States. Academic Press, London. Raper, K.B. and C. Thom, 1949. A Manual of the Penicillia. Williams and Wilkins Co., Baltimore, Md., U.S.A. Raper, K.B. and D.I. Fennel, 1965. The Genus Aspergillus. The Williams and Wilkins Company, Baltimore, Md., U.S.A.
9.2. Other subject areas
Bacon, C.W., J.G. Sweeney, J.D. Robbins and D. Burdick, 1973. Production of penicillic acid and ochratoxin A on poultry feed by Aspergillus ochraceus: temperature and moisture requirements. Applied Microbiology. 26:155-160. Buchanan, R.L., M.A. Molly and M.A. Gealt, 1983. Caffeine inhibition of sterigmatocystin, citrinin and patulin production. Journal of Food Science. 48: 1226-1228. Buchanan, R.L., G. Tice and D. Marino, 1981. Caffeine inhibition of ochratoxin A production. Journal of Food Science. 47: 319-321. Bucheli, P., C. Kanchanomai, I. Meyer and A. Pittet, 2000. Development of ochratoxin A during robusta (Coffea canephora) coffee cherry drying. Journal of Agricultural and Food Chemistry. 48: 1358-1362. Chelkowski, J., R.A. Samson, M. Wiewiorowska and P. Golinski, 1987. Ochratoxin A formation by isolated strains of the conidial stage of Aspergillus glaucus Link ex Grey (= Eurotium herbariorum Wiggers Link ex Grey) from cereal grains. Die Nahrung 31: 267-269. Frank, J.M., 2000. Development of Critical Control Points for Preventing Ochratoxin A (OTA) Accumulation in Coffee (in press). In proceedings of the Xth International Union of Pure and Applied Chemists (IUPAC) Symposium on Mycotoxins and Phycotoxins, May, 2000, Brasil. Frank, J.M., 1999. HACCP and its Mycotoxin Control Potential: Ochratoxin A (OTA) in Coffee Production. In: Food Microbiology and Food Safety into the Next Millenium, pp.122-125. eds. ACJ Tuijtelaars, RA Samson, FM Rombouts and S Notermans. Foundation Food Micro '99 Zeist, The Netherlands. Frank, J.M., 1999. HACCP and its Mycotoxin Control Potential: an Evaluation of Ochratoxin A in Coffee Production. Third FAO,WHO,UNEP Intergovernmental Conference on Mycotoxins. (Tunis, March 1999). Frank, J.M., 1998. Chapter 13. Special metabolites in relation to conditions of growth. pp.321-344. In: Chemical Fungal Taxonomy (eds. D. Arora, P. Bridge & J.C. Frisvad). Marcel Dekker, New York.
Handbook of Mycological Methods – Project GCP/INT/743/CFC Page 23 of 33
Frisvad, J.C. and O. Filtenborg, 1989. Terverticillate penicillia: chemotaxonomy and mycotoxin production. Mycologia. 81: 837-861. Ominski, K.H., R.R. Marquardt, R.N. Sinha and D. Abramson, 1994. Ecological aspects of growth and mycotoxin production by storage fungi, pp.287-312. In: Mycotoxins in Grains, Compounds Other Than Aflatoxin. (eds. J.D. Miller and H.L. Trenholm) Eagan Press, ST. Paul Minnesota, U.S.A. Petersson, S., M.W. Hansen, K. Axberg, K. Hult and J. Schnürer, 1998. Ochratoxin A accumulation in cultures of P. Verrucosum with the antagonistic yeast Pichia anomala and Saccharomyces cerevisiae. Mycological Research. 102:1003-1008. Samson, R.A. and John I. Pitt (eds.), 1992. Modern Methods in Food Mycology: International Workshop on Standardization of Methods for Food Mycology. Elsevier, Amsterdam. Samson, R.A. and John I. Pitt (eds.), 1985. Advances in Penicillium and Aspergillus Systematics. Plennum Press, London / NATO Scientific Affairs. Scott, P.M., S.R. Kanhere, G.A. Lawrence, E.F. Daley and J.M. Farber, 1995. Fermentation of wort containing added ochratoxin A and fuminisins B1 and B2. Food Additives and Contaminants. 12: 31-40. Tsubouchi, H., H. Terada, K. Yamamoto, K. Hisada and Y.Sakabe, 1985. Caffeine degradation and increased ochratoxin A production by strains of A. ochraceus isolated from green coffee beans. Mycopathologia. 90:181-186. Varga, J., K. Rigó and J. Téren, 2000. Degradation of ochratoxin A by Aspergillus species. International Journal of Food Microbiology. 59:1-7. Varga, J., E. Kevei, E. Rinyu, J. Téren and Z. Kozakiewicz, 1996. Ochratoxin production by Aspergillus species. Applied and Environmental Microbiology. 62: 4461-4464. Vega, F.E. and G.Mercadier, 1998. Insects, coffee and ochratoxin A. Florida Entomologist. 81: 543-544.
Handbook of Mycological Methods – Project GCP/INT/743/CFC Page 24 of 33
Annex 1 - Protocols for Phase 2 studies
I. Phase Two Sampling Experiments (for farms demonstrated to contain toxigenic fungi) Phase one sampling was designed to reveal locales for further study on the basis that an organism can only be assessed in places where it occurs while accepting the proposition that there is a degree of persistence in the occurrence of a species. The data we have from the pilot study suggests that the presence of A. ochraceus, for example, in a locale at one harvest means it is likely to still be there at the next harvest. We are especially interested in ascertaining the distribution, spread, ecological associations and ecological persistence of OTA-producers.
At present, we have no basis to associate the presence of OTA-producers on a farm with ‘bad practice’. This may very well be because there are other non-agronomic factors that are of overriding importance, a situation that would produce a distribution pattern that is entirely independent of coffee production practices. It might also be that we do not know what constitutes ‘bad practice’ in the context of fostering the success of this fungus. For example, perhaps regular fertilization, weed control or regular copper sulphate spraying helps establish A. ochraceus or other fungi of particular interest to the project in a plantation.
We have also been unable to identify a CCP (critical control point) prior to drying in the coffee production chain. One may predict that the point of infection could constitute a CCP, which is not to imply there must be only one such route. Other aspects such as any role of sucking insect pests, the ants that tend some of these, certain stem borers, windfall cherries acting as baits for soil-borne fungi, over-maturation of fruits in high and low humidity situations all suggest themselves as possibly significant aspects of the interaction of the coffee plant, agronomic practices and the toxigenic moulds associated with the system. In considering this area it must be said that we do not expect some ‘golden bullet’ to emerge. It must be remembered that broca-free beans can be contaminated with OTA and broca infested beans can be OTA-free; that first quality beans can contain OTA and just as significantly, worst quality beans are usually OTA-free. So it is clear that the system we are trying to describe is complex, subject to several factors none of which, evidently, are strongly deterministic. These sampling experiments are aimed at clarifying these aspects.
Distribution Phase 1 analysis was of samples taken from unknown or at least unselected parts of the plantations. The second phase is to examine distribution of the fungi in the proximate area of phase 1 samples from locations which had shown the presence of OTA-producing fungi at a previous sampling. This could mean a part of the original plantation if the farm is large or could include neighbouring farms in smallholder districts. At each of the selected farms ascertain the layout and where harvesting has been completed. Draft a sketch map. Indicate on the map a grid of sampling stations allowing about 50m between them and including five to eight stations depending on the size of the farm. At this point it may be indicated that samples from adjacent properties are required. Using the GPS (global positioning system) device, take
Handbook of Mycological Methods – Project GCP/INT/743/CFC Page 25 of 33
positional readings and record them (‘marks’) at landmarks of the property such as along a frontage and at the drying yard in order to locate your sketch map and proceed to where you estimate the first sampling station to be and record a precise positional reading. Sample here and at the other stations by collecting about 1kg of fresh cherry from five or six adjacent trees; combine soil from three of the sampled trees taken from the coffee rhizosphere (S0 samples); expose DC03 plates for air sampling for periods of time appropriate to conditions (suggest 8 and 15 min as a ‘normal’ period). Guided by the GPS proceed to the second station and again record a precise positional reading. If the GPS is not available, use a cord and compass to accurately record the sample stations’ relative position. The soil and air samples are analysed as set out in the manual. If due to pressure of sampling the soil cannot be analysed quickly, allow it to air dry and store at room temperature. Do a complete 3-part analysis on the fresh cherry. If the sampling site is remote causing a delay in setting up the cherry analysis, record the fact and take these precautions. Store in paper bags refrigerated, if possible, or at least cool. If two or more days have elapsed since harvest, before setting up the analysis, rinse the cherries gently in tap water and drain before commencing (by shaking vigorously in 0.1% peptone water) the analysis. This is intended to remove the excess yeast which tend to grow out very rapidly as soon as the humidity is maximised as it is by enclosing the fruit and which is a prominent artefact of a delay in analysis. Record all these deviations from the method as set out as well as any delay in the analysis so that all material facts relating to the samples are a matter of record. Base the i analysis on 49 beans (7 x 7plates) taken from 50 fruits.
Handbook of Mycological Methods – Project GCP/INT/743/CFC Page 26 of 33
II. Processing Experiments Using Naturally (or flower) Contaminated Cherry
1. Basic procedure for samples that are suspected but not certain to contain OTA-producing fungi.
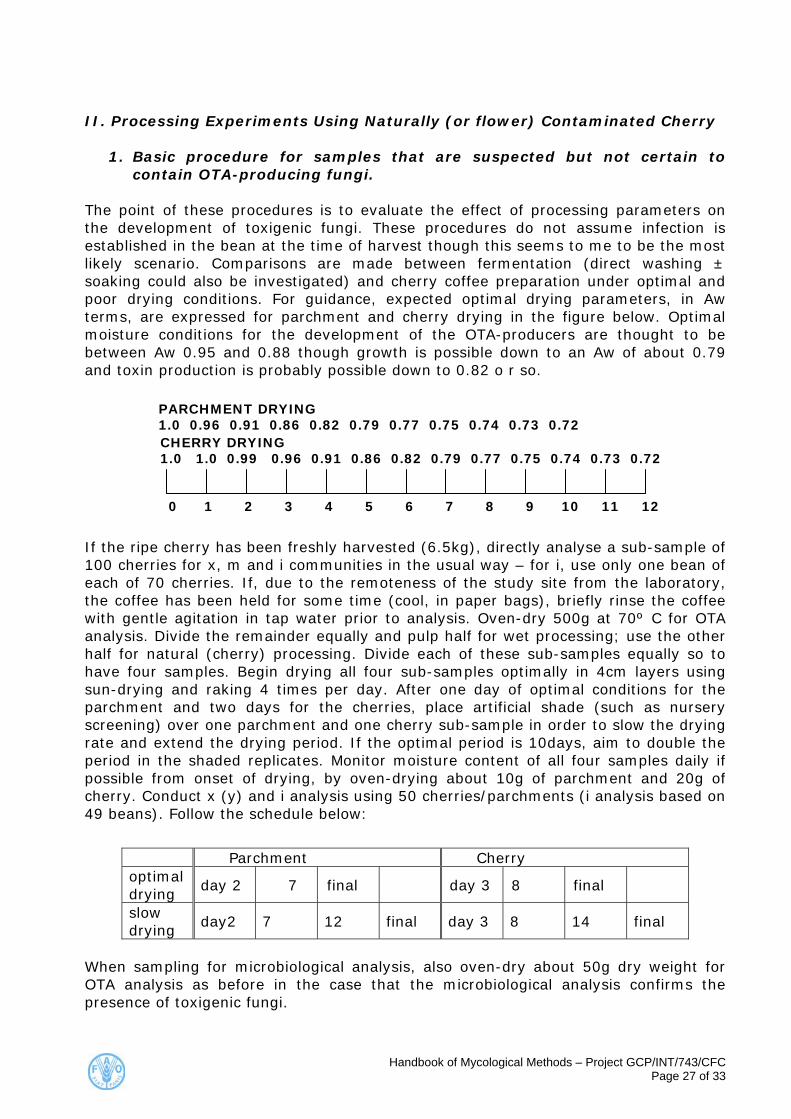
The point of these procedures is to evaluate the effect of processing parameters on the development of toxigenic fungi. These procedures do not assume infection is established in the bean at the time of harvest though this seems to me to be the most likely scenario. Comparisons are made between fermentation (direct washing ± soaking could also be investigated) and cherry coffee preparation under optimal and poor drying conditions. For guidance, expected optimal drying parameters, in Aw terms, are expressed for parchment and cherry drying in the figure below. Optimal moisture conditions for the development of the OTA-producers are thought to be between Aw 0.95 and 0.88 though growth is possible down to an Aw of about 0.79 and toxin production is probably possible down to 0.82 o r so.
CHERRY DRYING1.0 1.0 0.99 0.96 0.91 0.86 0.82 0.79 0.77 0.75 0.74 0.73 0.72
PARCHMENT DRYING1.0 0.96 0.91 0.86 0.82 0.79 0.77 0.75 0.74 0.73 0.72
0 1 2 3 4 5 6 7 8 9 10 11 12
If the ripe cherry has been freshly harvested (6.5kg), directly analyse a sub-sample of 100 cherries for x, m and i communities in the usual way – for i, use only one bean of each of 70 cherries. If, due to the remoteness of the study site from the laboratory, the coffee has been held for some time (cool, in paper bags), briefly rinse the coffee with gentle agitation in tap water prior to analysis. Oven-dry 500g at 70º C for OTA analysis. Divide the remainder equally and pulp half for wet processing; use the other half for natural (cherry) processing. Divide each of these sub-samples equally so to have four samples. Begin drying all four sub-samples optimally in 4cm layers using sun-drying and raking 4 times per day. After one day of optimal conditions for the parchment and two days for the cherries, place artificial shade (such as nursery screening) over one parchment and one cherry sub-sample in order to slow the drying rate and extend the drying period. If the optimal period is 10days, aim to double the period in the shaded replicates. Monitor moisture content of all four samples daily if possible from onset of drying, by oven-drying about 10g of parchment and 20g of cherry. Conduct x (y) and i analysis using 50 cherries/parchments (i analysis based on 49 beans). Follow the schedule below:
Parchment Cherry
optimal drying
day 2 7 final day 3 8 final
slow drying
day2 7 12 final day 3 8 14 final
When sampling for microbiological analysis, also oven-dry about 50g dry weight for OTA analysis as before in the case that the microbiological analysis confirms the presence of toxigenic fungi.
Handbook of Mycological Methods – Project GCP/INT/743/CFC Page 27 of 33
The remaining material after sampling has been completed, if confirmed to contain OTA or toxigenic fungi, can be used for rewetting and storage experiments.
2. Elaborated procedures These are the same in concept as 1 above but offer procedures to look more closely at processing parameters. Because these are larger and more detailed studies, you should be confident that the material selected for them does indeed contain the organisms of interest to the global project. Make the initial analysis of the coffee and prepare it as described in 1 above. In planning the amount of experimental material required, work backward from the amount of material you might require for storage/re-wetting experiments and any analysis such as OTA or cup-testing while accounting for all intermediate samples to be taken during the procedure.
Tests comparing the outcomes of the following processing routines would be of interest. 1) Mechanical washing; 15h fermentation; 60h fermentation followed by optimal and
slow drying. 2) Freshly harvested cherries dried (one sub-sample) and split and dried (second sub-
sample); both sub-samples dried according to both slow and optimal drying time-courses.
3) Cherries held in sacks for 48h then dried (one sub-sample) and split and dried (second sub-sample); both sub-samples dried according to both slow and optimal drying time-course.
4) Wet and natural processing followed by different drying time-courses: a) optimal b) dried in deep shade for three days after the initial one day (parchment) or
two day (cherry) drying then a return to optimal conditions. c) dried in deep shade for three days followed by optimal drying d) dried optimally for five days then finished in deep shade. e) dried in optimal conditions except thickness of layer and stirring; compare
4cm layer, with and without stirring 4 times per day and 8cm layer, with and without stirring
Handbook of Mycological Methods – Project GCP/INT/743/CFC Page 28 of 33
III. Testing de-novo contamination and the Competitive Exclusion Hypothesis The specific form that the idea of competitive exclusion has in the context of OTA production in coffee is that the toxigenic organisms (whether from the Aspergillus nigri or circumdati groups) are less well adapted to the coffee fruit when it is fully hydrated than other fungi that we find there. These other fungi prevent, at high water availability, the development of the toxigenic species but lose out to the toxigenic species (if they are present!) at conditions of lower water availability. Below is a procedure to test the ability of the natural fruit fungi or the community existing after fermentation to exclude a heavy superficial contamination of toxigenic fungi during natural coffee processing or parchment drying. ‘Competitive exclusion’ is the idea that the organisms which are best adapted to a set of conditions will out-compete less well adapted organisms. Stated in this way, the proposition is a tautology because success measures adaptation, however in the practical world we never have a complete knowledge of the organisms or of the conditions so the proposition is susceptible to, and requires, empirical tests. In addition, communities of microorganisms have the capacity to modify prevailing conditions, a fact demonstrated by the use of food fermentation in food traditions where human technology aids the establishment of (beneficial) microbial communities that exclude human pathogens and spoilage organisms. A community found in association with a ‘host’ organism has arisen through a selection process influenced by the way in which the host organism inter-reacts with the other organisms. Empirically we see this in the existence of ‘unit communities’ or ‘associated fungi’ like the reasonably consistent assemblage of fungi associated with the coffee fruit that the pilot study demonstrated. There is a documented qualitative and quantitative variation in this, however, so we can predict variation in the initial conditions of the experimental procedure described below. Repetition is the tool required to cover this degree of variation and, in the long run, may provide information that will allow revelation of the mechanism of exclusion and distinguish the important organisms from the incidental ones. Collect 8kg fresh ripe cherries from a source already shown to have OTA-producing fungi. Halve the following amounts indicated below if that coffee is wet processed and parchment drying is being tested. Separate into a 4kg and two 2kg sub-samples. One of the 2kg sub-samples is the control and should be divided into four half kg portions teach to be dried according to the protocol blow. Surface sterilise the 4kg sub-sample with 1% hypochlorite for 10 minutes and rinse in sterile water. Blot dry on sterile paper. Half of this can immediately be committed to drying as with the control. Inoculate the remaining two samples separately by placing each in a deep tray and sprinkling (for reasons of safety, do not spray), while carefully turning the coffee, with 60ml of a 106 spores/ml suspension of the selected OTA toxigen. To dry, place each lot in a shallow, tared tray which provides a 4cm-coffee layer. Record the initial weight. There will be 16 treatments from four coffee treatments against four drying treatments. Commence drying according to the following schedule using shade to retard drying and heat and wind to accelerate it as necessary. Mix the coffee regularly four to five times daily.
Handbook of Mycological Methods – Project GCP/INT/743/CFC Page 29 of 33
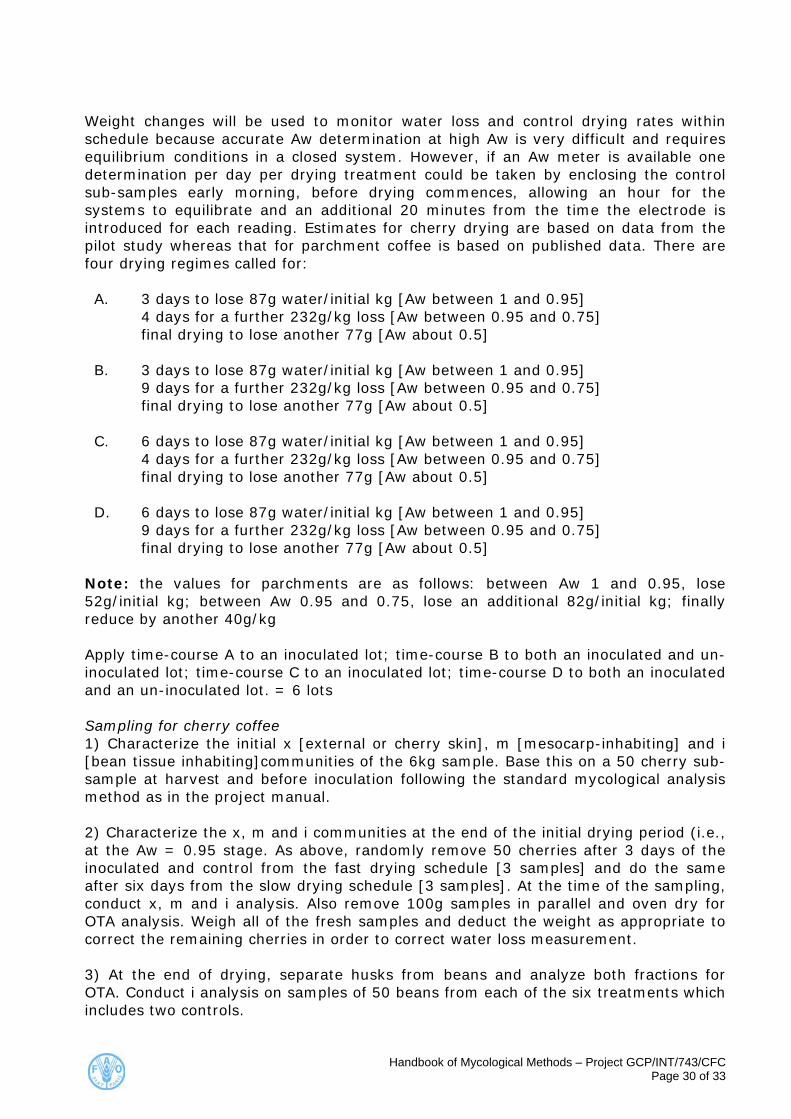
Weight changes will be used to monitor water loss and control drying rates within schedule because accurate Aw determination at high Aw is very difficult and requires equilibrium conditions in a closed system. However, if an Aw meter is available one determination per day per drying treatment could be taken by enclosing the control sub-samples early morning, before drying commences, allowing an hour for the systems to equilibrate and an additional 20 minutes from the time the electrode is introduced for each reading. Estimates for cherry drying are based on data from the pilot study whereas that for parchment coffee is based on published data. There are four drying regimes called for:
A. 3 days to lose 87g water/initial kg [Aw between 1 and 0.95] 4 days for a further 232g/kg loss [Aw between 0.95 and 0.75] final drying to lose another 77g [Aw about 0.5] B. 3 days to lose 87g water/initial kg [Aw between 1 and 0.95] 9 days for a further 232g/kg loss [Aw between 0.95 and 0.75] final drying to lose another 77g [Aw about 0.5] C. 6 days to lose 87g water/initial kg [Aw between 1 and 0.95] 4 days for a further 232g/kg loss [Aw between 0.95 and 0.75] final drying to lose another 77g [Aw about 0.5] D. 6 days to lose 87g water/initial kg [Aw between 1 and 0.95] 9 days for a further 232g/kg loss [Aw between 0.95 and 0.75] final drying to lose another 77g [Aw about 0.5]
Note: the values for parchments are as follows: between Aw 1 and 0.95, lose 52g/initial kg; between Aw 0.95 and 0.75, lose an additional 82g/initial kg; finally reduce by another 40g/kg Apply time-course A to an inoculated lot; time-course B to both an inoculated and un-inoculated lot; time-course C to an inoculated lot; time-course D to both an inoculated and an un-inoculated lot. = 6 lots
Sampling for cherry coffee 1) Characterize the initial x [external or cherry skin], m [mesocarp-inhabiting] and i [bean tissue inhabiting]communities of the 6kg sample. Base this on a 50 cherry sub-sample at harvest and before inoculation following the standard mycological analysis method as in the project manual. 2) Characterize the x, m and i communities at the end of the initial drying period (i.e., at the Aw = 0.95 stage. As above, randomly remove 50 cherries after 3 days of the inoculated and control from the fast drying schedule [3 samples] and do the same after six days from the slow drying schedule [3 samples]. At the time of the sampling, conduct x, m and i analysis. Also remove 100g samples in parallel and oven dry for OTA analysis. Weigh all of the fresh samples and deduct the weight as appropriate to correct the remaining cherries in order to correct water loss measurement. 3) At the end of drying, separate husks from beans and analyze both fractions for OTA. Conduct i analysis on samples of 50 beans from each of the six treatments which includes two controls.
Handbook of Mycological Methods – Project GCP/INT/743/CFC Page 30 of 33
Sampling for parchments 1) Characterize the i community, as above, after fermentation and washing but before inoculation. 2) Characterize the i community at the end of the initial drying period, as described above, as well as making the 100g OTA analysis samples and weighing of samples for water loss measurement correction. 3) sample as above but for 'husks' read parchment tissue.
Handbook of Mycological Methods – Project GCP/INT/743/CFC Page 31 of 33
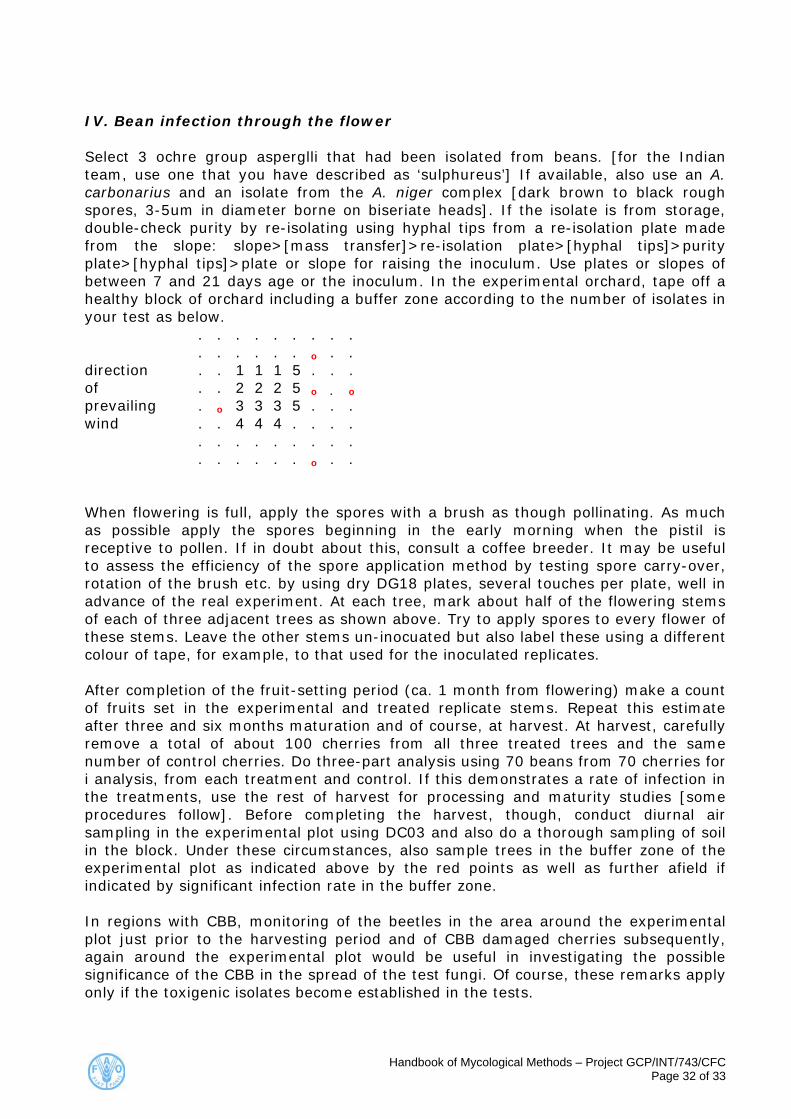
IV. Bean infection through the flower Select 3 ochre group asperglli that had been isolated from beans. [for the Indian team, use one that you have described as ‘sulphureus’] If available, also use an A. carbonarius and an isolate from the A. niger complex [dark brown to black rough spores, 3-5um in diameter borne on biseriate heads]. If the isolate is from storage, double-check purity by re-isolating using hyphal tips from a re-isolation plate made from the slope: slope>[mass transfer]>re-isolation plate>[hyphal tips]>purity plate>[hyphal tips]>plate or slope for raising the inoculum. Use plates or slopes of between 7 and 21 days age or the inoculum. In the experimental orchard, tape off a healthy block of orchard including a buffer zone according to the number of isolates in your test as below. . . . . . . . . . . . . . . . o . . direction . . 1 1 1 5 . . . of . . 2 2 2 5 o . o
prevailing . o 3 3 3 5 . . . wind . . 4 4 4 . . . . . . . . . . . . . . . . . . . o . .
When flowering is full, apply the spores with a brush as though pollinating. As much as possible apply the spores beginning in the early morning when the pistil is receptive to pollen. If in doubt about this, consult a coffee breeder. It may be useful to assess the efficiency of the spore application method by testing spore carry-over, rotation of the brush etc. by using dry DG18 plates, several touches per plate, well in advance of the real experiment. At each tree, mark about half of the flowering stems of each of three adjacent trees as shown above. Try to apply spores to every flower of these stems. Leave the other stems un-inocuated but also label these using a different colour of tape, for example, to that used for the inoculated replicates. After completion of the fruit-setting period (ca. 1 month from flowering) make a count of fruits set in the experimental and treated replicate stems. Repeat this estimate after three and six months maturation and of course, at harvest. At harvest, carefully remove a total of about 100 cherries from all three treated trees and the same number of control cherries. Do three-part analysis using 70 beans from 70 cherries for i analysis, from each treatment and control. If this demonstrates a rate of infection in the treatments, use the rest of harvest for processing and maturity studies [some procedures follow]. Before completing the harvest, though, conduct diurnal air sampling in the experimental plot using DC03 and also do a thorough sampling of soil in the block. Under these circumstances, also sample trees in the buffer zone of the experimental plot as indicated above by the red points as well as further afield if indicated by significant infection rate in the buffer zone. In regions with CBB, monitoring of the beetles in the area around the experimental plot just prior to the harvesting period and of CBB damaged cherries subsequently, again around the experimental plot would be useful in investigating the possible significance of the CBB in the spread of the test fungi. Of course, these remarks apply only if the toxigenic isolates become established in the tests.
Handbook of Mycological Methods – Project GCP/INT/743/CFC Page 32 of 33
Annex 2 – Excel Data Recording Sheets
1) Farm Information Form:
C:\Documents and Settings\Julius\My Do
2) Aspergillus Morphology Guide:
C:\Documents and Settings\Julius\My Do
Handbook of Mycological Methods – Project GCP/INT/743/CFC Page 33 of 33