Embed Size (px)
Citation preview

Conference call & webcast
Date: Tuesday, February 27th, 2018, 15:00 CET | 14:00 UK/LisbonWebcast: www.edpr.comPhone dial-In number: +44 (0) 1452 560304 | +1 631 621 5256Phone Replay dial-in number: +44 (0)14 5255 0000 | +1 866 247 4222 (until Match 5th, 2018)Access code: 7482825
EDP Renováveis, S.A. Head office: Plaza de la Gesta, 2 33007 Oviedo, Spain
2017 Results
February 27th, 2018

Table of contents
- 3 -
Sustainability Highlights
- 7 -
- 9 -
- 4 -
- 19 -
Asset Base
- 5 -
Europe
- 10 -
- 11 -
- 14 -
Income Statements
Quarterly Data
Net Debt and Institutional Partnership Liability
- 6 -
- 2 -2017 Highlights
Capital Expenditures and PP&E
Operating Performance
Financial Performance
- 8 -
Consolidated Financial Statements
Annex
Equity Consolidated & Non-controlling Interest (MW)
Share Performance & Shareholder Structure
Cash-Flow
Business Platforms
- 24 -
- 17 -
- 16 -
- 23 -
- 26 -
- 25 -
North America
Brazil
Remuneration Frameworks
- 22 -

2017 Highlights
Installed Capacity (MW)
EBITDA MWOther equity consolidated
EBITDA MW + Equity Consolidated
Operating Data - EBITDA MW metrics
Load Factor (%)Output (GWh)Avg. Electricity Price (€/MWh)
Consolidated Income Statement (€m)
RevenuesEBITDAEBITDA/RevenuesEBITNet Financial ExpensesShare of profit of associatesNon-controlling interestsNet Profit (Equity holders of EDPR)
Cash-Flow (€m)
Operating Cash-FlowRetained Cash-FlowNet Investments
Balance Sheet (€m)
PP&E (net)EquityNet DebtInstitutional Partnership Liabilities
Employees
Total
-
(25)
2017
2,806
1,366
(302)
∆ 17/16
869 +13%
+17%
2016
2016
(0)
564
1,114
2017
1803
1,827
981
276
(2%)
1,036
Results Highlights
75%803
2016
31% 30%
59.2
+2%
+42%
+4% 7,573
10,052
2016
(2%)
+1pp24,473 +13%
1,220
10,676
1,171
698
1,520
(14%)
- 2 -
+390%
(18%)
2017 2016 ∆ 17/16
+4pp
11,007
331
60.5
∆ 17/16
10,408 +600
13,437
+60%
∆ YTD20162017
13,185
1,651 +11%
∆ 17/16
1,249
356+624
27,621
2017
2017
7,895
+51%
1,083
(350)
71%
96
120
2,755
∆ YTD
+13%
56
+976%
•EDPR managed, by Dec-17, a global portfolio of 11.0 GW spread over 11 countries, of which 10.7 GW fully
consolidated and 331 MW equity consolidated (equity stakes in Spain and US). Over the last year, EDPR
portfolio increased by 600 MW, of which 49 MW were net added in Europe, 424 MW in North America and 127
MW in Brazil.
•EDPR produced 27.6 TWh of clean electricity (+13% YoY), avoiding 22 mt of CO2 emissions. The increase in
production benefitted mainly from the capacity additions (+600 MW YoY) with higher than expected load
factor. The achieved load factor in 2017 was 31% (vs 30% in 2016), representing 98% of the long-term average
(P50). In the period, EDPR maintained high level of technical availability (97.8% vs 97.7% in 2016), denoting its
distinctive core competences.
•The average selling price in 2017 totalled €59/MWh, -2% YoY due to generation mix, the slightly lower average
selling price in Europe along with a stable price in North America, were partially offset by Brazil (+34% YoY,
reflecting a temporary unwinding PPA). Revenues totalled €1,827m (+11%; +€176m YoY) and Core Opex per
average MW in operation was €42k (-2% YoY), as a consequence of EDPR’s control over costs, and O&M
program in place.
• In 2017 reported EBITDA totalled €1,366m (+17% YoY; +€195m YoY), benefitting from the positive evolution of
the top line and higher Other operating income (+77% YoY), which includes a gain (€29m) subsequent to the
sale of a stake and loss of control of a UK offshore project. As a consequence, EBIT increased to €803m (+42%
YoY; +€239m YoY), also due to lower depreciation and amortization costs, including provisions, impairments and
net of government grants. Depreciation and amortization decreased 7% YoY reflecting EDPR change in
depreciation schedule from 25 to 30 years, which offsets the negative impact from higher capacity in operation.
•Net Financial Expenses decreased €49m YoY to €302m, benefitting from lower Net interest costs (€139m; -
22% YoY) and with YoY comparison impacted by 2016 one-offs in Other financial expenses on the back of early
cancelation and optimization of certain project finances.
•At the bottom line, Net Profit summed €276m, while Adjusted Net Profit reached €226m (+36% YoY; 2016
adjusted at €166m) if adjusted for non-recurring events (adjustments: 2016 +€110m, including depreciation
schedule adjustment to 30 years; 2017 -€50m, mainly related to positive adjustments on asset rotation past
transactions, impairment losses and one-offs in taxes).
• In the period, EDPR delivered solid cash-flow generation. Following EBITDA cash-generation, income tax of the
period, interests, banking and derivatives expenses and minority dividends/interest payments, 2017 Retained
Cash-Flow (“RCF”) increased to €1,114m. EDPR’s 2017 RCF includes non-recurrent events (€168m) in Tax
Equity realized revenues, if adjusted by such events, RCF increased 35% YoY.
•As of Dec-17, Net Debt totalled €2,806m (+€51m vs Dec-16), reflecting the investments done in the period and
Mexico debt consolidation partially offset by the cash flow generated by the assets in the period, proceeds from
the 49% sale of certain Portuguese assets and forex translation, while Institutional Partnership Liabilities
decreased to €1,249m (-€271m vs Dec-16), benefitting from forex translation and bonus depreciation in 2016
and 2017 portfolios.
•The Board of Directors will propose a dividend distribution in the ASM of €52m, or €0.06/share.
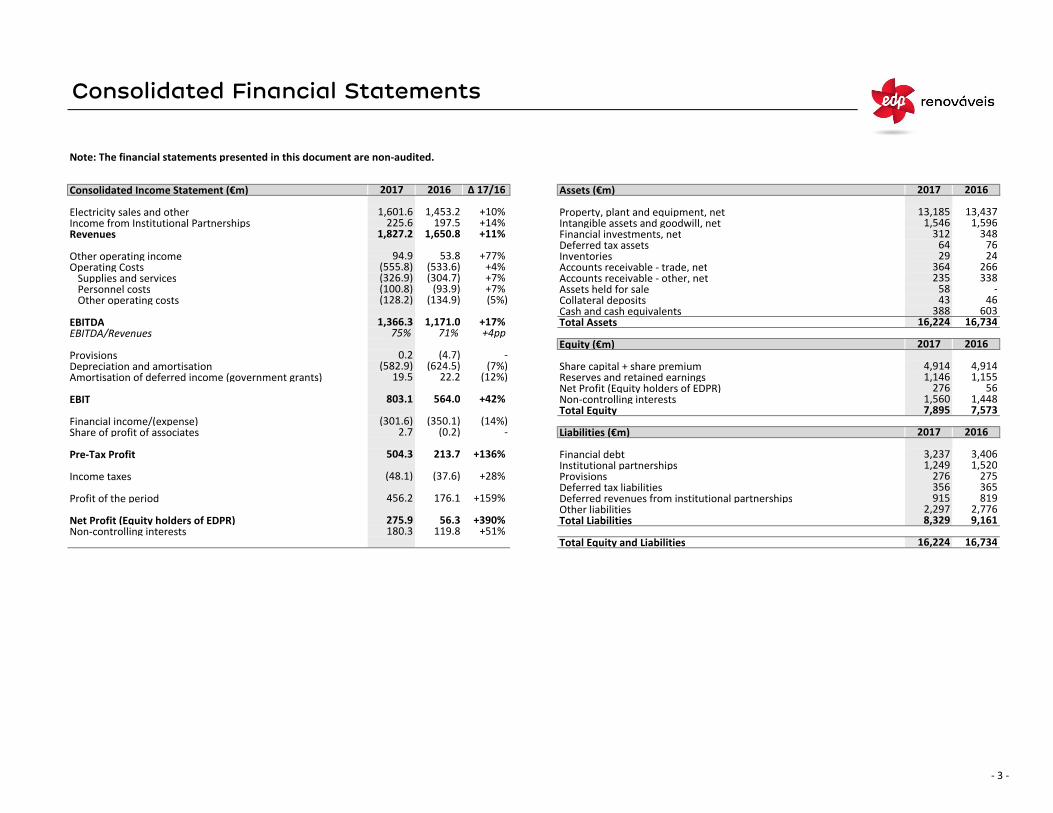
Consolidated Financial Statements
Note: The financial statements presented in this document are non-audited.
Consolidated Income Statement (€m) Assets (€m)
Electricity sales and other Property, plant and equipment, netIncome from Institutional Partnerships Intangible assets and goodwill, netRevenues Financial investments, net
Deferred tax assetsOther operating income InventoriesOperating Costs Accounts receivable - trade, net
Supplies and services Accounts receivable - other, netPersonnel costs Assets held for saleOther operating costs Collateral deposits
Cash and cash equivalentsEBITDA Total AssetsEBITDA/Revenues
Equity (€m)ProvisionsDepreciation and amortisation Share capital + share premiumAmortisation of deferred income (government grants) Reserves and retained earnings
Net Profit (Equity holders of EDPR)EBIT Non-controlling interests
Total EquityFinancial income/(expense)Share of profit of associates Liabilities (€m)
Pre-Tax Profit Financial debtInstitutional partnerships
Income taxes ProvisionsDeferred tax liabilities
Profit of the period Deferred revenues from institutional partnershipsOther liabilities
Net Profit (Equity holders of EDPR) Total LiabilitiesNon-controlling interests
Total Equity and Liabilities
4643388
(4.7)
1,155
16,734
276356
2016
(624.5)
8,329
1,560
(0.2)
180.3
16,734
20162017
561,448
+51%
275
7,573(14%)
(12%)
3,237
365819
2,7769,161
+136% 3,4061,249
- 2017
7,895
915
- 3 -
1,146
+159%
+390%
276
16,224
4,914
119.8
19.5
504.3
2.7
(304.7)(533.6)
53.8
(93.9)
1,601.6
2016
1,520213.7
1,546
(582.9)
338-
94.9
+14%
(555.8)
603
2017
1,453.2
∆ 17/16
13,4371,596
7624
266
58
2964
+11% 1,650.8
+4%
348197.5
312
(7%)
13,185
71%
+77%
+7%
+10%
+7% (5%)(134.9)
1,171.0 16,224+17%
4,914
176.1
(301.6)
75%
2,297
235364
+42%
456.2
1,366.3
22.2
56.3
(48.1) +28%
225.61,827.2
(100.8)
+4pp
-
(128.2)
2017 2016
275.9
803.1
(350.1)
0.2
(326.9)
(37.6)
564.0

Asset Base
EBITDA MW
SpainPortugalFranceBelgiumPolandRomaniaItaly
Europe
United StatesCanadaMexico
North America
Brazil
Total EBITDA MW
Equity Consolidated (MW)
SpainUnited States
Total Equity Consolidated
Total EBITDA MW + Equity Consolidated
EBITDA MW
- 4 -
+624
+50+31,253
418
5,284
30
521
71
10,676
480
-
(25)
-
---
2017
(25)
200
211
828
5,055
-
11
YoYInstalled Capacity (MW)
137
-
77
+424-
Assets’ Average Age & Useful Life by Country
-
Construc.
68
Under
-+745,061
-
2,244
828
+127
152179
410 +22
331
11,007
-331
-
+424
-
144
-
55
480
+600
•As of Dec-17, EDPR managed a global portfolio of 11.0 GW spread over 11 countries, of which Europe accounted for 47%, including 2.4 GW in Spain, 1.3 GW in Portugal and 1.6 GW in RoE, North America for 50%, including 5.1 GW in the US, 0.2 GW in Mexico and 30 MW in Canada and the remaining 0.3 GW in Brazil representing 3% of the portfolio.
•From the global portfolio of 11,007 MW, 10,862 MW are related to wind onshore technology, while the remaining 145 MW comprised solar PV power plants in US (90 MW), Romania (50 MW) and Portugal (5 MW).
• In 2017 EDPR installed 600 MW, of which 4 9 MW were net added in Europe, 4 24 MW in North America and 127 MW in Brazil. In Europe, 25 MW net were added in Spain (related to the acquisition of a 50% participation in a Spanish wind farm that was previously accounted as equity), 22 MW in France and 3 MW in Portugal. In the US, were completed 4 wind farms and 1 solar PV plant, namely Meadow Lake V (100 MW), Redbed Plains (99 MW), Quilt Block (98 MW), Hog Creek (66 MW) and the solar Cypress Creek (60 MW). In Brazil EDPR installed 127 MW related to JAU and Aventura wind farms.
•As of Dec-17, EDPR had 828 MW of wind onshore under construction. In Europe were 211 MW under construction (77 MW in Italy, 68 MW in Spain, 55 MW in Portugal and 11 MW in France). In the US were under construction 480 MW, namely Turtle Creek 202 MW (Iowa), Meadow Lake VI 200 MW (Indiana) and Arkwright 78 MW (New York) projects. In Brazil were under construction a total of 137 MW related to Babilonia wind farm.
•EDPR’s portfolio, considering EBITDA MW as of Dec-17 had an average age of 7 years, in detail, EDPR’s portfolio had an average age of 8.5 years in Europe, 6.4 years in North America and 2.5 years in Brazil. In 2017 EDPR’s depreciation and amortization schedule considered 30 years of useful life for wind and solar assets.
•As of Dec-17, EDPR’s EBITDA installed capacity with no exposure to merchant prices totalled 91%, being the remaining 9% of the EBITDA MW related to wind farms located in the US, Spain and Poland. In the US, EDPR exposure to the spot market was 684 MW, with the remaining capacity installed in the country being remunerated under long-term contracts (PPAs/hedges). In Spain, and in accordance with the Royal Decree 4 13/2014 approved in Jun-14 , EDPR’s installed capacity without incentive represented 2% of EDPR EBITDA MW portfolio. The remaining capacity installed in Spain is remunerated based on a standard return. In Poland 18% of its installed capacity is exposed to market prices. EDPR production exposed to merchant market is managed within EDPR’s risk management strategy and hedging policies, targeting a residual exposure to spot prices.
7.2
2.5
1.0
4.1
6.4
3.2
5.7
5.3
8.0
7.3
8.7
10.2
0 5 10 15 20 25 30 35
EDPR
Brazil
Mexico
Canada
US
Italy
Romania
Poland
Belgium
France
Portugal
Spain

Capital Expenditures and PP&E
EuropeNorth AmericaBrazilOther
Total Capex
Financial investments/(divestments)Government grantAsset rotation proceeds
Net Investments
PP&E (net)
(-) PP&E assets under construction
(=) PP&E existing assets (net)
(+) Accumulated Depreciation
(-) Government Grants
(=) Invested capital on existing assets
(1) Considers EBITDA MW, with percentages calculated in euros.
+45
949
1,035.9
1,029.4 +22
192.2840.9 (16%)
(15.2)
+239% 56.8
+2%
12,520
553524
(284)
+1
Invested Capital on existing assets
Investments (€m)
707.9
∆ €
2017 Capex per Platform
- 5 -
16,692
(133)
13,185
131.6
+940
+135
1,051.1
96.2
-
4,725
20162017
-
(29)
(46)
16,737
31.2
-
918
-
5,025 +300
Property, Plant & Equipment - PP&E (€m)
13,437
1.0 0.1 +1
0 (0.8) -
(252)
12,236
+963
∆ €
+32
150.0
2017
+14% +18
(963.5)
-
2016 ∆ %
€1,051m €16.7bn
Europe
14%
North America
68%
Brazil
18%
• In 2017 Capex totalled €1,051m, reflecting the capacity added in the period, the capacity
under construction and enhancements in capacity already in operation. Out of the €1,051m,
€708m were in North America, €192m in Brazil and €150m were related to growth in
Europe.
•Capex in North America represented 68% of total capex in 2017, reflecting EDPR’s growth
strategy based on markets with stable regulatory frameworks and long-terms contracts,
providing visibility over future returns. In the year, Brazil represented 18% and Europe 14%.
•Total net investments in 2017, calculated as total capex net of financial investments and
divestments (including the sale of a 23% stake in a UK offshore wind farm for €29m) and net
of government grants and proceeds from asset rotation, was €1,036m (+€940m YoY).
• In 2017, Net PP&E totalled €13.2bn, €252m lower vs 2016 mainly because of forex
translation. PP&E includes total investments, capex (gross of government grants) and
adjustments from Purchase Price Allocation (resulting from M&A transactions) incurred with
existing assets, assets under construction or under development. PP&E in existing assets
(net), adjusted for assets under construction, reached €12.2bn. Invested capital on existing
assets, adjusted for assets under construction, gross of depreciation and net of government
grants received, amounted to €16.7bn by Dec-17.
•As of Dec-17, North America represented 50% of Invested Capital in existing assets and Brazil
2%. Out of the 48% of invested capital in existing European assets, 22% was related to Spain,
11% to Portugal and 15% to Rest of Europe.
Spain
22%
Portugal
11%
RoE
15%
North
America
50%
Brazil
2%
(1)

Operating Performance
Load Factor
Europe
North America
Brazil
Total
Wind Index (vs P50)
Electricity Generation (GWh)
Europe
North America
Brazil
Total
Selling Prices (per MWh)
Europe
North America
Brazil
Average Selling Price
Electricity Sales and Other (€m)
Europe
North America
Brazil
Total
Income from Institutional Partnerships (€m)
Total
Revenues
Revenues (€m)Revenues per avg. MW in operation (€k)
Note: Operational Performance considers only capacity consolidated at EBITDA level
+4%
∆ 17/16
2016
- 6 -
197.5
+29%
∆ 17/16
∆ 17/16
+1pp
GWh Breakdown by Remuneration2017 Achieved Load Factor vs Avg.2017 2016
43%
$46.4
15,091
35%
31%
35%
33% +1pp
27,621
+20%
+2pp
26%
12,576
2016
11,230
30% +1pp
+9pp
2016
2016
€81.5
666
R$288.8
2017 ∆ 17/16
861
98% 96%
2017 2016
€60.5
34.4
R$216.1
2017
943.2 +3%
+14%
∆ 17/16
+1%1,827.2 1,650.8 +11%
+10%
∆ 17/162017
1,601.6
507.6 +18%
+83%
+34%
179.7 177.1
598.2
11,669
225.6
62.8
913.0
+13%
€81.0 (1%)
24,473
(2%)
27%
(0%)
€59.2
$46.4
2017
1,453.2
98% 98%
111%
98% Regulated/PPA
Spot US, PL & Spain
w/o complement
89% 90%
11% 10%
2016 2017
• In 2017 EDPR reached a 31% load factor (vs 30% in 2016), reflecting capacity additions with
higher load factors and the wind resource in the period (98% vs 96% of P50 in 2016). In the
4Q17, EDPR reached a 34% load factor (vs 30% in the 4Q16) with QoQ comparison benefitting
from a strong recovery of the wind resource in 2017. In Europe, EDPR reached a 27% load
factor (+1pp YoY), on the back of higher wind resource in Spain and the Rest of Europe. In
Spain, load factor increased +1pp YoY to 27% benefitting from a strong 4Q17 (+8pp YoY). In
Portugal, EDPR accomplished a load factor of 27%, -1pp YoY reflecting a below average wind
resource. In RoE, EDPR achieved a 27% load factor (+2pp YoY), driven by Poland and Romania.
In North America, EDPR achieved a 35% load factor (vs 33% in 2016) reflecting higher YoY wind
resource particularly in the 2Q17. In Brazil, EDPR reached a 43% load factor (vs 35% in 2016)
propelled by new capacity additions with higher expected wind resource.
•EDPR produced 27.6 TWh of renewable energy in 2017, +13% YoY, benefitting from the
capacity added over the year with above average load factor. From the 27.6 TWh generated in
2017, 90% was sold under regulated frameworks schemes or PPAs.
•EDPR’s average selling price in 2017 was €59/MWh (vs €61/MWh in 2016), mainly as a result
of capacity additions mix (production vs price) and lower YoY prices in the Rest of Europe. In
Europe, the realized price decreased by 1% YoY to €81/MWh, balanced between higher
realized price in Spain (+1% YoY) and Portugal (+2% YoY) along with lower price in the Rest of
Europe (-5% YoY) mainly due to regulatory changes and green certificates price evolution in
Poland. In North America, the average selling price was $46/MWh (flat YoY) supported by the
stability of long-term contracts in place. In Brazil, the average price increased 34% YoY to
R$289/MWh, mainly driven by a temporary PPA unwinding at Baixas do Feijão.
• In 2017 electricity sales increased by 10% YoY to €1,602m on the back of higher output in the
period (+13% YoY). Electricity sales in Europe increased by 3% YoY to €943m, with higher
output compensating the lower price effect. In North America, electricity sales increased 18%
YoY in Euros, driven by higher output (+20% YoY) with stable average prices. In Brazil,
electricity sales increased 83% YoY to €63m mainly driven by higher prices along with higher
generation from new installed capacity. Income from institutional partnerships in Euros
increased by 14% to €226m on the back of new institutional Tax Equity financing structures
and PTCs YoY upward revised price to $24/MWh.
•All in all, EDPR’s revenues increased by 11% YoY to €1,827m and revenues per average MW
totalled €180k (vs €177k in 2016).

Financial Performance
Revenues to EBITDA Net Financial Expenses (€m)
Revenues (€m) Net interest costs of debtInstitutional partnerships costs
Other operating income Capitalised financial expensesOperating Costs Forex differences
Supplies and services (S&S) OtherPersonnel costs (PC)Other operating costs Net Financial Expenses
EBITDA
Efficiency and Profitability Ratios Profits of Associates
Revenues/Average MW in operation (€k) Share of profit of associatesCore Opex (S&S + PC) /Average MW in operation (€k)Core Opex (S&S + PC) /MWh (€)EBITDA margin Profit Before Taxes to Net Income (€m)EBITDA/Average MW in operation (€k)
Pre-Tax ProfitEBITDA to EBIT (€m)
Income taxesEBITDA
Profit of the periodProvisionsDepreciation and amortisation Non-controlling interestsAmortisation of deferred income (government grants)EBIT Net Profit (Equity holders of EDPR)
53.8
1,650.8
94.9
(326.9)+4%
+7%
(7%)
+7%
(128.2)
71%
22.2
(4.7)
1,171.0
(93.9)
75%
(555.8) (533.6)
(12%)
(178.6)(88.6)
(114.0)
(0.2)
(350.1)
∆ %2016
56.3
∆ %
(304.7)
125.6
(582.9)
16.3
456.2
(48.1)
119.8
23.0
180.3
(37.6)
-
213.7
176.1
(2.8) 9.8
2017+4pp
+17%
275.9
+17% (301.6)
(87.2)
+136%
+51%
+159%
+28%
+390%
- 7 -
0.2
803.1 +42%
2016
(5%)1,366.3
179.7
15.542.8 (2%)42.1
(5%)
19.5
+7%
177.1
(134.9)
2.7
1,366.3
2017
1,171.0
2016504.3
(22%)
(29%)(90.3) (2%)
-
-
∆ %
∆ % 2017
16.4
(24%)
(14%)
+11% (139.5)
2017 2016
∆ %
+77%
∆ %2017 2016
(100.8)
2017
134.4
+1%
2016
1,827.2
(624.5)
564.0
•Operating income (EBIT) increased 42% YoY to €803m, driven by the positive top line
performance as well as an 7% decrease in depreciation and amortization cost (including
provisions, impairments and net of government grants) due to EDPR’s change in depreciation
schedule from 25 to 30 years that offset the negative impact from higher capacity in
operation.
•At the financing level, Net Financial Expenses decreased to €302m (€49m YoY) mainly
reflecting the lower Net interest cost of debt (€139m; -€39m YoY), after favourable
negotiations along with lower average debt and with YoY comparison impacted by a €30m
one off accounted (in 2016) in Other financial expenses mainly on the back of early
cancelation and optimization of certain project finances.
• In the period, Pre-Tax Profit summed €504m, with income taxes totalling €48m. Effective tax
rate was 10% and was positively impacted by the outcome of the US tax reform by the end
of the year. Non-controlling interests amounted to €180m, increasing by €61m YoY due to
change in depreciation schedule, EDPR settlement of previous minority stakes transactions
and in line with the top line performance.
•All in all, Net Profit totalled €276m and adjusted Net Profit €226m (+36% YoY; 2016 adjusted
at €166m) if adjusted for non-recurring events (adjustments; 2016 +€110m, including
depreciation schedule adjustment to 30 years; 2017 -€50m, mainly related to adjustments
on asset rotation past transactions, impairment losses and one-offs in taxes).
• In 2017 revenues increased 11% YoY to €1,827m (+€176m YoY), mainly due to higher MW in
operation (+€166m YoY), positive impact from individual country price evolution (+€27m
YoY), despite lower average selling price YoY (due to generation mix) along with positive
impact from load factor of new wind farms in operation, but negatively impacted by Fx and
others (-€17m). Other operating income amounted €95m with the year-on-year
performance benefited by a gain (+€29m) following the sale of a stake and loss of control of
a UK offshore project and gains in past asset rotation transaction’s adjustments along with a
revaluation gain related to the acquisition of assets.
• In detail, Core Opex, defined by Supplies and services (including O&M activities) and
Personnel costs, totalled €428m (+7% YoY), with Core Opex per Avg. MW (€42k) decreasing
by 2% YoY and reflecting strict control over costs and EDPR’s asset management strategy.
Core Opex per MWh was €15, representing a 5% decrease vs 2016.
•Other operating costs (including taxes and rents to public authorities, the 7% tax over
electricity sales generated in Spain and non-recurring costs) decreased to €128m, mainly
explained by one-offs in 2016 despite 2017 higher capacity in operation.
• In 2017, EBITDA increased by 17% YoY to €1,366m (75% EBITDA margin) and unitary EBITDA
per MW in operation totalled €134k (+7% YoY). Adjusted EBITDA summed €1,339m (+13% vs
Adj. EBITDA in 2016 of €1,184m) if adjusted by non-recurrent events.

Cash-Flow
Cash-Flow
EBITDA
Current income taxNet interest costsShare of profit of associates
FFO (Funds From Operations)
Net interest costsShare of profit of associates Income from institutional partnershipsNon-cash items adjustmentsChanges in working capital
Operating Cash-Flow
CapexFinancial (investments) divestmentsChanges in working capital related to PP&E suppliersGovernment grants
Net Operating Cash-Flow
Sale of non-controlling interests and shareholders' loansProceeds from institutional partnershipsPayments to institutional partnershipsNet interest costs (post capitalisation)Dividends net and other capital distributionsForex & others
Decrease / (Increase) in Net Debt
Note: 1) RCF +35% YoY if adjusted for 2017 non-recurrent event
(1,051)
+17%
(139)
869
(12)
139
(1,029)
981
1,184 +26%
15
942
952
(7%)
∆ 17/16 From EBITDA to Retained Cash-Flow (RCF) to Debt and TEI reduction (€m)
(50)
179
+43%
(77%)
(79%)
-
(22%)
+13%
(22%)
(105%)
- 8 -
(269)
1,171
+14%
2016
(0.2)
(29%)(172)
+2%
-
(181)
(31)
445
(146) (21%)(123)
14
(226)(3)
1 -
2017
+36%
0.2(198)
-
+338% (43)
(21%)
1,189
(41)
+13%
(51)
(156)
(207)
624(195)
+30%
(46)
10
(52)
(179)
247
(115)
(62)
(0)
3
1,366
+1,366
+1,114
+220
+154(46)
(268)
(92)
+247
(1,022)
(44)(75)
EBITDALT receivables & non-cash itemsIncome
Taxes
Interests, TEI & derivativesMinorities pay.RCFSale of minoritiesCash InvestmentsDividends (EDPR)FX & OtherNet Debt & TEI Redution
• Pursuing the strategic partnership between EDPR’s main shareholder (EDP) and CTG, in
2017 occurred the settlement of CTG – ENEOP transaction (MoU announced in Dec-13), for
a total amount of €247m.
• Proceeds from new institutional tax equity financing structure totalled €445m, related to
the tax equity signed in the US for 363 MW of wind energy projects and 60 MW of Solar PV
plants. Payments to institutional partnerships totalled €195m contributing to the reduction
of Institutional Partnership liability. Total net dividends and other capital distributions paid
to minorities amounted to €115m (including €44m to EDPR shareholders). Forex & Other
had a negative impact increasing Net Debt by €269m, mainly reflecting the consolidation
of Mexican wind farm (€221m), despite dollar depreciation vs Dec-16.
Retained Cash Flow, which captures the cash generated by operations to re-invest, distribute
dividends & amortize debt, increased to €1,114m. In 2017, RCF includes a non-recurrent
event (€168m mainly from bonus depreciation) in Tax Equity realized revenues, if adjusted by
such event, RCF increased 35% YoY. Net Debt & Institutional Partnership Liability decreased
by €220m.
In 2017, EDPR generated Operating Cash-Flow of €981m (+13% YoY), reflecting mainly
EBITDA performance (+17% YoY).
The key items that explain the 2017 cash-flow evolution to changes in Net Debt are:
• Funds from operations, resulting from EBITDA after net interest expenses, share of profits
of associates and current taxes, increased to €1,184m (+26% YoY).
• Operating Cash-Flow, which is EBITDA net of income tax and adjusted by non-cash items
(namely income from US institutional partnerships) and net of changes in working capital,
was €981m (+13% YoY).
• Capital expenditures with capacity additions, ongoing construction and development
works totalled €1,051m. Other net investing activities amounted to €29m (cash-in), mostly
reflecting invoices with equipment suppliers to be paid in the following periods together
with €29m from UK offshore stake divestment.
EBITDA Cash
adjustments
& LT receivables
RCFDividends
& interests
to
Minorities
Income
Taxes
Interests,
deriv.&
TEI
costs
Net Debt &
TEI
Reduction
Asset
Rotation
& CTG
Cash
Investm.
Forex
& Other
Dividends
to EDPR
shareh.
+60%1
+17%
Impacted by higher
benefits realized in Tax
Equity partnerships

Net Debt and Institutional Partnership Liability
Net Debt (€m)
Nominal Financial Debt + Accrued interests on DebtCollateral deposits associated with DebtTotal Financial Debt
Cash and cash equivalentsLoans to EDP Group related companies and cash poolingCash & Equivalents
Net Debt
Average Debt (€m)
Average nominal financial debtAverage net debt
Net Debt Breakdown by Assets (€m)
Net debt related to assets in operationNet debt related to assets under construction & develop.
Institutional Partnership (€m)
(1) Net of tax credits already benefited by the institutional investors and yet due to be recognised in the P&L
388
3,194
2,553
∆ %
2,755
2016
356
46
(215)
∆ €
2016
Dec-17: Financial Debt by Currency
605
3,237
2017
2017
2016
603
3,996
3,360
1
(271)
(166)
∆ €
2017
(9%)
(103)+154
253
3,476
∆ €
+51
(217)
Dec-17: Financial Debt by Type
Dec-17: Financial Debt by Maturity
3,406
(1)
Dec-17: Average Interest Rate Cost
(13%)
1,249
2,806
(3)43
2016
(169)
388
- 9 -
1,520
2017
0
3,367
2,399
Institutional Partnership Liability
3,048
EUR
42%
USD
46%
Other
12%
•EDPR continues to follow a long-term fixed rate funding strategy, matching the operating
cash-flow profile with its financial costs and therefore mitigating interest rate risk.
Accordingly, 84% of EDPR’s financial debt had a fixed interest rate. As of Dec-17, 11% of
EDPR’s financial debt had maturity in 2018, 12% of EDPR’s financial debt had maturity in
2019, 28% of EDPR’s financial debt had maturity in 2020 and 49% in 2021 and beyond. In
1Q17, EDPR renegotiated a maturity extension of €1.4bn, which was initially contracted in
2009 with EDP and scheduled to mature in 2018.
• In 2017, the average interest rate was 4.0% (flat YoY), reflecting EDPR’s €2.8bn debt
restructured and early amortized since 1Q16.
•As of Dec-17, EDPR’s Net Debt totalled €2.8bn, an increase of €51m from Dec-16, mainly
reflecting the investments done in the period and changes resulting from consolidation
perimeter variations in Mexico, partially offset by the cash flow generated by the assets and
proceeds from the sale of minority stakes settlement in Portugal (CTG).
•By Dec-17, 70% of EDPR’s financial debt was funded through long-term loans with EDP
Group – EDPR’s main shareholder – while loans with financial institutions represented 30%.
•Liabilities referred to Institutional Partnerships totalled €1,249m (-€271m YoY) reflecting the
benefits captured by the projects and by the tax equity partners during the period along
with forex.
•As of Dec-17, 42% of EDPR’s financial debt was Euro denominated, 46% was funded in US
dollars, related to the company’s investment in the US and the remaining 12% was mostly
related with debt in Polish Zloty and Brazilian Real.
Fixed
84%
Variable
16%
4.0% 4.0%
Dec-16 Dec-17
11% 12%
28%
49%
2018 2019 2020 ≥2021
(1)

- 10 -
Business Platforms

Europe
EBITDA MW
SpainPortugalFranceBelgiumItalyPolandRomania
Europe
Load Factor (%)
SpainPortugalFranceBelgiumItalyPolandRomania
See page 24 for more detail on regulation Europe
Note: Operational Performance considers only capacity consolidated at EBITDA level
2016
23%27%
2017
418
+3pp
2016
418
+74
∆ 17/16
-
∆ 17/16
144
28%27%
144-
28% (1pp)
410
-
71
4,986
521
26%
2,244 2,194
5,061
(0.3pp)
30%
2017
+22+3
-71
+0.2pp
EDPR EU: 2017 EBITDA MW by Market
+50
25%
1,253
21% 21%
+1pp
28%
(1pp)
27%
25%
27%
+5pp
521
388
26%
+1pp
23%
1,251
- 11 -
1,253 MW
• Feed-in Tariff
• Auction (ENEOP)
• 15+7 years
410 MW
• Feed-in Tariff
• 15 years
418 MW
• PPA
• Market price +
Green Certificate
521 MW
• Market price +
Green Certificate
2,244 MW
• Return on
standard asset
Poland
Romania
Italy
France
Spain
Belgium
Portugal
144 MW• < 2013: market
price + GC• Auctions
71 MW
• PPA
• Market price +
Green Certificate
• In Europe, EDPR reached a 27% load factor benefitting from a higher wind resource when
compare with 2016 (98% of P50 vs 97% of P50 in 2016). Poland (+5pp), Romania (+3pp) and
Spain (+1pp) where the top performers during the year.
• In the period, EDPR accomplished a load factor of 27% in Spain, above market average (+3pp)
with higher wind resource in the 4Q17 (+8pp YoY) offsetting the lower performance of the
first nine months of the year. In Portugal, France and Italy EDPR delivered lower YoY load
factors of 27%, 23% and 27% respectively while in Belgium, Poland and Romania load factors
increased YoY, reaching 21%, 30% and 28%, respectively.
•EDPR’s EBITDA installed capacity in Europe totalled 5.1 GW by Dec-17, a net increase of 49
MW YoY, divided into Spain, where 25 MW net were added (related to the acquisition of a
50% participation in a Spanish wind farm with 50 MW that was previously accounted as
equity), France, with 22 MW related to three wind farms and Portugal, with 3 MW installed
YoY.
•From the total 5,061 MW installed capacity in Europe (EBITDA MW), 5,006 MW were related
to wind onshore technology while 55 MW to solar PV (of which 50 MW in Romania and 5
MW in Portugal).
• In Spain, EDPR had 2.2 GW of which 9% had no capacity complement and the remaining
capacity is remunerated with a pool price with caps and floors and a capacity complement in
order to reach the targeted return on a standard asset. In Portugal, installed capacity
reached 1.3 GW representing 25% of EDPR EBITDA MW portfolio in Europe. EDPR had 1.6
GW installed in the Rest of Europe (“RoE”), accounting for 31% of the EBITDA MW portfolio
in Europe as of Dec-17.
• In addition to the 5,061 MW installed in Europe, as of Dec-17, EDPR had 152 MW
consolidated by equity, related to EDPR equity stakes in Spanish assets.

Europe
Spain Belgium
Production (GWh) Production (GWh)Production w/ capacity complement (GWh)
Standard Production (GWh) Avg. Selling Price (€/MWh)Above/(below) Standard Production (GWh)
Production w/o capacity complement (GWh) Electricity Sales (€m)
Selling Price + Capacity Complement ItalyRealised pool price (€/MWh)Regulatory Adjustment on standard GWh (€m) Production (GWh)Remuneration to investment (€m) Hedging gains/(losses) (€m) Avg. Selling Price (€/MWh)
Electricity Sales (€m) Electricity Sales (€m)
Portugal Poland
Production (GWh) Production (GWh)
Avg. Selling Price (€/MWh) Avg. Selling Price (€/MWh)
Electricity Sales (€m) Electricity Sales (€m)
France Romania
Production (GWh) Production (GWh)
Avg. Selling Price (€/MWh) Avg. Selling Price (€/MWh)
Electricity Sales (€m) Electricity Sales (€m)
Note: For analysis purposes hedging results are included in electricity sales
∆ 17/16
552
2,912
€158.0
€34.3
2017
398
4,140
2017
(4%)
4,528
€22.2
+4%
+29%
2016
€49.9
+1% 4,100429
13.6
€105.4
+5%
€90.4
2016
∆ 17/16
337
∆ 17/16
73.0
(€24.6)
- 12 -
(17%)
∆ 17/16
808
∆ 17/16
4,692
€73.7
1,093
95.5 86.6
5,095
2017
3,047
(0.01%)
261.9
2017
+15%
(2%)
1,295
∆ 17/16
(4%)
∆ 17/16
€62.2 €74.5
-
+1%
+30%
129 128
€105.8
2017
2016
- €120.9
30.140.8
+0.4%
+45%
€116.7 +4% +14%
70.9
+2%
2016
+1%
1,143
+35%
951
258
(0.4%)
2017
13.5
+10%
2017 2016
2016
68.1
+13%
€75.7 (3%)
€26.3€180.6
+4%
€88.0
268.3
70.2
€90.4
2016
777
375.3
€90.0
(€17.5)
4,926
+4%
404
+3%
392.6
• In Spain, 2017 production reached 5.1 TWh (+3% YoY), of which 92% was generated from
capacity with complement. According to the RDL 413/2014 approved in Jun-14, renewable
assets receive pool price with caps and floors and a capacity complement (€/MW) to achieve
the standard return. In 2017, on the back of weather conditions and the higher pool price,
the average realized pool price in the year was €50/MWh (vs €34/ MWh in 2016), leading to -
€18m of regulatory adjustment (base load higher than regulatory cap). Additionally, EDPR
accounted -€25m of hedging losses in 2017. All in all, the electricity sales in the period
totalled €393m (+5% YoY). For 2018, EDPR hedged 2.4 TWh at €41/MWh.
• In Portugal, electricity sales totalled €262m (-2% YoY) reflecting the lower YoY production at
2.9 TWh (-4% YoY) mainly explained by the lower wind conditions when compared to 2016.
The average selling price increased to €90/MWh (+2%), driven by inflation indexation.
• In France production increased to 808 GWh (+4% YoY) impacted by higher installed capacity.
Average selling price during the year was €90/MWh (stable YoY), leading to €73m electricity
sales in the period (+4% YoY).
• In Belgium, production in 2017 increased +1% YoY to 129 GWh on the back of a higher wind
resource YoY. During the year the average selling price was €105/MWh (-0.4% YoY), reflecting
the PPA price structure. All in all, electricity sales in 2017 were slightly higher at €14m (+0.4%
YoY).
• In Italy, production in 2017 increased to 337 GWh (+30% YoY), benefitting from the capacity
added at the very end of 2016. In 2017, the average selling price increased by 4% to
€121/MWh due to higher market prices (in wind farms installed before 2013). On the back of
a higher production and the increase in average selling price, electricity sales during the year
summed €41m (+35%).
• In Poland, production increased to 1.1 TWh (15% YoY) propelled by higher load factor (30%,
+5pp YoY). The average selling price decreased to €62/MWh (-17% YoY), on the back of lower
green certificate prices and a regulatory change in the substitution fee calculation method
(now calculated as 125% of previous year GC avg. price). Despite good weather conditions,
electricity sales in Poland decreased by 4% to €68m, hampered by the drop in selling prices.
• In Romania, production in 2017 increased to 1.3 TWh (+13% YoY) driven by a higher load
factor during the year (28%, +3pp YoY) while average selling price dropped 3% YoY to
€74/MWh, resulting in a 10% increase in electricity sales (€95m vs €87m in 2016).

Europe
Income Statement (€m)
GWh €/MWh €m Revenues
Other operating incomeOperating Costs
Supplies and services (S&S)Personnel costs (PC)Other operating costs
EBITDAEBITDA/Revenues
ProvisionsDepreciation and amortisationAmortisation of deferred income (government grants)
EBIT
Opex ratios Employees
Core Opex (S&S + PC) /Average MW in operation (€k) EuropeCore Opex (S&S + PC) /MWh (€)
Electricity Output Average Selling Price
∆ 17/16
16.8
2017
359.8
2016
+3%
+10% 17.1
3.3
- 13 -
39.4
2017
1.3
(30.3)(5%)
(4.8)
73%
2016
(281.2)
(2%)
(0.2%)
+21%
Revenues
2017
(84.2)
65.9
(88.8)
2016
666.5
(29.8)
437.0
728.6
+3%
+4pp
(280.5)34.6
(3%)
455
(96%)
943.2 913.0
+0.4%
∆ 17/16
∆ 17/16
(294.7)
499
+9%
+159%
(166.5)
77%
(162.0)
(0.2)
+90%
(303.2)
39.2(2%)
2016 20172016 2017
11,66911,230
• In 2017, EDPR output in Europe increased by +4% to 11.7 TWh, with YoY comparison
impacted by higher wind resource along with capacity additions. In 2017, European
generation accounted for 42% of EDPR total output. EDPR average selling price in Europe
decreased -1% to €81/MWh, mainly driven by the lower average selling price in Poland and
Romania (-17% and -3% YoY, respectively), partially compensated by the positive price
performance in Spain, Portugal and Italy (+1%, +2% and +4% YoY, respectively).
•Revenues in 2017 totalled €943m (+3% YoY or +€30m) reflecting higher installed capacity
(+€19m YoY) with higher load factor (+€12m YoY). In spite of lower YoY average selling price
in Europe (-1% YoY), there was a +€15m impact in revenues driven by higher prices in
Portugal and Spain offset by -€15m impact from Poland and Romania due to lower green
certificates prices and Polish substitution fee changes in law.
• In 2017, Other operating income totalled €66m, with the increase YoY mainly explained by a
capital gain subsequent to the sale, and loss of control, of a stake on an offshore UK project
(€29m) and gains in past asset rotation transaction’s adjustments along with a revaluation
gain related to the acquisition of assets. In 2017, Operating costs dropped -0.2% YoY at
€280m, due to the increase in Supplies and services (+€5m YoY) that was offset by Personnel
costs and Other operating costs decrease (-€1m and -€5m YoY, respectively) despite higher
capacity in operation.
• In 2017, Core Opex (defined as Supplies and Services and Personnel Costs) per average MW
in operation totaled €39k (+0.4% YoY) and Core Opex per MWh reached €17 (-2% YoY),
driven by higher output in the year.
•All in all, EBITDA totaled €729m, reflecting an EBITDA margin of 77%, with the YoY increase in
EBITDA mainly impacted by top-line evolution. In 2017, depreciations and amortizations
(including provisions, impairments and net of amortizations of government grants)
decreased by 5% YoY, reflecting the higher capacity and the change in EDPR depreciation
schedule from 25 to 30 years, and leading to an EBIT of €437m (+21% YoY).
2016 2017
81.5 81.0
913.0 943.2
+4% +3%(1%)
North America (USD)
EBITDA MW
US PPA/HedgeUS MerchantCanadaMexico
Total EBITDA MW
Load Factor (%)
USWestCentralEast
CanadaMexico
Average Load Factor
Electricity Output (GWh)
US Tax IncentivesCanadaMexico MW under PTC/ITC (Tax Equity Structure)Total GWh MW under cash grant flip (Tax Equity Structure)
MW under cash grant
Average Selling Price (US$/MWh) Revenues (US$m)
US Electricity sales and otherCanada Income from institutional partnershipsMexicoAvg. Final Selling Price Total Revenues
Note: (1) Considers projects with PPAs/LT contracts already signed but not yet contributing for production
45.5
-
112.1
585
∆ 17/16
-
2016
30
28%
12,576
+2pp
(0.4%)
+1pp
15,091
- -
33%
30
+20%
+15%
39%
-
39%
59.5
2017
∆ 17/16
780.5 +19%
2017
1,014
675.6
2017
684+325
2016 EDPR US: 2017 EBITDA MW by Market∆ 17/16
4,371
∆ 17/16
- 14 -
3,118
+20%218.6
2017
500500-
3,541 +424-
31%
2017
46.1
200
4,046
2016
-
2016
(1pp)29%
2016
+17%
+424
∆ 17/16
75
46.4
28%
109.4
1,014
561.9254.8
12,501
-4,8615,284
+99
930.446.4
30%33%
-
(1%)+2%
60675
-
2017
35%
33%
35%
2016
-
+1pp
14,410
+1pp
38%
∆ 17/16
200
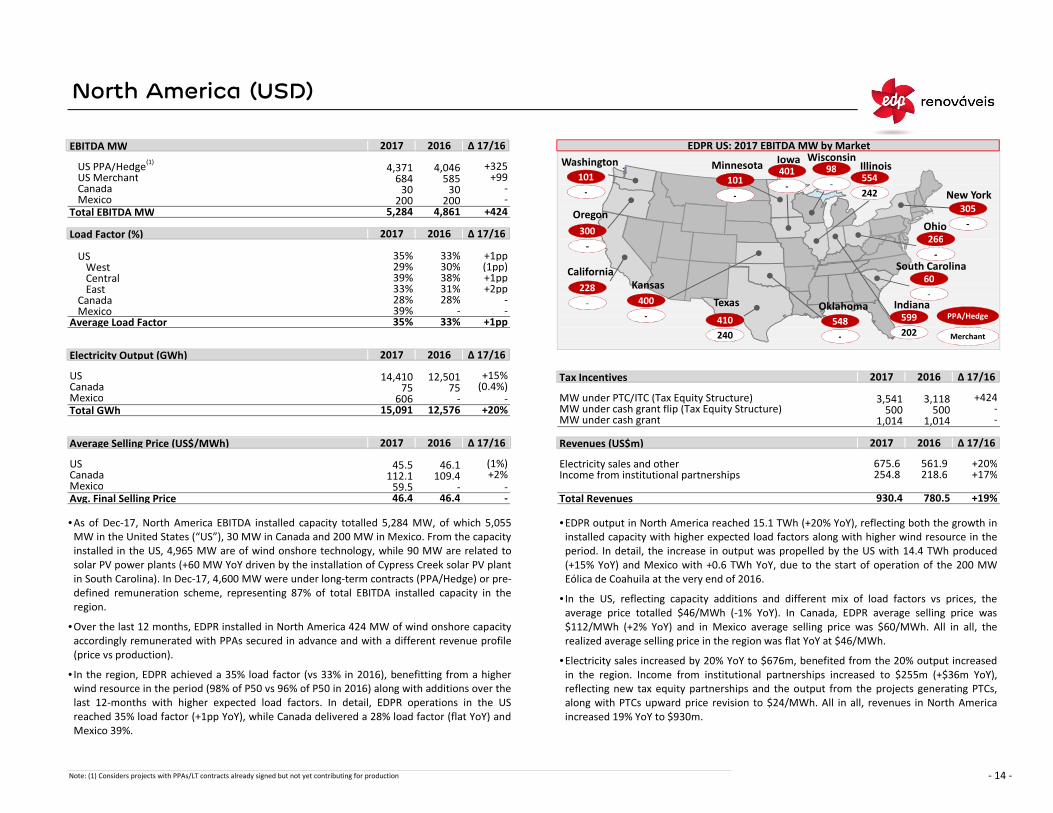
•EDPR output in North America reached 15.1 TWh (+20% YoY), reflecting both the growth in
installed capacity with higher expected load factors along with higher wind resource in the
period. In detail, the increase in output was propelled by the US with 14.4 TWh produced
(+15% YoY) and Mexico with +0.6 TWh YoY, due to the start of operation of the 200 MW
Eólica de Coahuila at the very end of 2016.
• In the US, reflecting capacity additions and different mix of load factors vs prices, the
average price totalled $46/MWh (-1% YoY). In Canada, EDPR average selling price was
$112/MWh (+2% YoY) and in Mexico average selling price was $60/MWh. All in all, the
realized average selling price in the region was flat YoY at $46/MWh.
•Electricity sales increased by 20% YoY to $676m, benefited from the 20% output increased
in the region. Income from institutional partnerships increased to $255m (+$36m YoY),
reflecting new tax equity partnerships and the output from the projects generating PTCs,
along with PTCs upward price revision to $24/MWh. All in all, revenues in North America
increased 19% YoY to $930m.
Oregon
Iowa
Texas
Illinois
New York
Minnesota
Kansas
Washington
Indiana
Ohio
Oklahoma
•As of Dec-17, North America EBITDA installed capacity totalled 5,284 MW, of which 5,055
MW in the United States (“US”), 30 MW in Canada and 200 MW in Mexico. From the capacity
installed in the US, 4,965 MW are of wind onshore technology, while 90 MW are related to
solar PV power plants (+60 MW YoY driven by the installation of Cypress Creek solar PV plant
in South Carolina). In Dec-17, 4,600 MW were under long-term contracts (PPA/Hedge) or pre-
defined remuneration scheme, representing 87% of total EBITDA installed capacity in the
region.
•Over the last 12 months, EDPR installed in North America 424 MW of wind onshore capacity
accordingly remunerated with PPAs secured in advance and with a different revenue profile
(price vs production).
• In the region, EDPR achieved a 35% load factor (vs 33% in 2016), benefitting from a higher
wind resource in the period (98% of P50 vs 96% of P50 in 2016) along with additions over the
last 12-months with higher expected load factors. In detail, EDPR operations in the US
reached 35% load factor (+1pp YoY), while Canada delivered a 28% load factor (flat YoY) and
Mexico 39%.
Merchant
PPA/Hedge
400
-
300
-
101
-101
-
401
-554
242
548
-
410
240
599
202
266
-
305
-
California
228
-
(1) Wisconsin98
-
South Carolina60
-

North America (USD)
Income Statement (US$m)
GWh $/MWh $m Electricity sales and otherIncome from institutional partnerships
Revenues
Other operating incomeOperating Costs
Supplies and services (S&S)Personnel costs (PC)Other operating costs
EBITDAEBITDA/Revenues
ProvisionsDepreciation and amortisationAmortisation of deferred income (government grants)
EBIT
Opex ratios Employees
Core Opex (S&S + PC) /Average MW in operation ($k) North AmericaCore Opex (S&S + PC) /MWh ($)
Note: In 2017 average exchange was 1.13 $/EUR. Exchange rate at Dec-17 was 1.20 $/EUR
Average Selling Price Revenues
47.5
Electricity Output
(343.1)18.2
+17%
(1%)
0.1
2016
+22%
(176.1)
(310.6) (9%)
71%
218.6
2016
384.1
(3%)
∆ 17/16
+63%
502
+11% +14%
+20%
+315%0.4
(46.7)
25.0 (3%)
+19%
676.0
(56.6)
+2pp
∆ 17/16
+17% 780.5
25.7
(48.2)
(21%)
675.6
(48.6)
254.8561.9
(154.4)
∆ 17/16
(4%)
73%
2017
235.2
555.1
(279.3)
23.1
(251.1)
422
2017
16.1+19%
- 15 -
930.4
47.0
2017
15.4
2016
2016 20172016 2017 2016 2017
-
46.4
• In 2017, EDPR electricity sales in North America increased by 20% YoY to $676m, driven by
the +20% YoY increase in electricity output and a stable average selling price of $46/MWh in
the region. Income from institutional partnerships was also +17% higher YoY to $255m,
reflecting new tax equity partnerships and the output from projects generating PTCs, along
with PTCs upward price revision to $24/MWh. Following the top line performance, revenues
in North America increased +$150m (+19% YoY) to a total of $930m.
• In the period, Other operating income totalled $25m (-3% YoY). Operating costs summed
$279m (+11% YoY), with the increase of +$22m YoY in Supplies and services and the increase
of +$8m YoY in Personnel costs, backed by the higher capacity in operation and the O&M
strategy. Core Opex (defined as Supplies and Services and Personnel costs) per average MW
in operation decreased by 1% to $47k, reflecting EDPR focus on efficiency and control over
costs along with an increase in average MW in operation. Core Opex per MWh decreased by
4% YoY to $15, also benefited from the higher output in 2017.
•Due to the strong performance in the top line with revenues increasing by +19% YoY and
despite higher net Operating costs, in 2017, EBITDA increased to $676m (+22% YoY) and
reached an EBITDA margin of 73% (+2pp YoY).
•Following the positive EBITDA performance and the $28m YoY decrease in depreciations and
amortisations (including impairments and net of amortisations of government grants), EBIT
amounted to $384m (+63% YoY). The YoY decrease in depreciations and amortisations
reflects the higher capacity and the change in EDPR depreciation schedule from 25 to 30
years.
12,576
15,09146.4 930.4
+19%
780.5
+20%

Brazil (BRL)
Income Statement (R$m)
GWh R$/MWh R$m Revenues
Other operating incomeOperating Costs
Supplies and services (S&S)Personnel costs (PC)Other operating costs
EBITDAEBITDA/Revenues
ProvisionsDepreciation and amortisationAmortisation of deferred income (government grants)
EBIT
Opex ratios Employees
Core Opex (S&S + PC) /Average MW in operation (R$k) BrazilCore Opex (S&S + PC) /MWh (R$)
Note: In 2017 average exchange was 3.60 BRL/EUR. Exchange rate at Dec-17 was 3.97 BRL/EUR
Electricity Output
2017 2016
+71%
+12%
2016
+20% (37.2)
+298%
- 16 -
203.0
(28.3)
2017 ∆ 17/16
+15%
+17pp
∆ 17/16
0.2
166.0
(33.1)
226.4 132.6
(6.2)
5.9
2016
-
(4%)+12%
+17%
2017
39
(5.5)
23.6(47.0)
34
0.2
73%
(31.0)
(41.8)
(8.0)
+152%
172.4 (27%)
65.9
110% 96.7
-
90%
∆ 17/16
(16%)
54.5
(0.0)
47.4
(7.7)
(13%)
Average Selling Price
235.9
Revenues
2016 20172016 2017 2016 2017
+34%
666
861
•As of Dec-17, EDPR had a total installed capacity of 331 MW in Brazil. In 2017 were added
127 MW related to JAU & Aventura wind farms. Brazilian projects operate under programs
with long-term contracts to sell the electricity produced for 20 years, providing long-term
visibility over cash-flow generation throughout the projects’ life.
• In 2017, EDPR generated 861 GWh vs 666 GWh in 2016 (+29% YoY), with increase in
production mainly explained by capacity additions with stronger wind resource.
•The average selling price in Brazil increased to R$289/MWh in the year, reflecting a
temporary PPA unwinding at Baixas do Feijão wind farm (120 MW).
• In the period, EDPR’s revenues in Brazil reached R$226m (+R$94m YoY), propelled both by
the increase in electricity generation and the higher average selling price.
• In 2017, Other operating income totalled R$24m (vs R$6m in 2016) related to adjustments
in past minority stake sales transactions. Operating costs totalled R$47m (+R$5m YoY) in
line with higher installed capacity. Reflecting the strict control over costs, higher average
capacity in operation and increased efficiency, Core Opex, defined by Supplies and Services
(including O&M activities) and Personnel costs, totalled R$41m, with Core Opex per Avg.
MW and per MWh decreasing by 27% and 13% YoY.
•All in all, EBITDA reached R$203m (vs R$97m in 2016), with higher YoY EBITDA margin (90%;
+17pp vs 2016).
•Following the EBITDA performance and the increase of $6m YoY in depreciations and
amortisations (including impairments and net of amortisations of government grants), EBIT
reached a total amount of R$166m (vs R$66m in 2016). The YoY increase in depreciations
and amortisations reflects the higher capacity, despite the change in EDPR depreciation
schedule from 25 to 30 years.
• In Brazilian energy auctions, EDPR was awarded in 2013 a 20-year PPA for 116 MW at JAU &
Aventura wind farms, already installed by December 2017. In 2014 EDPR was awarded a 20-
year PPA for 137 MW at Babilônia wind farm, which remains under construction with
expected CoD in 2018 while in the 2017 auction, EDPR was awarded a 20-year PPA for
Mundo Novo & Aventura II wind projects, totalling 218 MW with expected CoD in 2023.
These projects strengthen EDPR’s presence in a market with low risk profile, strong growth
prospects and attractive wind resource.
216.1
288.8
132.6
226.4
+71%+29%

Quarterly Data
- 17 -
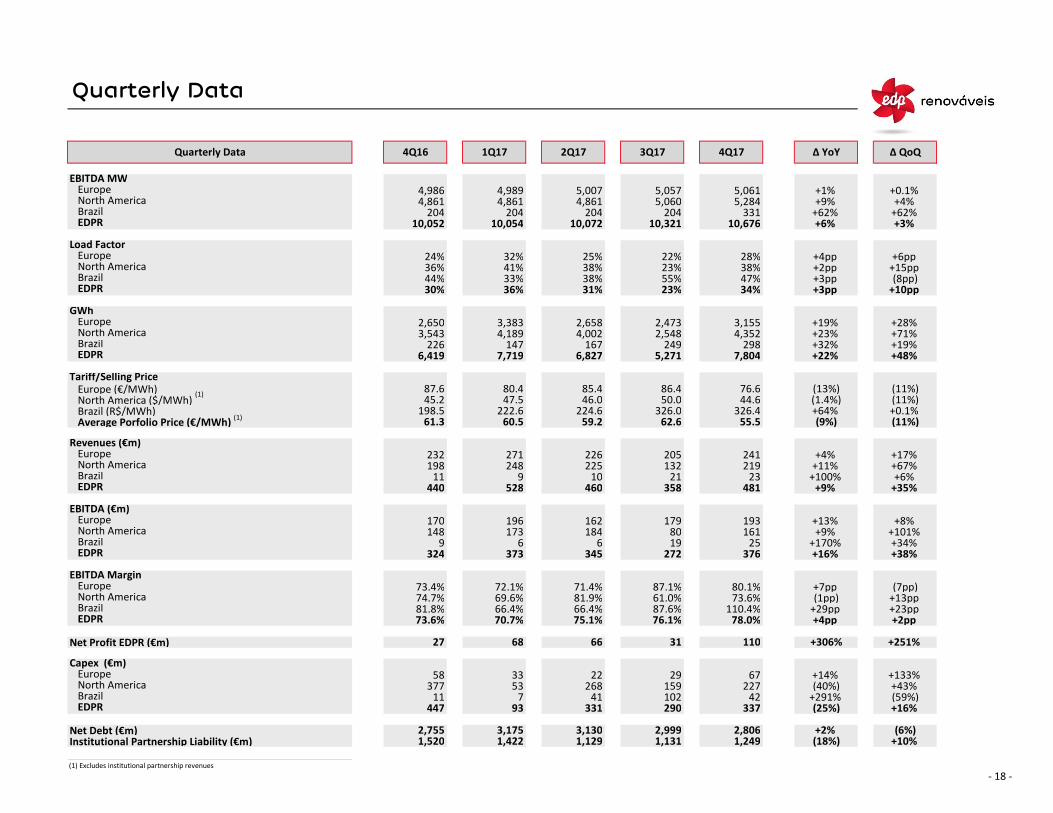
Quarterly Data
EBITDA MWEuropeNorth AmericaBrazilEDPR
Load FactorEuropeNorth AmericaBrazilEDPR
GWhEuropeNorth AmericaBrazilEDPR
Tariff/Selling PriceEurope (€/MWh)North America ($/MWh) Brazil (R$/MWh)Average Porfolio Price (€/MWh)
Revenues (€m)EuropeNorth AmericaBrazilEDPR
EBITDA (€m)EuropeNorth AmericaBrazilEDPR
EBITDA MarginEuropeNorth AmericaBrazilEDPR
Net Profit EDPR (€m)
Capex (€m)EuropeNorth AmericaBrazilEDPR
Net Debt (€m)Institutional Partnership Liability (€m)
(1) Excludes institutional partnership revenues
4,189
36%
3,543
41%
87.6
23%33%
4,352249
61.3
81.8%
373
447
73.6%
290
74.7%
78.0%
2,999
66
58 22
222.6
132
162
66.4%70.7%
345
66.4%
59.2
331
528 +9%
6,419
11268
27
76.1%
358
10,321
47.5
4,989
29
1,422
159
9
1,249
440
148
110.4%
10241
272
2,806
33
+306%
+4pp 75.1%
110
1,1311,129
227377
68
337
45.2
3,175 3,130
+16%
+2pp
198.5
11
232219
73.6%73.4%
+2%
+291% 7(40%)
61.0%87.6%
1,520
93
81.9%
271
42
67
72.1%
10198
46.0
241
+64%
+7pp
326.050.0
6
87.1%
9
224.6 326.4
2,755
+43% 53
+29pp
+9%
225
25
+23pp
193
23
7,719
+11%
184
62.6
44.686.4
(18%)(6%)
+14%
31
324
170
+170% 6
(1.4%)
161 +101% 196
19
+13% 173
80.1%69.6%
248
+133%
+17%
(59%)(25%)
(11%)
+71%
+6pp
179
(1pp)
3,155
85.4
+22%
80
+4%
460
6,827
55.5
76.6
71.4%
47%
205
481
(7pp)
7,804
+3pp
(9%)
23%
+0.1%
298
376
21
4,002
+4pp 28%
+3% 331
+6%
+13pp
- 18 -
(11%)
+100%
4Q17
+35%
+32% +19% +48%
(11%)
+16% +38% +34%
+251%
+10%
+8%
+67% +6%
2,473
31%
204
25%
34%
38% +2pp +15pp 38%
+23%
5,271
+4% +9% +1%
55%+10pp
226
80.4
2,650 3,383 2,658
(8pp)+3pp
147
38%
(13%)
5,007
10,072
60.5
167
+28%
+0.1% 5,284
5,057
20410,054
2Q17 ∆ YoY ∆ QoQ
2,548+19%
204
22%
5,061
10,676
3Q174Q16
5,060
10,052+62% +62%
4,8614,9864,861 4,861
204
226
Quarterly Data
44%36%
32%
30%
1Q17
24%
(1)
(1)

Income Statements
- 19 -

EDPR: Income Statement by Region
Electricity sales and otherIncome from institutional partnerships
Revenues
Other operating incomeOperating Costs
Supplies and servicesPersonnel costsOther operating costs
EBITDAEBITDA/Revenues
ProvisionsDepreciation and amortisationAmortisation of deferred income (government grants)
EBIT
Electricity sales and otherIncome from institutional partnerships
Revenues
Other operating incomeOperating Costs
Supplies and servicesPersonnel costsOther operating costs
EBITDAEBITDA/Revenues
ProvisionsDepreciation and amortisationAmortisation of deferred income (government grants)
EBIT
(29.8)
2016 (€m)
(43.9)
n.a.
(582.9)
(88.8)
359.8
(10.8)(281.2)
(1.7)
(155.9)
(17.2)75%
(128.2)
728.6
(9.2)
225.6
0.0
(139.5)(226.9)
Consolidated
0.4(13.0)(280.5)
(100.8)
(0.0)
(41.3)
73%
(8.0)20.9
(93.9)
(20.0)
94.9
0.0
16.1
53.8
(247.3)
(2.1)
225.6
(15.0)
-
Europe Brazil
(7.3)(17.6)
564.0212.5
19.5
(304.7)
(1.8)
(4.7)
17.1
(3.3)
2017 (€m)
(25.4)
- 20 -
71%
(0.0)
(2.6)
62.8
(1.4)
(162.0)
4.7
598.6
(50.1)
-
(43.5) (134.9)
22.2(624.5)
1,827.2
1,601.6
437.0
823.8
65.9
-62.8598.2
(18.7)
Consolidated
(2.6)
(275.0)
56.3
0.4
71%
(2.1)(1.1)
0.1
73% 90%
507.6
(294.7)0.2
73%
(30.3)
0.1
4.1
22.1 6.5
-
BrazilEurope
803.1
-
3.3
77%1,366.3
943.2
Other/Adj.
913.0
501.5
34.4
913.0197.5
(1.0)
(326.9)
-
(166.5)
1,650.834.4
(5.6)
n.a.
(22.1)
1,453.2
(84.2)
705.2
0.0
-
34.6
(10.3)0.0
(533.6)(14.7)
1,171.0
N. America
943.2
(555.8)
(0.2)(2.8)
Other/Adj.
(1.8)
340.1
(310.0)
25.1666.5
(4.8)
1.5
197.5
23.2
46.0
N. America
(303.2)1.3

EDPR Europe: Income Statement by Country
Revenues
Operating Costs and Other operating income
EBITDAEBITDA/Revenues
Depreciation, amortisation and provisions
EBIT
Revenues
Operating Costs and Other operating income
EBITDAEBITDA/Revenues
Depreciation, amortisation and provisions
EBIT
(122.6)
188.4
2017 (€m)
348.6
226.0
2016 (€m)
83%
Total EuropeRoE
(115.6)
(111.7) (4.1)(122.0) (291.6)
93.5
116.5
223.2
267.7
(73.7)
73%
Spain
65%
(132.6) (72.2) (3.7)
19.1
(306.7)
151.0
- 21 -
300.1
437.0
268.0 28.6
(246.5)
Total Europe
Other/Adj.
Other/Adj.
(5.8)
(22.1)
359.8
(21.9)n.a. 77%
22.8
96.2
158.1 (26.0)
(50.3)
RoE
73%
(98.2)
n.a.666.5
913.0
194.4
238.5
260.8
81%
Spain
288.8
0.2
83%
72%
Portugal
(214.6)
943.2
(48.9)
728.6
(44.5)
(53.8)
Portugal
211.9
415.8
(1) Important note on Spain and Other: Pursuant the changes in the Spanish regulatory framework, EDPR hedges its exposure to the Spanish pool price, accounted at the European
platform level (Other/Adj.). On page 12, the hedging was included in the Spanish division only for analytical purposes.
(1)
(1)

Annex
- 22 -

Equity Consolidated & Non-controlling Interest (MW)
(1) Breakdown only considers associate companies with installed capacity
1,215North America
-
2016
Spain
Installed Capacity (MW)
Rest of Europe (RoE)
Portugal
∆ YoY
+€3.3m
+$1.3m$1.8m
230
2017
179
177
+207
MW
+74%
230
∆ YoY
414
2016
€14.2m
Non-controlling Interest (Net MW)
EDPR Interest
152
2016
Share of profit
€8.2m
179 $15.1m
-
-
Equity Consolidated (MW)
US $0.5m
2017Country ∆ YoY
(25)
2016 ∆ %
-
2017
621
Spain €3.3m (€0.1m)
EBITDA Equivalent
2017
+264
557
1,220
$12.7m
(5)
557
100 +62Brazil
Total 2,785 2,521
- 23 -
162
•As of Dec-17, EDPR managed a total of 2.8 GW corresponding to minorities held by institutional
and strategic partners, an increase of 264 MW since Dec-16, mainly reflecting EDPR settlement
of asset rotation and CTG deals, executed in Europe and Brazil with EFG Hermes and CTG. North
America 5 MW YoY change was due to post-flip adjustments of tax equity investors.
•EDPR asset rotation strategy is based in selling minorities stakes in its optimized wind farms to
re-invest in the development of quality and value accretive projects.
(1)

Remuneration Frameworks
Short Description Country Short Description
- 24 -
Country
US
• Sales can be agreed under PPAs (up to 20 years), Hedges or Merchant prices
• Green Certificates (Renewable Energy Credits, REC) subject to each state
regulation
• Tax Incentive:
• PTC collected for 10-years since COD ($24/MWh in 2017)
• Wind farms beginning construction in 2009 and 2010 could opt for 30%
cash grant in lieu of PTC
Spain
• Wind energy receives pool price and a premium per MW, if necessary, in
order to achieve a target return established as the Spanish 10-year Bond
yields plus 300bps
• Premium calculation is based on standard assets (standard load factor,
production and costs)
Portugal
• MWs from previous regime: Feed-in Tariff inversely correlated with load
factor throughout the year. Tariff updated monthly with inflation, through
the later of: 15 years of operation or 2020, + 7 years (extension cap/floor
system: €74/MWh - €98/MWh)
• ENEOP: price defined in an international competitive tender and set for 15
years (or the first 33 GWh per MW) + 7 years (extension cap/floor system:
€74/MWh - €98/MWh). Tariff for first year established at c.€74/MWh and
CPI monthly update for following years
• VENTINVESTE: price defined in an international competitive tender and set
for 20 years (or the first 44 GWh per MW)
Poland
• Electricity price can be established through bilateral contracts or selling to
distributor at regulated price (162.5 PLN/MWh for 4Q 2017)
• Wind receive 1 GC/MWh which can be traded in the market. Electric
suppliers have a substitution fee for non compliance with GC obligation.
From Sep-17 onwards, substitution fee is calculated as 125% of the avg
market price of the GC from the previous year and capped at 300PLN.
Romania
• Wind assets (installed until 2013) receive 2 GC/MWh until 2017 and 1
GC/MWh after 2017 until completing 15 years. 1 out of the 2 GC earned
until Mar-2017 can only be sold from Jan-2018 and until Dec-2025. Solar
assets receive 6 GC/MWh for 15 years. 2 out of the 6 GC earned until Dec-
2024 can only be sold after Jan-2025 and until Dec-2030. GC are tradable on
market under a cap and floor system (cap €35 / floor €29.4)
• Wind assets (installed in 2013) receive 1.5 GC/MWh until 2017 and after
0.75 GC/MWh until completing 15 years
• The GCs issued starting in Apr-2017 and the GCs postponed to trading from
Jul-2013 will remain valid and may be traded until Mar-2032
• Projects online before 2013 are (during 15 years) under a pool + premium
scheme (premium=1x€180/MWh –“P-1”)x0.78, being P-1 previous year
average market price
• Assets online from 2013 onwards were awarded a 20 years contract
through competitive auctions. According with the auction scheme, the
electricity produced by these wind farms will be sold to the market and if
the realized market price is lower than the awarded price, the difference
will be paid by Gestore dei Servizi Energetici (“GSE”)
• Feed-in tariff for 15 years:
• First 10 years: receive €82/MWh; inflation type indexation
• Years 11-15: depending on load factor receive €82/MWh @2,400 hours
decreasing to €28/MWh @3,600 hours; inflation type indexationFrance
Belgium
• Market price plus green certificate (GC) system
• Separate GC prices with cap and floor for Wallonia (€65/MWh-100/MWh)
• Option to negotiate long-term PPAs
Italy
Brazil
Canada
• Installed capacity under PROINFA program
• Competitive auctions awarding 20-years PPAs
• Feed-in Tariff (Ontario). Duration: 20-years• Renewable Energy Support Agreement (Alberta)
• Bilateral Electricity Supply Agreement under self-supply regime
• Duration: 25-years
Mexico
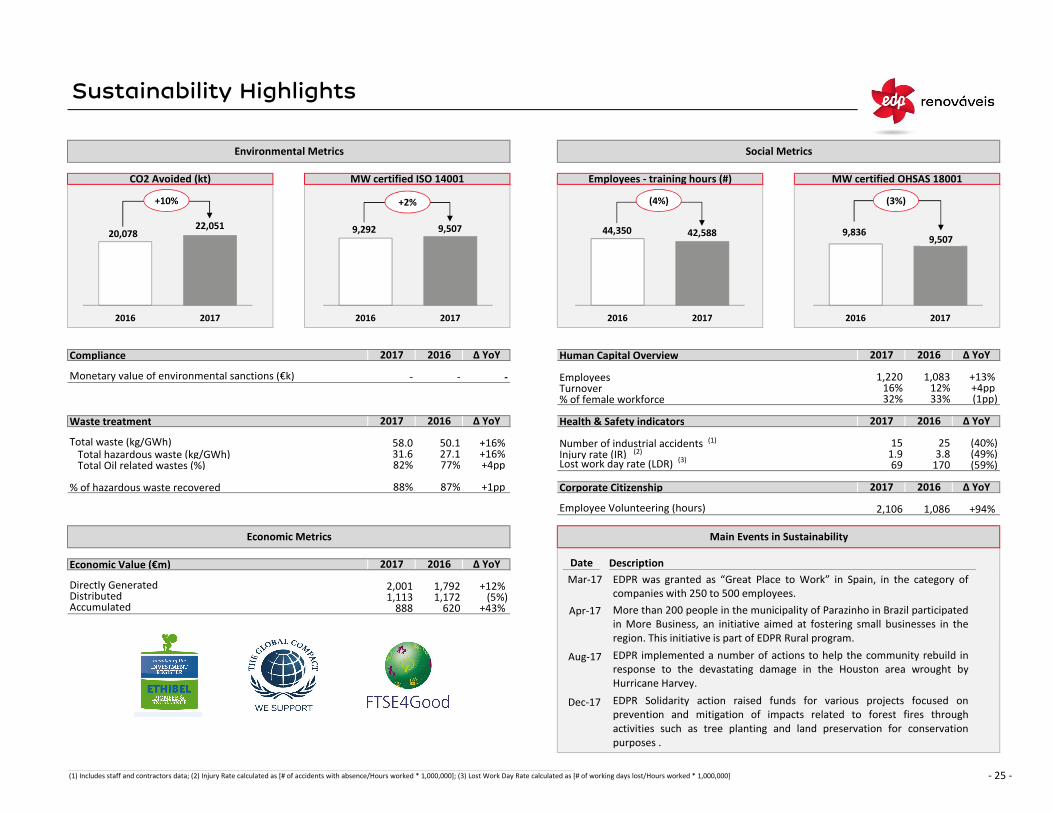
Sustainability Highlights
Compliance Human Capital Overview
Monetary value of environmental sanctions (€k) EmployeesTurnover% of female workforce
Waste treatment Health & Safety indicators
Total waste (kg/GWh) Number of industrial accidentsTotal hazardous waste (kg/GWh) Injury rate (IR)Total Oil related wastes (%) Lost work day rate (LDR)
% of hazardous waste recovered Corporate Citizenship
Employee Volunteering (hours)
Economic Value (€m)
Directly GeneratedDistributedAccumulated
(1) Includes staff and contractors data; (2) Injury Rate calculated as [# of accidents with absence/Hours worked * 1,000,000]; (3) Lost Work Day Rate calculated as [# of working days lost/Hours worked * 1,000,000]
Environmental Metrics
50.1
∆ YoY
∆ YoY
(59%)
+1pp
Economic Metrics
2017
-
27.1
16%
15
+94%
25
Employees - training hours (#)
+13% -
- 25 -
2017
Social Metrics
1,792
2,106 1,086
2016
+12%
2017
82%
2016
88%
58.031.6
2,001
Main Events in Sustainability
∆ YoY
(40%)
2017
87%
69
2016
1.9
∆ YoY
∆ YoY2017
(49%)
1,083
+16%
170
2016
+4pp +16%
33%
CO2 Avoided (kt)
2017
2016
77%
(1pp)32%12%
∆ YoY
1,220+4pp
3.8
2016
-
MW certified OHSAS 18001MW certified ISO 14001
1,113 1,172 (5%)888 620 +43%
Date Description
2016 2017
20,07822,051
+10%
2016 2017
9,292 9,507
+2%
2016 2017
44,350 42,588
(4%)
2016 2017
9,8369,507
(3%)
(2)
Mar-17 EDPR was granted as “Great Place to Work” in Spain, in the category of
companies with 250 to 500 employees.
(3)
(1)
Apr-17 More than 200 people in the municipality of Parazinho in Brazil participated
in More Business, an initiative aimed at fostering small businesses in the
region. This initiative is part of EDPR Rural program.
Aug-17 EDPR implemented a number of actions to help the community rebuild in
response to the devastating damage in the Houston area wrought by
Hurricane Harvey.
Dec-17 EDPR Solidarity action raised funds for various projects focused on
prevention and mitigation of impacts related to forest fires through
activities such as tree planting and land preservation for conservation
purposes .

Share Performance & Shareholder Structure
Opening PriceMinimum PriceMaximum PriceAverage PriceClosing Price
Share performanceDividend per shareTotal Shareholder Return
Volume (m)Daily Average (m)Market Cap (€m)
Rui Antunes, Head of IR Address:Maria Fontes Serrano Galvache, 56 - Edificio Olmo, 7ºPia Domecq 28033, Madrid, EspañaMarten Menke
Head Office:Plaza de la Gesta, nº 2
Email: [email protected] 33007 Oviedo, EspañaSite: www.edpr.com C.I.F. n. º A-74219304
LEI: 529900MUFAH07Q1TAX06
(1) From 01-Jan-2017 until 23-Fev-2017; (2) Bloomberg data including all exchanges and OTC; (3) Dated as of 29-Dec-2017
+3%
44.71.1
6,237 6,281
159.72.5
€ 6.13
€ 0.00
€ 6.93€ 6.13€ 6.93
€ 5.70
€ 0.05(16%)
€ 6.04
(17%)
€ 6.70€ 7.20€ 6.74
€ 0.05
1.66,077
€ 6.04€ 5.71
€ 0.00
+34 902 830 700 | +34 914 238 429Phone|Fax:
- 26 -
€ 6.97
291.1
9M17€ 7.25
+20%€ 0.05
€ 7.20€ 6.67€ 7.20
+15%
Capital Market Indicators
€ 5.71
+19%
2018YTD€ 6.97€ 6.78€ 7.19€ 7.03€ 7.15
+3%
1Q17€ 6.04
+15%
5,265
298.7
6,046
€ 7.28
20161H17
+15%
€ 6.04€ 5.71€ 6.93
Shareholder Structure Investor Type (ex-EDP Group) Investor Relations Department
2017 EDPR Share Price Performance 2017 Main Events
€ 6.04€ 5.71
2017
1.9
+16%
421.9
6,074
€ 0.05
€ 6.96
+16%
1.1
+15%
2.3373.6
0.0
5.0
10.0
15.0
20.0
25.0
Dec-16 Feb-17 Apr-17 Jun-17 Aug-17 Oct-17 Dec-17
4.00
4.50
5.00
5.50
6.00
6.50
7.00
7.50
8.00
Vo
lum
e (
m)
Sh
are
Pri
ce (
€)
Volume (m) Share Price (€) Events
1
2
3
4
82.6%
3.1%14.3%
EDP Group
MFS Investment
Management
Other shareholders 70%
16%
13%1% Investment Funds
Pension Fund & Other
SRI
Retail
(3)
5
22-Feb
27-Feb
28-Feb
27-Mar
06-Apr
18-Apr
24-Apr
03-May
08-May
30-Jun
07-Jul
11-Jul
18-Jul
26-Jul
08-Aug
16-Aug
11-Sep
26-Sep
17-Oct
31-Oct
14-Dec
20-Dec
29-Dec
29-Dec
€6.31
€6.20
€6.21
€6.27
€6.99
€6.94
€6.94
€6.99
€6.99
€6.96
€6.86
€6.85
€6.86
€6.78
€6.79
€6.86
€7.00
€7.20
€7.07
€7.10
€6.69
€6.75
€6.97
€6.97
Spain published the interim regulatory revision for wind energy assets
EDPR announces the sale of a minority stake in Portuguese assets to CTG
EDPR FY16 Annual Results release
EDP announces a Tender Offer over the shares issued by EDPR
EDPR Annual Shareholders’ Meeting
EDPR 1Q17 Volumes and Capacity Statement release
EDPR Board of Directors Report on EDP Tender Offer
EDPR 1Q17 Results release
EDPR payment of dividend (€0.05 per share)
Completion of the sale of a minority stake in Portuguese assets to CTG
EDPR announces the sale of a 23% stake in UK wind offshore project
EDPR 1H17 Volumes and Capacity Statement release
EDPR established new institutional partnership structure in the US
EDPR 1H17 Results release
EDPR informs about EDP qualified participation
EDPR secures 75 MW long-term contract in Indiana, US
EDPR JV is awarded with CfD for 950 MW of wind offshore in UK
EDPR informs about change in corporate bodies
EDPR 9M17 Volumes and Capacity Statement release
EDPR 3Q17 Results release
EDPR is awarded a L-T RESA for 248.4 MW of wind onshore in Canada
EDPR is awarded L-T contracts for 218 MW of wind in Brazil
EDPR announces 2018 Financial Calendar
EDPR completed $507m funding of TEI in the US for all its 2017 projects
Date Description Share Price#
(2)
1
2
34
5
15
1617
1819
20
21
22
6
6
7
8
9
10
11
12
7
8
9
10
11
12
13
14
14
15
16
17
18
19
13
23
24
20
21
22
23
24
(1)