Embed Size (px)
Citation preview
PNNL-13542
Hanford Radiological Protection Support Services Annual Report for 2000 T. P. Lynch J. A. MacLellan D. E. Bihl R. K. Piper M. L. Johnson May 2001 Prepared for the U.S. Department of Energy under Contract DE-AC06-76RL01830
DISCLAIMER This report was prepared as an account of work sponsored by an agency of the United States Government. Neither the United States Government nor any agency thereof, nor Battelle Memorial Institute, nor any of their employees, makes any warranty, express or implied, or assumes any legal liability or responsibility for the accuracy, completeness, or usefulness of any information, apparatus, product, or process disclosed, or represents that its use would not infringe privately owned rights. Reference herein to any specific commercial product, process, or service by trade name, trademark, manufacturer, or otherwise does not necessarily constitute or imply its endorsement, recommendation, or favoring by the United States Government or any agency thereof, or Battelle Memorial Institute. The views and opinions of authors expressed herein do not necessarily state or reflect those of the United States Government or any agency thereof. PACIFIC NORTHWEST NATIONAL LABORATORY operated by BATTELLE for the UNITED STATES DEPARTMENT OF ENERGY under Contract DE-ACO6-76RL0183O Printed in the United States of America Available to DOE and DOE contractors from the Office of Scientific and Technical Information, P.O. Box 62, Oak Ridge, TN 37831-0062; ph: (865) 576-8401 fax: (865) 576-5728 email: [email protected] Available to the public from the National Technical Information Service, U.S. Department of Commerce, 5285 Port Royal Rd., Springfield, VA 22161 ph: (800) 553-6847 fax: (703) 605-6900 email: [email protected] online ordering: http://www.ntis.gov/ordering.htm
This document was printed on recycled paper. (8/00)

PNNL-13542
Hanford Radiological Protection Support Services Annual Report for 2000 T. P. Lynch J. A. MacLellan D. E. Bihl R. K. Piper M. L. Johnson May 2001 Prepared for the U.S. Department of Energy under Contract DE-AC06-76RL01830 Pacific Northwest National Laboratory Richland, Washington 99352
iii
Summary During calendar year (CY) 2000, the Pacific Northwest National Laboratory (PNNL) performed its customary radiological protection support services in support of the U.S. Department of Energy (DOE) Richland Operations Office (RL) and the Hanford contractors. These services included 1) external dosimetry, 2) internal dosimetry, 3) in vivo measurements, 4) radiological records, 5) instrument calibra-tion and evaluation, and 6) calibration of radiation sources traceable to the National Institute of Standards and Technology (NIST). The services were provided under a number of programs as summarized here. The Hanford External Dosimetry Program (HEDP) supports Hanford radiation protection programs by providing external radiation monitoring capabilities for all Hanford workers and visitors to help ensure their health and safety. The HEDP also provides sitewide nuclear accident and environmental dosimetry services. The 43,760 dose results reported in CY 2000 represented a 3% increase from CY 1999. The HEDP successfully passed the DOE Laboratory Accreditation Program (DOELAP) performance testing criteria for all 36 requested categories. In addition, only a single finding resulted from the National Voluntary Laboratory Accreditation Program onsite assessment this year. Several changes were implemented or initiated during the year. These included improved tracking of dosimeters in process, improved documentation of dose adjustments, evaluation of incorrect filter thickness in dosimeter holders, development of a new neutron algorithm for estimating dose from neutrons at the Plutonium Finishing Plant, and evaluation of the deep dose response of the Hanford standard dosimeter to energetic beta radiation. Technical studies were performed in the areas of code development, uncertainty analysis, dosimeter filters, dosimeter response for specific exposure geometries, and 32P analyses to estimate doses from a criticality event. The Hanford Internal Dosimetry Program (HIDP) provides for the assessment and documentation of occupational dose from intakes of radionuclides at the Hanford Site. The 5,369 excreta bioassay measurements performed in CY 2000 were slightly greater than the number performed in CY 1999. Major revisions were made to the technical basis manual that describes the bases for the internal dose calculations performed at Hanford and the new revision was issued in CY 2000. The decision level used for alpha spectrometry was revised. The bioassay analytical contract was novated to a new company. The excreta bioassay contractor experienced problems with a backlog of alpha spectrometry samples and excessive 243Am false positives during the year. Dose assessments were performed for the 21 incidents that occurred with the potential for an intake. One hundred three evaluations were started because of routine bioassay results that exceeded the criteria for investigation. Six assessments of the HIDP were conducted during the year. Four technical studies were performed to 1) determine the dose from tritium absorption through the skin, 2) investigate a new internal dosimetry code, 3) review historical records in the radiological exposure (REX) system, and 4) establish a bioassay program for firefighters. A draft basic ordering agreement for a DOE-wide in vitro bioassay contract was reviewed. The In Vivo Monitoring Program provides the in vivo counting services for radiation workers at the Hanford Site. The 6,983 in vivo measurements performed in CY 2000 represented a 14% decrease from the 8,085 measurements performed in CY 1999. The first full year of operation with the Abacos software was completed. Technical equivalence was granted by DOELAP for the new Abacos software system.

iv
Subsequently, the DOELAP performance test criteria were met for all six categories for which reaccredidation was requested. The DOELAP onsite assessment was completed in January 2001. The performance of the standup counter was improved. The portable planar high-purity germanium counting system was calibrated for low- and high-energy applications. A spare whole body counting system was installed in the Lead Room. Digital signal processing electronics were installed in one counting room. Technical studies were conducted to 1) assess the capability to measure iodine in the thyroid, 2) study the impact of medically administered radionuclides on counting systems, 3) assess coincidence summing effects for lung counting calibrations, 4) evaluate the impact of platinum X-rays on check source quality, and 5) generate a computer model of a check source geometry. The Hanford Radiation Records Program preserves and administers all Hanford records of personnel radiological exposure, historical radiation protection, and radiological dosimetry practices and policies. It also produces reports for DOE Headquarters, RL, the Office of River Protection, Hanford contractors, individuals, and other authorized agencies, and it provides data for epidemiology and research projects. The total number of reports issued in CY 2000 was similar to the CY 1999 total. The 50,000 documents scanned and indexed were 50% higher in number compared to the CY 1999 number. The Access Control Entry System software was upgraded in May and work started later in the year on the next revision. The REX database was redesigned, moved to a new platform, and put into production in October. The LaserCAL system operated for the full year as the document database for the Instrumentation Services and Technology Program. The Instrumentation Services and Technology Program (IS&TP) provides complete and reliable radiation protection instrument services for site contractors to ensure personnel safety in the Hanford workplace. This includes administering the portable instrument pool for the site and supporting the Hanford Instrument Evaluation Committee. It was determined that the age of instruments in the pool does not appear to be adversely affecting performance. The 14,546 calibrations performed in CY 2000 represents a slight increase from the number of calibrations performed in CY 1999. The IS&TP assumed responsibility for managing the Maintenance and Test Equipment project in CY 2000. The Radiation Standards and Calibration Program maintains the radiological standards necessary to support the characterization and calibration needs of instrument and external dosimetry projects. The radiological reference fields maintained include gamma, beta, and neutron isotopic sources and X-ray-generating devices. Maintaining radiological reference fields traceable to national standards is a primary goal for the program. In CY 2000, verification measurements were made of reference radiation fields’ quantity and quality. The accuracy of instrument standards was also verified during the year. Exposures were made of Hanford dosimeters to support audit and quality control evaluations. The full bremsstrahlung X-ray capability was restored. Repair of the two Phillips X-ray systems was completed. Characterization of the 204Tl beta source continued in CY 2000. Five audits of the program were conducted during the year.

v
Abbreviations and Acronyms ACES Access Control Entry System ACLS Administrative Control Limits AIC air-equivalent ionization chamber AMAD activity median aerodynamic diameter ANSI American National Standards Institute BEGe broad energy germanium BHI Bechtel Hanford Incorporated BOA basic ordering agreement CAM continuous air monitor CAR computer-assisted retrieval (system) CC coaxial (high-purity germanium) counter CD compact disc CEDE committed effective dose equivalent CFR Code of Federal Regulations CHG CH2M Hill Hanford Group, Inc. CR&A Calibration Research and Accreditation (subgroup) CWT chest-wall thickness CY calendar year D2O deuterated water DEC Digital Equipment Corporation DNFSB Defense Nuclear Facility Safety Board DOE U.S. Department of Energy DOELAP DOE Laboratory Accreditation Program DSP digital signal processing ERC Environmental Restoration Contractor (team) Eres maximum residual energy FA failed analysis FH Fluor Hanford, Inc. FOIA Freedom of Information Act FY fiscal year GM Geiger-Müller HCND Hanford combination neutron dosimeter HEDP Hanford External Dosimetry Program
vi
HEHF Hanford Environmental Health Foundation HIDP Hanford Internal Dosimetry Program HIEC Hanford Instrument Evaluation Committee HLAN Hanford Local Area Network HPDAC Hanford Personnel Dosimetry Advisory Committee HPGe high-purity germanium HPS Health Physics Society HQ Headquarters HRRP Hanford Radiological Records Program HSD Hanford standard dosimeter HVL half-value layer IAEA International Atomic Energy Agency IARC International Agency for Research on Cancer ICRP International Commission on Radiological Protection ID identifier IMBA Integrated Modules for Bioassay Analysis (Code) IODR Investigation of Dosimetry Result IPUL low-level isotopic plutonium IR Iron Room IS insufficient sample volume ISO International Standards Organization IS&TP Instrumentation Services and Technology Program IVMP In Vivo Monitoring Program IVRRF In Vivo Radioassay and Research Facility LaserCAL CD-ROM imaging system for calibration records LaserREX CD-ROM imaging subsystem to REX Lc decision level LC lost container LEPD low-energy photon detector LMSI Lockhead Martin Services, Inc. LSR Low-Scatter Room MCA multichannel analyzer MCNP Monte Carlo N-Particle (transport code) MDA minimal detectable activity MQA measurement quality assurance M&TE Measuring and Test Equipment (calibration project) NA not applicable NBS National Bureau of Standards ND kit not delivered NIM nuclear instrument module

vii
NIOSH National Institute for Occupational Safety and Health NIST National Institute of Standards and Technology NRPB National Radiation Protection Board (United Kingdom) NS no sample received NVLAP National Voluntary Laboratory Accreditation Program ORP Office of River Protection PAAA Price Anderson Act Amendment PC personal computer PFP Plutonium Finishing Plant PMT photomultiplier tube PNNL Pacific Northwest National Laboratory PTB Physikalisch-Technische Bundesanstalt PTW Physikalisch-Technische Werkstäten QA quality assurance QC quality control REX Radiological Exposure (system) R&HT Radiation and Health Technology RL U.S. Department of Energy Richland Field Office RPG Radiochemistry Process Group RS&CP (Hanford) Radiation Standards and Calibrations Program RWP Radiation Work Permit SAIC Science Applications International Corporation SOW Statement of Work SS Stainless Steel Room STL Severn Trent Laboratories SU standup counter TIBM thoron in-breath monitor TL thermoluminescent (dosimetry) TLD thermoluminescent dosimeter TPU total propagated uncertainty TRIP Thyroid Radioiodine Intercomparison Program TRU transuranium radionuclide(s) URL uniform resource locator USE U.S. Ecology WB whole body WBC whole body count

viii
Y2K Year 2000

ix
Contents Summary............................................................................................................................................ iii Abbreviations and Acronyms ............................................................................................................ v 1.0 Introduction ............................................................................................................................... 1.1 2.0 Hanford External Dosimetry Program....................................................................................... 2.1 2.1 Routine Operations............................................................................................................ 2.2 2.2 Program Changes and Improvements................................................................................ 2.4 2.2.1 Tracking Status of Dosimeters in Process.............................................................. 2.4 2.2.2 Improvement in Documentation of Dose Adjustments .......................................... 2.4 2.2.3 Incorrect Tin Filter Thickness in HSD Holders ..................................................... 2.4 2.2.4 New 8816 Algorithm for Plutonium Finishing Plant Neutrons Proposed.............. 2.5 2.2.5 Deep Dose in HSDs From Beta-Radiation-Only Fields......................................... 2.5 2.2.6 Effects of the Millennium Transition ..................................................................... 2.5 2.3 Program Assessments and Quality Assurance .................................................................. 2.6 2.3.1 Blind Audit Personnel Dosimeters ......................................................................... 2.6 2.3.2 Blind Audit Environmental Dosimeters ................................................................. 2.6 2.3.3 Department of Energy Laboratory Accreditation Program.................................... 2.6 2.3.4 National Voluntary Laboratory Accreditation Program......................................... 2.11 2.3.5 Energy Northwest Assessment............................................................................... 2.12 2.3.6 Self-Assessments.................................................................................................... 2.12 2.3.7 Environmental Dosimeter Intercomparison ........................................................... 2.12
x
2.4 Supporting Technical Studies............................................................................................ 2.12 2.4.1 New External Dosimetry Code............................................................................... 2.13 2.4.2 Evaluation of Lead Impurity in Tin Filters in the 8825 Holders ............................ 2.13 2.4.3 Uncertainty Analyses ............................................................................................. 2.13 2.4.4 Effect of Lead Aprons on Response of 8825 and 8816 Dosimeters....................... 2.13 2.4.5 Analysis of Phosphorus-32 in Sulfur Pellets and Hair ........................................... 2.14 2.4.6 Shallow Dose Rate from T-Handle Waste Sample Carriers................................... 2.14 2.5 Skin Contaminations ......................................................................................................... 2.15 2.6 Program-Related Professional Activities .......................................................................... 2.15 2.6.1 Activities ................................................................................................................ 2.15 2.6.2 Presentations........................................................................................................... 2.16 2.6.3 Publications ............................................................................................................ 2.16 2.6.4 Professional Memberships ..................................................................................... 2.16 3.0 Hanford Internal Dosimetry Program........................................................................................ 3.1 3.1 Routine Operations............................................................................................................ 3.1 3.1.1 Bioassay Capabilities ............................................................................................. 3.2 3.1.2 Excreta Bioassay Contract Activities ..................................................................... 3.3 3.1.3 Excreta Bioassay Monitoring Activities................................................................. 3.4 3.1.4 Potential Intake Evaluations................................................................................... 3.9 3.2 Program Changes and Improvements................................................................................ 3.12 3.2.1 Methods and Models Manual Issued...................................................................... 3.12 3.2.2 Changes to the Hanford Internal Dosimetry Program Manual............................... 3.12
xi
3.2.3 Update on New Decision Level for Alpha Spectrometry....................................... 3.12 3.3 Program Assessments........................................................................................................ 3.13 3.3.1 Excreta Quality Control Oversight Program.......................................................... 3.13 3.3.2 Onsite Inspection of the Excreta Contract Laboratory ........................................... 3.14 3.3.3 Testing of Backup Lab for Rapid Plutonium and Strontium Analyses .................. 3.14 3.3.4 Hanford Contractors’ 10 CFR 835 Assessment ..................................................... 3.14 3.3.5 Program Self-Assessments ..................................................................................... 3.15 3.3.6 Quality Problem Reports........................................................................................ 3.15 3.4 Supporting Technical Studies............................................................................................ 3.16 3.4.1 Tritium Absorption Through Skin.......................................................................... 3.16 3.4.2 Investigation of a New Internal Dosimetry Code................................................... 3.16 3.4.3 Review of Historical Records on REX................................................................... 3.17 3.4.4 Bioassay for Hanford Firefighters.......................................................................... 3.17 3.4.5 Review of Draft Basic Ordering Agreement .......................................................... 3.17 3.5 Project-Related Professional Activities............................................................................. 3.17 3.5.1 Activities ................................................................................................................ 3.18 3.5.2 Presentations........................................................................................................... 3.18 3.5.3 Publications ............................................................................................................ 3.18 3.5.4 Professional Memberships and Other Activities .................................................... 3.18 4.0 In Vivo Monitoring Program for Hanford ................................................................................. 4.1 4.1 Routine Operations............................................................................................................ 4.1 4.1.1 Program Documentation ........................................................................................ 4.3
xii
4.1.2 Department of Energy Laboratory Accreditation Program.................................... 4.4 4.1.3 Equipment Maintenance and Repair ...................................................................... 4.5 4.1.4 Facility-Related Activities...................................................................................... 4.6 4.1.5 Historical In Vivo Measurement Records .............................................................. 4.6 4.2 Program Changes and Improvements................................................................................ 4.6 4.3 Program Assessments........................................................................................................ 4.7 4.4 Supporting Technical Studies............................................................................................ 4.7 4.4.1 Thyroid Radioiodine Intercomparison Program..................................................... 4.8 4.4.2 Thoron In-Breath Monitor Study ........................................................................... 4.8 4.4.3 Measurement Quality Control ................................................................................ 4.8 4.4.4 Measurements of Thallium Following Medical Administration ............................ 4.9 4.4.5 241Am/152Eu Lung Phantom and Coincidence Summing........................................ 4.10 4.4.6 Check Source Anomaly.......................................................................................... 4.11 4.5 Program-Related Professional Activities .......................................................................... 4.11 4.5.1 Activities ................................................................................................................ 4.12 4.5.2 Presentations........................................................................................................... 4.12 4.5.3 Publications ............................................................................................................ 4.12 5.0 Hanford Radiation Records Program......................................................................................... 5.1 5.1 Overview ........................................................................................................................... 5.1 5.1.1 Database Administration ........................................................................................ 5.1 5.1.2 Data Processing ...................................................................................................... 5.2 5.1.3 Report Issuance ...................................................................................................... 5.2
xiii
5.1.4 Records Library...................................................................................................... 5.2 5.2 Routine Operations............................................................................................................ 5.3 5.2.1 Data Administration ............................................................................................... 5.3 5.2.2 Data Processing ...................................................................................................... 5.3 5.2.3 Report Issuance ...................................................................................................... 5.4 5.2.4 Records Library...................................................................................................... 5.7 5.3 Program Changes and Improvements................................................................................ 5.7 5.3.1 ACES Database ...................................................................................................... 5.7 5.3.2 REX Database ........................................................................................................ 5.7 5.3.3 Document Scanning ............................................................................................... 5.8 5.4 Program Assessment ......................................................................................................... 5.8 5.5 Supporting Projects ........................................................................................................... 5.8 5.6 Program-Related Professional Activities .......................................................................... 5.9 6.0 Instrumentation Services and Technology Program.................................................................. 6.1 6.1 Routine Operations............................................................................................................ 6.1 6.1.1 Administration of the Portable Instrument Pool..................................................... 6.1 6.1.2 Calibration and Maintenance Service..................................................................... 6.2 6.1.3 Calibration As-Founds Out-of-Tolerance .............................................................. 6.8 6.1.4 Maintenance of the Calibration Records ................................................................ 6.9 6.2 Program Improvements in Calibration and Maintenance Operations ............................... 6.9 6.3 Hanford Instrument Evaluation Committee ...................................................................... 6.9 6.4 Supporting Technical Studies............................................................................................ 6.10
xiv
6.5 Program-Related Professional Activities .......................................................................... 6.10 6.5.1 Presentations........................................................................................................... 6.10 6.5.2 External Professional Activities ............................................................................. 6.10 7.0 Radiation Standards and Calibrations Program......................................................................... 7.1 7.1 Routine Operations............................................................................................................ 7.1 7.1.1 Standards and Capabilities ..................................................................................... 7.1 7.1.2 Traceability to National Standards ......................................................................... 7.8 7.1.3 Quantitative and Qualitative Confirmation of Standards ....................................... 7.13 7.1.4 Applications ........................................................................................................... 7.16 7.2 Operational Improvements................................................................................................ 7.17 7.2.1 Repair/Replacement of X-Ray Systems ................................................................. 7.17 7.3 Program Assessments........................................................................................................ 7.21 7.4 Project-Related Professional Activities............................................................................. 7.22 7.4.1 Presentations........................................................................................................... 7.22 7.4.2 Publications ............................................................................................................ 7.23 7.4.3 External Professional Activities ............................................................................. 7.23 8.0 References ................................................................................................................................. 8.1

xv
Figures 1.1 Management Structure and Major Communication Interfaces for Hanford Radiation Protection Services since October 2000 .................................................................................... 1.2 2.1 Trend in Reported Hanford Personnel Dosimeter Results......................................................... 2.2 2.2 DOELAP Performance Test Results for the HSD Whole Body Dosimeter, Deep Dose........... 2.8 2.3 DOELAP Performance Test Results for the HSD Whole Body Dosimeter, Shallow Dose...... 2.9 2.4 DOELAP Performance Test Results for the HCND Whole Body Dosimeter, Deep Dose ....... 2.9 2.5 DOELAP Performance Test Results for the HCND Whole Body Dosimeter, Shallow Dose... 2.10 2.6 DOELAP Performance Test Results for the Hanford Ring Dosimeter, Shallow Dose ............. 2.10 2.7 DOELAP Performance Test Results for the HSD Wrist Dosimeter, Shallow Dose ................. 2.11 3.1 Standard and Nonstandard Excreta Requests by Month for 2000 ............................................. 3.6 3.2 Routine Urine Measurements Made from 1994 Through 2000................................................. 3.6 3.3 Excreta Samples Not Obtained in the Grace Period .................................................................. 3.8 3.4 Termination Excreta Samples Not Obtained ............................................................................. 3.8 3.5 Number of Open Evaluations by Month.................................................................................... 3.11 4.1 Summary of the Number and Types of In Vivo Measurements Performed from 1991 Through 2000........................................................................................................... 4.3 4.2 Lung Phantom Quality Control Results..................................................................................... 4.9 4.3 201Tl Net Peak Count Rate at 167 keV....................................................................................... 4.9 4.4 202Tl Count Rate Versus Time After Injection........................................................................... 4.10 4.5 Efficiency Calibration Comparison ........................................................................................... 4.11 5.1 Number of Requests for Previous Exposure.............................................................................. 5.5 5.2 Number of Responses to Requests for Previous Exposure........................................................ 5.5 5.3 Number of Visitor Exposure Letters.......................................................................................... 5.6 5.4 Number of Termination Letters ................................................................................................. 5.6 5.5 Number of Documents Scanned/Indexed .................................................................................. 5.6 6.1 Total Number of Calibrations for Hanford Clients During CY 2000........................................ 6.8 7.1 GB650 60Co Irradiator ............................................................................................................... 7.4 7.2 Example Spectrum of X-Ray Configurations............................................................................ 7.5 7.3 Typical Traceability Pathway for PNNL Photon Reference Fields........................................... 7.10 7.4 Typical Traceability Pathway for PNNL Neutron Reference Fields ......................................... 7.11 7.5 Typical Traceability Pathway for PNNL Beta Reference Fields............................................... 7.13 7.6 Reduction in K-Fluorescence Exposure Rates Due to Addition of Primary Filter.................... 7.18 7.7a Effect of Primary Filter on 17.5-keV K-Fluorescence Spectra ................................................. 7.19 7.7b Effect of Primary Filter on 59.3-keV K-Fluorescence Spectra ................................................. 7.19 7.8 Comparison of New and Old 204T1 Source Transmission ......................................................... 7.20
xvi
Tables 2.1 External Whole Body Doses Received by Hanford Workers in 2000....................................... 2.3 2.2 Audit Dosimeters Processed During 2000................................................................................. 2.6 2.3 DOELAP Whole Body Performance Test Data ........................................................................ 2.7 2.4 DOELAP Extremity Dosimeters Shallow-Dose Performance Test Data .................................. 2.8 2.5 Number of Skin Contaminations ............................................................................................... 2.15 3.1 Specified Minimum Detectable Activities and Screening Levels for Routine Excreta Analyses During CY 2000............................................................................................ 3.3 3.2 Minimum Detectable Activities and Screening Levels for Routine In Vivo Measurements During CY 2000 ........................................................................................................................ 3.4 3.3 Specified Minimum Detectable Activities for Emergency and Expedited Excreta Bioassay During CY 2000 ........................................................................................................................ 3.5 3.4 Worker Excreta Measurements Reported in 2000.................................................................... 3.7 3.5 Summary of Potential Intake Incidents During 2000 ................................................................ 3.9 3.6 Summary of Intake Cases Identified Through the Routine Bioassay Program During 2000.... 3.10 3.7 Comparison of Potential Intakes by Reason Code, 1994 to 2000 ............................................. 3.10 3.8 Range of New Internal Doses Assigned to the Hanford Work Force in 2000........................... 3.11 3.9 Changes to the Hanford Internal Dosimetry Program Manual................................................. 3.13 4.1 In Vivo Measurements Performed During 2000 and Entered in the REX Database................. 4.2 4.2 In Vivo Count Summary from 1991 Through 2000 .................................................................. 4.2 4.3 Results from CY 2000 DOELAP Performance Testing ............................................................ 4.4 4.4 Results from the Thyroid Radioiodine Intercomparison Program............................................. 4.8 5.1 Data Processing Center Activity for Calendar Year 2000......................................................... 5.4 5.2 Number of Responses to Requests for Previous Exposure........................................................ 5.4 5.3 Number of Visitor Exposure Letters.......................................................................................... 5.5 6.1 Instrument Calibrations by Unit-Price Category and by Calendar Year ................................... 6.2 6.2 CY 2000 Calibration Volume for All Hanford Contractors ...................................................... 6.3 6.3 CY 2000 Calibration Volume for Fluor Hanford, Inc.. ............................................................. 6.4 6.4 CY 2000 Calibration Volume for CH2M Hill Hanford Group ................................................. 6.5 6.5 CY 2000 Calibration Volume for Bechtel Hanford, Inc............................................................ 6.6 6.6 CY 2000 Calibration Volume for PNNL................................................................................... 6.7 7.1 Available Gamma-Ray Sources (1999) ..................................................................................... 7.2 7.2a. Available NIST-Specified Bremsstrahlung X-Ray Reference Fields (2000) ............................ 7.6 7.2b Available ISO-Specified Bremsstrahlung X-Ray Reference Fields (2000) .............................. 7.7 7.2c Available K-Fluorescence Reference X-Ray Fields (2000) ...................................................... 7.7 7.3 Available Beta Reference Fields (2000).................................................................................... 7.8 7.4 Summary of 2000 Audit Items .................................................................................................. 7.22
1.1
1.0 Introduction Specific radiation protection services are performed routinely by the Pacific Northwest National Laboratory (PNNL)(a) for the U.S. Department of Energy (DOE) Richland Operations Office (RL) and the Hanford Site contractors. These sitewide services are provided by programs in 1) external dosimetry, 2) internal dosimetry, 3) in vivo monitoring, 4) radiation records, 5) instrument calibration and evaluation, and 6) calibration of radiation sources traceable to the National Institute of Science and Technology (NIST). The program work is performed by staff in the Radiation and Health Technology (R&HT) technical group, which falls under the purview of the Environmental Technology Division. The R&HT group was transferred from the Process Technology organization to Systems and Risk Analysis organization on October 1, 2000. R&HT is organized into five functional groups: 1) Dosimetry Services, 2) Instrumentation Services and Technology, 3) Radiation Records, 4) Administration, and 5) Dosimetry Research and Technology. The Dosimetry Services group includes the Hanford External Dosimetry Program, the Hanford Internal Dosimetry Program, and the In Vivo Monitoring Program, which includes the operational and technical staff at the In Vivo Radioassay and Research Facility; and the Dosimetry Operations Program, which includes all of the Dosimetry Services technician staff that perform the processing of dosimeters, handling of dosimeters, and bioassay scheduling for Fluor Hanford, Inc. (FH) and RL, and Radiological Exposure (REX) data processing (which was transferred from the Hanford Radiological Records Program). The Instrumentation Services and Technology group includes four programs: Radiological Calibration Services, Non-Radiological Calibration Services, Instrument Repair, and Instrument Testing and Qualification. The Hanford Radiation Records Program includes the Records Library, Exposure Reporting, and Data Administration tasks. Information Services policy and planning for R&HT are assigned to a staff position reporting directly to the R&HT manager. The Administration group is responsible for financial planning and secretarial support. Although some of the programs described in this report are involved in activities funded by other sources, only those activities funded by RL, DOE-Headquarters (HQ), or the Hanford contractors are addressed here. Services provided for non-RL activities are performed only to the extent that they do not adversely affect services to DOE and its contractors. These non-RL services provide funds that support the overall program and reduce costs to RL and to the Hanford contractors. Each of the six primary programs of R&HT is described in a separate chapter of this report: 1) the Hanford External Dosimetry Program, 2) the Hanford Internal Dosimetry Program, 3) the In Vivo Monitoring Program, 4) the Hanford Radiation Records Program, 5) the Hanford Instrumentation Services and Technology Program, and 6) the Hanford Radiation Standards and Calibrations Program. Program descriptions include: • the routine operations (a) Pacific Northwest National Laboratory is operated by Battelle Memorial Institute for the
U.S. Department of Energy under Contract DE-AC06-76RL01830.
1.2
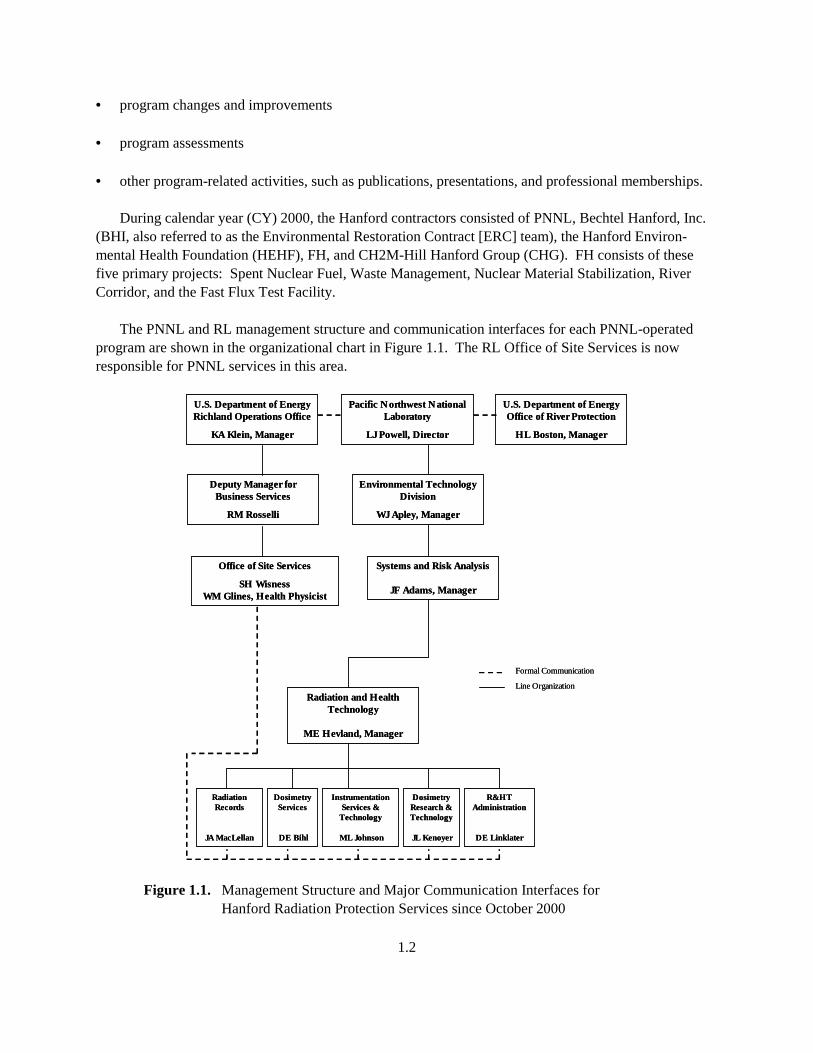
• program changes and improvements • program assessments • other program-related activities, such as publications, presentations, and professional memberships. During calendar year (CY) 2000, the Hanford contractors consisted of PNNL, Bechtel Hanford, Inc. (BHI, also referred to as the Environmental Restoration Contract [ERC] team), the Hanford Environ-mental Health Foundation (HEHF), FH, and CH2M-Hill Hanford Group (CHG). FH consists of these five primary projects: Spent Nuclear Fuel, Waste Management, Nuclear Material Stabilization, River Corridor, and the Fast Flux Test Facility. The PNNL and RL management structure and communication interfaces for each PNNL-operated program are shown in the organizational chart in Figure 1.1. The RL Office of Site Services is now responsible for PNNL services in this area.
U.S. Department of Energy Richland Operations Office
KA Klein, Manager
Deputy Manager for Business Services
RM Rosselli
Office of Site Services
SH WisnessWM Glines, Health Physicist
Pacific Northwest National Laboratory
LJ Powell, Director
Environmental Technology Division
WJ Apley, Manager
Systems and Risk Analysis
JF Adams, Manager
Radiation and Health Technology
ME Hevland, Manager
Radiation Records
JA MacLellan
Dosimetry Services
DE Bihl
Instrumentation Services &
Technology
ML Johnson
Dosimetry Research & Technology
JL Kenoyer
R&HT Administration
DE Linklater
Formal Communication
Line Organization
U.S. Department of EnergyOffice of River Protection
HL Boston, Manager
Figure 1.1. Management Structure and Major Communication Interfaces for
Hanford Radiation Protection Services since October 2000
2.1
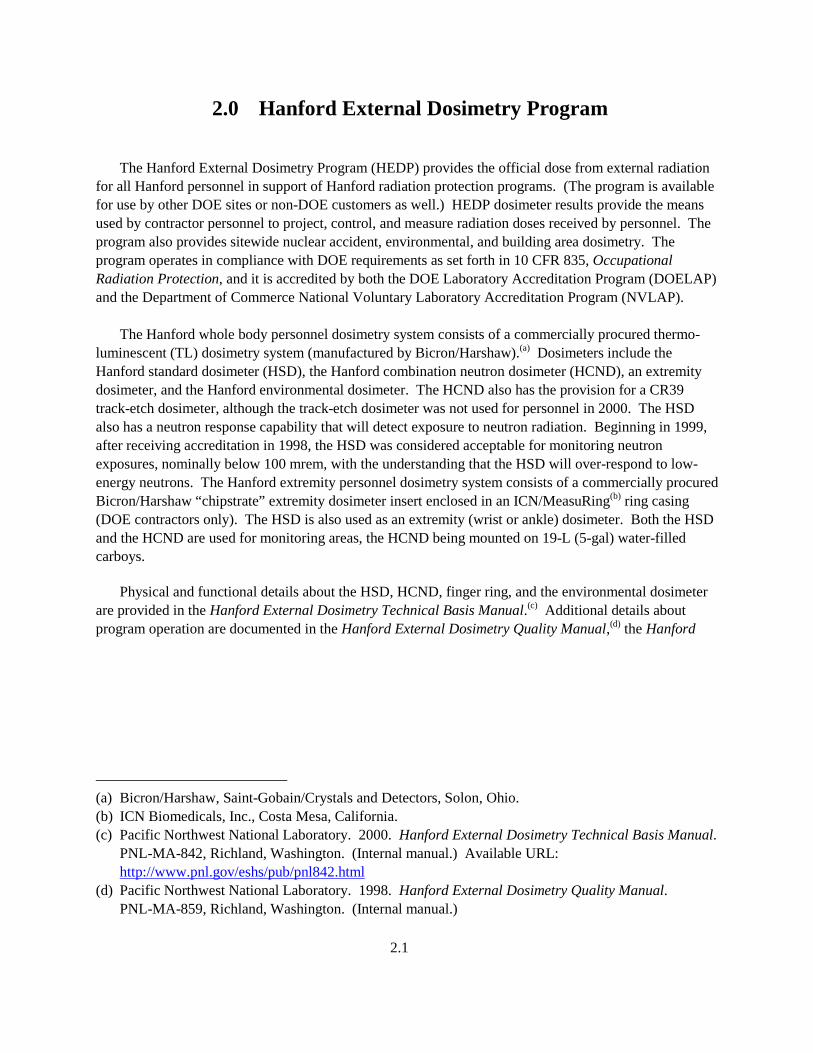
2.0 Hanford External Dosimetry Program The Hanford External Dosimetry Program (HEDP) provides the official dose from external radiation for all Hanford personnel in support of Hanford radiation protection programs. (The program is available for use by other DOE sites or non-DOE customers as well.) HEDP dosimeter results provide the means used by contractor personnel to project, control, and measure radiation doses received by personnel. The program also provides sitewide nuclear accident, environmental, and building area dosimetry. The program operates in compliance with DOE requirements as set forth in 10 CFR 835, Occupational Radiation Protection, and it is accredited by both the DOE Laboratory Accreditation Program (DOELAP) and the Department of Commerce National Voluntary Laboratory Accreditation Program (NVLAP). The Hanford whole body personnel dosimetry system consists of a commercially procured thermo-luminescent (TL) dosimetry system (manufactured by Bicron/Harshaw).(a) Dosimeters include the Hanford standard dosimeter (HSD), the Hanford combination neutron dosimeter (HCND), an extremity dosimeter, and the Hanford environmental dosimeter. The HCND also has the provision for a CR39 track-etch dosimeter, although the track-etch dosimeter was not used for personnel in 2000. The HSD also has a neutron response capability that will detect exposure to neutron radiation. Beginning in 1999, after receiving accreditation in 1998, the HSD was considered acceptable for monitoring neutron exposures, nominally below 100 mrem, with the understanding that the HSD will over-respond to low-energy neutrons. The Hanford extremity personnel dosimetry system consists of a commercially procured Bicron/Harshaw “chipstrate” extremity dosimeter insert enclosed in an ICN/MeasuRing(b) ring casing (DOE contractors only). The HSD is also used as an extremity (wrist or ankle) dosimeter. Both the HSD and the HCND are used for monitoring areas, the HCND being mounted on 19-L (5-gal) water-filled carboys. Physical and functional details about the HSD, HCND, finger ring, and the environmental dosimeter are provided in the Hanford External Dosimetry Technical Basis Manual.(c) Additional details about program operation are documented in the Hanford External Dosimetry Quality Manual,(d) the Hanford
(a) Bicron/Harshaw, Saint-Gobain/Crystals and Detectors, Solon, Ohio. (b) ICN Biomedicals, Inc., Costa Mesa, California. (c) Pacific Northwest National Laboratory. 2000. Hanford External Dosimetry Technical Basis Manual.
PNL-MA-842, Richland, Washington. (Internal manual.) Available URL: http://www.pnl.gov/eshs/pub/pnl842.html
(d) Pacific Northwest National Laboratory. 1998. Hanford External Dosimetry Quality Manual. PNL-MA-859, Richland, Washington. (Internal manual.)
2.2
External Dosimetry Project Procedures Manual,(a) the Quality Assurance Plan for Hanford External Dosimetry,(b) and the Hanford External Dosimetry Program Data Management Manual.(c)
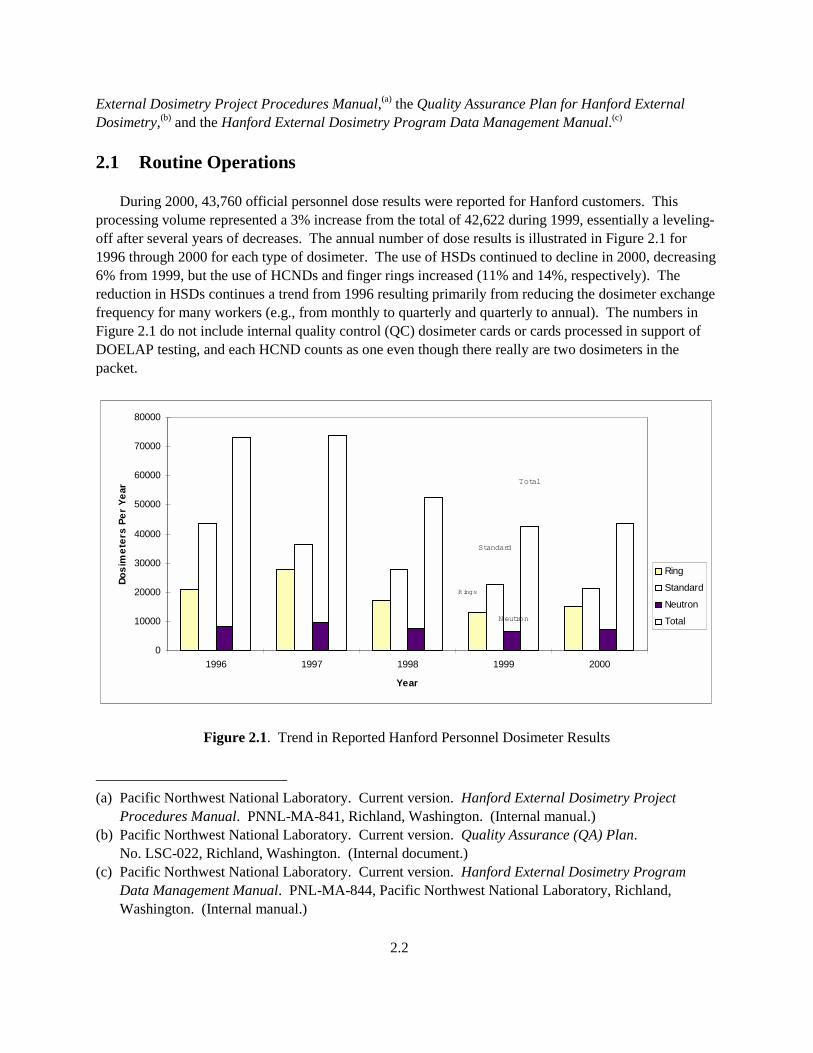
2.1 Routine Operations During 2000, 43,760 official personnel dose results were reported for Hanford customers. This processing volume represented a 3% increase from the total of 42,622 during 1999, essentially a leveling-off after several years of decreases. The annual number of dose results is illustrated in Figure 2.1 for 1996 through 2000 for each type of dosimeter. The use of HSDs continued to decline in 2000, decreasing 6% from 1999, but the use of HCNDs and finger rings increased (11% and 14%, respectively). The reduction in HSDs continues a trend from 1996 resulting primarily from reducing the dosimeter exchange frequency for many workers (e.g., from monthly to quarterly and quarterly to annual). The numbers in Figure 2.1 do not include internal quality control (QC) dosimeter cards or cards processed in support of DOELAP testing, and each HCND counts as one even though there really are two dosimeters in the packet.
0
10000
20000
30000
40000
50000
60000
70000
80000
1996 1997 1998 1999 2000
Year
Dosi
met
ers
Per
Year
Ring
Standard
Neutron
Total
Rings
Standard
Total
Neutron
Figure 2.1. Trend in Reported Hanford Personnel Dosimeter Results (a) Pacific Northwest National Laboratory. Current version. Hanford External Dosimetry Project
Procedures Manual. PNNL-MA-841, Richland, Washington. (Internal manual.) (b) Pacific Northwest National Laboratory. Current version. Quality Assurance (QA) Plan.
No. LSC-022, Richland, Washington. (Internal document.) (c) Pacific Northwest National Laboratory. Current version. Hanford External Dosimetry Program
Data Management Manual. PNL-MA-844, Pacific Northwest National Laboratory, Richland, Washington. (Internal manual.)
2.3
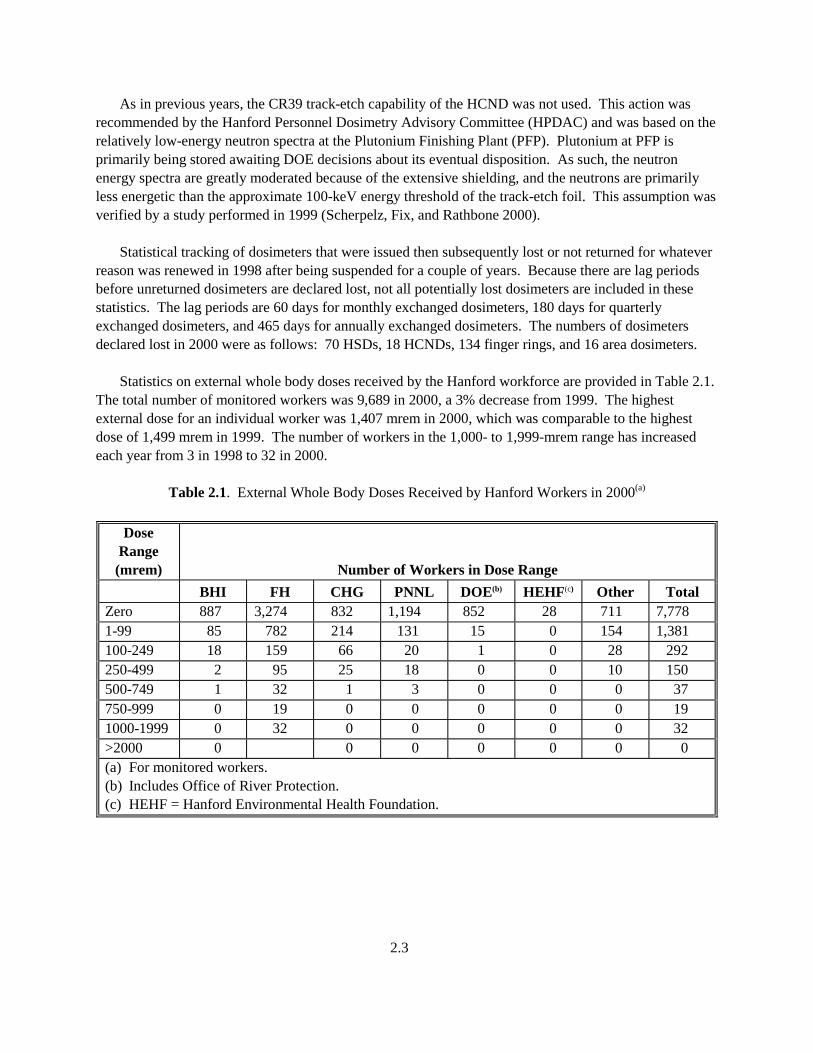
As in previous years, the CR39 track-etch capability of the HCND was not used. This action was recommended by the Hanford Personnel Dosimetry Advisory Committee (HPDAC) and was based on the relatively low-energy neutron spectra at the Plutonium Finishing Plant (PFP). Plutonium at PFP is primarily being stored awaiting DOE decisions about its eventual disposition. As such, the neutron energy spectra are greatly moderated because of the extensive shielding, and the neutrons are primarily less energetic than the approximate 100-keV energy threshold of the track-etch foil. This assumption was verified by a study performed in 1999 (Scherpelz, Fix, and Rathbone 2000). Statistical tracking of dosimeters that were issued then subsequently lost or not returned for whatever reason was renewed in 1998 after being suspended for a couple of years. Because there are lag periods before unreturned dosimeters are declared lost, not all potentially lost dosimeters are included in these statistics. The lag periods are 60 days for monthly exchanged dosimeters, 180 days for quarterly exchanged dosimeters, and 465 days for annually exchanged dosimeters. The numbers of dosimeters declared lost in 2000 were as follows: 70 HSDs, 18 HCNDs, 134 finger rings, and 16 area dosimeters. Statistics on external whole body doses received by the Hanford workforce are provided in Table 2.1. The total number of monitored workers was 9,689 in 2000, a 3% decrease from 1999. The highest external dose for an individual worker was 1,407 mrem in 2000, which was comparable to the highest dose of 1,499 mrem in 1999. The number of workers in the 1,000- to 1,999-mrem range has increased each year from 3 in 1998 to 32 in 2000.
Table 2.1. External Whole Body Doses Received by Hanford Workers in 2000(a)
Dose
Range (mrem) Number of Workers in Dose Range
BHI FH CHG PNNL DOE(b) HEHF(c) Other Total Zero 887 3,274 832 1,194 852 28 711 7,778 1-99 85 782 214 131 15 0 154 1,381 100-249 18 159 66 20 1 0 28 292 250-499 2 95 25 18 0 0 10 150 500-749 1 32 1 3 0 0 0 37 750-999 0 19 0 0 0 0 0 19 1000-1999 0 32 0 0 0 0 0 32 >2000 0 0 0 0 0 0 0 (a) For monitored workers. (b) Includes Office of River Protection. (c) HEHF = Hanford Environmental Health Foundation.
2.4
There were 606 Investigation of Dosimeter Results (IODRs) processed related to doses incurred in 2000 (DOE—22, FH—414, CHG—79, BHI—69, and PNNL 22). In addition to personnel dosimeters, the HEDP also processed 1,629 area dosimeters, 880 environ-mental dosimeters, and 86 fixed nuclear accident dosimeters. The number of environmental dosimeters increased slightly compared with 1999, but the numbers of area and fixed nuclear accident dosimeters decreased slightly from 1999 and were comparable to the numbers in 1998. 2.2 Program Changes and Improvements Major modifications to HEDP practices are discussed during HPDAC meetings. Six changes in program practices were made during 2000, as described in the following sections. 2.2.1 Tracking Status of Dosimeters in Process Three codes were written to assess the status of dosimeters in process. Returned_Not_Scanned_In identifies dosimeters that have been returned in REX but have no record in our internal tracking file (with a grace period of 5 days). Scanned_In_Not_Processed identifies dosimeters scanned into our lab for which reader data have not been processed through completion of dose results on the VAX (with a grace period of 10 days from scan-in date). Processed_Not_Reported finds records in the dose file that have not been transferred to REX (with a grace period of 15 days from scan-in date). These codes are run and the output reports are reviewed weekly. 2.2.2 Improvement in Documentation of Dose Adjustments When the thermoluminescent dosimeter (TLD) reader detects something anomalous with a glow curve (e.g., shifted, poorly shaped), the glow curve is flagged and requires review by a dosimetrist. To mark hard copies of flagged glow curves, a series of standardized notations was developed to indicate what the problem was and what method the dosimetrist used to adjust the dose from the reader-calculated value. The notations provide a consistent methodology for adjusting doses and for ease of recognition as to what method was used for each adjustment. The methodology and notations were documented in a letter to file(a) and dosimetrists were trained on their use. 2.2.3 Incorrect Tin Filter Thickness in HSD Holders In 1999, the manufacturer of the HSD holder notified HEDP that most holders sold since 1996 probably have tin filters that are 19-mil (0.48-mm) thick instead of being 25-mil (0.635-mm) thick, as specified. As reported in last year’s report (Lynch et al. 2000, Section 2.2.5), X-ray and beta + X-ray irradiation tests were conducted on dosimeter holders that contained the thinner tin. The X-ray tests were evaluated in 1999, and the bias in dose results from the X-rays caused by the thin filters was shown to be
(a) Internal letter to file, Scott E. Huneycutt, January 31, 2000, “Glow Curve Adjustment Methodology.”
2.5
inconsequential. The results of the beta + X-ray irradiation study were evaluated in 2000,(a) and, as expected, the bias increased for the 19-mil tin relative to the 25-mil tin; however, the dosimeters met the DOELAP criteria, and the change in bias was not considered significant. Nevertheless, a plan was implemented to remove from service over time all the holders with the 19-mil tin filters. The goal was to have no thin-tin filters in use in 2001, i.e., all dosimeter holders to be issued for use in 2001 had to be tested and the thin-tin filters removed. Complications in carrying out the plan arose when lead contamination was discovered in the tin filters, which interfered with the eddy current testing of the tin (see Section 2.4.2). However, this was overcome late in the year and the goal was met. Tested and accepted holders are now permanently marked and are also tracked in the external dosimetry database. 2.2.4 New 8816 Algorithm for Plutonium Finishing Plant Neutrons Proposed A proposal to upgrade the algorithm applied to HCNDs used at the PFP was presented to the HPDAC in December. The proposed algorithm was developed from the neutron measurements taken at the plant in 1999 where side-by-side neutron dose measurements were obtained with HCNDs and tissue-equivalent proportional counters (Scherlpelz, Fix, and Rathbone 2000). In developing the algorithm, it was determined that there was a trade-off between obtaining an accurate response for a variety of exposure conditions that workers might encounter at the plant and reducing the variability of response between dosimeters used in similar exposure conditions. The proposed algorithm will reduce the variability in the dosimeter readings to a composite of likely exposure conditions. The proposal was under consideration by the HPDAC at year-end. 2.2.5 Deep Dose in HSDs From Beta-Radiation-Only Fields To confirm initial indications from workplace surveys, a study was conducted to show that the HSD algorithm calculates a deep dose at about 1 to 1.5% of the shallow dose when subjected to pure beta radiation from 90Y, whereas the true deep dose for practical purposes is zero. The study concluded that the over-response of the HSD is due to the curvature of the plastic bubble over the deep dose chip. The curvature effectively reduces the density thickness of the material overlying the chip. Algorithm changes to correct for the over-response were being drafted at year-end. 2.2.6 Effects of the Millennium Transition Preparations conducted in the years prior to January 1, 2000, were sufficient in that there were only minor effects from the date change. The VAX cluster did have trouble restarting because of a dead battery on the disk array and two other small pieces of hardware failed to restart. These effects may have resulted more from shutting down the system for several days than from the date change. By DOE directive, constraints in place for making software changes continued until early March because of the unusual leap year. (a) Internal letter to file, Scott E. Huneycutt, September 7, 2000, “Impact of 19-mil Tin Filter on HSD
Beta Response.”
2.6
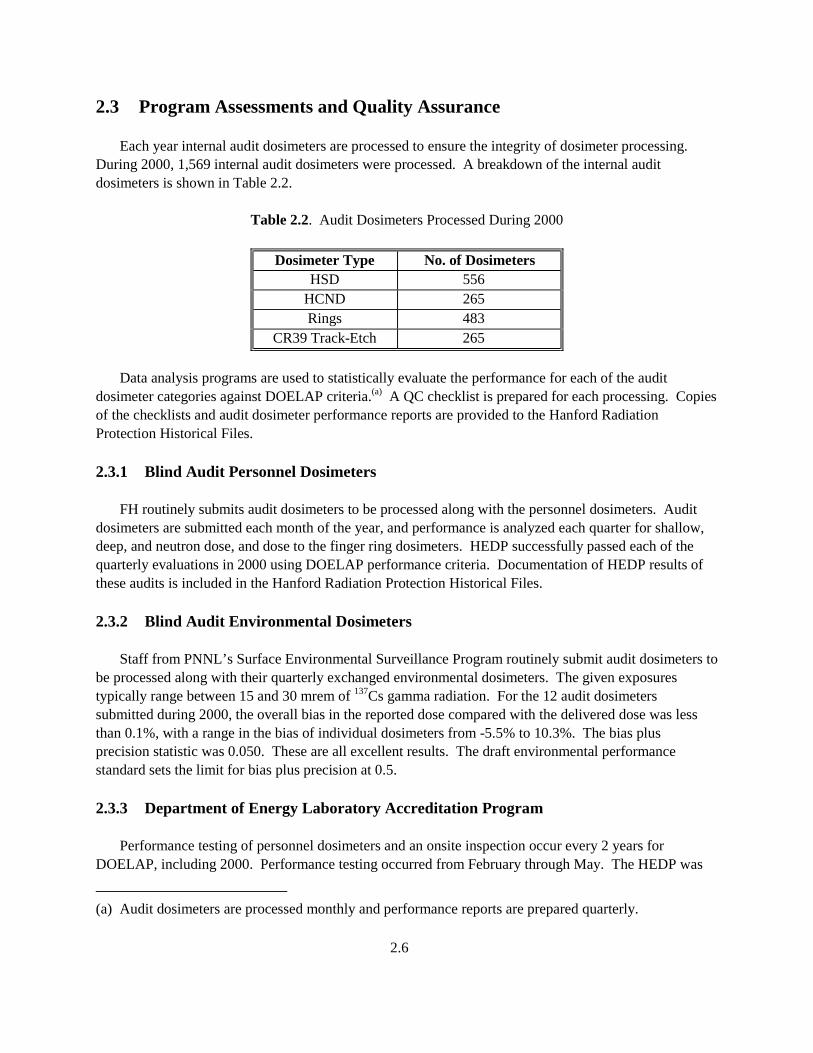
2.3 Program Assessments and Quality Assurance Each year internal audit dosimeters are processed to ensure the integrity of dosimeter processing. During 2000, 1,569 internal audit dosimeters were processed. A breakdown of the internal audit dosimeters is shown in Table 2.2.
Table 2.2. Audit Dosimeters Processed During 2000
Dosimeter Type No. of Dosimeters HSD 556
HCND 265 Rings 483
CR39 Track-Etch 265 Data analysis programs are used to statistically evaluate the performance for each of the audit dosimeter categories against DOELAP criteria.(a) A QC checklist is prepared for each processing. Copies of the checklists and audit dosimeter performance reports are provided to the Hanford Radiation Protection Historical Files. 2.3.1 Blind Audit Personnel Dosimeters FH routinely submits audit dosimeters to be processed along with the personnel dosimeters. Audit dosimeters are submitted each month of the year, and performance is analyzed each quarter for shallow, deep, and neutron dose, and dose to the finger ring dosimeters. HEDP successfully passed each of the quarterly evaluations in 2000 using DOELAP performance criteria. Documentation of HEDP results of these audits is included in the Hanford Radiation Protection Historical Files. 2.3.2 Blind Audit Environmental Dosimeters Staff from PNNL’s Surface Environmental Surveillance Program routinely submit audit dosimeters to be processed along with their quarterly exchanged environmental dosimeters. The given exposures typically range between 15 and 30 mrem of 137Cs gamma radiation. For the 12 audit dosimeters submitted during 2000, the overall bias in the reported dose compared with the delivered dose was less than 0.1%, with a range in the bias of individual dosimeters from -5.5% to 10.3%. The bias plus precision statistic was 0.050. These are all excellent results. The draft environmental performance standard sets the limit for bias plus precision at 0.5. 2.3.3 Department of Energy Laboratory Accreditation Program Performance testing of personnel dosimeters and an onsite inspection occur every 2 years for DOELAP, including 2000. Performance testing occurred from February through May. The HEDP was
(a) Audit dosimeters are processed monthly and performance reports are prepared quarterly.
2.7
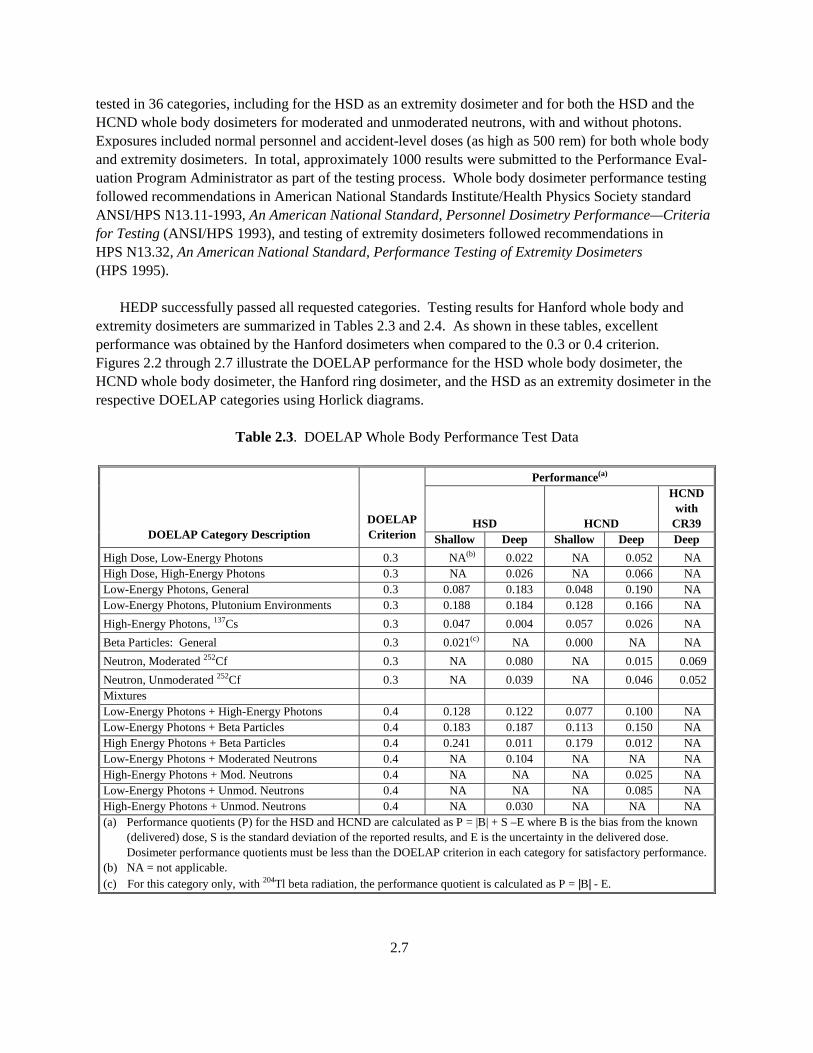
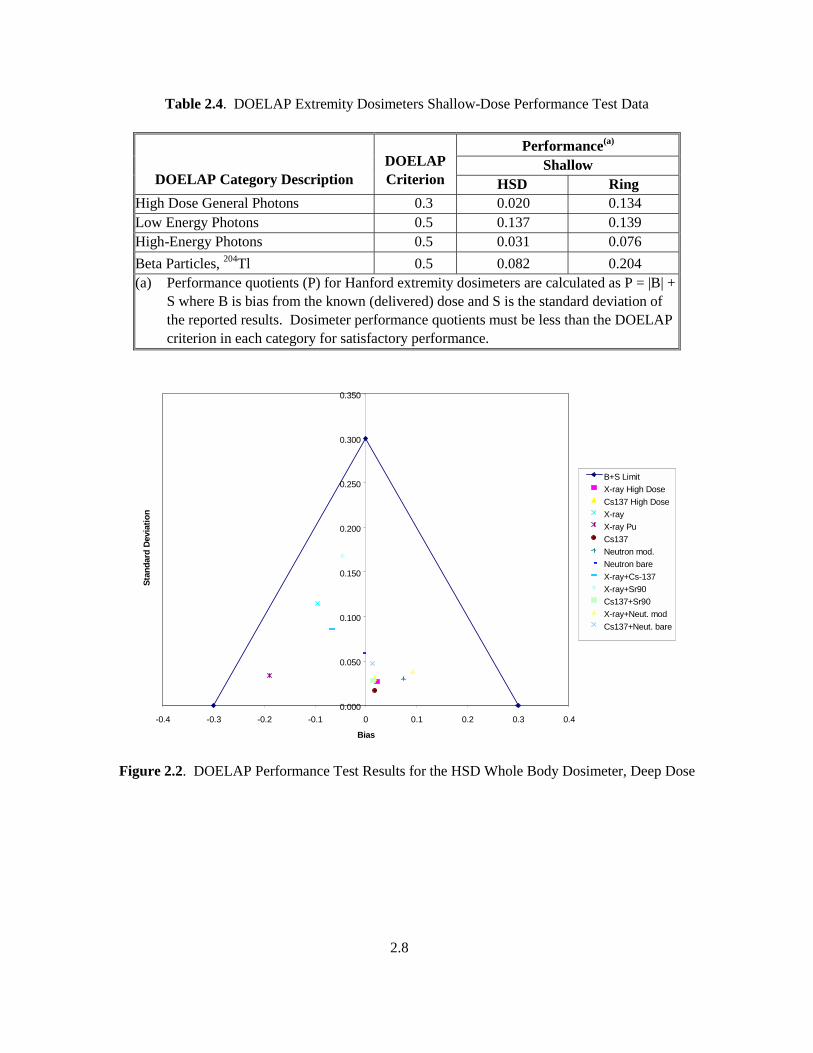
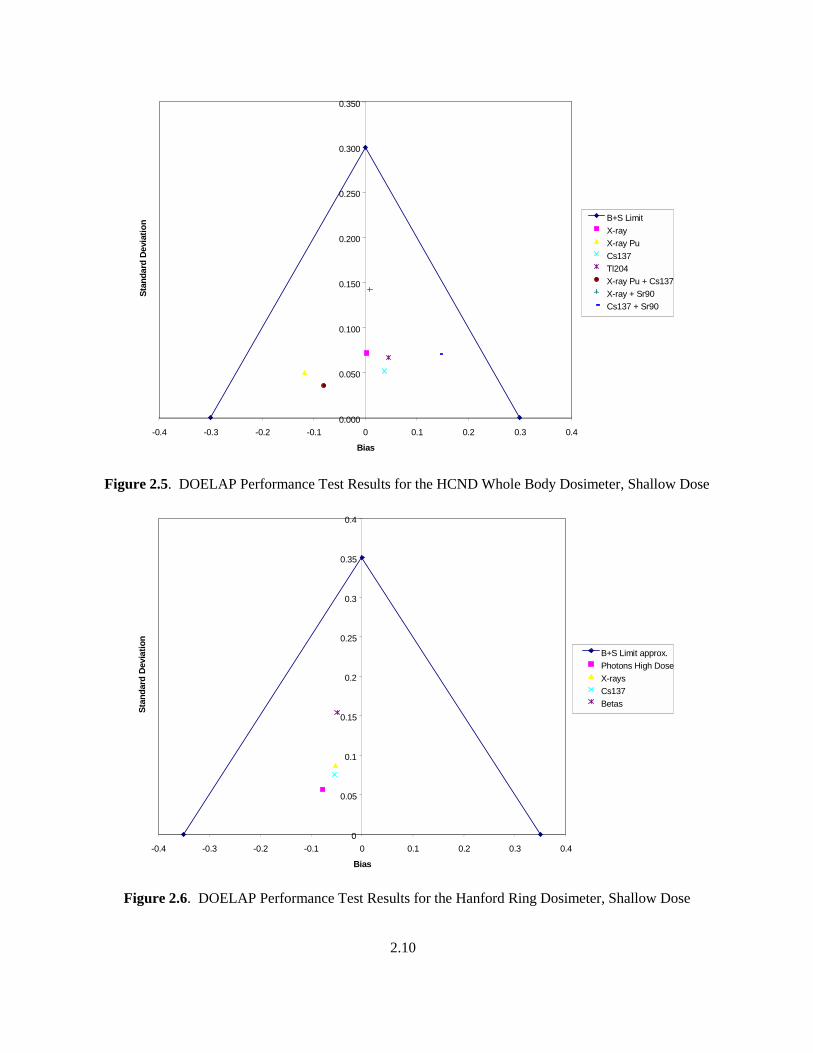
tested in 36 categories, including for the HSD as an extremity dosimeter and for both the HSD and the HCND whole body dosimeters for moderated and unmoderated neutrons, with and without photons. Exposures included normal personnel and accident-level doses (as high as 500 rem) for both whole body and extremity dosimeters. In total, approximately 1000 results were submitted to the Performance Eval-uation Program Administrator as part of the testing process. Whole body dosimeter performance testing followed recommendations in American National Standards Institute/Health Physics Society standard ANSI/HPS N13.11-1993, An American National Standard, Personnel Dosimetry Performance—Criteria for Testing (ANSI/HPS 1993), and testing of extremity dosimeters followed recommendations in HPS N13.32, An American National Standard, Performance Testing of Extremity Dosimeters (HPS 1995). HEDP successfully passed all requested categories. Testing results for Hanford whole body and extremity dosimeters are summarized in Tables 2.3 and 2.4. As shown in these tables, excellent performance was obtained by the Hanford dosimeters when compared to the 0.3 or 0.4 criterion. Figures 2.2 through 2.7 illustrate the DOELAP performance for the HSD whole body dosimeter, the HCND whole body dosimeter, the Hanford ring dosimeter, and the HSD as an extremity dosimeter in the respective DOELAP categories using Horlick diagrams.
Table 2.3. DOELAP Whole Body Performance Test Data
Performance(a)
HSD HCND
HCND with
CR39 DOELAP Category Description
DOELAP Criterion Shallow Deep Shallow Deep Deep
High Dose, Low-Energy Photons 0.3 NA(b) 0.022 NA 0.052 NA High Dose, High-Energy Photons 0.3 NA 0.026 NA 0.066 NA Low-Energy Photons, General 0.3 0.087 0.183 0.048 0.190 NA Low-Energy Photons, Plutonium Environments 0.3 0.188 0.184 0.128 0.166 NA High-Energy Photons, 137Cs 0.3 0.047 0.004 0.057 0.026 NA Beta Particles: General 0.3 0.021(c) NA 0.000 NA NA Neutron, Moderated 252Cf 0.3 NA 0.080 NA 0.015 0.069 Neutron, Unmoderated 252Cf 0.3 NA 0.039 NA 0.046 0.052 Mixtures Low-Energy Photons + High-Energy Photons 0.4 0.128 0.122 0.077 0.100 NA Low-Energy Photons + Beta Particles 0.4 0.183 0.187 0.113 0.150 NA High Energy Photons + Beta Particles 0.4 0.241 0.011 0.179 0.012 NA Low-Energy Photons + Moderated Neutrons 0.4 NA 0.104 NA NA NA High-Energy Photons + Mod. Neutrons 0.4 NA NA NA 0.025 NA Low-Energy Photons + Unmod. Neutrons 0.4 NA NA NA 0.085 NA High-Energy Photons + Unmod. Neutrons 0.4 NA 0.030 NA NA NA (a) Performance quotients (P) for the HSD and HCND are calculated as P = |B| + S –E where B is the bias from the known
(delivered) dose, S is the standard deviation of the reported results, and E is the uncertainty in the delivered dose. Dosimeter performance quotients must be less than the DOELAP criterion in each category for satisfactory performance.
(b) NA = not applicable. (c) For this category only, with 204Tl beta radiation, the performance quotient is calculated as P = |B| - E.
2.8
Table 2.4. DOELAP Extremity Dosimeters Shallow-Dose Performance Test Data
Performance(a) Shallow
DOELAP Category Description DOELAP Criterion HSD Ring
High Dose General Photons 0.3 0.020 0.134 Low Energy Photons 0.5 0.137 0.139 High-Energy Photons 0.5 0.031 0.076 Beta Particles, 204Tl 0.5 0.082 0.204 (a) Performance quotients (P) for Hanford extremity dosimeters are calculated as P = |B| +
S where B is bias from the known (delivered) dose and S is the standard deviation of the reported results. Dosimeter performance quotients must be less than the DOELAP criterion in each category for satisfactory performance.
0.000
0.050
0.100
0.150
0.200
0.250
0.300
0.350
-0.4 -0.3 -0.2 -0.1 0 0.1 0.2 0.3 0.4 Bias
Stan
dard
Dev
iatio
n
B+S Limit X-ray High Dose Cs137 High Dose X-ray X-ray Pu Cs137 Neutron mod. Neutron bare X-ray+Cs-137 X-ray+Sr90 Cs137+Sr90 X-ray+Neut. mod Cs137+Neut. bare
Figure 2.2. DOELAP Performance Test Results for the HSD Whole Body Dosimeter, Deep Dose

2.9
0.000
0.050
0.100
0.150
0.200
0.250
0.300
0.350
-0.4 -0.3 -0.2 -0.1 0 0.1 0.2 0.3 0.4 Bias
Stan
dard
Dev
iatio
n B+S Limit
X-ray Low-energy Pu Cs137 Sr90 X-ray + Cs137 X-ray + Sr90 Cs137 + Sr90
Figure 2.3. DOELAP Performance Test Results for the HSD Whole Body Dosimeter, Shallow Dose
0.000
0.050
0.100
0.150
0.200
0.250
0.300
0.350
-0.4 -0.3 -0.2 -0.1 0 0.1 0.2 0.3 0.4 Bias
Stan
dard
Dev
iatio
n
B+S Limit X-ray High Dose Cs137 High Dose X-ray X-ray Pu Cs137 Neutron mod. Neutron bare X-ray Pu + Cs137 X-ray + Sr90 Cs137 + Sr90 X-ray Pu + Neut. bare Cs137 + Neut. mod
Figure 2.4. DOELAP Performance Test Results for the HCND Whole Body Dosimeter, Deep Dose
2.10
0.000
0.050
0.100
0.150
0.200
0.250
0.300
0.350
-0.4 -0.3 -0.2 -0.1 0 0.1 0.2 0.3 0.4 Bias
Stan
dard
Dev
iatio
n B+S Limit
X-ray X-ray Pu Cs137 Tl204 X-ray Pu + Cs137 X-ray + Sr90 Cs137 + Sr90
Figure 2.5. DOELAP Performance Test Results for the HCND Whole Body Dosimeter, Shallow Dose
0
0.05
0.1
0.15
0.2
0.25
0.3
0.35
0.4
-0.4 -0.3 -0.2 -0.1 0 0.1 0.2 0.3 0.4 Bias
Stan
dard
Dev
iatio
n
B+S Limit approx. Photons High Dose X-rays Cs137 Betas
Figure 2.6. DOELAP Performance Test Results for the Hanford Ring Dosimeter, Shallow Dose
2.11
0
0.05
0.1
0.15
0.2
0.25
0.3
0.35
0.4
-0.4 -0.3 -0.2 -0.1 0 0.1 0.2 0.3 0.4 Bias
Stan
dard
Dev
iatio
n
Photons High Dose X-rays Cs137 Betas B+S Limit approx.
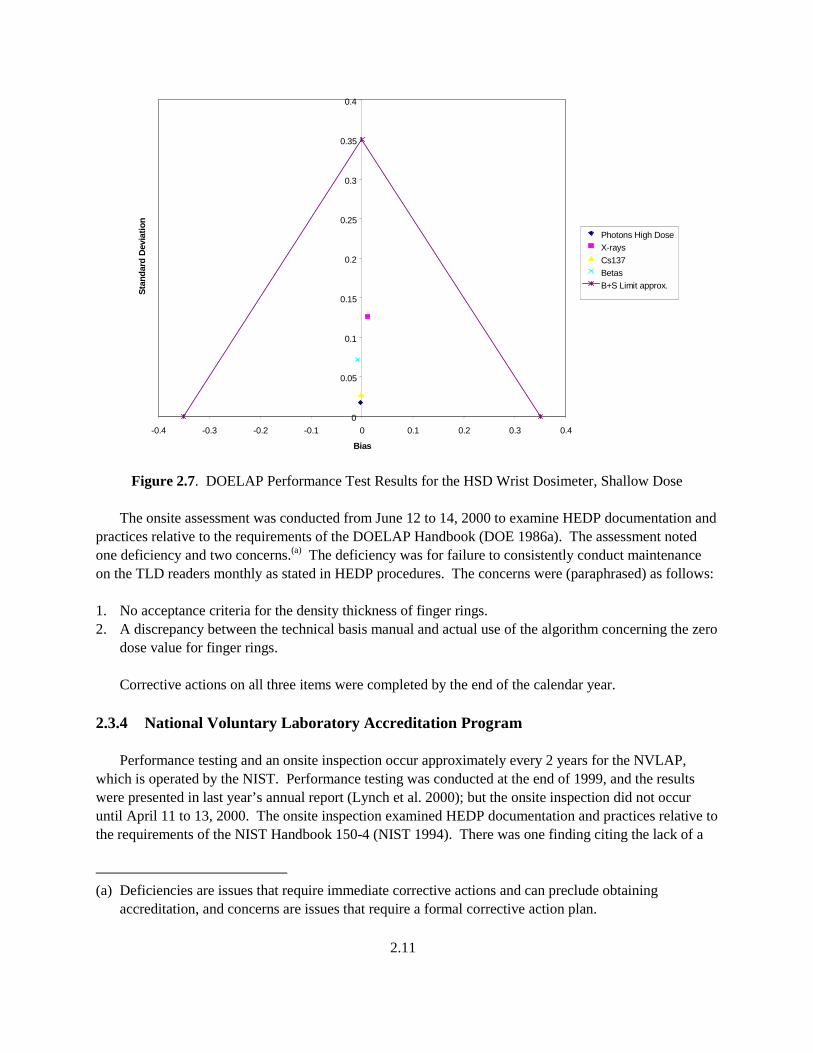
Figure 2.7. DOELAP Performance Test Results for the HSD Wrist Dosimeter, Shallow Dose The onsite assessment was conducted from June 12 to 14, 2000 to examine HEDP documentation and practices relative to the requirements of the DOELAP Handbook (DOE 1986a). The assessment noted one deficiency and two concerns.(a) The deficiency was for failure to consistently conduct maintenance on the TLD readers monthly as stated in HEDP procedures. The concerns were (paraphrased) as follows: 1. No acceptance criteria for the density thickness of finger rings. 2. A discrepancy between the technical basis manual and actual use of the algorithm concerning the zero
dose value for finger rings. Corrective actions on all three items were completed by the end of the calendar year. 2.3.4 National Voluntary Laboratory Accreditation Program Performance testing and an onsite inspection occur approximately every 2 years for the NVLAP, which is operated by the NIST. Performance testing was conducted at the end of 1999, and the results were presented in last year’s annual report (Lynch et al. 2000); but the onsite inspection did not occur until April 11 to 13, 2000. The onsite inspection examined HEDP documentation and practices relative to the requirements of the NIST Handbook 150-4 (NIST 1994). There was one finding citing the lack of a
(a) Deficiencies are issues that require immediate corrective actions and can preclude obtaining
accreditation, and concerns are issues that require a formal corrective action plan.
2.12
procedure for redetermining the element correction coefficient for chipstrate TLDs (in finger rings). (The need for the procedure in our program had not occurred yet.) That procedure was written by July, and accreditation was granted in September. 2.3.5 Energy Northwest Assessment From February 9 to 11, Energy Northwest, for which HEDP processes environmental dosimeters, audited our dosimetry practices against ANSI N545 (ANSI 1975), various Nuclear Regulatory Commission regulatory guides, and our own Quality Assurance (QA) Plan, technical basis manual, and procedures. No findings required a response; a few recommendations were quickly and easily implemented. 2.3.6 Self-Assessments Self- (or internal) assessments of the HEDP are conducted annually. The 2000 self-assessment was conducted in May and focused on the status of corrective actions from previous assessments by various groups in preparation for the DOELAP onsite assessment (see Section 2.3.3). In addition, the DOELAP deficiency mentioned in Section 2.3.3 was presented to PNNL’s Price Anderson Act Amendment (PAAA) Working Group. The Working Group concluded that the deficiency constituted a reportable event and requested that a root cause analysis of the program be performed as part of the corrective actions. That root cause analysis was conducted in August and September, and it resulted in the following additional corrective actions:
• implementation of a schedule for periodic (at least four per year) surveillances by the program’s quality engineer
• improvements in the process for changing procedures
• a review of all procedures to enhance tracking methods for steps that have definitive time constraints
• discussion among procedure authors concerning overspecifying steps in procedures that unnecessarily
inhibit flexibility. 2.3.7 Environmental Dosimeter Intercomparison HEDP participated in the 12th international environmental dosimeter intercomparison hosted by the Environmental Measurements Laboratory. At year-end, HEDP had analyzed the test dosimeters, but results of the intercomparison were still pending from the Environmental Measurements Laboratory. 2.4 Supporting Technical Studies Seven technical studies or tasks were undertaken during 2000, as described in the following sections.
2.13
2.4.1 New External Dosimetry Code HEDP began work on a new code that will operate on the Sun Enterprise computer that houses REX. The code, given the moniker Edipus, will be an Oracle relational database that will replace the series of codes presently operating on the VAX cluster. In 2000, the entity-relationship diagram was developed and work started on the coding. 2.4.2 Evaluation of Lead Impurity in Tin Filters in the 8825 Holders As part of special testing of tin filters over TLD chip 4 in the 8825 holders (see Section 2.2.5), lead impurity was discovered in some tin filters. Additional testing indicated that lead was present in about 90% of the tin filters ranging from 2 to 4% (weight %). DOELAP and NVLAP test dosimeters were found to have essentially the same makeup of lead contamination as worker dosimeters so all DOELAP and NVLAP performance testing over the years was considered valid for the entire stock of holders. Irradiation tests on leaded versus unleaded filters for photons from 17 to 662 keV indicated that there are essentially no differences in doses calculated with the two groups. Therefore, a decision was made to not remove leaded filters from service. 2.4.3 Uncertainty Analyses Analyses of overall uncertainty in the processing (in general, not of individual dosimeters) were conducted over the last 2 years for the 8825, 8816, CR39, and finger ring dosimeters. Uncertainties, at the 95% confidence level, for the 8825 HSD and 8825 portion of the HCND, were determined to be about 30% for the shallow, eye, and deep dose from photons and 60% for the deep dose from neutrons. The uncertainty in the 8816 deep dose from neutrons was about 12%. For neutron deep dose measured using CR39, the calculated uncertainty was about 23%. The uncertainties for the finger ring varied depending on the energy of the beta radiation, but for all beta radiations tested the uncertainties were less than 25%. 2.4.4 Effect of Lead Aprons on Response of 8825 and 8816 Dosimeters To support a feasibility study on the use of lead aprons at the PFP, HEDP measured the change in response of the 8825 portion of the HCND 8825 (7777) to photons and the response of the 8816 portion of the HCND to neutrons. Photon response was measured for 17-, 59-, and 662-keV photons; and neutron response was measured for both moderated and unmoderated 252Cf neutrons. The impacts were evaluated for dosimeters worn on top of and underneath the lead aprons being evaluated. The study concluded the following:
• For the 8825 dosimeter worn of top of the lead apron, the dosimeter will underestimate dose to unshielded portions of the body by about 35% for 59-keV photons and will be reasonably accurate for 17- and 662-keV photons. The dosimeter will overestimate dose to shielded portions of the body from both 17- and 59-keV photons and will be reasonably accurate for 662-keV photons.
2.14
• For the 8825 dosimeter worn underneath the lead apron, the dosimeter will be reasonably accurate for body parts under the apron regardless of photon energy. The dosimeter will significantly underestimate dose to unshielded parts of the body for 17- and 59-keV photons.
• Overall the lead apron reduced the shallow and deep dose from photons by about 100 fold for 17-keV
photons, about 10 fold for 59-keV photons, and essentially 1 fold (no reduction) for 662-keV photons.
• For the 8816 dosimeter worn on top of the lead apron, there was essentially no impact on the neutron measurements for either the moderated or unmoderated neutrons.
• For the 8816 dosimeter worn under the lead apron, the dosimeter overestimated the neutron dose
from unmoderated neutrons by 35% and underestimated the neutron dose from moderated neutrons by 25%.
Based on the study, a recommendation was made to wear an HCND under the apron and an 8825 (7777) dosimeter outside the apron. 2.4.5 Analysis of Phosphorus-32 in Sulfur Pellets and Hair A special test was conducted to exercise the capability of PNNL’s Radiological Chemistry Group to analyze 32P in sulfur pellets from nuclear accident dosimeters and in human hair. Phosphorus-32 results from neutron activation of 32S. The procedure to analyze these matrices for 32P had not been tested for many years. Six sulfur pellets and six hair samples were spiked with various known amounts of 32P and submitted along with three blank samples of each matrix. The laboratory provided acceptable results on all the samples. 2.4.6 Shallow Dose Rate from T-Handle Waste Sample Carriers HEDP assisted the radiological control group at the 222-S Building studying the dose rate to extrem-ities for workers carrying vials of waste tank samples in T-handle carriers. Holes in the top of the leaded carriers produce collimated beams of gamma and beta radiation upward toward the hands. In use, the dose rate at the hands is surveyed using an RO-3 or RO-20 ionization chamber survey instrument. However, because the beam diameter is smaller than the ionization chamber diameter, correction factors need to be applied to the ionization chamber readings. Chipstrate arrays were used to determine the size and shape of the beam and the correction factors for the RO-3 and RO-20 survey instruments. HSDs taped to cardboard sheets were also used to determine beta energy adjustment factors needed to properly interpret the readings on the chipstrates. These measurements were performed for different types of waste samples (solids or liquids) and different sample volumes.
2.15
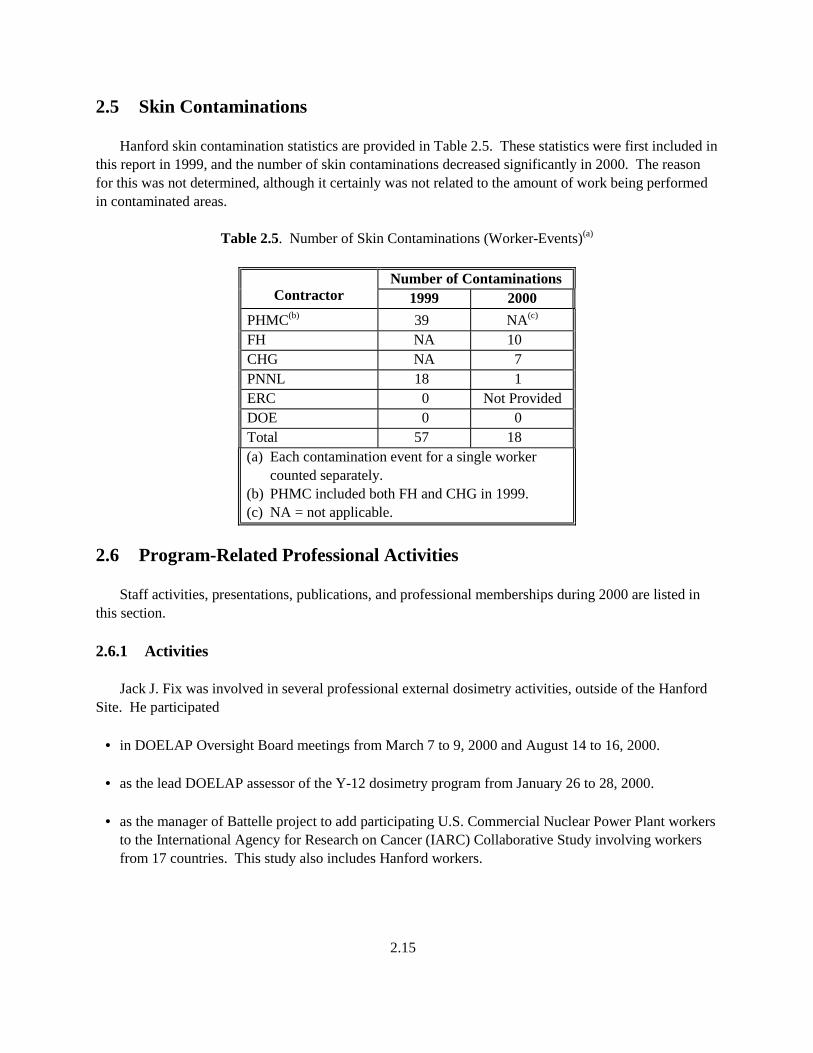
2.5 Skin Contaminations Hanford skin contamination statistics are provided in Table 2.5. These statistics were first included in this report in 1999, and the number of skin contaminations decreased significantly in 2000. The reason for this was not determined, although it certainly was not related to the amount of work being performed in contaminated areas.
Table 2.5. Number of Skin Contaminations (Worker-Events)(a)
Number of Contaminations Contractor 1999 2000
PHMC(b) 39 NA(c)
FH NA 10 CHG NA 7 PNNL 18 1 ERC 0 Not Provided DOE 0 0 Total 57 18 (a) Each contamination event for a single worker
counted separately. (b) PHMC included both FH and CHG in 1999. (c) NA = not applicable.
2.6 Program-Related Professional Activities Staff activities, presentations, publications, and professional memberships during 2000 are listed in this section. 2.6.1 Activities Jack J. Fix was involved in several professional external dosimetry activities, outside of the Hanford Site. He participated
• in DOELAP Oversight Board meetings from March 7 to 9, 2000 and August 14 to 16, 2000.
• as the lead DOELAP assessor of the Y-12 dosimetry program from January 26 to 28, 2000.
• as the manager of Battelle project to add participating U.S. Commercial Nuclear Power Plant workers to the International Agency for Research on Cancer (IARC) Collaborative Study involving workers from 17 countries. This study also includes Hanford workers.
2.16
• as principal investigator in a National Institute of Occupational Safety and Health (NIOSH) project concerning U.S. participants in the IARC study.
• as principal investigator to develop a DOE central dose repository and to include dose parameters in
the DOE Epidemiologic Surveillance Program. Bruce A. Rathbone was similarly involved in professional external dosimetry activities, outside of the Hanford Site, and participated
• as DOELAP assessor of the Oak Ridge National Laboratory dosimetry program from January 10 to 11, 2000.
• as DOELAP assessor of the Lawrence Livermore National Laboratory dosimetry program from
July 18 to 19, 2000. 2.6.2 Presentations Huneycutt, S. E., “Eddy Current Methods for Acceptance Testing TLD Holders,” PNNL-SA-33635, September 20, 2000, Harshaw TLD User’s Group Symposium, Herndon, Virginia. Rathbone, B. A., “Experiences in ANSI N13.29 Pilot Testing Using the Harshaw 8807 Environmental Dosimeter.” PNNL-SA-33640, September 20, 2000, Harshaw TLD User’s Group Symposium, Herndon, Virginia. 2.6.3 Publications Scherpelz, R. I., J. J. Fix, and B. A. Rathbone. 2000. Validation of Hanford Personnel and Extremity Dosimeters in Plutonium Environments. PNNL-13136, Pacific Northwest National Laboratory, Richland, Washington. 2.6.4 Professional Memberships Fix, J. J., Member of DOELAP Oversight Board. Fix, J. J., Chair of Health Physics Society Standards Committee. Fix, J. J., Consultant to ANSI N13.29, American National Standard for Dosimetry - Environmental Dosimetry Performance Criteria for Testing, and N13.37, American National Standard for Dosimetry, Performance Testing, and Procedural Specifications for Environmental Thermoluminescent Dosimetry, working groups. Rathbone, B. A., Member, HPS Working Group for ANSI N13.37, American National Standard for Environmental Dosimeters.
3.1
3.0 Hanford Internal Dosimetry Program The Hanford Internal Dosimetry Program (HIDP) was initiated in 1946 to provide for the assessment and documentation of occupational doses from intakes of radionuclides at the Hanford Site. The program is administered in support of Hanford radiation protection programs, as required by 10 CFR 835, Occupational Radiation Protection. Additional guidance is provided by the implementation guide (DOE 1999a) and the technical standard (DOE 1999b). The program provides the following internal dosimetry services:
• administration of a routine excreta monitoring program
• investigation and assessment of potential intakes
• monitoring performance of the contract excreta bioassay laboratory
• selection and application of models, procedures, and practices for evaluating intakes
• technical support to RL, DOE-Office of River Protection (ORP), and to Hanford Site contractors
• 24-hour, single-point-of-contact technical support for radiological incidents at Hanford
• bioassay scheduling for the Fluor Hanford companies, CHG, DOE-ORP, and RL. 3.1 Routine Operations Operational details of the HIDP are described in the following documents:
• The technical aspects of internal dose calculations are established in Methods and Models of the Hanford Internal Dosimetry Program,(a) which replaced the Technical Basis for Internal Dosimetry at Hanford, Rev. 1 (Sula, Carbaugh, and Bihl 1991) in CY 2000.
• The protocols and practices for operation of the program and coordination with the Hanford Site
contractors are established in the Hanford Internal Dosimetry Program Manual.(b)
(a) Pacific Northwest National Laboratory. Current version. Hanford Internal Dosimetry Technical
Basis Manual. PNNL-MA-860, Richland, Washington. (Internal manual.). Available URL: http://www.pnl.gov/eshs/pub/pnnl860.html
(b) Pacific Northwest National Laboratory. Current version. Hanford Internal Dosimetry Program Manual. PNL-MA-552, Rev. 3, Richland, Washington. (Internal manual.) Available URL: http://www.pnl.gov/eshs/pub/pnl552.html
3.2
• Detailed procedures are contained in the Hanford Internal Dosimetry Procedures Manual.(a)
• Protocols for responding to radiological incidents are contained in the On-Call Exposure Evaluator Manual.(b)
• Quality assurance for the program is covered in the Quality Assurance Plan for the Operation of the
Hanford Internal Dosimetry Program.(c)
• The technical agreements with the excreta lab are established by a contractual Statement of Work (SOW).
The practices and technical aspects of operating the In Vivo Monitoring Program for Hanford are established in the In Vivo Monitoring Program Manual(d) (see Chapter 4.0). Individual assessments of internal dose are documented in each individual’s file in the Hanford Radiation Records Program files. Bioassay measurement results and internal doses are maintained in the REX database, which is operated by the Hanford Radiation Records Program (see Chapter 5.0). Intakes of radionuclides are generally prevented by containment or other protective measures; therefore, intakes are normally assumed to result from an acute intake. Dose assessment is based on this assumption, except for work with tritium, for which chronic or intermittent acute intakes may be assumed. Four cases of intermittent tritium intakes were tracked throughout the year and assessed at the end of the year. Needs testing for bioassay requirements and waiving of the routine bioassay if a worker did not enter an area requiring specific bioassays was resumed for FH, CHG, and DOE workers in March 2000. 3.1.1 Bioassay Capabilities Bioassay monitoring is performed regularly for workers who might inhale, ingest, or absorb radio-nuclides into their bodies in the course of their jobs. Measurement types and frequencies are based on the radionuclides of concern, their anticipated physical and chemical form, the relative risks of intakes for workers, and the costs of the bioassay (both analysis cost and cost of the worker’s time away from the job). Minimum detectable activities (MDAs) and screening levels for routine excreta and in vivo bioassay measurements are shown in Tables 3.1 and 3.2. MDAs for emergency and expedited excreta measurements are provided in Table 3.3. (a) Pacific Northwest National Laboratory. Current version. Hanford Internal Dosimetry Procedures
Manual. PNL-MA-565, Richland, Washington. (Internal manual.) (b) Pacific Northwest National Laboratory. Current version. On-Call Exposure Evaluator Manual.
PNL-MA-857, Richland, Washington. (Internal manual.) (c) Pacific Northwest National Laboratory. Current version. Quality Assurance Plan for the Operation
of the Hanford Internal Dosimetry Program. LSC-026, Richland, Washington. (Internal manual.) (d) Pacific Northwest National Laboratory. Current version. In Vivo Monitoring Program Manual.
PNL-MA-574, Richland, Washington. (Internal manual.)
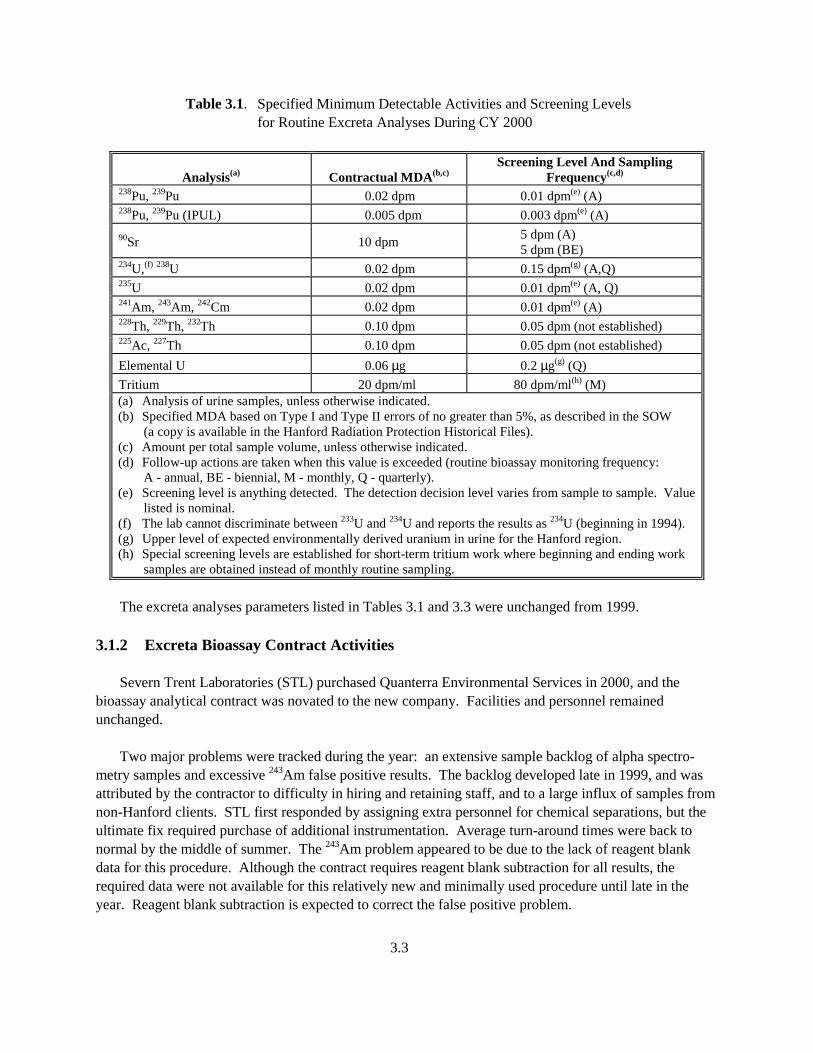
3.3
Table 3.1. Specified Minimum Detectable Activities and Screening Levels for Routine Excreta Analyses During CY 2000
Analysis(a) Contractual MDA(b,c) Screening Level And Sampling
Frequency(c,d) 238Pu, 239Pu 0.02 dpm 0.01 dpm(e) (A) 238Pu, 239Pu (IPUL) 0.005 dpm 0.003 dpm(e) (A) 90Sr 10 dpm 5 dpm (A)
5 dpm (BE) 234U,(f) 238U 0.02 dpm 0.15 dpm(g) (A,Q) 235U 0.02 dpm 0.01 dpm(e) (A, Q) 241Am, 243Am, 242Cm 0.02 dpm 0.01 dpm(e) (A) 228Th, 229Th, 232Th 0.10 dpm 0.05 dpm (not established) 225Ac, 227Th 0.10 dpm 0.05 dpm (not established) Elemental U 0.06 µg 0.2 µg(g) (Q) Tritium 20 dpm/ml 80 dpm/ml(h) (M) (a) Analysis of urine samples, unless otherwise indicated. (b) Specified MDA based on Type I and Type II errors of no greater than 5%, as described in the SOW
(a copy is available in the Hanford Radiation Protection Historical Files). (c) Amount per total sample volume, unless otherwise indicated. (d) Follow-up actions are taken when this value is exceeded (routine bioassay monitoring frequency:
A - annual, BE - biennial, M - monthly, Q - quarterly). (e) Screening level is anything detected. The detection decision level varies from sample to sample. Value
listed is nominal. (f) The lab cannot discriminate between 233U and 234U and reports the results as 234U (beginning in 1994). (g) Upper level of expected environmentally derived uranium in urine for the Hanford region. (h) Special screening levels are established for short-term tritium work where beginning and ending work
samples are obtained instead of monthly routine sampling. The excreta analyses parameters listed in Tables 3.1 and 3.3 were unchanged from 1999. 3.1.2 Excreta Bioassay Contract Activities Severn Trent Laboratories (STL) purchased Quanterra Environmental Services in 2000, and the bioassay analytical contract was novated to the new company. Facilities and personnel remained unchanged. Two major problems were tracked during the year: an extensive sample backlog of alpha spectro-metry samples and excessive 243Am false positive results. The backlog developed late in 1999, and was attributed by the contractor to difficulty in hiring and retaining staff, and to a large influx of samples from non-Hanford clients. STL first responded by assigning extra personnel for chemical separations, but the ultimate fix required purchase of additional instrumentation. Average turn-around times were back to normal by the middle of summer. The 243Am problem appeared to be due to the lack of reagent blank data for this procedure. Although the contract requires reagent blank subtraction for all results, the required data were not available for this relatively new and minimally used procedure until late in the year. Reagent blank subtraction is expected to correct the false positive problem.
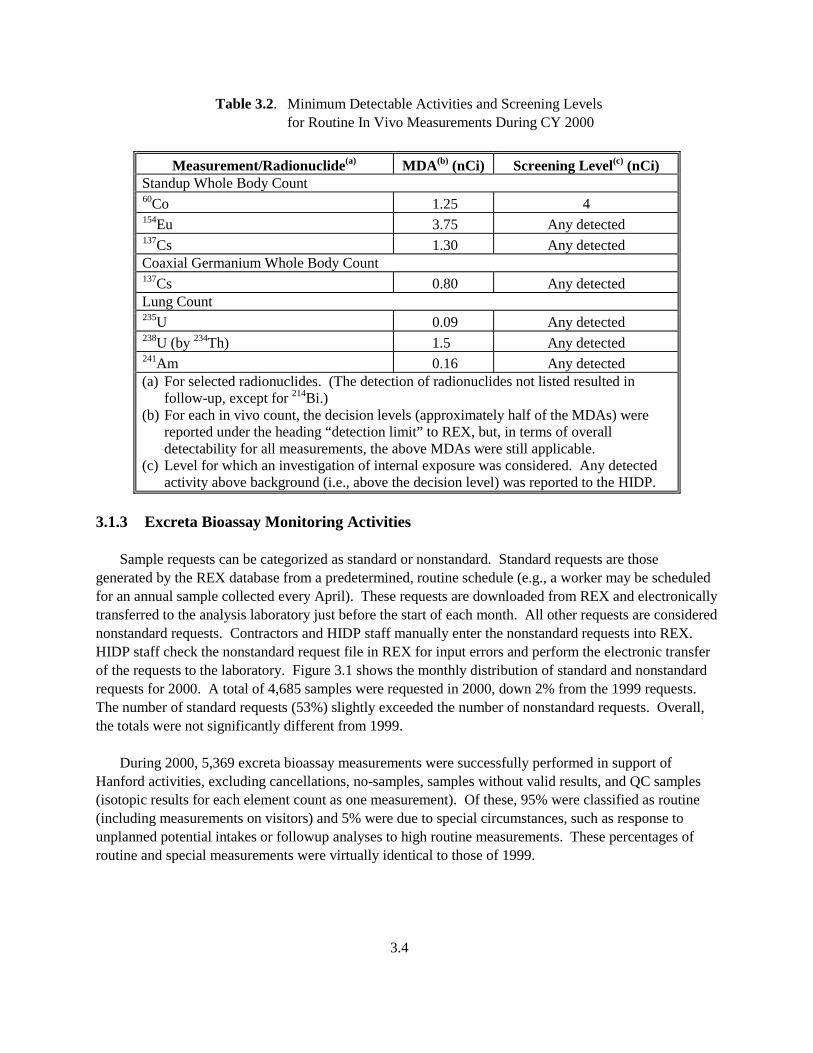
3.4
Table 3.2. Minimum Detectable Activities and Screening Levels for Routine In Vivo Measurements During CY 2000
Measurement/Radionuclide(a) MDA(b) (nCi) Screening Level(c) (nCi) Standup Whole Body Count 60Co 1.25 4 154Eu 3.75 Any detected 137Cs 1.30 Any detected Coaxial Germanium Whole Body Count 137Cs 0.80 Any detected Lung Count 235U 0.09 Any detected 238U (by 234Th) 1.5 Any detected 241Am 0.16 Any detected (a) For selected radionuclides. (The detection of radionuclides not listed resulted in
follow-up, except for 214Bi.) (b) For each in vivo count, the decision levels (approximately half of the MDAs) were
reported under the heading “detection limit” to REX, but, in terms of overall detectability for all measurements, the above MDAs were still applicable.
(c) Level for which an investigation of internal exposure was considered. Any detected activity above background (i.e., above the decision level) was reported to the HIDP.
3.1.3 Excreta Bioassay Monitoring Activities Sample requests can be categorized as standard or nonstandard. Standard requests are those generated by the REX database from a predetermined, routine schedule (e.g., a worker may be scheduled for an annual sample collected every April). These requests are downloaded from REX and electronically transferred to the analysis laboratory just before the start of each month. All other requests are considered nonstandard requests. Contractors and HIDP staff manually enter the nonstandard requests into REX. HIDP staff check the nonstandard request file in REX for input errors and perform the electronic transfer of the requests to the laboratory. Figure 3.1 shows the monthly distribution of standard and nonstandard requests for 2000. A total of 4,685 samples were requested in 2000, down 2% from the 1999 requests. The number of standard requests (53%) slightly exceeded the number of nonstandard requests. Overall, the totals were not significantly different from 1999. During 2000, 5,369 excreta bioassay measurements were successfully performed in support of Hanford activities, excluding cancellations, no-samples, samples without valid results, and QC samples (isotopic results for each element count as one measurement). Of these, 95% were classified as routine (including measurements on visitors) and 5% were due to special circumstances, such as response to unplanned potential intakes or followup analyses to high routine measurements. These percentages of routine and special measurements were virtually identical to those of 1999.
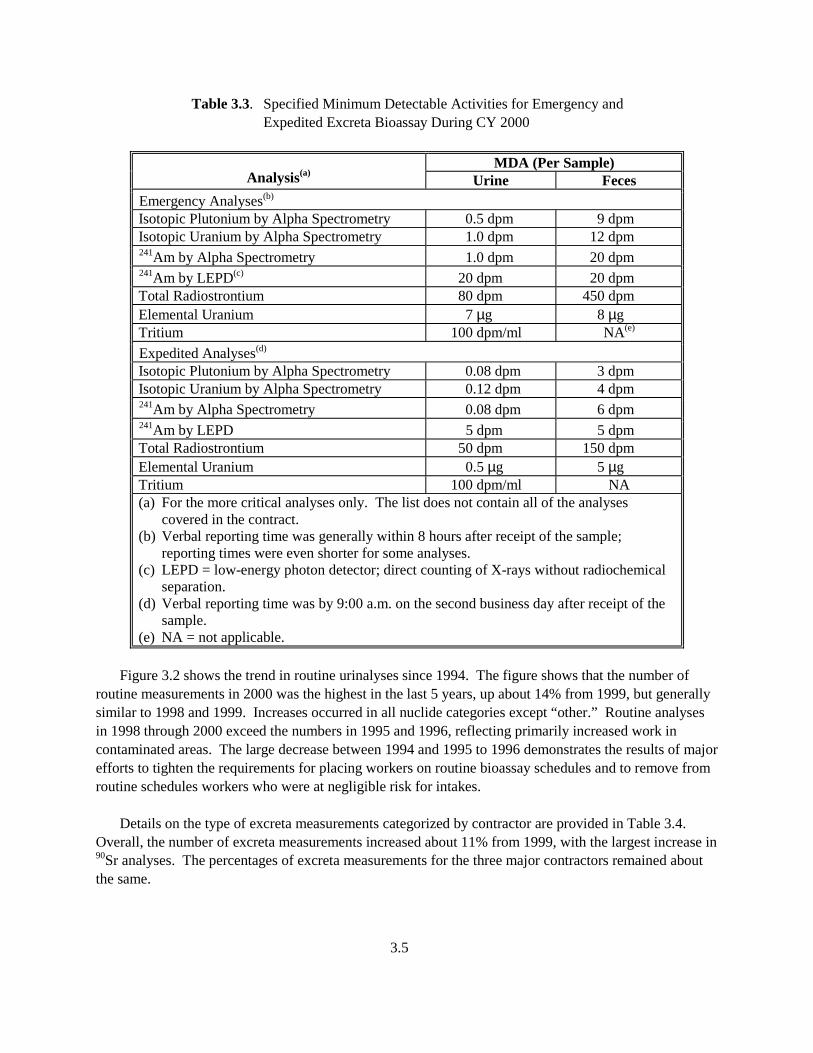
3.5
Table 3.3. Specified Minimum Detectable Activities for Emergency and Expedited Excreta Bioassay During CY 2000
MDA (Per Sample)
Analysis(a) Urine Feces Emergency Analyses(b) Isotopic Plutonium by Alpha Spectrometry 0.5 dpm 9 dpm Isotopic Uranium by Alpha Spectrometry 1.0 dpm 12 dpm 241Am by Alpha Spectrometry 1.0 dpm 20 dpm 241Am by LEPD(c) 20 dpm 20 dpm Total Radiostrontium 80 dpm 450 dpm Elemental Uranium 7 µg 8 µg Tritium 100 dpm/ml NA(e) Expedited Analyses(d) Isotopic Plutonium by Alpha Spectrometry 0.08 dpm 3 dpm Isotopic Uranium by Alpha Spectrometry 0.12 dpm 4 dpm 241Am by Alpha Spectrometry 0.08 dpm 6 dpm 241Am by LEPD 5 dpm 5 dpm Total Radiostrontium 50 dpm 150 dpm Elemental Uranium 0.5 µg 5 µg Tritium 100 dpm/ml NA (a) For the more critical analyses only. The list does not contain all of the analyses
covered in the contract. (b) Verbal reporting time was generally within 8 hours after receipt of the sample;
reporting times were even shorter for some analyses. (c) LEPD = low-energy photon detector; direct counting of X-rays without radiochemical
separation. (d) Verbal reporting time was by 9:00 a.m. on the second business day after receipt of the
sample. (e) NA = not applicable.
Figure 3.2 shows the trend in routine urinalyses since 1994. The figure shows that the number of routine measurements in 2000 was the highest in the last 5 years, up about 14% from 1999, but generally similar to 1998 and 1999. Increases occurred in all nuclide categories except “other.” Routine analyses in 1998 through 2000 exceed the numbers in 1995 and 1996, reflecting primarily increased work in contaminated areas. The large decrease between 1994 and 1995 to 1996 demonstrates the results of major efforts to tighten the requirements for placing workers on routine bioassay schedules and to remove from routine schedules workers who were at negligible risk for intakes. Details on the type of excreta measurements categorized by contractor are provided in Table 3.4. Overall, the number of excreta measurements increased about 11% from 1999, with the largest increase in 90Sr analyses. The percentages of excreta measurements for the three major contractors remained about the same.
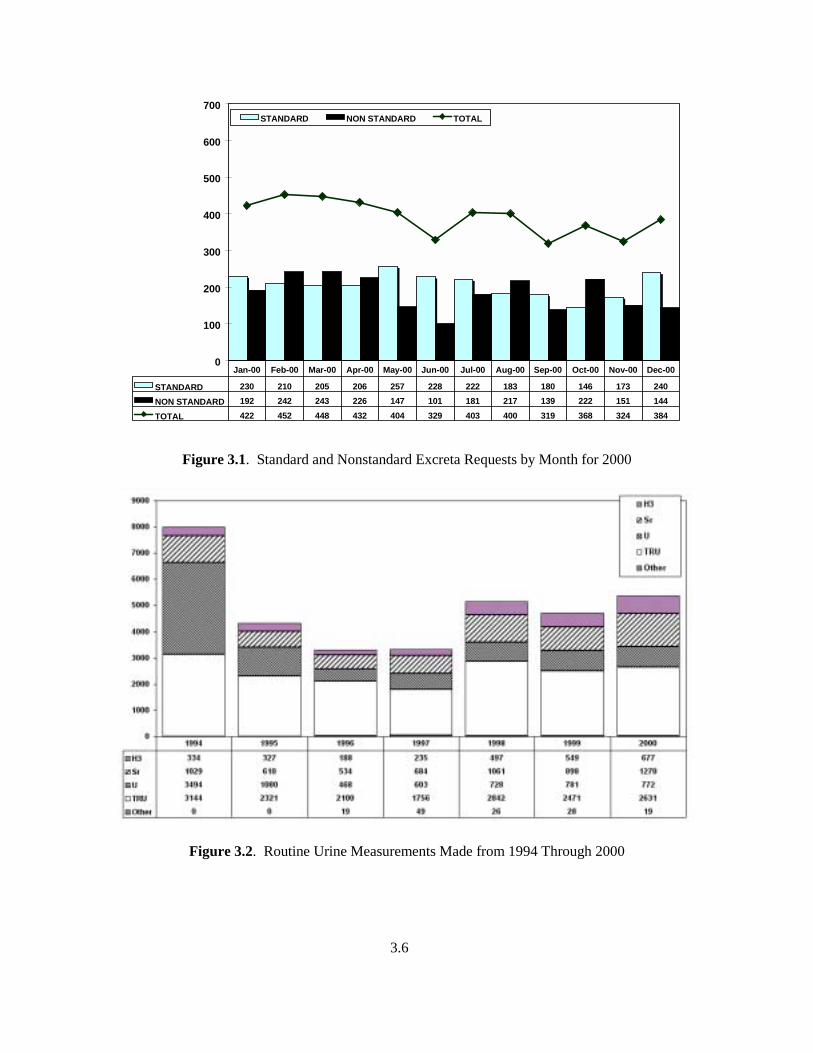
3.6
0
100
200
300
400
500
600
700STANDARD NON STANDARD TOTAL
STANDARD 230 210 205 206 257 228 222 183 180 146 173 240NON STANDARD 192 242 243 226 147 101 181 217 139 222 151 144
TOTAL 422 452 448 432 404 329 403 400 319 368 324 384
Jan-00 Feb-00 Mar-00 Apr-00 May-00 Jun-00 Jul-00 Aug-00 Sep-00 Oct-00 Nov-00 Dec-00
Figure 3.1. Standard and Nonstandard Excreta Requests by Month for 2000
Figure 3.2. Routine Urine Measurements Made from 1994 Through 2000
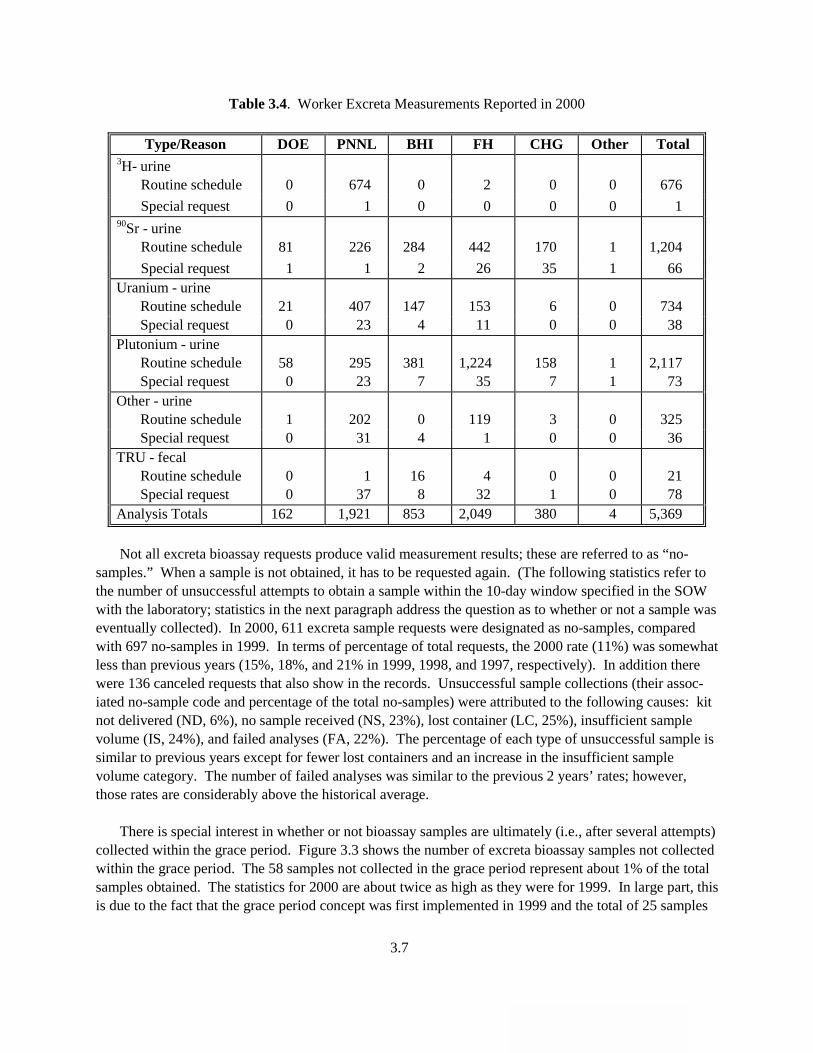
3.7
Table 3.4. Worker Excreta Measurements Reported in 2000
Type/Reason DOE PNNL BHI FH CHG Other Total 3H- urine Routine schedule 0 674 0 2 0 0 676 Special request 0 1 0 0 0 0 1 90Sr - urine Routine schedule 81 226 284 442 170 1 1,204 Special request 1 1 2 26 35 1 66 Uranium - urine Routine schedule 21 407 147 153 6 0 734 Special request 0 23 4 11 0 0 38 Plutonium - urine Routine schedule 58 295 381 1,224 158 1 2,117 Special request 0 23 7 35 7 1 73 Other - urine Routine schedule 1 202 0 119 3 0 325 Special request 0 31 4 1 0 0 36 TRU - fecal Routine schedule 0 1 16 4 0 0 21 Special request 0 37 8 32 1 0 78 Analysis Totals 162 1,921 853 2,049 380 4 5,369
Not all excreta bioassay requests produce valid measurement results; these are referred to as “no-samples.” When a sample is not obtained, it has to be requested again. (The following statistics refer to the number of unsuccessful attempts to obtain a sample within the 10-day window specified in the SOW with the laboratory; statistics in the next paragraph address the question as to whether or not a sample was eventually collected). In 2000, 611 excreta sample requests were designated as no-samples, compared with 697 no-samples in 1999. In terms of percentage of total requests, the 2000 rate (11%) was somewhat less than previous years (15%, 18%, and 21% in 1999, 1998, and 1997, respectively). In addition there were 136 canceled requests that also show in the records. Unsuccessful sample collections (their assoc-iated no-sample code and percentage of the total no-samples) were attributed to the following causes: kit not delivered (ND, 6%), no sample received (NS, 23%), lost container (LC, 25%), insufficient sample volume (IS, 24%), and failed analyses (FA, 22%). The percentage of each type of unsuccessful sample is similar to previous years except for fewer lost containers and an increase in the insufficient sample volume category. The number of failed analyses was similar to the previous 2 years’ rates; however, those rates are considerably above the historical average. There is special interest in whether or not bioassay samples are ultimately (i.e., after several attempts) collected within the grace period. Figure 3.3 shows the number of excreta bioassay samples not collected within the grace period. The 58 samples not collected in the grace period represent about 1% of the total samples obtained. The statistics for 2000 are about twice as high as they were for 1999. In large part, this is due to the fact that the grace period concept was first implemented in 1999 and the total of 25 samples
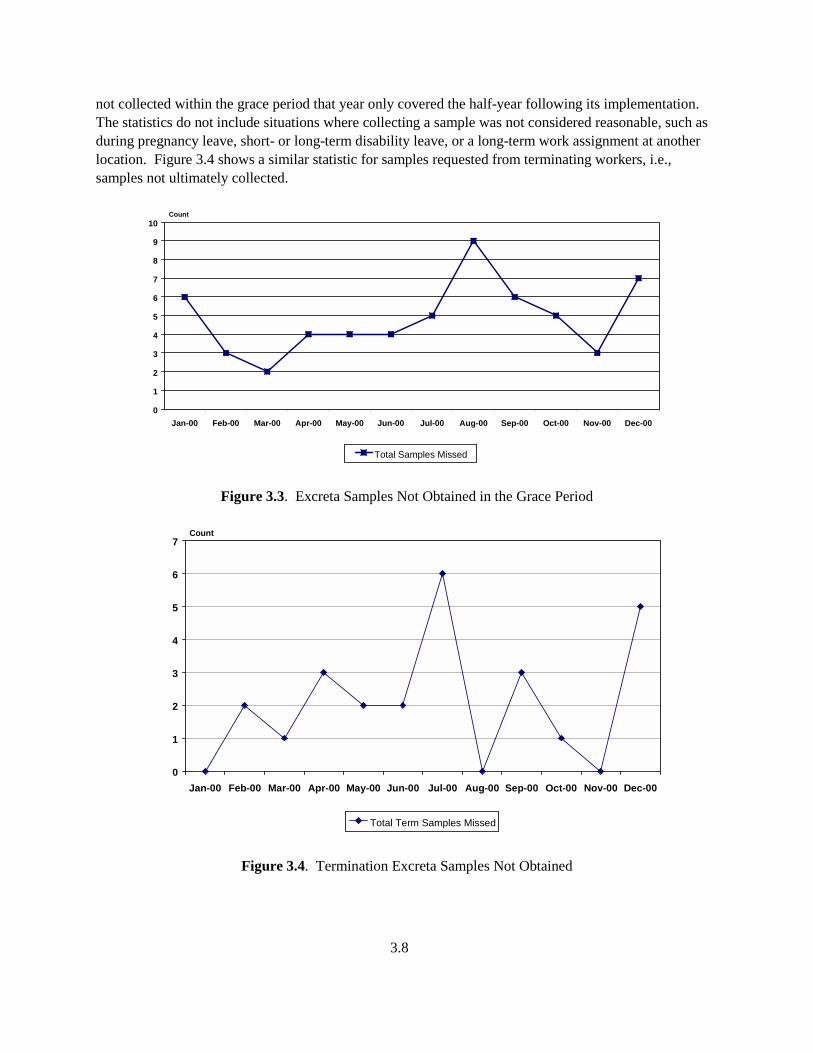
3.8
not collected within the grace period that year only covered the half-year following its implementation. The statistics do not include situations where collecting a sample was not considered reasonable, such as during pregnancy leave, short- or long-term disability leave, or a long-term work assignment at another location. Figure 3.4 shows a similar statistic for samples requested from terminating workers, i.e., samples not ultimately collected.
0
1
2
3
4
5
6
7
8
9
10
Jan-00 Feb-00 Mar-00 Apr-00 May-00 Jun-00 Jul-00 Aug-00 Sep-00 Oct-00 Nov-00 Dec-00
Count
Total Samples Missed
Figure 3.3. Excreta Samples Not Obtained in the Grace Period
0
1
2
3
4
5
6
7
Jan-00 Feb-00 Mar-00 Apr-00 May-00 Jun-00 Jul-00 Aug-00 Sep-00 Oct-00 Nov-00 Dec-00
Count
Total Term Samples Missed
Figure 3.4. Termination Excreta Samples Not Obtained
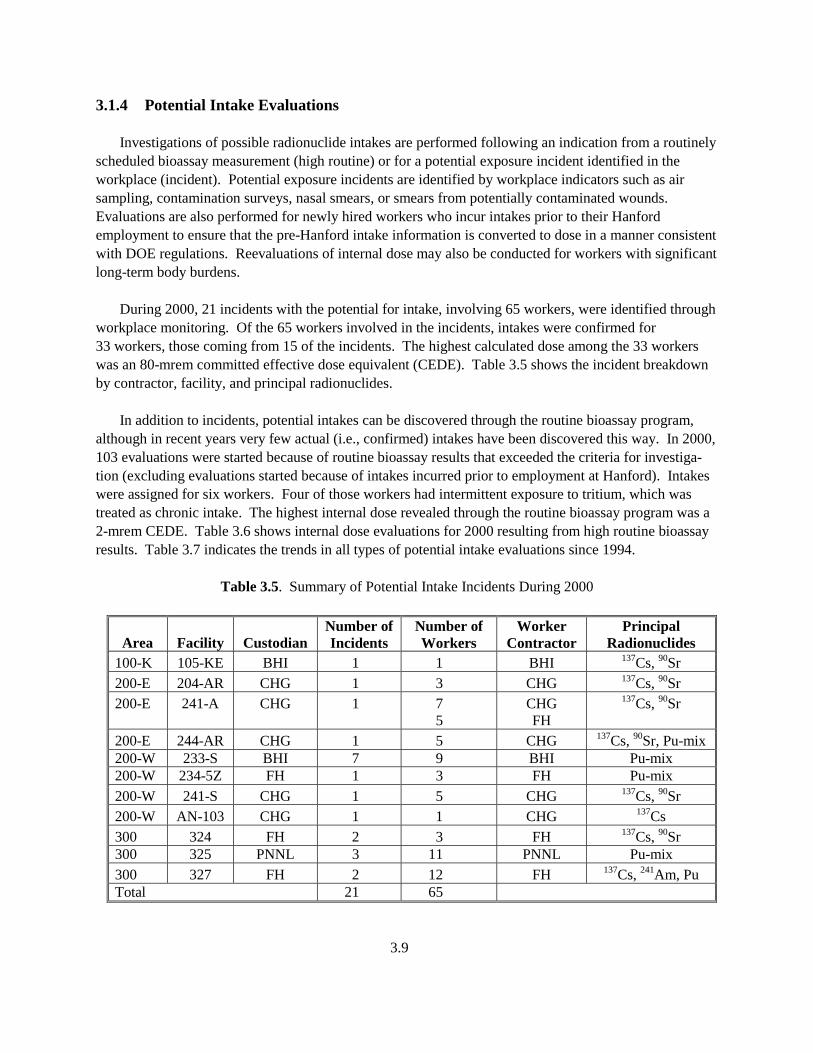
3.9
3.1.4 Potential Intake Evaluations Investigations of possible radionuclide intakes are performed following an indication from a routinely scheduled bioassay measurement (high routine) or for a potential exposure incident identified in the workplace (incident). Potential exposure incidents are identified by workplace indicators such as air sampling, contamination surveys, nasal smears, or smears from potentially contaminated wounds. Evaluations are also performed for newly hired workers who incur intakes prior to their Hanford employment to ensure that the pre-Hanford intake information is converted to dose in a manner consistent with DOE regulations. Reevaluations of internal dose may also be conducted for workers with significant long-term body burdens. During 2000, 21 incidents with the potential for intake, involving 65 workers, were identified through workplace monitoring. Of the 65 workers involved in the incidents, intakes were confirmed for 33 workers, those coming from 15 of the incidents. The highest calculated dose among the 33 workers was an 80-mrem committed effective dose equivalent (CEDE). Table 3.5 shows the incident breakdown by contractor, facility, and principal radionuclides. In addition to incidents, potential intakes can be discovered through the routine bioassay program, although in recent years very few actual (i.e., confirmed) intakes have been discovered this way. In 2000, 103 evaluations were started because of routine bioassay results that exceeded the criteria for investiga-tion (excluding evaluations started because of intakes incurred prior to employment at Hanford). Intakes were assigned for six workers. Four of those workers had intermittent exposure to tritium, which was treated as chronic intake. The highest internal dose revealed through the routine bioassay program was a 2-mrem CEDE. Table 3.6 shows internal dose evaluations for 2000 resulting from high routine bioassay results. Table 3.7 indicates the trends in all types of potential intake evaluations since 1994.
Table 3.5. Summary of Potential Intake Incidents During 2000
Area Facility Custodian Number of Incidents
Number of Workers
Worker Contractor
Principal Radionuclides
100-K 105-KE BHI 1 1 BHI 137Cs, 90Sr 200-E 204-AR CHG 1 3 CHG 137Cs, 90Sr 200-E 241-A CHG 1 7
5 CHG FH
137Cs, 90Sr
200-E 244-AR CHG 1 5 CHG 137Cs, 90Sr, Pu-mix 200-W 233-S BHI 7 9 BHI Pu-mix 200-W 234-5Z FH 1 3 FH Pu-mix 200-W 241-S CHG 1 5 CHG 137Cs, 90Sr 200-W AN-103 CHG 1 1 CHG 137Cs 300 324 FH 2 3 FH 137Cs, 90Sr 300 325 PNNL 3 11 PNNL Pu-mix 300 327 FH 2 12 FH 137Cs, 241Am, Pu Total 21 65
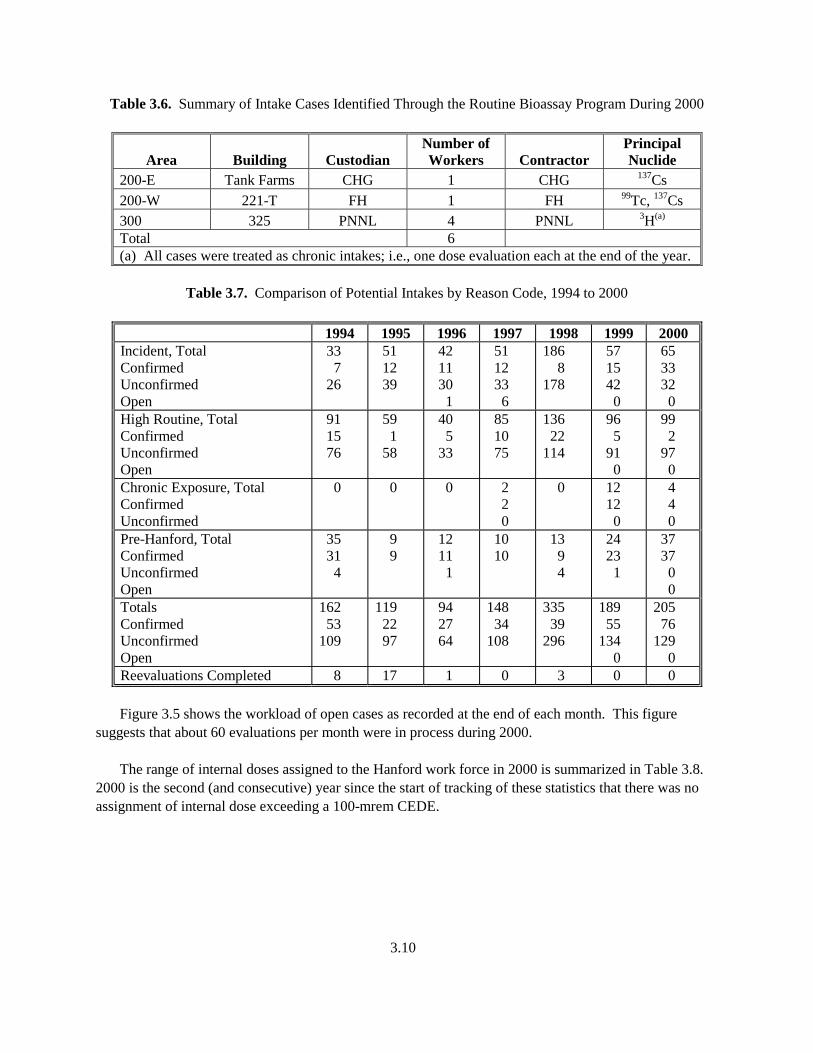
3.10
Table 3.6. Summary of Intake Cases Identified Through the Routine Bioassay Program During 2000
Area Building Custodian Number of Workers Contractor
Principal Nuclide
200-E Tank Farms CHG 1 CHG 137Cs 200-W 221-T FH 1 FH 99Tc, 137Cs 300 325 PNNL 4 PNNL 3H(a) Total 6 (a) All cases were treated as chronic intakes; i.e., one dose evaluation each at the end of the year.
Table 3.7. Comparison of Potential Intakes by Reason Code, 1994 to 2000
1994 1995 1996 1997 1998 1999 2000
Incident, Total Confirmed Unconfirmed Open
33 7
26
51 12 39
42 11 30 1
51 12 33 6
186 8
178
57 15 42 0
65 33 32 0
High Routine, Total Confirmed Unconfirmed Open
91 15 76
59 1
58
40 5
33
85 10 75
136 22
114
96 5
91 0
99 2
97 0
Chronic Exposure, Total Confirmed Unconfirmed
0
0
0
2 2 0
0
12 12 0
4 4 0
Pre-Hanford, Total Confirmed Unconfirmed Open
35 31
4
9 9
12 11 1
10 10
13 9 4
24 23 1
37 37 0 0
Totals Confirmed Unconfirmed Open
162 53
109
119 22 97
94 27 64
148 34
108
335 39
296
189 55
134 0
205 76
129 0
Reevaluations Completed 8 17 1 0 3 0 0 Figure 3.5 shows the workload of open cases as recorded at the end of each month. This figure suggests that about 60 evaluations per month were in process during 2000. The range of internal doses assigned to the Hanford work force in 2000 is summarized in Table 3.8. 2000 is the second (and consecutive) year since the start of tracking of these statistics that there was no assignment of internal dose exceeding a 100-mrem CEDE.
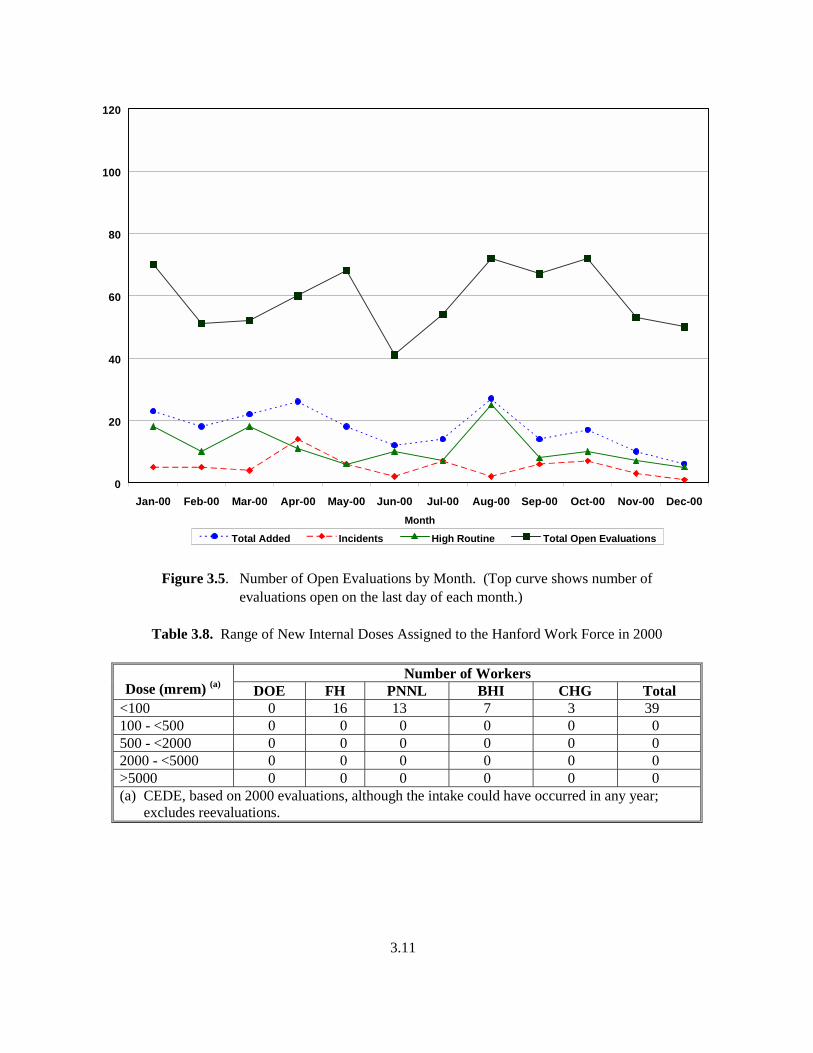
3.11
0
20
40
60
80
100
120
Jan-00 Feb-00 Mar-00 Apr-00 May-00 Jun-00 Jul-00 Aug-00 Sep-00 Oct-00 Nov-00 Dec-00Month
Total Added Incidents High Routine Total Open Evaluations Figure 3.5. Number of Open Evaluations by Month. (Top curve shows number of
evaluations open on the last day of each month.)
Table 3.8. Range of New Internal Doses Assigned to the Hanford Work Force in 2000
Number of Workers Dose (mrem) (a) DOE FH PNNL BHI CHG Total
<100 0 16 13 7 3 39 100 - <500 0 0 0 0 0 0 500 - <2000 0 0 0 0 0 0 2000 - <5000 0 0 0 0 0 0 >5000 0 0 0 0 0 0 (a) CEDE, based on 2000 evaluations, although the intake could have occurred in any year;
excludes reevaluations.
3.12
3.2 Program Changes and Improvements Three program changes and improvements were made during CY 2000 as described in the following sections. 3.2.1 Methods and Models Manual Issued The internal manual, Methods and Models of the Hanford Internal Dosimetry Program, (PNNL-MA-860) was completed and issued in September 2000, both as a controlled hard-copy manual and as an online manual. This manual replaced the 1991 document, Technical Basis for Internal Dosimetry at Hanford (PNL-6866 Rev. 1) as the program’s reference document detailing how biossay data are interpreted and how internal dosimetry is performed at the Hanford Site. The former document has been retired. The “M&M” manual specifies the biokinetic model used for each radioelement, along with the assumptions used in program design and data interpretation. Generally, the biokinetic models of Publication 30 of the International Commission on Radiological Protection (ICRP 1979) are used; however, some of the compartment fractions and biological half-times have been modified to approximate more recent ICRP models. The ICRP 30 respiratory tract model has been retained, however the default assumption for inhalation particle size was changed from 1-µm to 5-µm activity median aerodynamic diameter (AMAD), based on current recommendations of the ICRP and a literature review. The manual also tabulates many values for intake retention, excretion, dose coefficients, minimum detectable doses for various bioassay intervals, and it provides some historical background on sources and past internal dosimetry practices at Hanford. Specific chapters of the manual are devoted to tritium, cesium, strontium, uranium, plutonium, americium, 60Co and corrosion products, iodine, europium, and neptunium. Mixtures of cesium, strontium, and plutonium are addressed in an appendix. The manual can be found as a pdf format file on the World Wide Web, at the following URL address: http://www.pnl.gov/eshs/pub/pnnl860.html 3.2.2 Changes to the Hanford Internal Dosimetry Program Manual Changes to the program instituted through the Hanford Internal Dosimetry Program Manual are summarized in Table 3.9. 3.2.3 Update on New Decision Level for Alpha Spectrometry The reasons for changing the computational method for determining the decision level (Lc) were reported in last year’s annual report. The change was originally implemented using the following formula: ( )TPU05.2+x=L Bc •
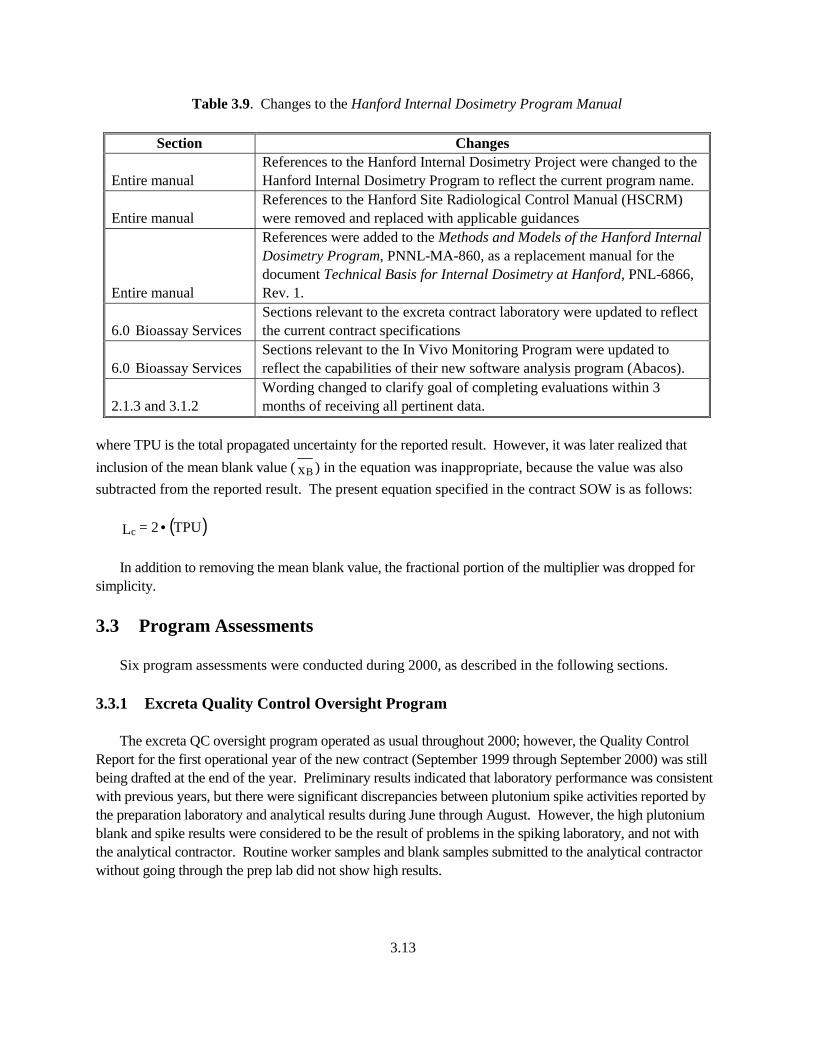
3.13
Table 3.9. Changes to the Hanford Internal Dosimetry Program Manual
Section Changes
Entire manual References to the Hanford Internal Dosimetry Project were changed to the Hanford Internal Dosimetry Program to reflect the current program name.
Entire manual References to the Hanford Site Radiological Control Manual (HSCRM) were removed and replaced with applicable guidances
Entire manual
References were added to the Methods and Models of the Hanford Internal Dosimetry Program, PNNL-MA-860, as a replacement manual for the document Technical Basis for Internal Dosimetry at Hanford, PNL-6866, Rev. 1.
6.0 Bioassay Services Sections relevant to the excreta contract laboratory were updated to reflect the current contract specifications
6.0 Bioassay Services Sections relevant to the In Vivo Monitoring Program were updated to reflect the capabilities of their new software analysis program (Abacos).
2.1.3 and 3.1.2 Wording changed to clarify goal of completing evaluations within 3 months of receiving all pertinent data.
where TPU is the total propagated uncertainty for the reported result. However, it was later realized that inclusion of the mean blank value ( xB ) in the equation was inappropriate, because the value was also subtracted from the reported result. The present equation specified in the contract SOW is as follows: ( )TPU2=Lc • In addition to removing the mean blank value, the fractional portion of the multiplier was dropped for simplicity. 3.3 Program Assessments Six program assessments were conducted during 2000, as described in the following sections. 3.3.1 Excreta Quality Control Oversight Program The excreta QC oversight program operated as usual throughout 2000; however, the Quality Control Report for the first operational year of the new contract (September 1999 through September 2000) was still being drafted at the end of the year. Preliminary results indicated that laboratory performance was consistent with previous years, but there were significant discrepancies between plutonium spike activities reported by the preparation laboratory and analytical results during June through August. However, the high plutonium blank and spike results were considered to be the result of problems in the spiking laboratory, and not with the analytical contractor. Routine worker samples and blank samples submitted to the analytical contractor without going through the prep lab did not show high results.

3.14
Although no source of the contamination in the prep lab was identified, minor modification to the addition technique and the prep area appear to have corrected the problem. The time sample containers are open is now minimized by pre-weighing added water and completing the task as quickly as possible. Blank samples are prepared in a laminar flow hood. Also, all reagent materials were replaced with new stock, and quartz-distilled water was used instead of just Nanopure (a) water. 3.3.2 Onsite Inspection of the Excreta Contract Laboratory The annual QA assessment of STL performance under Contract 313500 was conducted in November 2000. In addition to the contract’s QA requirements, the audit base included the contractor’s Quality Assurance Management Plan and procedures. Requirements not specifically evaluated during the Environmental Management Consolidated Audit Program audit conducted from September 25 through 27, 2000 were also assessed. There was one finding (missing red tape on a “critical” pipet) and one observation (conflicting data in the electronic bioassay sample status report) noted during the audit. Both were corrected satisfactorily. 3.3.3 Testing of Backup Lab for Rapid Plutonium and Strontium Analyses Capabilities for performing rapid urinalyses for plutonium and 90Sr by PNNL’s Radiochemistry Process Group (RPG) were tested twice in 2000. These capabilities are intended to serve as backup for the contract laboratory. RPG staff satisfactorily completed the analyses of the blind performance samples. 3.3.4 Hanford Contractors’ 10 CFR 835 Assessment Contractors are required to assess all functional elements of their radiological protection programs at least once every 3 years. Internal dosimetry and bioassay are considered a single functional element, and the contractors jointly conducted an assessment of HIDP in June, although the assessment letter was not officially issued until August. There were two findings and three observations concerning the HIDP that can be summarized as follows:
• A discrepancy was found between procedure 300-05 and actual practice concerning use of the Bioassay Request Sheet.
• A corrective action plan is needed for completion of the Methods and Models of the Hanford Internal
Dosimetry Program.(b)
(a) Nanopure is a registered trademark of Barnstead/Thermodyne. (b) Pacific Northwest National Laboratory. Current version. Methods and Models of the Hanford
Internal Dosimetry Program. PNNL-MA-860, Richland, Washington. (Internal manual.) Available URL: http://www.pnl.gov/eshs/pub/pnnl860.html

3.15
• A need was identified for improved tracking of the timeliness of dose assessments.
• A need was identified to ensure HIDP is aware of and in compliance with contractor radiological control program requirements.
• Three procedures had effective dates preceding signoff dates.
Corrective actions for all of the findings and observations were completed in CY 2000. 3.3.5 Program Self-Assessments A self-assessment of the program is conducted annually by the program’s quality engineer. This year’s assessment was conducted in April and found minor discrepancies between actual practice and two procedures, and some procedure training records that had not been completed. Corrective actions were completed by August. 3.3.6 Quality Problem Reports Four quality problem reports related to bioassay were filed in 2000. These were presented as a group to PNNL’s PAAA Working Group in November and were determined to be reportable as a management concern in January 2001. The problems were not entirely within the HIDP, but were isolated cases of breakdown of the complex of systems that together constitute the methods for scheduling, obtaining, and tracking status of bioassay and the prompt reporting of results of concern. Each problem was critiqued when discovered and corrective actions were developed separately. Corrective actions included the following:
• improving the review of the Excreta Bioassay Positive Exam Results Report
• modifying the time period encompassed by the Schedule Due Report (for scheduling in vivo measurements) to scan backward in time to locate workers who had failed to show up for their measurements and failed to get rescheduled
• ensuring that the Grace Period Deficiency Report will identify insufficient volume samples and failed
analyses (excreta samples)
• modifying the Daily Sample Excreta Report to include data on insufficient volume samples submitted to the results portion of the REX database (as opposed to being submitted to the excreta status portion of REX)
• modifying the Access Control Entry System (used by FH, CHG, and PNNL for radiological area
entry qualifications control) to accept data on insufficient volume and failed analysis samples.
3.16
Most of these corrective actions represent improvements to the backup systems for finding data in the database that should have been reported promptly to HIDP. The PAAA Working Group requested two additional corrective actions that were being performed in 2001; one involved corrective actions by the contract excreta bioassay laboratory and the other involved an extensive functional requirements analysis of the whole bioassay system. 3.4 Supporting Technical Studies Four supporting studies were conducted during 2000, as described in the following sections. 3.4.1 Tritium Absorption Through Skin A method for calculating dose from uptake through intact skin contact with tritium-contaminated water was developed in response to a contractor request. Based on a water-absorption rate through intact skin of 0.065 mg/cm2-min (Pinson and Langham 1980), the method was documented in a memo to the requesting contractor. It was estimated that 10 minutes of contact with both hands and arms (20% total body skin area) to water contaminated at 641 µCi/ml would result in a 100-mrem CEDE. The method will be incorporated into the first revision of the tritium chapter of PNNL-MA-860. 3.4.2 Investigation of a New Internal Dosimetry Code A computer code, developed by the British National Radiological Protection Board and being marketed in North America by ACJ & Associates, is being considered as a possible supplement or eventual replacement for the CINDY code currently used by Hanford for internal dose calculations. CINDY is now over 10 years old and two significant shortcomings are being experienced with the code: 1) it is limited to the ICRP 30 form of biokinetic models and is not capable of using the new ICRP 66 (1994) lung model or the recent ICRP recycling biokinetic models, and 2) the code is proving to be very difficult to successfully run on current personal computer (PC) operating systems (e.g., Windows 2000 and Windows NT). The Integrated Modules for Bioassay Analysis (IMBA) Code implements the ICRP 66 lung model, recycling biokinetic models, and ICRP 60 weighting factors to give results for intake, retention, and effective dose calculations. Adaptation of these modules to meet DOE requirements of 10 CFR 835 (notably the DOE tissue-weighting factors) would be required; however, the utility of the code and the ability to use the new models (or the former ICRP 30 [1979] models) makes it an attractive possibility and a cost-effective alternative to developing a new code from scratch. In addition, IMBA is designed to run on advanced operating systems and can be easily interfaced with various other applications (e.g., Excel spreadsheets). Discussions with the vendor, other DOE sites, and DOE-HQ indicated that adaptation of the code to provide a DOE complex-wide version was feasible, and a DOE-HQ (Environmental Health) managed effort to fund the adaptation and development was initiated. HIDP committed $20K of FY 2001 funding towards this effort. Several other DOE sites have indicated they will provide similar support.
3.17
3.4.3 Review of Historical Records on REX A number of minor modifications to REX internal dosimetry INTERTRAC records were made in preparation for the rehosting of REX. The modifications addressed inconsistencies resulting from changes in reporting criteria and a few data errors that had resulted over the 12 years of INTERTRAC existence. With the expanded use of database queries and provision of database subsets to various researchers, the inconsistency in reporting data was considered likely to lead to errors and inefficiencies in the interpretation and use of data. All assigned internal doses in INTERTRAC were reviewed (1,784 dose entries for 892 evaluations); representing all Hanford workers with internal doses assigned under the ICRP 26 (1977) dosimetry systems as of June 1, 2000. A total of 222 inconsistencies had resulted from the reporting criteria having changed in 1993 from annual dose equivalents to 50-year committed dose equivalents. An additional 12 inconsistencies were identified as errors in the peer review of the evaluation prior to data entry or to previously undetected data entry errors. Memos documenting the modifications were added to each affected worker’s file. These modifications brought the INTERTRAC database into internal consistency; with all reported doses being 50-year committed doses. 3.4.4 Bioassay for Hanford Firefighters A program was established to offer, obtain, and analyze urine samples from firefighters associated with the Hanford range fire of June 29 to July 2. The HIDP initially offered whole body exams to firefighters after the fire prior to leaving the community; however, no firefighters accepted the offer. Later, concerns developed among the firefighters as a result of media reports of elevated environmental air samples and urine sampling was offered to those concerned. Urinalysis requests were received from 53 Hanford employee firefighters and 144 non-Hanford employees and all requesting firefighters were provided sample kits. Of the kits provided, 46 Hanford employees and 71 non-Hanford employees returned samples for analysis. All samples were analyzed for radiostrontium, and 5 samples were also analyzed for plutonium. None of the samples showed any indications of intake. 3.4.5 Review of Draft Basic Ordering Agreement HIDP staff reviewed a draft basic ordering agreement (BOA) for a DOE complex-wide bioassay procurement and provided comments to the Sample Management Group at the Rocky Flats Environmental Restoration Site, which originated the BOA. The draft resulted from a recommendation by the DOE Inspector General’s office 1999 multi-site audit that a DOE-wide contract was feasible and would save money. The HIDP commented that the draft BOA did not meet the analytical sensitivity, turnaround times, quality, or reporting provisions of the current Hanford bioassay contract. 3.5 Project-Related Professional Activities HIDP staff activities, presentations, and professional memberships during 1999 are listed in this section.

3.18
3.5.1 Activities Donald E. Bihl was Chair of Health Physics Society Standards Working Group N13.39, Internal Dosimetry Programs. This working group completed its task when N13.39 was approved by the HPS Standards Committee and the final copy was submitted to the HPS Secretariat for publication. Eugene H. Carbaugh was involved in professional dosimetry activities, outside of the Hanford Site, as a member of the DOELAP Radiobioassay Oversight Board, and he attended the Board’s meeting May 1 to 3 in Idaho Falls, Idaho. He also attended a meeting of the DOE Working Group on Stable Tritium Compounds, from January 18 to 19, in Albuquerque, New Mexico, at which a set of specific issues were identified to be addressed by DOE in establishing policy on radiation protection for metal tritide particulates and organically bound tritium. Jay A. MacLellan was Technical Program Co-chairman for the 47th Bioassay, Analytical, and Environmental Radiochemistry Conference held in Seattle, November 12-17, 2010. 3.5.2 Presentations MacLellan, J. A. 2000. “Hanford’s Decision Level for Alpha Spectrometry Bioassay Analyses Based on Sample Specific Total Propagated Uncertainty.” PNNL-SA-33598, presented at the 46th Bioassay, Analytical, and Environmental Radiochemistry Conference, November 12-17, 2000, Seattle, Washington. Strom, D. J., D. E. Bihl, E. H. Carbaugh, J. A. MacLellan, and C. L. Antonio. 2000. “Hanford Approach to Dealing with Suspected Intakes of Plutonium.” PNNL-SA-34012, presented at the Los Alamos National Laboratory Plutonium Bioassay and Internal Dosimetry Workshop, December 4, 2000, Los Alamos, New Mexico. 3.5.3 Publications Pacific Northwest National Laboratory. Current version. Methods and Models of the Hanford Internal Dosimetry Program. PNNL-MA-860, Richland, Washington. (Internal manual.) Available URL: http://www.pnl.gov/eshs/pub/pnnl860.html 3.5.4 Professional Memberships and Other Activities Carbaugh, E. H., Member of the HPS Standards Committee N13.25, Internal Dosimetry Standard for Plutonium. Carbaugh, E. H., Member Bioassay/ Internal Dosimetry DOELAP Oversight Board. Carbaugh, E. H., Member DOE Working Group on Stable Tritium Compounds.

3.19
MacLellan, J. A., Chair of the American Academy of Health Physics Appeals Committee. MacLellan, J. A., President-Elect of the Columbia Chapter of the Health Physics Society.
4.0 In Vivo Monitoring Program for Hanford The In Vivo Monitoring Program for Hanford (IVMP; formerly the Hanford Whole Body Counting Program) has been an integral part of the comprehensive radiological protection program for Hanford workers since 1959. The IVMP staff provides routine and emergency in vivo counting services. The majority of the measurements are performed in the 747-A Building at the corner of Knight Street and Goethals Avenue in Richland. Additional radiation detection equipment is maintained and operated at the Emergency Decontamination Facility located next to the Kadlec Medical Center. Mobile in vivo equip-ment is also maintained in a trailer located near the 747-A Building. Collectively, the facilities are called the In Vivo Radioassay and Research Facility (IVRRF). Four shielded counting systems in the 747-A Building were used to perform the routine measure-ments during 2000. The standup counter employs five large sodium-iodide detectors for measuring fission and activation products in the body with energies >200 keV. It is used primarily as a screening counter to determine whether activity is present above the decision level. The Palmer Room contains a system with seven coaxial high-purity germanium (HPGe) detectors. It is also used to detect and quantify radionuclides that emit high-energy photons. Because of the excellent resolution, it is used to obtain the final results when activity is detected. The Iron Room and Stainless Steel Room each contain planar HPGe detector arrays optimized for the detection of uranium, transuranic radionuclides, and other nuclides that emit low-energy photons. Additional sodium-iodide and HPGe detectors are located in the Lead Room and are infrequently used for organ and whole body counting. When activity is detected and confirmed, the results are provided to the HIDP to be used in determin-ing the dose to workers from the internally deposited radionuclides. Records of the measurement results, counting system calibrations, and measurement QC records are ultimately transmitted to the Hanford Radiological Records Program. Information copies of the records are maintained at the IVRRF. The IVMP is accredited through the DOELAP for bioassay and is operated in compliance with 10 CFR 835, Occupational Radiation Protection. The program documentation includes the In Vivo Monitoring Project Manual, PNL-MA-574,(a) the Quality Assurance Plan for the operation of the In Vivo Monitoring Program for Hanford, LSC-021, and the In Vivo Counting Program Procedures Manual, PNL-MA-554.(b) 4.1 Routine Operations A total of 6,983 in vivo measurement results were sent to the REX database for DOE and the Hanford contractors during 2000. This included 5,650 whole body measurements, 1,319 chest measurements, and
(a) Pacific Northwest National Laboratory. Current version. In Vivo Monitoring Project Manual.
PNL-MA-574, Richland, Washington. (Internal manual.) (b) Pacific Northwest National Laboratory. Current version. In Vivo Counting Program Procedures
Manual. PNL-MA-554, Richland, Washington. (Internal manual.)
4.1
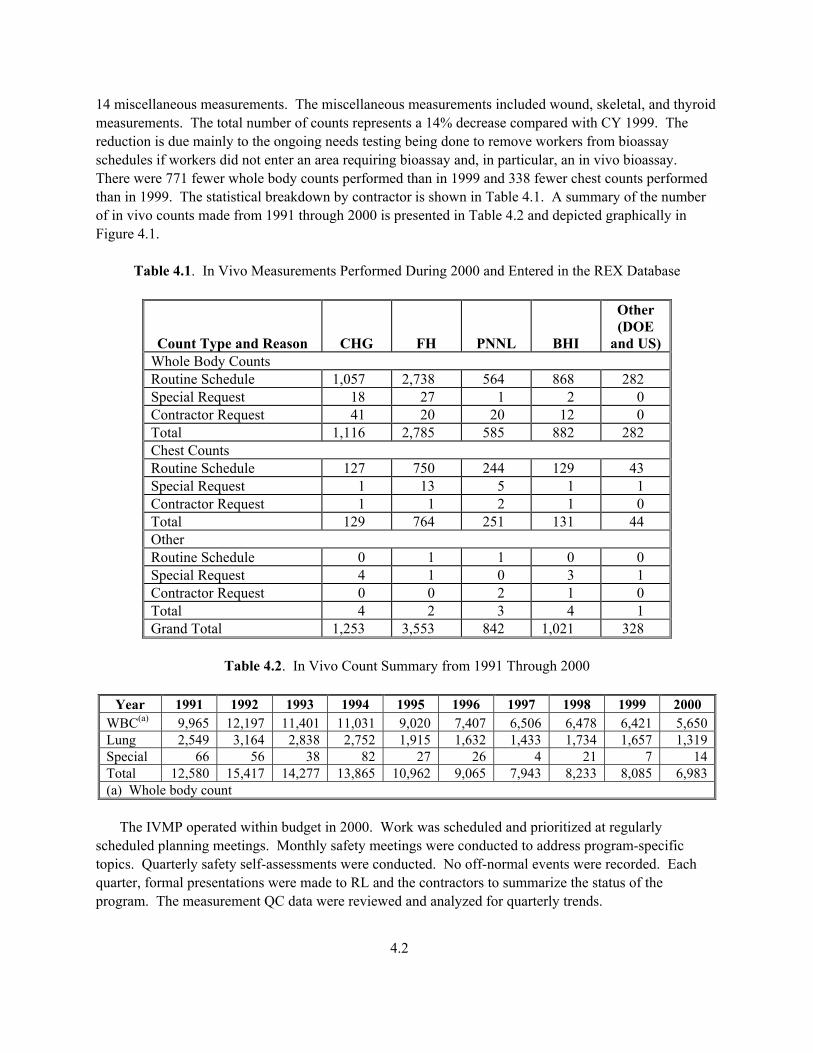
14 miscellaneous measurements. The miscellaneous measurements included wound, skeletal, and thyroid measurements. The total number of counts represents a 14% decrease compared with CY 1999. The reduction is due mainly to the ongoing needs testing being done to remove workers from bioassay schedules if workers did not enter an area requiring bioassay and, in particular, an in vivo bioassay. There were 771 fewer whole body counts performed than in 1999 and 338 fewer chest counts performed than in 1999. The statistical breakdown by contractor is shown in Table 4.1. A summary of the number of in vivo counts made from 1991 through 2000 is presented in Table 4.2 and depicted graphically in Figure 4.1.
Table 4.1. In Vivo Measurements Performed During 2000 and Entered in the REX Database
Count Type and Reason CHG FH PNNL BHI
Other (DOE
and US) Whole Body Counts Routine Schedule 1,057 2,738 564 868 282 Special Request 18 27 1 2 0 Contractor Request 41 20 20 12 0 Total 1,116 2,785 585 882 282 Chest Counts Routine Schedule 127 750 244 129 43 Special Request 1 13 5 1 1 Contractor Request 1 1 2 1 0 Total 129 764 251 131 44 Other Routine Schedule 0 1 1 0 0 Special Request 4 1 0 3 1 Contractor Request 0 0 2 1 0 Total 4 2 3 4 1 Grand Total 1,253 3,553 842 1,021 328
Table 4.2. In Vivo Count Summary from 1991 Through 2000
Year 1991 1992 1993 1994 1995 1996 1997 1998 1999 2000
WBC(a) 9,965 12,197 11,401 11,031 9,020 7,407 6,506 6,478 6,421 5,650Lung 2,549 3,164 2,838 2,752 1,915 1,632 1,433 1,734 1,657 1,319Special 66 56 38 82 27 26 4 21 7 14Total 12,580 15,417 14,277 13,865 10,962 9,065 7,943 8,233 8,085 6,983(a) Whole body count
The IVMP operated within budget in 2000. Work was scheduled and prioritized at regularly scheduled planning meetings. Monthly safety meetings were conducted to address program-specific topics. Quarterly safety self-assessments were conducted. No off-normal events were recorded. Each quarter, formal presentations were made to RL and the contractors to summarize the status of the program. The measurement QC data were reviewed and analyzed for quarterly trends.
4.2
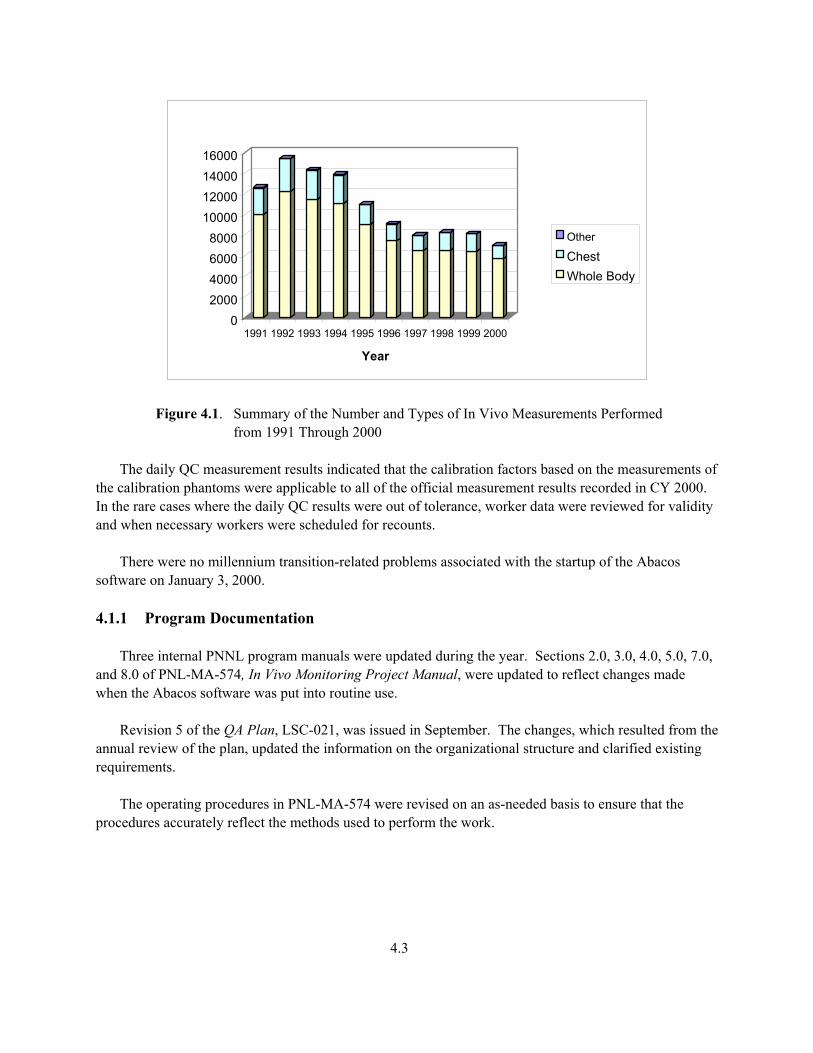
02000400060008000
10000120001400016000
1991 1992 1993 1994 1995 1996 1997 1998 1999 2000
Year
Other
ChestWhole Body
Figure 4.1. Summary of the Number and Types of In Vivo Measurements Performed
from 1991 Through 2000 The daily QC measurement results indicated that the calibration factors based on the measurements of the calibration phantoms were applicable to all of the official measurement results recorded in CY 2000. In the rare cases where the daily QC results were out of tolerance, worker data were reviewed for validity and when necessary workers were scheduled for recounts. There were no millennium transition-related problems associated with the startup of the Abacos software on January 3, 2000. 4.1.1 Program Documentation Three internal PNNL program manuals were updated during the year. Sections 2.0, 3.0, 4.0, 5.0, 7.0, and 8.0 of PNL-MA-574, In Vivo Monitoring Project Manual, were updated to reflect changes made when the Abacos software was put into routine use. Revision 5 of the QA Plan, LSC-021, was issued in September. The changes, which resulted from the annual review of the plan, updated the information on the organizational structure and clarified existing requirements. The operating procedures in PNL-MA-574 were revised on an as-needed basis to ensure that the procedures accurately reflect the methods used to perform the work.
4.3
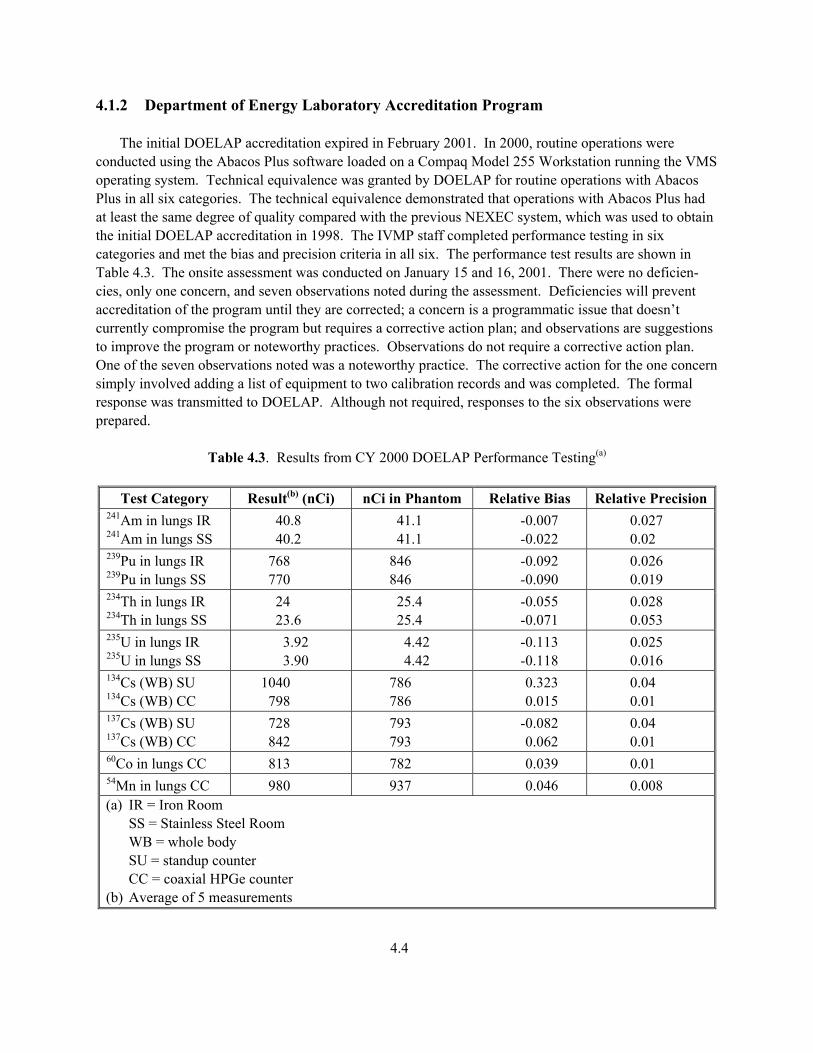
4.1.2 Department of Energy Laboratory Accreditation Program The initial DOELAP accreditation expired in February 2001. In 2000, routine operations were conducted using the Abacos Plus software loaded on a Compaq Model 255 Workstation running the VMS operating system. Technical equivalence was granted by DOELAP for routine operations with Abacos Plus in all six categories. The technical equivalence demonstrated that operations with Abacos Plus had at least the same degree of quality compared with the previous NEXEC system, which was used to obtain the initial DOELAP accreditation in 1998. The IVMP staff completed performance testing in six categories and met the bias and precision criteria in all six. The performance test results are shown in Table 4.3. The onsite assessment was conducted on January 15 and 16, 2001. There were no deficien-cies, only one concern, and seven observations noted during the assessment. Deficiencies will prevent accreditation of the program until they are corrected; a concern is a programmatic issue that doesn’t currently compromise the program but requires a corrective action plan; and observations are suggestions to improve the program or noteworthy practices. Observations do not require a corrective action plan. One of the seven observations noted was a noteworthy practice. The corrective action for the one concern simply involved adding a list of equipment to two calibration records and was completed. The formal response was transmitted to DOELAP. Although not required, responses to the six observations were prepared.
Table 4.3. Results from CY 2000 DOELAP Performance Testing(a)
Test Category Result(b) (nCi) nCi in Phantom Relative Bias Relative Precision
241Am in lungs IR 241Am in lungs SS
40.8 40.2
41.1 41.1
-0.007 -0.022
0.027 0.02
239Pu in lungs IR 239Pu in lungs SS
768 770
846 846
-0.092 -0.090
0.026 0.019
234Th in lungs IR 234Th in lungs SS
24 23.6
25.4 25.4
-0.055 -0.071
0.028 0.053
235U in lungs IR 235U in lungs SS
3.92 3.90
4.42 4.42
-0.113 -0.118
0.025 0.016
134Cs (WB) SU 134Cs (WB) CC
1040 798
786 786
0.323 0.015
0.04 0.01
137Cs (WB) SU 137Cs (WB) CC
728 842
793 793
-0.082 0.062
0.04 0.01
60Co in lungs CC 813 782 0.039 0.01 54Mn in lungs CC 980 937 0.046 0.008 (a) IR = Iron Room
SS = Stainless Steel Room WB = whole body SU = standup counter CC = coaxial HPGe counter
(b) Average of 5 measurements
4.4

4.1.3 Equipment Maintenance and Repair Three HPGe detectors required repair during the year. Other electronic components that also were repaired included:
• 11 main amplifiers • 3 nuclear instrument module (NIM) bins • 1 high-voltage power supply • 1 preamplifier power supply
This resulted in an estimated $15,000 cost savings compared with shipping the detectors and electronic components offsite for repair. One NIM bin that was still under warranty was returned to the factory for repair. The portable counting system described in last year’s annual report consists of a 28-cm2 by 20-mm-thick planar HPGe detector, a laptop computer, and a single electronics module. The system was calibrated for low- and high-energy wound counting this year. The low-energy configuration has a conversion gain of 0.25 keV/channel with 2,048 channels for counting of nuclides that emit photons with energies up to 200 keV. The high-energy configuration has a conversion gain of 1.5 keV/channel using 2,048 channels to detect and quantify nuclides that emit photons with energies up to 3 MeV. The system has proven to be very stable. The MDAs for americium and plutonium in a shallow puncture wound are 10 pCi and 200 pCi, respectively. The operating procedure was written and staff were trained on the operation of the counting system. A new Access database was developed to document instrument and detector repair histories. The Access database replaces the “Yourway” card file software that had no user documentation. The database allows the maintenance histories to be accessed by equipment type and property number. The battery capacity of the uninterruptible power supply system was checked and found to be adequate to provide sufficient (40 to 50 minutes) backup power to allow shutdown of the critical instrumentation during business hours. In September, the amount of time required to transfer and save the spectral configurations to the Alphastation disk began to increase for the standup and coaxial counters. At times, 2 to 3 minutes are required to completely save the configurations to disk. The chest-counting systems take much less time to complete the same “transfer and save” process. Two VMS utilities, Autogen and Monitor, were run to optimize system parameters. The optimization had little impact on the times required to save the spectral configurations. The system memory was increased from 96 Mb to 256 Mb again with no observable increase in the processing speed. It appears that reducing the number of files stored on the user disk will be required to improve the processing speed. A direct connection to LaserREX will be established in CY 2001 to facilitate removing the files.
4.5
The seven rectangular NaI detectors from the mobile counter were installed in the Lead Room. A lie-down counter was fabricated using the detectors to serve as a backup to the standup counter. The system was tested and found to be ready for acquiring data. It will take a week to ready the system for routine operation if needed. 4.1.4 Facility-Related Activities The 747 Building complex was sold to Mr. James Go in June. The IVMP currently has a 5-year lease agreement to occupy the 747-A Building with options for two additional 5-year extensions. The owner promptly addressed all facility issues that occurred since June. 4.1.5 Historical In Vivo Measurement Records With assistance from PNNL Information Systems, the Oracle database was restored to the pre-crash configuration that contained records through October 21, 1999. The database contained the records for all the in vivo measurements performed from March 1995 through October 21, 1999. The records were saved to compact disks (CDs) in ASCII format and Oracle (Version 8.1.6) format for future access. The Oracle format will allow access in the near future (3 to 5 years) and the ASCII format will allow retrieval of the data for the foreseeable future. Explanations of the data format were generated and included on the CD. 4.2 Program Changes and Improvements The first full year of operation using the Abacos Plus software was completed in CY 2000. Overall, the system operated reliably. Several programs were written to provide customized tools for error checking, data handling, and analysis of data. Code was written to 1) perform mean blank value analyses, 2) evaluate the false positive rate, 3) add multiple spectra, 4) eliminate the generation of duplicate tagwords, 5) monitor the number of files transferred to REX, and 6) check the tagword sequence to help identify whether there are any missing records. In addition, a new plotting routine with much better resolution than the standard Abacos Plus plotting package was added as an option. Shielded cables were fabricated and installed for the coaxial HPGe motion control system to reduce the level of electromagnetic interference generated by the operation of the motion controller. The interference contributed to the background count rate in the low-energy region and also degraded the system resolution. On December 11, the three ADIT photomultiplier tubes (PMTs) on the 11.5-inch sodium iodide detector used on the standup counter were replaced. This detector was experiencing changes in gain that were inversely proportional to the temperature. The new PMT manufactured by Hammamatsu, Inc. reduced the 40K background level, and more importantly, stabilized the troublesome gain drift (inversely proportional to temperature) associated with the other PMT. The QC parameters for 40K were adjusted to account for the decrease in the potassium activity.
4.6
Four digital signal-processing (DSP) units were installed in the Stainless Steel Room. One DSP replaces an amplifier and an analog-to-digital converter. The four DSP together eliminate the need for a multiplexer. This system will allow individual detector start/stop control and may improve system performance. A digital signal is transmitted from the Counting Room to the multichannel analyzer (MCA) located 30 feet away in the instrument rack; this eliminates amplification of analog noise signals from the cable. The DSP arrangement was configured on the Abacos Plus software for data acquisition and tested. Preliminary results indicated that the system was operating properly. More extensive testing is scheduled for CY 2001. The chest-counting calibration was extended to 5.3 cm from 4.1 cm by combining two overlays. This was done to account for the customers who have a predicted chest-wall thickness greater than 4.11 cm based on their weight-to-height ratio. If activity were detected above the Lc then the chest-wall thickness (CWT) would still be estimated using ultrasonic measurements. The manually operated assemblies for adjusting the attitude of the four detector arrays in the two chest-counting systems were replaced due to normal wear and tear from routine use. In addition, the micro switches for the Stainless Steel Room doorstop were replaced. A model was developed of a chest counting system and a source jig used for the daily QA checks using the Monte Carlo N-Particle (MCNP) transport code. The empirical and MCNP spectra are very similar with some variance in the MCNP data at certain energy ranges compared to the empirical data. This may be simply a matter of running more tallies with MCNP. The next step is to model a phantom with a radioactive material distribution and use MCNP to transport photons from a source organ to the detector. 4.3 Program Assessments Representatives from the Hanford contractors’ dosimetry organizations conducted the triennial assessment of the in vivo and internal dosimetry programs June 12 through 14 as part of the ongoing sitewide self-assessment process. There were two findings and six observations related to the in vivo program. Action plans for the findings and observations were completed. A procedure compliance surveillance was conducted as part of the 2000 management assessment. Corrective actions for the findings were completed. Representatives from U.S. Ecology (USE) conducted a one-day audit of the program. No findings resulted from the audit. The IVMP remains on the USE-approved vendor listing for in vivo services. 4.4 Supporting Technical Studies Six supporting technical studies were undertaken during 2000, as described in the following sections.
4.7
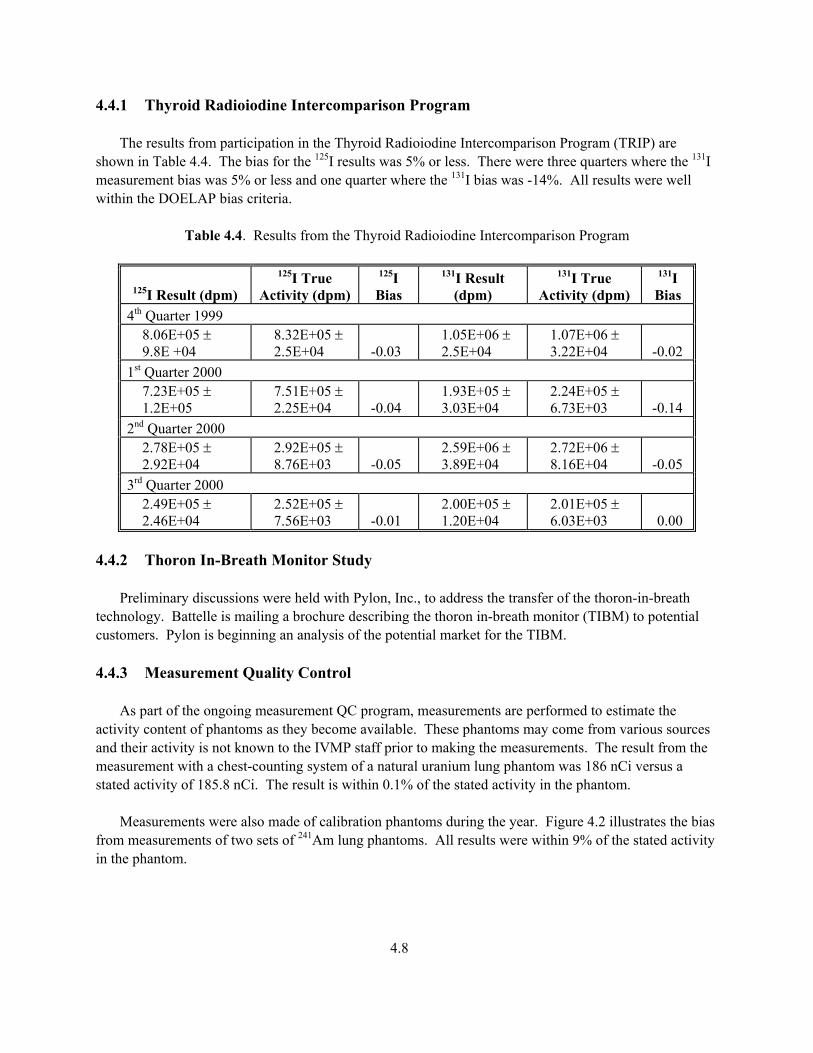
4.4.1 Thyroid Radioiodine Intercomparison Program The results from participation in the Thyroid Radioiodine Intercomparison Program (TRIP) are shown in Table 4.4. The bias for the 125I results was 5% or less. There were three quarters where the 131I measurement bias was 5% or less and one quarter where the 131I bias was -14%. All results were well within the DOELAP bias criteria.
Table 4.4. Results from the Thyroid Radioiodine Intercomparison Program
125I Result (dpm) 125I True
Activity (dpm) 125I Bias
131I Result (dpm)
131I True Activity (dpm)
131I Bias
4th Quarter 1999 8.06E+05 ± 9.8E +04
8.32E+05 ± 2.5E+04 -0.03
1.05E+06 ± 2.5E+04
1.07E+06 ± 3.22E+04 -0.02
1st Quarter 2000 7.23E+05 ± 1.2E+05
7.51E+05 ± 2.25E+04 -0.04
1.93E+05 ± 3.03E+04
2.24E+05 ± 6.73E+03 -0.14
2nd Quarter 2000 2.78E+05 ± 2.92E+04
2.92E+05 ± 8.76E+03 -0.05
2.59E+06 ± 3.89E+04
2.72E+06 ± 8.16E+04 -0.05
3rd Quarter 2000 2.49E+05 ± 2.46E+04
2.52E+05 ± 7.56E+03 -0.01
2.00E+05 ± 1.20E+04
2.01E+05 ± 6.03E+03 0.00
4.4.2 Thoron In-Breath Monitor Study Preliminary discussions were held with Pylon, Inc., to address the transfer of the thoron-in-breath technology. Battelle is mailing a brochure describing the thoron in-breath monitor (TIBM) to potential customers. Pylon is beginning an analysis of the potential market for the TIBM. 4.4.3 Measurement Quality Control As part of the ongoing measurement QC program, measurements are performed to estimate the activity content of phantoms as they become available. These phantoms may come from various sources and their activity is not known to the IVMP staff prior to making the measurements. The result from the measurement with a chest-counting system of a natural uranium lung phantom was 186 nCi versus a stated activity of 185.8 nCi. The result is within 0.1% of the stated activity in the phantom. Measurements were also made of calibration phantoms during the year. Figure 4.2 illustrates the bias from measurements of two sets of 241Am lung phantoms. All results were within 9% of the stated activity in the phantom.
4.8
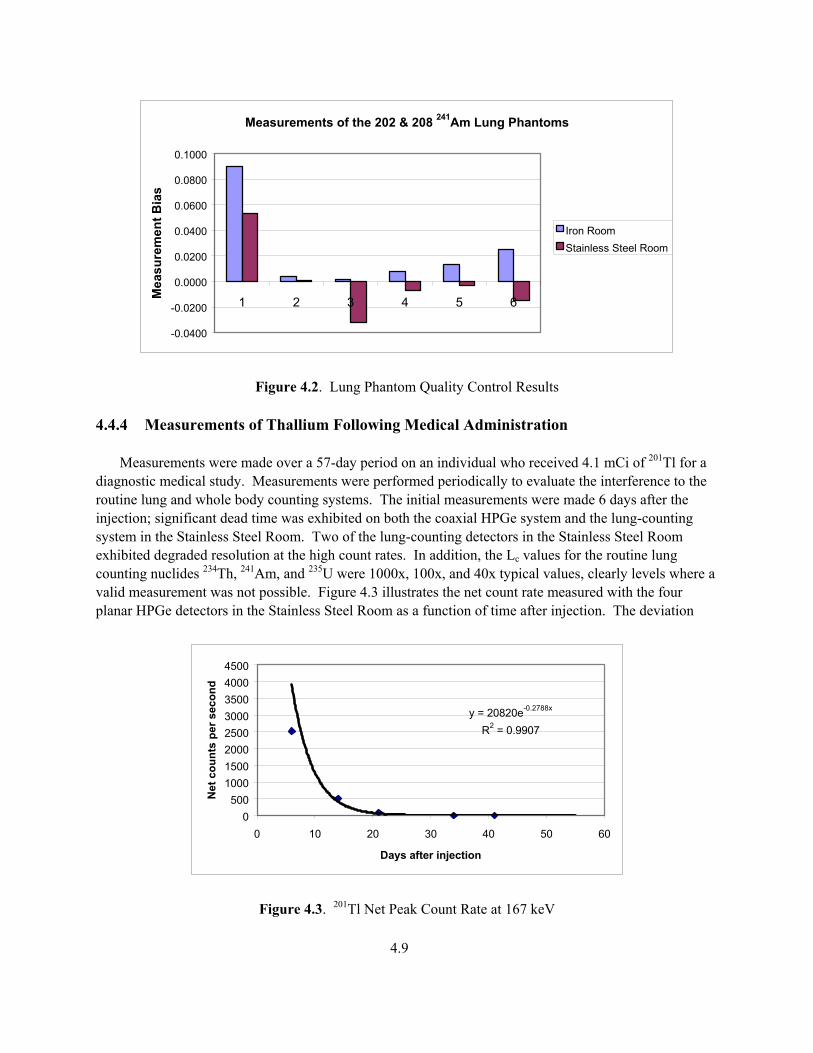
Measurements of the 202 & 208 241Am Lung Phantoms
-0.0400
-0.0200
0.0000
0.0200
0.0400
0.0600
0.0800
0.1000
1 2 3 4 5 6Mea
sure
men
t Bia
s
Iron RoomStainless Steel Room
Figure 4.2. Lung Phantom Quality Control Results 4.4.4 Measurements of Thallium Following Medical Administration Measurements were made over a 57-day period on an individual who received 4.1 mCi of 201Tl for a diagnostic medical study. Measurements were performed periodically to evaluate the interference to the routine lung and whole body counting systems. The initial measurements were made 6 days after the injection; significant dead time was exhibited on both the coaxial HPGe system and the lung-counting system in the Stainless Steel Room. Two of the lung-counting detectors in the Stainless Steel Room exhibited degraded resolution at the high count rates. In addition, the Lc values for the routine lung counting nuclides 234Th, 241Am, and 235U were 1000x, 100x, and 40x typical values, clearly levels where a valid measurement was not possible. Figure 4.3 illustrates the net count rate measured with the four planar HPGe detectors in the Stainless Steel Room as a function of time after injection. The deviation
y = 20820e-0.2788x
R2 = 0.9907
0500
10001500200025003000350040004500
0 10 20 30 40 50 6
Days after injection
Net
cou
nts
per s
econ
d
0
Figure 4.3. 201Tl Net Peak Count Rate at 167 keV
4.9
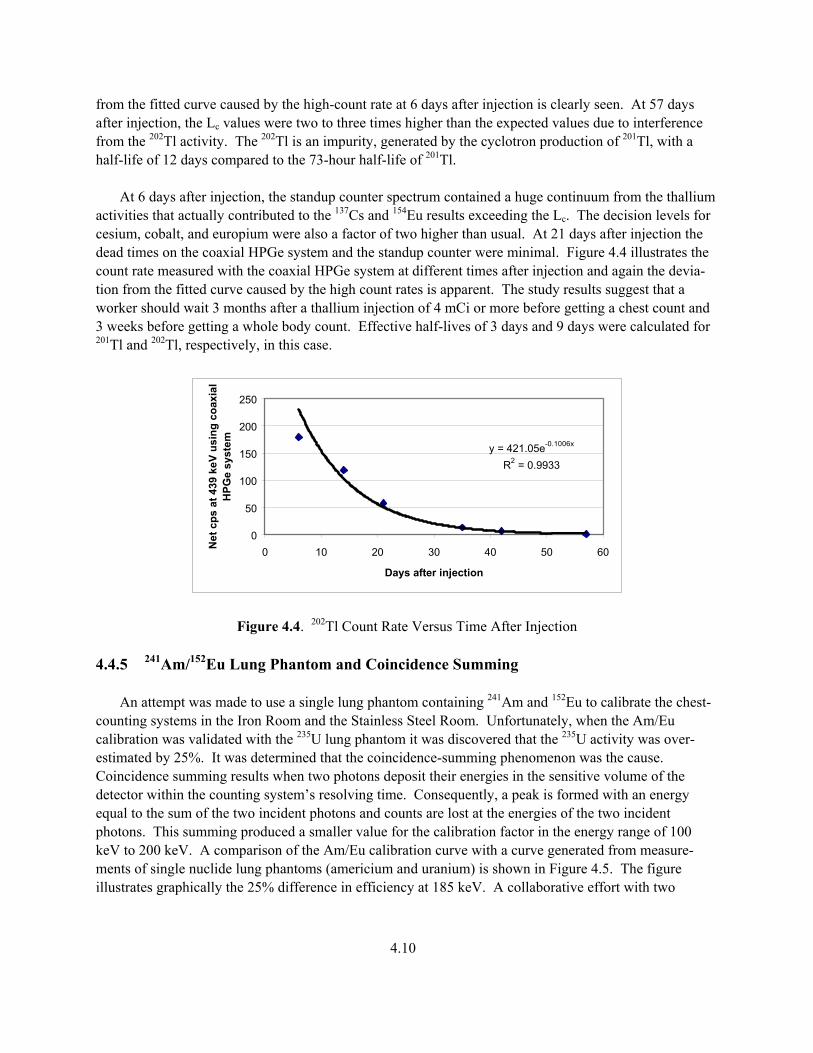
from the fitted curve caused by the high-count rate at 6 days after injection is clearly seen. At 57 days after injection, the Lc values were two to three times higher than the expected values due to interference from the 202Tl activity. The 202Tl is an impurity, generated by the cyclotron production of 201Tl, with a half-life of 12 days compared to the 73-hour half-life of 201Tl. At 6 days after injection, the standup counter spectrum contained a huge continuum from the thallium activities that actually contributed to the 137Cs and 154Eu results exceeding the Lc. The decision levels for cesium, cobalt, and europium were also a factor of two higher than usual. At 21 days after injection the dead times on the coaxial HPGe system and the standup counter were minimal. Figure 4.4 illustrates the count rate measured with the coaxial HPGe system at different times after injection and again the devia-tion from the fitted curve caused by the high count rates is apparent. The study results suggest that a worker should wait 3 months after a thallium injection of 4 mCi or more before getting a chest count and 3 weeks before getting a whole body count. Effective half-lives of 3 days and 9 days were calculated for 201Tl and 202Tl, respectively, in this case.
y = 421.05e-0.1006x
R2 = 0.9933
0
50
100
150
200
250
0 10 20 30 40 50 60
Days after injection
Net
cps
at 4
39 k
eV u
sing
coa
xial
H
PGe
syst
em
Figure 4.4. 202Tl Count Rate Versus Time After Injection 4.4.5 241Am/152Eu Lung Phantom and Coincidence Summing An attempt was made to use a single lung phantom containing 241Am and 152Eu to calibrate the chest-counting systems in the Iron Room and the Stainless Steel Room. Unfortunately, when the Am/Eu calibration was validated with the 235U lung phantom it was discovered that the 235U activity was over-estimated by 25%. It was determined that the coincidence-summing phenomenon was the cause. Coincidence summing results when two photons deposit their energies in the sensitive volume of the detector within the counting system’s resolving time. Consequently, a peak is formed with an energy equal to the sum of the two incident photons and counts are lost at the energies of the two incident photons. This summing produced a smaller value for the calibration factor in the energy range of 100 keV to 200 keV. A comparison of the Am/Eu calibration curve with a curve generated from measure-ments of single nuclide lung phantoms (americium and uranium) is shown in Figure 4.5. The figure illustrates graphically the 25% difference in efficiency at 185 keV. A collaborative effort with two
4.10
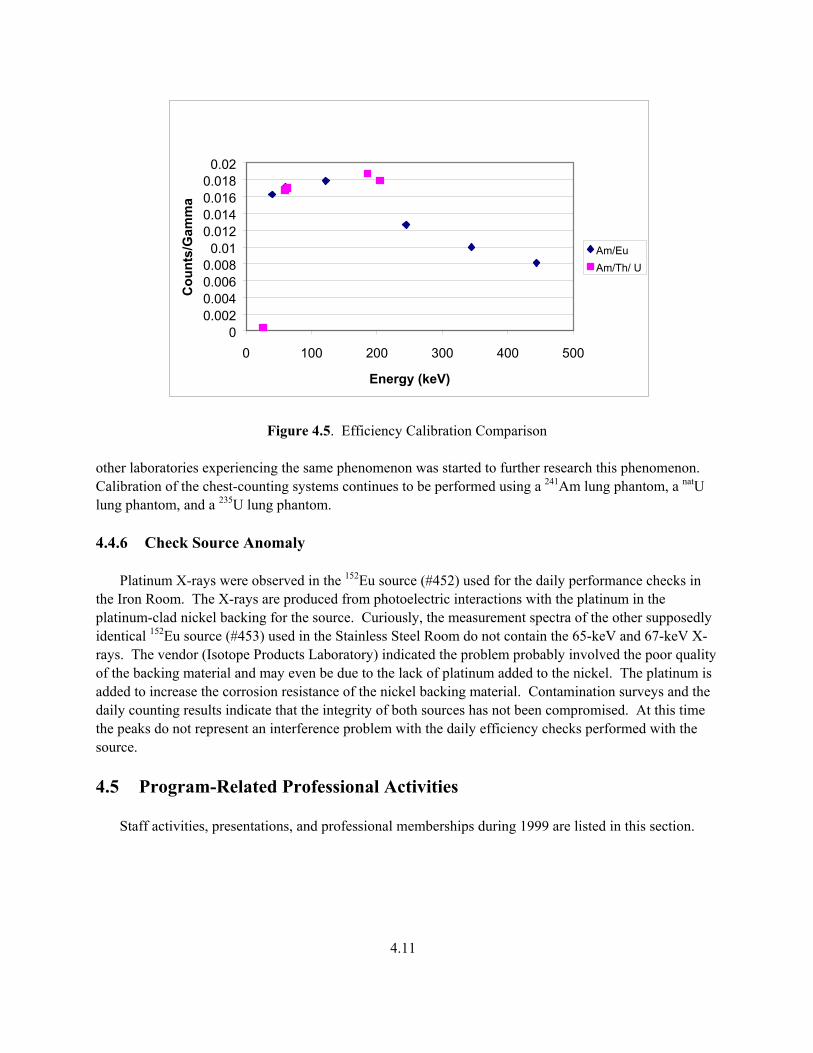
00.0020.0040.0060.0080.01
0.0120.0140.0160.0180.02
0 100 200 300 400 500
Energy (keV)
Cou
nts/
Gam
ma
Am/EuAm/Th/ U
Figure 4.5. Efficiency Calibration Comparison other laboratories experiencing the same phenomenon was started to further research this phenomenon. Calibration of the chest-counting systems continues to be performed using a 241Am lung phantom, a natU lung phantom, and a 235U lung phantom. 4.4.6 Check Source Anomaly Platinum X-rays were observed in the 152Eu source (#452) used for the daily performance checks in the Iron Room. The X-rays are produced from photoelectric interactions with the platinum in the platinum-clad nickel backing for the source. Curiously, the measurement spectra of the other supposedly identical 152Eu source (#453) used in the Stainless Steel Room do not contain the 65-keV and 67-keV X-rays. The vendor (Isotope Products Laboratory) indicated the problem probably involved the poor quality of the backing material and may even be due to the lack of platinum added to the nickel. The platinum is added to increase the corrosion resistance of the nickel backing material. Contamination surveys and the daily counting results indicate that the integrity of both sources has not been compromised. At this time the peaks do not represent an interference problem with the daily efficiency checks performed with the source. 4.5 Program-Related Professional Activities Staff activities, presentations, and professional memberships during 1999 are listed in this section.
4.11
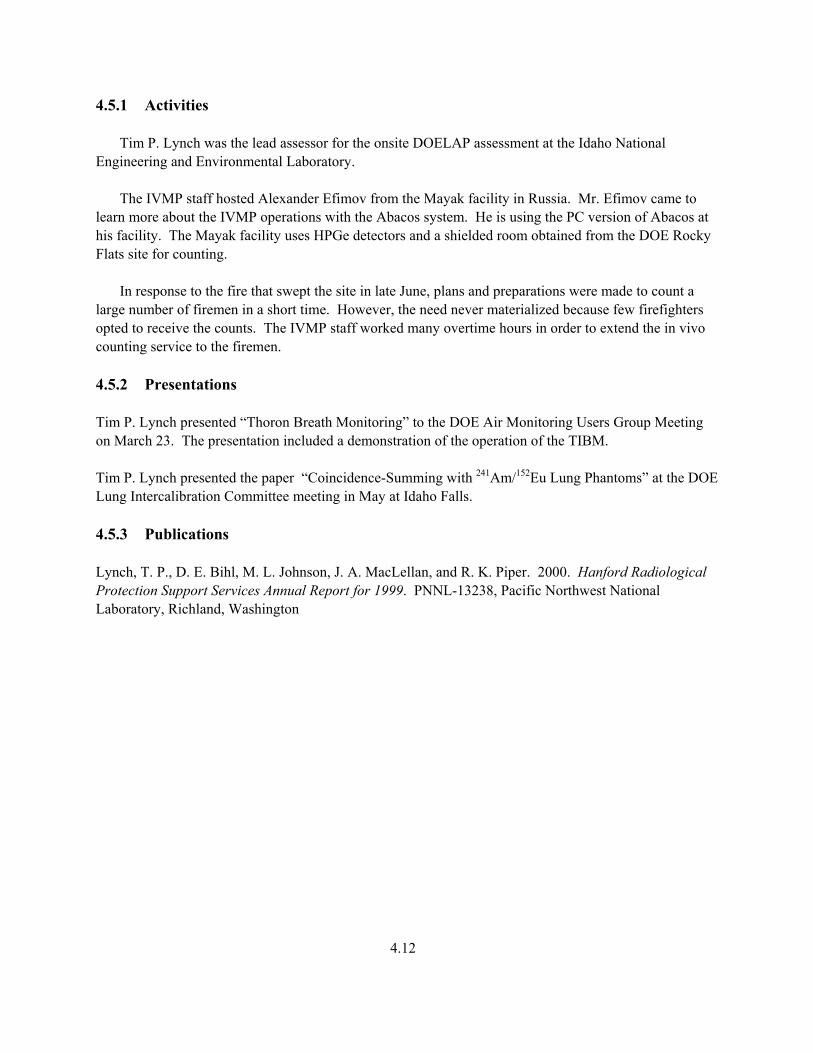
4.5.1 Activities Tim P. Lynch was the lead assessor for the onsite DOELAP assessment at the Idaho National Engineering and Environmental Laboratory. The IVMP staff hosted Alexander Efimov from the Mayak facility in Russia. Mr. Efimov came to learn more about the IVMP operations with the Abacos system. He is using the PC version of Abacos at his facility. The Mayak facility uses HPGe detectors and a shielded room obtained from the DOE Rocky Flats site for counting. In response to the fire that swept the site in late June, plans and preparations were made to count a large number of firemen in a short time. However, the need never materialized because few firefighters opted to receive the counts. The IVMP staff worked many overtime hours in order to extend the in vivo counting service to the firemen. 4.5.2 Presentations Tim P. Lynch presented “Thoron Breath Monitoring” to the DOE Air Monitoring Users Group Meeting on March 23. The presentation included a demonstration of the operation of the TIBM. Tim P. Lynch presented the paper “Coincidence-Summing with 241Am/152Eu Lung Phantoms” at the DOE Lung Intercalibration Committee meeting in May at Idaho Falls. 4.5.3 Publications Lynch, T. P., D. E. Bihl, M. L. Johnson, J. A. MacLellan, and R. K. Piper. 2000. Hanford Radiological Protection Support Services Annual Report for 1999. PNNL-13238, Pacific Northwest National Laboratory, Richland, Washington
4.12
5.0 Hanford Radiation Records Program The Hanford Radiation Records Program (HRRP) supports RL and Hanford contractor radiation protection programs by administering and preserving radiological exposure records for all Hanford workers and visitors, past and present, and by providing specified and requested reports using these records. The program is also responsible for maintaining the Hanford Radiation Protection Historical Files; operating the computer systems and library equipment necessary to input, store, verify, and retrieve the records; and producing the required reports and downloads. Although data processing functions are now the responsibility of Dosimetry Services, data entry and validation are reported in this section. 5.1 Overview The HRRP is organized into four major functional areas: data administration, data processing, report issuance, and the Records Library, as described in the following sections. Data processing and part of report issuance are performed by the HRRP Dosimetry Services Dosimetry Operations. 5.1.1 Database Administration The database administrators evaluate systems, troubleshoot, resolve system and user problems, train users, oversee system security, serve as liaisons with the computer analysts, and initiate and test modifications of the databases for the REX database and Access Control Entry System (ACES). The ACES data administrator provides monthly reports of entry and dose data to PNNL and FH. Upon request, the data administrator also provides personnel qualification reports to federal and state regulators, and adjusts the Administrative Control Limits (ACLs) for individuals in accordance with established policies. The data administrator monitors data downloads for accuracy, and is the point of contact for access qualification or system problems. The data administrator also initiates, tracks, and participates in the evaluation and review of system change requests. The ACES was created to implement a system for computerized supplemental dose tracking and radiation area/hazardous waste site access control. It is a computerized access control program that electronically compares worker qualifications with controlled area access requirements. Although HRRP has data administration responsibilities for ACES, FH retains ownership. However, the HRRP manager works closely with the FH ACES manager and Lockhead Martin Services, Inc., (LMSI) personnel in the operation and maintenance of the system. ACES is a client-server system, hosted on an HP 9000 computer (four 180-MHz processors) using the Hewlett Packard Unix operating system and Oracle software to manage the database and provide entry screens and reports. Users access the server via PCs connected to the Hanford Local Area Network (HLAN) using Windows-based software residing on the users’ (clients’) computers. The database receives data from several other Hanford computer systems (e.g., PeopleSoft, REX, and PeopleCORE). The REX system is a computerized database that maintains all of the radiological exposure records and supplementary and support data for individuals who have worked at the Hanford Site since 1946.
5.1
The REX system contains the individual radiological exposure records on all Hanford DOE, contractor, and subcontractor employees as well as Hanford visitors. The system also contains other information used by site radiation protection organizations such as individual skin contamination reports and bioassay schedules and delivery addresses. These data are readily retrievable via a system of PCs and terminals operated by the HRRP and Hanford contractor dosimetry staffs. The REX system also includes support-ing exposure documentation on microfilm and CD that are indexed into computer-assisted retrieval (CAR) systems. The CAR systems allow for rapid retrieval of the documents for any individual person using identifiers (IDs). These IDs include payroll numbers, social security numbers, names, and/or REX IDs, which are unique numbers generated by the computer for each individual to tie all of their records together. The HRRP also uses a CD imaging subsystem for hard-copy documents. The imaging and storage hardware is used by two systems, a personnel exposure document system (LaserREX), and an instrument calibration record system (LaserCAL). Since January 1, 1992, all hard-copy exposure records have been preserved on LaserREX. Hard-copy records generated prior to 1992 are maintained on microfilm. The LaserREX also stores the electronic records created by the REX transaction log subsystem, which logs all changes to the database data fields. 5.1.2 Data Processing Data processing includes entering data into the REX database and validating all data entry. This function is actually the responsibility of the Dosimetry Processing Center for DOE and FH data, and PNNL Safety and Health Technology and Bechtel Radiological Control for their own data. Data valida-tion is accomplished by reviewing field data entry, establishing audits to be matched to entries of results, resolving unmatched results, and interacting directly with contractor personnel. Data handlers also deal directly with contractor personnel and data suppliers to assist them and solve data problems. The Dosimetry Processing Center also issues, tracks, and processes dosimeters for FH and DOE. 5.1.3 Report Issuance The report issuance function is shared by HRRP and the Data Processing Center. The Data Processing Center is responsible for generating and issuing routine exposure status reports to the contractors, quarterly person-rem and annual statistical reports to DOE, and annual reports to employees. This function requires close contact with RL, the contractors, and other personnel dosimetry functions. Special reports requested by former employees, as well as those requested by the contractors, RL, the United States Uranium and Transuranium Registries, and Privacy Act and Freedom of Information Act petitions are the responsibility of HRRP. 5.1.4 Records Library The Records Library maintains individual exposure records and backup documentation that are not reducible to database elements, as well as the HRRP Historical Files. The library staff scan, index, and retrieve hard-copy documents; prepare documents for long-term storage; and track and account for the documents through the imaging and indexing process. The library contains the individual exposure records of all Hanford personnel since Hanford’s inception in 1944 (almost five million microforms),
5.2
except for those individuals who transferred from Hanford when DuPont left in 1946. These exposure records and the Historical File microforms are retrievable through index systems that are maintained by the library staff. Although the results from the dosimeter and excreta processing, as well as the in vivo counts, are received by electronic transmission, a large amount of data is entered manually by the field dosimetry organizations and the Data Processing Center staff. The hard copies are then sent to the library for preservation on the imaging systems. Records in the HRRP Historical Files include documents such as policies, procedures, reports, and important communications that define the Hanford radiological dosimetry and radiation protection programs throughout their history. The historical records are microfilmed and indexed into an additional CAR system. These records are retrievable by author, date, or range of dates, document number (if applicable), document title, and up to three keywords. Starting September 20, 1999, the LaserREX document scanning and retrieval hardware was shared with a new document database for Instrument Services and Technology, LaserCAL. The system was cloned from LaserREX, and is operated by the Records Library staff. The program is operated under the applicable sections of 10 CFR 830 and 10 CFR 835; ANSI N13.6, American National Standard Practice for Occupational Radiation Exposure Records Systems (ANSI 1999); as well as the following DOE directives: DOE Guide 1324.5B, Implementation Guide for Use with 36 CFR Chapter XII - Subchapter B Records Management (DOE 1996); DOE Guide 441.1-11, Occupational Radiation Protection Record-Keeping and Reporting Guide (DOE 1999c), DOE Order 231.1-1, Environment, Safety and Health Reporting (DOE 1997); and DOE Manual 231.1-1, Environment, Safety and Health Reporting Manual (DOE 2000). The program also complies with the applicable sections of the Privacy Act (1974) and the Freedom of Information Act (FOIA 1966). 5.2 Routine Operations Staff routinely administer and process data, issue reports, and maintain the Records Library. 5.2.1 Data Administration Over 2441 Radiation Work Permits (RWPs) were created/closed in ACES in 2000, and over 252,603 access instances occurred. The REX database administrator completed 56 software change requests in 200 to REX Version 2, and an additional 11 to Version 3 after implementation in October. 5.2.2 Data Processing In most categories, the number of documents sent from the Data Processing Center to the HRRP records library decreased from 1999 totals (see Table 5.1). However, the total number of documents scanned increased by 50 percent. The increase was due to operation of LaserCAL for the full year, and the decision to enter the “Report of Hanford Occupational Radiation Dose Status” (report card) in the LaserREX system for each person.
5.3
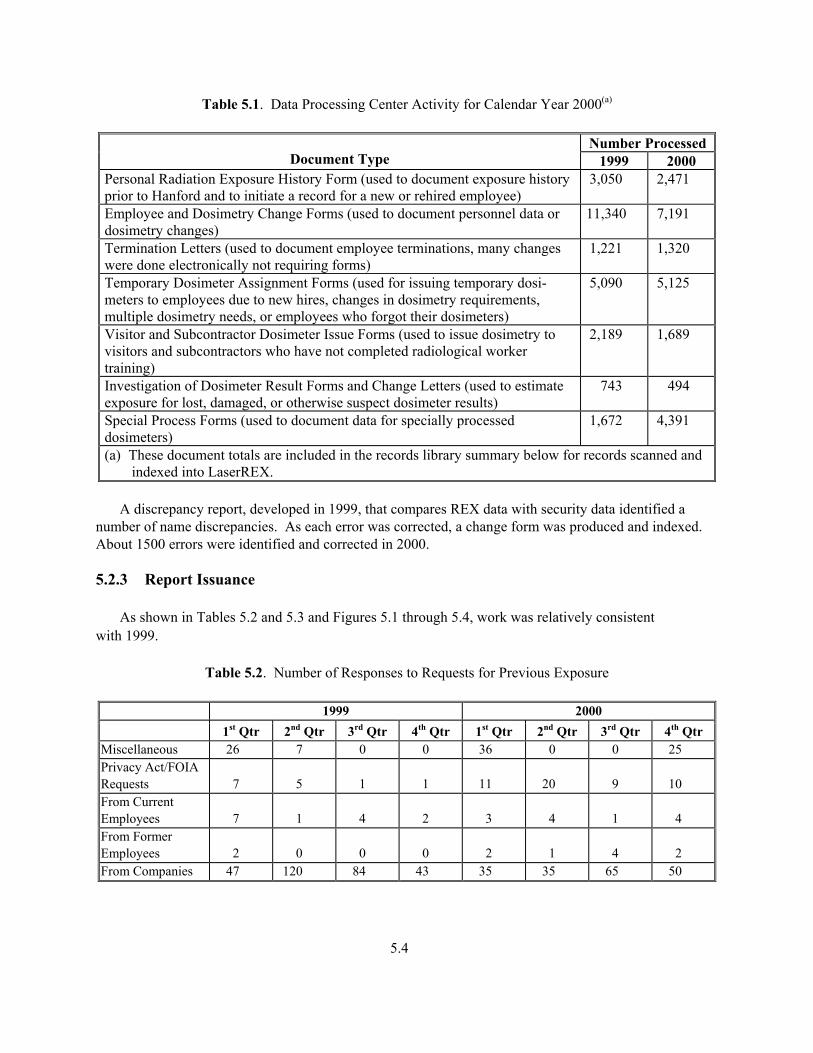
Table 5.1. Data Processing Center Activity for Calendar Year 2000(a)
Number Processed Document Type 1999 2000
Personal Radiation Exposure History Form (used to document exposure history prior to Hanford and to initiate a record for a new or rehired employee)
3,050 2,471
Employee and Dosimetry Change Forms (used to document personnel data or dosimetry changes)
11,340 7,191
Termination Letters (used to document employee terminations, many changes were done electronically not requiring forms)
1,221 1,320
Temporary Dosimeter Assignment Forms (used for issuing temporary dosi-meters to employees due to new hires, changes in dosimetry requirements, multiple dosimetry needs, or employees who forgot their dosimeters)
5,090 5,125
Visitor and Subcontractor Dosimeter Issue Forms (used to issue dosimetry to visitors and subcontractors who have not completed radiological worker training)
2,189 1,689
Investigation of Dosimeter Result Forms and Change Letters (used to estimate exposure for lost, damaged, or otherwise suspect dosimeter results)
743 494
Special Process Forms (used to document data for specially processed dosimeters)
1,672 4,391
(a) These document totals are included in the records library summary below for records scanned and indexed into LaserREX.
A discrepancy report, developed in 1999, that compares REX data with security data identified a number of name discrepancies. As each error was corrected, a change form was produced and indexed. About 1500 errors were identified and corrected in 2000. 5.2.3 Report Issuance As shown in Tables 5.2 and 5.3 and Figures 5.1 through 5.4, work was relatively consistent with 1999.
Table 5.2. Number of Responses to Requests for Previous Exposure
1999 2000 1st Qtr 2nd Qtr 3rd Qtr 4th Qtr 1st Qtr 2nd Qtr 3rd Qtr 4th Qtr
Miscellaneous 26 7 0 0 36 0 0 25 Privacy Act/FOIA Requests 7 5 1 1 11 20 9 10 From Current Employees 7 1 4 2 3 4 1 4 From Former Employees 2 0 0 0 2 1 4 2 From Companies 47 120 84 43 35 35 65 50
5.4
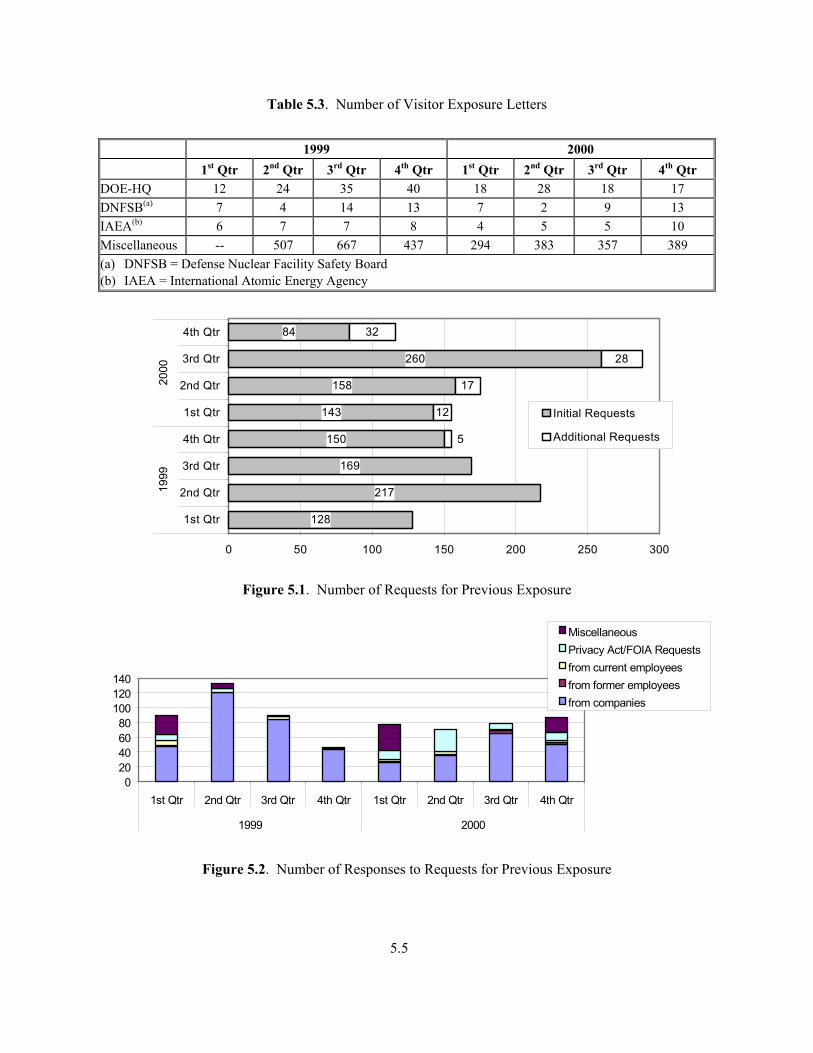
Table 5.3. Number of Visitor Exposure Letters
1999 2000 1st Qtr 2nd Qtr 3rd Qtr 4th Qtr 1st Qtr 2nd Qtr 3rd Qtr 4th Qtr
DOE-HQ 12 24 35 40 18 28 18 17 DNFSB(a) 7 4 14 13 7 2 9 13 IAEA(b) 6 7 7 8 4 5 5 10 Miscellaneous -- 507 667 437 294 383 357 389 (a) DNFSB = Defense Nuclear Facility Safety Board (b) IAEA = International Atomic Energy Agency
128
217
169
150
143
158
260
84
12
17
28
32
5
0 50 100 150 200 250 300
1st Qtr
2nd Qtr
3rd Qtr
4th Qtr
1st Qtr
2nd Qtr
3rd Qtr
4th Qtr
1999
2000
Initial Requests
Additional Requests
Figure 5.1. Number of Requests for Previous Exposure
020406080
100120140
1st Qtr 2nd Qtr 3rd Qtr 4th Qtr 1st Qtr 2nd Qtr 3rd Qtr 4th Qtr
1999 2000
MiscellaneousPrivacy Act/FOIA Requestsfrom current employeesfrom former employeesfrom companies
Figure 5.2. Number of Responses to Requests for Previous Exposure
5.5
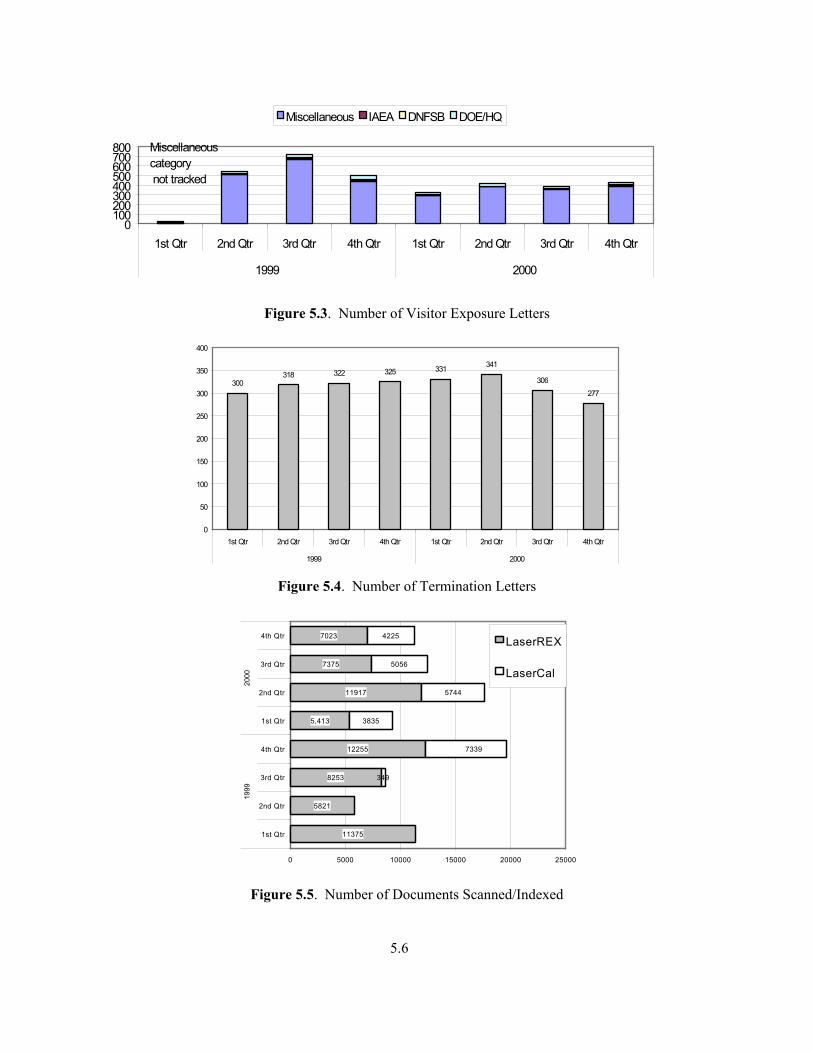
0100200300400500600700800
1st Qtr 2nd Qtr 3rd Qtr 4th Qtr 1st Qtr 2nd Qtr 3rd Qtr 4th Qtr
1999 2000
Miscellaneous IAEA DNFSB DOE/HQ
Miscellaneous category not tracked
Figure 5.3. Number of Visitor Exposure Letters
300318 322 325 331 341
306277
0
50
100
150
200
250
300
350
400
1st Qtr 2nd Qtr 3rd Qtr 4th Qtr 1st Qtr 2nd Qtr 3rd Qtr 4th Qtr
1999 2000 Figure 5.4. Number of Termination Letters
11375
5821
8253
12255
5,413
11917
7375
7023
349
3835
5744
5056
4225
7339
0 5000 10000 15000 20000 25000
1st Qtr
2nd Qtr
3rd Qtr
4th Qtr
1st Qtr
2nd Qtr
3rd Qtr
4th Qtr
1999
2000
LaserREX
LaserCal
Figure 5.5. Number of Documents Scanned/Indexed
5.6
5.2.4 Records Library The number of documents scanned and indexed into the LaserREX and LaserCAL systems this year was up 11% from 1999, to about 50,000 documents. This was the first full year of operation of the LaserCAL system, which accounted for over one-third of the Records Library workload in 2000. Additionally, all “Report of Hanford Occupational Radiation Dose Status” (report card) documents were entered into the LaserREX system for the first time in 2000, adding about 7,500 documents scanned. These additions more than offset a decrease of 16% in the number of LaserREX documents scanned in 2000. 5.3 Program Changes and Improvements Database and document scanning capabilities were improved during the year, as described in the following sections. 5.3.1 ACES Database The original version of ACES was determined to not be Year 2000 (Y2K) compliant. Therefore, an upgrade (Version 6.0) was initiated in 1998 that maintained the established functionality, but in a Windows-based client-server environment that is fully Y2K compliant. The new system was imple-mented in early 1999. The ACES data administrator was very involved with testing screens and reports in Version 6.0 prior to its release, coordinating user field testing, developing the user manual, and training the users on the new system. ACES did not encounter any significant Y2K problems as it transitioned into the new year. In May 2000, ACES 6.5 was released with the upgrade to Oracle Developer 6.0, which included Oracle Forms Version 6.0 and Oracle Reports Version 6.0, to be compatible with the new REX Oracle Runtime and Development tools. In the third and fourth quarters of 2000, efforts were concentrated on the development of ACES 7.0, which allows the incorporation of external equipment to the ACES computers, such as the electronic dosimeter readers, brick (pseudo dosimeter) label printers, and bar code readers. 5.3.2 REX Database Battelle, along with the major REX users, agreed in 1999 that the system needed to be redeveloped/ re-hosted into a more cost-effective environment, and a contract was signed with the Science Applications International Corporation (SAIC) to redevelop the system. The user interface was developed using the Oracle Developer 2000 suite of tools. The Oracle-based client server system was released for production use on October 2, 2000. The REX Version 2 database was migrated from a DB2 database, residing on an IBM mainframe computer to an Oracle database (REX Version 3), residing on a UNIX platform on a Sun Microsystems Enterprise server operated by PNNL. The last REX-related system on the IBM mainframe computer was removed in December.
5.7
The REX database performed very well all year (both Version 2 and Version 3). Software Change Requests (SCRs) were kept to a minimum to avoid having to coordinate and implement new code in both systems. However, during the re-hosting effort, each of the processes, screens, and reports were reviewed and modified as identified by the REX users. Most of the SCRs issued during the year were for changes and enhancements to make the operations more efficient and data entry less cumbersome. The REX User’s Group, initiated late in 1993, was instrumental in proposing and defining many of the enhancements and changes. The REX database administrator and the LMSI maintenance programmer completed 56 software change requests for REX Version 2 in 2000, before a moratorium was placed on REX changes the end of April, in anticipation of the REX Version 3 migration. SCR work was resumed on REX Version 3 the end of October, and 11 additional SCRs were completed in 2000. Some of the significant changes included the following:
• corrected screens, reports, and programs to reflect the mass personnel transfers from B&W Protec, Inc. to Protection Technology Hanford, and LMSI to CHG.
• revised the format of the visitor and termination letters
• provided automated notifications to ACES when processes did not run as expected.
5.3.3 Document Scanning The LaserREX system consists a single 350-MHz dual processor Gateway ALR 7200 server using Windows NT, coupled with two computer workstations, each with an optical scanner. There were no major periods of unavailability this year. LaserCAL uses existing LaserREX hardware with modified software cloned from LaserREX. LaserCAL provides a retrievable document database for the Instrument Services and Technology Project. About one-third of the documents scanned and indexed by Radiation Records are now for the Instrument Services and Technology Project. The Hanford Identification Number was added to the keywords of the LaserREX system in 2000. This was necessary because of the planned elimination of the Payroll ID number by the Hanford Site. 5.4 Program Assessment There were no assessments or surveillances of Radiation Records performed during 2000. 5.5 Supporting Projects None
5.8

5.6 Program-Related Professional Activities Jay A. MacLellan served as:
• Chair of the American Academy of Health Physics Appeals Committee.
• President Elect, Columbia Chapter of the Health Physics Society (from June 2000).
5.9

6.0 Instrumentation Services and Technology Program The Instrumentation Services and Technology Project (IS&TP) provides complete and reliable calibration and maintenance services for Hanford Site contractors. The project calibrates and maintains radiation protection instrumentation that is used to ensure personnel safety in the Hanford workplace. Effective CY 2000, the project also calibrates and maintains measuring and test equipment that is used for occupational protection and for research projects on the Hanford Site. Specific tasks performed under this program during CY 2000 included calibration, maintenance, and repair of instrumentation; procurement and testing of new radiological control instruments; administration and technical support of the Hanford Instrument Evaluation Committee (HIEC); and maintenance of a pool of portable survey instruments available for use by site contractors. The operation of a complete radiation protection instrument calibration and maintenance program is an integral part of the Hanford Site Radiological Control Program. During CY 2000, IS&TP continued to provide complete instrument services including calibration, maintenance, repair, and records management. Procurement of new instruments is initiated by the site contractors, or jointly by the contractors through the HIEC, and the procurement costs are charged to the contractor using the instruments. The Hanford contractors, through the evaluation, calibration, and maintenance programs of IS&TP provide the site with high-quality instrumentation that is reliable, accurate, and capable of performing at the level necessary to ensure personnel safety as required by 10 CFR 835. Calibrations are performed using the mandatory guidance in ANSI N323-1978, Radiation Protection Instrumentation Test and Calibration (ANSI 1978). IS&TP activities fall under several basic tasks. These basic tasks are 1) administration of the Hanford Site pool of portable survey instruments; 2) calibration and maintenance of radiation detection instruments; 3) calibration and maintenance of measuring and test equipment; 4) evaluation and publication at Hanford Site of all site portable survey instrument environmental parameters; 5) maintenance of a calibration records database; 6) maintenance of all the necessary radiological, electronic, and mechanical standards traceable to NIST; and 7) administration and technical support of the HIEC. Several of these basic tasks and other important supporting tasks performed in CY 2000 are described in this chapter. 6.1 Routine Operations Routine operations include instrument pool management, calibration and maintenance services, and calibration record management, as described in the following sections. 6.1.1 Administration of the Portable Instrument Pool Administration of the portable instrument pool includes maintaining a sufficient inventory of commonly used instruments to ensure that there is a sufficient supply to meet the daily instrumentation
6.1
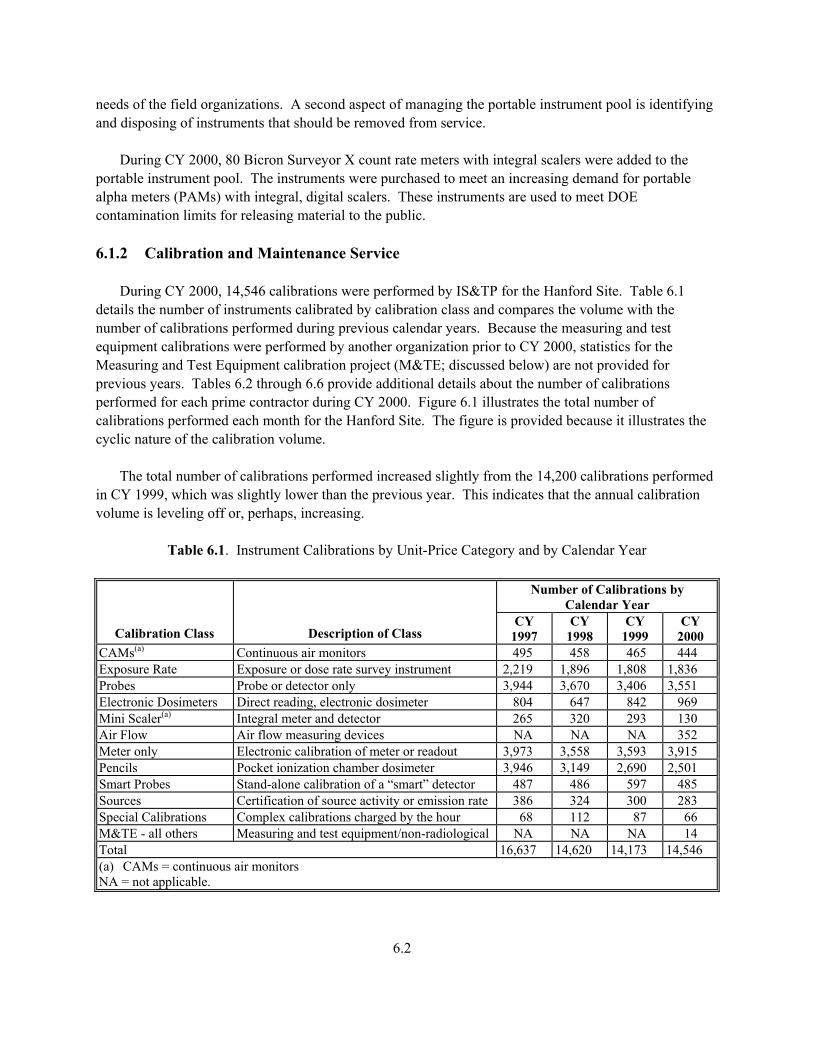
needs of the field organizations. A second aspect of managing the portable instrument pool is identifying and disposing of instruments that should be removed from service. During CY 2000, 80 Bicron Surveyor X count rate meters with integral scalers were added to the portable instrument pool. The instruments were purchased to meet an increasing demand for portable alpha meters (PAMs) with integral, digital scalers. These instruments are used to meet DOE contamination limits for releasing material to the public. 6.1.2 Calibration and Maintenance Service During CY 2000, 14,546 calibrations were performed by IS&TP for the Hanford Site. Table 6.1 details the number of instruments calibrated by calibration class and compares the volume with the number of calibrations performed during previous calendar years. Because the measuring and test equipment calibrations were performed by another organization prior to CY 2000, statistics for the Measuring and Test Equipment calibration project (M&TE; discussed below) are not provided for previous years. Tables 6.2 through 6.6 provide additional details about the number of calibrations performed for each prime contractor during CY 2000. Figure 6.1 illustrates the total number of calibrations performed each month for the Hanford Site. The figure is provided because it illustrates the cyclic nature of the calibration volume. The total number of calibrations performed increased slightly from the 14,200 calibrations performed in CY 1999, which was slightly lower than the previous year. This indicates that the annual calibration volume is leveling off or, perhaps, increasing.
Table 6.1. Instrument Calibrations by Unit-Price Category and by Calendar Year
Number of Calibrations by Calendar Year
Calibration Class Description of Class CY
1997 CY
1998 CY
1999 CY
2000 CAMs(a) Continuous air monitors 495 458 465 444 Exposure Rate Exposure or dose rate survey instrument 2,219 1,896 1,808 1,836 Probes Probe or detector only 3,944 3,670 3,406 3,551 Electronic Dosimeters Direct reading, electronic dosimeter 804 647 842 969 Mini Scaler(a) Integral meter and detector 265 320 293 130 Air Flow Air flow measuring devices NA NA NA 352 Meter only Electronic calibration of meter or readout 3,973 3,558 3,593 3,915 Pencils Pocket ionization chamber dosimeter 3,946 3,149 2,690 2,501 Smart Probes Stand-alone calibration of a “smart” detector 487 486 597 485 Sources Certification of source activity or emission rate 386 324 300 283 Special Calibrations Complex calibrations charged by the hour 68 112 87 66 M&TE - all others Measuring and test equipment/non-radiological NA NA NA 14 Total 16,637 14,620 14,173 14,546 (a) CAMs = continuous air monitors NA = not applicable.
6.2
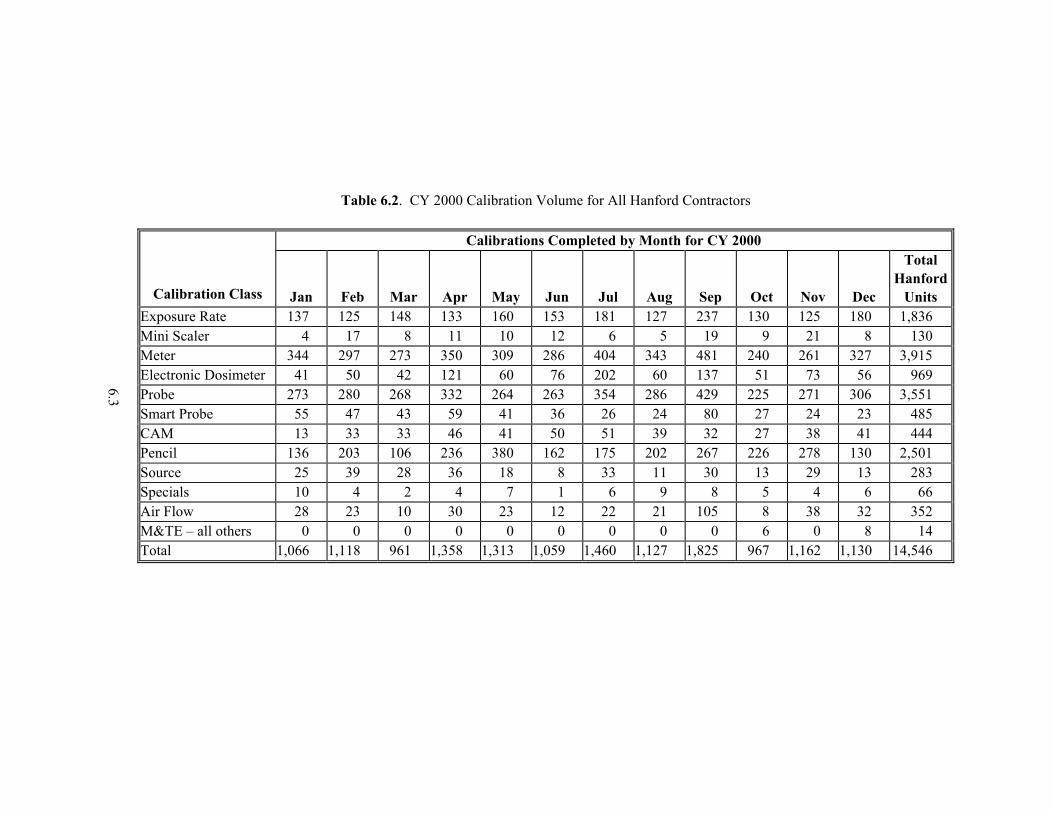
Table 6.2. CY 2000 Calibration Volume for All Hanford Contractors
Calibrations Completed by Month for CY 2000
Calibration Class Jan Feb Mar Apr May Jun Jul Aug Sep Oct Nov Dec
Total Hanford
Units Exposure Rate 137 125 148 133 160 153 181 127 237 130 125 180 1,836Mini Scaler 4 17 8 11 10 12 6 5 19 9 21 8 130Meter 344 297 273 350 309 286 404 343 481 240 261 327 3,915Electronic Dosimeter 41 50 42 121 60 76 202 60 137 51 73 56 969Probe 273 280 268 332 264 263 354 286 429 225 271 306 3,551Smart Probe 55 47 43 59 41 36 26 24 80 27 24 23 485CAM 13 33 33 46 41 50 51 39 32 27 38 41 444Pencil 136 203 106 236 380 162 175 202 267 226 278 130 2,501Source 25 39 28 36 18 8 33 11 30 13 29 13 283Specials 10 4 2 4 7 1 6 9 8 5 4 6 66Air Flow 28 23 10 30 23 12 22 21 105 8 38 32 352M&TE – all others 0 0 0 0 0 0 0 0 0 6 0 8 14Total 1,066 1,118 961 1,358 1,313 1,059 1,460 1,127 1,825 967 1,162 1,130 14,546
6.3
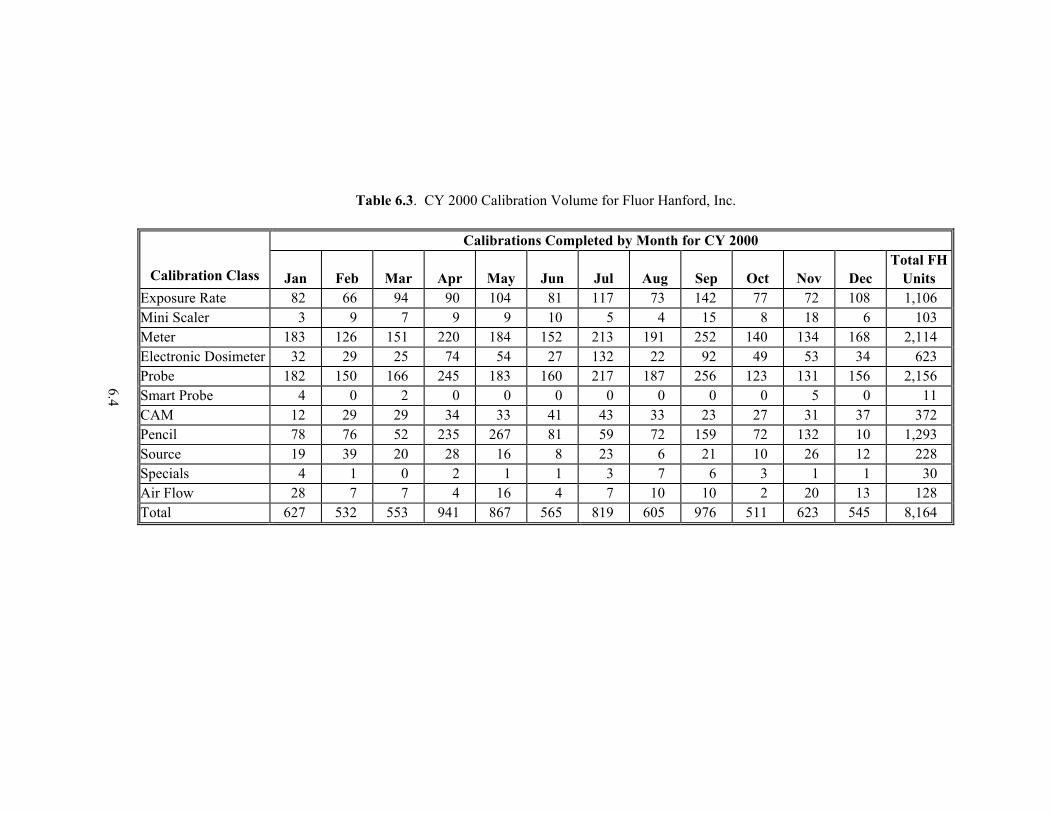
Table 6.3. CY 2000 Calibration Volume for Fluor Hanford, Inc.
Calibrations Completed by Month for CY 2000
Calibration Class Jan Feb Mar Apr May Jun Jul Aug Sep Oct Nov DecTotal FH
Units Exposure Rate 82 66 94 90 104 81 117 73 142 77 72 108 1,106Mini Scaler 3 9 7 9 9 10 5 4 15 8 18 6 103Meter 183 126 151 220 184 152 213 191 252 140 134 168 2,114Electronic Dosimeter 32 29 25 74 54 27 132 22 92 49 53 34 623Probe 182 150 166 245 183 160 217 187 256 123 131 156 2,156Smart Probe 4 0 2 0 0 0 0 0 0 0 5 0 11CAM 12 29 29 34 33 41 43 33 23 27 31 37 372Pencil 78 76 52 235 267 81 59 72 159 72 132 10 1,293Source 19 39 20 28 16 8 23 6 21 10 26 12 228Specials 4 1 0 2 1 1 3 7 6 3 1 1 30Air Flow 28 7 7 4 16 4 7 10 10 2 20 13 128Total 627 532 553 941 867 565 819 605 976 511 623 545 8,164
6.4

Table 6.4. CY 2000 Calibration Volume for CH2M Hill Hanford Group
Calibrations Completed by Month for CY 2000
Calibration Class Jan Feb Mar Apr May Jun Jul Aug Sep Oct Nov Dec
Total CHG Units
Exposure Rate 19 28 27 13 17 41 20 25 46 23 14 32 305Mini Scaler 0 3 1 0 0 1 0 0 1 1 3 1 11Meter 42 48 46 37 63 43 38 28 53 40 42 56 536Electronic Dosimeter 4 4 1 25 0 0 9 24 45 0 10 6 128Probe 43 57 50 36 45 49 55 28 54 45 51 49 562Smart Probe 0 0 0 0 0 0 0 0 0 0 0 0 0CAM 0 0 0 3 1 0 0 3 4 0 0 0 11Pencil 39 113 51 1 66 52 95 86 78 65 59 91 796Source 3 0 4 5 2 0 7 2 8 3 2 0 36Specials 0 0 0 0 0 0 0 0 0 0 0 0 0Air Flow 0 16 1 24 6 6 10 7 87 1 10 12 180Total 150 269 181 144 200 192 234 203 376 178 191 247 2,565
6.5
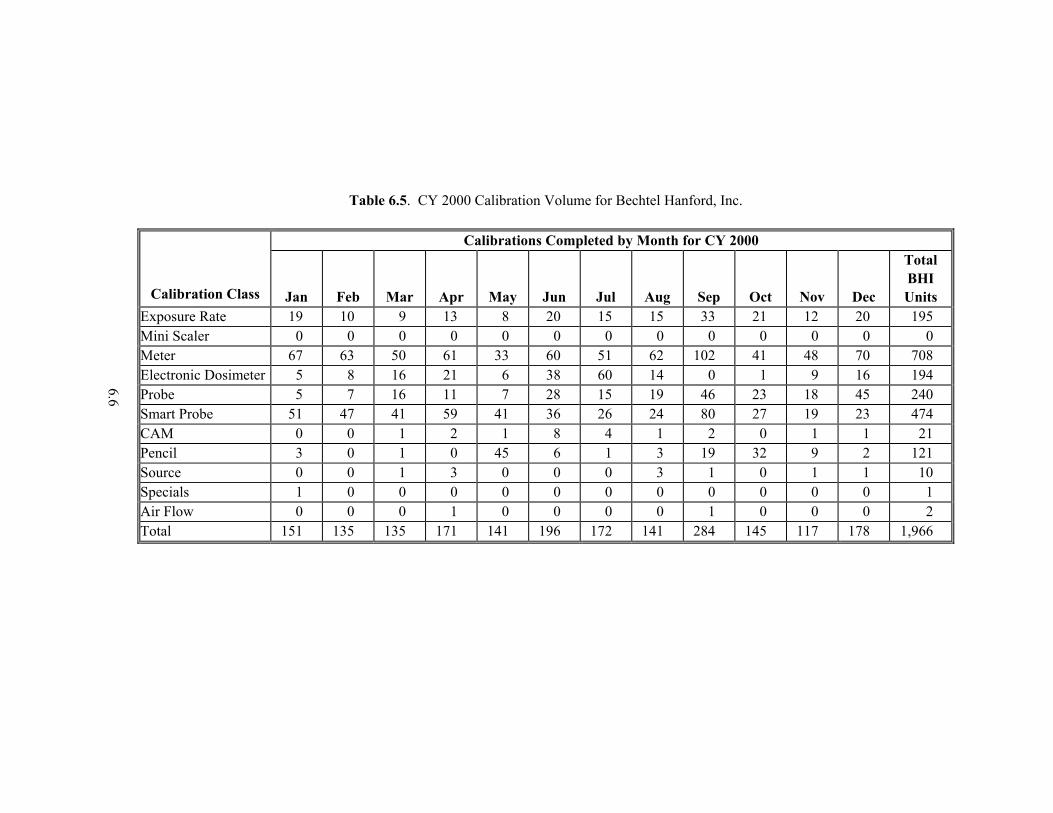
Table 6.5. CY 2000 Calibration Volume for Bechtel Hanford, Inc.
Calibrations Completed by Month for CY 2000
Calibration Class Jan Feb Mar Apr May Jun Jul Aug Sep Oct Nov Dec
Total BHI Units
Exposure Rate 19 10 9 13 8 20 15 15 33 21 12 20 195Mini Scaler 0 0 0 0 0 0 0 0 0 0 0 0 0Meter 67 63 50 61 33 60 51 62 102 41 48 70 708Electronic Dosimeter 5 8 16 21 6 38 60 14 0 1 9 16 194Probe 5 7 16 11 7 28 15 19 46 23 18 45 240Smart Probe 51 47 41 59 41 36 26 24 80 27 19 23 474CAM 0 0 1 2 1 8 4 1 2 0 1 1 21Pencil 3 0 1 0 45 6 1 3 19 32 9 2 121Source 0 0 1 3 0 0 0 3 1 0 1 1 10Specials 1 0 0 0 0 0 0 0 0 0 0 0 1Air Flow 0 0 0 1 0 0 0 0 1 0 0 0 2Total 151 135 135 171 141 196 172 141 284 145 117 178 1,966
6.6
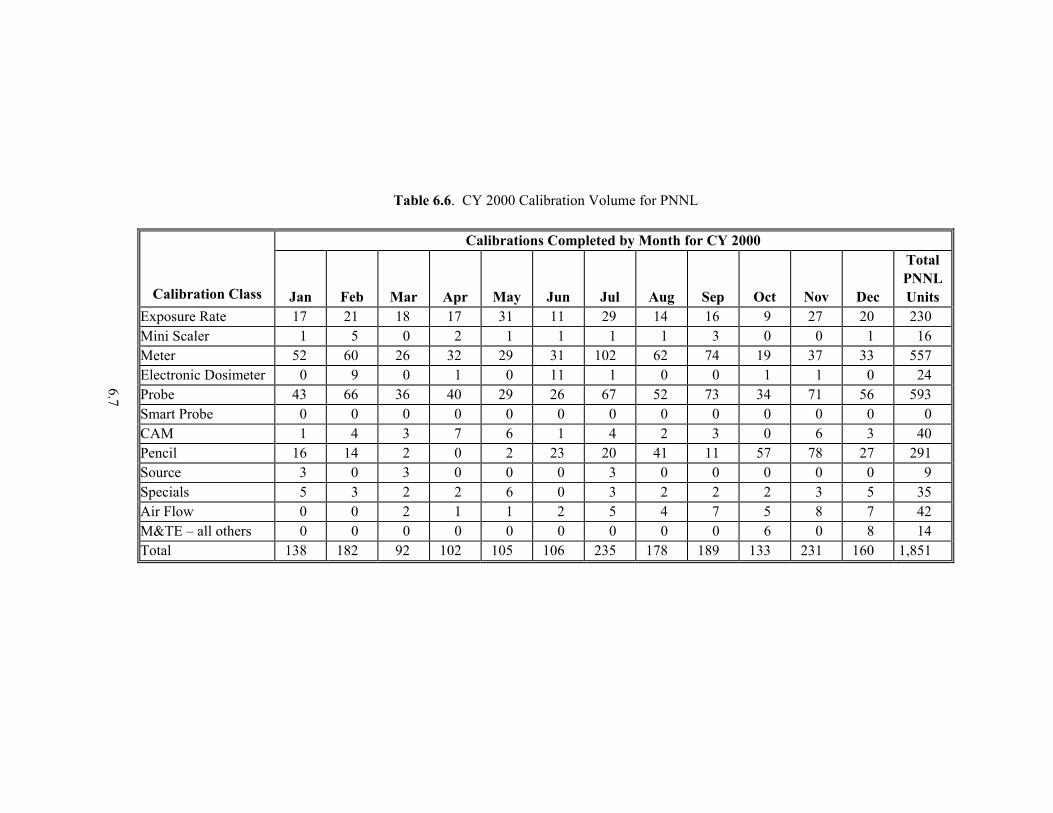
Table 6.6. CY 2000 Calibration Volume for PNNL
Calibrations Completed by Month for CY 2000
Calibration Class Jan Feb Mar Apr May Jun Jul Aug Sep Oct Nov Dec
Total PNNL Units
Exposure Rate 17 21 18 17 31 11 29 14 16 9 27 20 230Mini Scaler 1 5 0 2 1 1 1 1 3 0 0 1 16Meter 52 60 26 32 29 31 102 62 74 19 37 33 557Electronic Dosimeter 0 9 0 1 0 11 1 0 0 1 1 0 24Probe 43 66 36 40 29 26 67 52 73 34 71 56 593Smart Probe 0 0 0 0 0 0 0 0 0 0 0 0 0CAM 1 4 3 7 6 1 4 2 3 0 6 3 40Pencil 16 14 2 0 2 23 20 41 11 57 78 27 291Source 3 0 3 0 0 0 3 0 0 0 0 0 9Specials 5 3 2 2 6 0 3 2 2 2 3 5 35Air Flow 0 0 2 1 1 2 5 4 7 5 8 7 42M&TE – all others 0 0 0 0 0 0 0 0 0 6 0 8 14Total 138 182 92 102 105 106 235 178 189 133 231 160 1,851
6.7

0
200
400
600
800
1000
1200
1400
1600
1800
2000
January February M arch April M ay June July August September October November December
Figure 6.1. Total Number of Calibrations for Hanford Clients During CY 2000
During CY 2000, IS&TP assumed responsibility for managing the PNNL M&TE. The project was previously managed by the Facilities and Operations organization. Because both projects require similar infrastructures, and because IS&TP has a well-developed, mature process for managing calibration projects, the M&TE function was moved into IS&TP. The result is that IS&TP now offers calibration services for other types of equipment besides just radiation detection instrumentation. 6.1.3 Calibration As-Founds Out-of-Tolerance Part of the calibration service provided by IS&TP is quantifying the as-found condition of each instrument when it is returned for calibration. The as-found condition is typically documented as the instrument’s response to the calibration standards and is recorded before any adjustments are made to the instrument’s response. A total of 102 instruments calibrated during CY 2000 were found to be significantly out of tolerance when returned for calibration (that is, the instrument’s response was not within ± 20% of the conventionally true value of the calibration field). The number of out-of-tolerance notifications issued is consistent with previous years (last year’s total was 101 notices). This is an indication that the instruments in the portable instrument pool are not aging to the point of being unreliable. The total does not include instruments that were returned for calibration with flaws or defects that would render the instrument obviously unusable to the user. Nor does it include instruments
6.8

that were repaired prior to calibration because any repairs would invalidate the as-found readings. In each case, the organization that used the instrument was notified of the out-of-tolerance condition. When a single instrument model seems to have a large number of calibration as-founds that are out of tolerance, a detailed review of all calibration as-founds for that instrument model is conducted. If more than 15% of the instruments returned for calibration have as-founds out of tolerance, the calibration interval for that instrument model is shortened. During CY 2000, as-found data for several instrument models were investigated for adverse trends. The models investigated were the Nuclear Research Corporation AN/PDR-70 “Snoopy”; the Eberline Model 3, 4, and 5-series Alpha continuous air monitors (CAMs); the Eberline GM count rate meters; and the Eberline RO-3B “CP.” The as-found data for all models were acceptable, and none of the calibration intervals were adjusted. 6.1.4 Maintenance of the Calibration Records IS&TP manages the calibration records for all instruments, sources, and dosimeters calibrated by IS&TP. The records are scanned to allow for ready retrieval before being sent to record storage. Upon request, copies of calibration records are provided to customers. 6.2 Program Improvements in Calibration and Maintenance
Operations During CY 2000, IS&TP radiological calibration project merged with the Facility and Operations M&TE calibration project. The consolidation allows both projects—radiological calibrations and M&TE calibrations—to use the same infrastructure. The end result is reduced cost to the customer because infrastructure costs (calibration recall system, database maintenance, records management) are spread across a larger number of calibrations. 6.3 Hanford Instrument Evaluation Committee The HIEC was established to provide a Hanford intercontractor information exchange mechanism to ensure that the highest-quality portable and semi-portable radiological protection instrumentation program is maintained at Hanford. The responsibilities of the committee include the following:
• Discuss and propose solutions to ongoing or potential radiological instrumentation problems and needs onsite.
• Identify new radiological instrumentation available from manufacturers that may be useful to
Hanford Site operations.
• Oversee the procurement of the instruments and review the evaluations of the performance by contractor organizations.
6.9
• Establish or review minimum acceptable operational criteria for portable and semi-portable radiological instrumentation used for safety on the Hanford Site.
• Promote information exchange between contractors on radiological protection instrumentation
usage and problems/resolutions. Representatives from all of the Hanford contractors and a representative of RL are on this committee. During CY 2000, the HIEC continued to evaluate instruments identified as needing further evaluations before being approved and placed on the “approved instrument list.” The HIEC maintains the “approved instrument list” as a mechanism to demonstrate compliance with the 10 CFR 835 requirement that instruments “shall be appropriate for their environment.” IS&TP supports the HIEC by serving as the organization’s secretary and providing administrative and technical support. In this role, IS&TP maintains the approved instrument list and the record files of all instrument evaluations completed for Hanford Site customers. IS&TP also provides technical support in the areas of instrument testing and design. During CY 2000, IS&TP began issuing HIEC meeting minutes as electronic documents accessible through the calibration web page. This reduced the effort required to distribute minutes and improved the availability of HIEC historical documents to Hanford technical staff. 6.4 Supporting Technical Studies No technical studies were performed under this project during CY 2000. 6.5 Program-Related Professional Activities Staff presentations and external professional activities during CY 2000 are listed in this section. 6.5.1 Presentations Johnson, M. L., Evaluation of the MGP Instruments Model DMC 2000S Electronic Dosimeter, presented at the MGP Instruments, Inc., User’s Group Meeting, Atlanta, Georgia, June 2000. 6.5.2 External Professional Activities Bratvold, T. E., Member of the Health Physics Laboratory Accreditation Assessment Committee. Johnson, M. L., Co-Chairperson of the Working Group for ANSI N323C, Radiation Protection Instrumentation Test and Calibration—Air Monitoring Instruments.
6.10

Johnson, M. L., Member of the Working Group for ANSI N323A, Radiation Protection Instrumentation and Calibration—General Requirements and Portable Instruments. Johnson, M. L., Member of the Working Group for ANSI N323D, Radiation Protection Instrumentation and Calibration—Fixed Instruments.
6.11
7.0 Radiation Standards and Calibrations Program The primary function of the Radiation Standards and Calibrations Program (RS&CP) is to maintain the necessary radiological reference fields to facilitate appropriate characterizations and calibrations within the Hanford IS&TP and HEDP. In support of this task, special instrument and dosimeter response-characterizing equipment and supplemental radiological reference fields are maintained, as necessary. This activity provides the means to characterize instrument and dosimeter response to various radiation fields encountered at Hanford and to ensure that calibration capabilities are available in accordance with recommended standards and guides. The RS&CP is coordinated by the Calibration Research and Accreditation (CR&A) subgroup of the DR&T technical group. This group also supports other Hanford entities as well as DOE-HQ, other departments of the U.S. Government, and the private sector within its NVLAP scope of accreditation as a Calibration Laboratory for Ionizing Radiation, which has been maintained since 1994. Standards and methodologies developed in support of non-Hanford applications serve to enhance the capabilities available to the Hanford Site. Typical project activities include the following:
• providing a pathway of traceability for the calibration sources to the NIST
• maintaining radioactive sources, X-ray-generating devices, and instruments that serve as radiological standards
• reviewing calibration standards, regulations, and handbooks to ensure that calibration and characteri-
zation protocols agree with technically accepted methods. Program activities conducted during CY 2000 are discussed in the following sections. 7.1 Routine Operations Routine activities conducted by program personnel included maintenance of radiological standards, including reference class instruments and reference fields traceable to national standards, and the develop-ment of new and/or specialized capabilities. These existing and new capabilities support a variety of applications at the Hanford Site, within the DOE and other U.S. Government communities, and throughout the international radiological protection industry, in both the private sector and government programs. The activities related to radiological standards and capabilities and applications are discussed in the following sections. 7.1.1 Standards and Capabilities The radiological reference fields maintained include gamma, beta, and neutron isotopic sources and X-ray-generating devices. These standards and capabilities are configured to deliver well-characterized and reproducible quantities of radiation dose or exposure to environmental or personnel dosimeters, radiological survey instruments, etc., for providing NIST-traceable calibration and/or response
7.1
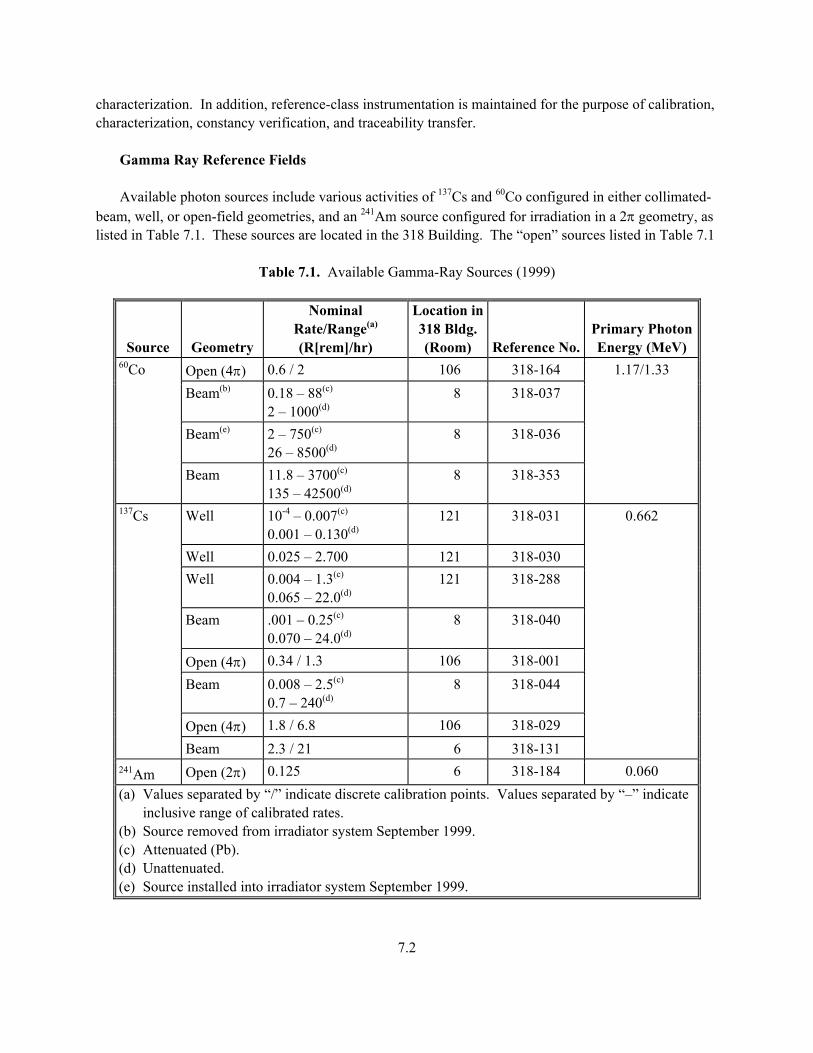
characterization. In addition, reference-class instrumentation is maintained for the purpose of calibration, characterization, constancy verification, and traceability transfer.
Gamma Ray Reference Fields Available photon sources include various activities of 137Cs and 60Co configured in either collimated-beam, well, or open-field geometries, and an 241Am source configured for irradiation in a 2π geometry, as listed in Table 7.1. These sources are located in the 318 Building. The “open” sources listed in Table 7.1
Table 7.1. Available Gamma-Ray Sources (1999)
Source Geometry
Nominal Rate/Range(a) (R[rem]/hr)
Location in 318 Bldg. (Room) Reference No.
Primary Photon Energy (MeV)
Open (4π) 0.6 / 2 106 318-164 Beam(b) 0.18 – 88(c)
2 – 1000(d) 8 318-037
Beam(e) 2 – 750(c) 26 – 8500(d)
8 318-036
60Co
Beam 11.8 – 3700(c)
135 – 42500(d) 8 318-353
1.17/1.33
Well 10-4 – 0.007(c)
0.001 – 0.130(d) 121 318-031
Well 0.025 – 2.700 121 318-030 Well 0.004 – 1.3(c)
0.065 – 22.0(d) 121 318-288
Beam .001 – 0.25(c) 0.070 – 24.0(d)
8 318-040
Open (4π) 0.34 / 1.3 106 318-001 Beam 0.008 – 2.5(c)
0.7 – 240(d) 8 318-044
Open (4π) 1.8 / 6.8 106 318-029
137Cs
Beam 2.3 / 21 6 318-131
0.662
241Am Open (2π) 0.125 6 318-184 0.060 (a) Values separated by “/” indicate discrete calibration points. Values separated by “–” indicate
inclusive range of calibrated rates. (b) Source removed from irradiator system September 1999. (c) Attenuated (Pb). (d) Unattenuated. (e) Source installed into irradiator system September 1999.
7.2
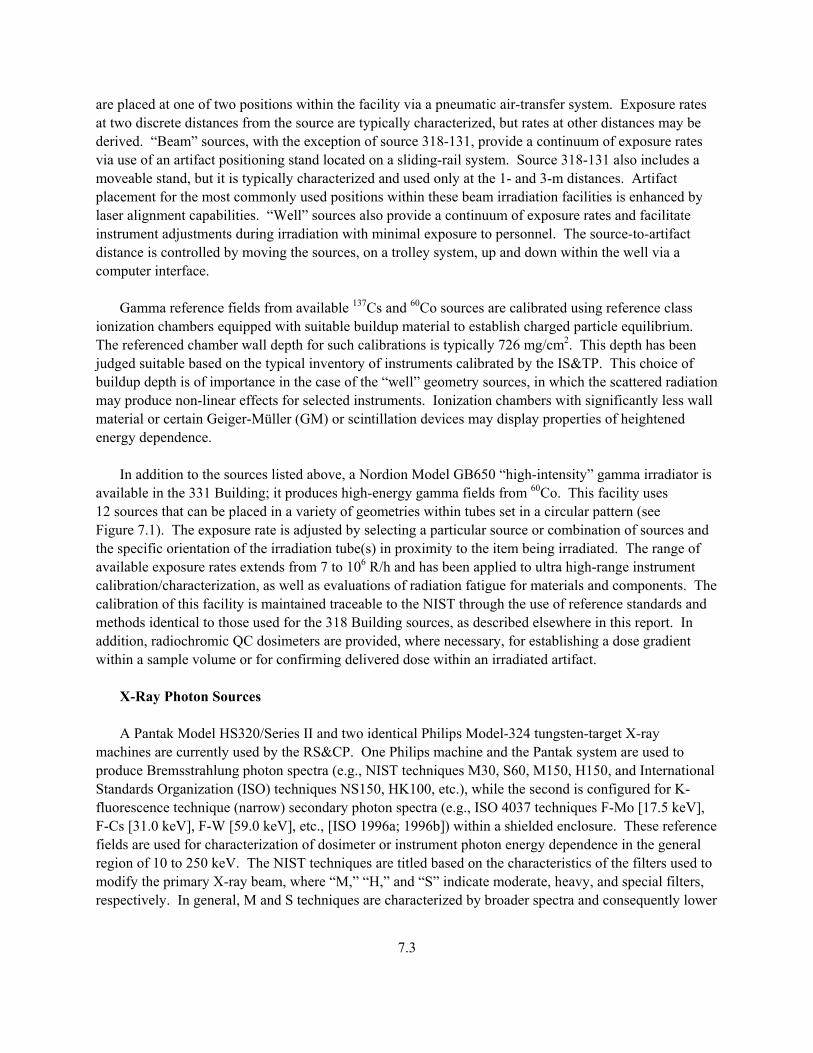
are placed at one of two positions within the facility via a pneumatic air-transfer system. Exposure rates at two discrete distances from the source are typically characterized, but rates at other distances may be derived. “Beam” sources, with the exception of source 318-131, provide a continuum of exposure rates via use of an artifact positioning stand located on a sliding-rail system. Source 318-131 also includes a moveable stand, but it is typically characterized and used only at the 1- and 3-m distances. Artifact placement for the most commonly used positions within these beam irradiation facilities is enhanced by laser alignment capabilities. “Well” sources also provide a continuum of exposure rates and facilitate instrument adjustments during irradiation with minimal exposure to personnel. The source-to-artifact distance is controlled by moving the sources, on a trolley system, up and down within the well via a computer interface. Gamma reference fields from available 137Cs and 60Co sources are calibrated using reference class ionization chambers equipped with suitable buildup material to establish charged particle equilibrium. The referenced chamber wall depth for such calibrations is typically 726 mg/cm2. This depth has been judged suitable based on the typical inventory of instruments calibrated by the IS&TP. This choice of buildup depth is of importance in the case of the “well” geometry sources, in which the scattered radiation may produce non-linear effects for selected instruments. Ionization chambers with significantly less wall material or certain Geiger-Müller (GM) or scintillation devices may display properties of heightened energy dependence. In addition to the sources listed above, a Nordion Model GB650 “high-intensity” gamma irradiator is available in the 331 Building; it produces high-energy gamma fields from 60Co. This facility uses 12 sources that can be placed in a variety of geometries within tubes set in a circular pattern (see Figure 7.1). The exposure rate is adjusted by selecting a particular source or combination of sources and the specific orientation of the irradiation tube(s) in proximity to the item being irradiated. The range of available exposure rates extends from 7 to 106 R/h and has been applied to ultra high-range instrument calibration/characterization, as well as evaluations of radiation fatigue for materials and components. The calibration of this facility is maintained traceable to the NIST through the use of reference standards and methods identical to those used for the 318 Building sources, as described elsewhere in this report. In addition, radiochromic QC dosimeters are provided, where necessary, for establishing a dose gradient within a sample volume or for confirming delivered dose within an irradiated artifact.
X-Ray Photon Sources A Pantak Model HS320/Series II and two identical Philips Model-324 tungsten-target X-ray machines are currently used by the RS&CP. One Philips machine and the Pantak system are used to produce Bremsstrahlung photon spectra (e.g., NIST techniques M30, S60, M150, H150, and International Standards Organization (ISO) techniques NS150, HK100, etc.), while the second is configured for K-fluorescence technique (narrow) secondary photon spectra (e.g., ISO 4037 techniques F-Mo [17.5 keV], F-Cs [31.0 keV], F-W [59.0 keV], etc., [ISO 1996a; 1996b]) within a shielded enclosure. These reference fields are used for characterization of dosimeter or instrument photon energy dependence in the general region of 10 to 250 keV. The NIST techniques are titled based on the characteristics of the filters used to modify the primary X-ray beam, where “M,” “H,” and “S” indicate moderate, heavy, and special filters, respectively. In general, M and S techniques are characterized by broader spectra and consequently lower
7.3
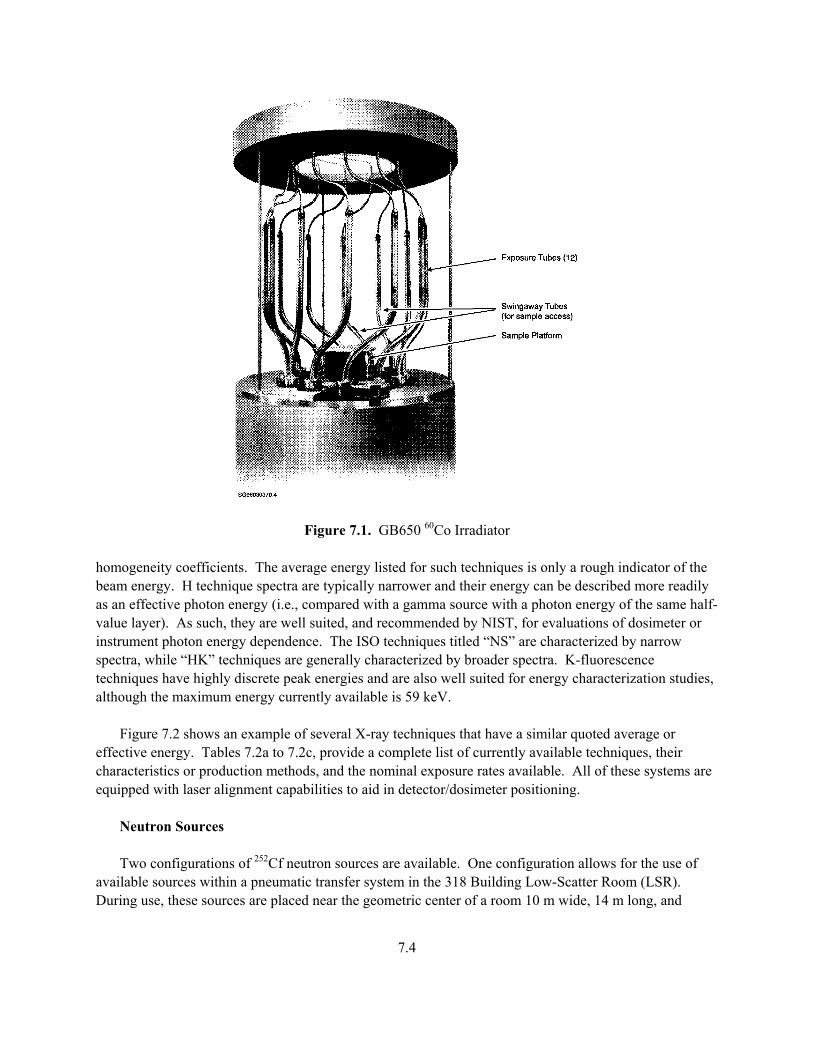
Figure 7.1. GB650 60Co Irradiator homogeneity coefficients. The average energy listed for such techniques is only a rough indicator of the beam energy. H technique spectra are typically narrower and their energy can be described more readily as an effective photon energy (i.e., compared with a gamma source with a photon energy of the same half-value layer). As such, they are well suited, and recommended by NIST, for evaluations of dosimeter or instrument photon energy dependence. The ISO techniques titled “NS” are characterized by narrow spectra, while “HK” techniques are generally characterized by broader spectra. K-fluorescence techniques have highly discrete peak energies and are also well suited for energy characterization studies, although the maximum energy currently available is 59 keV. Figure 7.2 shows an example of several X-ray techniques that have a similar quoted average or effective energy. Tables 7.2a to 7.2c, provide a complete list of currently available techniques, their characteristics or production methods, and the nominal exposure rates available. All of these systems are equipped with laser alignment capabilities to aid in detector/dosimeter positioning.
Neutron Sources Two configurations of 252Cf neutron sources are available. One configuration allows for the use of available sources within a pneumatic transfer system in the 318 Building Low-Scatter Room (LSR). During use, these sources are placed near the geometric center of a room 10 m wide, 14 m long, and
7.4

p y pBremsstrahlung vs. K-Fluorescence
0.0
0.4
0.8
1.2
1.6
2.0
0 20 40 60 80 100
Photon Energy (keV)
Rel
ativ
e In
tens
ity
49.1 keVEr FilterK-Fluorescence
47 keVH60
53 keVM100
Tungsten Characteristic X-rays
Figure 7.2. Example Spectrum of X-Ray Configurations (peak or average energy normalized to 1.0) 8.8 m high. Such placement minimizes scattered neutrons from the walls, floor, and ceiling at the point of the detector and facilitates the quantification of scatter influence upon the detection device. Sources may be used bare or moderated by a sphere of deuterated water (D2O) 15 cm in radius, enclosed within a thin stainless steel shell, and covered by 0.051 cm of cadmium. These provide neutron fields that are useful for instrument calibrations as well as for dosimeter characterization in accordance with the specifications of DOE/EH-0027, the Department of Energy Standard for the Performance Testing of Personnel Dosimetry Systems (DOE 1986b); HPS N13.11, Personnel Dosimetry Performance – Criteria for Testing (ANSI/HPS 1993); and ISO 8529, Neutron Reference Radiations for Calibrating Neutron-Measuring Devices Used for Radiation Protection Purposes and for Determining their Response as a Function of Neutron Energy (ISO 1989). In addition, a D2O-moderator sphere, similar to the one described above, is available without the shell of cadmium. This sphere, while originally intended as a backup, has been used, upon request, to provide neutron test fields with a larger component of thermal neutrons. The second configuration involves a 252Cf source placed in a well to facilitate easy access for instru-ment calibration. This source provides a fission spectrum that is significantly altered by the scattering from the concrete sides of the well; however, its calibration is established such that instrument calibra-tions will be referenceable to bare 252Cf under free-field conditions, for selected instruments.
7.5
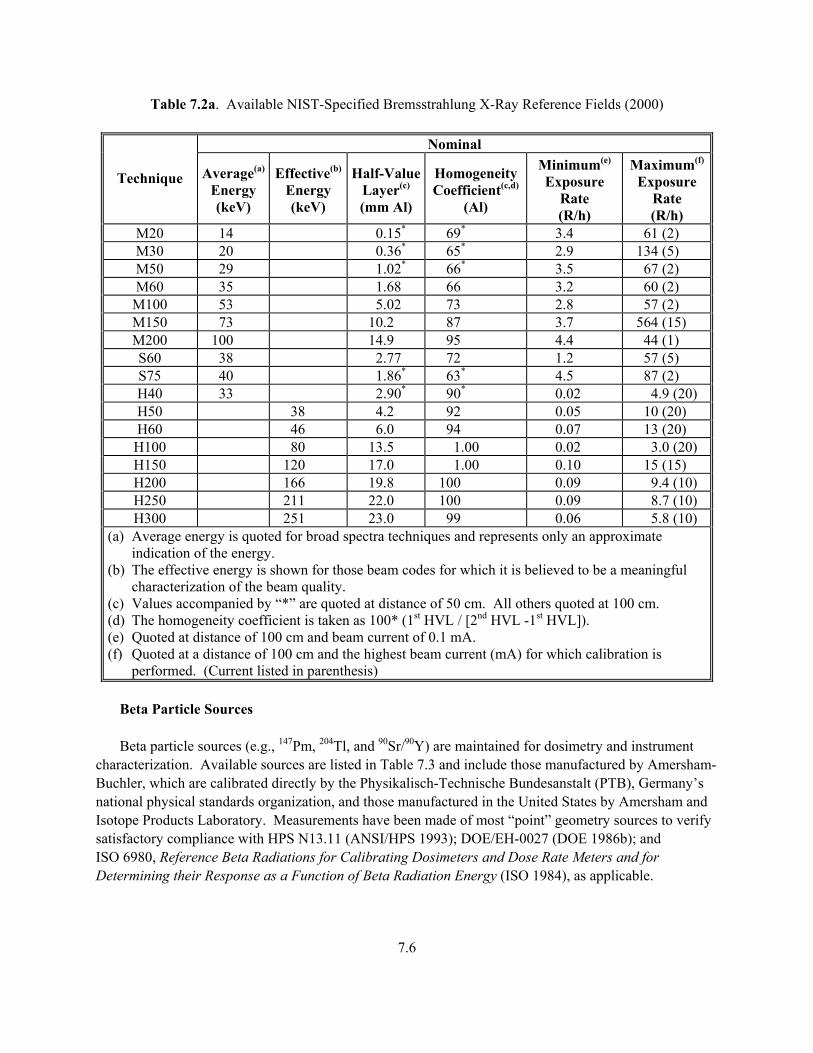
Table 7.2a. Available NIST-Specified Bremsstrahlung X-Ray Reference Fields (2000)
Nominal
Technique Average(a) Energy (keV)
Effective(b)
Energy (keV)
Half-ValueLayer(c) (mm Al)
Homogeneity Coefficient(c,d)
(Al)
Minimum(e) Exposure
Rate (R/h)
Maximum(f) Exposure
Rate (R/h)
M20 14 0.15* 69* 3.4 61 (2) M30 20 0.36* 65* 2.9 134 (5) M50 29 1.02* 66* 3.5 67 (2) M60 35 1.68 66 3.2 60 (2)
M100 53 5.02 73 2.8 57 (2) M150 73 10.2 87 3.7 564 (15) M200 100 14.9 95 4.4 44 (1) S60 38 2.77 72 1.2 57 (5) S75 40 1.86* 63* 4.5 87 (2) H40 33 2.90* 90* 0.02 4.9 (20) H50 38 4.2 92 0.05 10 (20) H60 46 6.0 94 0.07 13 (20)
H100 80 13.5 1.00 0.02 3.0 (20) H150 120 17.0 1.00 0.10 15 (15) H200 166 19.8 100 0.09 9.4 (10) H250 211 22.0 100 0.09 8.7 (10) H300 251 23.0 99 0.06 5.8 (10)
(a) Average energy is quoted for broad spectra techniques and represents only an approximate indication of the energy. (b) The effective energy is shown for those beam codes for which it is believed to be a meaningful characterization of the beam quality. (c) Values accompanied by “*” are quoted at distance of 50 cm. All others quoted at 100 cm. (d) The homogeneity coefficient is taken as 100* (1st HVL / [2nd HVL -1st HVL]). (e) Quoted at distance of 100 cm and beam current of 0.1 mA. (f) Quoted at a distance of 100 cm and the highest beam current (mA) for which calibration is performed. (Current listed in parenthesis)
Beta Particle Sources
Beta particle sources (e.g., 147Pm, 204Tl, and 90Sr/90Y) are maintained for dosimetry and instrument characterization. Available sources are listed in Table 7.3 and include those manufactured by Amersham-Buchler, which are calibrated directly by the Physikalisch-Technische Bundesanstalt (PTB), Germany’s national physical standards organization, and those manufactured in the United States by Amersham and Isotope Products Laboratory. Measurements have been made of most “point” geometry sources to verify satisfactory compliance with HPS N13.11 (ANSI/HPS 1993); DOE/EH-0027 (DOE 1986b); and ISO 6980, Reference Beta Radiations for Calibrating Dosimeters and Dose Rate Meters and for Determining their Response as a Function of Beta Radiation Energy (ISO 1984), as applicable.
7.6
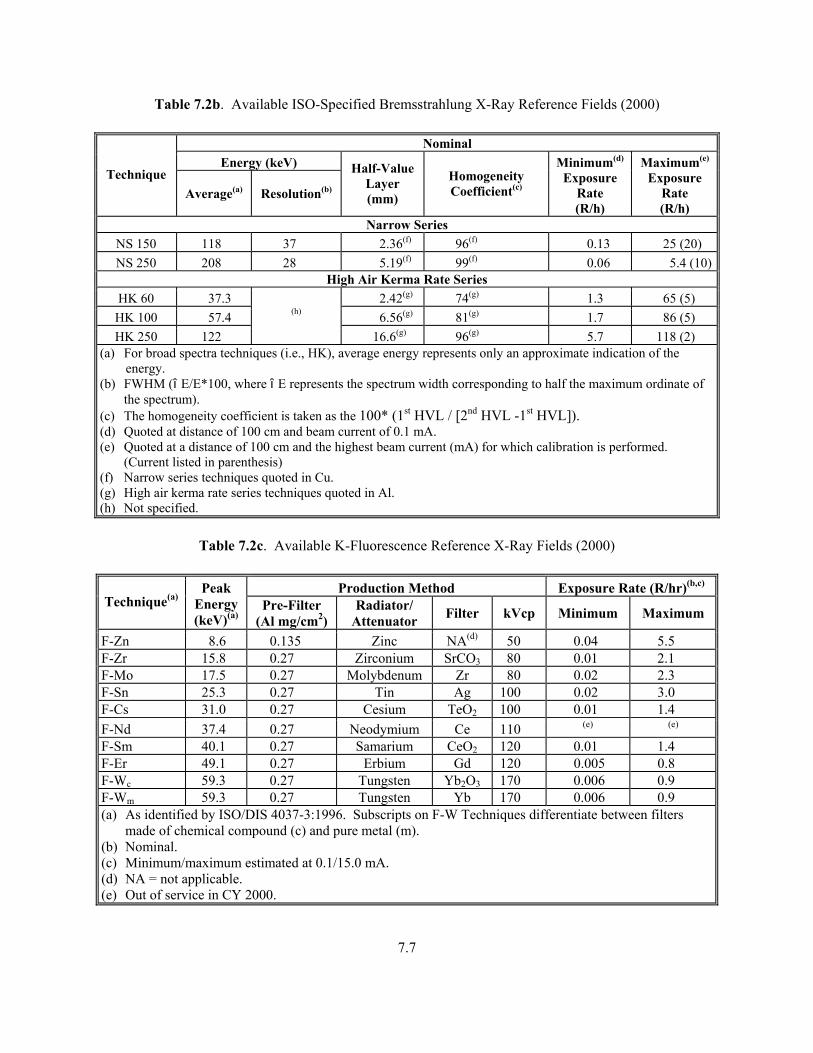
Table 7.2b. Available ISO-Specified Bremsstrahlung X-Ray Reference Fields (2000)
Nominal Energy (keV)
Technique Average(a) Resolution(b)
Half-Value Layer (mm)
Homogeneity Coefficient(c)
Minimum(d) Exposure
Rate (R/h)
Maximum(e) Exposure
Rate (R/h)
Narrow Series NS 150 118 37 2.36(f) 96(f) 0.13 25 (20) NS 250 208 28 5.19(f) 99(f) 0.06 5.4 (10)
High Air Kerma Rate Series HK 60 37.3 2.42(g) 74(g) 1.3 65 (5) HK 100 57.4 6.56(g) 81(g) 1.7 86 (5) HK 250 122
(h)
16.6(g) 96(g) 5.7 118 (2) (a) For broad spectra techniques (i.e., HK), average energy represents only an approximate indication of the
energy. (b) FWHM (ÎE/E*100, where ÎE represents the spectrum width corresponding to half the maximum ordinate of
the spectrum). (c) The homogeneity coefficient is taken as the 100* (1st HVL / [2nd HVL -1st HVL]). (d) Quoted at distance of 100 cm and beam current of 0.1 mA. (e) Quoted at a distance of 100 cm and the highest beam current (mA) for which calibration is performed.
(Current listed in parenthesis) (f) Narrow series techniques quoted in Cu. (g) High air kerma rate series techniques quoted in Al. (h) Not specified.
Table 7.2c. Available K-Fluorescence Reference X-Ray Fields (2000)
Production Method Exposure Rate (R/hr)(b,c)
Technique(a) Peak
Energy (keV)(a)
Pre-Filter (Al mg/cm2)
Radiator/ Attenuator Filter kVcp Minimum Maximum
F-Zn 8.6 0.135 Zinc NA(d) 50 0.04 5.5 F-Zr 15.8 0.27 Zirconium SrCO3 80 0.01 2.1 F-Mo 17.5 0.27 Molybdenum Zr 80 0.02 2.3 F-Sn 25.3 0.27 Tin Ag 100 0.02 3.0 F-Cs 31.0 0.27 Cesium TeO2 100 0.01 1.4 F-Nd 37.4 0.27 Neodymium Ce 110 (e) (e)
F-Sm 40.1 0.27 Samarium CeO2 120 0.01 1.4 F-Er 49.1 0.27 Erbium Gd 120 0.005 0.8 F-Wc 59.3 0.27 Tungsten Yb2O3 170 0.006 0.9 F-Wm 59.3 0.27 Tungsten Yb 170 0.006 0.9 (a) As identified by ISO/DIS 4037-3:1996. Subscripts on F-W Techniques differentiate between filters
made of chemical compound (c) and pure metal (m). (b) Nominal. (c) Minimum/maximum estimated at 0.1/15.0 mA. (d) NA = not applicable. (e) Out of service in CY 2000.
7.7
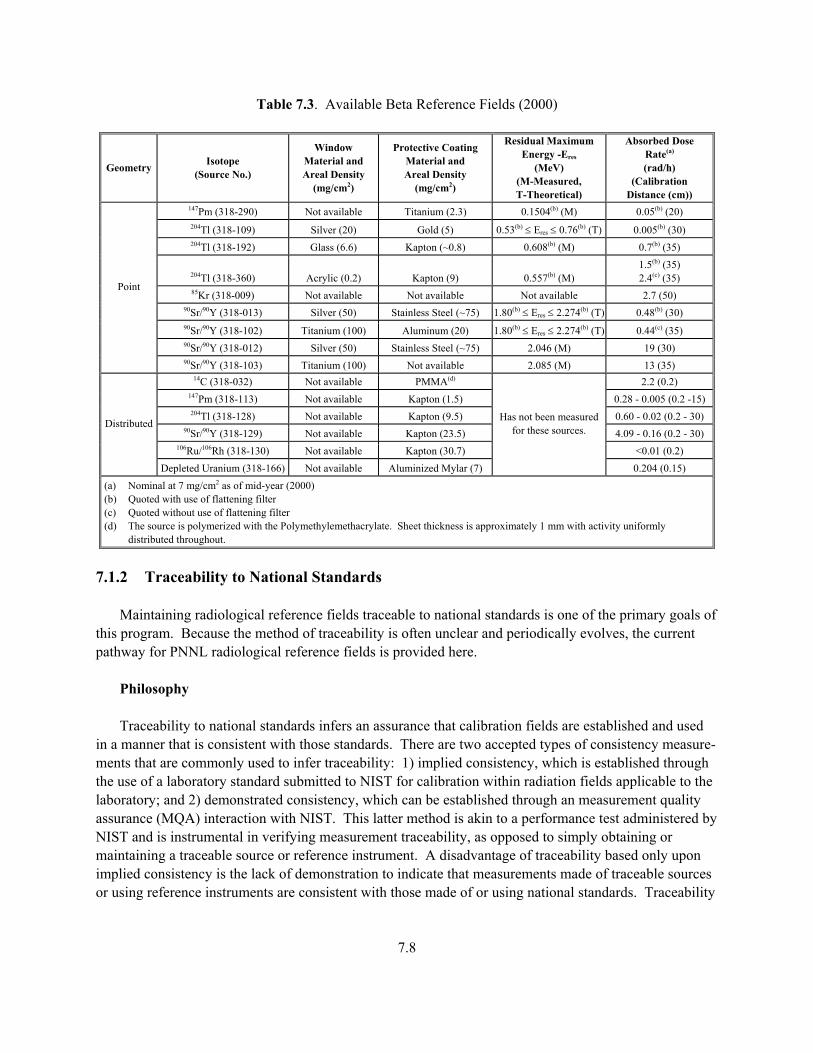
Table 7.3. Available Beta Reference Fields (2000)
Geometry Isotope (Source No.)
Window Material and Areal Density
(mg/cm2)
Protective Coating Material and Areal Density
(mg/cm2)
Residual Maximum Energy -Eres
(MeV) (M-Measured, T-Theoretical)
Absorbed Dose Rate(a) (rad/h)
(Calibration Distance (cm))
147Pm (318-290) Not available Titanium (2.3) 0.1504(b) (M) 0.05(b) (20) 204Tl (318-109) Silver (20) Gold (5) 0.53(b) ≤ Eres ≤ 0.76(b) (T) 0.005(b) (30) 204Tl (318-192) Glass (6.6) Kapton (~0.8) 0.608(b) (M) 0.7(b) (35)
204Tl (318-360) Acrylic (0.2) Kapton (9) 0.557(b) (M) 1.5(b) (35) 2.4(c) (35)
85Kr (318-009) Not available Not available Not available 2.7 (50) 90Sr/90Y (318-013) Silver (50) Stainless Steel (~75) 1.80(b) ≤ Eres ≤ 2.274(b) (T) 0.48(b) (30) 90Sr/90Y (318-102) Titanium (100) Aluminum (20) 1.80(b) ≤ Eres ≤ 2.274(b) (T) 0.44(c) (35) 90Sr/90Y (318-012) Silver (50) Stainless Steel (~75) 2.046 (M) 19 (30)
Point
90Sr/90Y (318-103) Titanium (100) Not available 2.085 (M) 13 (35) 14C (318-032) Not available PMMA(d) 2.2 (0.2)
147Pm (318-113) Not available Kapton (1.5) 0.28 - 0.005 (0.2 -15) 204Tl (318-128) Not available Kapton (9.5) 0.60 - 0.02 (0.2 - 30)
90Sr/90Y (318-129) Not available Kapton (23.5) 4.09 - 0.16 (0.2 - 30) 106Ru/106Rh (318-130) Not available Kapton (30.7) <0.01 (0.2)
Distributed
Depleted Uranium (318-166) Not available Aluminized Mylar (7)
Has not been measured for these sources.
0.204 (0.15) (a) Nominal at 7 mg/cm2 as of mid-year (2000) (b) Quoted with use of flattening filter (c) Quoted without use of flattening filter (d) The source is polymerized with the Polymethylemethacrylate. Sheet thickness is approximately 1 mm with activity uniformly
distributed throughout.
7.1.2 Traceability to National Standards Maintaining radiological reference fields traceable to national standards is one of the primary goals of this program. Because the method of traceability is often unclear and periodically evolves, the current pathway for PNNL radiological reference fields is provided here.
Philosophy Traceability to national standards infers an assurance that calibration fields are established and used in a manner that is consistent with those standards. There are two accepted types of consistency measure-ments that are commonly used to infer traceability: 1) implied consistency, which is established through the use of a laboratory standard submitted to NIST for calibration within radiation fields applicable to the laboratory; and 2) demonstrated consistency, which can be established through an measurement quality assurance (MQA) interaction with NIST. This latter method is akin to a performance test administered by NIST and is instrumental in verifying measurement traceability, as opposed to simply obtaining or maintaining a traceable source or reference instrument. A disadvantage of traceability based only upon implied consistency is the lack of demonstration to indicate that measurements made of traceable sources or using reference instruments are consistent with those made of or using national standards. Traceability
7.8

based upon demonstrated consistency provides the assurance that traceable instruments and/or sources are being used properly (whether to calibrate additional sources [or reference fields] or laboratory instrument standards), so that traceability is appropriately extended as desired. NIST supports the use of both techniques in maintaining traceability, but favors the practice of performing MQA interactions on a routine basis coupled with providing infrequent instrument or source calibrations. The RS&CP mirrors the NIST philosophy where possible; however, there are some limita-tions of the NIST capability that require a variance in the normal process. The following sections describe the traceability pathway for each of the radiation types applicable within this project.
Photon Standards Photon sources (i.e., gamma sources and X-ray techniques) are maintained traceable via both implied and demonstrated consistency verifications. On an as-needed basis, one or more selected laboratory standards (air-equivalent ionization chambers [AICs]) are submitted to NIST for calibration to specific radiation fields. Through CY 2000, six commonly used AICs had been submitted for calibration to 137Cs, 60Co, and many of the available NIST and ISO X-ray techniques, including all but one (M20) of the Bremsstrahlung techniques listed in Table 7.2a. In calibrating these instruments directly to NIST “primary standard” reference fields, they are deemed “secondary standards” and are used in the process of calibrating other radiological reference fields and/or reference instruments for use as tertiary or working standards. The most current representation of the traceability pathway is depicted in Figure 7.3. In some cases, secondary standard instruments have been used to calibrate or verify the constancy of working standard radiation fields such as the well calibrators. This practice is acceptable but avoided whenever practical, because it exposes the valuable secondary standards to increased use and the potential for damage. To achieve demonstrated consistency, NIST has conducted MQA assessments of PNNL photon reference fields since 1984, each time selecting a subset of the available sources and/or X-ray techniques for intercomparison. There were no MQA measurements performed through NIST in CY 2000. Currently, NIST does not maintain capabilities for K-fluorescence X-ray or 241Am reference fields. Although traceability for these fields has been established using two additional AICs and a pathway similar to that identified in Figure 7.3 for a limited number of fluorescence techniques, the primary reference fields are maintained by the National Radiation Protection Board (NRPB) of the United Kingdom. Traceability for irradiations and calibrations made using these reference fields are implied. The accuracy of these reference fields is confirmed via long-term trending of the transmission chamber output and/or reference standard AIC measurements.
Neutron Standards Neutron traceability for all irradiations and measurements performed using PNNL sources is currently only implied. The primary pathway to NIST is through direct calibration of PNNL 252Cf sources, in terms of neutron emission rate, within the NIST Manganous Sulfate Bath Facility. Free-field dose-equivalent rates are calculated for these sources in their bare and moderated configuration based on NIST
7.9

Capintec PM-30 AICs/n: CII30.4277
M100, M150, M200S60H50, H100, H150, H200, H250, H300137Cs, 60Co
Capintec PR-18 AICs/n: CII1.8.5889
137Cs (low intensity)
Capintec PM-30 AICs/n: CII30.7502
M60, M100, M150S60H150137Cs, 60Co
Capintec PM-30 AICs/n: CII30. 8850
HK60, HK100, HK250NS150, NS250
Capintec PR-06C AICs/n: CIIG.64053
M250137Cs, 60Co
Victoreen 415A AICs/n: 149
M20, M30, M50S60, S75
NIST
SecondaryStandards
IsotopicSources
241Am: 318 -184137Cs: 318 -040
-044-131
60Co: 318 -036-164-353
X-ray (Broad Spectrum)Mid-High EnergyM60, M100, M150, M200S60H50, H100, H150, H2 H250, H300Phillips SystemPTW 30-363 AIC; s/n: WA92035Pantak SystemPTW 30-363 AIC; s/n: 34014-004
X-ray (Bremsstrahlung)Low EnergyM20, M30, M50S75H40Phillips SystemPTW 30-363 AIC; s/n: WA92305Pantak SystemPTW 30-363 AIC; s/n: 34014-004
X-ray (Bremsstrahlung)Mid-High EnergyHK60, HK100, HK250NS150, NS250
Phillips SystemPTW 30-363 AIC; s/n: WA92305Pantak SystemPTW 30-363 AIC; s/n: 34014-004
X-ray (Characteristic)Mid Energy*31 keV (S60/H50)40 keV (H50/M100)49 keV (M100/M150)59 keV (M100/M150)Phillips SystemPTW 30-363 AICs/n: WA92036
X-ray (Characteristic)Low Energy*16 keV (M30)23 keV (M50)
Phillips SystemPTW 30-363 AICs/n: WA92036
TertiaryStandards
Capintec PM-30s/n: CII30.6924s/n: CII30.5774
Capintec PR-18s/n: CII1.8.8489
WorkingStandardInstruments
Victoreen 550-3s/n: 711
Capintec PR-06Cs/n: CIIG.64552
Low Scatter Room
137Cs: 318 - 001- 029
60Co: 318 - 164
Well No. 1
137Cs: 318 - 031
Well No. 2
137Cs: 318 - 288
Well No. 4
137Cs: 318 - 030
GB-650 Gamma Calibrator
60Co: Twelve high-density sources
WorkingStandardReference Fields
* Correction factors for traceable secondary standard derivedfrom bremsstrahlung techniques identified in parenthesis.
7.10
Figure 7.3. Typical Traceability Pathway for PNNL Photon Reference Fields
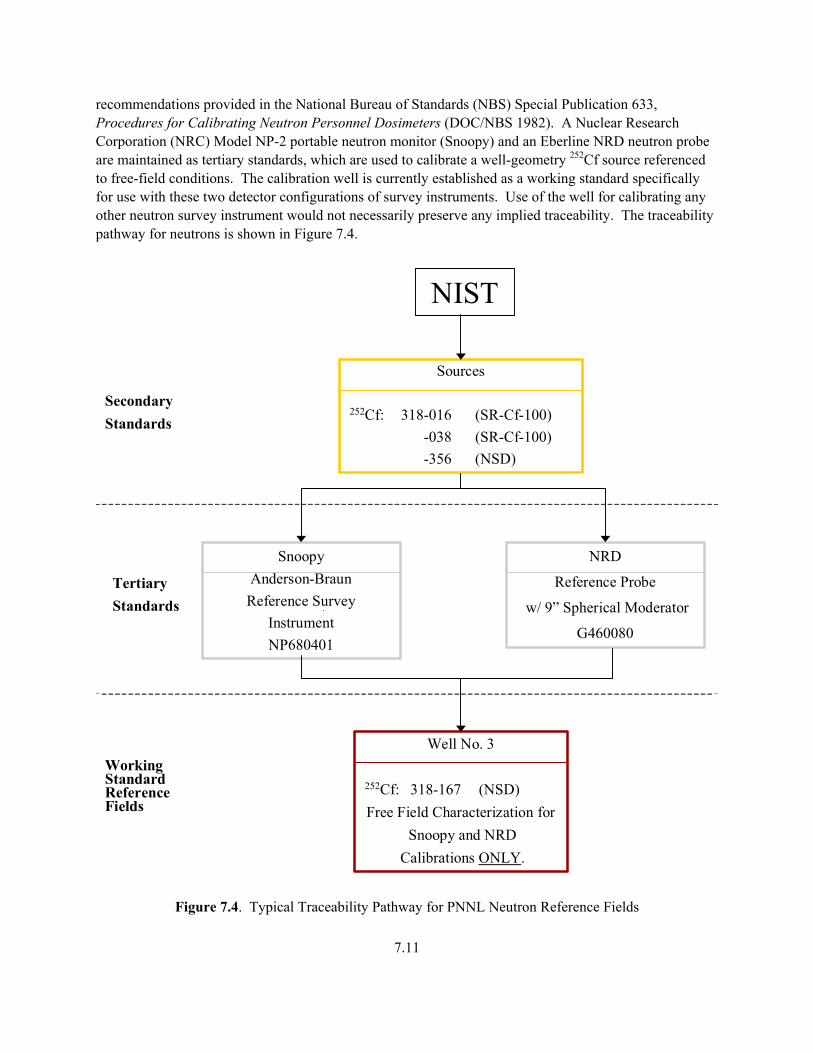
recommendations provided in the National Bureau of Standards (NBS) Special Publication 633, Procedures for Calibrating Neutron Personnel Dosimeters (DOC/NBS 1982). A Nuclear Research Corporation (NRC) Model NP-2 portable neutron monitor (Snoopy) and an Eberline NRD neutron probe are maintained as tertiary standards, which are used to calibrate a well-geometry 252Cf source referenced to free-field conditions. The calibration well is currently established as a working standard specifically for use with these two detector configurations of survey instruments. Use of the well for calibrating any other neutron survey instrument would not necessarily preserve any implied traceability. The traceability pathway for neutrons is shown in Figure 7.4.
Sources
252Cf: 318-016 (SR-Cf-100)-038 (SR-Cf-100)-356 (NSD)
NIST
SecondaryStandards
SnoopyAnderson-Braun
Reference SurveyInstrumentNP680401
NRD
Reference Probe
w/ 9” Spherical Moderator
G460080
TertiaryStandards
Well No. 3
252Cf: 318-167 (NSD)Free Field Characterization for
Snoopy and NRDCalibrations ONLY.
WorkingStandardReference Fields
Figure 7.4. Typical Traceability Pathway for PNNL Neutron Reference Fields
7.11
MQA interactions are especially desirable for neutron sources as a means to confirm that various parameters are properly determined and/or are accounted for in the use of these sources. Influences such as air scatter, room return (scattered neutrons from walls, ceiling, and floor), source anisotropy, and inherent photon contribution must be properly characterized, either by measurement, calculation, or both. Source aging is a concern due to the magnitude of isotopic contaminants (primarily 249Cf, 250Cf, and 251Cf), which remain following source manufacture and are not directly identifiable via a single NIST calibration. Also, when configured with the D2O moderating sphere, there are concerns about subtle differences between the NIST design and the PNNL assembly. The NIST design almost completely surrounds the source and is more closely related to the referenced dose equivalent conversion factor, while the PNNL assembly, with an inherent void, allows placement of the sphere around the end tube of the pneumatic transfer system. Monte Carlo modeling suggests that the effect of this void is substantial; however, reliable measurements that can substantiate this model have not been completed. Until measurements confirm or refine the magnitude of this effect, the calculated value will continue to be treated as a component of uncertainty rather than being used as a correction factor applied to the dose equivalent rate. During the past several years, numerous joint efforts by NIST and PNNL have been conducted to establish a suitable method for neutron MQA intercomparisons in order to demonstrate traceability. These intercomparisons have steadily improved as sources of uncertainty are reduced or better under-stood; however, there continues to be a bias in intercomparison results induced, in theory, by the acknowledged differences in the PNNL source configurations versus those of NIST. A clear explanation and resolution for the measured bias is not a trivial matter and will continue to be investigated.
Beta Sources The NIST-traceability of beta reference fields is based upon both implied and demonstrated consistency. Of highest order in the PNNL reference field hierarchy are the PTB sources identified in Section 7.1.1, including 90Sr/90Y (sources 318-012 and -013) and 204Tl (sources 318-014 and -109). These sources are considered secondary standards because they were initially calibrated and are certified through the PTB and continue to be periodically intercompared with NIST via MQA interactions. The NIST maintains a similar set of sources at its facility that have been characterized/verified both quantitatively and qualitatively. PNNL maintains a Physikalisch-Technische Werkstäten (PTW) extrapolation ionization chamber for use in performing measurements of absorbed dose rate from the various sources. This chamber is generally considered to be an absolute standard; however, in conforming with the methods used for other radiation fields within the laboratory, it is designated as a tertiary standard. As such, it is the primary link between the PTB sources and all other beta sources. In many cases, beta irradiations/calibrations are performed using alternate point sources of isotopic distribution similar to the PTB sources, but with subtle differences in construction material and/or activity, including sources 318-102, -103, and -192 (see Table 7.3). The 90Sr/90Y sources (318-102 and -103) were calibrated directly by NIST (source 318-102 [74 MBq] in 1986 at NIST and source 318-103 [1.85 GBq] at PNNL by a visiting NIST scientist). The latter source was calibrated with PNNL’s PTW
7.12
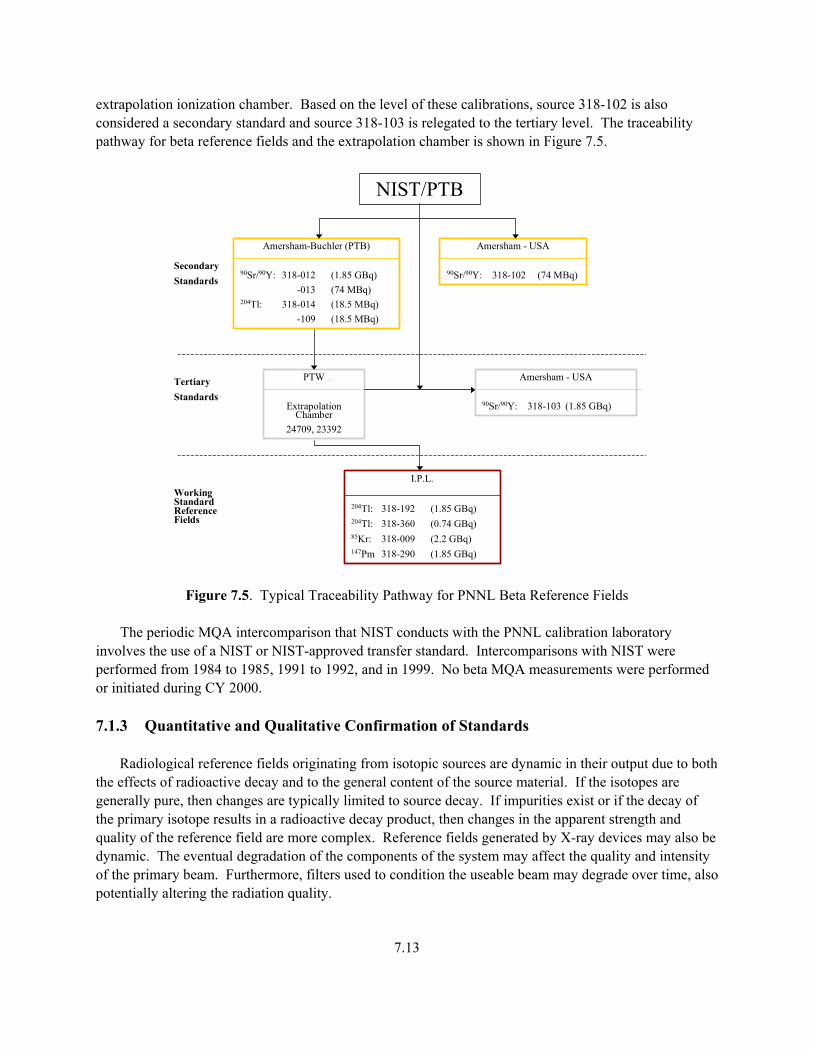
extrapolation ionization chamber. Based on the level of these calibrations, source 318-102 is also considered a secondary standard and source 318-103 is relegated to the tertiary level. The traceability pathway for beta reference fields and the extrapolation chamber is shown in Figure 7.5.
Amersham-Buchler (PTB)
90Sr/90Y: 318-012 (1.85 GBq)-013 (74 MBq)
204Tl: 318-014 (18.5 MBq)-109 (18.5 MBq)
Amersham - USA
90Sr/90Y: 318-102 (74 MBq)
NIST/PTB
SecondaryStandards
PTW
Extrapolation Chamber
24709, 23392
Amersham - USA
90Sr/90Y: 318-103 (1.85 GBq)
TertiaryStandards
I.P.L.
204Tl: 318-192 (1.85 GBq)204Tl: 318-360 (0.74 GBq)85Kr: 318-009 (2.2 GBq)147Pm 318-290 (1.85 GBq)
WorkingStandardReference Fields
Figure 7.5. Typical Traceability Pathway for PNNL Beta Reference Fields The periodic MQA intercomparison that NIST conducts with the PNNL calibration laboratory involves the use of a NIST or NIST-approved transfer standard. Intercomparisons with NIST were performed from 1984 to 1985, 1991 to 1992, and in 1999. No beta MQA measurements were performed or initiated during CY 2000. 7.1.3 Quantitative and Qualitative Confirmation of Standards Radiological reference fields originating from isotopic sources are dynamic in their output due to both the effects of radioactive decay and to the general content of the source material. If the isotopes are generally pure, then changes are typically limited to source decay. If impurities exist or if the decay of the primary isotope results in a radioactive decay product, then changes in the apparent strength and quality of the reference field are more complex. Reference fields generated by X-ray devices may also be dynamic. The eventual degradation of the components of the system may affect the quality and intensity of the primary beam. Furthermore, filters used to condition the useable beam may degrade over time, also potentially altering the radiation quality.
7.13
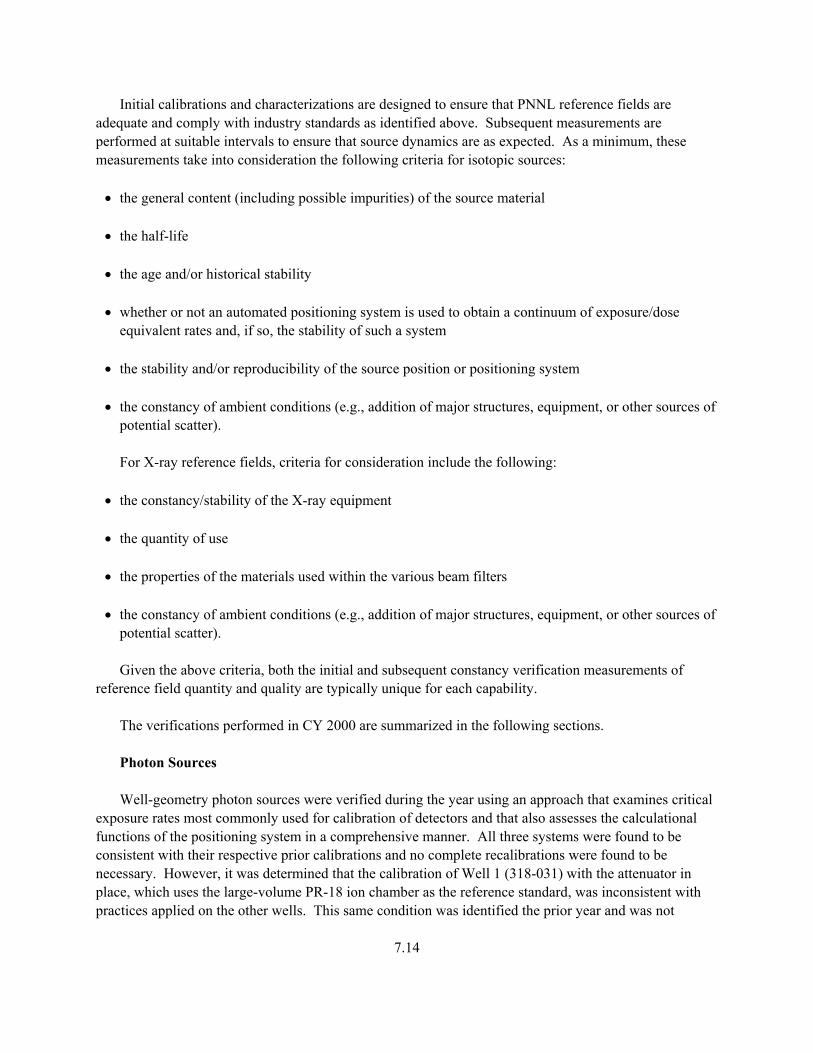
Initial calibrations and characterizations are designed to ensure that PNNL reference fields are adequate and comply with industry standards as identified above. Subsequent measurements are performed at suitable intervals to ensure that source dynamics are as expected. As a minimum, these measurements take into consideration the following criteria for isotopic sources:
• the general content (including possible impurities) of the source material
• the half-life
• the age and/or historical stability
• whether or not an automated positioning system is used to obtain a continuum of exposure/dose equivalent rates and, if so, the stability of such a system
• the stability and/or reproducibility of the source position or positioning system
• the constancy of ambient conditions (e.g., addition of major structures, equipment, or other sources of
potential scatter). For X-ray reference fields, criteria for consideration include the following:
• the constancy/stability of the X-ray equipment
• the quantity of use
• the properties of the materials used within the various beam filters
• the constancy of ambient conditions (e.g., addition of major structures, equipment, or other sources of potential scatter).
Given the above criteria, both the initial and subsequent constancy verification measurements of reference field quantity and quality are typically unique for each capability. The verifications performed in CY 2000 are summarized in the following sections.
Photon Sources Well-geometry photon sources were verified during the year using an approach that examines critical exposure rates most commonly used for calibration of detectors and that also assesses the calculational functions of the positioning system in a comprehensive manner. All three systems were found to be consistent with their respective prior calibrations and no complete recalibrations were found to be necessary. However, it was determined that the calibration of Well 1 (318-031) with the attenuator in place, which uses the large-volume PR-18 ion chamber as the reference standard, was inconsistent with practices applied on the other wells. This same condition was identified the prior year and was not
7.14
corrected as anticipated. The previous full calibration of this system used a response correction factor established under ideal conditions for the calibration chamber, which has a wall thickness of 212 mg/cm2. For other wells, the calibration has been normalized to a buildup thickness of 726 mg/cm2 (i.e., that of the PM-30 reference ion chambers), which is more consistent with the normal wall thickness of field detectors calibrated using the wells. Data from the last full calibration of Well 1 (December 1997) were compensated appropriately for this difference and reference fields in the nominal range of 0.1 to 7.0 mR/h were adjusted higher by 4% to 6%. High-Exposure Facility sources were verified using an approach similar to that used for well-geometry sources. The LSR gamma sources were verified using the new measurement protocol developed in 1998. Other photon isotopic sources (i.e., Shepherd 137Cs and 241Am irradiators) were verified as in prior years and found to be consistent. After moving to a 1-year interval for calibration verification on the X-ray system in CY 1999, troubles with the primary Philips X-ray machines during the end of that year ended the use of those particular machines. During the ensuing recovery, a backup Pantak machine was brought online for use with most of the Bremsstrahlung techniques and replacement efforts began for the Philips systems. As a result of this, it was considered prudent to return to a more frequent interval for calibration. X-ray calibrations have also been structured around a moving average of multiple calibrations. The increased frequency, selected to be 6 months, would also enable a quicker build up of calibration data. This 6-month calibration interval was maintained for each X-ray technique on the Pantak system throughout CY 2000 and will be implemented for the Philips systems, as well, during its continuing return to service. Following several calibration cycles, the interval for X-ray calibrations will again be reviewed and, if warranted, will again be extended to 1 year.
Neutron Sources Well 3, containing a 252Cf source (318-167), was calibrated using the NRC Rem-Rad (Snoopy). The mean bias in comparison to the prior calibration in CY 1999 was !1.6%. The bias ranged from !0.8% to !3.2%, but there was no correlation with the position of the source, indicating that there were no problems with the positioning system. It was considered likely that the identified bias was due to a change in the half-life of the source, which is anticipated to have a steadily increasing influence from 250Cf as it ages.
Beta Sources Beta sources used most commonly for calibration or characterization purposes, 147Pm source 318-290, 204Tl source 318-192, depleted uranium source 318-166, and 90Sr/90Y sources 318-102 and -103, were confirmed via extrapolation chamber measurement. Due to the extensive efforts required to perform complete measurements of absorbed dose from beta sources, those used only occasionally are calibrated/confirmed only when needed. All measurements confirmed the previously established dose rates of the sources within the prior measurement uncertainty.
7.15
Reference Standard Instruments Routinely used instrument standards were verified for consistency, as necessary, to ensure their subsequent accuracy for measuring reference fields. These included various AICs used to perform photon reference field measurements, the PTW extrapolation chamber used to assess beta reference fields, and the reference NRC-Snoopy survey instrument used to convey calibration to Well 3. 7.1.4 Applications The capabilities maintained, in part, via the RS&CP and under the custodianship of the CR&A subgroup can be subdivided into general areas of support for passive and active radiation measurement and dosimetry. These areas are described below.
Traceability Transfer The radiological reference fields and reference class instruments available within the RS&CP suit the function of establishing or extending traceability to NIST. Most importantly under this project, this applies to the calibration/characterization of working class reference fields such as the well calibrators and panoramic gamma calibration fields available in the 318 Building and the calibration of dosimeter devices used in support of external dosimetry efforts (e.g., calibration/testing of dosimeters, dosimeter readers, and automated dosimeter irradiation devices). Similar transfers of traceability are available to those outside of the immediate facility as well. These are facilitated by the submission of dosimetry devices or reference instruments for irradiation/calibration within the NIST-traceable reference fields. These irradiations serve to establish implied traceability for the user/owner reference field or dosimetry analysis capabilities.
Traceability Confirmation The radiological reference fields are used to provide a blind evaluation of performance, either in the area of instrument calibration or external dosimetry analysis. Such MQA tests help ensure that the participant uses NIST-traceable artifacts consistently and, if necessary, appropriately addresses external influences characteristic of related analytical equipment and/or the calibration environment.
Unique Calibration or Investigative Needs Traceable radiological reference fields may be configured specifically to meet or approximate the needs of a select application for evaluation of field instrument response, reference class instruments, and dosimetry. Historically, reference fields have been structured to account for alternate radiation field geometries, special beta source attenuation configurations, and interpolation of detector response to atypical calibration energies, short-lived nuclides, and mixed fields.
7.16
Characterization/Type Testing Reference fields are used to evaluate lower levels of detection; neutron, beta, and photon energy dependence; the influence of contaminating radiation fields on detectors; response linearity; geometry dependence; and acceptance testing.
CY 2000 Summary During CY 2000, efforts focused on the above-described scopes of work. Within the scope of traceability transfer, calibration of the various radiological reference fields in the 318 Building were confirmed as described in Section 7.1.3. In support of traceability confirmation, Hanford dosimeters were exposed on a monthly, quarterly, and annual basis to provide audit and QC evaluations of the PNNL external dosimetry analysis system. In addition, FH contracted for exposed dosimeters on a monthly basis as an independent evaluation of the PNNL external dosimetry analysis system. In all, approximately 1,355 Hanford dosimeters were exposed to controlled doses of radiation for this process. Characterization and type testing efforts during CY 2000 supported both external dosimetry and instrument calibration efforts. Collectively, approximately 310 dosimeters were exposed to investigate dosimeter configuration and the effects of specific irradiation geometry conditions on the response of Hanford whole body and/or extremity dosimeters. Electronic dosimetry and survey instrument devices were irradiated in support of energy dependence testing and evaluations of sensitivity to beta radiation. 7.2 Operational Improvements During 2000, operational improvements were made to develop and enhance techniques, systems, and processes, as described in the following sections. 7.2.1 Repair/Replacement of X-Ray Systems Work continued on implementing the backup, Pantak X-ray system for techniques not configured during the CY 1999 and by early 2000, the full Bremsstrahlung X-ray capability had been restored. Normally, when a move to a secondary system or alternate reference field capability takes place, an intercomparison of that system would be made against the primary fields using typical artifacts calibrated or irradiated using that system. This is desirable to identify whether subtle differences in the systems, which may not be realized by standard characterization methods, might potentially be detectable on such artifacts. Unfortunately, a direct intercomparison with the primary reference fields was not possible due to their catastrophic failure. A review of Hanford dosimeters performed in 1999 was useful in gaining confidence that the new reference fields were performing well; however, more proof was sought to provide additional confidence. That additional confidence was gained via a review of dosimeter test data reported by processors undergoing NVLAP proficiency testing. An evaluation of general performance trends provided objective evidence that X-ray reference fields generated by the backup system were indistinct from those of the primary system.
7.17
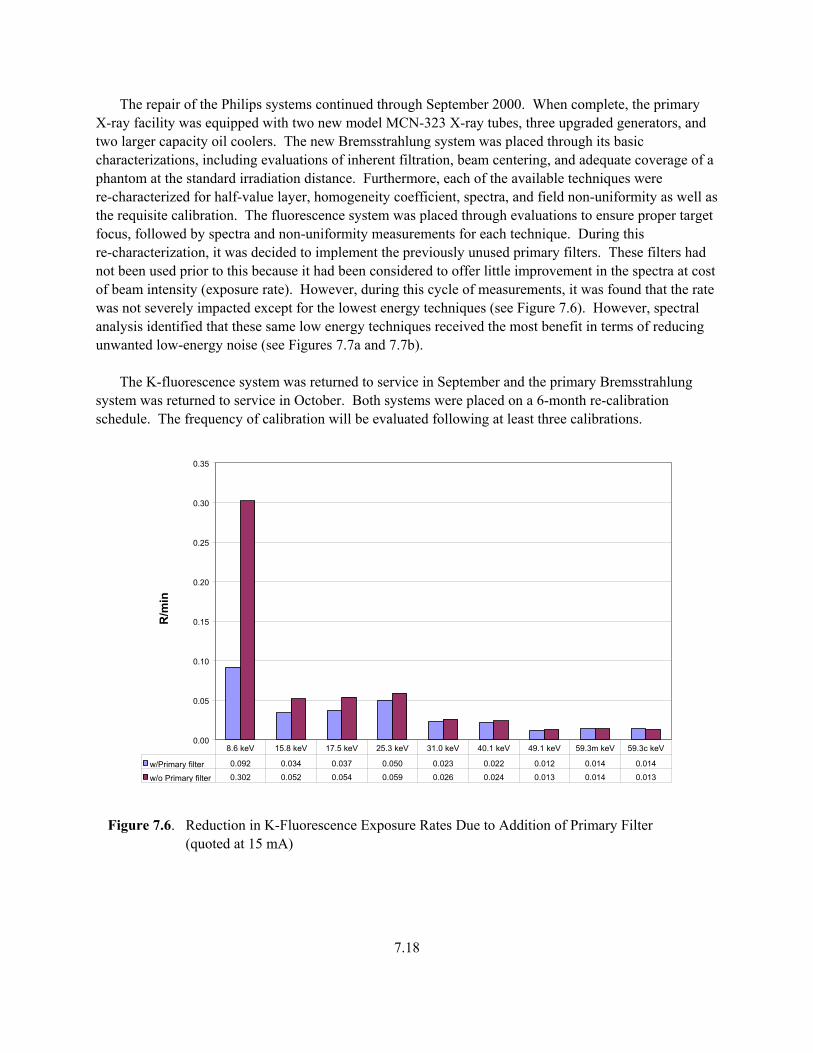
The repair of the Philips systems continued through September 2000. When complete, the primary X-ray facility was equipped with two new model MCN-323 X-ray tubes, three upgraded generators, and two larger capacity oil coolers. The new Bremsstrahlung system was placed through its basic characterizations, including evaluations of inherent filtration, beam centering, and adequate coverage of a phantom at the standard irradiation distance. Furthermore, each of the available techniques were re-characterized for half-value layer, homogeneity coefficient, spectra, and field non-uniformity as well as the requisite calibration. The fluorescence system was placed through evaluations to ensure proper target focus, followed by spectra and non-uniformity measurements for each technique. During this re-characterization, it was decided to implement the previously unused primary filters. These filters had not been used prior to this because it had been considered to offer little improvement in the spectra at cost of beam intensity (exposure rate). However, during this cycle of measurements, it was found that the rate was not severely impacted except for the lowest energy techniques (see Figure 7.6). However, spectral analysis identified that these same low energy techniques received the most benefit in terms of reducing unwanted low-energy noise (see Figures 7.7a and 7.7b). The K-fluorescence system was returned to service in September and the primary Bremsstrahlung system was returned to service in October. Both systems were placed on a 6-month re-calibration schedule. The frequency of calibration will be evaluated following at least three calibrations.
0.00
0.05
0.10
0.15
0.20
0.25
0.30
0.35
R/m
in
w/Primary filter 0.092 0.034 0.037 0.050 0.023 0.022 0.012 0.014 0.014
w/o Primary filter 0.302 0.052 0.054 0.059 0.026 0.024 0.013 0.014 0.013
8.6 keV 15.8 keV 17.5 keV 25.3 keV 31.0 keV 40.1 keV 49.1 keV 59.3m keV 59.3c keV
Figure 7.6. Reduction in K-Fluorescence Exposure Rates Due to Addition of Primary Filter (quoted at 15 mA)
7.18
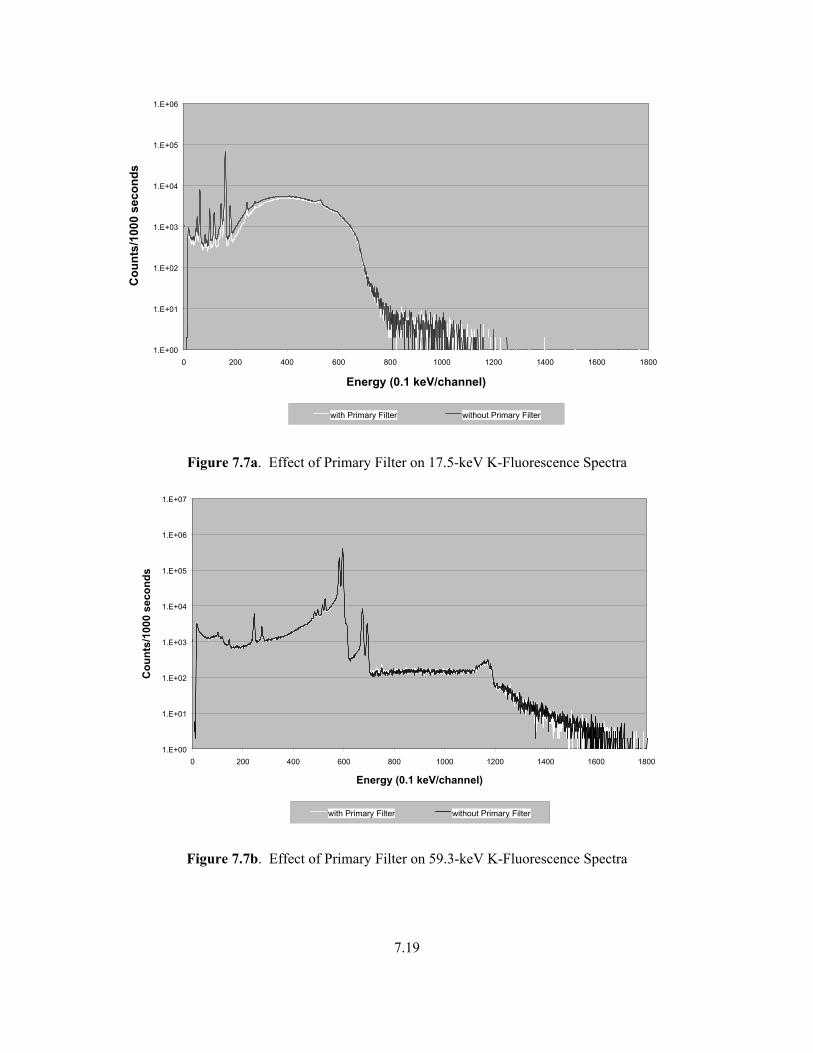
1.E+00
1.E+01
1.E+02
1.E+03
1.E+04
1.E+05
1.E+06
0 200 400 600 800 1000 1200 1400 1600 1800
Energy (0.1 keV/channel)
Cou
nts/
1000
sec
onds
with Primary Filter without Primary Filter
Figure 7.7a. Effect of Primary Filter on 17.5-keV K-Fluorescence Spectra
1.E+00
1.E+01
1.E+02
1.E+03
1.E+04
1.E+05
1.E+06
1.E+07
0 200 400 600 800 1000 1200 1400 1600 1800
Energy (0.1 keV/channel)
Cou
nts/
1000
sec
onds
with Primary Filter without Primary Filter
Figure 7.7b. Effect of Primary Filter on 59.3-keV K-Fluorescence Spectra
7.19
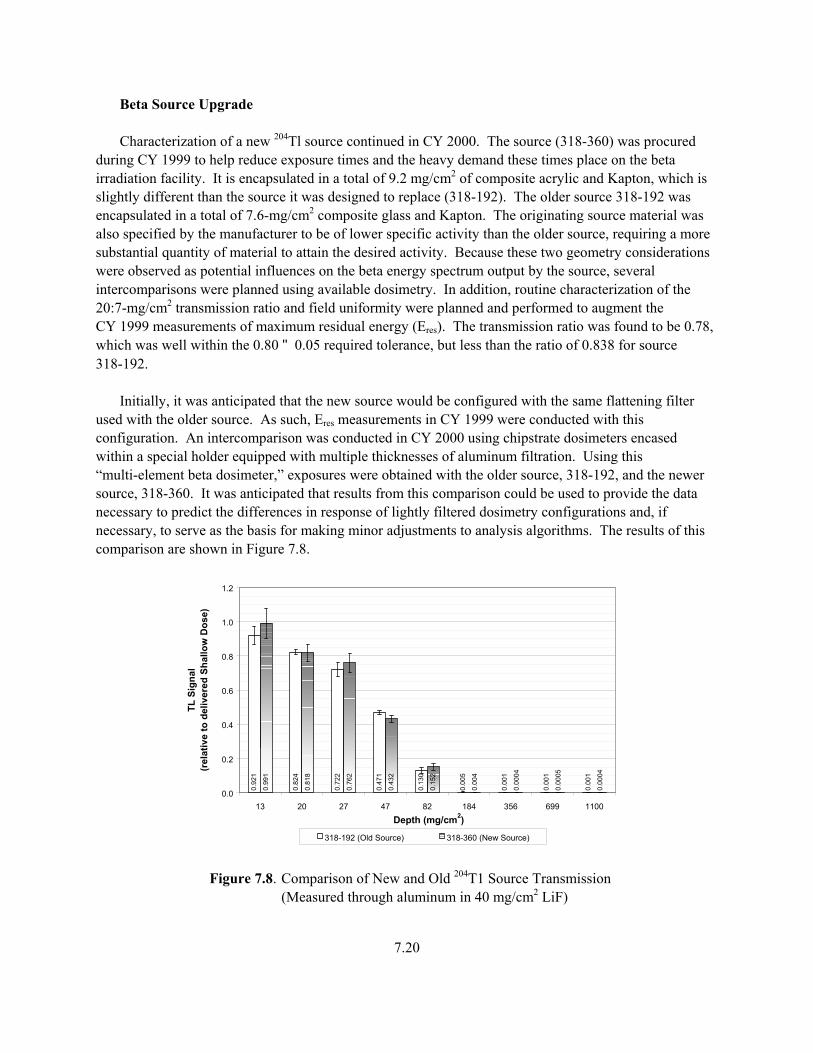
Beta Source Upgrade Characterization of a new 204Tl source continued in CY 2000. The source (318-360) was procured during CY 1999 to help reduce exposure times and the heavy demand these times place on the beta irradiation facility. It is encapsulated in a total of 9.2 mg/cm2 of composite acrylic and Kapton, which is slightly different than the source it was designed to replace (318-192). The older source 318-192 was encapsulated in a total of 7.6-mg/cm2 composite glass and Kapton. The originating source material was also specified by the manufacturer to be of lower specific activity than the older source, requiring a more substantial quantity of material to attain the desired activity. Because these two geometry considerations were observed as potential influences on the beta energy spectrum output by the source, several intercomparisons were planned using available dosimetry. In addition, routine characterization of the 20:7-mg/cm2 transmission ratio and field uniformity were planned and performed to augment the CY 1999 measurements of maximum residual energy (Eres). The transmission ratio was found to be 0.78, which was well within the 0.80 " 0.05 required tolerance, but less than the ratio of 0.838 for source 318-192. Initially, it was anticipated that the new source would be configured with the same flattening filter used with the older source. As such, Eres measurements in CY 1999 were conducted with this configuration. An intercomparison was conducted in CY 2000 using chipstrate dosimeters encased within a special holder equipped with multiple thicknesses of aluminum filtration. Using this “multi-element beta dosimeter,” exposures were obtained with the older source, 318-192, and the newer source, 318-360. It was anticipated that results from this comparison could be used to provide the data necessary to predict the differences in response of lightly filtered dosimetry configurations and, if necessary, to serve as the basis for making minor adjustments to analysis algorithms. The results of this comparison are shown in Figure 7.8.
0.13
0
0.00
5
0.00
1
0.00
1
0.00
1
0.99
1
0.81
8
0.76
2
0.43
2
0.15
2
0.00
4
0.47
1
0.72
2
0.82
4
0.92
1
0.00
04
0.00
05
0.00
04
0.0
0.2
0.4
0.6
0.8
1.0
1.2
13 20 27 47 82 184 356 699 1100Depth (mg/cm2)
TL S
igna
l(r
elat
ive
to d
eliv
ered
Sha
llow
Dos
e)
318-192 (Old Source) 318-360 (New Source)
Figure 7.8. Comparison of New and Old 204T1 Source Transmission (Measured through aluminum in 40 mg/cm2 LiF)
7.20
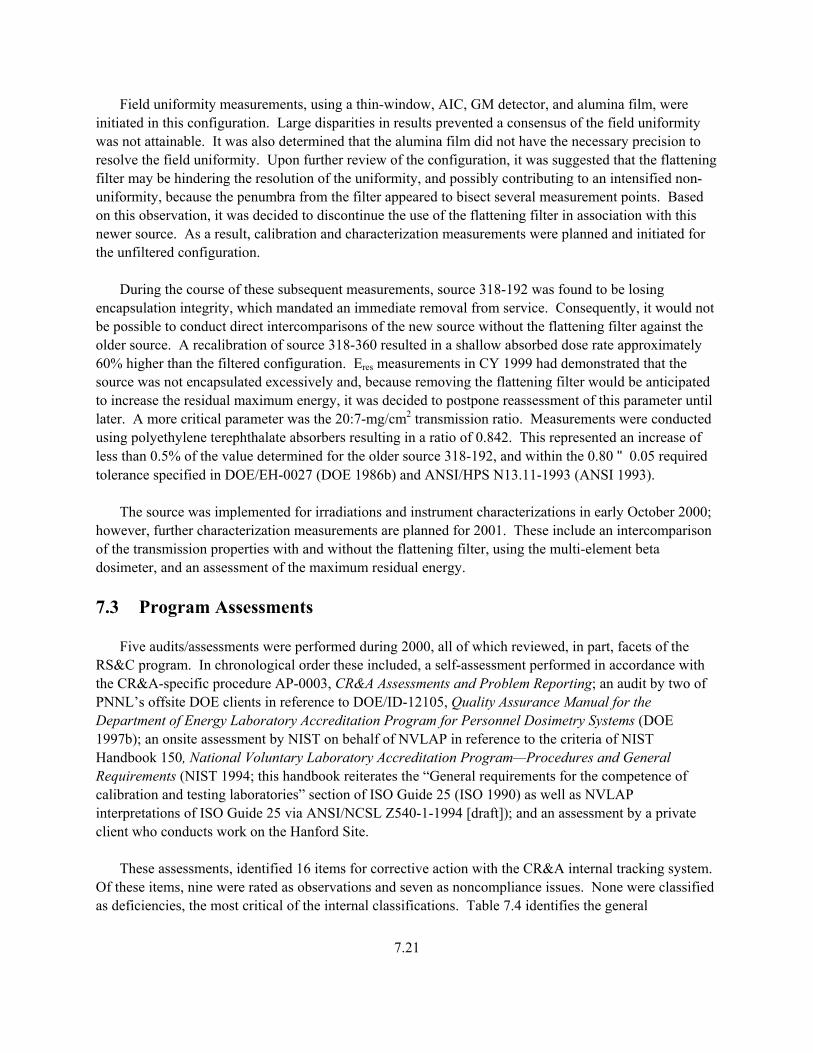
Field uniformity measurements, using a thin-window, AIC, GM detector, and alumina film, were initiated in this configuration. Large disparities in results prevented a consensus of the field uniformity was not attainable. It was also determined that the alumina film did not have the necessary precision to resolve the field uniformity. Upon further review of the configuration, it was suggested that the flattening filter may be hindering the resolution of the uniformity, and possibly contributing to an intensified non-uniformity, because the penumbra from the filter appeared to bisect several measurement points. Based on this observation, it was decided to discontinue the use of the flattening filter in association with this newer source. As a result, calibration and characterization measurements were planned and initiated for the unfiltered configuration. During the course of these subsequent measurements, source 318-192 was found to be losing encapsulation integrity, which mandated an immediate removal from service. Consequently, it would not be possible to conduct direct intercomparisons of the new source without the flattening filter against the older source. A recalibration of source 318-360 resulted in a shallow absorbed dose rate approximately 60% higher than the filtered configuration. Eres measurements in CY 1999 had demonstrated that the source was not encapsulated excessively and, because removing the flattening filter would be anticipated to increase the residual maximum energy, it was decided to postpone reassessment of this parameter until later. A more critical parameter was the 20:7-mg/cm2 transmission ratio. Measurements were conducted using polyethylene terephthalate absorbers resulting in a ratio of 0.842. This represented an increase of less than 0.5% of the value determined for the older source 318-192, and within the 0.80 " 0.05 required tolerance specified in DOE/EH-0027 (DOE 1986b) and ANSI/HPS N13.11-1993 (ANSI 1993). The source was implemented for irradiations and instrument characterizations in early October 2000; however, further characterization measurements are planned for 2001. These include an intercomparison of the transmission properties with and without the flattening filter, using the multi-element beta dosimeter, and an assessment of the maximum residual energy. 7.3 Program Assessments Five audits/assessments were performed during 2000, all of which reviewed, in part, facets of the RS&C program. In chronological order these included, a self-assessment performed in accordance with the CR&A-specific procedure AP-0003, CR&A Assessments and Problem Reporting; an audit by two of PNNL’s offsite DOE clients in reference to DOE/ID-12105, Quality Assurance Manual for the Department of Energy Laboratory Accreditation Program for Personnel Dosimetry Systems (DOE 1997b); an onsite assessment by NIST on behalf of NVLAP in reference to the criteria of NIST Handbook 150, National Voluntary Laboratory Accreditation Program—Procedures and General Requirements (NIST 1994; this handbook reiterates the “General requirements for the competence of calibration and testing laboratories” section of ISO Guide 25 (ISO 1990) as well as NVLAP interpretations of ISO Guide 25 via ANSI/NCSL Z540-1-1994 [draft]); and an assessment by a private client who conducts work on the Hanford Site. These assessments, identified 16 items for corrective action with the CR&A internal tracking system. Of these items, nine were rated as observations and seven as noncompliance issues. None were classified as deficiencies, the most critical of the internal classifications. Table 7.4 identifies the general
7.21
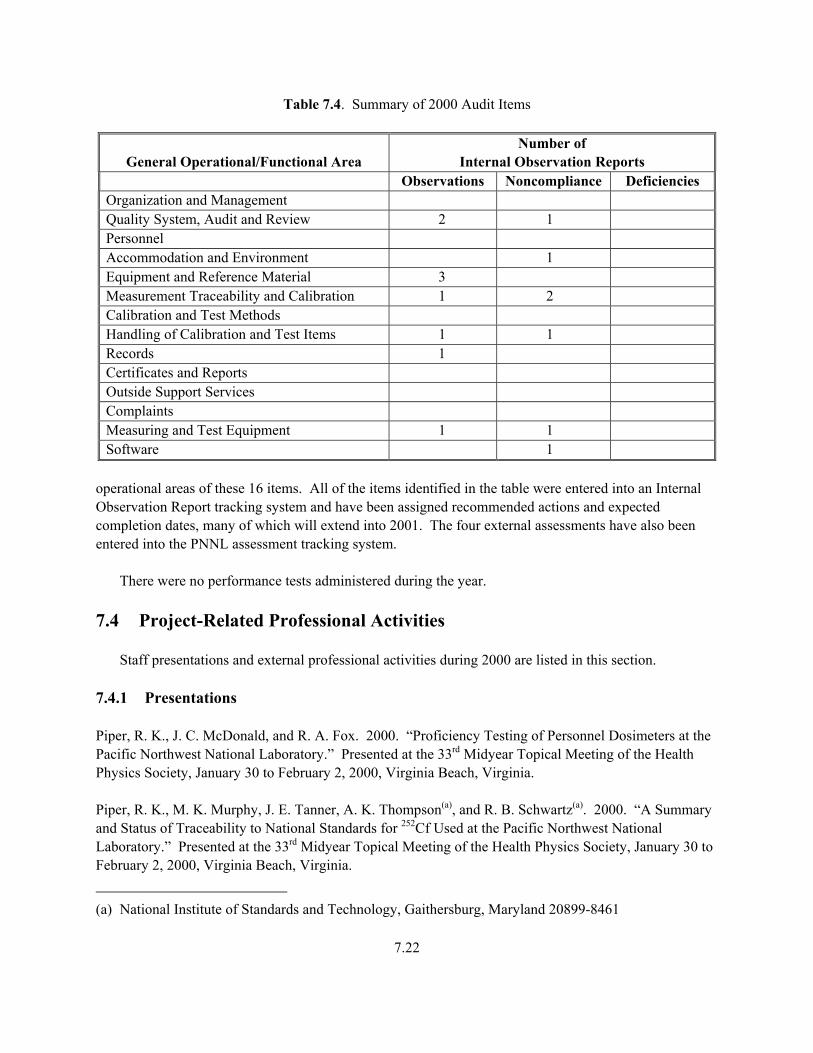
Table 7.4. Summary of 2000 Audit Items
General Operational/Functional Area Number of
Internal Observation Reports Observations Noncompliance Deficiencies
Organization and Management Quality System, Audit and Review 2 1 Personnel Accommodation and Environment 1 Equipment and Reference Material 3 Measurement Traceability and Calibration 1 2 Calibration and Test Methods Handling of Calibration and Test Items 1 1 Records 1 Certificates and Reports Outside Support Services Complaints Measuring and Test Equipment 1 1 Software 1
operational areas of these 16 items. All of the items identified in the table were entered into an Internal Observation Report tracking system and have been assigned recommended actions and expected completion dates, many of which will extend into 2001. The four external assessments have also been entered into the PNNL assessment tracking system. There were no performance tests administered during the year. 7.4 Project-Related Professional Activities Staff presentations and external professional activities during 2000 are listed in this section. 7.4.1 Presentations Piper, R. K., J. C. McDonald, and R. A. Fox. 2000. “Proficiency Testing of Personnel Dosimeters at the Pacific Northwest National Laboratory.” Presented at the 33rd Midyear Topical Meeting of the Health Physics Society, January 30 to February 2, 2000, Virginia Beach, Virginia. Piper, R. K., M. K. Murphy, J. E. Tanner, A. K. Thompson(a), and R. B. Schwartz(a). 2000. “A Summary and Status of Traceability to National Standards for 252Cf Used at the Pacific Northwest National Laboratory.” Presented at the 33rd Midyear Topical Meeting of the Health Physics Society, January 30 to February 2, 2000, Virginia Beach, Virginia.
(a) National Institute of Standards and Technology, Gaithersburg, Maryland 20899-8461
7.22
Piper, R. K. and R. A. Fox. 2000. “Dosimetry Testing at PNNL.” Presented at the Ninth Annual Meeting of the Council on Ionizing Radiation Measurements and Standards (CIRMS), October 30 to November 1, 2000, Gaithersburg, Maryland. 7.4.2 Publications Piper, R. K., M. K. Murphy, J. E. Tanner, A. K. Thompson(a), and R. B. Schwartz(a). 2000. A Summary and Status of Traceability to National Standards for 252Cf Used at the Pacific Northwest National Laboratory. In Proceedings of the 33rd Midyear Topical Meeting of the Health Physics Society. Medical Physics Publishing, Madison, Wisconsin. 7.4.3 External Professional Activities Fox, R. A., Member of the Working Group for ANSI N13.11, Personnel Dosimetry Performance – Criteria for Testing. Murphy, M. K., Member of the ASTM Subcommittee E10.01, Radiation Processing Dosimetry, and Chair of the Task Group for Standard Practice for Use of Photo-fluorescent Dosimetry Systems.
(a) National Institute of Standards and Technology, Gaithersburg, Maryland 20899-8461
7.23
8.0 References 10 CFR 835. 1998. U.S. Department of Energy (DOE). “Occupational Radiation Protection.” Revision 1. U.S. Code of Federal Regulations. 10 CFR 830. 2000. U.S. Department of Energy (DOE). “Nuclear Safety Management.” U.S. Code of Federal Regulations. American National Standards Institute (ANSI). 1972. American National Standard Practice for Occupational Radiation Exposure Records Systems. ANSI N13.6, New York. American National Standards Institute (ANSI). 1975. An American National Standard, Performance, Testing, and Procedural Specifications for Thermoluminescence Dosimetry (Environmental Applications). ANSI N545, New York. American National Standards Institute (ANSI). 1978. An American National Standard, Radiation Protection Instrumentation Test and Calibration. ANSI N323, New York. American National Standards Institute (ANSI). 1993. An American National Standard, Personnel Dosimetry PerformanceCriteria for Testing. ANSI/HPS N13.11, American National Standards Institute, New York. Freedom of Information Act, Public Law 89-847, July 4, 1966. Health Physics Society (HPS). 1995. An American National Standard, Performance Testing of Extremity Dosimeters. HPS N13.32, Health Physics Society, McLean, Virginia. International Commission on Radiological Protection (ICRP). 1977. “Recommendations of the International Commission on radiological protection.” (ICRP publication 26). Annals of ICRP, 1:3, Elsevier Science, Inc., Tarrytown, New York. International Commission on Radiological Protection (ICRP). 1979. “Limits for intakes of radionuclides by workers.” (ICRP publication 30, part 1). Annals of ICRP, 2:3/4, Elsevier Science, Inc., Tarrytown, New York. International Commission on Radiological Protection (ICRP). 1991. “1990 Recommendations of the International Commission on Radiological Protection.” (ICRP publication 60). Annals of ICRP, 21:1-3, Elsevier Science, Inc., Tarrytown, New York. International Commission on Radiological Protection (ICRP). 1994. “Human respiratory tract model for radiological protection.” (ICRP publication 66). Annals of ICRP, 24:1-3, Elsevier Science, Inc., Tarrytown, New York.
8.1
International Standards Organization (ISO). 1984. Reference Beta Radiations for Calibrating Dosimeters and Doseratemeters and for Determining Their Response as a Function of Beta Radiation Energy. ISO 6980, Geneva, Switzerland. International Standards Organization (ISO). 1989. Neutron Reference Radiations for Calibrating Neutron-Measuring Devices Used for Radiation Protection Purposes and for Determining Their Response as a Function of Neutron Energy. ISO 8529, Geneva, Switzerland. International Standards Organization (ISO). 1990. General Requirements for the Competence of Calibration and Testing Laboratories. Guide 25, Geneva, Switzerland. International Standards Organization (ISO). 1996a. X and Gamma Reference Radiation for Calibrating Dosimeters and Dose Rate Meters and for Determining Their Response as a Function of Photon Energy—Part 1: Radiation Characteristics and Production Methods. ISO 4037-1, Geneva, Switzerland. International Standards Organization (ISO). 1996b. X and Gamma Reference Radiation for Calibrating Dosimeters and Dose Rate Meters and for Determining Their Response as a Function of Photon Energy—Part 3: Calibration of Area and Personal Dosimeters and the Measurement of Their Response as a Function of Energy and Angle of Incidence. ISO 4037-3, Geneva, Switzerland. Lynch, T. P., J. A. MacLellan, D. E. Bihl, R. K. Piper, M. L. Johnson. 2000. Hanford Radiological Protection Support Services Annual Report for 1999. PNNL-13238, Pacific Northwest National Laboratory, Richland, Washington. National Institute of Standards and Technology (NIST). 1994. National Voluntary Laboratory Accreditation Program, Procedures and General Requirements. NIST Handbook 150. U.S. Department of Commerce, Washington, D.C. Pinson, E. A., and W. H. Langham. 1980. “Physiology and Toxicology of Tritium in Man.” Health Phys. 38 (1087-1110). Privacy Act, 44 Federal Regulations 510 777 (1974). Scherpelz, R. I., J. J. Fix, and B. A. Rathbone. 2000. Validation of Hanford Personnel and Extremity Dosimeters in Plutonium Environments. PNNL-13136, Pacific Northwest National Laboratory, Richland, Washington. Sula, M. J., E. H. Carbaugh, and D. E. Bihl. 1991. Technical Basis for Internal Dosimetry at Hanford, Rev. 1. PNL-6866 R.1, Pacific Northwest National Laboratory. U.S. Department of Energy (DOE). 2000. Environment, Safety and Health Reporting Manual, DOE Manual 231.1-1 Change 2, Washington, D.C. U.S. Department of Commerce/National Bureau of Standards (DOC/NBS). 1982. Proceedings for Calibrating Neutron Personnel Dosimeters. NBS Special Publication 633, Washington, D.C.
8.2
U.S. Department of Commerce. 1994. National Voluntary Laboratory Accreditation Program - Procedures and General Requirements. NIST Handbook 150-4, Gaithersburg, Maryland. U.S. Department of Energy (DOE). 1986a. Handbook for the Department of Energy Accreditation Program for Personnel Dosimetry Systems. DOE/EH-0026, Washington, D.C. U.S. Department of Energy (DOE). 1986b. Department of Energy Standard for the Performance Testing of Personnel Dosimetry Systems. DOE/EH-0027, Washington, D.C. U.S. Department of Energy (DOE). 1996. Implementation Guide for Use with 36 CFR Chapter XII - Subchapter B Records Management. DOE G 1324.5B, Washington, D.C. U.S. Department of Energy (DOE). 1997a. Environment, Safety and Health Reporting. DOE Order 231.1-1 Change 2, Washington, D.C. U.S. Department of Energy (DOE). 1997b. Quality Assurance Manual for the Department of Energy Laboratory Accreditation Program for Personnel Dosimetry Systems. DOE/ID-12105, Washington, D.C. U.S. Department of Energy (DOE). 1999a. Internal Dosimetry Program Guide. DOE G 441.1-3, Washington, D.C. U.S. Department of Energy (DOE). 1999b. DOE Standard Internal Dosimetry. DOE-STD-1121-98. Washington, D.C. U.S. Department of Energy (DOE). 1999c. Occupational Radiation Protection Record-Keeping and Reporting Guide. DOE G 441.1-11, Washington, D.C. U.S. Department of Energy (DOE). 2000. Environment, Safety and Health Reporting Manual. DOE Manual 231.1-1 Change 2, Washington, D.C.
8.3
PNNL-13542
Distribution No. of Copies OFFSITE DOE EM-4
M. Gavrilas-Guinn Radiological Control Program Advisor Environmental Management, U.S Department of Energy 1000 Independence Ave., S.W. Washington, D.C. 20585
DOE EH-54 R. M. Loesch U.S. Department of Energy Mail Stop - 5142 19901 Germantown Rd Germantown, MD 20874-1290
4 DOE Albuquerque Field Office
M. G. Knight Radiological Control Manager Battelle Pantex Plant P.O. Box 30020 Amarillo, TX 79120
R. J. Blum Mound Laboratory EG&G Mound Applied Technologies P.O. Box 3000 Miamisburg, OH 45342
J. M. Graf Los Alamos National Laboratory P.O. Box 1663 Los Alamos, NM 87545
No. of Copies
S. Baker RMRS Rocky Flats Plant P.O. Box 464 Golden, CO 80402-0464
2 DOE Chicago Field Office
S. Layendecker Radiological Control Section Brookhaven National Laboratory P.O. Box 5000 Upton, NY 11973
Manager, Radiation Protection Argonne National Laboratory 9700 South Cass Avenue Argonne, IL 60439
DOE Idaho Field Office
G. Courtney LITCO P.O. Box 4000 Idaho Falls, ID 83404
DOE Nevada Field Office
C. T. Bastian Bechtel Nevada P.O. Box 98521 Las Vegas, NV 89193
Distr.1
PNNL-13542
No. of Copies 2 DOE Oak Ridge Field Office
J. S. Bogard Oak Ridge National Laboratory Martin Marietta Energy Systems, Inc. P.O. Box 2008 Oak Ridge, TN 37831
J. B. Hunt Y-12 Plant Martin Marietta Energy Systems, Inc. P.O. Box 2009 Oak Ridge, TN 37831
DOE San Francisco Field Office
C. T. Prevo Lawrence Livermore National Laboratory P.O. Box 808 Livermore, CA 94550
DOE Savannah River Field Office
K. W. Crase Westinghouse Savannah River Company Savannah River Plant P.O. Box 616 Aiken, SC 29802
No. of Copies ONSITE 5 DOE Richland Operations Office
T.L. Aldridge K8-50 W. M. Glines A2-15 B. M. Pangborn A5-17 R. M. Rosselli A7-50 D. E. Trader K8-50
4 Environmental Restoration Contractor
D. E. Gergely H0-15 C. L. Hellier X0-34 J. E. Tarpinian H0-09 S. L. Winslow L5-64
Hanford Environmental Health Foundation
S. M. McInturff H1-77
2 Fluor Daniel Hanford
D. B. Ottley H5-26 G. D. Perkins H8-67 Washington State University (Tri-Cities)
R. Filipy H2-52
Distr.2
PNNL-13542
No. of Copies 37 Pacific Northwest National Laboratory
D. E. Bihl (2) P7-02 E. H. Carbaugh P7-01 S. K. Ennor K1-01 J. J. Fix K3-55 M. E. Hevland (10) P7-02 S. D. Dossett P7-75 M. L. Johnson (2) P7-01 J. L. Kenoyer K3-55 M. P. Long P7-28 T. P. Lynch (2) B1-60 J. C. McDonald K3-53 J. A. MacLellan P7-01 R. K. Piper (2) P7-03 K. H. Pryor K8-34 B. A. Rathbone P7-02 W. J. Apley K9-01 K. L. Soldat K3-53 Radiation Protection Historical Files (c/o M. A. Combs) (2) P7-01 Information Release Office (5) K1-06
Distr.3