Embed Size (px)
Citation preview
Hanford Site-Wide Probabilistic Seismic Hazard Analysis 2014
Appendix K (Revision 1)
Example Application of Approach 3
to Develop Soil Hazard Curves

Hanford Site-Wide Probabilistic Seismic Hazard Analysis 2014
K.1
Appendix K –
Example Application of Approach 3 to Develop Soil Hazard Curves
The seismic hazard results presented in Chapter 10.0 represent the hazard at the baserock horizon defined to be at the top of the Wanapum basalts, which is encountered at depths of between 332 and 446 m at the hazard calculation Sites A−E. As discussed in Section 10.5, the recommended approach for development of hazard results at or near the ground surface is the application of Approach 3 as defined by McGuire et al. (2001). This appendix presents an example of the application of Approach 3 to develop surface soil hazard curves for peak ground acceleration (PGA) at the Waste Treatment Plant (WTP) site adjacent to the 200-East Area on the U.S. Department of Energy’s (DOE’s) Hanford Site. The purpose of this example is to provide an illustration of the manner in which the products from the Hanford PSHA can be used at various facility sites within the Hanford Site to develop ground motions at the surface for use in design or design review. The example is developed for a single structural frequency (PGA) but is applicable to a full range of structural frequencies.
K.1 Description of Approach 3
The basic concept of Approach 3 is to convolve a probabilistic representation of site response with the probabilistic seismic hazard results for the base rock to produce probabilistic seismic hazard results at the desired horizon within the soil column. As discussed by McGuire et al. (2001), Approach 3 can be applied in various ways depending on the specification of the probabilistic site amplification. These alternatives include use of magnitude- and distance-dependent amplification functions, use of only magnitude-dependent amplification functions, and use of magnitude- and distance-independent amplification functions. McGuire et al. (2001) indicate that soil response is governed primarily by the level of rock motion and the magnitude of the seismic event; and given the level of rock motion and the earthquake magnitude, the distance of the seismic event from a site does not have a significant effect on the soil response. Therefore, only magnitude dependence is incorporated in this example calculation of site amplification. This approach is designated by McGuire et al. (2001) as Approach 3A.
The theoretical basis for Approach 3 is provided in Bazzurro and Cornell (2004) and is given below as Equation (K.1), which is formulated to match Approach 3A of McGuire et al. (2001).
GZ (zk ) P Y zk
x j
x j, mi
pX M (x j M mi )
j
i
(K.1)
In Equation (K.1) GZ(zk) is the soil hazard curve that provides the annual frequency of exceeding
ground motion level zk, pX M (xj M mi ) is the discretized rock hazard curve that provides the annual
frequency of ground motions on rock of xj (values near xj) contributed by magnitude mi (obtained from
deaggregation), and P Y zk
x j
x j, mi
is the probability that the site amplification, Y, is greater than or
2014 Hanford Site-Wide Probabilistic Seismic Hazard Analysis
equal to zk
x j
given ground motions xj from magnitude mi earthquakes. Following most applications of
Approach 3 (e.g., McGuire et al. 2001, 2002; Bazzurro and Cornell 2004), the site amplification Y is assumed to be log normally distributed, resulting in:
P Y zk
x j
x j, mi
1
lnzk
x j
lnY xj, mi
lnY x j,mi
(K.2)
In Equation (K.2), is the mean value of lnY evaluated at xj, and mi; is the
standard deviation of lnY evaluated at xj, and mi; and Φ[ ] is the cumulative normal distribution function.
Equations (K.1) and (K.2) provide the basis for developing a soil hazard curve from a rock hazard
curve incorporating a probabilistic representation of site response. The parameter characterizes
the variability in site response that is typically considered aleatory variability (see, for example, EPRI 2013), and is modeled by conducting site response calculations for a suite of randomized dynamic properties (i.e., shear wave velocity, modulus reduction and damping relationships, and layer thicknesses). In addition, there is epistemic uncertainty in defining average dynamic properties of the site materials above the reference rock horizon where the hazard is specified. This epistemic uncertainty is captured by defining alternative base case dynamic properties, developing randomized sets of properties
for each base case, characterizing and for each base case, and then applying
Equations (K.1) and K.2) to develop a soil hazard curve for each base case set of dynamic properties. The result is a suite of alternative soil hazard curves with weights that represent the weights assigned to the alternative sets of dynamic properties. These weighted hazard curves are then used to develop a mean soil hazard curve at the desired soil horizon.
The application of Approach 3 described above operates as a post processor given the rock hazard results at the reference horizon. In this application, one typically operates with the mean hazard curve and its magnitude deaggregation. Alternative applications apply Equations (K.1) and (K.2) directly as part of the hazard integral calculation. However, for the majority of the Hanford facility sites, detailed characterization of the dynamic properties is not available at present. Thus, the calculation of soil hazard has been separated into two stages: the development of rock hazard at the reference horizon, which is the subject of this report, and future analyses to develop probabilistic soil hazard curves at the various sites once characterization of the site dynamic properties is available. The one Hanford DOE facility site that has detailed characterization of the dynamic properties is the WTP site, and this site is used to illustrate the application of Approach 3 as a post processor to the rock hazard.
ij mxY ,lnij mxY ,ln
ij mxY ,ln
ij mxY ,lnij mxY ,ln
Hanford Site-Wide Probabilistic Seismic Hazard Analysis 2014
K.2 Characterization of the Dynamic Properties of the WTP Site
The required dynamic properties for development of probabilistic amplification functions are described in Section 9.6 along with specification of these properties for the sequence of Saddle Mountains basalts and Ellensburg Formation interbeds (denoted as the SMB stack) at the five hazard calculation sites. Previous studies for the WTP site provide the necessary characterization of the suprabasalt sediments. Rohay and Brouns (2007) developed a detailed characterization of the dynamic properties of the materials underlying the WTP site. As described by Youngs (2007), the Rohay and Brouns (2007) characterization was used to develop a site response model for the WTP site that incorporated both epistemic uncertainties in the base-case properties and appropriate randomization of these properties for use in probabilistic site response analyses. The site response model developed by Youngs (2007) contained two components: the characterization of the suprabasalt sediments and the characterization of the SMB stack. The characterization of the SMB stack was updated in this study as part of the ground motion model development (see Section 9.6). This updated characterization combined with the characterization of the suprabasalt sediments from Rohay and Brouns (2007) and Youngs (2007) was used to develop a probabilistic site response model for the WTP site.
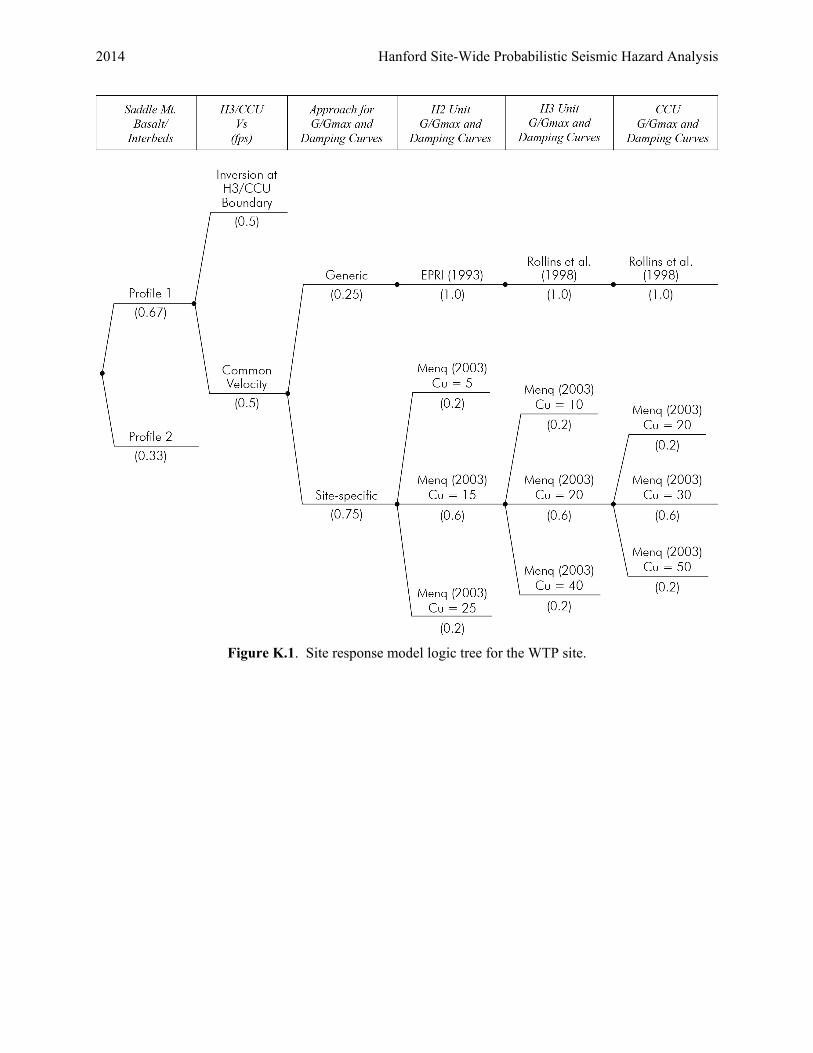
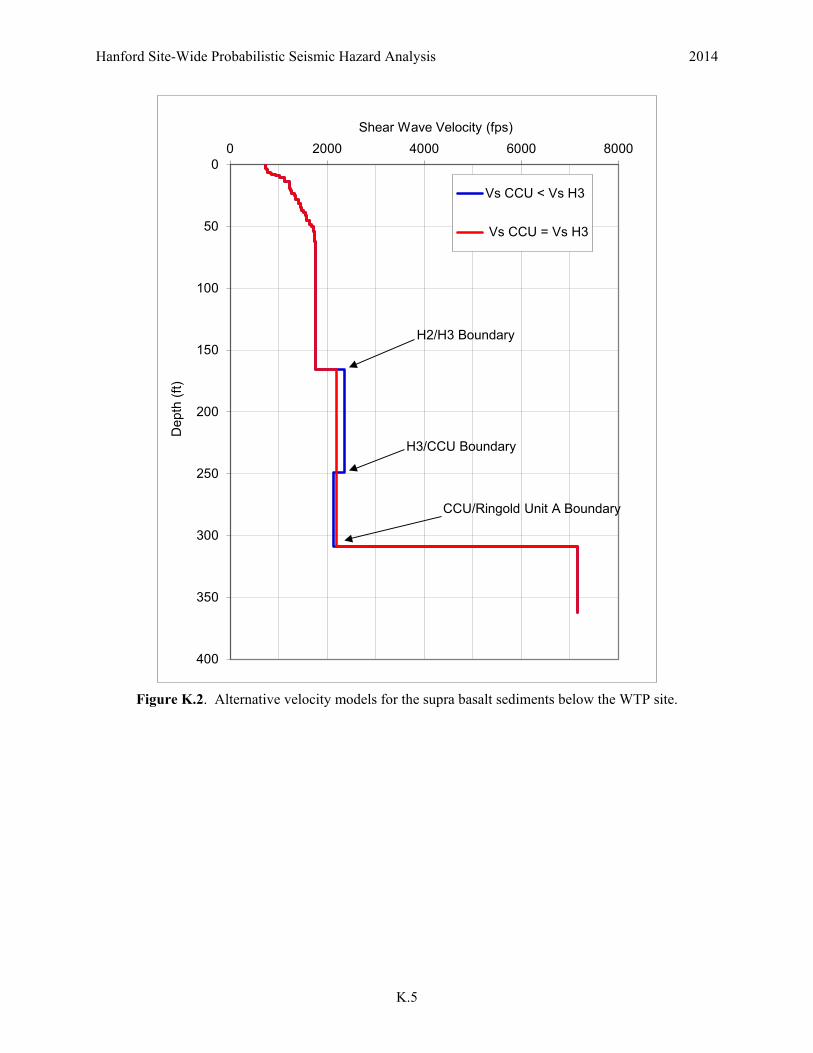
Figure K.1 shows the WTP site response model logic tree. The first level contains the two alternative models for the SMB stack. These models are described in Section 9.6. The second level contains the two alternative base-case velocity models developed for the suprabasalt sediments. These sediments consist of four basic units in order from the surface: the Hanford Formation sands (denoted H2), the Hanford Formation gravels (denoted H3), the reworked Cold Creek Unit gravels (denoted CCU), and the Ringold Formation Unit A. Figure K.2 shows the two velocity models, which differ only in the assigned velocities to the H3 and CCU layers.
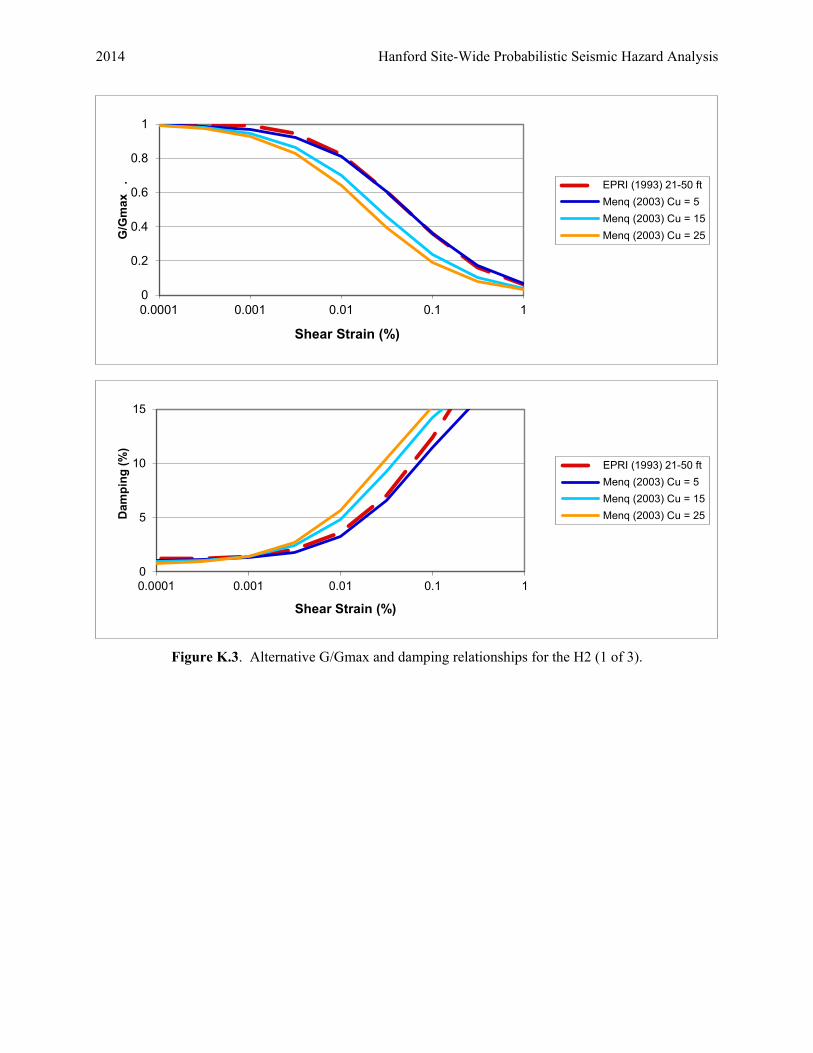
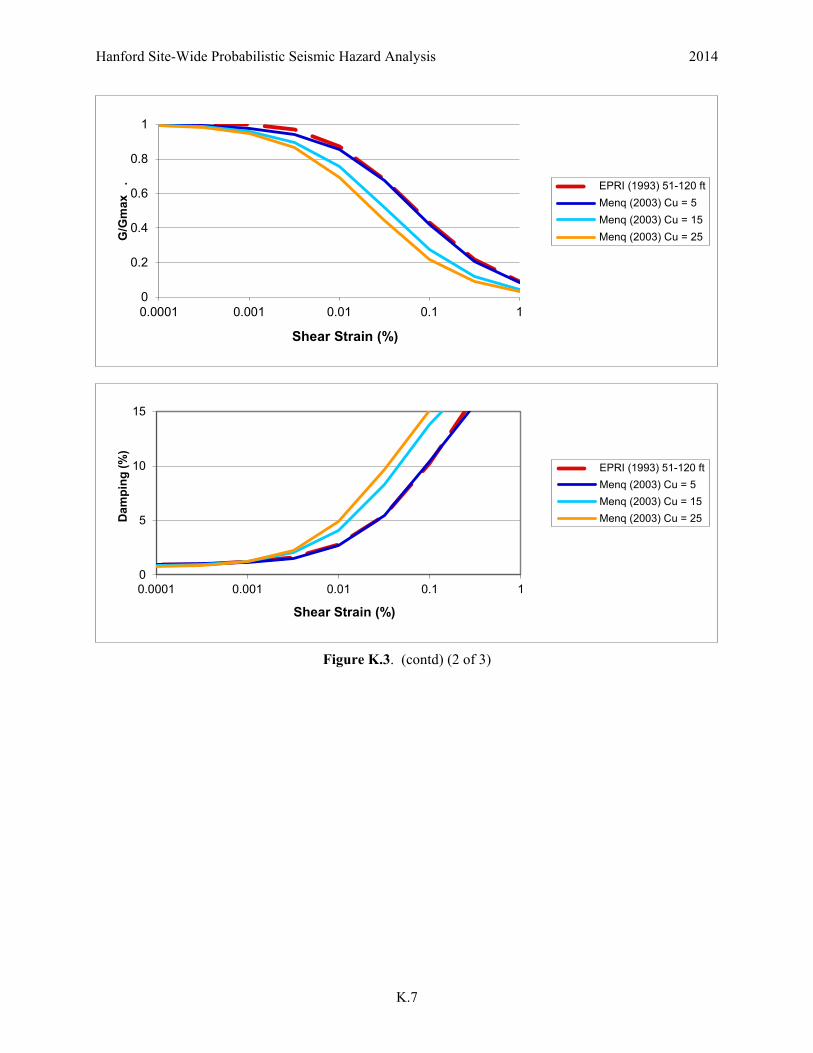
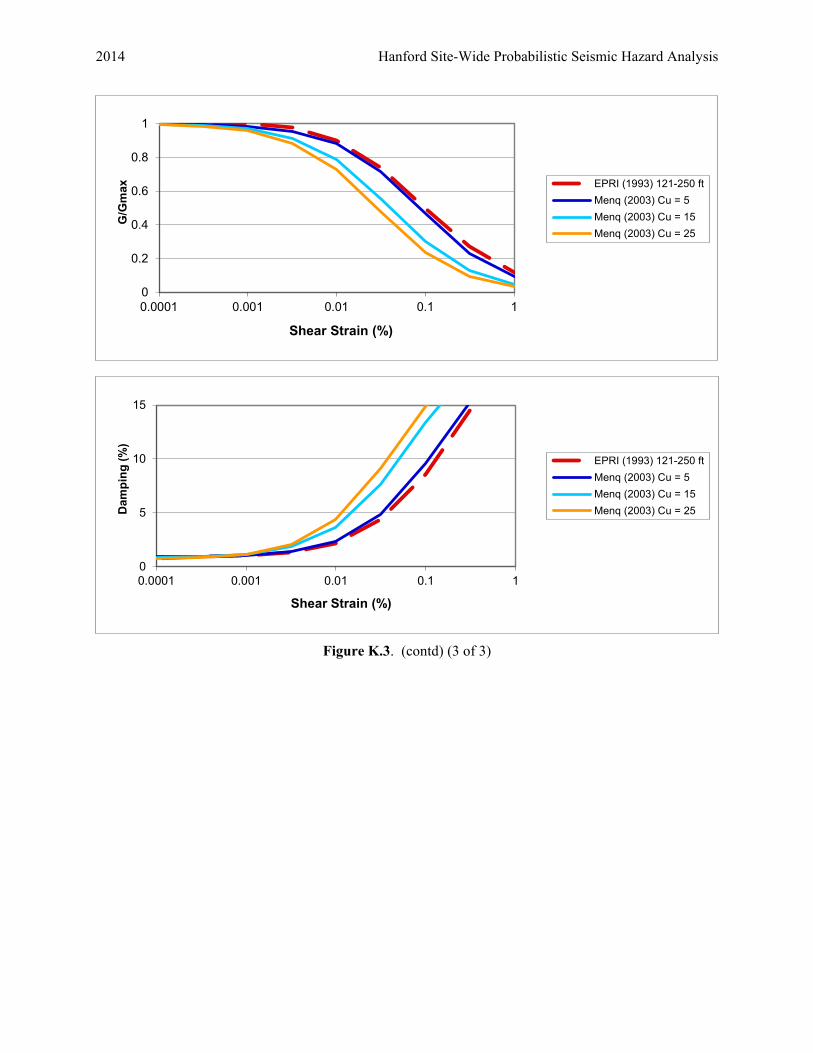
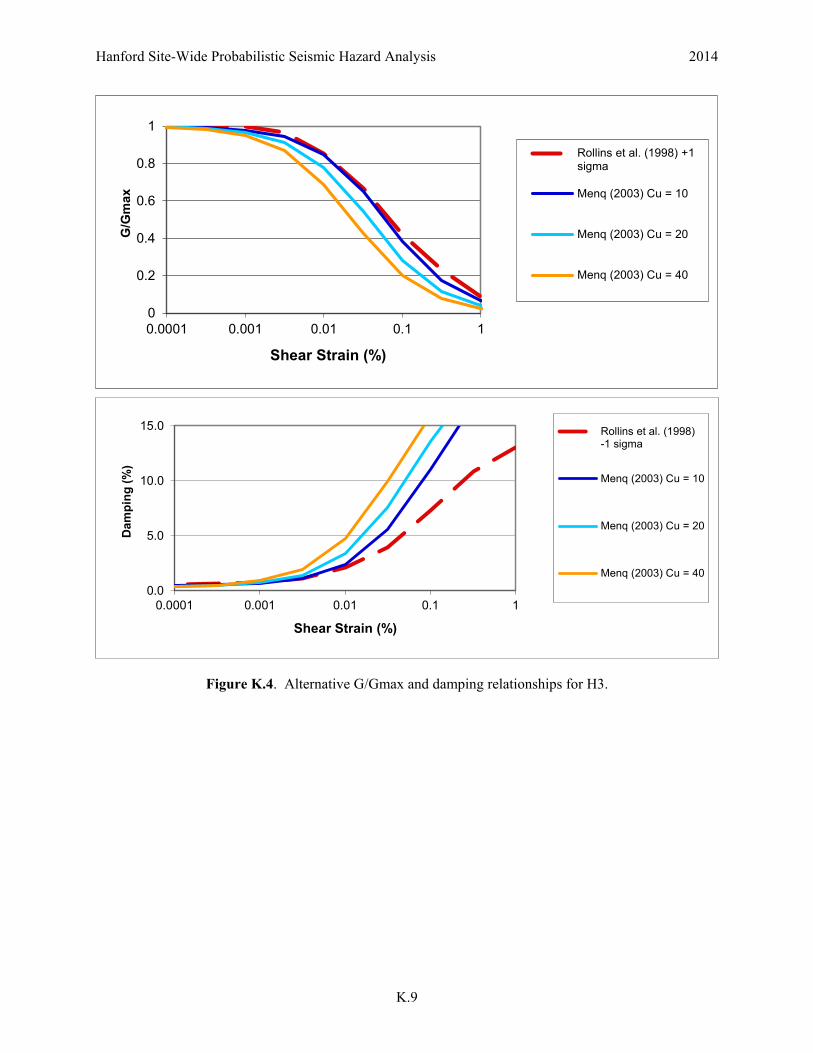
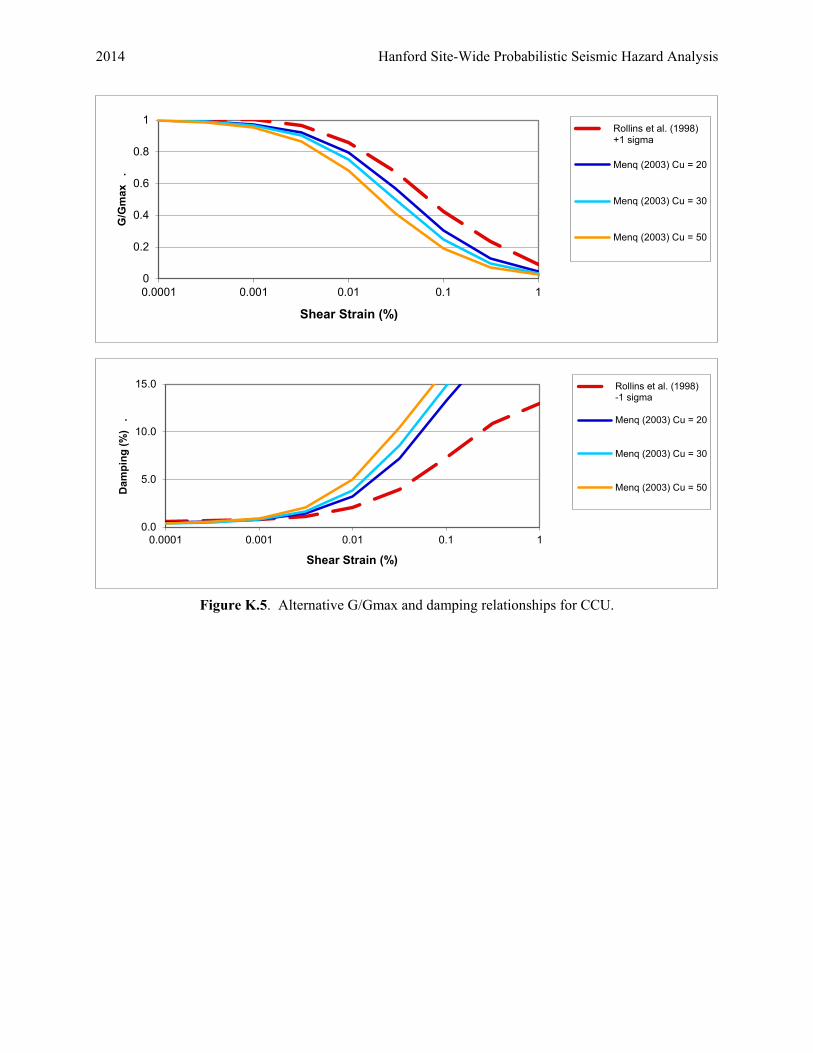
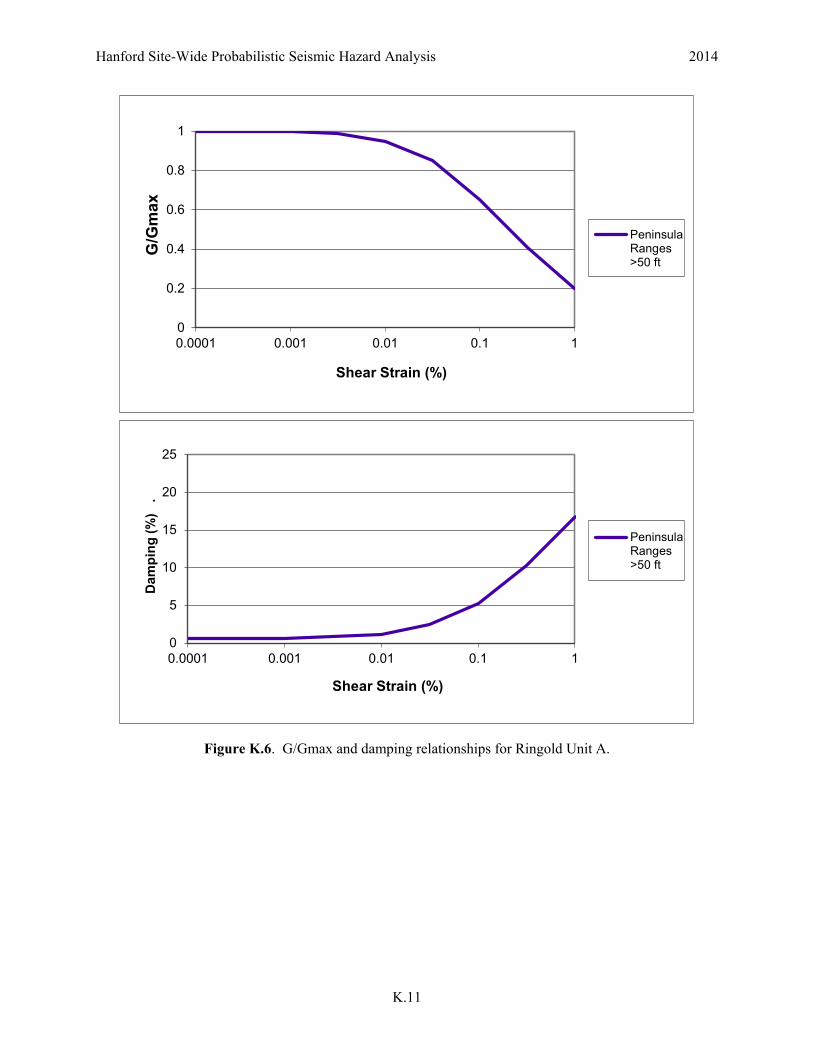
The next four levels of the site response model logic tree address the alternative sets of shear modulus reduction (G/Gmax) and damping relationships that were specified for the H2, H3, and CCU units. The first level entailed the use of generic or inferred site-specific G/Gmax and damping relationships. Following the generic curve approach, a representative relationship was selected from the literature for each of the three units. These were the Electric Power Research Institute (EPRI 1993) relationships for the H2 layer and the Rollins et al. (1998) gravel relationships for the H2 and CCU layers. Following the site-specific curve approach, G/Gmax and damping relationships were specified for each layer using the relationships developed by Menq (2003). The Menq (2003) relationships use the coefficient of uniformity (CU) and median grain size (D50) of the cohesionless soils as key parameters to define the G/Gmax and damping curves. Alternative values of Cu and D50 were assessed for each layer and these were used to develop the alternative G/Gmax and damping curves. Figure K.3, Figure K.4, and Figure K.5 compare the G/Gmax and damping relationships for each unit. The Peninsula Ranges G/Gmax and damping relationships (Silva et al. 1996) were used for Ringold Unit A. These relationships are shown in Figure K.6.
The WTP site response model developed by Youngs (2007) contained an additional level for the uncertainty in site kappa. However, the ground motion characterization developed in Chapter 9.0 incorporates the epistemic uncertainty in site kappa, including the kappa contributed by the SMB stack, into the distribution of the ground motion prediction equations for calculation of the baserock hazard. Therefore, no additional uncertainty in site kappa is included in the site response model logic tree.
K.3
2014 Hanford Site-Wide Probabilistic Seismic Hazard Analysis
Figure K.1. Site response model logic tree for the WTP site.
Hanford Site-Wide Probabilistic Seismic Hazard Analysis 2014
Figure K.2. Alternative velocity models for the supra basalt sediments below the WTP site.
0
50
100
150
200
250
300
350
400
0 2000 4000 6000 8000
Dep
th (f
t)
Shear Wave Velocity (fps)
Vs CCU < Vs H3
Vs CCU = Vs H3
H3/CCU Boundary
CCU/Ringold Unit A Boundary
H2/H3 Boundary
K.5
2014 Hanford Site-Wide Probabilistic Seismic Hazard Analysis
Figure K.3. Alternative G/Gmax and damping relationships for the H2 (1 of 3).
0
0.2
0.4
0.6
0.8
1
0.0001 0.001 0.01 0.1 1
G/G
max
.
Shear Strain (%)
EPRI (1993) 21-50 ftMenq (2003) Cu = 5Menq (2003) Cu = 15Menq (2003) Cu = 25
0
5
10
15
0.0001 0.001 0.01 0.1 1
Dam
ping
(%)
Shear Strain (%)
EPRI (1993) 21-50 ftMenq (2003) Cu = 5Menq (2003) Cu = 15Menq (2003) Cu = 25
Hanford Site-Wide Probabilistic Seismic Hazard Analysis 2014
Figure K.3. (contd) (2 of 3)
0
0.2
0.4
0.6
0.8
1
0.0001 0.001 0.01 0.1 1
G/G
max
.
Shear Strain (%)
EPRI (1993) 51-120 ftMenq (2003) Cu = 5Menq (2003) Cu = 15Menq (2003) Cu = 25
0
5
10
15
0.0001 0.001 0.01 0.1 1
Dam
ping
(%)
Shear Strain (%)
EPRI (1993) 51-120 ftMenq (2003) Cu = 5Menq (2003) Cu = 15Menq (2003) Cu = 25
K.7
2014 Hanford Site-Wide Probabilistic Seismic Hazard Analysis
Figure K.3. (contd) (3 of 3)
0
0.2
0.4
0.6
0.8
1
0.0001 0.001 0.01 0.1 1
G/G
max
Shear Strain (%)
EPRI (1993) 121-250 ftMenq (2003) Cu = 5Menq (2003) Cu = 15Menq (2003) Cu = 25
0
5
10
15
0.0001 0.001 0.01 0.1 1
Dam
ping
(%)
Shear Strain (%)
EPRI (1993) 121-250 ftMenq (2003) Cu = 5Menq (2003) Cu = 15Menq (2003) Cu = 25
Hanford Site-Wide Probabilistic Seismic Hazard Analysis 2014
Figure K.4. Alternative G/Gmax and damping relationships for H3.
0
0.2
0.4
0.6
0.8
1
0.0001 0.001 0.01 0.1 1
G/G
max
Shear Strain (%)
Rollins et al. (1998) +1sigma
Menq (2003) Cu = 10
Menq (2003) Cu = 20
Menq (2003) Cu = 40
0.0
5.0
10.0
15.0
0.0001 0.001 0.01 0.1 1
Dam
ping
(%)
Shear Strain (%)
Rollins et al. (1998)-1 sigma
Menq (2003) Cu = 10
Menq (2003) Cu = 20
Menq (2003) Cu = 40
K.9
2014 Hanford Site-Wide Probabilistic Seismic Hazard Analysis
Figure K.5. Alternative G/Gmax and damping relationships for CCU.
0
0.2
0.4
0.6
0.8
1
0.0001 0.001 0.01 0.1 1
G/G
max
.
Shear Strain (%)
Rollins et al. (1998)+1 sigma
Menq (2003) Cu = 20
Menq (2003) Cu = 30
Menq (2003) Cu = 50
0.0
5.0
10.0
15.0
0.0001 0.001 0.01 0.1 1
Dam
ping
(%)
.
Shear Strain (%)
Rollins et al. (1998)-1 sigma
Menq (2003) Cu = 20
Menq (2003) Cu = 30
Menq (2003) Cu = 50
Hanford Site-Wide Probabilistic Seismic Hazard Analysis 2014
Figure K.6. G/Gmax and damping relationships for Ringold Unit A.
0
0.2
0.4
0.6
0.8
1
0.0001 0.001 0.01 0.1 1
G/G
max
Shear Strain (%)
PeninsulaRanges>50 ft
0
5
10
15
20
25
0.0001 0.001 0.01 0.1 1
Dam
ping
(%)
.
Shear Strain (%)
PeninsulaRanges>50 ft
K.11
2014 Hanford Site-Wide Probabilistic Seismic Hazard Analysis
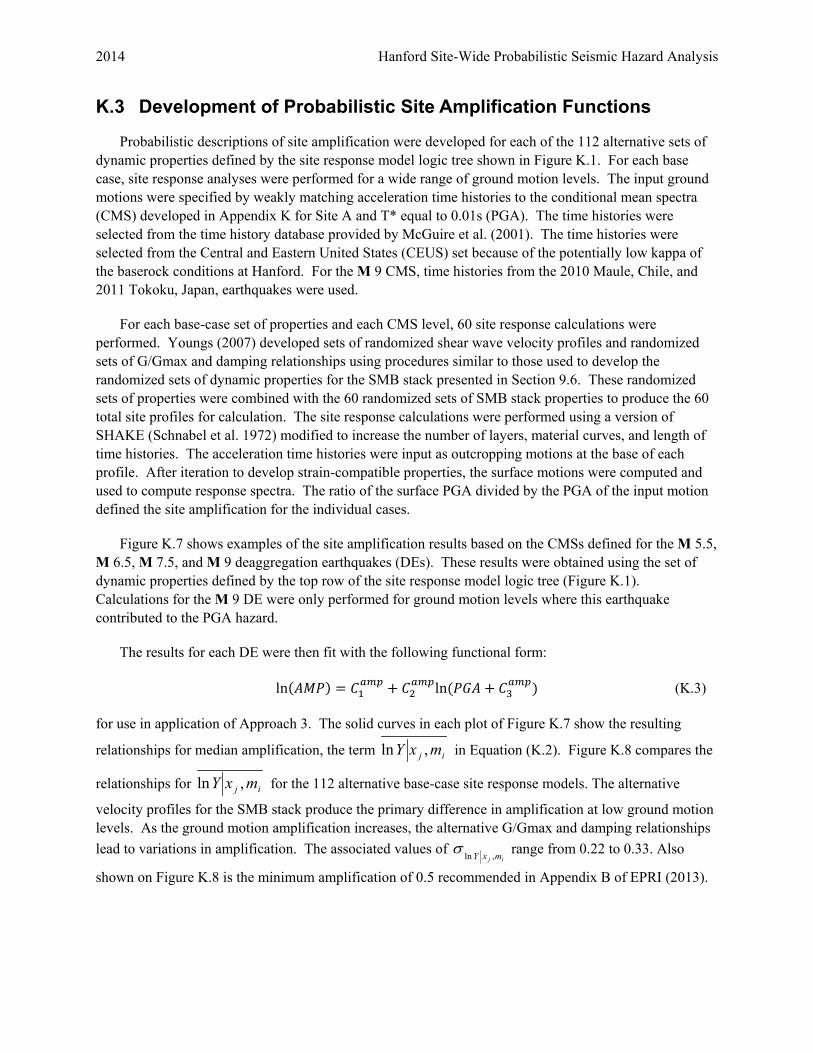
K.3 Development of Probabilistic Site Amplification Functions
Probabilistic descriptions of site amplification were developed for each of the 112 alternative sets of dynamic properties defined by the site response model logic tree shown in Figure K.1. For each base case, site response analyses were performed for a wide range of ground motion levels. The input ground motions were specified by weakly matching acceleration time histories to the conditional mean spectra (CMS) developed in Appendix K for Site A and T* equal to 0.01s (PGA). The time histories were selected from the time history database provided by McGuire et al. (2001). The time histories were selected from the Central and Eastern United States (CEUS) set because of the potentially low kappa of the baserock conditions at Hanford. For the M 9 CMS, time histories from the 2010 Maule, Chile, and 2011 Tokoku, Japan, earthquakes were used.
For each base-case set of properties and each CMS level, 60 site response calculations were performed. Youngs (2007) developed sets of randomized shear wave velocity profiles and randomized sets of G/Gmax and damping relationships using procedures similar to those used to develop the randomized sets of dynamic properties for the SMB stack presented in Section 9.6. These randomized sets of properties were combined with the 60 randomized sets of SMB stack properties to produce the 60 total site profiles for calculation. The site response calculations were performed using a version of SHAKE (Schnabel et al. 1972) modified to increase the number of layers, material curves, and length of time histories. The acceleration time histories were input as outcropping motions at the base of each profile. After iteration to develop strain-compatible properties, the surface motions were computed and used to compute response spectra. The ratio of the surface PGA divided by the PGA of the input motion defined the site amplification for the individual cases.
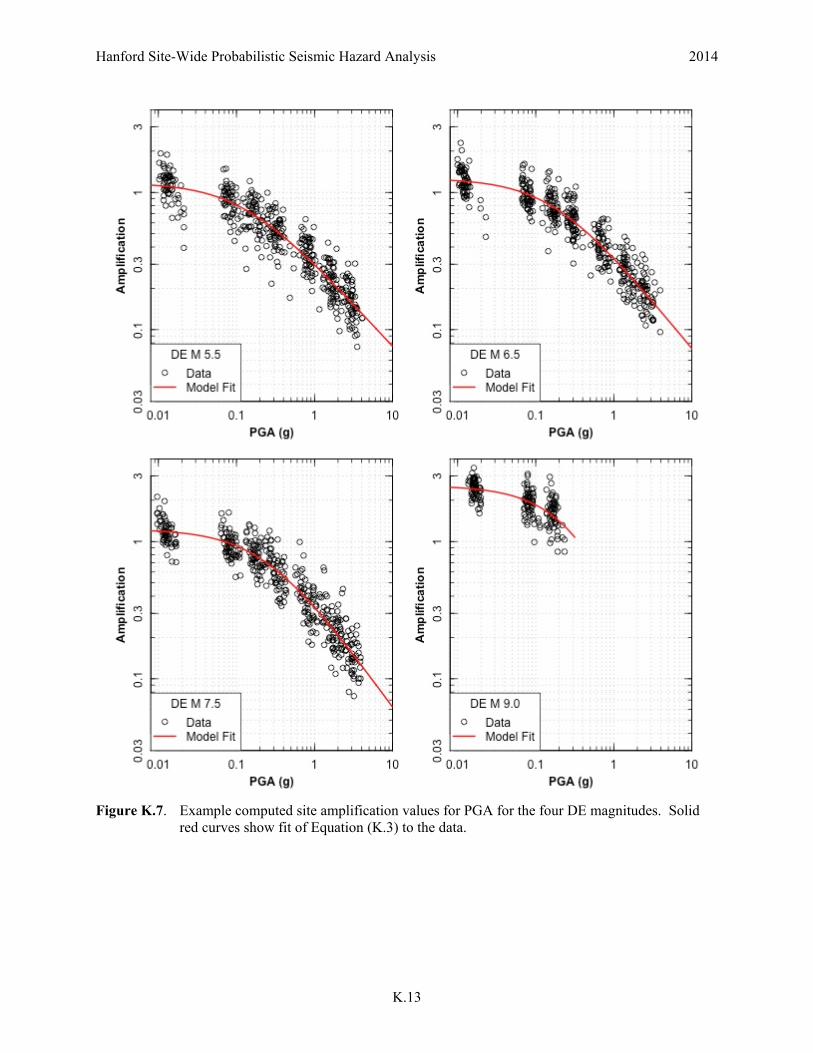
Figure K.7 shows examples of the site amplification results based on the CMSs defined for the M 5.5, M 6.5, M 7.5, and M 9 deaggregation earthquakes (DEs). These results were obtained using the set of dynamic properties defined by the top row of the site response model logic tree (Figure K.1). Calculations for the M 9 DE were only performed for ground motion levels where this earthquake contributed to the PGA hazard.
The results for each DE were then fit with the following functional form:
ln(𝐴𝐴𝐴𝐴𝐴𝐴) = 𝐶𝐶1𝑎𝑎𝑎𝑎𝑎𝑎 + 𝐶𝐶2
𝑎𝑎𝑎𝑎𝑎𝑎ln (𝐴𝐴𝑃𝑃𝐴𝐴 + 𝐶𝐶3𝑎𝑎𝑎𝑎𝑎𝑎) (K.3)
for use in application of Approach 3. The solid curves in each plot of Figure K.7 show the resulting
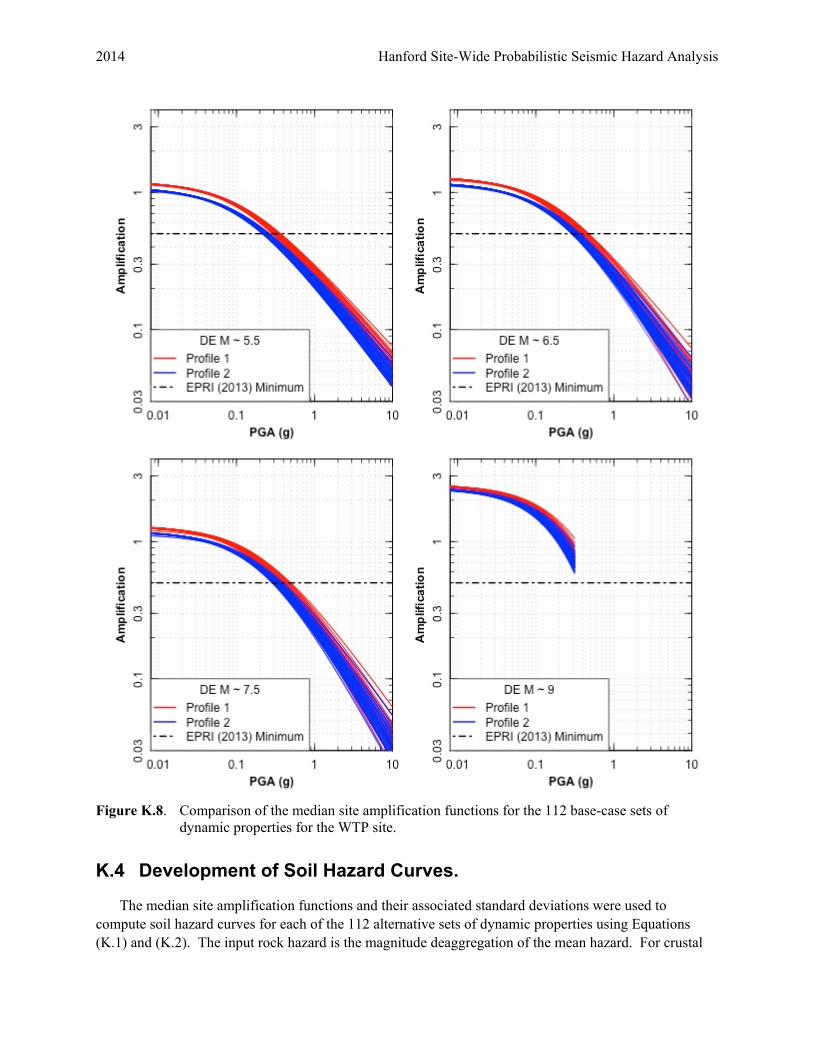
relationships for median amplification, the term in Equation (K.2). Figure K.8 compares the
relationships for for the 112 alternative base-case site response models. The alternative
velocity profiles for the SMB stack produce the primary difference in amplification at low ground motion levels. As the ground motion amplification increases, the alternative G/Gmax and damping relationships lead to variations in amplification. The associated values of range from 0.22 to 0.33. Also
shown on Figure K.8 is the minimum amplification of 0.5 recommended in Appendix B of EPRI (2013).
ij mxY ,ln
ij mxY ,ln
ij mxY ,lnσ
Hanford Site-Wide Probabilistic Seismic Hazard Analysis 2014
Figure K.7. Example computed site amplification values for PGA for the four DE magnitudes. Solid
red curves show fit of Equation (K.3) to the data.
K.13
2014 Hanford Site-Wide Probabilistic Seismic Hazard Analysis
Figure K.8. Comparison of the median site amplification functions for the 112 base-case sets of
dynamic properties for the WTP site.
K.4 Development of Soil Hazard Curves.
The median site amplification functions and their associated standard deviations were used to compute soil hazard curves for each of the 112 alternative sets of dynamic properties using Equations (K.1) and (K.2). The input rock hazard is the magnitude deaggregation of the mean hazard. For crustal
Hanford Site-Wide Probabilistic Seismic Hazard Analysis 2014
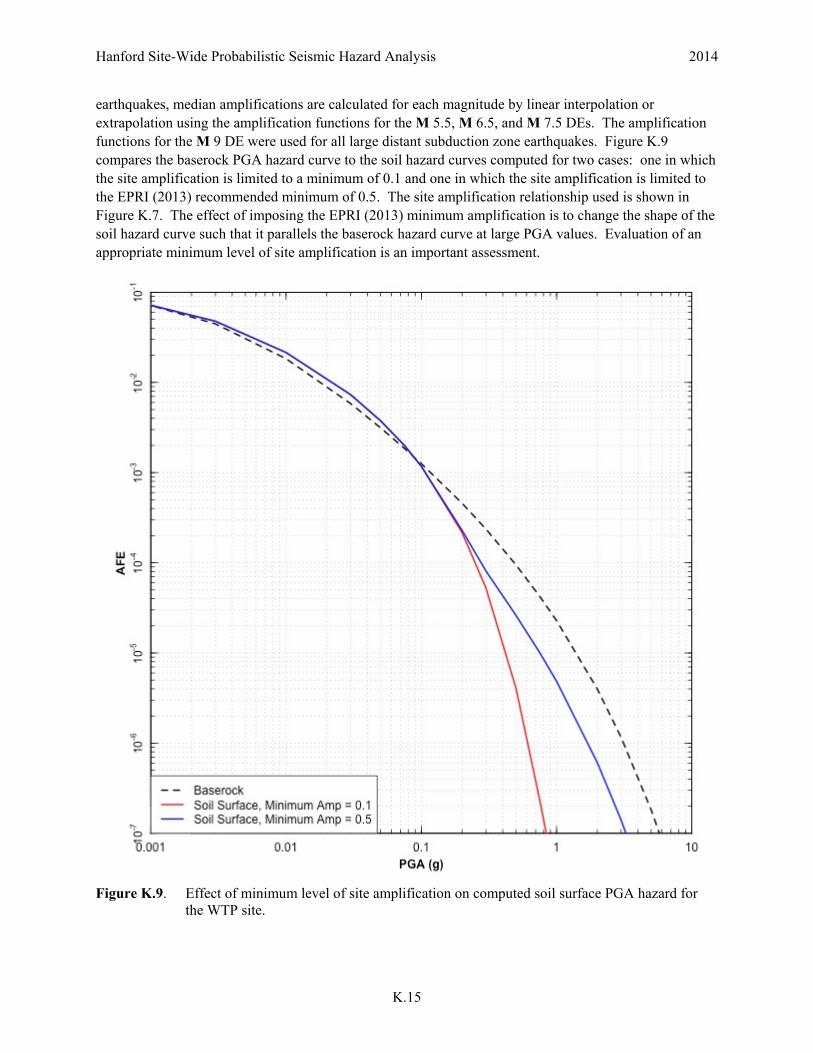
earthquakes, median amplifications are calculated for each magnitude by linear interpolation or extrapolation using the amplification functions for the M 5.5, M 6.5, and M 7.5 DEs. The amplification functions for the M 9 DE were used for all large distant subduction zone earthquakes. Figure K.9 compares the baserock PGA hazard curve to the soil hazard curves computed for two cases: one in which the site amplification is limited to a minimum of 0.1 and one in which the site amplification is limited to the EPRI (2013) recommended minimum of 0.5. The site amplification relationship used is shown in Figure K.7. The effect of imposing the EPRI (2013) minimum amplification is to change the shape of the soil hazard curve such that it parallels the baserock hazard curve at large PGA values. Evaluation of an appropriate minimum level of site amplification is an important assessment.
Figure K.9. Effect of minimum level of site amplification on computed soil surface PGA hazard for
the WTP site.
K.15
2014 Hanford Site-Wide Probabilistic Seismic Hazard Analysis
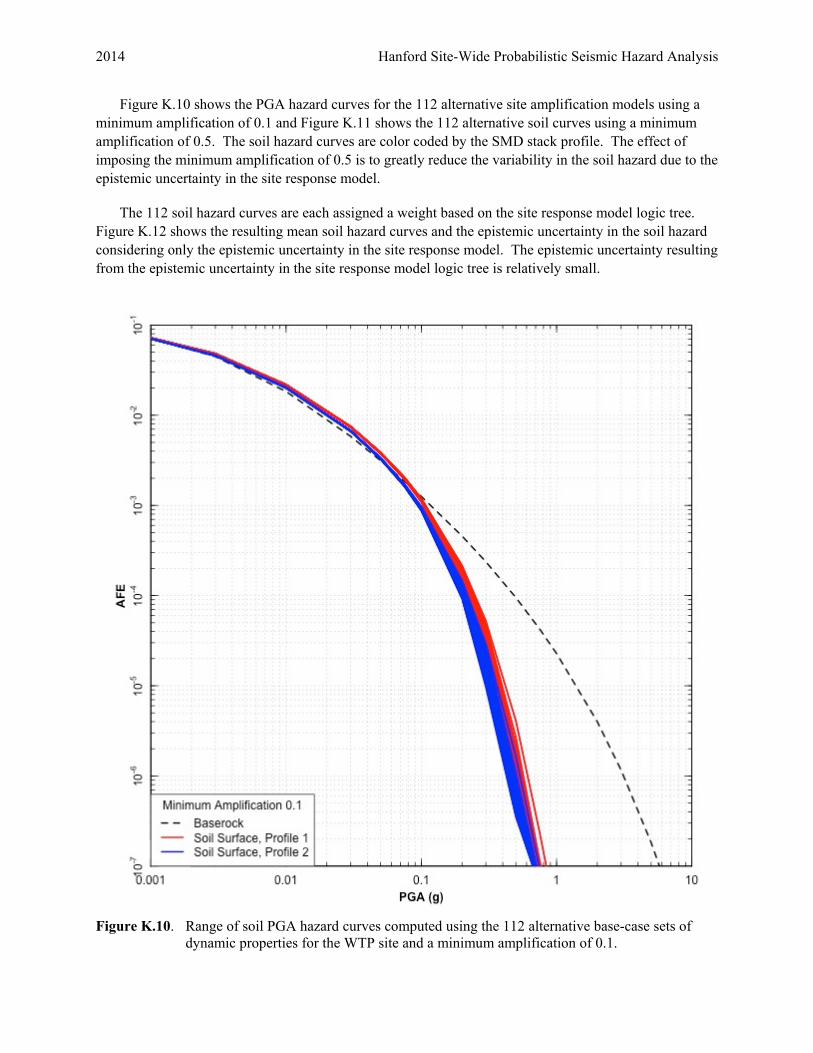
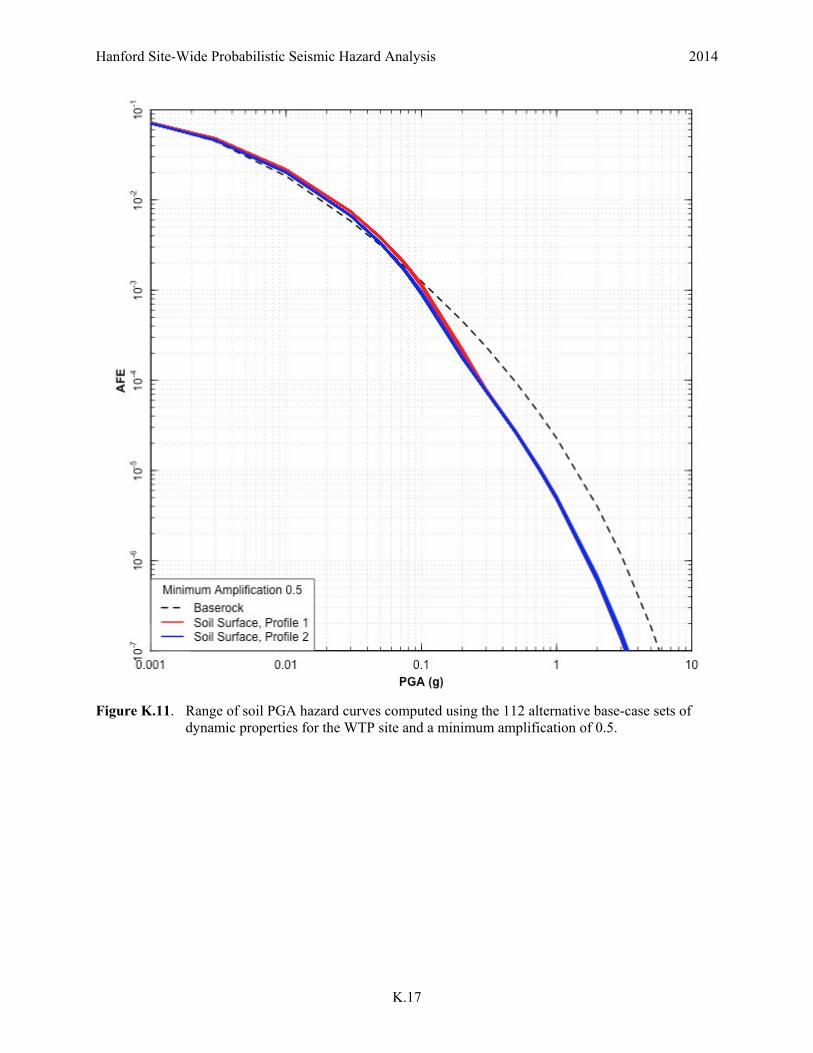
Figure K.10 shows the PGA hazard curves for the 112 alternative site amplification models using a minimum amplification of 0.1 and Figure K.11 shows the 112 alternative soil curves using a minimum amplification of 0.5. The soil hazard curves are color coded by the SMD stack profile. The effect of imposing the minimum amplification of 0.5 is to greatly reduce the variability in the soil hazard due to the epistemic uncertainty in the site response model.
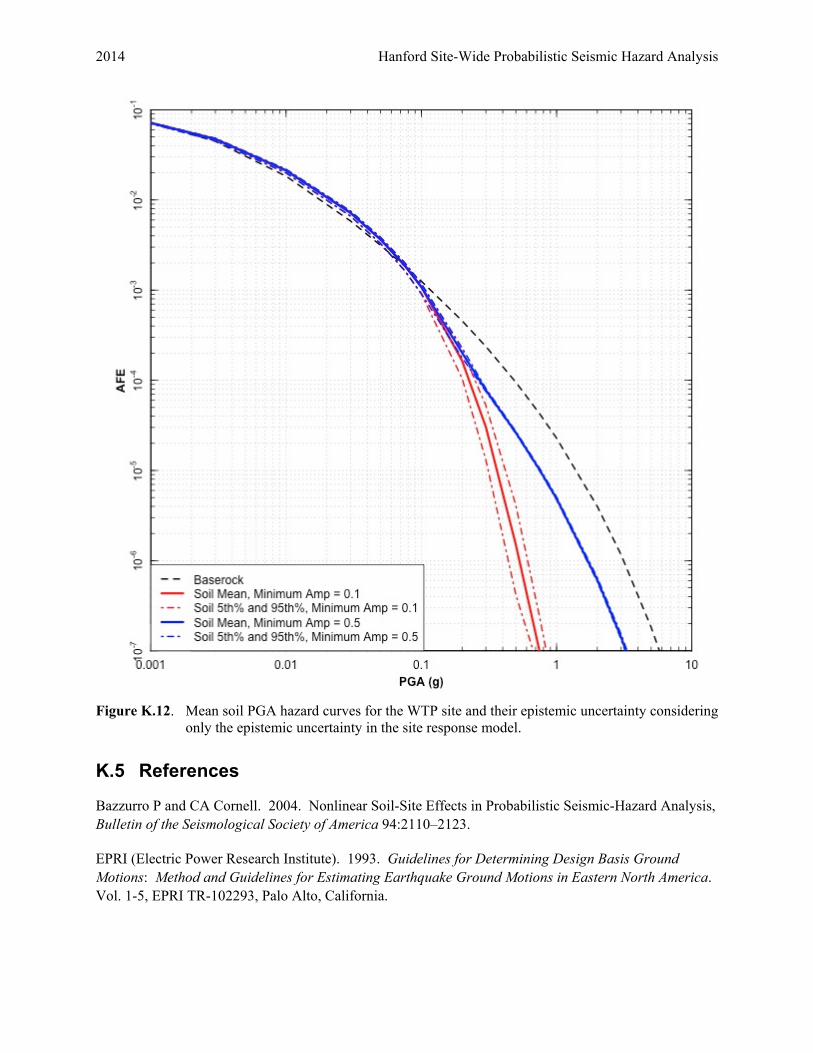
The 112 soil hazard curves are each assigned a weight based on the site response model logic tree. Figure K.12 shows the resulting mean soil hazard curves and the epistemic uncertainty in the soil hazard considering only the epistemic uncertainty in the site response model. The epistemic uncertainty resulting from the epistemic uncertainty in the site response model logic tree is relatively small.
Figure K.10. Range of soil PGA hazard curves computed using the 112 alternative base-case sets of
dynamic properties for the WTP site and a minimum amplification of 0.1.
Hanford Site-Wide Probabilistic Seismic Hazard Analysis 2014
Figure K.11. Range of soil PGA hazard curves computed using the 112 alternative base-case sets of
dynamic properties for the WTP site and a minimum amplification of 0.5.
K.17
2014 Hanford Site-Wide Probabilistic Seismic Hazard Analysis
Figure K.12. Mean soil PGA hazard curves for the WTP site and their epistemic uncertainty considering
only the epistemic uncertainty in the site response model.
K.5 References
Bazzurro P and CA Cornell. 2004. Nonlinear Soil-Site Effects in Probabilistic Seismic-Hazard Analysis, Bulletin of the Seismological Society of America 94:2110–2123.
EPRI (Electric Power Research Institute). 1993. Guidelines for Determining Design Basis Ground Motions: Method and Guidelines for Estimating Earthquake Ground Motions in Eastern North America. Vol. 1-5, EPRI TR-102293, Palo Alto, California.
Hanford Site-Wide Probabilistic Seismic Hazard Analysis 2014
EPRI (Electric Power Research Institute). 2013. Seismic Evaluation Guidance Screening, Prioritization and Implementation Details (SPID) for the Resolution of Fukushima Near-Term Task Force Recommendation 2.1. Report 1025287, Palo Alto, California.
McGuire RK, WJ Silva, and CJ Costantino. 2001. Technical Basis for Revision of Regulatory Guidance on Design Ground Motions: Hazard- and Risk-Consistent Ground Motion Spectra Guidelines. NUREG/CR-6728, U.S. Nuclear Regulatory Commission, Washington, D.C.
McGuire RK, WJ Silva, and CJ Costantino. 2002. Technical Basis for Revision of Regulatory Guidance on Design Ground Motions: Development of Hazard- and Risk-consistent Seismic Spectra for Two Sites. NUREG/CR-6769, U.S. Nuclear Regulatory Commission, Washington, D.C.
Menq F-Y. 2003. Dynamic properties of sandy and gravely soils. Ph.D. Dissertation, University of Texas, Austin.
Rohay AC and TM Brouns. 2007. Site-Specific Velocity and Density Model for the Waste Treatment Plant, Hanford, Washington. PNNL-16652, Pacific Northwest National Laboratory, Richland, Washington.
Rollins K, M Evans, N Diehl, and W Ill. 1998. Shear Modulus and Damping Relationships for Gravels. Journal of Geotechnical and Geoenvironmental Engineering 124(5):396−405.
Schnabel PB, J Lysmer, and HB Seed. 1972. SHAKE, a Computer Program for Earthquake Response. Earthquake Engineering Research Center Report EERC 72-12, University of California, Berkeley, California.
Silva WJ, N Abrahamson, G Toro and C. Costantino. 1996. Description and Validation of the Stochastic Model. Report Submitted to Brookhaven National Laboratory, Associated Universities, Inc. Upton, New York 11973, Contract No. 770573.
Youngs RR. 2007. Updated Site Response Analyses for the Waste Treatment Plant, DOE Hanford Site, Washington. PNNL-16653, Pacific Northwest National Laboratory, Richland, Washington.
K.19