Embed Size (px)
Citation preview
MAritime Systems and Technology 2009Sweden, Stockholm 21-23 October 2009
HARBOUR SEA-FLOOR CLEARANCE: “HD” HIGH DEFINITION MAGNETIC SURVEY
PERFORMANCE
Faggioni O., Soldani M., Leoncini D., Zunino R., Gastaldo P., Di Gennaro E., Lamberti L., Maggiani P.V.
University of GenoaDIBE - SEA Lab, DGG
INGV Sez. ROMA2AOG -.App. Ocean. Group
Italian Navy
Davide Leoncini – University of Genoa Ph.D. Student ([email protected])
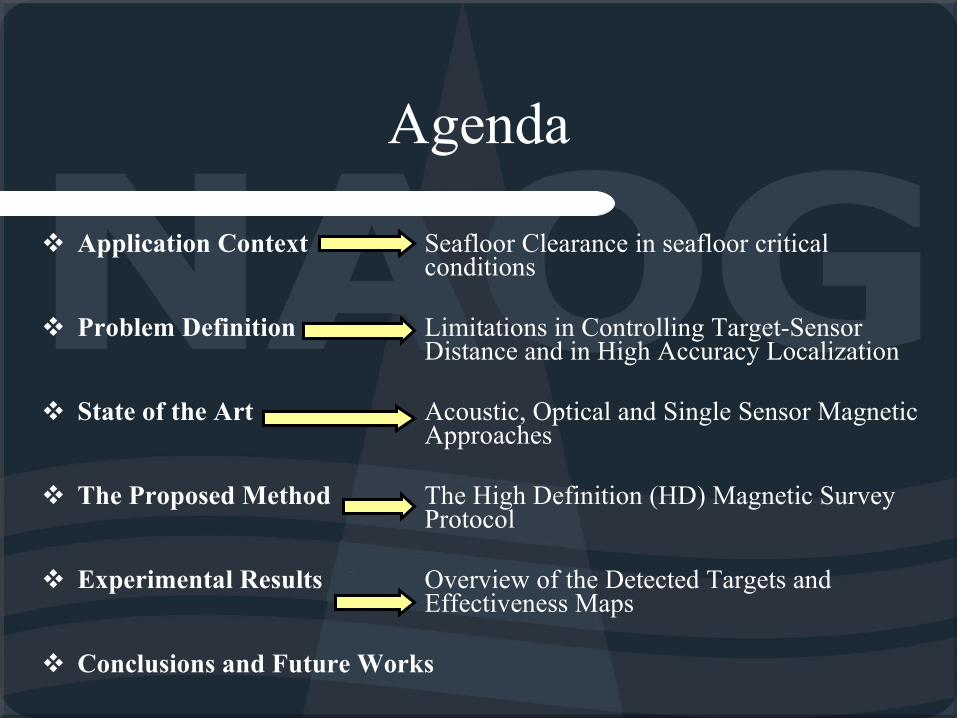
Agenda
Application Context Seafloor Clearance in seafloor critical conditions
Problem Definition Limitations in Controlling Target-Sensor Distance and in High Accuracy Localization
State of the Art Acoustic, Optical and Single Sensor Magnetic Approaches
The Proposed Method The High Definition (HD) Magnetic Survey Protocol
Experimental Results Overview of the Detected Targets and Effectiveness Maps
Conclusions and Future Works

The History of the ProjectAPPLICATION CONTEXT
• May 2007: Request of Italian Ministry of Defence and Autonomous Region of Sardinia
• Italian Navy (ITN) – prime contractor – and NURC agreed to provide the marine survey of Cape Teulada (NATO firing range)
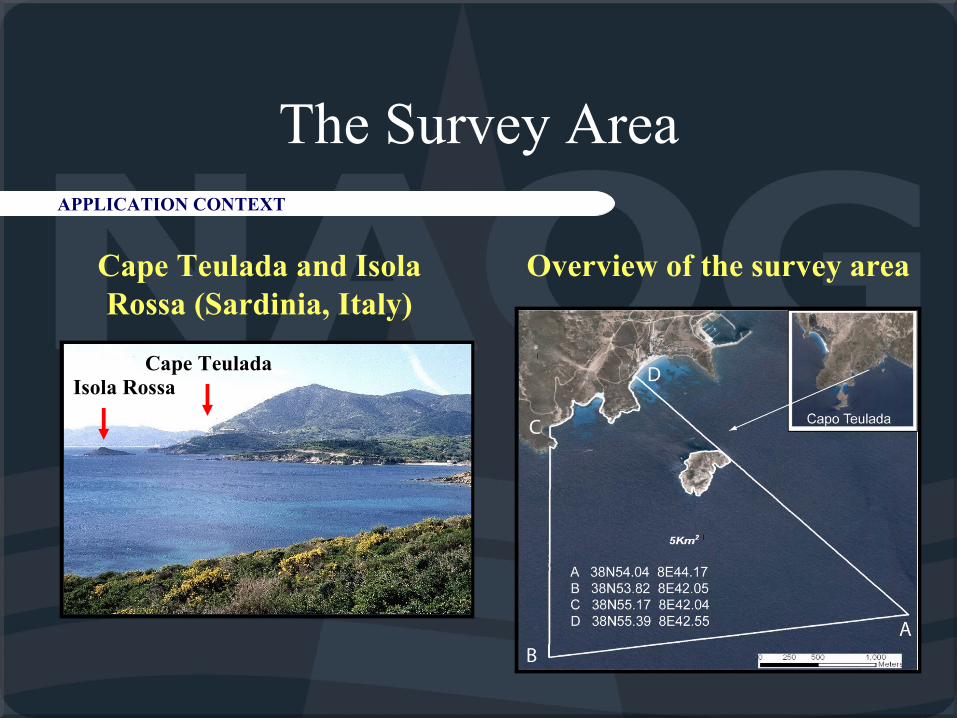
The Survey AreaAPPLICATION CONTEXT
Isola RossaCape Teulada
Cape Teulada and Isola Rossa (Sardinia, Italy)
Overview of the survey area
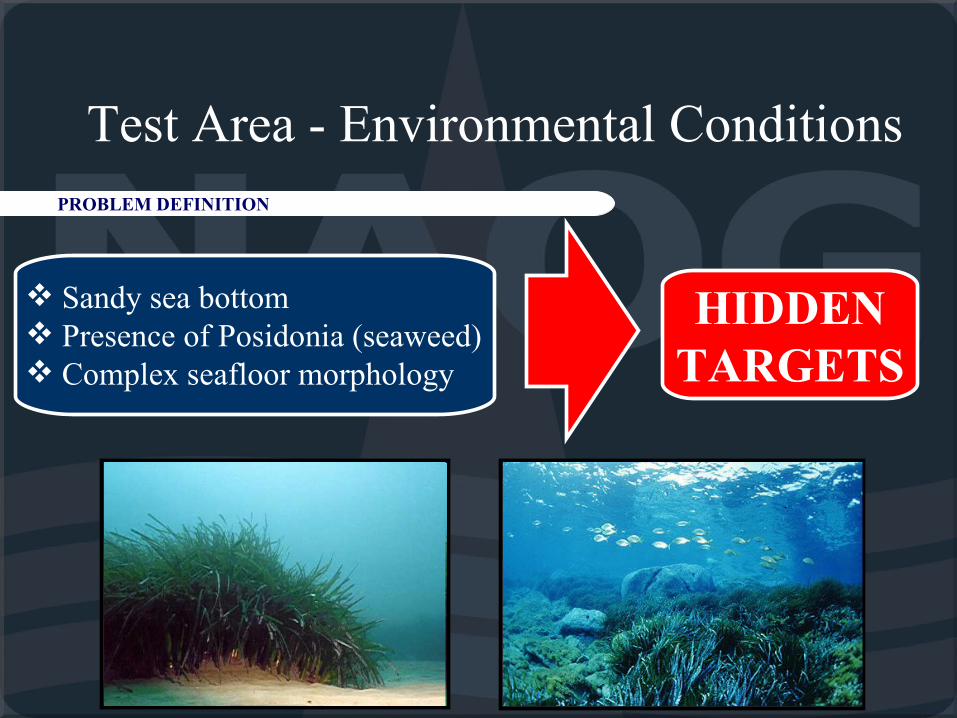
Test Area - Environmental ConditionsPROBLEM DEFINITION
HIDDEN TARGETS
Sandy sea bottom Presence of Posidonia (seaweed) Complex seafloor morphology
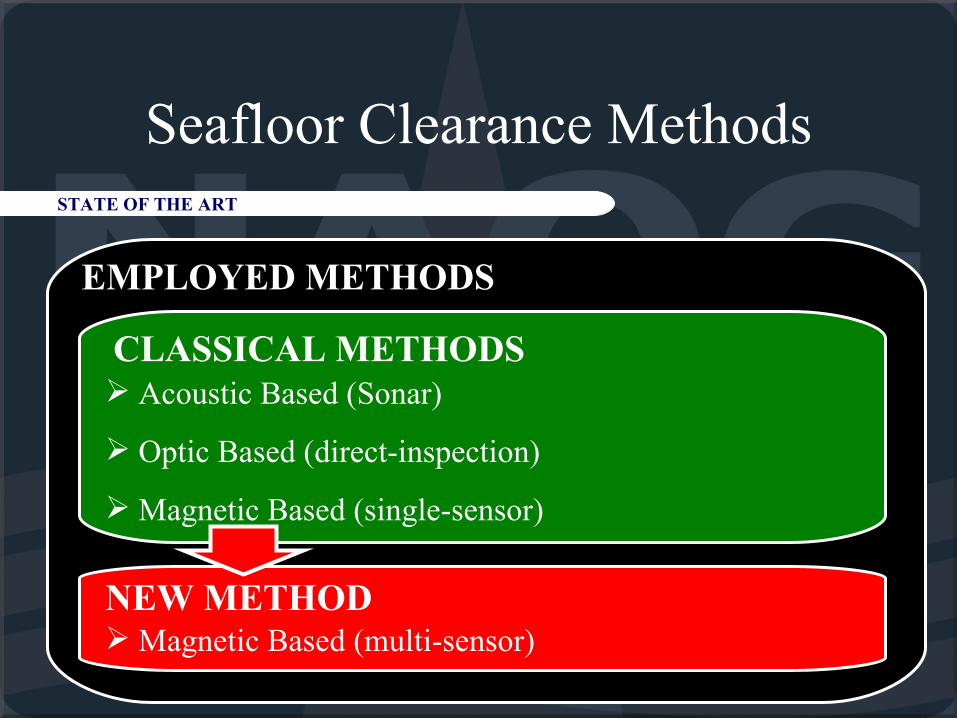
Seafloor Clearance MethodsSTATE OF THE ART
CLASSICAL METHODS
NEW METHOD
EMPLOYED METHODS
Acoustic Based (Sonar)
Optic Based (direct-inspection)
Magnetic Based (single-sensor)
Magnetic Based (multi-sensor)
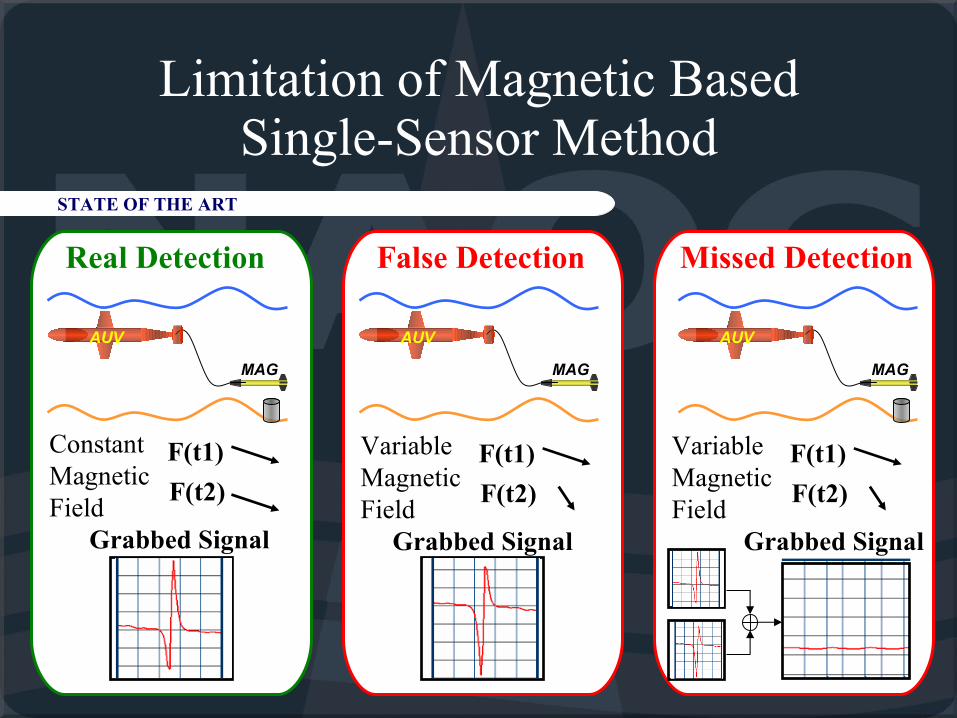
Limitation of Magnetic Based Single-Sensor Method
STATE OF THE ART
AUV AUV AUV
MAG MAG MAG
Real Detection False Detection Missed Detection
Constant Magnetic Field
F(t1)
F(t2)
Variable Magnetic Field
F(t1)
F(t2)
Variable Magnetic Field
F(t1)
F(t2)
Grabbed Signal Grabbed Signal Grabbed Signal
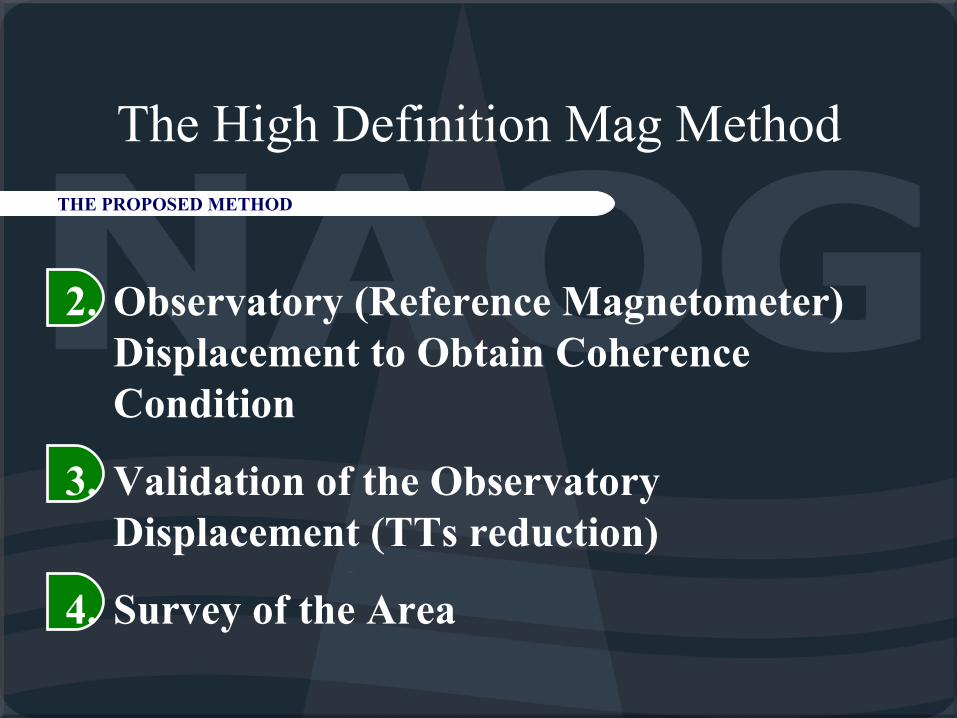
The High Definition Mag MethodTHE PROPOSED METHOD
2. Observatory (Reference Magnetometer) Displacement to Obtain Coherence Condition
3. Validation of the Observatory Displacement (TTs reduction)
4. Survey of the Area
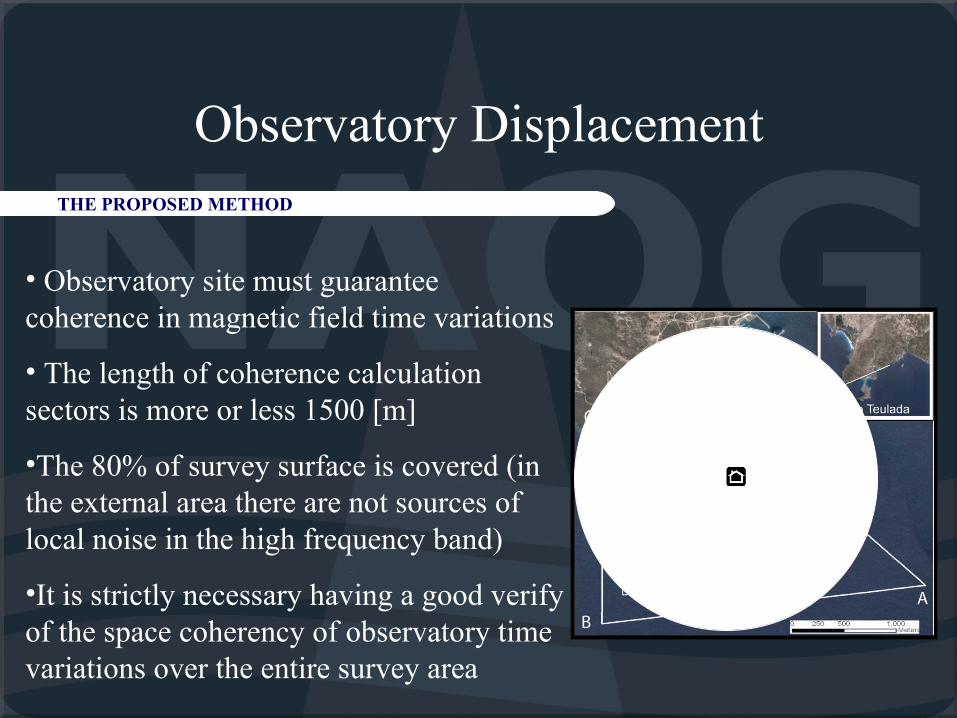
Observatory DisplacementTHE PROPOSED METHOD
• Observatory site must guarantee coherence in magnetic field time variations
• The length of coherence calculation sectors is more or less 1500 [m]
•The 80% of survey surface is covered (in the external area there are not sources of local noise in the high frequency band)
•It is strictly necessary having a good verify of the space coherency of observatory time variations over the entire survey area
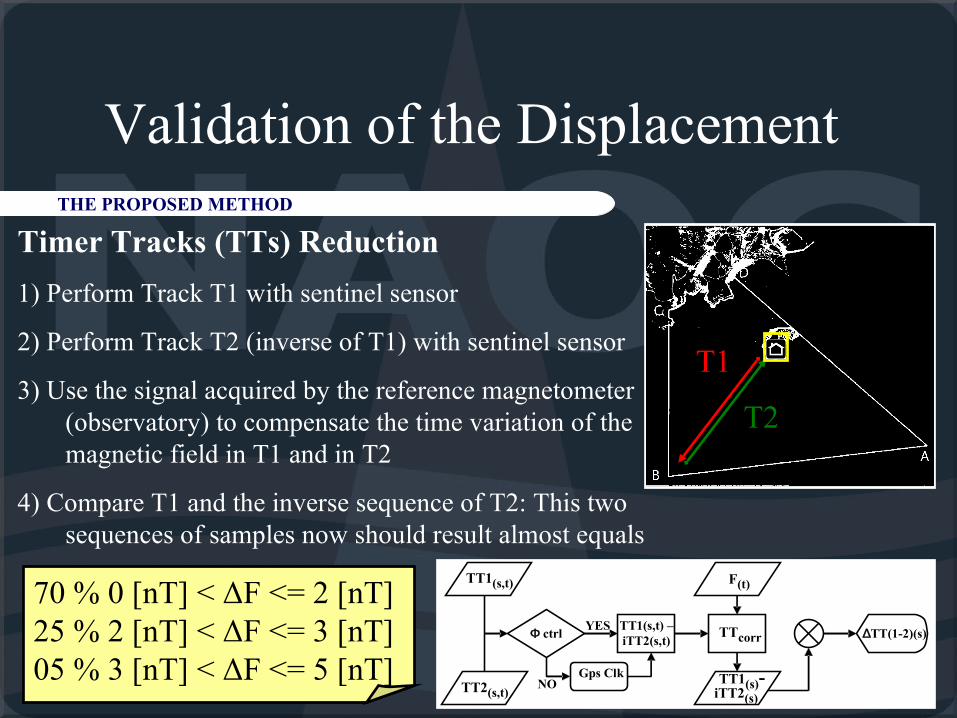
Validation of the Displacement THE PROPOSED METHOD
Timer Tracks (TTs) Reduction
1) Perform Track T1 with sentinel sensor
2) Perform Track T2 (inverse of T1) with sentinel sensor
3) Use the signal acquired by the reference magnetometer (observatory) to compensate the time variation of the magnetic field in T1 and in T2
4) Compare T1 and the inverse sequence of T2: This two sequences of samples now should result almost equals
TT1(s,t)
TT2(s,t)NO
YES
Gps Clk
TTcorr
F(t)
TT1(s)-iTT2(s)
Φ ctrlTT1(s,t) –iTT2(s,t)
∆TT(1-2)(s)
T1
T2
70 % 0 [nT] < ΔF <= 2 [nT]25 % 2 [nT] < ΔF <= 3 [nT] 05 % 3 [nT] < ΔF <= 5 [nT]
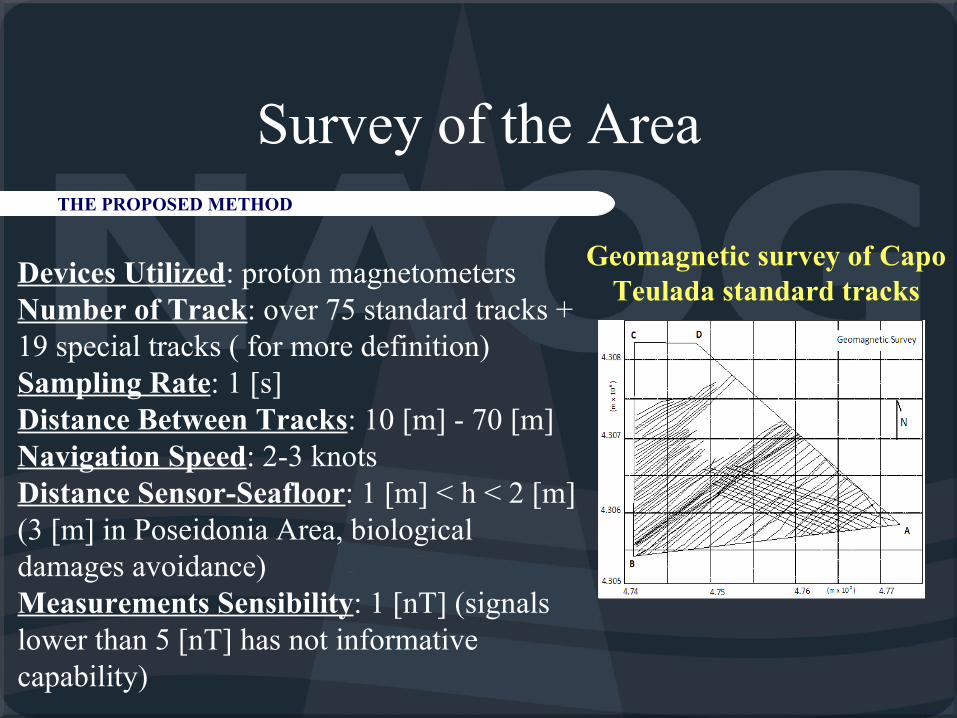
Survey of the AreaTHE PROPOSED METHOD
Devices Utilized: proton magnetometersNumber of Track: over 75 standard tracks + 19 special tracks ( for more definition) Sampling Rate: 1 [s]Distance Between Tracks: 10 [m] - 70 [m] Navigation Speed: 2-3 knots Distance Sensor-Seafloor: 1 [m] < h < 2 [m](3 [m] in Poseidonia Area, biological damages avoidance) Measurements Sensibility: 1 [nT] (signals lower than 5 [nT] has not informative capability)
Geomagnetic survey of Capo Teulada standard tracks
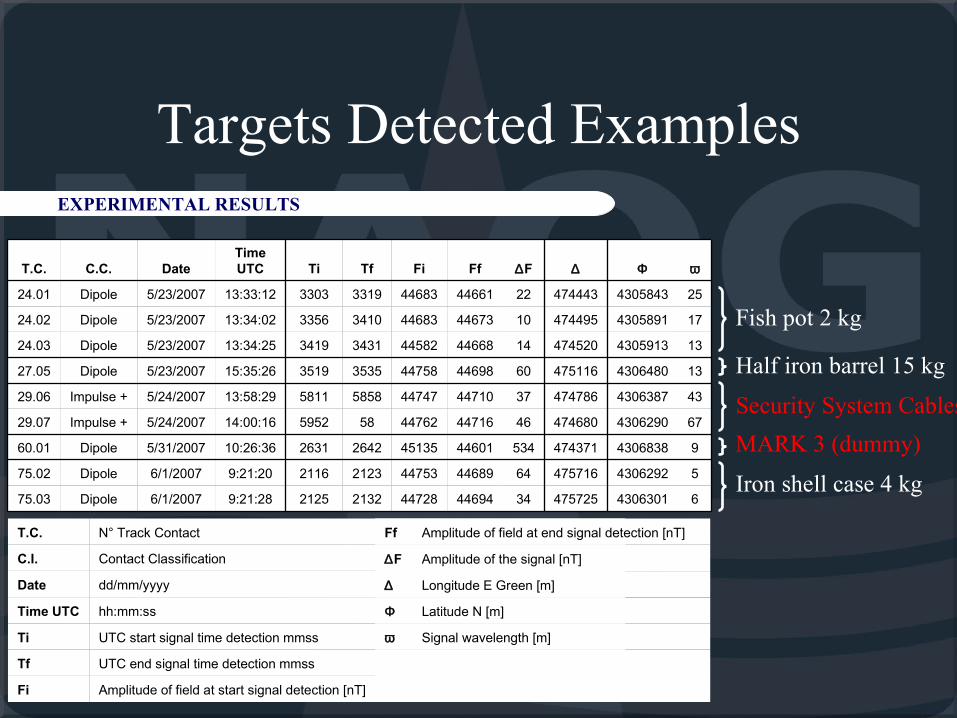
Targets Detected ExamplesEXPERIMENTAL RESULTS
T.C. C.C. DateTime UTC Ti Tf Fi Ff ∆F ∆ Φ ω
24.01 Dipole 5/23/2007 13:33:12 3303 3319 44683 44661 22 474443 4305843 25
24.02 Dipole 5/23/2007 13:34:02 3356 3410 44683 44673 10 474495 4305891 17
24.03 Dipole 5/23/2007 13:34:25 3419 3431 44582 44668 14 474520 4305913 13
27.05 Dipole 5/23/2007 15:35:26 3519 3535 44758 44698 60 475116 4306480 13
29.06 Impulse + 5/24/2007 13:58:29 5811 5858 44747 44710 37 474786 4306387 43
29.07 Impulse + 5/24/2007 14:00:16 5952 58 44762 44716 46 474680 4306290 67
60.01 Dipole 5/31/2007 10:26:36 2631 2642 45135 44601 534 474371 4306838 9
75.02 Dipole 6/1/2007 9:21:20 2116 2123 44753 44689 64 475716 4306292 5
75.03 Dipole 6/1/2007 9:21:28 2125 2132 44728 44694 34 475725 4306301 6
Fish pot 2 kg
Half iron barrel 15 kg
Security System Cables
MARK 3 (dummy)
Iron shell case 4 kg
T.C. N° Track Contact
C.I. Contact Classification
Date dd/mm/yyyy
Time UTC hh:mm:ss
Ti UTC start signal time detection mmss
Tf UTC end signal time detection mmss
Fi Amplitude of field at start signal detection [nT]
Ff Amplitude of field at end signal detection [nT]
∆F Amplitude of the signal [nT]
∆ Longitude E Green [m]
Φ Latitude N [m]
ω Signal wavelength [m]
A
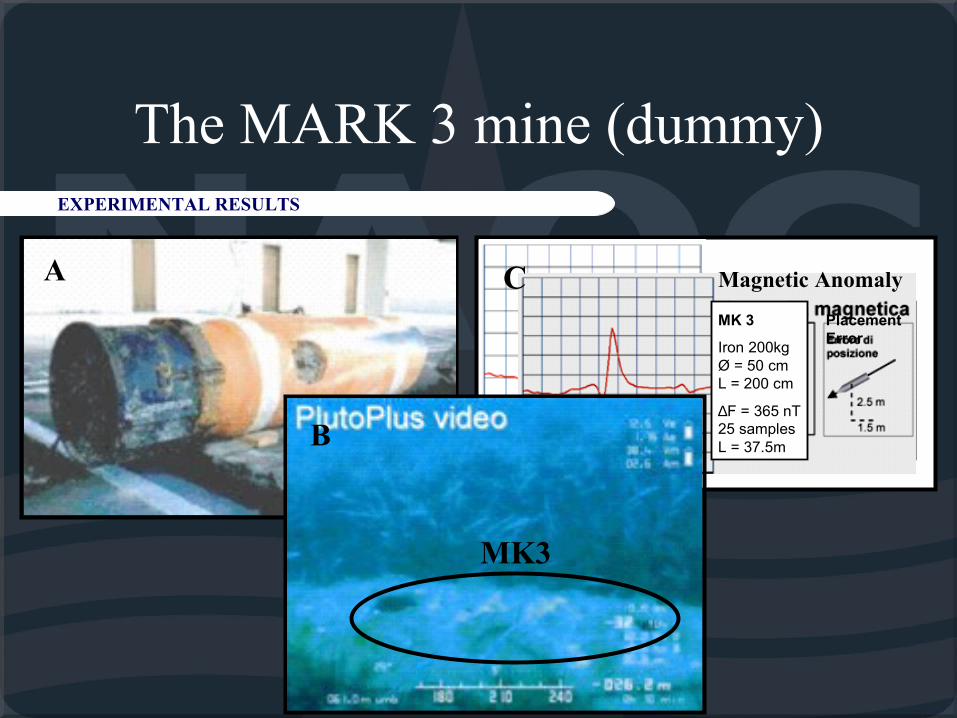
The MARK 3 mine (dummy)EXPERIMENTAL RESULTS
Magnetic Anomaly
MK 3
Iron 200kg Ø = 50 cm L = 200 cm
∆F = 365 nT25 samples L = 37.5m
Placement Error
C
B
MK3
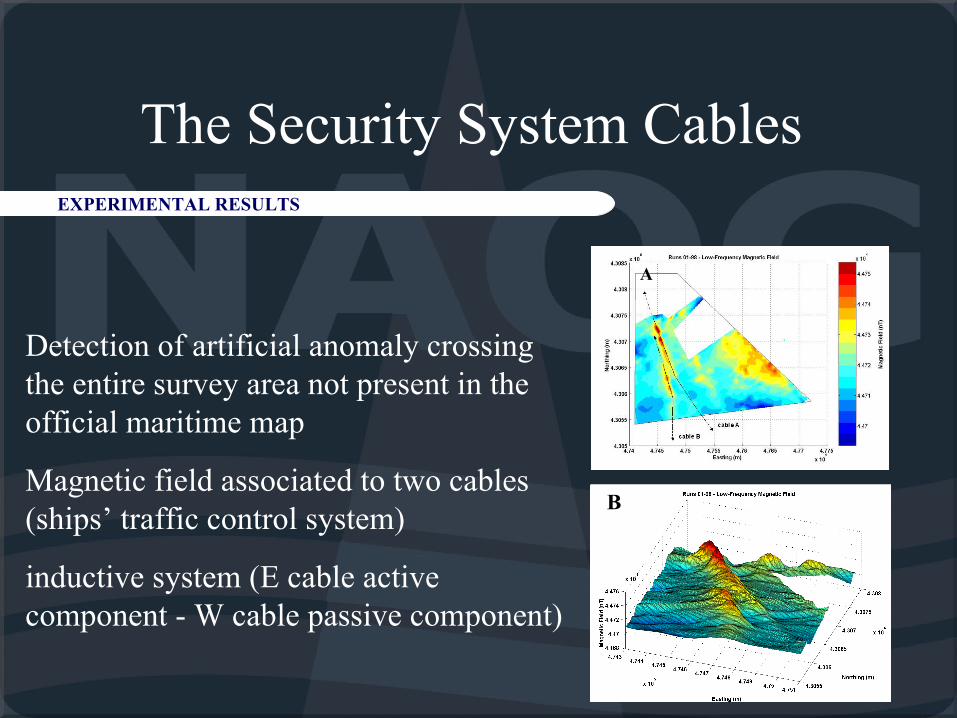
The Security System Cables EXPERIMENTAL RESULTS
A
B
Detection of artificial anomaly crossing the entire survey area not present in the official maritime map
Magnetic field associated to two cables (ships’ traffic control system)
inductive system (E cable active component - W cable passive component)
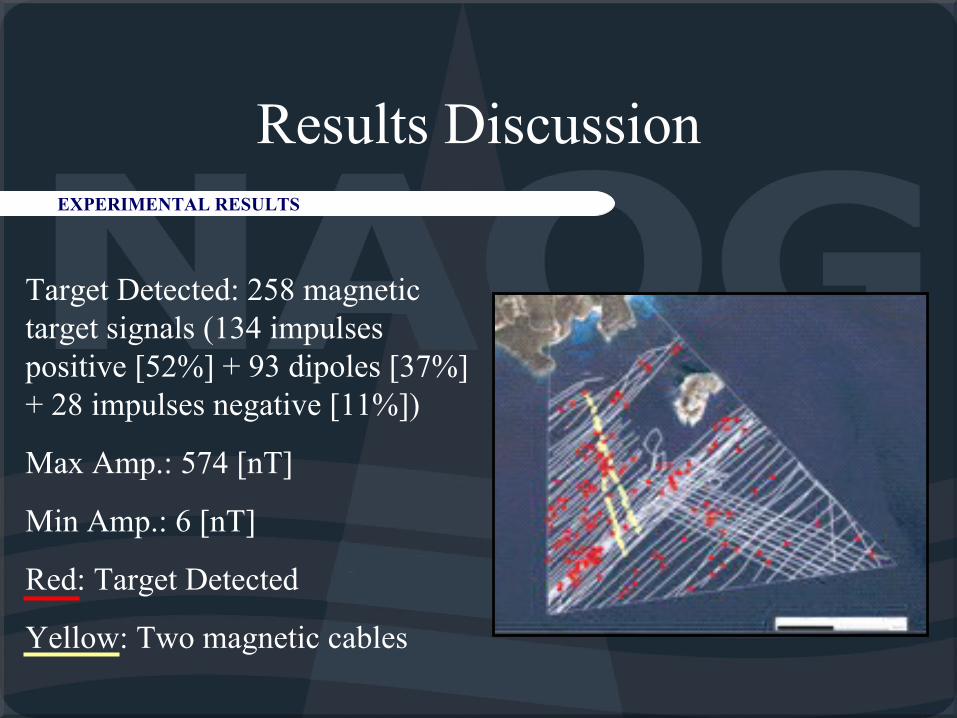
Results DiscussionEXPERIMENTAL RESULTS
Target Detected: 258 magnetic target signals (134 impulses positive [52%] + 93 dipoles [37%] + 28 impulses negative [11%])
Max Amp.: 574 [nT]
Min Amp.: 6 [nT]
Red: Target Detected
Yellow: Two magnetic cables
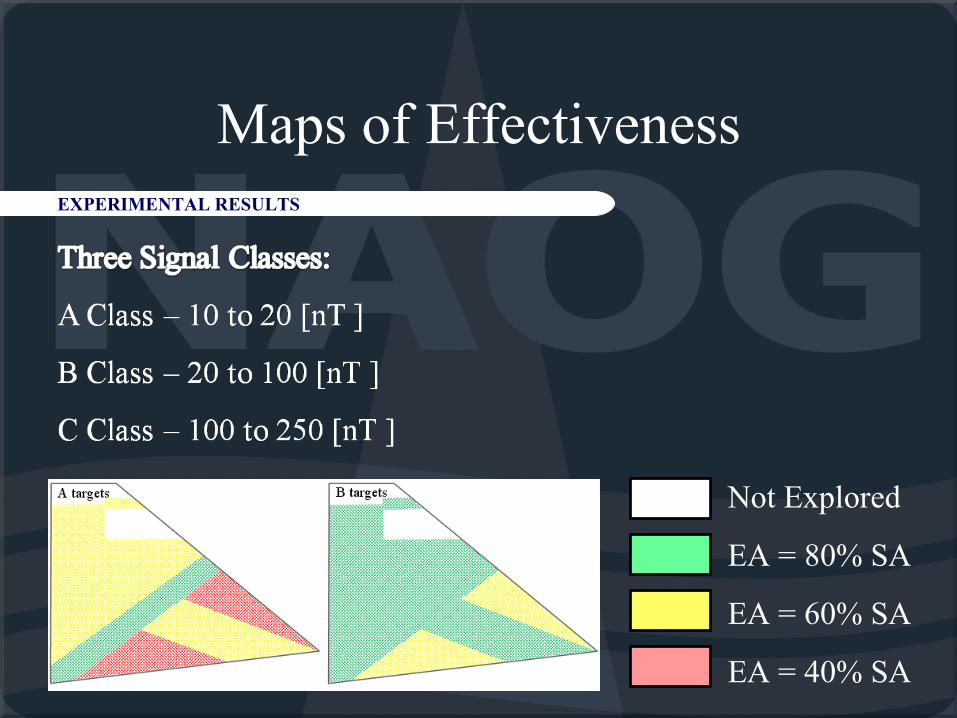
Maps of EffectivenessEXPERIMENTAL RESULTS
Not Explored
EA = 80% SA
EA = 60% SA
EA = 40% SA
Conclusions and Future Works
This technique proves to be a great auxiliary method to the standard approaches using in sea floor survey and detection (acoustic, optic, etc…).
Analyzing the results obtained in Capo Teulada ITN has decided to carry on the research on MCM developing a multi sensorial system.
CONCLUSIONS AND FUTURE WORKS

Organizations Involved in the Research