Embed Size (px)
Citation preview
Grant Final Report Grant ID: 1 R18 HS17261 Harnessing Health IT for Self-Management and Medication Activation in a Medicaid Plan Inclusive project dates: 09/01/07 - 08/31/11 Principal Investigator: Dean Schillinger, MD Team members: Margaret Handley, PhD, MPHNeda Ratanawongsa, MD, MPH
*
Urmimala Sarkar, MD, MPH*
Judy Quan, PhD *
Claudia Barrera, BS Phiona Tan, BS Catalina Soria, BS
*
Co-Investigator
Performing Organization: UCSF Center for Vulnerable Populations at San Francisco General Hospital Federal Project Officer: Teresa Zayas-Cabán, PhD Submitted to: The Agency for Healthcare Research and Quality (AHRQ) U.S. Department of Health and Human Services 540 Gaither Road Rockville, MD 20850 www.ahrq.gov

2
Abstract
Purpose: To determine if automated telephone self-management support (ATSM) improves quality of life and self-management among diverse patients with diabetes in a Medicaid and low-income health plan. Scope: Researchers from UCSF formed a partnership with San Francisco Health Plan to implement two forms of ATSM. The first (ATSM-ONLY) provided automated queries and messages combined with health coaching. The second (ATSM-PLUS) also leveraged pharmacy claims to strengthen medication counseling. Methods: SFHP used claims data to identify English, Spanish, or Chinese speaking members with diabetes and enrolled eligible patients using a staggered implementation and quasi-experimental design with wait-list control. UCSF staff contacted participants who agreed to complete a telephone interview at baseline and follow-up. Results: 362 members enrolled; 249 completed baseline and 6-month interviews. Mean age was 55.7; 79% reported incomes ≤$30,000. 68% reported limited English proficiency: 19% Spanish- and 54% Cantonese. There were no differences in baseline characteristics between ATSM and wait-list. Engagement was high: 85% participated in > 1 ATSM call, and median number of calls was 20 calls over 27 weeks. Those exposed to ATSM had greater improvements in SF-12 physical component scale (p=0.04) and better diabetes self-care behaviors (p <.01). Conclusion: A collaborative effort between health plan stakeholders and a practice-based research network to implement a health IT innovation for linguistically diverse Medicaid and low-income beneficiaries with diabetes was associated with high engagement rates, and significantly improved quality of life and diabetes self-care. Key Words: diabetes; self-management; limited English proficiency; disease management: health disparities; health literacy; health IT
The authors of this report are responsible for its content. Statements in the report should not be construed as endorsement by the Agency for Healthcare Research and Quality or the U.S. Department of Health and Human Services of a particular drug, device, test, treatment, or other clinical service.

3
Final Report
Purpose
This project focuses on low-income, underserved patients and their interaction with the ambulatory health care system, employing a multilingual automated telephone health IT and health coaching strategy to improve the patient experience of diabetes care. It attempts to improve the delivery of patient-centered health information to patients where they live and work, so as to ensure they can (a) maximize quality of life and (b) have the information and support they need, specifically around patient self-management of diabetes. Reducing the burden of diabetes and disability is an important goal for both patients and health care providers and, as such, functional status and quality of life are primary outcomes for this project. In addition, because medication management has been identified as one of the primary areas for prevention of medical errors, we linked automated telephone system inputs with medication claims data to attempt to improve medication management through reminders, patient education, and clinician communication. Finally, we focused on vulnerable patients, including the low-income underinsured, Medicaid beneficiaries, patients with special health care needs, minority populations, and non-English-speakers. The setting for this project was a Medicaid health plan and four underserved clinics involved in the UCSF Collaborative Research Network. The primary goal of this evaluation study was to determine if the automated telephone self-management support system (ATSM) with health coaching improves quality of life and diabetes self-management among participants. A secondary goal was to evaluate whether participants who received ATSM had improved clinical outcomes compared with participants not receiving ATSM. The Specific Aims are:
1a. To measure the effects of a Medicaid health plan-directed automated telephone self-management support system (ATSM) on patient-centered outcomes among ethnically diverse health plan enrollees with diabetes.
1b. To explore whether combining ATSM with an additional patient-directed health IT
innovation—a medication activation communication strategy triggered by pharmacy claims data (ATSM-PLUS)—yields differential effects on patient-centered outcomes compared to ATSM alone.
2a. To quantify and characterize patient safety events triggered and/or identified through
active surveillance among ATSM participants. 2b. To measure differences in the frequency and nature of patient safety events among
participants receiving ATSM-ONLY vs. ATSM-PLUS medication activation. 3a. To explore the effects of ATSM interventions on HEDIS-relevant metabolic and clinical
process and outcome measures when compared to usual care.
4
3b. To explore whether ATSM-PLUS medication activation is superior to ATSM-ONLY with respect to HEDIS-relevant metabolic and clinical process and outcome measures.
Of note, we measured (a) whether patients were receiving appropriate care for three of the
priority areas for transforming health care identified by the Institute of Medicine (http://www.ahrq.gov/qual/iompriorities.htm): (1) diabetes (2) medication management and (3) self-management/health literacy; (b) patients’ reported experience of care; and (c) the impact of the project in an urban safety net setting with limited health IT diffusion.
Scope
Background
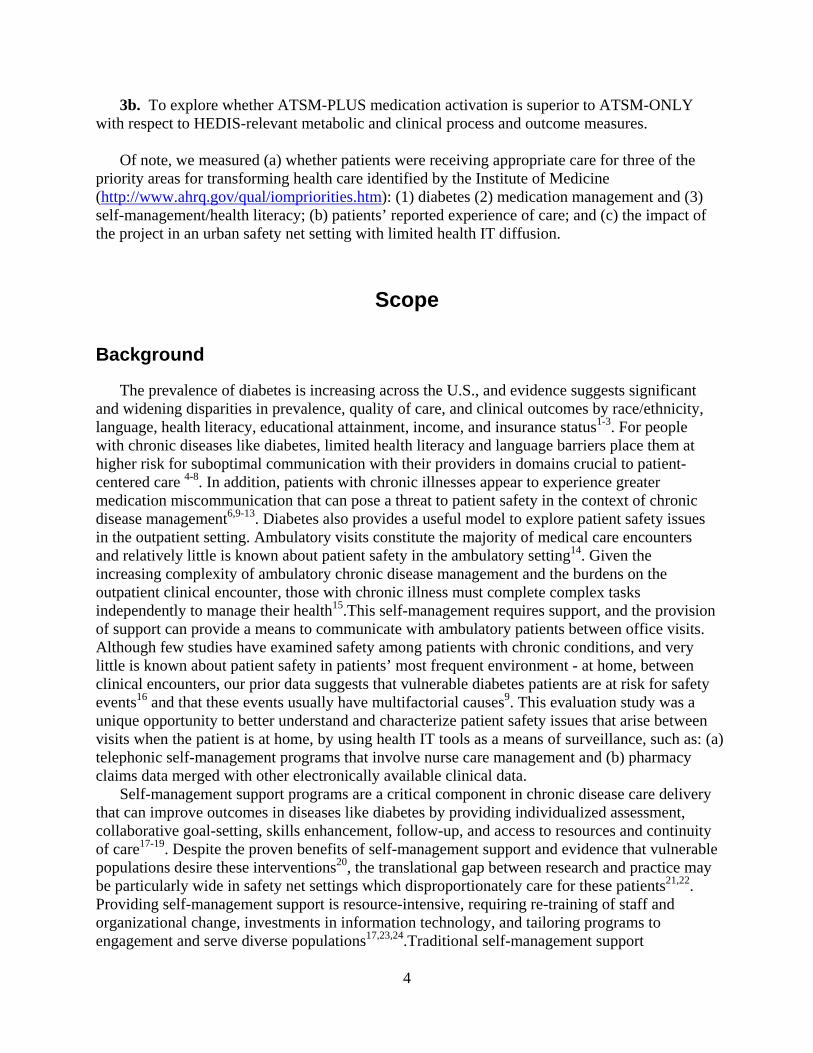
The prevalence of diabetes is increasing across the U.S., and evidence suggests significant and widening disparities in prevalence, quality of care, and clinical outcomes by race/ethnicity, language, health literacy, educational attainment, income, and insurance status1-3. For people with chronic diseases like diabetes, limited health literacy and language barriers place them at higher risk for suboptimal communication with their providers in domains crucial to patient-centered care 4-8. In addition, patients with chronic illnesses appear to experience greater medication miscommunication that can pose a threat to patient safety in the context of chronic disease management6,9-13. Diabetes also provides a useful model to explore patient safety issues in the outpatient setting. Ambulatory visits constitute the majority of medical care encounters and relatively little is known about patient safety in the ambulatory setting14. Given the increasing complexity of ambulatory chronic disease management and the burdens on the outpatient clinical encounter, those with chronic illness must complete complex tasks independently to manage their health15.This self-management requires support, and the provision of support can provide a means to communicate with ambulatory patients between office visits. Although few studies have examined safety among patients with chronic conditions, and very little is known about patient safety in patients’ most frequent environment - at home, between clinical encounters, our prior data suggests that vulnerable diabetes patients are at risk for safety events16 and that these events usually have multifactorial causes9
Self-management support programs are a critical component in chronic disease care delivery that can improve outcomes in diseases like diabetes by providing individualized assessment, collaborative goal-setting, skills enhancement, follow-up, and access to resources and continuity of care
. This evaluation study was a unique opportunity to better understand and characterize patient safety issues that arise between visits when the patient is at home, by using health IT tools as a means of surveillance, such as: (a) telephonic self-management programs that involve nurse care management and (b) pharmacy claims data merged with other electronically available clinical data.
17-19. Despite the proven benefits of self-management support and evidence that vulnerable populations desire these interventions20, the translational gap between research and practice may be particularly wide in safety net settings which disproportionately care for these patients21,22. Providing self-management support is resource-intensive, requiring re-training of staff and organizational change, investments in information technology, and tailoring programs to engagement and serve diverse populations17,23,24.Traditional self-management support

5
approaches often do not reach significant and growing segments of the chronic disease population, such as the uninsured or publicly-insured, or those with communication barriers1,10,20,25-27. Given the documented challenges with translating research into practice, more practical research to implement and evaluate quality improvement programs is needed in settings where vulnerable populations receive care28-34
Patient-directed health information technology holds promise to increase access to self-management support and enhance health outcomes for vulnerable populations
.
35-37. Automated telephone self-management support (ATSM) employs phone technology to provide surveillance and education and to prioritize further care management efforts for those most in need35. ATSM can be used to promote collaborative goal-setting in the form of behavioral action plans, by which patients set and achieve short-term goals to improve their self-management38. ATSM can also provide individualized assessment, skills enhancement, health education, follow-up, access to community resources and continuity of care35,36
Translational evidence from safety net settings is needed to understand whether health IT applications such as ATSM can work in real-world settings, and to inform how to harness health IT most effectively to support chronic disease self-management among vulnerable populations. Expanding health IT integration between Medicaid managed health plans, provider groups, and patients will increasingly be a critical avenue to improve the health of vulnerable populations. Improving health communication through the use of tailored, proactive health IT is one scalable vehicle to improve chronic disease care for vulnerable populations
.
35,36
Our previous randomized controlled trial of ATSM among English, Spanish, and Chinese speaking patients with poorly controlled diabetes demonstrated high engagement with ATSM, particularly among participants with limited literacy and limited English proficiency
.
35,36. Compared to patients receiving usual care or group medical visits, patients exposed to ATSM had greater improvements in self-management behavior, fewer bed days per month, and less interference in their daily activities, with a cost utility for functional outcomes comparable to other diabetes prevention and treatment interventions36,37. In addition, ATSM identified previously undetected potential adverse events and actual adverse events occurring at home, often in the context of patients’ self-management of diabetes16. Given the contributions of patient non-adherence to medications and provider clinical inertia to suboptimal achievement of diabetes treatment goals38,39, the impact of ATSM on clinical outcomes could be enhanced by health IT tools that can uncover poor adherence through electronic pharmacy claims data and identify opportunities to intensify treatment regimens using clinical registry data, allowing real-time, patient-centered counseling outside of the traditional office visit. The IOM highlighted ATSM as an important strategy in its National Action Plan for Health Literacy40
The San Francisco Health Plan (SFHP) approached our team of investigators at the University of California San Francisco (UCSF) Center for Vulnerable Populations to evaluate the implementation of ATSM as a covered health benefit for a subset of its members with type 2 diabetes. SFHP is a non-profit government-sponsored Medicaid managed-care plan created in 1994 to provide high quality medical care to the largest number of low-income San Francisco residents possible. In addition to managing Medicaid benefits, SFHP administers a local insurance program (“Healthy Workers”) for health workers who provide in-home support services for elderly or disabled people in San Francisco. When SFHP contacted the UCSF team in 2008, it managed the care of approximately 50,000 enrollees that were 48% Asian-Americans, 26% Latinos, and 12% African-Americans. Sixty percent of their membership was non-English speaking.
.
6
This final report presents a description of the SMART Steps (Self-Management Automated and Real-Time Telephonic Support) Study, a controlled quasi-experimental trial to improve type 2 diabetes self-management and clinical outcomes with two variants of language-concordant ATSM intervention implemented by SFHP. We hypothesized that intervention participants would demonstrate greater improvements in patient-centered and cardiometabolic outcomes compared to wait-list controls, and that cardiometabolic improvements would be greatest for patients exposed to ATSM with an enhanced medication activation communication strategy triggered by pharmacy claims and self-reported (e.g. ATSM) medication non-adherence.
Context
This evaluation study focuses on primary care with an emphasis on diabetes care for vulnerable populations. The collaborators with the SFHP in this study were investigators affiliated with the UCSF Center for Vulnerable Populations (CVP) and the UCSF Collaborative Research Network (CRN). The current ATSM study is one of several practice-based research studies in primary care settings from this group that emphasize developing and improving methods to reduce the communication barriers and improve the quality of care for ethnically and linguistically diverse, socio-economically vulnerable patients. The ATSM system was developed for the IDEALL project, previously funded by AHRQ. The SFHP re-named the ATSM program “SMART Steps”, but for this report, we refer to it as ATSM, for consistency with the original grant.
Setting
The SFHP is a Medicaid managed care plan in San Francisco that has in recent years experienced an increase in enrollees with diabetes, for which self-management education and support was particularly relevant. As a result, the SFHP Governing Board approached UCSF investigators to implement ATSM at SFHP. After determining that ATSM would be implemented as SMART Steps for eligible health plan members with diabetes, eligible participants were contacted and enrolled via telephone by SFHP staff. Enrollees were also offered the option to participate in the UCSF evaluation study and, if they agreed, the UCSF team would contact them via telephone in their primary language to confirm interest and obtain informed consent. SFHP members could receive ATSM/SMART Steps without participating in the UCSF evaluation.
Participants
Approximately half of the SFHP members have less than a high school education and most are economically disadvantaged. In addition to having diabetes, speaking one of the three study languages, participants were eligible if they were 18 years or older and attended one of four primary care clinics. The 4 clinics, located in a medically underserved area (MUA), are part of the UCSF Collaborative Research Network (CRN) (http://developmentalmedicine.ucsf.edu/research/research_programs/crn/crn.aspx), and were selected based on their high volume of SFHP member with diabetes and their willingness to participate due to the reported success of the prior AHRQ-funded CRN ATSM project (IDEALL

7
Project). The CRN's core membership currently includes over 250 primary care clinicians in a broad range of practice settings in cities spread throughout Northern California and extending into the California's Central Coast and Central Valley. The CRN is currently expanding partnerships within disciplines that extend beyond primary care, including medical subspecialties, dentistry, nursing, and pharmacy, with a focus on the underserved. Consenting SFHP patients provided their last name, sex, and phone number and were given a unique study ID number. UCSF research assistants contacted participants about also participating in the UCSF evaluation study. If patients agreed to the evaluation, a verbal consent was obtained. Participants were interviewed via telephone using close-ended surveys adapted from the original IDEALL study, at baseline and at 6-month follow up intervals.
Methods
Study Design
The ATSM evaluation was designed using a ‘practical clinical trial’ with a quasi-experimental ‘stepped wedge’ design that included a wait list (Refer to Figure 1). This design allowed for all patients contacted and determined eligible from SFHP to receive the intervention, at the request of the SFHP. During the project’s four year period, 362 SFHP enrollees with diabetes were randomized by the SFHP to one of two ATSM-intervention groups (ATSM-ONLY or ATSM-PLUS) or to wait-list41. Patients received the intervention for 6 months or were in the wait list control group for 6 months and then they received one or the other forms of the intervention. A detailed description of each intervention is provided under Interventions. We obtained patient-centered outcome measures for the subset of wait-listed ‘control group’ participants and ATSM participants (ATSM-ONLY, ATSM-PLUS) who consented to the UCSF study at baseline and 6 months. The study’s step-wedge design was characterized by staggered introduction of the ATSM intervention over time41-43. Because of the previous ATSM trial results, SFHP did not want to deny ATSM to any health plan members as would be required in a randomized clinical trial. Instead, ATSM was offered as a covered benefit to members, necessitating a quasi-experimental design. To ensure similar distributions of participants into each arm by language, randomization occurred stratified by language. In addition, SFHP felt that a staggered intervention implementation over time would be practical from a staffing and enrollment perspective. The step-wedge wait-list design allows for practical allocation of intervention resources over time. With four recruitment waves occurring over 24 months, it was feasible to collect several waves of intervention and control data that will enable evaluation of possible variations in intervention effects over time or temporal confounding47
.

8
Figure 1. ATSM/SMART Steps study design
To accomplish Specific Aim 1a, patient-centered outcomes were compared for ATSM exposed and ATSM wait list participants (refer to Results). To accomplish Specific Aim 1b, 6-month changes in patient-centered outcomes among ATSM-ONLY participants were compared with ATSM-PLUS participants. To accomplish Specific Aims 2a and 2b, the SFHP care managers identified and reported potential adverse events and actual adverse events among all ATSM participants. Using established ambulatory patient safety taxonomy and coding16
Specific Aims 3a and 3b were accomplished by carrying out a prospective cohort study among SFHP patients randomized to ATSM program (N=362), including eligible SFHP members not formally enrolled in the UCSF evaluation. We are currently analyzing administrative and electronically available clinical data to explore time-dependent, between-group differences in the values obtained for lower density lipid (LDL) cholesterol, hemoglobin A1c (HbA1c), blood pressure, retinal examinations, and ACE inhibitor use.
, study investigators reviewed events. The frequency of events, the automated trigger that led to ascertainment of each event, and the extent of harm from each type of event are described (refer to Results).
Enrollment Process. The SFHP determined which of their members were eligible and contacted them by telephone. During the phone call, participants were allowed to opt out of the ATSM intervention, the UCSF evaluation, or both. For participants enrolled in the ATSM program and the UCSF evaluation, the SFHP staff immediately informed the UCSF evaluation team and provided the last name, preferred language, phone number, and a unique SFHP-ATSM identifier for the participant. UCSF research staff then had a research assistant call the patient in the appropriate language and asked about participation in the UCSF evaluation using a verbal consent process. To ensure that UCSF did not have access to personal health information and that SFHP did not know who completed the evaluation or have linked survey results to their patients, the next set of steps were followed:
9
1. The SFHP created and maintained a unique SFHP- ATSM ID number separate from the patient’s SFHP ID, but is created just for the ATSM program.
2. At the end of the intervention, SFHP provided UCSF with datasets that only used the
unique SFHP-ATSM ID number, and UCSF linked these data with survey results for the evaluation.
3. UCSF then provided the SFHP with survey data in aggregate identified by the unique
UCSF identifier. Through these steps no exchange of individually identifiable research data between occurred.
Data Sources/Collection
For all eligible SFHP members, we collected socio-demographic variables and cardiometabolic outcomes data using monthly downloads of SFHP administrative and claims data and Community Health Network (CHN) clinical registry data. We currently are preparing to transfer de-identified SFHP administrative and claims data for utilization outcomes. Measures of all primary and secondary outcomes, except for the cardiometabolic and utilization outcomes, were derived from structured interviews conducted in English, Spanish, or Cantonese. For Spanish and Cantonese interviews, survey questions were translated and back-translated in their respective languages. Interviews were administered using computer-assisted telephone interview (CATI) software or in a few cases, by paper survey. Paper survey responses were later entered into the CATI-created database. Consenting participants were contacted to complete a baseline interview within 2 weeks of being randomized, prior to the start of their ATSM intervention or prior to a 6-month wait list period. A 6-month follow-up interview that assessed a number of the same domains as the baseline interview was also administered to consenting participants who were randomized to start ATSM immediately after enrollment. Wait-list randomized participants received a 6-month follow-up interview before they started the ATSM intervention and also an additional follow up interview, 12 months after enrollment, after completion of the intervention period as described above. Participants received a $50 gift card to Walgreens at each interview.
Interventions
The three randomly assigned intervention groups included: ATSM-Waitlist. Wait-list participants received usual care through their clinics, as well as receive all existing SFHP benefits (reminders and incentives for receipt of recommended processes of care, including laboratory testing, eye and foot examination, and influenza vaccination). After the 6-month wait list period, participants crossed over to ATSM-ONLY or ATSM-PLUS intervention, depending on baseline randomization. ATSM-ONLY. ATSM-ONLY participants immediately received the 6-month ATSM intervention after randomization. Developed with extensive input from patients to be sensitive to literacy, language, and culture in the target populations35, this ATSM system provides 27 weeks of 8-12 minute calls in English, Cantonese, or Spanish. Patients selected a convenient time to

10
receive the weekly call or they could call into the system, toll-free. The content consisted of rotating sets of queries about self-care (such as diet, exercise, and medication adherence), psychosocial issues (such as depressive symptoms), and access to preventive services (such as eye care). Patients respond via touch-tone commands, and based on their answers they may hear automated health education messages in the form of narratives. Patients answering “out of range” on an item received a telephone call within 3 days from a language-concordant SFHP health coach, who provides provide education and engages in collaborative goal-setting to form patient-centered action plans. ATSM was designed to promote health coach efficiency and effectiveness by focusing outreach calls to patients who report a need for further support via ATSM responses. SFHP implemented a health coach model for responding to ATSM triggers, rather than a nurse practitioner care manager as was used in our prior randomized controlled trial. SFHP employees without medical backgrounds or postgraduate training conducted phone calls, under the supervision of a registered nurse care manager. SFHP supervisors and UCSF staff taught health coaches about diabetes and trained them in behavior change counseling and overcoming barriers to health communication. UCSF staff also guided the development of written protocols and scripts to respond to potential triggers in each ATSM call, such as assessing for hypoglycemia symptoms or causes. All health coach-patient interactions, including action plans created and achieved, were documented via an SFHP care management system. For patients with pre-specified safety issues (such as a new medical symptom) or access concerns (such as need for refills or appointments), health coaches contacted a designated clinic contact and/or the primary care provider using standardized templates. Non-urgent issues were communicated by email or fax, while urgent issues were conveyed by phone with a confirmatory email or fax. Patients who indicated on their ATSM responses that they missed their diabetes, blood pressure, or cholesterol medications for 3-7 days in the previous week received calls to troubleshoot barriers to adherence. However, these calls were only triggered by patient self-disclosure in response to ATSM queries. ATSM-PLUS. ATSM-PLUS participants immediately received the 6-month ATSM intervention after randomization and medication activation and intensification coaching triggered by refill non-adherence or suboptimal achievement of cardiometabolic treatment goals. The goal of the ATSM-PLUS arm was to detect and intervene for participants whose medication treatment was suboptimal, either because of non-adherence or a potential missed opportunity to intensify their regimens. Because SFHP does not have prescribing authorization members, the intervention focused on enhancing medication regimens and adherence through collaborative goal-setting with patients and electronic feedback to primary care providers. Based on evidence-based guidelines44
The ATSM-PLUS protocol targeted 3 groups of patients:
, SFHP and UCSF collaborated to develop a protocol to improve medication adherence and promote patient-centered intensification by harnessing electronically available data from two additional sources: monthly SFHP pharmacy claims and clinical laboratory and blood pressure data from the electronic health records/registry of the Community Health Network.
1. Patients who indicated in response to weekly ATSM queries that they missed 3-7 days of
medication in the last week.
11
2. Patients with a 15-day to 6-month gap in refilling specific cardiometabolic prescriptions: oral hypoglycemic, insulin, anti-hypertensives (including ACE inhibitors and angiotensin-receptor blockers), cholesterol-lowering medications, or glucose testing strips (for patients receiving insulin or sulfonylureas), based on pharmacy claims data.
3. Patients with suboptimal achievement of cardiometabolic goals:
• Systolic blood pressure ≥ 130 at last recorded visit or no measurement in i2i within
the preceding 6 months.
• Diastolic blood pressure ≥ 80 at last recorded visit or no measurement in i2i within the preceding 6 months.
• Hemoglobin A1c > 7.0% on last measurement or no measurement in i2i within the
preceding 6 months.
• LDL > 100mg/dL on last measurement or no measurement in i2i within the preceding 12 months.
• Urinary albumin/creatinine >30mcg/mg for patients who are not prescribed or with a
late to refill for an ACE inhibitor or angiotensin-receptor blocker. An ATSM-PLUS participant could fall into none, one, or more than one of these groups at any given time. Pharmacy claims and clinical data were queried monthly to provide health coaches with a list of ATSM-PLUS participants to call. For patients with evidence of non-adherence, SFHP health coaches were trained with specific written protocols and scripts to promote self-disclosure of medication non-adherence and troubleshoot barriers such as confusion frequency of medications, forgetfulness, concerns about side effects, or health beliefs. For patients who had not had cardiometabolic measurements within guideline-concordant timeframes, health coaches were instructed to counsel patients about the reasons, encourage them to talk with their providers, and notify primary care providers of patients willing to obtain these tests. For patients with suboptimal achievement of treatment goals, health coaches were trained to counsel patients about their blood pressure or lab values and assess their willingness to discuss with their primary care providers the possibility of taking more medication. For those unwilling to consider medication intensification, health coaches also encouraged potential lifestyle changes. Based on their discussions, health coaches engage patients in collaborative goal-setting and action planning. Health coaches then notified the clinics’ contacts and/or primary care providers about interactions with any patients who reported barriers to medication adherence, needed laboratory or blood pressure assessments, or indicated a willingness to discuss medication intensification. In sum, the interventions were designed to: (1) improve patient self-management, (2) provide patients medical information, including but not limited to medication adherence and achieving clinical goals through medication, (3) improving patient-clinician (e.g. health coach) communication. Health plan coaches did not have prescribing authority. Communications to primary care clinicians were limited only to potential and actual safety events that arose, as well as medication non-adherence and patient willingness to intensify medication regimen, but only in the event that the patient reported a desire to have this communicated with their provider.

12
Measures
For Specific Aim 1a, we measured differences in patient-centered outcomes over time and compared these differences between ATSM (combining the ONLY and PLUS arms) and wait-list control. We used validated scales (refer to Table 1), intended to capture the experience of having a chronic illness along a number of patient-centered domains. Our primary outcomes are physical and mental functional status (SF-12) and the number of days spent in bed due to illness46. Secondary outcomes include patients’ perspectives on the structure of their chronic illness care (PACIC) and interpersonal processes of care (IPC), using instruments translated and validated in our prior work36, 47,48. For both PACIC and IPC, an overall summary scale score, as well as scores for individual subscales, were generated on a 100-point scale. We chose to not include the CAHPS® Clinician & Group Survey as an outcome measure, since the IPC has been developed and well-validated in Spanish and Chinese speaking populations, since there were some overlapping items, and since the intervention we were studying represented a health plans’ adjunct to primary care. Additional secondary outcome variables include diabetes self-efficacy and self-management behavior, including medication adherence in the preceding 7 days49,50
. We assessed the differential effects of ATSM and wait-list control on patient-centered outcomes, with t-tests for continuous variables to measure differences in change for each scale and adjusting for patient’s baseline score on each scale.
Table 1. SMART Steps primary and secondary outcomes measures Table 1a. Primary outcome variables
Primary Outcome Variables Functional Status Bed days
SF-12 Days confined to bed due to illness
Table 1b. Secondary outcome variables
Secondary Outcome Variables Instrument for Variable Measurement Diabetes self-management behaviors Summary of Diabetes Self-Care Activities (SDSCA) measure Patient-centeredness of care Perspectives on the structure of their chronic illness care (PACIC)
Interpersonal processes of care (IPC) Diabetes self-efficacy Patient self-management scale derived from questionnaire used in the
Diabetes Quality Improvement Project Glycemic control Hemoglobin A1c values Blood pressure control Systolic and diastolic blood pressure values Cholesterol control Low-density lipoprotein values Quality of care (HEDIS measures) - Proportions receiving hemoglobin A1c and blood pressure check
within previous 6 months - Proportions receiving LDL and microalbumin/creatinine check within
previous 12 months - Proportion receiving retinal examination within 12 months - Proportion receiving influenza and pneumococcal vaccination within
previous 12 months Health Care Utilization Emergency department visit data
Hospitalization data
13
For Specific Aim 1b, we compared changes in patient-centered outcomes among ATSM-ONLY participants to changes among ATSM-PLUS participants, adjusting for baseline values. For Specific Aim 2, we developed an active prospective surveillance system to identify threats to patient safety in the context where these threats are least likely to be detected, at home outside the clinical encounter. We implemented a descriptive component (Specific Aim 2a) to provide an understanding of the most important triggers for safety events, through descriptions of the triggers, frequency and nature of these events; and a comparative component (Specific Aim 2b) to determine the extent to which the two variations of the ATSM system differ with respect to triggers, frequency and nature of these events. Training the SFHP care managers was required to identify the patient safety events at the time of the patient call-backs. For the first few months of the project, there was close collaboration between SFHP care managers and the research team to review and discuss patient scenarios that would be considered potential adverse event (PAE) or adverse event (AE), review the triggers that would suggest events, and review the classification of events, once identified. Reporting of PAE or AE was made immediately to clinicians and clinic diabetes care coordinators. All notes were entered directly in an Events Access database for data analysis purposes. For Specific Aim 2b, we conducted a descriptive analysis of the Events Access database of ATSM call notes for the ATSM-ONLY and ATSM-PLUS groups (refer to Results). We will further explore differences related to: the event trigger; frequency of events, their nature, (prevalent or incident), preventability/ameliorability, whether the clinician was aware at time of their detection (health coaches notified the clinics’ contacts and/or primary care providers about interactions with any patients who reported barriers to medication adherence, needed laboratory or blood pressure assessments, or indicated a willingness to discuss medication intensification) the self-management domains they are in (medication, foot care, blood sugar self-monitoring, symptoms); and determine underlying contributing factors. We will also explore differences in the patients experiencing events across age, race/ethnicity, sex, language, health literacy, health status, clinic, HbA1c value, presence of co-morbidities, medication regimen, and proximity to the visit. For Specific Aim 3a and 3b, we used administrative and clinical de-identified data obtained from the SFHP-ATSM database. We analyzed the reliability of the data by estimating the level of agreement among common variables across the three electronic data sources and survey data. For Specific Aim 3a, we analyzed between-group differences in HbA1c by comparing 6-month changes in HbA1c for wait-listed patients versus ATSM intervention patients. This analysis was repeated for LDL cholesterol and blood pressure values. We also determined the proportion receiving LDL cholesterol test, blood pressure test, retinal examinations, and microalbuminuria screening. For Specific Aim 3b, we also measured between-ATSM group differences comparing 6-month changes in HbA1c for ATSM-ONLY patients with HbA1c changes in ATSM-PLUS patients. We repeated this analysis for other metabolic outcomes, as described above. Finally, we will be delayed in analysis of the SFHP utilization data such as emergency, primary care, and hospitalization visits. This is a very complex analysis requiring claims data from the SF Health Plan. They report a 3-6 month lag time in obtaining claims, and then many claims get reversed, requiring data cleaning. This will be completed after November 30, 2011.

14
Limitations
The evaluation study results must be interpreted within the following limitations: First, selection bias of ATSM participants may have resulted from the phone-based population recruitment conducted by SFHP. We have conducted an analysis of project reach—comparing enrolled versus non-enrolled eligible SFHP members—to examine demographic, clinical, and utilization-related differences between eligible and enrolled SFHP members. Second, with earlier recruitment waves focusing on Cantonese-speaking populations and later recruitment focusing on English-speaking participants, differences in intervention impact by language may be apparent due to changes in project implementation over time. Third, the intervention relied on lay health coaches—rather than medically-trained care managers—to conduct telephone counseling. Consequently, the self-management support calls may have been less focused on certain areas that coaches lacked expertise, such as medication and safety discussions. Although health coaches did record what patients reported, they may not have been able to well characterize medication and safety issues in a manner that a clinically-trained person could. Fourth, staff turnover within SFHP necessitates a need to examine the fidelity of health coach processes, both in counseling and documentation, and to determine whether fidelity changed over time. Fifth, health coaches were linguistically-concordant with patients but not necessarily culturally-concordant, and this may have affected engagement with the intervention. Sixth, because SFHP does not have prescribing authority for its members or authority to document within participants’ medical records, the intervention was not fully-integrated into care delivery in the context of participants’ primary care clinic; this may have especially limited the effectiveness of the ATSM-PLUS medication intensification arm. The safety issue of medication non-use, in particular, could not be addressed in real time because of the delay inherent in using pharmacy claims data. Finally, recruitment did not reach target goals for evaluating the impact on cardiometabolic outcomes, and data for these outcomes relied on collection through routine medical care. As a result of this, this study has limited power to detect a modest impact of the intervention on glycemic or blood pressure control.
Results
Principal Findings
Enrollment. A total of 910 SFHP members were identified as eligible to participate (Figure 2).

15
Figure 2. Numerical breakdown and comparison of the participants in the ATSM evaluation study
At the conclusion of the project the number of participants randomized and enrolled into ATSM was 362. Of the 362, 347 also reported a willingness to participate in the UCSF evaluation study. We analyzed the socio-demographic and clinical characteristics of the 362 participants and compared them with potential participants who declined or were not successfully contacted (Table 2). Of the 362 participants enrolled, 180 were Cantonese speakers, 121 English speakers, and 61 were Spanish speakers.

16
Table 2. Baseline socio-demographic and medical characteristics of key subgroups of potentially eligible SFHP members
Characteristic Participants (N=362)
Declined (N=160) p-value*
Non-Contacted (N=168) p-value*
Age in years, mean +/- SD 54.8 (8.4) 56.2 (9.2) 0.03 54.5 (10.9) 0.93 Female, n (%) 258 (71.3) 98 (61.3) 0.02 111 (66.1) 0.23 Race/ethnicity, n (%) <0.01 † <0.01Race/ethnicity, n (%): Asian
† 212 (58.6) 97 (60.6) 84 (50.0)
Race/ethnicity, n (%): Black / African-American 25 (6.9) 9 (5.6) 18 (10.7) Race/ethnicity, n (%): White / Caucasian 34 (9.4) 31 (19.4) 20 (11.9) Race/ethnicity, n (%): Latino / Hispanic 81 (22.4) 16 (10.0) 38 (22.6) Race/ethnicity, n (%): Native American / Eskimo 1 (0.3) 0 (0.0) 2 (1.2) Race/ethnicity, n (%): Hawaiian / Pacific Islander 3 (0.8) 0 (0.0) 0 (0.0) Race/ethnicity, n (%): Other 5 (1.4) 6 (3.8) 5 (3.0) Race/ethnicity, n (%): Unknown 1 (0.3) 1 (0.6) 1 (0.6) Language, n (%) <0.01 <0.01 Language, n (%): English 121 (33.4) 81 (50.6) 95 (56.5) Language, n (%): Spanish 61 (16.9) 6 (3.8) 22 (13.1) Language, n (%): Cantonese 180 (49.7) 73 (45.6) 51 (30.4) Financial Class – Insurance Type, n (%) 0.83 ‡ 0.01Financial Class – Insurance Type, n (%): Healthy Worker
‡ 255 (70.6) 112 (70.0) 95 (56.5)
Financial Class – Insurance Type, n (%): Medicaid Community Alternatives Program
80 (22.1) 34 (21.3) 48 (28.6)
Financial Class – Insurance Type, n (%): Medicaid Fee For Service
2 (0.6) 1 (0.6) 5 (3.0)
Financial Class – Insurance Type, n (%): Medicare
16 (4.4) 9 (5.6) 10 (6.0)
Financial Class – Insurance Type, n (%): Healthy San Francisco
5 (1.4) 2 (1.3) 6 (3.6)
Financial Class – Insurance Type, n (%): Uninsured
3 (0.8) 1 (0.6) 3 (1.8)
Financial Class – Insurance Type, n (%): Commercial
0 (0.0) 1 (0.6) 1 (0.6)
Financial Class – Insurance Type, n (%): Healthy Kids
1 (0.3) 0 (0.0) 0 (0.0)
Hemoglobin A1c, mean +/- SD 7.7 (1.6) 7.6 (1.5) 0.09 7.9 (1.9) 0.82 Systolic blood pressure, mean +/- SD 128.6 (17.6) 128.8 (16.7) 0.99 131.6 (19.2) 0.38 Diastolic blood pressure, mean +/- SD 74.7 (11.2) 75.2 (11.0) 0.80 75.6 (10.2) 0.31 Low-density lipoprotein, mean +/- SD 95.0 (30.6) 95.0 (34.3) 0.48 105.2 (34.0) <0.01
* P-values derived from chi-sq tests for categorical variables, t-tests for interval variables if normally distributed and Wilcoxon tests if interval variables not normally distributed (age, HbA1c, SBP, DBP, and LDL). † P-values calculated based on categories of Asian / Pacific Islander, Black / African-American, Hispanic / Latino, Native American / Other / Unknown, and White / Caucasian ‡P-values calculated based on categories of Healthy Worker / Healthy San Francisco, Medi-Cal (CAP or FFS), Medicare, and Commercial / Uninsured. Follow-up. A total of 278 baseline interviews, 278 6-month follow-up 1 interviews, and 118 follow-up 2 interviews were conducted. We calculated that among participants with a baseline interview, there was a 90% retention rate from baseline and the first-follow up interview. Table 3, below, provides a descriptive profile of the 249 participants who completed both the baseline and first follow-up interviews, by study arm.

17
Table 3. Participants that completed baseline and follow-up survey (N=249)
Characteristic ATSM (n=125)
Wait-List (n=124) p-value
Age in years, mean (SD) 56.6 (7.9) 54.9 (8.6) 0.14 Women, n (%) 76.8 71.8 0.36 Race / ethnicity, n (%) 0.44 Race / ethnicity, n (%): Latino 25.6 20.2 Race / ethnicity, n (%): Black / African-American 5.6 9.7 Race / ethnicity, n (%): Asian / Pacific Islander 60.0 62.1 Race / ethnicity, n (%): White / Caucasian 5.6 7.3 Born outside the U.S., n (%) 86.4 84.7 0.70 Language, n (%) 0.96 Language, n (%): Cantonese-speaking 53.6 54.8 Language, n (%): Spanish-speaking 20.0 18.5 Language-concordant primary care provider 35.2 29.9 0.57 Educational attainment, n (%) 0.72 Educational attainment, n (%): 8th 39.2 grade education or less
46.7
Educational attainment, n (%): Some high school 10.4 8.9 Educational attainment, n (%): High school graduate or GED
25.6 17.7
Educational attainment, n (%): College graduate or above
24.8 26.6
Limited health literacy, n (%) 46.8 40.3 0.31 Employment status, n (%) Employment status, n (%): Employed full-time 22.4 21.0 Employment status, n (%): Part-time 48.8 46.8 Employment status, n (%): Unemployed 9.6 12.1 Employment status, n (%): Disability 5.6 10.5 Annual household income, n (%) 0.68 Annual household income, n (%): ≤ $20,000 60.5 59.7 Annual household income, n (%): $20,001 – 30,000 17.7 20.2 Annual household income, n (%): >$30,000 15.3 15.3 Insurance type, n (%) Insurance type, n (%): Medicaid 22.6 16.1 Insurance type, n (%): Medicare 3.2 5.6 Insurance type, n (%): Uninsured/Healthy SF 1.6 3.2 Insurance type, n (%): Healthy Worker 72.6 74.2 Diabetes years, mean (SD) 6.8 (5.8) 7.1 (5.4) 0.35 Insulin treatment, n (%) 80.8 86.3 0.24 Hemoglobin A1c >8.0%, n (%) 30% 24% 0.31 Hemoglobin A1c, mean (SD) 7.8 (1.6) 7.5 (1.3) 0.14 Low-density lipoprotein, mean mg/dL (SD) 93.1 (30.3) 93.5 (31.7) 0.91 Systolic blood pressure, mean mm Hg (SD) 130.9 (18.9) 126.7 (17.3) 0.10
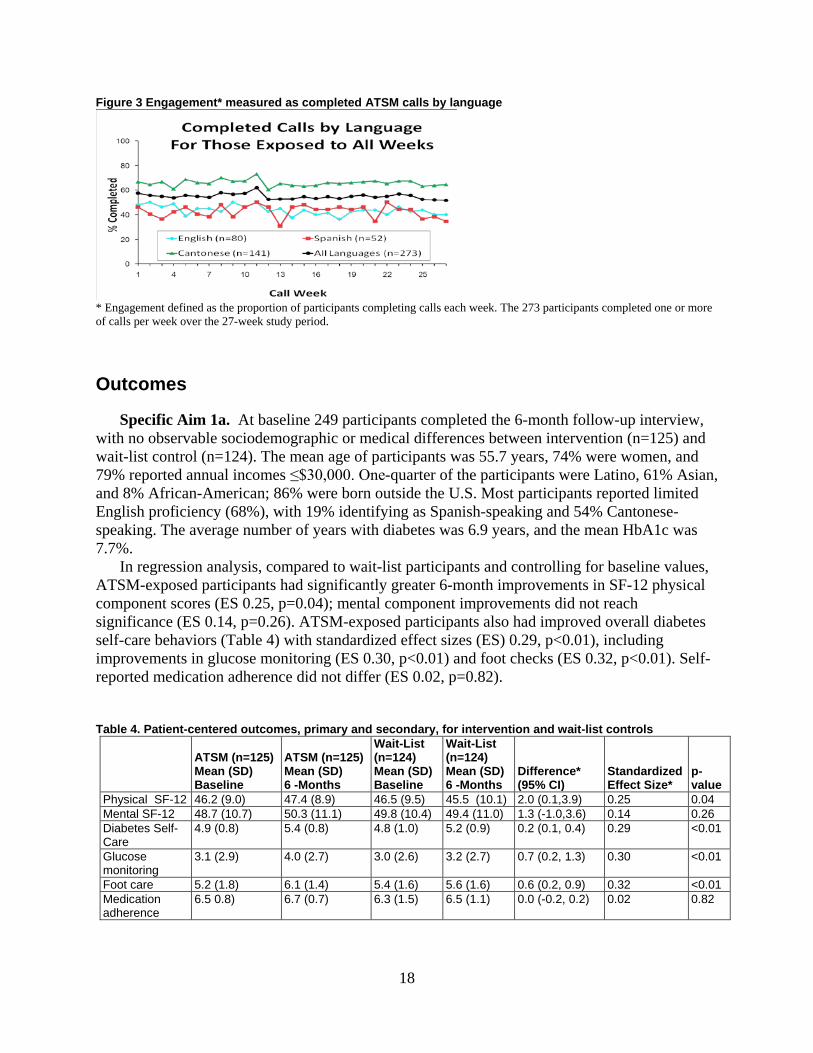
Intervention Engagement. We examined engagement with the ATSM calls for participants. Engagement was defined as the proportion of participants completing ATSM calls each week (Figure 3). Engagement remained high throughout the 27 weeks, especially for Cantonese-speakers. Eighty-five percent of ATSM exposed participants completed at least 1 call, with a median of 19 calls per engaged patient (interquartile range 4-24). Non-English speakers had higher engagement, with Cantonese speakers completing a median of 21 calls, 10.5 for Spanish speakers, and 9 for English-speakers. This median difference was statistically significant.
18
Figure 3 Engagement* measured as completed ATSM calls by language
* Engagement defined as the proportion of participants completing calls each week. The 273 participants completed one or more of calls per week over the 27-week study period.
Outcomes
Specific Aim 1a. At baseline 249 participants completed the 6-month follow-up interview, with no observable sociodemographic or medical differences between intervention (n=125) and wait-list control (n=124). The mean age of participants was 55.7 years, 74% were women, and 79% reported annual incomes ≤$30,000. One-quarter of the participants were Latino, 61% Asian, and 8% African-American; 86% were born outside the U.S. Most participants reported limited English proficiency (68%), with 19% identifying as Spanish-speaking and 54% Cantonese-speaking. The average number of years with diabetes was 6.9 years, and the mean HbA1c was 7.7%. In regression analysis, compared to wait-list participants and controlling for baseline values, ATSM-exposed participants had significantly greater 6-month improvements in SF-12 physical component scores (ES 0.25, p=0.04); mental component improvements did not reach significance (ES 0.14, p=0.26). ATSM-exposed participants also had improved overall diabetes self-care behaviors (Table 4) with standardized effect sizes (ES) 0.29, p<0.01), including improvements in glucose monitoring (ES 0.30, p<0.01) and foot checks (ES 0.32, p<0.01). Self-reported medication adherence did not differ (ES 0.02, p=0.82). Table 4. Patient-centered outcomes, primary and secondary, for intervention and wait-list controls
ATSM (n=125) Mean (SD) Baseline
ATSM (n=125) Mean (SD) 6 -Months
Wait-List (n=124) Mean (SD) Baseline
Wait-List (n=124) Mean (SD) 6 -Months
Difference* (95% CI)
Standardized Effect Size*
p-value
Physical SF-12 46.2 (9.0) 47.4 (8.9) 46.5 (9.5) 45.5 (10.1) 2.0 (0.1,3.9) 0.25 0.04 Mental SF-12 48.7 (10.7) 50.3 (11.1) 49.8 (10.4) 49.4 (11.0) 1.3 (-1.0,3.6) 0.14 0.26 Diabetes Self-Care
4.9 (0.8) 5.4 (0.8) 4.8 (1.0) 5.2 (0.9) 0.2 (0.1, 0.4) 0.29 <0.01
Glucose monitoring
3.1 (2.9) 4.0 (2.7) 3.0 (2.6) 3.2 (2.7) 0.7 (0.2, 1.3) 0.30 <0.01
Foot care 5.2 (1.8) 6.1 (1.4) 5.4 (1.6) 5.6 (1.6) 0.6 (0.2, 0.9) 0.32 <0.01 Medication adherence
6.5 0.8) 6.7 (0.7) 6.3 (1.5) 6.5 (1.1) 0.0 (-0.2, 0.2) 0.02 0.82

19
Table 4. Patient-centered outcomes, primary and secondary, for intervention and wait-list controls (continued)
ATSM (n=125) Mean (SD) Baseline
ATSM (n=125) Mean (SD) 6 -Months
Wait-List (n=124) Mean (SD) Baseline
Wait-List (n=124) Mean (SD) 6 -Months
Difference* (95% CI)
Standardized Effect Size*
p-value
Moderate physical activity (minutes/week)
720 (815) 470 (643) 839 (1012) 548 (679) -22.1 (-167.7, 123.5)
-0.02 0.77
Vigorous exercise (minutes/week)
137 (288) 75.5 (169) 134 (260) 92.1 (245) -29.8 (-83.1, 23.5)
-0.10 0.27
Patient assessment of chronic illness care
44.0 (24.0) 55.8 (24.1) 45.3 (23.0) 55.2 (23.2) 1.4 (-2.9, 5.7) 0.07 0.52
Interpersonal processes of care
58.3 (11.7) 56.3 (10.9) 58.3 (11.4) 54.6 (11.3) 1.8 (-0.6, 4.2) 0.15 0.15
ATSM (n=125) Mean (SD) Baseline
ATSM (n=125) Mean (SD) 6 -Months
Wait-List (n=124) Mean (SD) Baseline
Wait-List (n=124) Mean (SD) 6 -Months
Difference* (95% CI) Rate Ratio
p-value
Bed days in prior month
1.4 (4.6) 1.0 (3.3) 1.1 (3.2) 1.4 (4.4) -0.5 (-1.3, 0.4) 0.64 (0.3, 1.5) 0.30
Restricted activity days in prior month
2.9 (7.0) 1.8 (5.2) 2.6 (6.2) 2.4 (5.9) -0.1 (-0.8, 0.5) 0.9 (0.5, 1.7) 0.70
Specific Aim 1b. There were no statistical differences between the ATSM-PLUS and ONLY groups regarding the SF-12, PACIC, or IPC measures. For the overall measure of diabetes self-efficacy, the PLUS group had significant improvements compared to the ONLY group (adjusted mean difference=3.4, 95% CI 0.5-6.4). There were no differences in overall scores for weekly diabetes-related self-management behaviors between PLUS and ONLY groups, but there were several differences in sub-scales, reflecting improved exercise-specific behavior in the PLUS group (adjusted mean difference 0.8, 95% CI 0.3-1.4) and behaviors related to medication adherence (adjusted mean difference 0.3, 95% CI 0.0-0.6), as well as medication adherence measures for diabetes medicines (adjusted mean difference 0.8, 95% CI 0.2-1.4) and blood pressure/cholesterol medicines (adjusted mean difference 0.2, 95% CI 0.0-0.3). Reported hours of physical activity were also higher in the PLUS group compared to ONLY (adjusted mean difference 0.9, 95% CI 0.1-1.7). Patients in PLUS reported fewer bed days in the previous month than ONLY patients (adjusted mean difference 0.7 fewer days, 95% CI 0.2-1.7). Specific Aim 2a and 2b. For Specific Aim 2a, Table 5 below demonstrates the number of safety events recorded, and the triggers from which they resulted. During the study’s three year period, 480 safety events were reported among 164 participants. In Table 6, below, the values demonstrate that noted safety events did not appear to lead to patient harm. However, there were instances where adverse events did lead to health care utilization, including 23 emergency department visits. We found no significant differences between the ATSM-ONLY and ATSM-PLUS groups in terms of the frequency and type of safety events. Of note, 27 triggers for a blood

20
sugar less than 60 were in the ATSM-PLUS group and 14 were in the ATSM-ONLY group (p=0.08). (Specific Aim 2b). Table 5. Number and percentage of trigger events
Trigger Events for Patient Safety Automated trigger Live Care Manager Interaction Sugar < 60 41 (8) 74 (15) Sugar > 300 50 (10) 7 (2) Not checking sugars 23 (5) 26 (5) Do not know medications’ names and/or instructions 27 (6) 16 (3) Could not get medications at pharmacy 37 (8) 4 (1) Did not adhere CVD/DM Meds > 4-7 days 23 (5) 11 (2) Having Pain, Symptom, or Side Effect 0 (0) 28 (6) Needs Refill for CVD/DM Medications 2 (0.40) 19 (4) Needs Glucometer 1 (0.20) 8 (2) Needs Glucometer Strips 1 (0.20) 7 (1.5) Needs Medical Appointment 4 (0.80) 3 (0.60) Other Safety Issue 45 (9) 26 (5)
Table 6. Number of potential and/or actual adverse events
Trigger Events for Patient Safety
Lab Abnormalities Hospitalization ER
One Day Symptoms
Several Day Symptoms
Sugar < 60 0 0 5 5 0 Sugar > 300 0 0 6 9 0 Not checking Sugars 0 0 1 8 0 Do not know medications’ names and/or instructions 0 0 0 2 0
Could not get medications at pharmacy 0 0 0 1 0
Did not adhere CVD/DM Meds > 4-7 days 0 2 0 0 4
Having Pain, Symptom, or Side Effect 2 0 5 59 0
Needs Refill for CVD/DM Medications 0 0 0 2 0
Needs Glucometer 0 0 2 3 0 Needs Glucometer Strips 0 0 0 3 0 Needs Medical Appointment 0 0 1 8 0 *Other Safety Issue 0 0 3 18 0 Totals 2 2 23 118 4
*Other Safety issue include “feeling sad,” “unable to manage diabetes,” and “unknown” Specific Aim 3a and 3b. In our study, we have baseline and 6-month follow-up HbA1c values for 263 participants from intervention and wait-list groups; based on actual HbA1c values, our study was sufficiently powered to detect an a priori HbA1c difference of 0.51%. The combined ATSM intervention arms had baseline HbA1c of 7.85 (SD 1.67) and 6-month follow-up HbA1c of 7.73 (SD 1.63), while the waitlist arm changed from 7.61 (SD 1.44) to 7.44 (SD 1.15). Adjusting for the baseline values, the difference in 6-month changes was 0.1 (95% CI -0.1, 0.3) Final intervention exposure ended in August 2011. We found no differences between wait list and ATSM or between ATSM-PLUS and ATSM-ONLY participants regarding metabolic outcomes, with one exception. Wait-list patients had a lower adjusted mean difference in LDL value than did intervention patients (adjusted mean difference 7.7, 95% CI 0.0-15.3). However,

21
as 51% of the LDL values were missing (refer to Table 7 below), there may be selection biases associated with this measure. Table 7. Number and percentage of randomized patients with data by clinical outcome and visit (N= 362)
Clinical Outcome Baseline FU1 Both Baseline and FU1 A1C 348 (96) 275 (76) 263 (73) LDL 323 (89) 197 (54) 179 (49) BP 358 (99) 314 (87) 311 (86)
Discussion
Our findings suggest that ATSM with health coach counseling is a viable strategy as implemented by a managed care plan to engage linguistically and culturally diverse, vulnerable, and low-income individuals with diabetes using population-based recruitment. As with the IDEALL study, we found high levels of engagement, suggesting that this intervention model can be scaled up for larger populations. Another similarity between this evaluation study and IDEALL35
Our findings suggest that ATSM with health coaching resulted in improved diabetes self-care behaviors and physical quality of life outcomes that are both clinically relevant and meaningful as patient-centered outcomes. In IDEALL
, was higher levels of engagement for non-English-speaking participants—particularly Cantonese-speakers. Findings of differences in language must be adjusted for potential confounding. If still present in multivariate models, this difference may be attributable to the cultural—as well as linguistic—concordance of the Cantonese-speaking health coaches. The median engagement of English- and Spanish-speakers in 27 weeks of ATSM calls represents substantive engagement in the ATSM intervention. Further assessment of health coach processes—including qualitative interviews with health coaches—will explore potential mechanisms for differences in engagement among diverse participants.
36
The intervention was not associated with improvements in patient-centered processes of care delivery as measured by PACIC or IPC measures. However, there were between-group differences for some measures of diabetes self-efficacy and self-care, including exercise and medication adherence, as well as increased hours of exercise and reduced number of bed days among ATSM-PLUS compared with ATSM-ONLY participants. ATSM-triggered health coaching was conducted by lay coaches who lacked medical training and worked outside of patients’ primary care clinic and this could partially explain the lack of change in these measures, but the PLUS findings will be further examined through review of the care manager notes and patient action plans. The fact that the intervention was still associated with improvements in quality of life may suggest that the health coach counseling focused more on self-management outside of the context of health care delivery, rather than engagement with health care providers.
, we found similarly robust improvements in self-care and improvements functional outcomes.
We did find a significant number of adverse events in the population of vulnerable diabetes patients. It is reassuring that most events were not associated with harm, although we cannot assess whether these events would have eventually led to harm if they had persisted undetected until the next ambulatory visit. Two common events, non-adherence to medications and to glucose monitoring, certainly can lead to diabetes complications and poor control if they persist

22
unchecked. It is important to note that abnormally low or high glucose values were frequent and were associated with the rare excess health care utilization that did occur. Lastly, we did not find that the combined intervention arms were associated with improvements in HbA1c or other HEDIS-relevant cardiometabolic outcomes, with the exception of lower LDL among wait-list participants, although the low numbers of available LDL tests for this analysis raises concerns of selection bias in the analysis. We are currently analyzing the care processes, and utilization outcomes. In IDEALL, the lack of improvements in cardiometabolic indicators was attributed to lack of impact on medication-taking behavior, either in patient adherence or clinician intensification of treatment regimens36
. In this study, compared with wait-list, the combined intervention arms did not experience improvements in self-reported medication adherence, but differences were identified in the ATSM-PLUS group, consistent with our study hypotheses. As described above though, SFHP’s lack of prescribing authority and challenges with integrating health coaches into clinical workflow of patients’ primary care clinic limited the potential effectiveness of the enhanced ATSM-PLUS intervention with regards to cardiometabolic outcomes, and the sample size will limit our power to detect differences in cardiometabolic measures. Future analyses will examine differences in the impact of the intervention arms, with particular attention to rates of refill non-adherence from SFHP pharmacy claims.
Conclusions
Automated telephone self-management with health coach collaborative counseling as implemented by a low-income managed care plan led to successful engagement with a linguistically and culturally diverse vulnerable population with diabetes. Although this study may not be powered to detect differences in cardiometabolic outcomes, the intervention was associated with improved diabetes self-care behaviors and physical quality of life, outcomes that are both clinically relevant and meaningful as patient-centered outcomes.
Significance
Automated telephone self-management with health coach collaborative counseling can be successfully implemented and scaled up by managed care plans serving linguistically and culturally diverse, low-income populations. This health IT intervention model is a viable strategy for improving self-care, conducting surveillance for adverse events, and increasing quality of life among vulnerable populations with chronic illness, potentially reducing health disparities by overcoming barriers experienced in traditional medical care. Additional features to the intervention itself, or changes to the delivery model (e.g. enable prescribing authority) may be necessary to enhance metabolic control. This case study of a collaborative effort between health plan stakeholders and a primary care research network to implement a health IT innovation that provides support to linguistically diverse Medicaid and low-income beneficiaries with diabetes was associated with high rates of engagement, and significantly improved quality of life, but did not appear to alter metabolic parameters. Given the burden of diabetes in low-income communities and increases in diabetes-related utilization that will accompany health reform, providing accessible health IT tools to optimize efficiency in workforce deployment, improve quality, and enable low-income people with diabetes to successfully self-manage their condition is a priority. Automated telephone self-management support with health coaching appears to be a

23
successful health IT tool to engage linguistically and culturally diverse vulnerable populations to improve patient-centered diabetes outcomes, but will require additional features to enhance metabolic control.
Implications
Specific Aim 1 suggests that a patient-directed ATSM with health coach counseling is a viable strategy for engaging linguistically and culturally diverse vulnerable patients with diabetes, and that this intervention model can be scaled up for larger populations so as to improve quality of life and self-care behavior. ATSM-PLUS may differentially improve some patient-centered outcomes, which will be further explored. Specific Aim 2 suggests that diabetes self-management support interventions can be used to monitor adverse events between visits, and that such monitoring may enable interventions prior to harm. Results for Specific Aim 3 suggest that the ATSM interventions in their current format did not affect HbA1c, BP or LDL, with the exception of lower LDL in the wait-list arm, which may have been related to the select group of values we had available for this variable. In the future, we will begin our analyses of utilization outcomes.
References
1. United States. Dept. of Health and Human Services, United States. Agency for Healthcare Research and Quality. 2010 National Healthcare Disparities Report. Rockville, Md.: U.S. Department of Health and Human Services, Agency for Healthcare Research and Quality; 2010.
2. Brown AF, Mangione CM, Saliba D, Sarkisian CA, California Healthcare Foundation/American Geriatrics Society Panel on Improving Care for Elders with Diabetes. Guidelines for improving the care of the older person with diabetes mellitus. J Am Geriatr Soc 2003 May;51(5 Suppl Guidelines):S265-80.
3. Fernandez A, Schillinger D, Warton EM, Adler N, Moffet HH, Schenker Y, et al. Language barriers, physician-patient language concordance, and glycemic control among insured Latinos with diabetes: the Diabetes Study of Northern California (DISTANCE). J Gen Intern Med 2011 Feb;26(2):170-176.
4. Schillinger D, Bindman A, Wang F, Stewart A, Piette J. Functional health literacy and the quality of physician-patient communication among diabetes patients. Patient Educ Couns 2004 Mar;52(3):315-323.
5. Fernandez A, Schillinger D, Grumbach K, Rosenthal A, Stewart AL, Wang F, et al. Physician language ability and cultural competence. An exploratory study of communication with Spanish-speaking patients. J Gen Intern Med 2004 Feb;19(2):167-174.
6. Fang MC, Machtinger EL, Wang F, Schillinger D. Health literacy and anticoagulation-related outcomes among patients taking warfarin. J Gen Intern Med 2006 Aug;21(8):841-846.
7. Castro CM, Wilson C, Wang F, Schillinger D. Babel babble: physicians' use of unclarified medical jargon with patients. Am J Health Behav 2007 Sep-Oct;31 Suppl 1:S85-95.
8. Sudore RL, Landefeld CS, Williams BA, Barnes DE, Lindquist K, Schillinger D. Use of a modified informed consent process among vulnerable patients: a descriptive study. J Gen Intern Med 2006 Aug;21(8):867-873.
9. Sarkar U, Handley MA, Gupta R, Tang A, Murphy E, Seligman HK, et al. What happens between visits? Adverse and potential adverse events among a low-income, urban, ambulatory population with diabetes. Qual Saf Health Care 2010 Jun;19(3):223-228.

24
10. Schillinger D, Barton LR, Karter AJ, Wang F, Adler N. Does literacy mediate the relationship between education and health outcomes? A study of a low-income population with diabetes. Public Health Rep 2006 May-Jun;121(3):245-254.
11. Schillinger D. Misunderstanding prescription labels: the genie is out of the bottle. Ann Intern Med 2006 Dec 19;145(12):926-928.
12. Wolf MS, Davis TC, Shrank W, Rapp DN, Bass PF, Connor UM, et al. To err is human: patient misinterpretations of prescription drug label instructions. Patient Educ Couns 2007 Aug;67(3):293-300.
13. Davis TC, Wolf MS, Bass PF,3rd, Thompson JA, Tilson HH, Neuberger M, et al. Literacy and misunderstanding prescription drug labels. Ann Intern Med 2006 Dec 19;145(12):887-894.
14. Wachter RM. Is ambulatory patient safety just like hospital safety, only without the "stat"? Ann Intern Med 2006 Oct 3;145(7):547-549.
15. Tierney WM. Adverse outpatient drug events--a problem and an opportunity. N Engl J Med 2003 Apr 17;348(16):1587-1589.
16. Sarkar U, Handley MA, Gupta R, Tang A, Murphy E, Seligman HK, et al. Use of an interactive, telephone-based self-management support program to identify adverse events among ambulatory diabetes patients. J Gen Intern Med 2008 Apr;23(4):459-465.
17. Fisher EB, Brownson CA, O'Toole ML, Shetty G, Anwuri VV, Glasgow RE. Ecological approaches to self-management: the case of diabetes. Am J Public Health 2005 Sep;95(9):1523-1535.
18. Institute of Medicine. Committee on Quality of Health Care in America. Crossing the quality chasm: A new health system for the 21st century. Washington, D.C.: National Academy Press; 2001.
19. Naik AD, Palmer N, Petersen NJ, Street RL,Jr, Rao R, Suarez-Almazor M, et al. Comparative effectiveness of goal setting in diabetes mellitus group clinics: randomized clinical trial. Arch Intern Med 2011 Mar 14;171(5):453-459.
20. Sarkar U, Piette JD, Gonzales R, Lessler D, Chew LD, Reilly B, et al. Preferences for self-management support: findings from a survey of diabetes patients in safety-net health systems. Patient Educ Couns 2008 Jan;70(1):102-110.
21. Regenstein M, Huang J, Cummings L, Lessler D, Reilly B, Schillinger D. Caring for patients with diabetes in safety net hospitals and health systems (Publication No. 826). 2005.
22. Eakin EG, Bull SS, Glasgow RE, Mason M. Reaching those most in need: a review of diabetes self-management interventions in disadvantaged populations. Diabetes Metab Res Rev 2002 Jan-Feb;18(1):26-35.
23. Wagner EH, Austin BT, Von Korff M. Improving outcomes in chronic illness. Manag Care Q 1996 Spring;4(2):12-25.
24. Fiscella K, Geiger HJ. Health information technology and quality improvement for community health centers. Health Aff (Millwood) 2006 Mar-Apr;25(2):405-412.
25. Institute of Medicine. Health literacy: A prescription to end confusion. Washington, D.C.: National Academy Press; 2004.
26. Yach D, Hawkes C, Gould CL, Hofman KJ. The global burden of chronic diseases: overcoming impediments to prevention and control. JAMA 2004 Jun 2;291(21):2616-2622.
27. Varkey AB, Manwell LB, Williams ES, Ibrahim SA, Brown RL, Bobula JA, et al. Separate and unequal: clinics where minority and nonminority patients receive primary care. Arch Intern Med 2009 Feb 9;169(3):243-250.
28. Cooper LA, Hill MN, Powe NR. Designing and evaluating interventions to eliminate racial and ethnic disparities in health care. J Gen Intern Med 2002 Jun;17(6):477-486.
29. Glasgow RE, Davis CL, Funnell MM, Beck A. Implementing practical interventions to support chronic illness self-management. Jt Comm J Qual Saf 2003 Nov;29(11):563-574.
30. Beach MC, Gary TL, Price EG, Robinson K, Gozu A, Palacio A, et al. Improving health care quality for racial/ethnic minorities: a systematic review of the best evidence regarding provider and organization interventions. BMC Public Health 2006 Apr 24;6:104.
31. Chin MH, Cook S, Jin L, Drum ML, Harrison JF, Koppert J, et al. Barriers to providing diabetes care in community health centers. Diabetes Care 2001 Feb;24(2):268-274.
25
32. Bonell CP, Hargreaves J, Cousens S, Ross D, Hayes R, Petticrew M, et al. Alternatives to randomisation in the evaluation of public health interventions: design challenges and solutions. J Epidemiol Community Health 2011 Jul;65(7):582-587.
33. Tunis SR, Stryer DB, Clancy CM. Practical clinical trials: increasing the value of clinical research for decision making in clinical and health policy. JAMA 2003 Sep 24;290(12):1624-1632.
34. Green LW. Making research relevant: if it is an evidence-based practice, where's the practice-based evidence? Fam Pract 2008 Dec;25 Suppl 1:i20-4.
35. Schillinger D, Hammer H, Wang F, Palacios J, McLean I, Tang A, et al. Seeing in 3-D: examining the reach of diabetes self-management support strategies in a public health care system. Health Educ Behav 2008 Oct;35(5):664-682.
36. Schillinger D, Handley M, Wang F, Hammer H. Effects of self-management support on structure, process, and outcomes among vulnerable patients with diabetes: a three-arm practical clinical trial. Diabetes Care 2009 Apr;32(4):559-566.
37. Handley MA, Shumway M, Schillinger D. Cost-effectiveness of automated telephone self-management support with nurse care management among patients with diabetes. Ann Fam Med 2008 Nov-Dec;6(6):512-518.
38. Schmittdiel JA, Uratsu CS, Karter AJ, Heisler M, Subramanian U, Mangione CM, et al. Why don't diabetes patients achieve recommended risk factor targets? Poor adherence versus lack of treatment intensification. J Gen Intern Med 2008 May;23(5):588-594.
39. Heisler M, Hogan MM, Hofer TP, Schmittdiel JA, Pladevall M, Kerr EA. When more is not better: treatment intensification among hypertensive patients with poor medication adherence. Circulation 2008 Jun 3;117(22):2884-2892.
40. U.S. Department of Health and Human Services, Office of Disease Prevention and Health Promotion. National Action Plan to Improve Health Literacy. Washington, D.C.: U.S. Department of Health and Human Services, Office of Disease Prevention and
Health Promotion; 2010.
41. Handley MA, Schillinger D, Shiboski S. Quasi-Experimental Designs in Practice-based Research Settings: Design and Implementation Considerations. J Am Board Fam Med 2011 Sep-Oct;24(5):589-596.
42. Brown CA, Lilford RJ. The stepped wedge trial design: a systematic review. BMC Med Res Methodol 2006 Nov 8;6:54.
43. Hussey MA, Hughes JP. Design and analysis of stepped wedge cluster randomized trials. Contemp Clin Trials 2007 Feb;28(2):182-191.
44. American Diabetes Association. Standards of medical care in diabetes--2009. Diabetes Care 2009 Jan;32 Suppl 1:S13-61.
45. National Committee for Quality Assurance. The State of Health Care Quality 2008. Washington, D.C.: National Committee for Quality Assurance; 2008.
46. Ware J,Jr, Kosinski M, Keller SD. A 12-Item Short-Form Health Survey: construction of scales and preliminary tests of reliability and validity. Med Care 1996 Mar;34(3):220-233.
47. Glasgow RE, Whitesides H, Nelson CC, King DK. Use of the Patient Assessment of Chronic Illness Care (PACIC) with diabetic patients: relationship to patient characteristics, receipt of care, and self-management. Diabetes Care 2005 Nov;28(11):2655-2661.
48. Stewart AL, Napoles-Springer AM, Gregorich SE, Santoyo-Olsson J. Interpersonal processes of care survey: patient-reported measures for diverse groups. Health Serv Res 2007 Jun;42(3 Pt 1):1235-1256.
49. Heisler M, Bouknight RR, Hayward RA, Smith DM, Kerr EA. The relative importance of physician communication, participatory decision making, and patient understanding in diabetes self-management. J Gen Intern Med 2002 Apr;17(4):243-252.
50. Toobert DJ, Hampson SE, Glasgow RE. The summary of diabetes self-care activities measure: results from 7 studies and a revised scale. Diabetes Care 2000 Jul;23(7):943-950.

26
List of Publications and Products
1. Handley M, Schillinger D, Shiboski S. Quasi-Experimental Designs in Practice Based Research Settings-Design and Implementation Considerations. Journal of the American Board of Family Medicine. September-October 2011 24:589-596; doi:10.3122/jabfm.2011.05.110067.
2. Sarkar U, Handley M, Gupta R, et al. What happens between visits? Adverse and potential adverse events among a low-income, urban, ambulatory population with diabetes. Qual Saf Health Care 2010 Apr 8; doi:10.1136/qshc.2008.029116.
3. Sarkar U, Schillinger D, Lopez A, et al. Validation of Self-Reported Health Literacy Questions Among Diverse English and Spanish-Speaking Populations. J Gen Intern Med 2010 Nov 6; doi: 10.1007/s11606-010-1552-1.
4. Sarkar U, Karter A, Liu J, et al. The Literacy Divide: Health Literacy and the Use of an Internet-Based Patient Portal in an Integrated Health System—Results from the Diabetes Study of Northern California (DISTANCE). Journal of Health Communication 2010 Sept 15; 15: 1, 183-196.