Embed Size (px)
Citation preview

HART/McINTURFF Study #141503--page 1 Late October 2014 NBC News/Wall Street Journal Survey
Interviews: 1200 registered voters including 826 likely voters, 420 respondents with a cell phone only and 49 respondents reached on a cell phone but who also have a landline Date: October 30 – November 1, 2014 Study #141503 NBC News/Wall Street Journal Survey Please note: all results are shown as percentages unless otherwise stated.
The margin of error for 1200 interviews among Registered Voters is ±2.83% The margin of error for 826 interviews among Likely Voters is ±3.41%
Unless otherwise noted by a “+” or “++”, all previous data shown reflects responses among all adults.
QF1a Are you currently registered to vote [LANDLINE: at this address; CELL: in (STATE)]?
Registered ................................... 100 Not registered .............................. - Not sure ..................................... -
Q2a For statistical purposes only, would you please tell me how old you are? (IF “REFUSED,” ASK:) Well, would
you tell me which age group you belong to? (READ LIST) +
18-24 .................................................................. 12 25-29 .................................................................. 8 30-34 .................................................................. 9 35-39 .................................................................. 5 40-44 .................................................................. 7 45-49 .................................................................. 8 50-54 .................................................................. 9 55-59 .................................................................. 9 60-64 .................................................................. 11 65-69 .................................................................. 7 70-74 .................................................................. 4 75 and over ........................................................ 10 Not sure/refused ............................................... 1
+ Results shown reflect responses among registered voters. Q2b To ensure that we have a representative sample, would you please tell me whether you are from a Hispanic
or Spanish-speaking background? +
Yes, Hispanic ................................................... 9 No, not Hispanic ............................................... 91 Not sure/refused ............................................. -
+ Results shown reflect responses among registered voters. Q2c And again, for statistical purposes only, what is your race--white, black, Asian, or something else? +
White............................................................... 75 Black ............................................................... 13 Asian ............................................................... 1 Other ............................................................... 3 Hispanic (VOL) ............................................. 6 Not sure/refused ........................................... 2 White Non-Hispanic (Q2b:2-3 & Qc:1) ............ 73
+ Results shown reflect responses among registered voters.
48 Male 52 Female

HART/McINTURFF Study #141503--page 2 Late October 2014 NBC News/Wall Street Journal Survey
Q3 Are you currently registered to vote [LANDLINE: at this address; CELL: in (STATE)]?
Registered ................................... 100 Not registered .............................. - Not sure ..................................... -
Q4 All in all, do you think that things in the nation are generally headed in the right direction, or do you feel that
things are off on the wrong track?
High Low
10/30-
11/1/14+ 10/8-
12/14+ 9/14+ 8/14 6/14 4/14 3/14 1/14
9/01 10/17-20/08+
Headed in the right direction ..... 27 25 23 22 25 27 26 28 72 12 Off on the wrong track .............. 63 65 67 71 63 63 65 63 11 78 Mixed (VOL) ........................... 6 6 6 5 7 6 5 5 11 7 Not sure .................................. 4 4 4 2 5 4 4 4 6 3
12/13 10/25-28/13
10/7-9/13 9/13 7/13 6/13 4/13 2/13 1/13 12/12
29 22 14 30 29 32 31 32 35 41 64 70 78 62 61 59 61 59 57 53 5 4 4 5 6 6 5 6 4 3 2 4 4 3 4 3 3 3 4 3
10/12+ 9/26-
30/12+ 9/12-
16/12+ 8/12+ 7/12+ 6/12 5/12 4/12 3/12 1/12 41 40 39 32 32 31 33 33 33 30 53 53 55 61 60 61 58 59 58 61 4 5 4 4 5 5 5 6 5 5 2 2 2 3 3 3 4 2 4 4 12/11 11/11 10/11 8/11 7/11 6/11 5/11 4/11 2/11 1/11 22 19 17 19 25 29 36 28 31 35 69 73 74 73 67 62 50 63 60 56 6 5 5 5 5 6 10 6 6 5 3 3 4 3 3 3 4 3 3 4
12/10 11/10 10/28-30/10+
10/14-18/10+ 9/10
8/26-30/10
8/5-9/10
6/10
5/6-11/10
3/10
28 32 31 32 32 30 32 29 34 33 63 58 60 59 59 61 58 62 56 59 6 6 5 6 5 6 6 5 6 5 3 4 4 3 4 3 4 4 4 3
1/23 -25/10
1/10-14/10 12/09 10/09 9/09 7/09 6/09 4/09 2/09 1/09
32 34 33 36 39 39 42 43 41 26 58 54 55 52 48 49 46 43 44 59 7 10 10 9 10 9 9 10 9 9 3 2 2 3 3 3 3 4 6 6
+ Results shown reflect responses among registered voters. 1
The historical trend data for this item does not include every survey in which this item has been asked.

HART/McINTURFF Study #141503--page 3 Late October 2014 NBC News/Wall Street Journal Survey
Q5 In general, do you approve or disapprove of the job Barack Obama is doing as president? High Low
10/30-
11/1/14+ 10/8-
12/14+ 9/14+ 8/14 6/14 4/14 3/14 1/14 12/13 4/09 9/14+ Approve ....... 42 42 40 40 41 44 41 43 43 61 40 Disapprove .. 52 52 54 54 53 50 54 51 54 30 54 Not sure ..... 6 6 6 6 6 6 5 6 3 9 6
10/25-28/13
10/7-9/13 9/13 8/13 7/13 6/13 4/13 2/13 1/13 12/12
42 47 45 44 45 48 47 50 52 53 51 48 50 48 50 47 48 45 44 43 7 5 5 8 5 5 5 5 4 4
10/12+ 9/26-
30/12+ 9/12-
16/12+ 8/12+ 7/12+ 6/12 5/12 4/12 3/12 1/12 49 49 50 48 49 47 48 49 50 48 48 48 48 49 48 48 46 46 45 46 3 3 2 3 3 5 6 5 5 6 12/11 11/11 10/11 8/11 7/11 6/11 5/11 4/11 2/11 1/11 46 44 44 44 47 49 52 49 48 53 48 51 51 51 48 46 41 45 46 41 6 5 5 5 5 5 7 6 6 6
12/10 11/10
10/28- 30/10+
10/14-18/10+ 9/10
8/26-30/10
8/5-9/10
6/10
5/20-23/10
5/6-11/10
45 47 45 47 46 45 47 45 48 50 48 47 50 49 49 49 48 48 45 44 7 6 5 4 5 6 5 7 7 6
3/10
1/23-25/10
1/10-14/10
12/09
10/09
9/09
8/09
7/09
6/09
4/09
2/09
48 50 48 47 51 51 51 53 56 61 60 47 44 43 46 42 41 40 40 34 30 26 5 6 9 7 7 8 9 7 10 9 14
+ Results shown reflect responses among registered voters.

HART/McINTURFF Study #141503--page 4 Late October 2014 NBC News/Wall Street Journal Survey
Q6 Now I'm going to read you the names of several public figures, groups and organizations, and I'd like you to rate your feelings toward each one as very positive, somewhat positive, neutral, somewhat negative, or very negative. If you don't know the name, please just say so. (RANDOMIZE EXCEPT BARACK OBAMA)
Very Positive
Somewhat
Positive
Neutral
Somewhat Negative
Very
Negative
Don't Know Name/
Not Sure Barack Obama1 Oct. 30 – Nov. 1, 2014+ ............... 23 20 12 13 32 - October 8-12, 2014+ .................... 21 22 11 12 34 - September 2014+ ........................ 22 20 11 13 33 1 August 2014 ................................. 22 18 13 14 33 - June 2014 .................................... 20 21 13 14 31 1 April 2014 ..................................... 24 20 15 13 28 - March 2014 .................................. 21 20 15 14 30 - January 2014 ............................... 23 19 13 14 30 1 December 2013 ............................ 22 20 11 13 33 1 October 25-28, 2013 .................... 24 17 13 13 32 1 October 7-9, 2013 ........................ 26 21 11 11 30 1 September 2013 ........................... 25 20 12 16 26 1 July 2013 ...................................... 28 20 12 14 26 - May 30-June 2, 2013 ................... 28 19 13 12 28 - April 2013 ..................................... 30 17 10 15 27 1 February 2013 .............................. 31 18 11 14 26 - January 2013 ............................... 31 21 11 11 26 - December 2012 ............................ 37 16 9 14 24 - October 2012+ ............................. 34 15 8 12 31 - September 26-30, 2012+ ............. 37 15 6 11 31 - August 2012+ ............................... 31 17 8 13 30 1 July 2012+ .................................... 33 16 8 11 32 - June 2012 .................................... 29 19 14 11 27 - May 2012 ..................................... 32 17 10 12 29 - April 2012 ..................................... 30 18 13 13 26 - March 2012 .................................. 28 21 14 12 25 - January 2012 ............................... 28 22 10 14 25 1 December 2011 ............................ 22 23 13 15 27 - November 2011 ............................ 26 19 15 13 27 - October 2011 ............................... 23 23 14 12 28 - August 2011 ................................. 24 20 12 14 30 - June 2011 .................................... 27 22 14 13 24 - May 2011 ..................................... 33 21 14 13 18 1 April 2011 ..................................... 28 22 14 13 23 - February 2011 .............................. 28 21 15 15 20 1 January 2011 ............................... 29 23 15 14 18 1 December 2010 ............................ 25 23 14 14 24 - November 2010 ............................ 28 21 12 13 26 - October 28-30, 2010+ .................. 29 18 12 15 27 - September 2010 ........................... 29 18 12 14 27 - August 26-30, 2010 ...................... 26 20 12 14 27 1 June 2010 .................................... 27 20 13 15 25 - May 20-23, 2010 .......................... 28 19 15 14 24 - March 2010 .................................. 31 19 11 14 24 1 January 23-25, 2010 .................... 29 23 14 14 20 - December 2009 ............................ 29 21 13 15 22 - October 2009 ............................... 36 20 11 12 21 - September 2009 ........................... 38 18 11 14 19 - February 2009 .............................. 47 21 12 9 10 1 January 2009 ............................... 43 23 17 8 6 3 Barack Obama High February 2009 .................................... 47 21 12 9 10 1 Presidential Term Low August 2014 ........................................ 22 18 13 14 33 - All-time Obama Low October 28-30, 2006+ ......................... 14 17 18 5 6 40 + Results shown reflect responses among registered voters.
1 The historical trend data for this item does not include every survey in which this item has been asked.

HART/McINTURFF Study #141503--page 5 Late October 2014 NBC News/Wall Street Journal Survey
Q6 (cont'd)
Very Positive
Somewhat
Positive
Neutral
Somewhat Negative
Very
Negative
Don't Know Name/
Not Sure The Democratic Party1 Oct. 30 – Nov. 1, 2014+ ............... 12 24 19 20 23 2 October 8-12, 2014+ .................... 12 25 20 20 23 1 September 2014+ ......................... 11 25 22 20 22 - June 2014 .................................... 13 25 21 18 22 1 April 2014 ..................................... 13 23 24 19 18 3 March 2014 .................................. 14 21 25 18 20 2 January 2014 ............................... 10 27 22 20 20 1 December 2013 ............................ 10 26 19 20 24 1 October 25-28, 2013 .................... 15 22 21 18 22 2 October 7-9, 2013 ........................ 14 25 18 20 20 3 September 2013 ........................... 13 27 22 20 18 - May 30-June 2, 2013.................... 14 25 22 19 18 2 February 2013 .............................. 18 23 22 17 19 1 January 2013 ............................... 17 27 17 19 19 1 December 2012 ............................ 21 23 19 16 19 2 October 2012+ ............................. 21 21 17 17 23 1 September 26-30, 2012+ ............. 21 21 17 17 22 2 August 2012+ ............................... 19 23 16 17 23 2 July 2012+ .................................... 17 23 20 17 23 - June 2012 .................................... 14 23 25 18 19 1 May 2012 ..................................... 17 22 19 21 19 1 April 2012 ..................................... 15 24 21 19 19 1 March 2012 .................................. 15 23 24 18 18 2 January 2012 ............................... 15 23 23 21 18 - December 2011 ............................ 9 23 25 23 19 1 November 2011 ............................ 15 25 22 18 19 1 October 2011 ............................... 12 25 19 20 22 2 August 2011 ................................. 11 22 21 19 25 2 June 2011 .................................... 13 25 21 19 20 2 May 2011 ..................................... 15 26 22 18 17 2 April 2011 ..................................... 12 26 22 18 21 1 January 2011 ............................... 15 24 25 19 16 1 December 2010 ............................ 9 28 20 18 23 2 November 2010 ............................ 14 26 18 18 23 1 October 28-30, 2010+ .................. 16 23 17 19 23 2 October 14-18, 2010+ .................. 14 24 16 19 26 1 September 2010 ........................... 15 22 20 20 22 1 August 26-30, 2010 ...................... 11 25 19 19 24 2 August 5-9, 2010 .......................... 11 22 22 18 26 1 June 2010 .................................... 11 24 21 20 24 - May 20-23, 2010 .......................... 15 26 18 18 22 1 May 6-11, 2010 ............................ 11 26 19 18 24 2 March 2010 .................................. 9 28 19 19 24 1 January 23-25, 2010 .................... 14 25 22 17 21 1 January 10-14, 2010 .................... 11 27 20 18 23 1 December 2009 ............................ 10 25 19 19 26 1 October 2009 ............................... 14 28 20 14 22 2 September 2009 ........................... 14 27 18 17 22 2 July 2009 ...................................... 13 29 19 17 20 2 June 2009 .................................... 19 26 16 16 21 2 April 2009 ..................................... 17 28 19 15 19 2 February 2009 .............................. 20 29 18 14 17 2 December 2008 ............................ 17 32 22 15 13 1 High January 2000 ............................... 20 30 23 15 10 2 Low July 2006 ...................................... 7 25 27 22 17 2 + Results shown reflect responses among registered voters. 1 The historical trend data for this item does not include every survey in which this item has been asked.

HART/McINTURFF Study #141503--page 6 Late October 2014 NBC News/Wall Street Journal Survey
Q6 (cont'd)
Very Positive
Somewhat
Positive
Neutral
Somewhat Negative
Very
Negative
Don't Know Name/
Not Sure The Republican Party1 Oct. 30 – Nov. 1, 2014+ ............... 7 22 23 23 24 1 October 8-12, 2014+ .................... 6 21 21 25 25 2 September 2014+ ........................ 9 22 26 20 21 2 June 2014 .................................... 6 23 24 22 23 2 April 2014..................................... 6 19 29 22 22 2 March 2014 .................................. 7 20 27 21 24 1 January 2014 ............................... 5 19 28 22 25 1 December 2013 ........................... 6 20 22 26 25 1 October 25-28, 2013 .................... 6 16 24 23 30 1 October 7-9, 2013 ........................ 7 17 21 24 29 2 September 2013 .......................... 7 21 27 23 21 1 May 30-June 2, 2013 ................... 8 24 26 18 23 1 February 2013 ............................. 8 21 24 20 26 1 January 2013 ............................... 6 20 24 24 25 1 December 2012 ........................... 9 21 23 18 27 2 October 2012+ ............................. 15 21 20 18 25 1 September 26-30, 2012+ ............. 14 24 18 18 25 1 August 2012+ .............................. 12 24 18 16 29 1 July 2012+ ................................... 11 23 22 18 25 1 June 2012 .................................... 10 21 23 18 26 2 May 2012 ..................................... 9 23 23 19 24 2 April 2012..................................... 11 22 23 19 24 1 March 2012 .................................. 8 24 23 19 24 2 January 2012 ............................... 8 23 24 19 25 1 December 2011 ........................... 6 21 23 23 25 2 November 2011 ........................... 9 21 23 18 26 3 October 2011 ............................... 11 22 21 18 26 2 August 2011 ................................. 8 24 21 23 23 1 June 2011 .................................... 8 22 24 23 21 2 May 2011 ..................................... 8 24 22 21 23 2 April 2011..................................... 7 24 24 22 22 1 January 2011 ............................... 7 27 24 21 19 2 December 2010 .......................... 11 27 23 17 20 2 November 2010 .......................... 11 23 24 20 19 3 October 28-30, 2010+ .................. 12 22 24 18 23 1 October 14-18, 2010+ .................. 8 23 25 19 23 2 September 2010 .......................... 8 23 25 21 22 1 August 26-30, 2010 ..................... 7 23 25 22 21 2 August 5-9, 2010 ......................... 6 18 28 24 22 2 June 2010 .................................... 6 24 26 23 19 2 May 20-23, 2010 .......................... 10 23 26 21 19 1 May 6-11, 2010 ............................ 8 22 26 22 20 2 March 2010 .................................. 6 25 24 20 23 2 January 23-25, 2010 .................... 7 25 27 18 20 3 January 10-14, 2010 .................... 7 23 27 24 18 1 December 2009 ........................... 5 23 27 24 19 2 October 2009 ............................... 6 19 27 23 23 2 September 2009 .......................... 5 23 27 22 21 2 July 2009 ..................................... 9 19 29 21 20 2 June 2009 .................................... 6 19 29 23 21 2 April 2009..................................... 7 22 25 22 22 2 February 2009 ............................. 7 19 24 25 22 3 High December 2001 ........................... 21 36 18 13 9 3 Low October 25-28, 2013 .................... 6 16 24 23 30 1 + Results shown reflect responses among registered voters.
1 The historical trend data for this item does not include every survey in which this item has been asked.

HART/McINTURFF Study #141503--page 7 Late October 2014 NBC News/Wall Street Journal Survey
Q6 (cont'd)
Very Positive
Somewhat
Positive
Neutral
Somewhat Negative
Very
Negative
Don't Know Name/
Not Sure The Tea Party Movement Oct. 30 – Nov. 1, 2014+* .............. 7 13 26 13 29 12 October 8-12, 2014+ .................... 6 13 23 15 31 12 September 2014+ ........................ 7 15 25 14 31 8 June 2014 .................................... 8 14 26 13 28 11 April 2014 ..................................... 7 15 26 15 26 11 March 2014 .................................. 9 14 25 13 28 11 December 2013 ........................... 10 14 21 14 31 10 October 25-28, 2013 .................... 9 14 22 10 37 8 October 7-9, 2013 ........................ 9 12 20 13 34 12 September 2013 .......................... 9 16 23 15 27 10 May 30-June 2, 2013 ................... 11 15 26 13 25 11 January 2013 ............................... 9 14 20 15 32 10 July 2012+ ................................... 14 14 23 14 29 6 April 2012 ..................................... 10 17 23 11 27 12 January 2012 ............................... 10 18 19 16 27 10 December 2011 ........................... 10 17 21 15 28 9 November 2011 ........................... 12 15 21 14 30 8 October 2011 ............................... 12 16 21 12 29 10 August 2011 ................................. 11 17 20 14 29 9 June 2011 .................................... 13 15 20 14 27 11 April 2011 ..................................... 13 16 20 14 30 7 January 2011 ............................... 13 16 22 14 24 11 December 2010 ........................... 15 18 20 14 23 10 November 2010 ........................... 14 16 21 13 25 11 October 28-30, 2010+ .................. 14 18 18 12 28 10 October 14-18, 2010+ .................. 14 16 20 11 27 12 September 2010 .......................... 15 15 21 13 23 13 August 26-30, 2010 ...................... 12 16 19 12 24 17 August 5-9, 2010 .......................... 14 16 23 12 22 13 June 2010 .................................... 15 19 21 12 19 14 May 6-11, 2010 ............................ 16 15 21 10 20 18 March 2010 .................................. 13 16 22 10 18 21 January 23-25, 2010 .................... 14 14 20 6 15 31 High June 2010 .................................... 15 19 21 12 19 14 Low October 8-12, 2014+ .................... 6 13 23 15 31 12 Democrats in Congress Oct. 30 – Nov. 1, 2014+* .............. 9 22 19 21 25 4 August 2014 ................................. 8 23 21 22 24 2 January 2003 ............................... 9 30 30 18 11 2 April 2002 ..................................... 11 31 28 17 11 2 The Centers for Disease Control and Prevention, or CDC Oct. 30 – Nov. 1, 2014+** ............ 18 27 25 14 12 4 October 8-12, 2014+ .................... 19 30 25 14 8 4 Republicans in Congress Oct. 30 – Nov. 1, 2014+** ............ 5 19 21 20 32 3 August 2014 ................................. 4 15 24 24 30 3 January 2003 ............................... 12 31 25 18 12 2 April 2002 ..................................... 10 33 28 15 11 3 * Asked of one-half the respondents (FORM A). ** Asked of one-half the respondents (FORM B). + Results shown reflect responses among registered voters.

HART/McINTURFF Study #141503--page 8 Late October 2014 NBC News/Wall Street Journal Survey
SUMMARY TABLE OF IMAGES – BY D/S (POSITIVE – NEGATIVE)
TOTAL POSITIVE
TOTAL NEGATIVE
D/S
The Centers for Disease Control and Prevention, or CDC ............. 45 26 19 Barack Obama ................................................................................ 43 45 -2 The Democratic Party ..................................................................... 36 43 -7 Democrats in Congress .................................................................. 31 46 -15 The Republican Party ..................................................................... 29 47 -18 The Tea Party Movement ............................................................... 20 42 -22 Republicans in Congress ................................................................ 24 52 -28
Moving on… Q7 Of the following issues, please tell me which one or two are going to be most important to you in deciding
your vote for Congress. (IF MORE THAN TWO, ASK:) Well, if you had to pick just one or two, which would they be? (RECORD FIRST AND SECOND CHOICE, RANDOMIZE) +
THIS TABLE HAS BEEN RANKED BY COMBINED CHOICE 1st
Choice Comb Choice
Job creation and economic growth .............................................................. 23 41 Breaking the partisan gridlock in Washington to get things done ................ 23 36 The deficit and government spending .......................................................... 12 23 Health care .................................................................................................. 9 22 Social Security and Medicare ...................................................................... 9 19 Military action against ISIS, the Islamic State in Iraq and Syria ................... 7 19 Immigration .................................................................................................. 7 14 Looking out for the interests of women ........................................................ 4 9 The Ebola outbreak ..................................................................................... 2 6 Other (VOL) ............................................................................................... 1 2 All equally (VOL) ........................................................................................ 3 3 None of these (VOL) .................................................................................. - 1 Not sure ..................................................................................................... - 2 + Results shown reflect responses among registered voters
OCTOBER 8-12, 2014 + 1st
Choice Comb Choice
Job creation and economic growth .............................................................. 23 44 Breaking the partisan gridlock in Washington to get things done ................ 23 33 Military action against ISIS, the Islamic State in Iraq and Syria ................... 12 29 Health care .................................................................................................. 8 22 Social Security and Medicare ...................................................................... 11 19 The deficit and government spending .......................................................... 7 18 Immigration .................................................................................................. 7 14 Looking out for the interests of women ........................................................ 3 9 Other (VOL) ............................................................................................... 1 2 All equally (VOL) ........................................................................................ 3 4 None of these (VOL) .................................................................................. 1 1 Not sure ..................................................................................................... 1 1 + Results shown reflect responses among registered voters
October 14-18, 2010 + 1st
Choice Comb Choice
Job creation and economic growth .............................................................. 36 51 Health care .................................................................................................. 13 23 The deficit and government spending .......................................................... 13 20 Social Security and Medicare ...................................................................... 9 16 The wars in Afghanistan and Iraq ................................................................ 7 13 Illegal immigration ........................................................................................ 6 11 The mortgage and housing situation ........................................................... 4 10 Terrorism ..................................................................................................... 3 5 Other (VOL) ............................................................................................... 1 1 All equally (VOL) ........................................................................................ 6 6 None of these (VOL) .................................................................................. - - Not sure ..................................................................................................... 1 1 + Results shown reflect responses among registered voters

HART/McINTURFF Study #141503--page 9 Late October 2014 NBC News/Wall Street Journal Survey
Q8 Which of the following sets of issues is more important to you in your vote for Congress–– (ROTATE) – Set A: issues such as the economy, health care, and Social Security and Medicare, or Set B: issues such as dealing with the Ebola virus, military action against ISIS in Iraq and Syria, and Russia’s actions in the Ukraine? +
All Dem. Ind. GOPSet A: Economy, health care, Social Security and Medicare ...... 77 85 75 69 Set B: Ebola, ISIS, and Russia’s actions .................................... 19 12 21 26 Both equally (VOL) ................................................................... 3 2 4 5 Not sure ..................................................................................... 1 1 - - + Results shown reflect responses among registered voters
SEPTEMBER 2014+ Which is more important to you in your vote for Congress this November––domestic issues such as the economy, health care, and immigration, or international issues
such as Iraq, Russia, and terrorism? All Dem. Ind. GOP Domestic issues ............................................ 64 67 64 57 International issues ....................................... 22 21 19 27 Both equally important (VOL) ...................... 13 10 17 15 Not sure ...................................................... 1 2 - 1 + Results shown reflect responses among registered voters.
SEPTEMBER 2006+ Which is more important to you in your vote for Congress this November––domestic issues such as the economy, health care, and immigration, or international issues
such as Iraq, Iran, and terrorism?
All Dem. Ind. GOP Domestic issues ............................................. 43 49 49 34 International issues ........................................ 28 24 24 34 Both equally important (VOL) ....................... 28 27 25 31 Not sure ....................................................... 1 - 2 1 + Results shown reflect responses among registered voters.

HART/McINTURFF Study #141503--page 10 Late October 2014 NBC News/Wall Street Journal Survey
And, thinking again about the election being held on Tuesday… Q9 Please tell me how interested you are in Tuesday’s elections, using a scale from one to ten, on which a "ten"
means that you are very interested in Tuesday’s elections and a "one" means that you are not at all interested. You may choose any number from one to ten. (IF "NOT SURE," RECORD AS "DK.")
10/30-
11/1/14+ 10/8-
12/14+ 9/14+ 8/14+ 6/14+ 4/14+ 3/14+ 10/28-30/10+
10/14-18/10+
10, very interested ..................... 49 44 44 43 43 45 41 52 51 9 ................................................. 6 6 7 8 8 6 6 9 10 8 ................................................. 14 14 16 14 16 16 17 14 13 7 ................................................. 10 11 9 10 10 10 11 9 9 6 ................................................. 6 5 7 7 6 7 8 4 5 5 ................................................. 7 10 8 7 8 7 9 5 7 4 ................................................. 2 2 2 3 1 1 3 2 1 3 ................................................. 2 2 3 3 3 2 1 2 1 2 ................................................. 1 1 1 2 1 2 1 1 1 1, not interested at all ................. 3 4 3 3 3 3 3 2 2 Cannot rate .............................. - - - - 1 1 - - -
9/10+ 8/26-
30/10+ 8/5-
9/10+ 6/10+ 5/6-
10/10+ 3/10+ 1/23-
25/10+ 1/10-14/10
50 47 49 44 47 47 41 44 7 6 9 7 7 6 6 5 14 15 13 13 14 15 16 12 11 10 9 11 8 9 10 10 5 5 4 6 5 5 5 7 5 8 7 10 9 9 14 11 2 2 2 2 2 2 2 2 2 1 2 2 2 3 2 2 1 2 1 1 2 - 1 1 4 3 4 3 3 4 3 5 - - - 1 1 - - 1
12/09 10/13- 16/06+
9/30- 10/2/06+
9/8- 11/06+
7/06+
6/06+
4/06+
3/06+
1/06+
48 53 46 47 51 47 49 45 46 6 8 9 8 9 8 7 7 7 12 14 17 16 17 17 17 18 15 10 7 12 10 10 9 10 11 12 5 6 5 5 4 5 5 5 5 9 5 6 8 6 8 7 7 7 2 2 1 2 2 1 2 1 2 2 1 2 1 - 2 - 2 1 1 1 - - - 1 1 1 1 5 3 2 2 1 2 2 3 4 - - - 1 - - - - - + Results shown reflect responses among registered voters.

HART/McINTURFF Study #141503--page 11 Late October 2014 NBC News/Wall Street Journal Survey
Q10 What is your preference for the outcome of Tuesday’s congressional elections -- (ROTATE:) a Congress controlled by Republicans or a Congress controlled by Democrats?
LIKELY VOTERS++ 10/30-
11/1/14 10/8- 12/14
11/1- 3/12
10/17-20/12
10/28- 30/10
10/14-18/10
Republican-controlled Congress ...... 46 46 45 45 49 50 Democrat-controlled Congress ........ 45 44 47 45 43 43 Not sure ......................................... 9 10 8 10 8 7 ++ Results shown reflect responses among N=826 likely voters who voted in both 2010 and 2012 and are a 7-10 on the interest scale (Q9) and all remaining voters who are 9-10 on the interest scale.
REGISTERED VOTERS+
10/30-
11/1/14+ 10/8-
12/14+ 9/14+ 8/14+ 6/14+ 4/14+ 3/14+ 1/14+ 12/13+ 10/25- 28/13+
10/7- 9/13+
Republican-controlled Congress ..... 42 42 45 44 43 45 44 43 44 41 39 Democrat-controlled Congress ....... 46 46 43 43 45 45 43 45 42 45 47 Not sure .......................................... 12 12 12 13 12 10 13 12 14 14 14
9/13+ 7/13+ 6/13+ 10/12+ 9/26-
30/12+ 8/12+ 7/12+ 6/12+ 5/12+ 4/12+ 43 44 42 43 43 42 45 44 43 44 46 44 45 45 47 47 46 45 44 46 11 12 13 12 10 11 9 11 13 10
3/12+ 1/12+ 12/11+ 11/11+ 10/11+ 8/11+ 6/11+ 10/28-30/10+
10/14-18/10+ 9/10+
41 41 43 43 41 47 44 46 44 44 46 47 45 46 45 41 44 44 46 44 13 12 12 11 14 12 12 10 10 12
8/26-
30/10+ 8/5-
9/10+ 6/10+ 5/20-
23/10+ 5/6-
11/10+
3/10+ 1/23-
25/10+ 1/10-
14/10+ 12/09+ 10/09+ 43 42 45 44 44 42 42 41 41 38 43 43 43 43 44 45 44 41 43 46 14 15 12 13 12 13 14 18 16 16 9/09+ 7/09+ 4/09+ 11/08+ 10/08+ 9/08+ 8/08+ 7/08+ 6/08+ 4/08+ 40 39 39 36 36 37 36 36 33 34 43 46 48 48 49 50 47 49 52 49 17 15 13 16 15 13 17 15 15 17 3/08+ 11/07+ 9/07+ 10/06+ 9/06+ 7/06+ 6/06+ 4/06+ 3/06+ 1/06+ 12/05+ 35 37 35 37 39 38 38 39 37 38 38 49 46 47 52 48 48 49 45 50 47 46 16 17 18 11 13 14 13 16 13 15 16 11/05+ 10/05+ 7/05+ 5/05+ 10/04+ 9/04+ 6/04+ 5/04+ 3/04+ 1/04 12/13/03 37 39 40 40 43 42 42 41 42 42 42 48 48 45 47 44 46 44 44 45 43 42 15 13 15 13 13 12 14 15 13 15 16 10/02+ 9/02 7/02 6/02 1/02 12/01 12/99 10/99 7/99 6/99 4/99 43 42 43 42 44 42 40 39 39 42 41 42 42 41 41 40 40 44 41 43 41 40 15 16 16 17 16 18 16 20 18 17 19 3/99 10/98+ 9/98 7/98 6/98 2/98 1/98 12/97 9/97 7/97 4/97 37 41 40 41 39 41 40 41 41 45 44 43 43 39 40 40 37 42 37 39 39 38 20 16 21 19 21 22 18 22 20 16 18 + Results shown reflect responses among registered voters.

HART/McINTURFF Study #141503--page 12 Late October 2014 NBC News/Wall Street Journal Survey
ASKED ONLY OF RESPONDENTS WHO PREFERED A REPUBLICAN-CONTROLLED CONGRESS (Q10:1) Q11a Is your preference for a Republican-controlled Congress a vote in protest against the performance of the
Obama Administration, a vote in protest against the performance of Democrats in Congress, or is it more of a positive vote for the Republicans in Congress?
10/30-
11/1/14+ 10/28-30/10+
8/26-30/10+
Protest the performance of the Obama Administration......................................... 25 15 12 Protest the performance of Democrats in Congress^ ........................................... 19 20 28 Positive vote for Republicans in Congress^^ ........................................................ 45 48 46 Protest both Administration and Democrats in Congress (VOL) ....................... 6 10 7 Both a vote for Republicans and against Democrats in Congress (VOL) .......... 2 4 3 None of these (VOL) ......................................................................................... 2 2 1 Do not plan to vote (VOL) .................................................................................. - - - Not sure ............................................................................................................ 1 1 3 + Results shown reflect responses among registered voters. ^ In Late October 2010, the option read “ Protest the performance of Speaker Nancy Pelosi and Democrats in Congress.” ^^ Before 2014, the item did not include the words “in Congress.”
ASKED ONLY OF RESPONDENTS WHO PREFERED A DEMOCRAT-CONTROLLED CONGRESS (Q10:2) Q11b Is your preference for a Democrat-controlled Congress a vote in protest against the performance of the
Republicans in Congress, more of a positive vote for the Democrats in Congress, or is it more of a positive vote for the Obama administration? +
Protest the performance of the Republicans in Congress ........................... 27 Positive vote for Democrats in Congress .................................................... 41 Positive vote for the Obama Administration ................................................ 26 Both a vote for Democrats and against Republicans (VOL) ..................... 1 None of these (VOL) ................................................................................ 2 Do not plan to vote (VOL) ........................................................................ - Not sure .................................................................................................. 3 + Results shown reflect responses among registered voters.

HART/McINTURFF Study #141503--page 13 Late October 2014 NBC News/Wall Street Journal Survey
Q12a If you had the choice in your congressional district, would you be more likely to vote for a (ROTATE:) Republican, Democratic, Libertarian, or Green Party…candidate for Congress?
LIKELY VOTERS++ 10/30-
11/1/14 10/8- 12/14
10/28- 30/10
10/14- 18/10
Republican candidate ................ 41 39 44 47 Democratic candidate ................ 43 41 43 41 Libertarian candidate ................. 7 9 5 6 Green Party candidate ............... 4 3 2 2 Not sure ................................... 5 8 6 4 ++ Results shown reflect responses among N=826 likely voters who voted in both 2010 and 2012 and are a 7-10 on the interest scale (Q9) and all remaining voters who are 9-10 on the interest scale.
REGISTERED VOTERS+ 10/30-
11/1/14+10/8-
12/14+ 10/28- 30/10+
10/14-18/10+
Republican candidate ................ 39 36 41 41 Democratic candidate ................ 42 43 44 44 Libertarian candidate ................. 8 9 5 5 Green Party candidate ............... 4 4 2 3 Not sure ................................... 7 8 8 7 + Results shown reflect responses among registered voters.
ASKED ONLY OF RESPONDENTS WHO CHOSE LIBERTARIAN, GREEN, OR NOT SURE (Q12a:3-5) Q12b But, if it came down to just a choice between (ROTATE:) a Republican and a Democratic…candidate for
Congress, for whom would you vote?
LIKELY VOTERS++ 10/30-
11/1/1410/8- 12/14
10/28- 30/10
10/14- 18/10
Republican candidate ............. 39 46 51 45 Democratic candidate ............. 36 28 24 32 Depends (VOL) .................... 13 14 17 11 Wouldn’t vote (VOL) ............. 2 3 5 4 Not sure ................................ 10 9 3 8 ++ Results shown reflect responses among N=826 likely voters who voted in both 2010 and 2012 and are a 7-10 on the interest scale (Q9) and all remaining voters who are 9-10 on the interest scale.
REGISTERED VOTERS+ 10/30-
11/1/14+10/8-
12/14+10/28- 30/10+
10/14-18/10+
Republican candidate ............ 39 36 40 39 Democratic candidate ............ 34 31 29 33 Depends (VOL) .................... 13 17 16 11 Wouldn’t vote (VOL)............. 6 7 7 6 Not sure ............................... 8 9 8 11 + Results shown reflect responses among registered voters.

HART/McINTURFF Study #141503--page 14 Late October 2014 NBC News/Wall Street Journal Survey
RECALCULATED COMBINED BALLOT OF Q12a AND Q12b
LIKELY VOTERS++ 10/30-
11/1/1410/8- 12/14
10/28- 30/10
10/14- 18/10
Republican candidate ............. 48 48 51 52 Democratic candidate ............. 48 47 46 45 Depends (VOL) .................... 2 3 2 1 Wouldn’t vote (VOL) ............. - 1 1 1 Not sure ................................ 2 1 - - ++ Results shown reflect responses among N=826 likely voters who voted in both 2010 and 2012 and are a 7-10 on the interest scale (Q9) and all remaining voters who are 9-10 on the interest scale.
REGISTERED VOTERS+ 10/30-
11/1/14+10/8-
12/14+10/28- 30/10+
10/14-18/10+
Republican candidate ............ 46 44 47 47 Democratic candidate ............ 49 49 48 49 Depends (VOL) .................... 2 4 3 2 Wouldn’t vote (VOL)............. 1 1 1 1 Not sure ............................... 2 2 1 1 + Results shown reflect responses among registered voters.

HART/McINTURFF Study #141503--page 15 Late October 2014 NBC News/Wall Street Journal Survey
Thinking more about the election on Tuesday… (Q13 AND Q14 ROTATED) Q13 Have you received any mail, e-mail, telephone calls, contact on social media like Facebook or Twitter or any
other personal contact encouraging you to vote for a Republican candidate for U.S. Congress?
LIKELY
VOTERS++ REGISTERED
VOTERS+ Yes .................................... 52 47 No ..................................... 45 51 Not sure ......................... 3 2 ++ Results shown reflect responses among N=826 likely voters who voted in both 2010 and 2012 and are a 7-10 on the interest scale (Q9) and all remaining voters who are 9-10 on the interest scale. + Results shown reflect responses among registered voters.
Q14 Have you received any mail, e-mail, telephone calls, contact on social media like Facebook or Twitter or any
other personal contact encouraging you to vote for a Democratic candidate for U.S. Congress?
LIKELY
VOTERS++ REGISTERED
VOTERS+ Yes .................................... 54 48 No ..................................... 43 50 Not sure ......................... 3 2 ++ Results shown reflect responses among N=826 likely voters who voted in both 2010 and 2012 and are a 7-10 on the interest scale (Q9) and all remaining voters who are 9-10 on the interest scale. + Results shown reflect responses among registered voters.
2006 VOTER CONTACT TREND
October 28-30, 2006
Within the past thirty days have you been directly contacted at your home, either by telephone or in person,
by one of the political parties or a congressional campaign? (IF "YES," ASK:) Were you contacted by the Republican Party or candidate or the Democratic Party or
candidate?+
Yes, Contacted ................................................... 47 Republican Party/candidate ............................... 10 Democratic Party/candidate ............................... 10 Both (VOL) ......................................................... 22 Don’t remember by whom (VOL) ...................... 5 No, Not Contacted .............................................. 52 Not sure ............................................................ 1
+ Results shown reflect responses among registered voters.

HART/McINTURFF Study #141503--page 16 Late October 2014 NBC News/Wall Street Journal Survey
Now, moving on.... Q15 How much change would you like to see in the direction in which President Obama has been leading the
country--a great deal, quite a bit, just some, or not that much?
10/30-11/1/14+
10/28-30/10+
11/9/94+^
A great deal of change ................................... 45 41 36 Quite a bit of change ...................................... 22 22 26 Just some change .......................................... 23 23 25 Not that much change .................................... 8 11 10 No change (VOL) ........................................... - 1 1 Not sure .......................................................... 2 2 2 + Results shown reflect responses among registered voters ^ In 1994, the question was asked about President Clinton.
Changing topics… Q16 When it comes to (READ ITEM) which party do you think would do a better job--the Democratic Party, the
Republican Party, or both about the same? If you think that neither would do a good job, please just say so. (RANDOMIZE)
THIS TABLE HAS BEEN RANKED BY THE PERCENTAGE WHO GIVE THE ADVANTAGE TO THE DEMOCRATIC PARTY
Party Advantage
DemocraticParty
RepublicanParty
Both About The Same
Neither
Not Sure
Dealing with Social Security Oct. 30 – Nov. 1, 2014+ .............. D-12 38 26 16 18 2 February 2013 ............................. D-14 36 22 15 22 5 June 2012 .................................... D-12 36 24 16 20 4 April 2011 .................................... D-8 31 23 20 24 2 October 14-18, 2010+ ................. D-9 36 27 14 19 4 August 5-9, 2010+ ....................... D-3 29 26 18 21 5 October 13-16, 2006+ ................ D-28 48 20 18 10 4 September 8-11, 2006 ................. D-23 42 19 17 16 6 November 2005 ........................... D-22 44 22 13 16 5 December 2004 ........................... D-15 38 23 20 13 6 January 2004 ............................... D-20 45 25 16 11 3 December 13, 2003 ..................... D-15 39 24 18 13 7 October 2002+ ............................ D-23 43 20 19 13 5 June 2002 .................................... D-15 36 21 26 12 5 June 2001 .................................... D-15 38 23 22 11 6 December 1999 ........................... D-15 38 23 18 14 7 March 1999 ................................. D-18 39 21 23 11 6 October 1998+ ............................ D-23 44 21 25 6 4 September 1998 .......................... D-16 37 21 25 13 4 July 1998 ..................................... D-9 28 19 34 14 5 January 1998 ............................... D-11 26 15 34 18 7 September 1997 .......................... D-14 33 19 18 22 8 October 1996 ............................... D-12 36 24 17 15 8 December 1995 ........................... D-22 44 22 14 14 6 June 1995 .................................... D-9 35 26 16 15 8 November 1994 ........................... D-5 32 27 15 16 10 + Results shown reflect responses among registered voters.
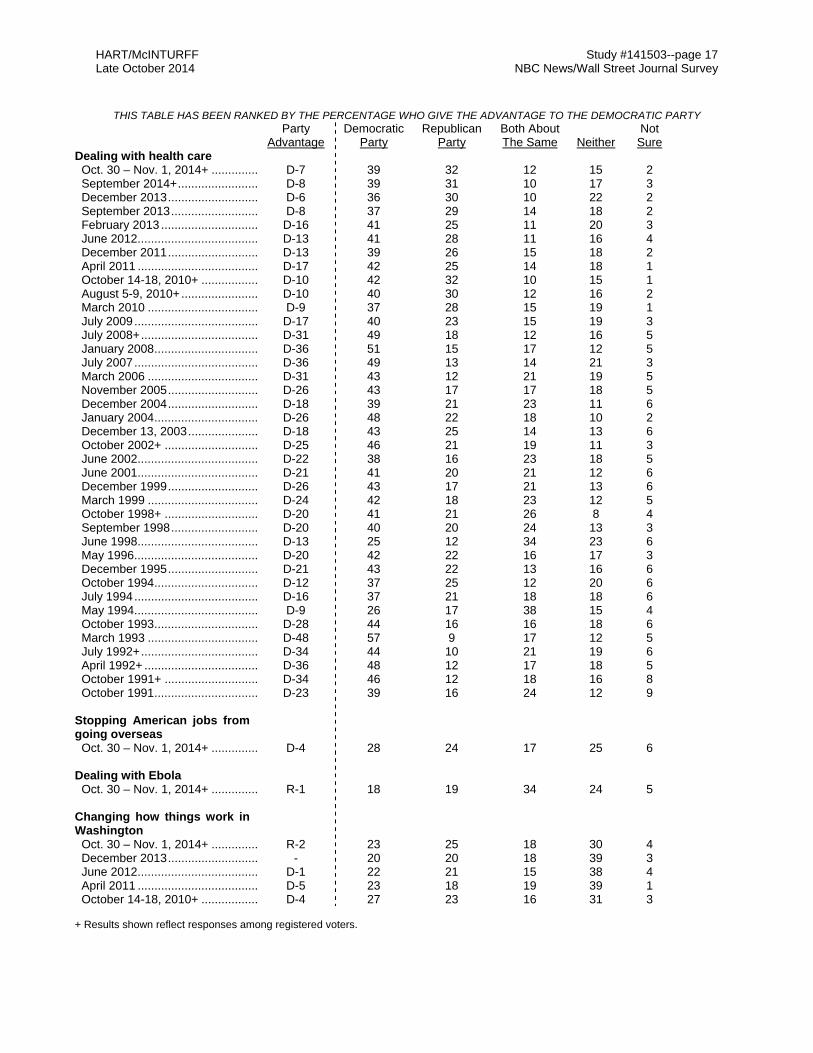
HART/McINTURFF Study #141503--page 17 Late October 2014 NBC News/Wall Street Journal Survey
THIS TABLE HAS BEEN RANKED BY THE PERCENTAGE WHO GIVE THE ADVANTAGE TO THE DEMOCRATIC PARTY
Party Advantage
DemocraticParty
RepublicanParty
Both About The Same
Neither
Not Sure
Dealing with health care Oct. 30 – Nov. 1, 2014+ .............. D-7 39 32 12 15 2 September 2014+ ........................ D-8 39 31 10 17 3 December 2013 ........................... D-6 36 30 10 22 2 September 2013 .......................... D-8 37 29 14 18 2 February 2013 ............................. D-16 41 25 11 20 3 June 2012 .................................... D-13 41 28 11 16 4 December 2011 ........................... D-13 39 26 15 18 2 April 2011 .................................... D-17 42 25 14 18 1 October 14-18, 2010+ ................. D-10 42 32 10 15 1 August 5-9, 2010+ ....................... D-10 40 30 12 16 2 March 2010 ................................. D-9 37 28 15 19 1 July 2009 ..................................... D-17 40 23 15 19 3 July 2008+ ................................... D-31 49 18 12 16 5 January 2008 ............................... D-36 51 15 17 12 5 July 2007 ..................................... D-36 49 13 14 21 3 March 2006 ................................. D-31 43 12 21 19 5 November 2005 ........................... D-26 43 17 17 18 5 December 2004 ........................... D-18 39 21 23 11 6 January 2004 ............................... D-26 48 22 18 10 2 December 13, 2003 ..................... D-18 43 25 14 13 6 October 2002+ ............................ D-25 46 21 19 11 3 June 2002 .................................... D-22 38 16 23 18 5 June 2001 .................................... D-21 41 20 21 12 6 December 1999 ........................... D-26 43 17 21 13 6 March 1999 ................................. D-24 42 18 23 12 5 October 1998+ ............................ D-20 41 21 26 8 4 September 1998 .......................... D-20 40 20 24 13 3 June 1998 .................................... D-13 25 12 34 23 6 May 1996 ..................................... D-20 42 22 16 17 3 December 1995 ........................... D-21 43 22 13 16 6 October 1994 ............................... D-12 37 25 12 20 6 July 1994 ..................................... D-16 37 21 18 18 6 May 1994 ..................................... D-9 26 17 38 15 4 October 1993 ............................... D-28 44 16 16 18 6 March 1993 ................................. D-48 57 9 17 12 5 July 1992+ ................................... D-34 44 10 21 19 6 April 1992+ .................................. D-36 48 12 17 18 5 October 1991+ ............................ D-34 46 12 18 16 8 October 1991 ............................... D-23 39 16 24 12 9 Stopping American jobs from going overseas Oct. 30 – Nov. 1, 2014+ .............. D-4 28 24 17 25 6 Dealing with Ebola Oct. 30 – Nov. 1, 2014+ .............. R-1 18 19 34 24 5 Changing how things work in Washington Oct. 30 – Nov. 1, 2014+ .............. R-2 23 25 18 30 4 December 2013 ........................... - 20 20 18 39 3 June 2012 .................................... D-1 22 21 15 38 4 April 2011 .................................... D-5 23 18 19 39 1 October 14-18, 2010+ ................. D-4 27 23 16 31 3 + Results shown reflect responses among registered voters.

HART/McINTURFF Study #141503--page 18 Late October 2014 NBC News/Wall Street Journal Survey
THIS TABLE HAS BEEN RANKED BY THE PERCENTAGE WHO GIVE THE ADVANTAGE TO THE DEMOCRATIC PARTY Party
Advantage Democratic
Party Republican
Party Both About The Same
Neither
Not Sure
Dealing with the economy Oct. 30 – Nov. 1, 2014+ .............. R-9 30 39 15 16 - September 2014+ ........................ R-10 26 36 17 18 3 December 2013 ........................... R-10 26 36 17 19 2 September 2013 .......................... R-4 29 33 19 17 2 February 2013 ............................. D-2 32 30 16 20 2 June 2012 .................................... R-6 31 37 13 16 3 December 2011 ........................... R-3 28 31 18 20 3 April 2011 .................................... - 29 29 20 20 2 October 14-18, 2010+ ................. R-1 35 36 14 14 1 August 5-9, 2010+ ....................... R-2 32 34 16 17 2 March 2010 ................................. - 31 31 18 18 2 July 2009 ..................................... D-6 35 29 19 14 3 July 2008+ ................................... D-16 41 25 14 14 6 January 2008 ............................... D-18 43 25 21 8 3 July 2007 ..................................... D-15 41 26 17 12 4 October 13-16, 2006+ ................. D-13 43 30 17 7 3 September 2006+ ........................ D-12 40 28 17 10 5 March 2006 ................................. D-12 39 27 20 11 3 November 2005 ........................... D-14 39 25 17 14 5 December 2004 ........................... D-9 39 30 20 7 4 July 2004+ ................................... D-8 40 32 19 7 2 January 2004+ ............................ R-2 36 38 15 8 2 December 13, 2003 ..................... R-1 37 38 14 7 5 October 2002+ ............................ D-6 36 30 21 9 4 June 2002 .................................... D-1 32 31 24 9 4 June 2001 .................................... D-6 37 31 20 6 6 December 1999 ........................... D-3 34 31 24 7 4 March 1999 ................................. D-6 35 29 26 6 4 September 1998 .......................... - 31 31 29 6 3 September 1997 .......................... R-9 25 34 26 9 6 October 1996 ............................... D-4 36 32 15 10 7 May 1996+ .................................. R-4 26 30 27 14 3 December 1995 ........................... R-8 22 30 27 17 4 June 1995 .................................... R-12 17 29 29 23 2 October 1994 ............................... R-8 22 30 28 16 4 July 1994 ..................................... R-11 18 29 32 17 4 June 1994 .................................... R-5 21 26 39 12 2 October 1993 ............................... R-5 22 27 20 28 3 March 1993 ................................. D-16 34 18 34 11 3 July 1992+ ................................... D-8 26 18 35 18 3 May 1992 ..................................... D-6 29 23 26 17 5 January 1992+ ............................ D-5 28 23 33 12 4 October 1991+ ............................ R-1 27 28 26 14 5 Dealing with ISIS in Iraq and Syria Oct. 30 – Nov. 1, 2014+ .............. R-22 17 39 21 17 6 + Results shown reflect responses among registered voters.

HART/McINTURFF Study #141503--page 19 Late October 2014 NBC News/Wall Street Journal Survey
Now turning to the economy... Q17 How satisfied are you with the state of the U.S. economy today--are you very satisfied, somewhat satisfied,
somewhat dissatisfied, or very dissatisfied with the state of the economy?
High Low
10/30-
11/1/14+ 10/8-
12/14+ 8/14 1/14 6/13 1/13 10/10+ 6/10+ 9/98 2/09 Very satisfied .............................. 4 2 3 2 4 3 3 2 31 1 Somewhat satisfied .................... 32 29 32 26 32 24 17 16 55 6 Somewhat dissatisfied ................ 34 34 31 37 35 32 31 34 10 22 Very dissatisfied ......................... 30 34 33 34 29 40 48 48 3 70 Not sure ...................................... - 1 1 1 - 1 1 - 1 1
5/6-
10/10 1/10 10/09 9/09 7/09 6/09 4/09 2/09 1/09 2 1 2 2 2 1 2 1 2 17 15 17 21 11 11 16 6 8 36 33 31 35 31 33 30 22 25 45 50 49 41 56 54 52 70 65 - 1 1 1 - 1 - 1 - 4/08+ 12/07 9/06+ 1/04 12/02 10/02+ 9/02 7/02 4/02 1/02 2 5 10 6 3 4 2 4 6 4 12 27 33 45 33 27 32 42 44 43 28 28 32 30 38 37 41 39 33 39 58 40 25 18 25 31 24 14 15 13 - - - 1 1 1 1 1 2 1 12/01 1/01 4/00+ 10/99 12/98 10/98+ 9/98 12/97 9/97 6/97 5 18 29 23 26 27 31 18 13 10 47 57 52 53 54 55 55 52 52 51 32 18 12 17 13 12 10 20 23 27 15 6 6 7 6 5 3 8 10 10 1 1 1 - 1 1 1 2 2 2 3/97 12/96 9/96 6/96 5/96+ 3/96 1/96 7/95 4/95 12/94 13 9 7 5 4 3 3 4 4 4 45 51 49 43 43 39 37 39 40 41 27 27 30 32 38 37 38 35 37 38 13 11 12 18 14 19 19 21 18 15 2 2 2 2 1 2 3 1 1 2
+ Results shown reflect responses among registered voters.

HART/McINTURFF Study #141503--page 20 Late October 2014 NBC News/Wall Street Journal Survey
And, switching topics one last time… Q18 Now, how prepared, if at all, do you think that the United States is for a possible outbreak of the Ebola virus
– very prepared, somewhat prepared, not too prepared, or not prepared at all?
10/30-11/1/14+**
10/8-12/14+
Very prepared ............................................... 16 12 Somewhat prepared ...................................... 41 44 Not too prepared ........................................... 23 22 Not prepared at all ........................................ 19 20 Not sure ...................................................... 1 1 ** Asked of one-half the respondents (FORM B) (N=595). + Results shown reflect responses among registered voters.
Q19 Which comes closer to your point of view about whether health professionals who have been treating Ebola
patients in West Africa, but have no symptoms of Ebola should be quarantined for twenty-one (21) days when they arrive here? (ROTATE)
They should be quarantined until we are absolutely sure they do not develop symptoms later and pose a risk to the public. They should NOT be quarantined because they have no symptoms and this requirement will make it less likely others will be willing to treat Ebola patients. +*
Should be quarantined ...................................................... 71 Should NOT be quarantined .............................................. 24 Not sure ........................................................................... 5 * Asked of one-half the respondents (FORM A) on 10/31-11/1 (N=293). + Results shown reflect responses among registered voters.

HART/McINTURFF Study #141503--page 21 Late October 2014 NBC News/Wall Street Journal Survey
Now I am going to ask you a few questions for statistical purposes only. (ASKED ONLY IN STATES WHERE EARLY VOTING HAS ALREADY STARTED) QF1a Some people we have spoken with have already filled out their ballot for the Federal election for Senate,
Congress and statewide offices being held Tuesday – Have you already cast your ballot in the election by voting by mail or in person at an early polling location? (DO NOT READ CHOICES:) (IF NOT YET VOTED, THEN ASK:) And do you plan to vote early - either by mail or in person - or will you vote at the polls on Election Day?
LIKELY VOTERS++ 10/30-
11/1/14 10/8-12/14
Total Already Voted Early ............................ 25 2 Yes, voted by mail ........................................ 13 2 Yes, voted early in person ............................ 12 - No, plan to vote early by mail ......................... 3 6 No, plan to vote early in person ...................... 6 3 No, will vote at the polls on Election Day ........ 50 27 Don’t plan on voting (VOL) .......................... - - Not sure ........................................................ 1 3 Not in a State that allows early voting ........ 15 61 ++ Results shown reflect responses among N=826 likely voters who voted in both 2010 and 2012 and are a 7-10 on the interest scale (Q9) and all remaining voters who are 9-10 on the interest scale.
REGISTERED VOTERS+ 10/30-
11/1/14 10/8-12/14
Total Already Voted Early ............................ 22 2 Yes, voted by mail ........................................ 12 1 Yes, voted early in person ............................ 10 1 No, plan to vote early by mail ......................... 4 7 No, plan to vote early in person ...................... 6 2 No, will vote at the polls on Election Day ........ 50 28 Don’t plan on voting (VOL) .......................... 2 1 Not sure ........................................................ 1 1 Not in a State that allows early voting ........ 15 59 + Results shown reflect responses among registered voters.
Already Voted Early Trend*
11/12++ 10/10++ 11/08++ 10/06+ 10/04++
Already Voted....................... 30 25 30 11 20 * Question language differs from year to year. ++ Results shown reflect responses among likely voters. + Results shown reflect responses among registered voters.

HART/McINTURFF Study #141503--page 22 Late October 2014 NBC News/Wall Street Journal Survey
QF1b/c A lot of people are unable to get out and vote for many reasons. Did you happen to vote in the 2012 election for president? (IF “YES,” ASK:) For whom did you vote--Barack Obama, Mitt Romney, or someone else? +
Voted for Barack Obama ..................................... 43 Voted for Mitt Romney ......................................... 34 Voted for someone else ....................................... 7 Not sure ............................................................... 5 No, Did Not Vote .................................................... 10 Not sure ............................................................. 1 + Results shown reflect responses among registered voters.
QF1d And did you happen to vote in the 2010 election for U.S. Congress? +
Yes, voted ............................................................... 71 No, did not vote ....................................................... 24 Not sure .................................................................. 5 + Results shown reflect responses among registered voters.
QF3 What is the last grade that you completed in school? (DO NOT READ CHOICES.)
Grade school ........................................................... 1 Some high school .................................................... 2 High school graduate ............................................... 24 Some college, no degree ......................................... 21 Vocational training/2-year college ............................ 8 4-year college/bachelor's degree ............................. 25 Some postgraduate work, no degree ....................... 2 2-3 years postgraduate work/master's degree ......... 12 Doctoral/law degree ................................................. 4 Not sure/refused .................................................... 1
+ Results shown reflect responses among registered voters. QF4a Generally speaking, do you think of yourself as (ROTATE:) a Democrat, a Republican, an independent, or
something else? (IF "DEMOCRAT" OR "REPUBLICAN," ASK:) Would you call yourself a strong (Democrat/Republican) or not a very strong (Democrat/Republican)? (IF "NOT SURE," CODE AS "NOT VERY STRONG DEMOCRAT/REPUBLICAN.") (IF "INDEPENDENT," ASK:) Do you think of yourself as closer to the Republican Party, closer to the Democratic Party, or do you think of yourself as strictly independent? (IF "NOT SURE," CODE AS "STRICTLY INDEPENDENT.")
Strong Democrat ................................................ 21 Not very strong Democrat .................................. 10 Independent/lean Democrat............................... 12 Strictly Independent ........................................... 12 Independent/lean Republican ............................ 15 Not very strong Republican ................................ 8 Strong Republican ............................................. 16 Other (VOL) ....................................................... 4 Not sure ........................................................... 2 + Results shown reflect responses among registered voters.

HART/McINTURFF Study #141503--page 23 Late October 2014 NBC News/Wall Street Journal Survey
QF4b Do you consider yourself a supporter of the Tea Party Movement?
10/30-11/1/14+
10/8-12/14+ 9/14+ 8/14+ 6/14+ 4/14+ 3/14+
Yes ............................ 21 20 21 22 22 24 24 No .............................. 69 67 70 66 67 66 66 Depends (VOL) ......... 3 3 3 4 4 3 2 Not sure ..................... 7 10 6 8 7 7 8
1/14+ 12/13+ 10/25-28/13+
10/7-9/13+ 9/13+ 7/13+
24 24 22 20 21 21 65 67 70 70 67 67 3 2 3 2 3 3 8 7 5 8 9 9
6/13+ 2/13+ 1/13+ 10/12+ 9/26-
30/12+ 9/12-
16/12+ 24 20 23 24 25 22 65 64 63 64 66 65 3 4 4 3 2 4 8 12 10 9 7 9 8/12+ 7/12+ 6/12+ 5/12+ 4/12+ 3/12+ 1/12+ 26 25 24 30 25 28 27 63 65 64 60 64 63 66 3 2 3 2 2 2 2 8 7 9 8 9 7 5 12/11+ 11/11+ 10/11+ 8/11+ 6/11+ 5/11+ 4/11+ 27 25 26 27 26 26 25 65 69 64 62 63 62 67 3 2 3 4 3 2 3 5 4 7 7 8 10 5
2/11+ 1/11+ 12/10+ 11/10+ 10/28-30/10+
10/14-18/10+ 9/10+
29 27 29 30 28 30 28 61 62 61 59 61 59 61 3 3 3 4 3 2 3 7 8 7 7 8 10 8 + Results shown reflect responses among registered voters.
QF5 Thinking about your general approach to issues, do you consider yourself to be liberal, moderate, or
conservative? (IF "LIBERAL" OR "CONSERVATIVE," ASK:) Do you consider yourself to be very (liberal/conservative) or somewhat (liberal/conservative)?
Very liberal ......................................................... 10 Somewhat liberal ............................................... 14 Moderate ............................................................ 36 Somewhat conservative ..................................... 20 Very conservative .............................................. 16 Not sure ........................................................... 4 + Results shown reflect responses among registered voters.
QF6a/b Are you a current or retired labor union member? (ASK ONLY OF RESPONDENTS WHO SAY "NO" OR
"NOT SURE" IN QF6a.) Is anyone else in your household a current or retired labor union member? +
Labor union member ........................................ 16 Union household ............................................... 8 Non-union household ....................................... 75 Not sure .......................................................... 1 + Results shown reflect responses among registered voters.

HART/McINTURFF Study #141503--page 24 Late October 2014 NBC News/Wall Street Journal Survey
QF7 Are you married, widowed, separated, divorced, single and never been married, or are you unmarried and living with a partner?
Married ............................................................. 53 Widowed ........................................................... 8 Separated ........................................................ 1 Divorced ........................................................... 10 Single/never been married ................................ 21 Unmarried and living with a partner .................. 5 Refused .......................................................... 2 + Results shown reflect responses among registered voters.
QF8 If you added together the yearly income of all the members of your family who were living at home last year,
would the total be less than ten thousand dollars, between ten thousand dollars and twenty thousand dollars, between twenty thousand dollars and thirty thousand dollars, between thirty thousand dollars and forty thousand dollars, between forty thousand dollars and fifty thousand dollars, between fifty thousand dollars and seventy-five thousand dollars, between seventy-five thousand dollars and one hundred thousand dollars, or would the total be more than that?
Less than $10,000 ............................................... 3 Between $10,000 and $20,000............................ 8 Between $20,000 and $30,000............................ 9 Between $30,000 and $40,000............................ 6 Between $40,000 and $50,000............................ 9 Between $50,000 and $75,000............................ 17 Between $75,000 and $100,000.......................... 13 More than $100,000 ............................................ 24 Not sure/refused ................................................. 11
+ Results shown reflect responses among registered voters.