Embed Size (px)
Citation preview
1
Stillwater Associates
Hawaii Fuels Study
Public Information BriefingSeptember 8, 2003
2
Stillwater Associates
Hawaii Fuels Study – Public Information Briefing – September 8, 2003
Hawaii Fuel Study – Background
Initiative for Act 77 followed after settlement of anti-trust lawsuit brought by the State of Hawaii against several refiners and marketersKey feature of Act 77 was the creation of price cap regulation for regular gasolinePrice caps to become effective July 1st, 2004Bill required a study to be conducted in the intervening period to evaluate the potential impact of price capsStillwater Associates was retained by DBEDT to conduct study after competitive bidding process
3
Stillwater Associates
Hawaii Fuels Study – Public Information Briefing – September 8, 2003
Hawaii Fuel Study – Methodology
Study required comprehensive analysis of Hawaii’s petroleum industry– Gasoline market can not be studied in isolation– In Hawaii, gasoline is only small fraction of refinery output– Evaluation of market, infrastructure, prices, volumes, refineries, supply and demand
Information required from all segments of industry and relevant entities – Stillwater conducted over 30 meetings with stakeholders– Stakeholders included legislators, administration officials, academics, refiners,
marketers, dealers, logistic service providers
Unsealed court documents from State of Hawaii anti-trust lawsuit (Anzai v. Chevron, et al. ) were extensively used
– Analysis of documents was required by Act 77– Summary brief redacted documents– Expert Witness reports – Industry and State experts’ analysis
4
Stillwater Associates
Hawaii Fuels Study – Public Information Briefing – September 8, 2003
Hawaii Fuel Study – Methodology (Continued)
Comprehensive Policy Impact Analysis– Evaluate Impact of Price Caps– Develop Alternative Solutions– Cost/Benefit Analysis of Feasible Alternatives– Presentation of options to legislation
Multi-disciplinary 5 Member Team– Previous experience in advising government on energy policy issues– All members 25+ years industry experience– Several were familiar with Hawaii fuel markets– Extensive West Coast and Pacific Rim experience
5
Stillwater Associates
Hawaii Fuels Study – Public Information Briefing – September 8, 2003
Conclusions – Gasoline Prices
High gasoline prices in Hawaii are caused byIntrinsic high cost of manufacture, distribution and marketing
– Refining cost: + 5 cpg vs. US average– Distribution and marketing: + 12 cpg– Dealer cost: + 3 cpg
High taxes– 12 cpg higher than average US
Exercise of market power in concentrated markets– 2 refiners, 5 total marketers– Import parity at wholesale level is not passed through in branded retail– Prices show prolonged disconnects from crude oil, international markets
Consumer preferences– Some consumers prefer small volume retailers for location and service,
regardless of price– Purchase of premium and midgrade when not required
30 – 35 cpg over US average
6
Stillwater Associates
Hawaii Fuels Study – Public Information Briefing – September 8, 2003
Conclusions – Hawaii Gasoline Market
Hawaii’s wholesale gasoline market is competitive– Since Aloha/Texaco opened an import terminal in 1998, Hawaii’s non-
refining marketers have had access to gasoline at import parity pricing– Supply contracts for the large marketers have since shifted from mainland
related exchange deals to PacRim based formula pricing– Some large volume offtake agreements also incorporate other pricing
elements, i.e., US Gulf CoastHawaii’s retail gasoline market is competitive
– Dealers struggle to survive, compete with service, convenience stores– High Volume Retailers (Costco) have made significant inroads– Other low cost market channels exist where members use cardlocks, PX
Wholesale to Retail is where market breaks down– High cost, notably land lease not recovered in dealer leases– Sluggish, complacent pricing behavior
7
Stillwater Associates
Hawaii Fuels Study – Public Information Briefing – September 8, 2003
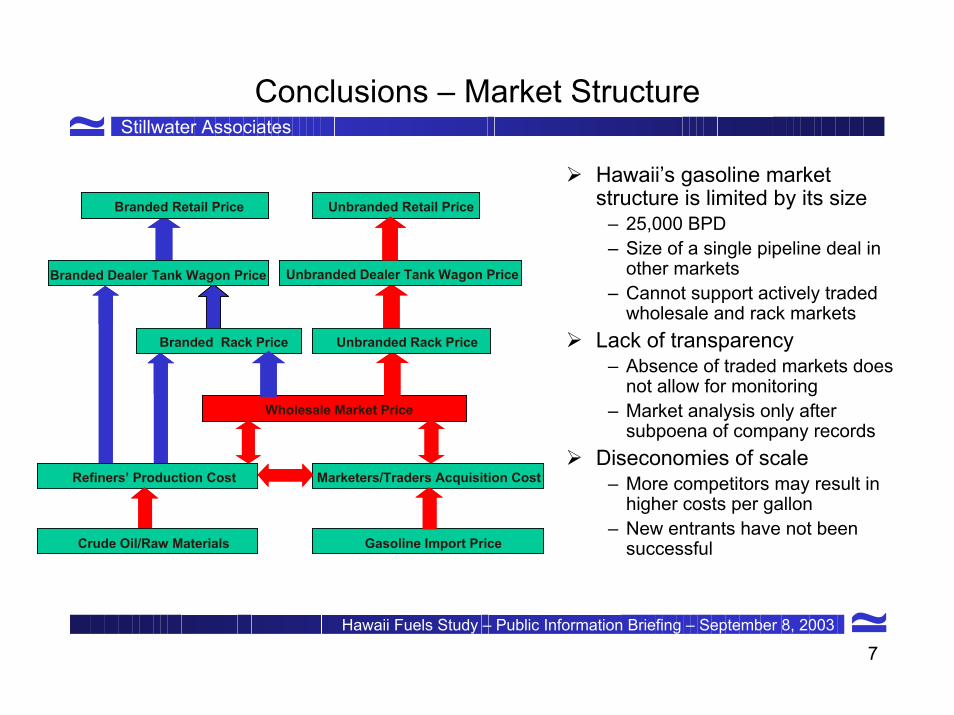
Conclusions – Market Structure
Hawaii’s gasoline market structure is limited by its size
– 25,000 BPD– Size of a single pipeline deal in
other markets– Cannot support actively traded
wholesale and rack marketsLack of transparency
– Absence of traded markets does not allow for monitoring
– Market analysis only after subpoena of company records
Diseconomies of scale– More competitors may result in
higher costs per gallon– New entrants have not been
successful
Spot Market Price
Refiners’ Production Cost
Branded Rack Price Unbranded Rack Price
Branded Retail Price Unbranded Retail Price
Gasoline Import PriceCrude Oil/Raw Materials
Wholesale Market Price
Refiners’ Production Cost Marketers/Traders Acquisition Cost
Branded Rack Price Unbranded Rack Price
Branded Dealer Tank Wagon Price
Branded Retail Price Unbranded Retail Price
Gasoline Import Price
Unbranded Dealer Tank Wagon Price
Crude Oil/Raw Materials
8
Stillwater Associates
Hawaii Fuels Study – Public Information Briefing – September 8, 2003
Conclusions – Neighbor Island Markets
Maui gasoline prices on average higher than can be justified by logistic cost
– Only 4 marketers active on Maui vs. 5 on Oahu– Lack of tankage in Kahului prevents entry of 5th marketer– 5th marketer is supplier of Costco– Cardlocks provide cheaper gasoline for knowledgeable local consumers
Big Island West Coast situation somewhat similar to Maui– Lack of terminals & tankage restricts access– Market concentration plus logistic costs for trans-island trucking create high
prices in isolated markets– Costco does have a store in Kona
Kauai, Lanai small markets with intrinsic high costs
9
Stillwater Associates
Hawaii Fuels Study – Public Information Briefing – September 8, 2003
Conclusions – Industry Profitability
Overall profitability of refiners is not excessive– 20 to 25% Return on Capital Employed in good years for the most profitable
companies – 0 to 10% for less profitable companies in bad years– The famous quote “Chevron made 20% of profits in Hawaii, which is only
3% of sales” actually referred to lessee dealer sales only – lessee dealers at the time represented 74% of ChevronTexaco dealers in Hawaii vs. 7% in the rest of the US
Refinery profitability is a complex issue– In Hawaii, gasoline is less than 20% of product slate vs. 60% in rest of US– Margins in main products of Hawaii’s refineries, fuel oil and jet fuel, are slim– Refineries require expensive sweet, light crude oil – which is getting scarce– Operating cost in Hawaii are higher than in mainland US
Long term, Hawaii’s refineries unlikely to remain economically viable– Similar refineries in mainland US were upgraded or shut down long ago– Upgrade to full conversion capability is costly
10
Stillwater Associates
Hawaii Fuels Study – Public Information Briefing – September 8, 2003
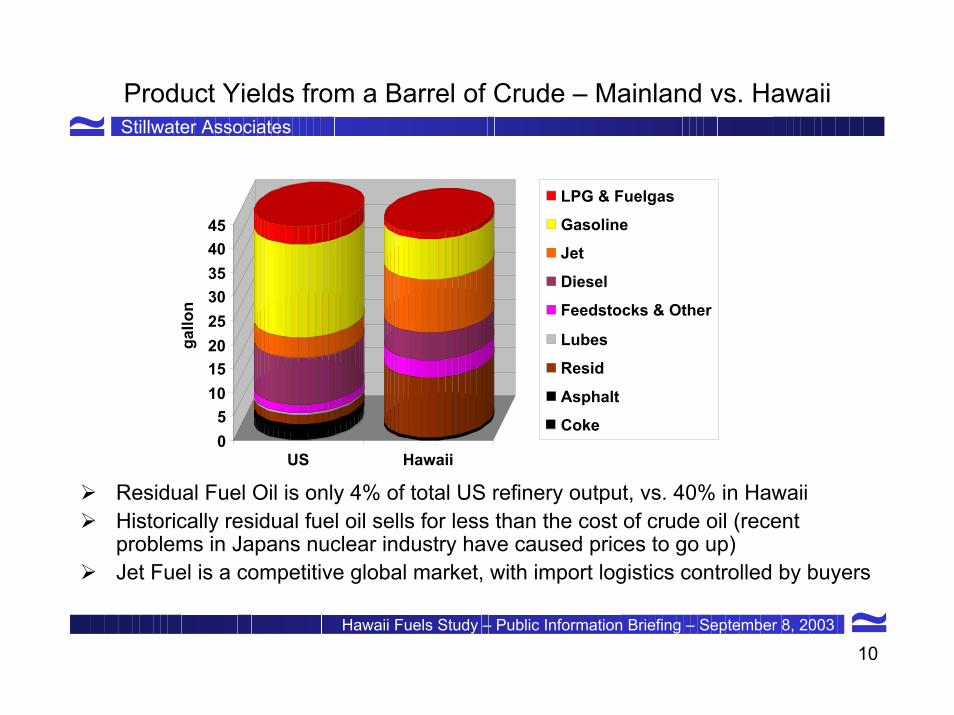
Product Yields from a Barrel of Crude – Mainland vs. Hawaii
05
1015202530354045
gallo
n
US Hawaii
LPG & FuelgasGasolineJet
Diesel
Feedstocks & Other
Lubes
Resid
Asphalt
Coke
Residual Fuel Oil is only 4% of total US refinery output, vs. 40% in HawaiiHistorically residual fuel oil sells for less than the cost of crude oil (recent problems in Japans nuclear industry have caused prices to go up)Jet Fuel is a competitive global market, with import logistics controlled by buyers
11
Stillwater Associates
Hawaii Fuels Study – Public Information Briefing – September 8, 2003
Conclusions – Price Caps
Price Caps are not effective– Federal price controls did not work, created shortages– In-depth review of Canadian initiatives failed to identify clear benefits– Transparency initiatives (Australia, Canada, Pacific Islands) are more
effective with less unintended side effects
Current price formula unlikely to bring lower prices– Link to West Coast prices brings exposure to volatility, seasonal swings– Formula allows for current intrinsic high costs to continue
Unwanted side effects– Time lag provides opportunity for manipulation of market– Caps perceived by marketers and dealers as a license to price at the cap– Price controls project an anti-business image for Hawaii
12
Stillwater Associates
Hawaii Fuels Study – Public Information Briefing – September 8, 2003
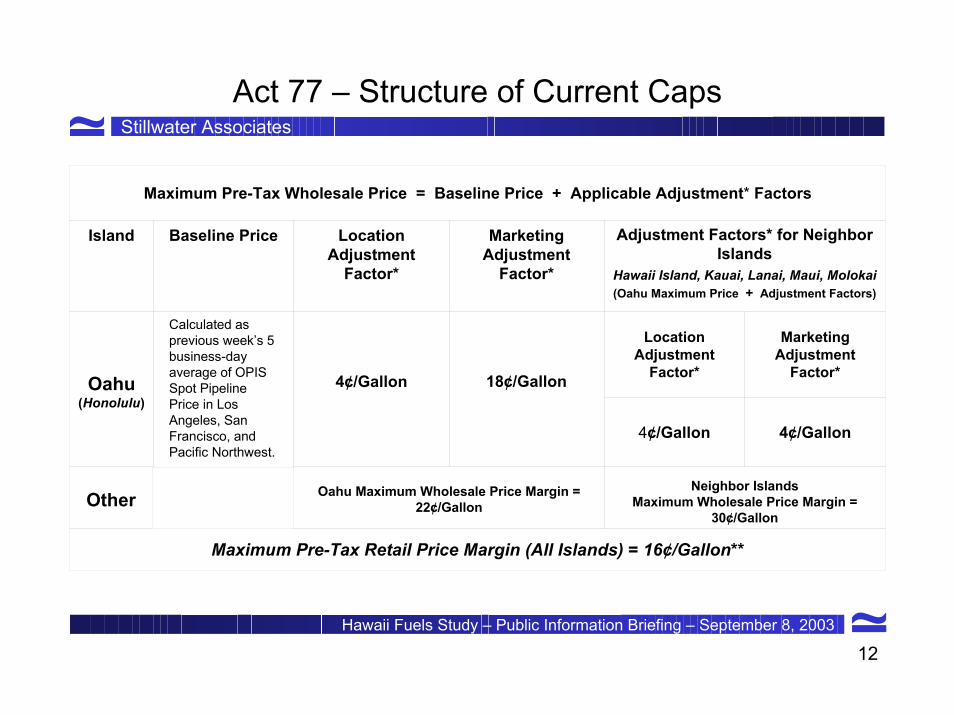
Act 77 – Structure of Current Caps
Maximum Pre-Tax Wholesale Price = Baseline Price + Applicable Adjustment* Factors
Island Baseline Price LocationAdjustment
Factor*
Marketing Adjustment
Factor*
Adjustment Factors* for Neighbor Islands
Hawaii Island, Kauai, Lanai, Maui, Molokai(Oahu Maximum Price + Adjustment Factors)
Oahu(Honolulu)
Calculated as previous week’s 5 business-day average of OPIS Spot Pipeline Price in Los Angeles, San Francisco, and Pacific Northwest.
4¢/Gallon 18¢/Gallon
Location Adjustment
Factor*
Marketing Adjustment
Factor*
4¢/Gallon 4¢/Gallon
Oahu Maximum Wholesale Price Margin = 22¢/Gallon
Neighbor IslandsMaximum Wholesale Price Margin =
30¢/Gallon
Maximum Pre-Tax Retail Price Margin (All Islands) = 16¢/Gallon**
Other
13
Stillwater Associates
Hawaii Fuels Study – Public Information Briefing – September 8, 2003
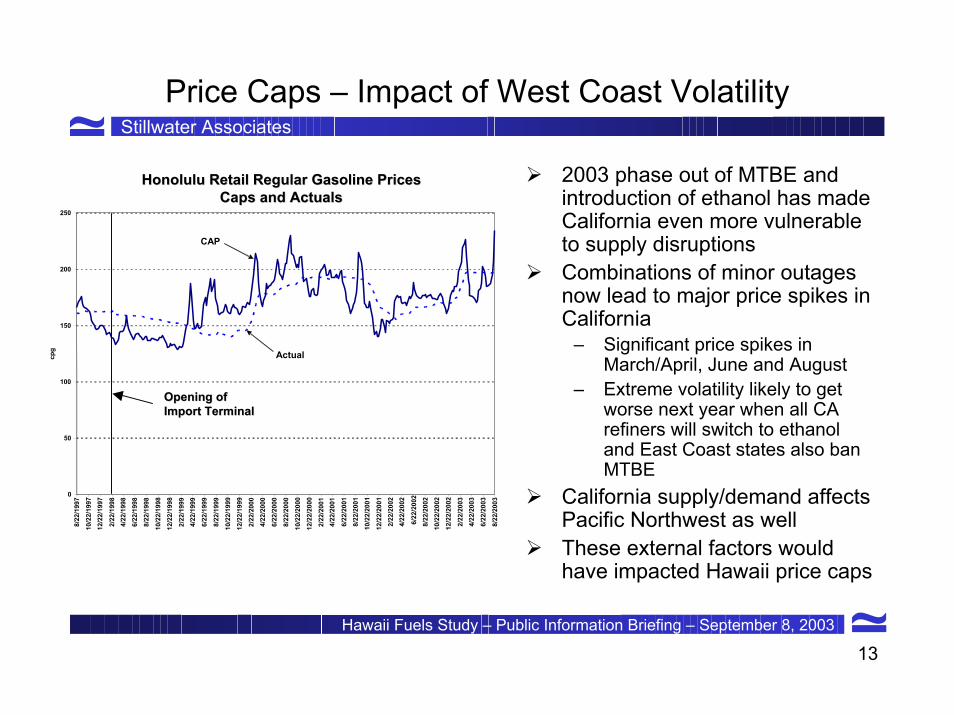
Price Caps – Impact of West Coast Volatility
2003 phase out of MTBE and introduction of ethanol has made California even more vulnerable to supply disruptionsCombinations of minor outages now lead to major price spikes in California
– Significant price spikes in March/April, June and August
– Extreme volatility likely to get worse next year when all CA refiners will switch to ethanol and East Coast states also ban MTBE
California supply/demand affects Pacific Northwest as wellThese external factors would have impacted Hawaii price caps
Honolulu Retail Regular Gasoline PricesCap Versus Actual
0
50
100
150
200
250
8/22
/199
710
/22/
1997
12/2
2/19
97
2/22
/199
84/
22/1
998
6/22
/199
88/
22/1
998
10/2
2/19
9812
/22/
1998
2/22
/199
94/
22/1
999
6/22
/199
9
8/22
/199
910
/22/
1999
12/2
2/19
992/
22/2
000
4/22
/200
06/
22/2
000
8/22
/200
010
/22/
2000
12/2
2/20
002/
22/2
001
4/22
/200
1
6/22
/200
18/
22/2
001
10/2
2/20
01
12/2
2/20
012/
22/2
002
4/22
/200
2
6/22
/200
28/
22/2
002
10/2
2/20
0212
/22/
2002
2/22
/200
34/
22/2
003
6/22
/200
38/
22/2
003
cpg
CAP
Actual
Opening of Opening of Import TerminalImport Terminal
Honolulu Retail Regular Gasoline PricesHonolulu Retail Regular Gasoline PricesCaps and ActualsCaps and Actuals
14
Stillwater Associates
Hawaii Fuels Study – Public Information Briefing – September 8, 2003
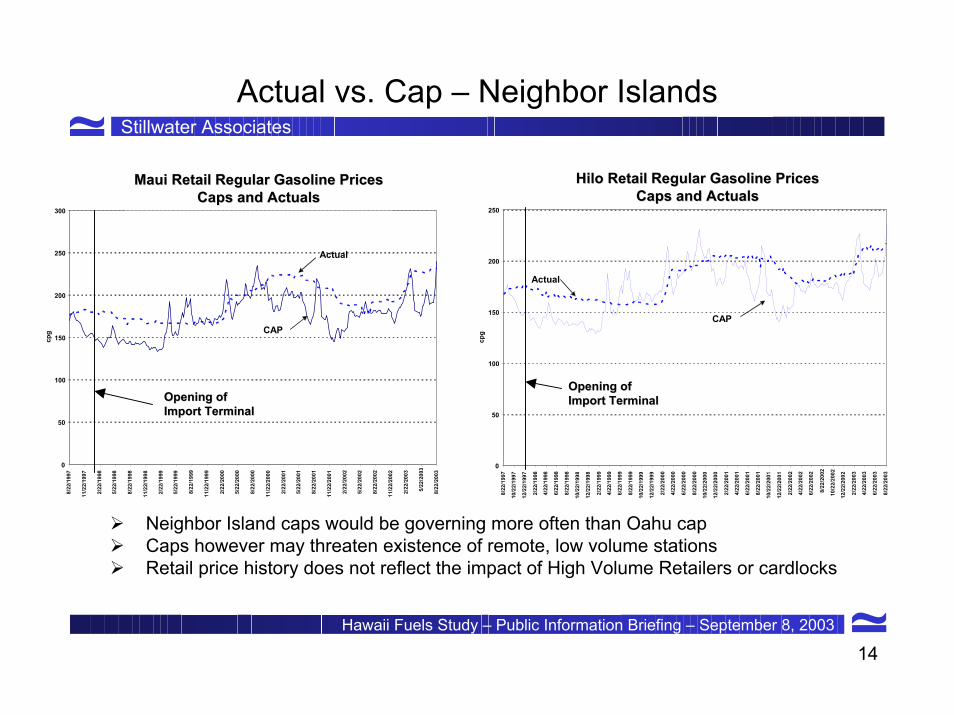
Actual vs. Cap – Neighbor Islands
Hilo Retail Gasoline PricesCap vs. Actual
0
50
100
150
200
250
8/22
/199
7
10/2
2/19
97
12/2
2/19
97
2/22
/199
8
4/22
/199
8
6/22
/199
8
8/22
/199
8
10/2
2/19
98
12/2
2/19
98
2/22
/199
9
4/22
/199
9
6/22
/199
9
8/22
/199
9
10/2
2/19
99
12/2
2/19
99
2/22
/200
0
4/22
/200
0
6/22
/200
0
8/22
/200
0
10/2
2/20
00
12/2
2/20
00
2/22
/200
1
4/22
/200
1
6/22
/200
1
8/22
/200
1
10/2
2/20
01
12/2
2/20
01
2/22
/200
2
4/22
/200
2
6/22
/200
2
8/22
/200
2
10/2
2/20
02
12/2
2/20
02
2/22
/200
3
4/22
/200
3
6/22
/200
3
cpg
CAP
Actual
Maui Retail Gasoline PricesCap vs. Actual
0
50
100
150
200
250
300
8/22
/199
7
11/2
2/19
97
2/22
/199
8
5/22
/199
8
8/22
/199
8
11/2
2/19
98
2/22
/199
9
5/22
/199
9
8/22
/199
9
11/2
2/19
99
2/22
/200
0
5/22
/200
0
8/22
/200
0
11/2
2/20
00
2/22
/200
1
5/22
/200
1
8/22
/200
1
11/2
2/20
01
2/22
/200
2
5/22
/200
2
8/22
/200
2
11/2
2/20
02
2/22
/200
3
5/22
/200
3
8/22
/200
3
cpg
Actual
CAP
Opening of Opening of Import TerminalImport Terminal
Opening of Opening of Import TerminalImport Terminal
Maui Retail Regular Gasoline PricesMaui Retail Regular Gasoline PricesCaps and ActualsCaps and Actuals
Hilo Retail Regular Gasoline PricesHilo Retail Regular Gasoline PricesCaps and ActualsCaps and Actuals
8/22
/200
3
Neighbor Island caps would be governing more often than Oahu capCaps however may threaten existence of remote, low volume stations Retail price history does not reflect the impact of High Volume Retailers or cardlocks
15
Stillwater Associates
Hawaii Fuels Study – Public Information Briefing – September 8, 2003
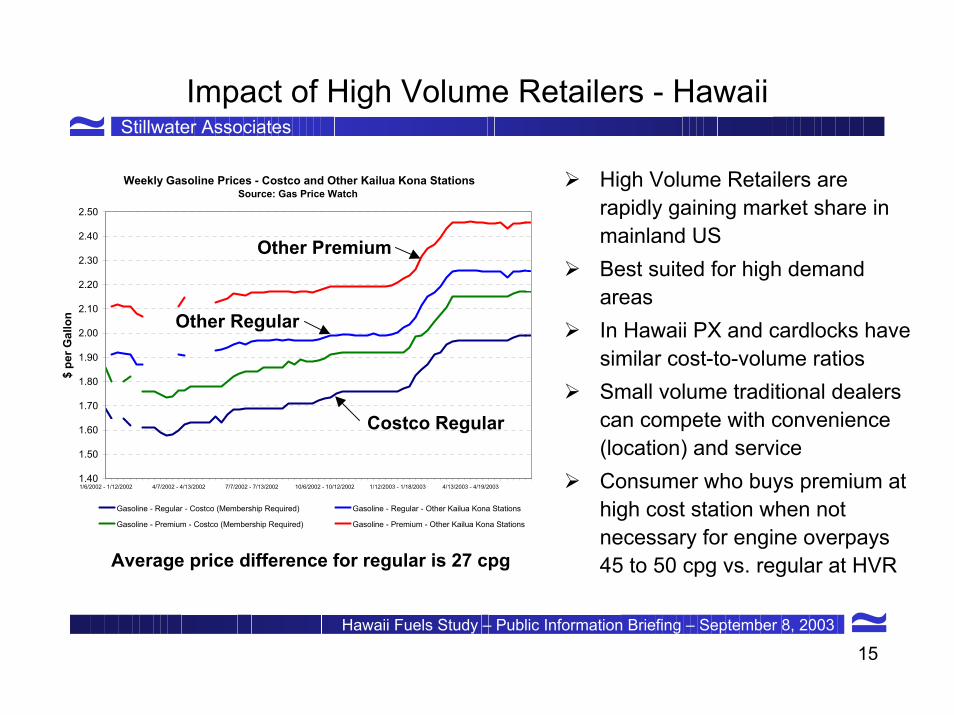
Impact of High Volume Retailers - Hawaii
High Volume Retailers are rapidly gaining market share in mainland USBest suited for high demand areasIn Hawaii PX and cardlocks have similar cost-to-volume ratios Small volume traditional dealers can compete with convenience (location) and serviceConsumer who buys premium at high cost station when not necessary for engine overpays 45 to 50 cpg vs. regular at HVR
Weekly Gasoline Prices - Costco and Other Kailua Kona Stations Source: Gas Price Watch
1.40
1.50
1.60
1.70
1.80
1.90
2.00
2.10
2.20
2.30
2.40
2.50
1/6/2002 - 1/12/2002 4/7/2002 - 4/13/2002 7/7/2002 - 7/13/2002 10/6/2002 - 10/12/2002 1/12/2003 - 1/18/2003 4/13/2003 - 4/19/2003
$ pe
r Gal
lon
Gasoline - Regular - Costco (Membership Required) Gasoline - Regular - Other Kailua Kona Stations
Gasoline - Premium - Costco (Membership Required) Gasoline - Premium - Other Kailua Kona Stations
Costco Regular
Other Regular
Other Premium
Average price difference for regular is 27 cpg
16
Stillwater Associates
Hawaii Fuels Study – Public Information Briefing – September 8, 2003
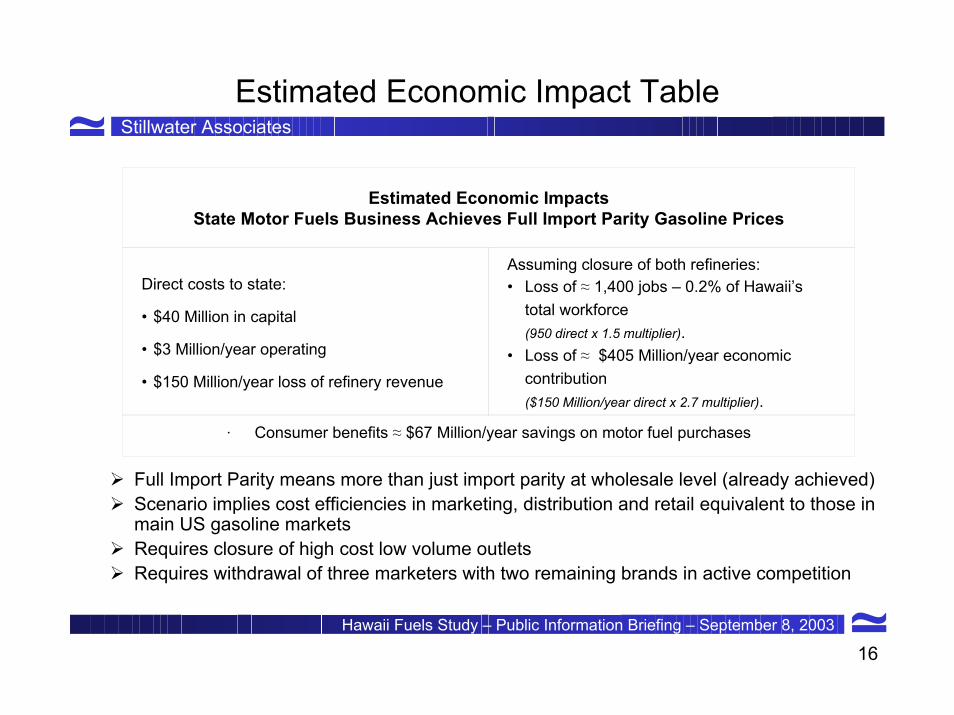
Estimated Economic Impact Table
Estimated Economic Impacts State Motor Fuels Business Achieves Full Import Parity Gasoline Prices
Direct costs to state:
• $40 Million in capital
• $3 Million/year operating
• $150 Million/year loss of refinery revenue
Assuming closure of both refineries:• Loss of ≈ 1,400 jobs – 0.2% of Hawaii’s
total workforce (950 direct x 1.5 multiplier).
• Loss of ≈ $405 Million/year economic contribution ($150 Million/year direct x 2.7 multiplier).
· Consumer benefits ≈ $67 Million/year savings on motor fuel purchases
Full Import Parity means more than just import parity at wholesale level (already achieved)Scenario implies cost efficiencies in marketing, distribution and retail equivalent to those in main US gasoline marketsRequires closure of high cost low volume outletsRequires withdrawal of three marketers with two remaining brands in active competition
17
Stillwater Associates
Hawaii Fuels Study – Public Information Briefing – September 8, 2003
Recommendations – Price Caps
Do not implement price caps– Not likely to accomplish their objectives of lowering prices– Will be ineffective– Costly to administer– Open to manipulation– Creates an anti-business climate
Eliminate position of Petroleum Commissioner– The regulatory function is redundant with enforcement agencies’
responsibilities– Maintain DBEDT’s role as a business development agency
18
Stillwater Associates
Hawaii Fuels Study – Public Information Briefing – September 8, 2003
Recommendation - Transparency
Create Transparency– Extend volume reporting requirements to cover volume and prices
for all petroleum products and all classes of trade– Analyze profitability by sector on an ongoing basis– Maintain a continuous dialogue between industry and oversight
agencies, with quick resolution of observed issues– DBEDT to be provided with adequate tools and means for data
collection and analysis– Implement in consultation with industry– Harmonize data reporting requirements between various agencies– Minimize burden on small businesses
19
Stillwater Associates
Hawaii Fuels Study – Public Information Briefing – September 8, 2003
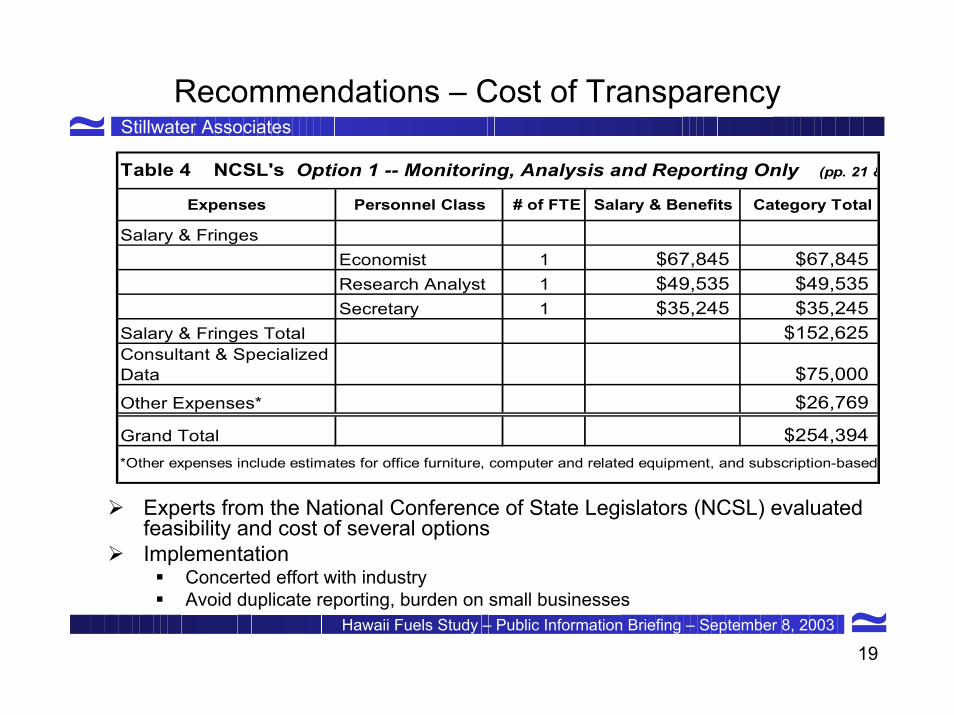
Recommendations – Cost of Transparency
Expenses Personnel Class # of FTE Salary & Benefits Category Total
Salary & FringesEconomist 1 $67,845 $67,845Research Analyst 1 $49,535 $49,535Secretary 1 $35,245 $35,245
Salary & Fringes Total $152,625Consultant & Specialized Data $75,000Other Expenses* $26,769
Grand Total $254,394
Table 4 NCSL's Option 1 -- Monitoring, Analysis and Reporting Only (pp. 21 &
*Other expenses include estimates for office furniture, computer and related equipment, and subscription-based
Experts from the National Conference of State Legislators (NCSL) evaluated feasibility and cost of several optionsImplementation
Concerted effort with industryAvoid duplicate reporting, burden on small businesses
20
Stillwater Associates
Hawaii Fuels Study – Public Information Briefing – September 8, 2003
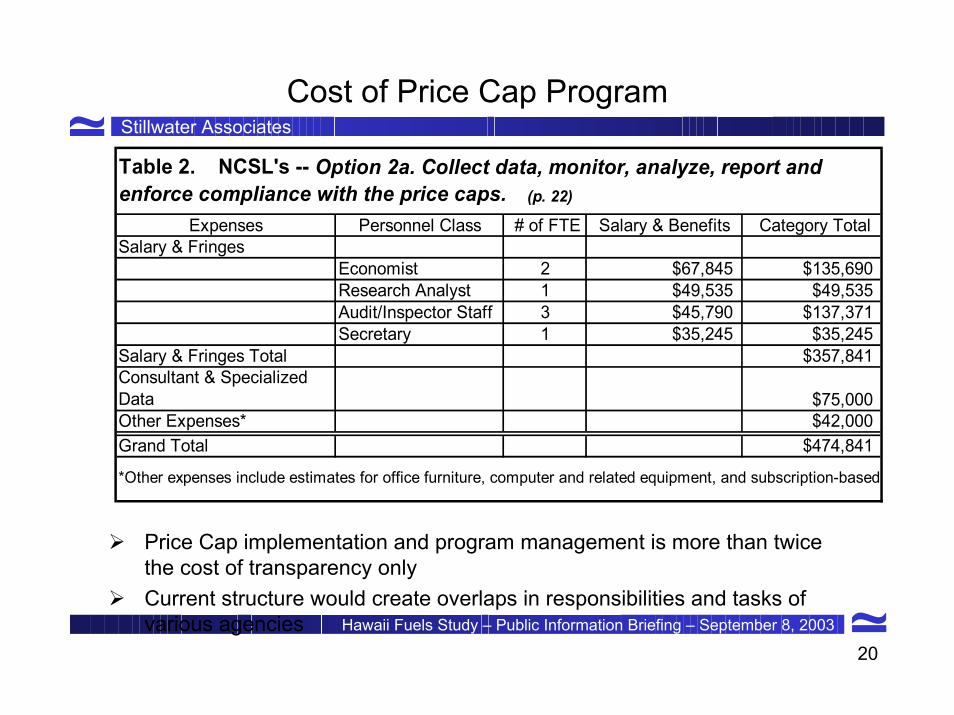
Cost of Price Cap Program
Expenses Personnel Class # of FTE Salary & Benefits Category TotalSalary & Fringes
Economist 2 $67,845 $135,690Research Analyst 1 $49,535 $49,535Audit/Inspector Staff 3 $45,790 $137,371Secretary 1 $35,245 $35,245
Salary & Fringes Total $357,841Consultant & Specialized Data $75,000Other Expenses* $42,000Grand Total $474,841
Table 2. NCSL's -- Option 2a. Collect data, monitor, analyze, report and enforce compliance with the price caps. (p. 22)
*Other expenses include estimates for office furniture, computer and related equipment, and subscription-based
Price Cap implementation and program management is more than twice the cost of transparency onlyCurrent structure would create overlaps in responsibilities and tasks of various agencies
21
Stillwater Associates
Hawaii Fuels Study – Public Information Briefing – September 8, 2003
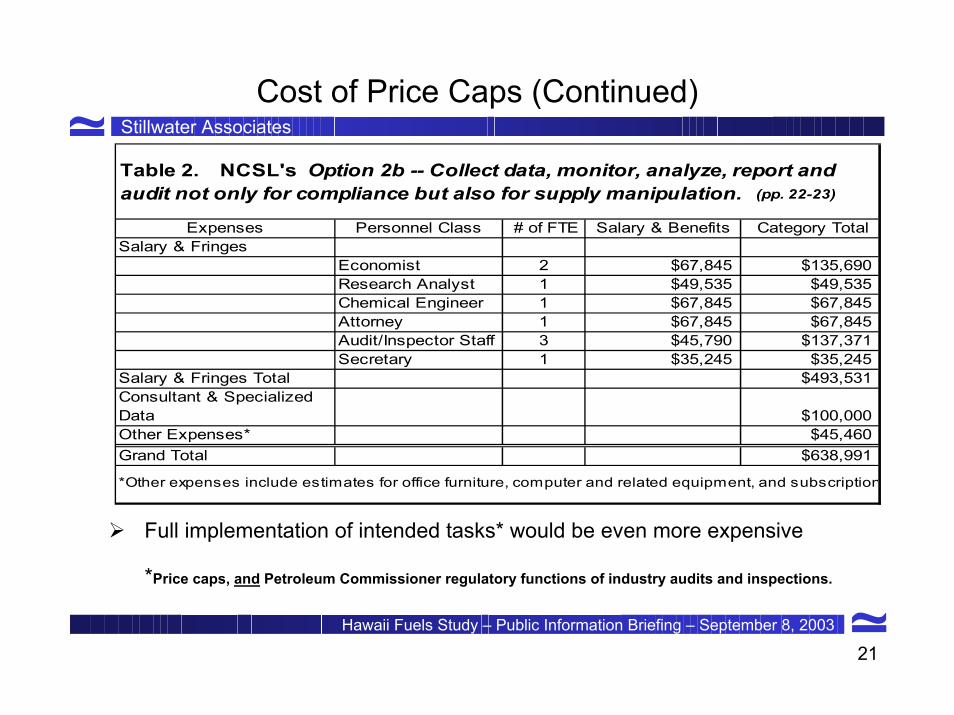
Cost of Price Caps (Continued)
Expenses Personnel Class # of FTE Salary & Benefits Category TotalSalary & Fringes
Economist 2 $67,845 $135,690Research Analyst 1 $49,535 $49,535Chemical Engineer 1 $67,845 $67,845Attorney 1 $67,845 $67,845Audit/Inspector Staff 3 $45,790 $137,371Secretary 1 $35,245 $35,245
Salary & Fringes Total $493,531Consultant & Specialized Data $100,000Other Expenses* $45,460Grand Total $638,991
*Other expenses include estimates for office furniture, computer and related equipment, and subscription
Table 2. NCSL's Option 2b -- Collect data, monitor, analyze, report and audit not only for compliance but also for supply manipulation. (pp. 22-23)
Full implementation of intended tasks* would be even more expensive
*Price caps, and Petroleum Commissioner regulatory functions of industry audits and inspections.
22
Stillwater Associates
Hawaii Fuels Study – Public Information Briefing – September 8, 2003
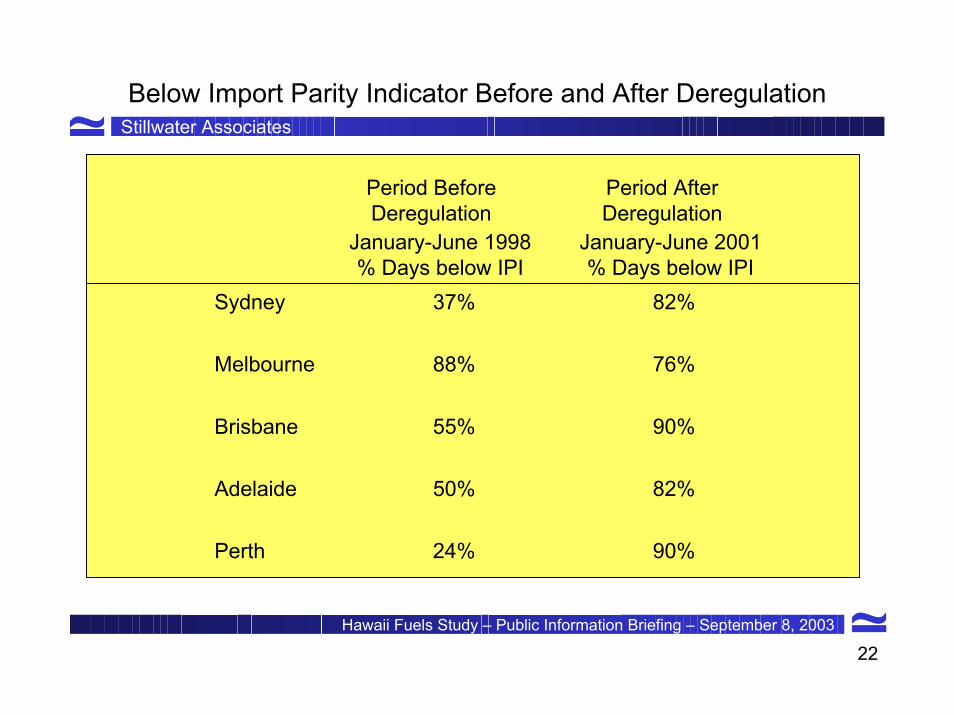
Below Import Parity Indicator Before and After Deregulation
Period Before Deregulation
Period After Deregulation
Sydney 37% 82%
Melbourne 88% 76%
Brisbane 55% 90%
Adelaide 50% 82%
January-June 1998% Days below IPI
January-June 2001% Days below IPI
Perth 24% 90%
23
Stillwater Associates
Hawaii Fuels Study – Public Information Briefing – September 8, 2003
Recommendations – Broader Outlook
Future Hawaii Energy Infrastructure– Opportunities exist to fundamentally lower Hawaii’s energy cost, electrical
power as well as gasoline – Need for integrated approach– Potential to reduce petroleum dependency by 35% (LNG replacing fuel oil)– Integrated approach required to create opportunities for ethanol,
renewables, hydrogen, and other emerging energy technologiesElements of an Integrated Energy Strategy
– Assess LNG to replace residual fuel oil and SNG in Oahu– Analyze relevant factors (market, infrastructure, cost-effectiveness, legal,
policy, etc. ) for potential refinery upgrades and to produce and export high value gasoline blendstocks to California
– Production of ethanol from sugarcane with integrated power production from biomass
Requires private industry initiatives as well as coherent State energy policies, to create climate conducive to investment
24
Stillwater Associates
Hawaii Fuels Study – Public Information Briefing – September 8, 2003
Recommendations – Broader Outlook (Continued)
Potential Benefits of an Integrated State Energy StrategyPreliminary findings
– Workable economics for LNG as fuel for Oahu power generation– Workable economics for integrated, export capable refinery system
Estimated Potential Benefits to the State of Hawaii– ≈ 30% decreased petroleum dependency– ≈ $300 Million/year energy cost savings – Systematic planning for cleaner fossil fuels, LNG as transition fuel to H2,
renewables, energy efficiency, energy emergency planning– Maintains existing jobs through retention and growth of Hawaii’s refinery
industry facing future competitive challenges– Creates significant number of new, high quality jobs associated with $0.5 to
1 billion dollar in potential investments
25
Stillwater Associates
Hawaii Fuels Study – Public Information Briefing – September 8, 2003
Recommendations – Broader Outlook (Continued)
Role for the State in creating an Integrated Energy StrategyState has responsibility, authority, and need to coordinate overall energy needs to support energy policy objectives for a productive, sustainable and efficient State economyStrategic energy planning– Analyze feasibility of LNG and export-capable, integrated refinery,
and full range of sustainable energy options -- renewables, hydrogen, ethanol, and other indigenous energy resources
– As State Energy Resources Coordinator, DBEDT Director’s leadership role in this area is established and recognized, and can facilitate strategic partnerships to develop effective Integrated State Energy Strategy