Embed Size (px)
Citation preview

Hawaii Ocean Time-seriesData Report 1
1988–1989
Stephen ChiswellEric FiringDavid Karl
Roger LukasChristopher Winn
School of Ocean and Earth Science and TechnologyUniversity of Hawaii
1000 Pope RoadHonolulu, Hawaii 96822
U. S. A.
November 1990
SOEST Technical Report #1

Preface
The Hawaii Ocean Time-series (HOT) project has been making repeated observations of thehydrography, chemistry, and biology at a station north of Hawaii since October 1988, with the ob-jective of describing the oceanography at a site representative of the central north Pacific Ocean.
Cruises are made approximately once a month to the HOT deep-water station (22°45’N,158°W) about 100 km north of Oahu, Hawaii. Measurements of the hydrography, water columnchemistry, primary production, and sedimentation rates are made over three days.
This document reports the data collected during the first 15 months of the HOT program. Thedata reported here are a screened subset of the complete data set. Only two CTD casts for eachcruise are presented, although between 10 and 20 casts are typically made each cruise. Summaryplots are given for CTD, meteorological, and ADCP observations.
A more complete data set resides on a Sun workstation at the University of Hawaii. Thesedata are in ASCII form, and can easily be accessed using anonymous ftp via the Internet. Detailson obtaining the data are given in Section VIII. The entire data set has also been submitted to theNational Oceanographic Data Center (NODC) Office and is available through that service.
- i -

Acknowledgements
Many people have participated in cruises under the HOT program. They are listed in Table IV.B.3. We gratefully acknowledge their involvement and support.
Special thanks are due to Dale Hebel, Ricardo Letelier, Stewart Reid, Marc Rosen, and Jefrey Snyder for participating in most of the cruises, and for the tremendous amount of time andeffort they have put into the program. In addition, we would like to acknowledge the contribu-tions made by Sharon DeCarlo and Eric Loucks for programming; Lance Fujieki, Janice Sato,and Bo Yang helped with the data processing. Ursula Magaard performed many routine chemicalanalyses, including Winkler titrations. Ted Walsh and Gerald Akiyama performed the salinity andnutrient analyses. Without the assistance of these people, the data presented in this report couldnot have been collected, processed and analyzed. We would like to thank Anne Shure for herhelp in the production of this document.
We also would like to thank the Captains and crew members of the R/V MOANA WAVEand SSP KAIMALINO for their efforts.
This dataset was acquired under National Science Foundation (NSF) grants OCE-8717195(WOCE) and OCE-8800329 (JGOFS). Ship time on SSP KAIMALINO was partially supportedby the National Oceanic and Atmospheric Administration (NOAA).
- iii -

Table of Contents
I. Introduction . . . . . . . . . . . . . . . . . . . . . . . . . . . . . 1
II. Sampling Procedures and Analytical Methods . . . . . . . . . . . . . . . 3
II.A. CTD Profiling . . . . . . . . . . . . . . . . . . . . . . . . . 3
II.A.1. CTD Data Acquisition and Processing . . . . . . . . . . . . . 3
II.A.2. CTD Sensor Corrections and Calibration . . . . . . . . . . . . 5II.A.2.a. Pressure . . . . . . . . . . . . . . . . . . . . . 5
II.A.2.b. Temperature . . . . . . . . . . . . . . . . . . . 5II.A.2.c. Conductivity . . . . . . . . . . . . . . . . . . . 6
II.A.2.d. Dissolved Oxygen . . . . . . . . . . . . . . . . . 7
II.A.2.e. Fluorescence . . . . . . . . . . . . . . . . . . . 10
II.B. Water Column Measurements . . . . . . . . . . . . . . . . . . . 10
II.B.1. Salinity . . . . . . . . . . . . . . . . . . . . . . . . . 11
II.B.2. Dissolved Oxygen . . . . . . . . . . . . . . . . . . . . 12
II.B.3. Dissolved Inorganic Carbon . . . . . . . . . . . . . . . . . 12
II.B.4. Inorganic and Organic Nutrients . . . . . . . . . . . . . . . 13
II.B.4.a. Nitrate plus Nitrite and Dissolved Organic Nitrogen . . . 13
II.B.4.b. Orthophosphate and Dissolved Organic Phosphorus . . . 14
II.B.4.c. Silicate . . . . . . . . . . . . . . . . . . . . . 14
II.B.5. Particulate Carbon and Nitrogen . . . . . . . . . . . . . . . 14
II.B.6. Particulate Phosphorus . . . . . . . . . . . . . . . . . . . 14
II.B.7. Chlorophyll a and Phaeopigments . . . . . . . . . . . . . . 15
II.B.8. Bacterioplankton . . . . . . . . . . . . . . . . . . . . . 15
II.B.9. Adenosine 5’-Triphosphate . . . . . . . . . . . . . . . . . 15
II.C. Primary Productivity . . . . . . . . . . . . . . . . . . . . . . . 16
II.D. Particle Flux . . . . . . . . . . . . . . . . . . . . . . . . . . 17
II.D.1. Sediment Trap Design and Sample Collection . . . . . . . . . . 17II.D.2. Sediment Trap Analyses . . . . . . . . . . . . . . . . . . 17
II.D.2.a. Carbon, Nitrogen, and Phosphorus Fluxes . . . . . . . 18
II.D.2.b. Mass Flux . . . . . . . . . . . . . . . . . . . . 18
II.E. ADCP Profiling . . . . . . . . . . . . . . . . . . . . . . . . . 18
II.E.1. Shipboard ADCP . . . . . . . . . . . . . . . . . . . . 18II.E.2. Lowered ADCP (LADCP) . . . . . . . . . . . . . . . . . 19
II.F. Meteorology . . . . . . . . . . . . . . . . . . . . . . . . . . 20
II.G. XBT . . . . . . . . . . . . . . . . . . . . . . . . . . . . . 20
II.H. Light Measurements . . . . . . . . . . . . . . . . . . . . . . . 20
III. Results . . . . . . . . . . . . . . . . . . . . . . . . . . . . . . . 21
III.A. CTD Profiling . . . . . . . . . . . . . . . . . . . . . . . . . 21
III.A.1. Surface Layer . . . . . . . . . . . . . . . . . . . . . . 21
III.A.2. Temperature . . . . . . . . . . . . . . . . . . . . . . 21
III.A.3. Salinity . . . . . . . . . . . . . . . . . . . . . . . . . 21III.A.4. Dissolved Oxygen . . . . . . . . . . . . . . . . . . . . 22
III.A.5. Inorganic Nutrients . . . . . . . . . . . . . . . . . . . . 22
III.A.6. Fluorescence . . . . . . . . . . . . . . . . . . . . . . . 22
III.B. Water Column Chemical Measurements . . . . . . . . . . . . . . . 23
III.C. Primary Productivity . . . . . . . . . . . . . . . . . . . . . . . 24
III.D. Particle Flux . . . . . . . . . . . . . . . . . . . . . . . . . . 24
III.E. ADCP Profiling . . . . . . . . . . . . . . . . . . . . . . . . . 25
III.E.1. Shipboard ADCP . . . . . . . . . . . . . . . . . . . . 25
III.E.2. Lowered ADCP . . . . . . . . . . . . . . . . . . . . . 27
III.F. Meteorology . . . . . . . . . . . . . . . . . . . . . . . . . . 27
III.G. Light measurements . . . . . . . . . . . . . . . . . . . . . . . 27
IV. Cruise Summaries . . . . . . . . . . . . . . . . . . . . . . . . . . 27
IV.A. Cruise Summaries . . . . . . . . . . . . . . . . . . . . . . . . 27
IV.B. Cruise Dates and Personnel . . . . . . . . . . . . . . . . . . . . 30
V. References . . . . . . . . . . . . . . . . . . . . . . . . . . . . . 32
VI. Data . . . . . . . . . . . . . . . . . . . . . . . . . . . . . . . . 35
VI.A. CTD Profiling . . . . . . . . . . . . . . . . . . . . . . . . . 35
VI.B. Water Column Measurements . . . . . . . . . . . . . . . . . . . 57
VI.C. Primary Productivity . . . . . . . . . . . . . . . . . . . . . 154
VI.D. Particle Flux . . . . . . . . . . . . . . . . . . . . . . . . . 159
VII. Figures . . . . . . . . . . . . . . . . . . . . . . . . . . . . . . 161
VII.A. CTD Profiling . . . . . . . . . . . . . . . . . . . . . . . . 161
VII.B. Water Column Measurements . . . . . . . . . . . . . . . . . . 199

VII.C. Primary Productivity . . . . . . . . . . . . . . . . . . . . . . 209
VII.D. Particle Flux . . . . . . . . . . . . . . . . . . . . . . . . . 212
VII.E. ADCP Profiling . . . . . . . . . . . . . . . . . . . . . . . . 219
VII.F. Meteorology . . . . . . . . . . . . . . . . . . . . . . . . . 249
VII.G. Light . . . . . . . . . . . . . . . . . . . . . . . . . . . . 253
VII.H. Station Locations and Sediment-Trap Tracks . . . . . . . . . . . . 255
VIII. Data Availability and Distribution . . . . . . . . . . . . . . . . . . . 269
I. Introduction
In 1987, the National Science Foundation established a special-focus research initiativetermed ‘The Global Geosciences Program’. This program is intended to support studies of theearth as a system of interrelated physical, chemical, and biological processes that act together toregulate the habitability of our planet. The stated goals of this program are two-fold. The firstgoal is to understand the earth-ocean-atmosphere system and how it functions. The second goal isto describe, and eventually predict, major cause-and-effect relationships. Two of the componentsof the Global Geosciences Program are the World Ocean Circulation Experiment (WOCE) andthe Joint Global Ocean Flux Study (JGOFS) programs. The former is focused on physical oceano-graphic processes and the latter on biogeochemical processes.
The Hawaii Ocean Time-series (HOT) project has been funded under the WOCE and JGOFSprograms to make repeated observations of the hydrography, chemistry, and biology for fiveyears at a station north of Hawaii. The objectives of HOT are to describe the physical oceanogra-phy, and to identify and quantify the processes controlling biogeochemical cycling in the ocean ata site representative of the central north Pacific Ocean.
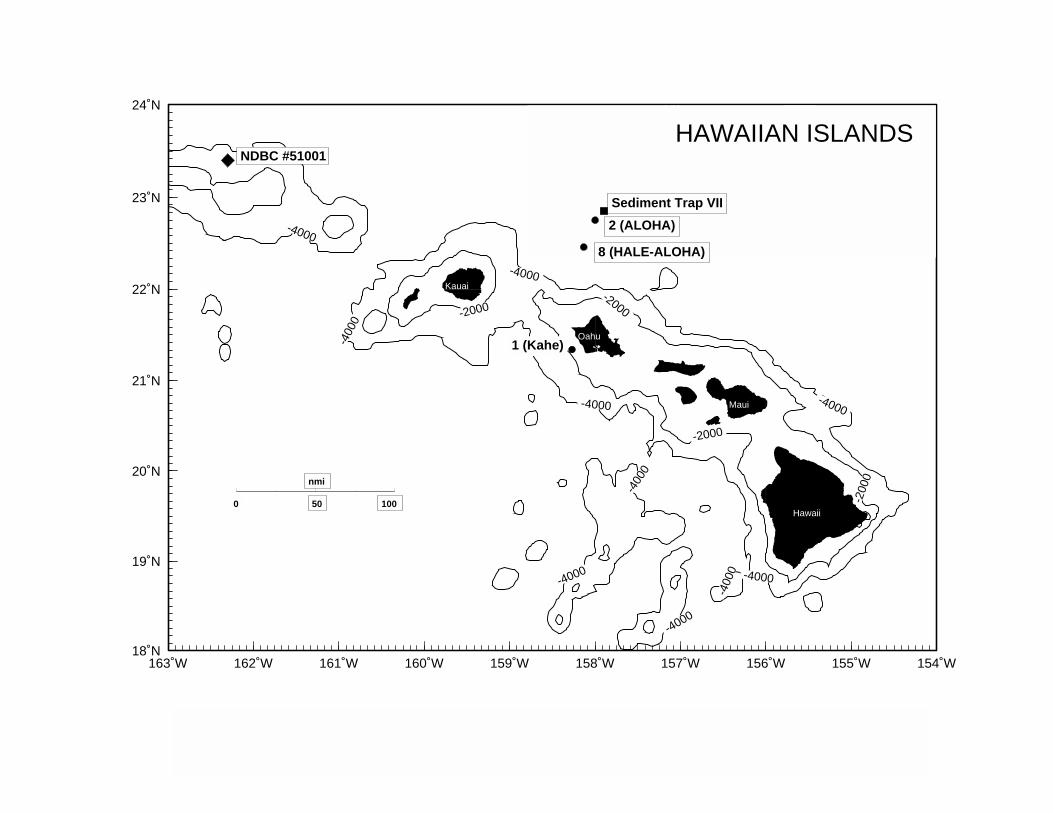
The HOT deep-water station, also known as Station ALOHA (A Long-term OligotrophicHabitat Assessment), is about 100 km north of Kahuku Point, Oahu, Hawaii (Figure I.1). Cruisesare made to the site about once a month, and about three days are spent on station. The cruiselength is dictated by the minimum time necessary to obtain reasonable estimates of particle fluxusing free-floating sediment traps. The WOCE requirements for HOT are met by making a 36-hour burst of CTD casts to obtain temperature, salinity, dissolved oxygen, and fluorescence pro-files. Water samples are collected simultaneously with the CTD casts for the measurement of avariety of parameters, including inorganic and organic nutrient concentrations, microbial biomass,and primary production. Velocity measurements are made using a shipboard Acoustic DopplerCurrent Profiler (ADCP) and a Lowered ADCP.
The nominal deep-water station is at 22°45’N, 158°W. We have defined the station to be a10-km radius circle centered on this position. Every effort is made to sample within this circle, es-pecially during the 36-hour burst of CTD sampling.
A station is also occupied at 21°20.6’N, 158°16.4’W, near Kahe Point, Oahu, during the tran-sit from Honolulu to Station ALOHA. The Kahe Point station is used primarily to test the CTDand other equipment, but it also provides additional time-series data at a near-shore site. TheKahe Point station is located in approximately 1500 m of water about 16 km from shore.
This report presents data collected during the first 12 cruises of HOT, from October 1988 toNovember 1989. Two ships were used during this time period: the University of Hawaii’s
- 1 -
-4000
-4000
-4000
-4000
-4000
-4000
-400
0
-400
0
-4000
-4000
-400
0
-2000-2000
-200
0
-2000
163˚W 162˚W 161˚W 160˚W 159˚W 158˚W 157˚W 156˚W 155˚W 154˚W18˚N
19˚N
20˚N
21˚N
22˚N
23˚N
24˚N
HAWAIIAN ISLANDS
Kauai
Oahu
Maui
Hawaii
1 (Kahe)
2 (ALOHA)
8 (HALE-ALOHA)
NDBC #51001
Sediment Trap VII
0 50 100
nmi
Figure 1.1: Map of Hawaiian Island, Showing Station ALOHA, the Kahe Point Station, and NDBC Buoy.

R/V MOANA WAVE, and the SSP KAIMALINO operated by Seaco for the Naval Ocean Sys-tem Center (NOSC).
II. Sampling Procedures and Analytical Methods
II.A. CTD Profiling
CTD data are collected with a Sea-Bird SBE-09 CTD, which has an internal Digiquartz pres-sure sensor and external temperature, conductivity, and dissolved oxygen sensors. During 1989,Sea-Bird introduced a temperature-conductivity duct, so that water is pumped through both thetemperature and conductivity sensors. This T-C duct has been used since HOT-11. The instru-ment also has provision for an external fluorometer and/or transmissometer. The CTD is mountedin a rosette, and the package is deployed on a three-conductor cable, allowing for real-time dataacquisition and data display. Water samples are taken on the upcasts for chemical analyses, andfor calibration of the conductivity and oxygen sensors.
A single CTD cast to approximately 1000 dbar is made at the Kahe Point station each month.
At Station ALOHA, a burst of consecutive CTD casts to 1000 dbar is made over 36 hours tospan the local inertial period (~31.0 hours) and three semi-diurnal tidal cycles. This sampling isdesigned so that tidal and near-inertial variability during each cruise can be averaged to preventthese components from aliasing the longer time-scale signals. In order to satisfy WOCE require-ments, one deep cast to near the bottom is made on each cruise. When cruises are made on a shipequipped with a 12-kHz echo sounder, a Benthos acoustic pinger attached to the rosette is used tomake the cast to within 50 m of the sea floor (approximately 4750 m); otherwise the cast is madeto 4500 dbar.
II.A.1. CTD Data Acquisition and Processing
CTD data are acquired at the instrument’s highest sampling rate of 24 samples per second.Digital data are stored on a PC-compatible computer and, for redundancy, the analog CTD signalis recorded on VHS video tapes.
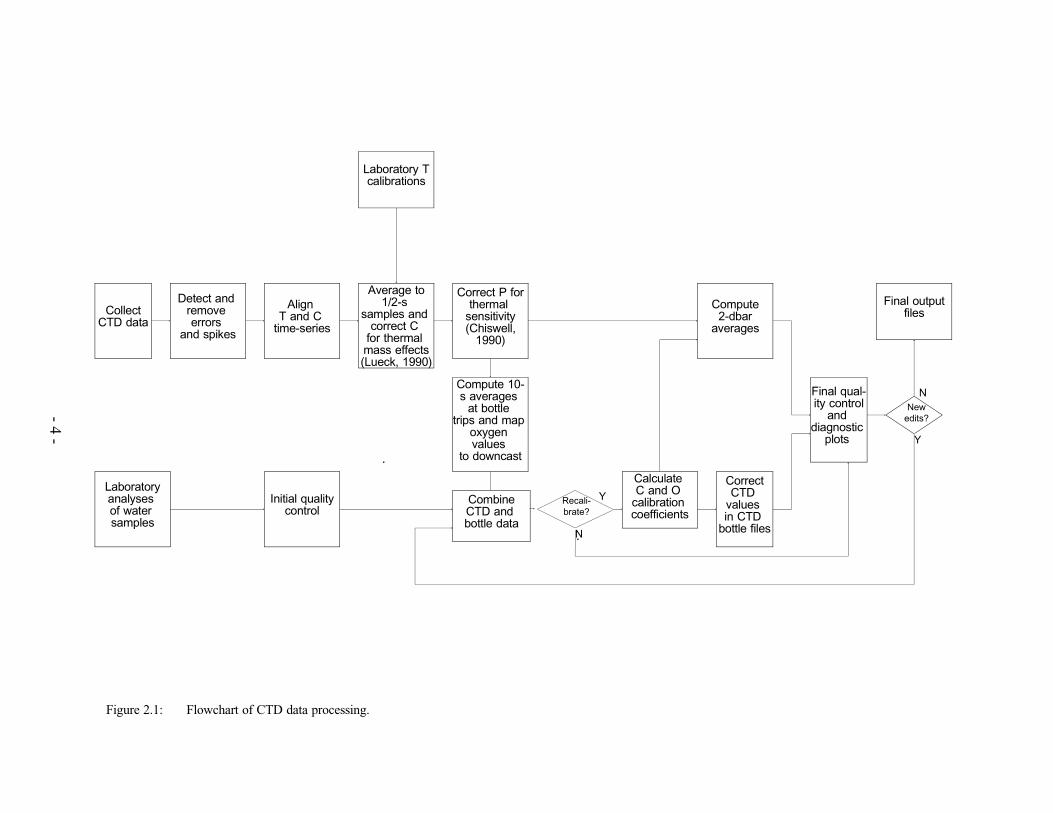
A flowchart of the CTD processing is shown in Figure II.A.1. The raw data (pressure, pres-sure-sensor temperature, temperature, conductivity, oxygen-sensor current, and oxygen-sensortemperature) are recorded as voltages or frequencies output from the various sensors. The firststep is to convert these to scientific units (dbar, °C, °C, S m-1, mA, °C, respectively). The dataare then subjected to quality control procedures and preliminary processing. First they arescreened for spikes or missing data using a 9-point median filter. After screening, the correctalignment of temperature and conductivity time-series is computed since the lag between tempera-ture and conductivity can change from cruise to cruise, depending on the particular placement ofthe sensors, and whether the T-C duct is used.
- 3 -
N
CollectCTD data
Detect and remove errors
and spikes
Average to1/2-s
samples and correct C
for thermal mass effects(Lueck, 1990)
Correct P forthermal
sensitivity(Chiswell,
1990)
Compute 2-dbar
averages
Final qual-ity control
and diagnostic
plots
Laboratory Tcalibrations
Laboratoryanalyses of water samples
Initial qualitycontrol
Compute 10-s averages
at bottle trips and map
oxygen values
to downcast
CombineCTD and bottle data
Recali-brate?
CorrectCTD
values in CTD
bottle files
Newedits?
Calculate C and O
calibration coefficients
Final outputfiles
Align T and C
time-series
Y
N
Y
Figure 2.1: Flowchart of CTD data processing.
- 4 -

The data are then averaged to half-second values, and the pressure, temperature, conductivity,and oxygen calibration corrections are applied. Salinity and dissolved oxygen are then computed.Details of these corrections are described in the following sections.
Eddy shed wakes, caused by the rosette entraining water, introduce salinity spikes in the CTDprofile data. These contaminated data are handled by using an algorithm which eliminates datacollected when the CTD’s speed is less than 0.25 m s-1 or its acceleration is greater than 0.25 m s-2. Finally, the data are averaged into 2 dbar pressure bins.
Temperature is reported here in the IPTS-68 scale. Salinity and all derived units are calcu-lated using the UNESCO (1981) routines.
II.A.2. CTD Sensor Corrections and Calibration
II.A.2.a. Pressure
The CTD pressure is measured with an internal 6000 dbar Paroscientific Digiquartz pressuretransducer. Pressure is corrected for dynamic temperature effects using:
Pcor = a Pm − h ∗ T + Poffset
where Pcor is the corrected pressure, Pm is the measured pressure, a and Poffset are calibration coef-ficients, and * signifies the convolution of an impulse response function, h, with the water tem-perature, T. The calibration coefficient, a, is determined from calibrations at constant temperatureconducted twice yearly against a reference Paroscientific pressure standard, which has a calibra-tion traceable to the National Bureau of Standards; Poffset is chosen to ensure that the pre-cast on-deck pressure is zero. The impulse response function, h, was computed by measuring pressureperturbations when the CTD was plunged into a cold water bath; details of this determination aregiven in Chiswell (1990).
II.A.2.b. Temperature
The Sea-Bird temperature sensors (SBE-3-02/F) can be removed and calibrated inde-pendently. Two sensors (#741 and #886) were used during 1988–1989. Sensors #886 and #741were originally calibrated at the Northwest Regional Calibration Center in October 1988 August1987, respectively; both sensors were recalibrated in November 1989. Between cruises, the sen-sors were intercalibrated against each other to check for sudden calibration changes. Based on theexperience of Sea-Bird (Nordeen Larson, personal communication, 1990), and available lab inter-calibrations, corrections were made to temperature assuming that the sensors drifted linearly between calibrations. Table II.A.1 lists the corrections made for each cruise.
- 5 -

II.A.2.c. Conductivity
The conductivity sensors (SBE-4-02/0) can be removed from the CTD for recalibrationand/or cleaning. Three sensors were used in 1988-89 (Table II.A.1).
Conductivity is corrected for the thermal inertia of the glass conductivity cell using the recur-sive filter given by Lueck (1990) and Lueck and Picklo (1990):
Ct(n) = −b Ct (n−1) + γ a [Tc(n) − Tc(n−1)]
where γ = ∂C∂T
S P , Tc is filtered temperature, and a and b are coefficients calculated from
sensor parameters α and β, which characterize the initial magnitude of the thermal effect and its
relaxation time, respectively. As recommended by Lueck (personal communication, 1990), β was
set to 0.1 s-1 for all cruises, but α was calculated separately for each cruise to close the spread
between the down- and up-cast T-S curves. Table II.A.1 lists the values of α used for each cruise.
Table II.A.1: Temperature and Conductivity Sensor Corrections
HOT Temp # T Correction Cond # α Drift** Station:Casts*
°C 10-8(S m-1)s-1
1 886 0.0006 528 0.028 2:1–13
1 375 0.045 - 10 2:14–17
2 886 0.0013 375 0.045 - 11 all
3 741 0.0065 375 0.045 - 14 all
4 886 0.0035 375 0.010 - 13 all
5 886 0.0041 375 0.045 all
6 886 0.0054 375 0.045 - 9 all
7 886 0.0063 375 0.045 all
8 886 0.0071 375 0.045 1:1–2; 2:1–12
8 527 0.045 2:13–15
9 886 0.0078 527 0.045 all
10 886 0.0085 527 0.045 all
11 741 0.0101 375 0.045 - 7 all
12 741 0.0106 375 0.045 - 10 all
*Station 1 is Kahe Point Station; Station 2 is Station ALOHA**Drifts are calculated only where sensor #375 was used on 4500 dbar casts
The final conductivity cell calibration is computed from salinity check samples. In situ con-ductivity is back-calculated from the bottle salinity using the CTD pressure and temperature at
- 6 -
the time of the bottle trip. These in situ conductivity values are compared with those from theCTD and a correction is made on a cast-by-cast and cruise-by-cruise basis as needed.
Conductivity sensor #375 was found to drift for a few hours after power-up. Tests performedon the sensor after it was returned to Sea-Bird in early 1990 indicated that the drift was causedby unstable electronics. Empirical calculations of conductivity drifts required to minimize thespread in deep T-S between the down- and up-casts indicated that the drift was nearly linear intime, but that the rates varied somewhat from cruise to cruise. These rates were so small that theyintroduced significant salinity errors only in the deep casts, which typically take 3 to 4 hours tocomplete. Table II.1 includes the drift rates used to correct sensor #375 (no drifts are given forHOT-5, -7, -8 because no deep casts were made during these cruises). After applying these cor-rections, the spreads between down- and up-cast T-S curves were comparable to the spreads incasts made using other sensors (r.m.s spread was about 0.001 psu).
Calibrations for conductivity cell #375 for cruises from HOT-5 to HOT-12 showed a stronglinear dependence on pressure in the upper 200 dbar. We suspect that these were caused by asmall crack in the cell found when it was returned to Sea-Bird.
The quality of the CTD calibration is illustrated by Figures II.A.2, which shows the differ-ences between the corrected CTD salinities and the bottle salinities as a function of pressure foreach cruise. Typically, the calibrations are best below 500 dbar, because the weaker vertical salin-ity gradients at depth lead to less error if the bottle and CTD pressures are slightly mismatched.From HOT-5 on, the differences are significantly worse in the upper 200 dbar when cell #375was used, because of the crack. Below 500 dbars, standard deviations between the calibrated sa-linities and the bottle salinities range from a minimum of 0.0013 psu (HOT-4) to a maximum of0.0034 psu (HOT-7); these values are shown in Table II.A.2.
II.A.2.d. Dissolved Oxygen
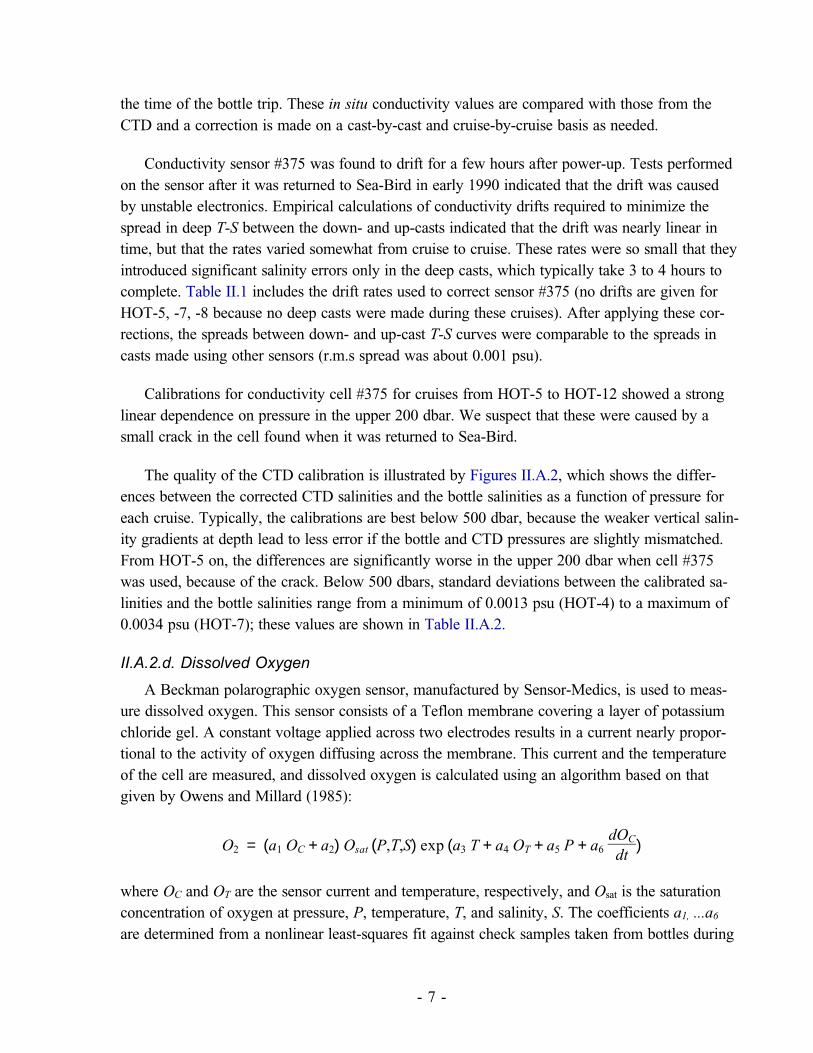
A Beckman polarographic oxygen sensor, manufactured by Sensor-Medics, is used to meas-ure dissolved oxygen. This sensor consists of a Teflon membrane covering a layer of potassiumchloride gel. A constant voltage applied across two electrodes results in a current nearly propor-tional to the activity of oxygen diffusing across the membrane. This current and the temperatureof the cell are measured, and dissolved oxygen is calculated using an algorithm based on thatgiven by Owens and Millard (1985):
O2 = (a1 OC + a2) Osat (P,T,S) exp (a3 T + a4 OT + a5 P + a6 dOC
dt)
where OC and OT are the sensor current and temperature, respectively, and Osat is the saturationconcentration of oxygen at pressure, P, temperature, T, and salinity, S. The coefficients a1, ...a6
are determined from a nonlinear least-squares fit against check samples taken from bottles during
- 7 -


the deep cast. Because the oxygen sensor shows considerable hysteresis (upcast oxygen valuesare very different from the downcast values) the calibration is made using the downcast CTD val-ues of OC, OT, P, T, and S at the density levels where the bottles were closed on the upcast.
Table II.A.2. shows the standard deviations of differences between the calibrated CTD andbottle oxygen values.
Table II.A.2: Standard Deviations of Calibrated CTD Values - Bottle Values
Salinity (psu) Oxygen (µmol kg -1)
HOT 0 < P < 4500 500 < P < 4500 0 < P < 4500
1 0.0050 0.0021 9.3
2 0.0050 0.0017 14.4
3 0.0032 0.0022 6.9
4 0.0107 0.0013 0.8
5 0.0310* 0.0026 3.4
6 0.0132* 0.0020 3.0
7 0.0175* 0.0034 5.2
8 0.0200* 0.0027 2.5
9 0.0063 0.0021 1.9
10 0.0039 0.0021 3.6
11 0.0262* 0.0031 2.7
12 0.0305* 0.0020 3.1
*conductivity sensor #375 used with hairline crack
In order to satisfy WOCE requirements for vertical resolution, between 36 and 48 water sam-ples (depending on whether the 12- or 24-place rosette was used) were taken on each of two orthree consecutive casts. These data are used to calibrate the conductivity and oxygen profiles ofthe 4500 dbar cast. During the first year of HOT, bottle samples from these casts were not inter-leaved (i.e., the deepest samples were taken on one cast, and the shallowest were taken on an-other).
This does not pose a significant problem for the conductivity calibration, but because the oxy-gen sensor drifts, in some cases significantly, between casts, the oxygen calibration is more prob-lematic. The oxygen calibration is very nonlinear, and if one were to calibrate the deep cast usingonly the samples taken on that cast (usually below 2500 dbar), the shallow oxygen trace could bewildly in error because there would be no bottle data to constrain it near the surface.
We have calibrated the oxygen sensor using the ensemble bottle data—akin to assuming thatthe sensor does not drift. In fact, in some cruises, the drift was large between casts, and calibrateddissolved oxygen traces do not agree well with the bottle data for casts where no bottle samples
- 9 -

were taken. HOT-1 appears to be the worst cruise (Figure VII.A.10b), where the difference be-
tween the CTD oxygen trace and the bottle values is as much as 25 µmol kg-1 in places. On othercruises, e.g., HOT-9 and -11, the sensor was apparently much more stable, and could be cali-brated satisfactorily.
II.A.2.e. Fluorescence
In situ fluorescence is measured using a fluorometer manufactured by Sea Tech Inc., havingan excitation wavelength of 425 nm and an emission wavelength of 625 nm. Fluorometer voltageis recorded and averaged into 2 dbar pressure bins as described in Section II.A.1. As much as pos-sible fluorescence traces are acquired at night when samples for the fluorometric determination ofchlorophyll a are collected. Because of equipment problems, no fluorescence data were obtainedon HOT-5 and -7.
II.B. Water Column Measurements
Samples for water column chemical analyses are collected at both Kahe Point and StationALOHA. Most of the samples are collected in the upper 1000 m. As much as possible, depth pro-files of specific chemical constituents are collected on consecutive casts in order to minimize theeffects of time-dependent variation within the water column. In addition, samples are collectedfrom the same depths each month in order to facilitate comparisons between monthly profiles. Inthe first year, approximately 20% of the discrete chemical samples were collected in triplicate.
A 12-place General Oceanics rosette was used for water sample collection on HOT-1 to HOT- 9. General Oceanics 5- or 30-l Niskin bottles were used with this rosette. The 30-l bottleswere used for the collection of high-volume samples for particulate phosphorus and particulate or-ganic carbon and nitrogen, and the 5-l bottles were used for all other water column sampling.
A 24-place aluminum rosette manufactured by Scripps Institution of Oceanography’s Oceano-graphic Data Facility (ODF) was used beginning on HOT-10. PVC 12-l sampling bottles, alsomade by ODF, are used with this rosette; these bottles are equipped with Buna-N rubber O-rings,Teflon-coated steel springs and standard General Oceanics sampling valves.
Water sampling bottles are washed with dilute hydrochloric acid and rinsed with distilledwater before each cruise.
A detailed description of our sampling procedures and analytical methods has been given in aseparate report (Karl et al., 1990). Abbreviated descriptions of these procedures are included inthis report. During the first year of HOT, the sampling program and analytical protocols were al-tered somewhat as we became more familiar with the laboratory techniques and as our field sam-pling became more efficient.
- 10 -
The primary objective of the Hawaii Ocean Time-series program is to assess variability in thecentral Pacific Ocean on annual and interannual time scales. One of our most important concerns,therefore, is to ensure that highest possible precision and accuracy be consistently maintained forall water column chemical measurements. In order to achieve the highest possible data quality,we have instituted a quality-assurance/quality-control program with the HOT program (see Karlet al., 1990), and have attempted to collect all ancillary information necessary to ensure that ourdata are not biased by sampling artifacts.
II.B.1. Salinity
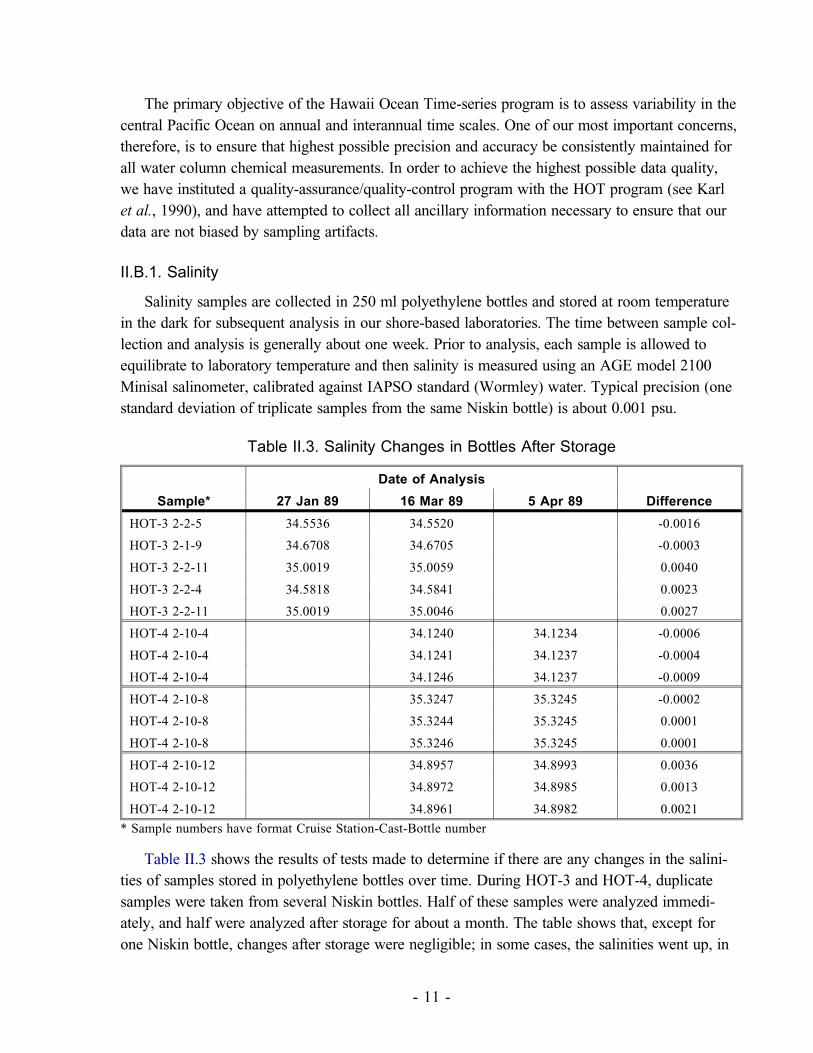
Salinity samples are collected in 250 ml polyethylene bottles and stored at room temperaturein the dark for subsequent analysis in our shore-based laboratories. The time between sample col-lection and analysis is generally about one week. Prior to analysis, each sample is allowed toequilibrate to laboratory temperature and then salinity is measured using an AGE model 2100Minisal salinometer, calibrated against IAPSO standard (Wormley) water. Typical precision (onestandard deviation of triplicate samples from the same Niskin bottle) is about 0.001 psu.
Table II.3. Salinity Changes in Bottles After Storage
Date of Analysis
Sample* 27 Jan 89 16 Mar 89 5 Apr 89 Difference
HOT-3 2-2-5 34.5536 34.5520 -0.0016
HOT-3 2-1-9 34.6708 34.6705 -0.0003
HOT-3 2-2-11 35.0019 35.0059 0.0040
HOT-3 2-2-4 34.5818 34.5841 0.0023
HOT-3 2-2-11 35.0019 35.0046 0.0027
HOT-4 2-10-4 34.1240 34.1234 -0.0006
HOT-4 2-10-4 34.1241 34.1237 -0.0004
HOT-4 2-10-4 34.1246 34.1237 -0.0009
HOT-4 2-10-8 35.3247 35.3245 -0.0002
HOT-4 2-10-8 35.3244 35.3245 0.0001
HOT-4 2-10-8 35.3246 35.3245 0.0001
HOT-4 2-10-12 34.8957 34.8993 0.0036
HOT-4 2-10-12 34.8972 34.8985 0.0013
HOT-4 2-10-12 34.8961 34.8982 0.0021
* Sample numbers have format Cruise Station-Cast-Bottle number
Table II.3 shows the results of tests made to determine if there are any changes in the salini-ties of samples stored in polyethylene bottles over time. During HOT-3 and HOT-4, duplicatesamples were taken from several Niskin bottles. Half of these samples were analyzed immedi-ately, and half were analyzed after storage for about a month. The table shows that, except forone Niskin bottle, changes after storage were negligible; in some cases, the salinities went up, in
- 11 -

others it went down. Overall, the mean increase in salinity after storage for one month was 0.001psu, but because the standard deviation was 0.0028, this is statistically indistinguishable fromzero. We thus expect that the typical 7–10 days storage of the salt samples before analysis leadsto no significant salinity changes.
In the one case where large changes occurred (HOT-4 2-10-12), the standard deviations ofthe triplicates were large, indicating that there may have been some other sampling problems.
II.B.2. Dissolved Oxygen
Samples for dissolved oxygen are drawn as soon as possible after the rosette arrives on deck,and are collected before those for any other constituent. Samples are fixed immediately for sub-sequent analysis in the laboratory. Prior to HOT-11, the titration procedures described by Strick-land and Parsons (1972) were used to determine dissolved oxygen. Samples were collected in300-ml BOD bottles and a 50-ml aliquot was removed for titration. From HOT-11 on, dissolvedoxygen was determined using a more accurate titration method (Carpenter, 1965). Samples aredrawn into precalibrated 125-ml iodine flasks, which are flushed with at least 2 volumes ofseawater. Whole-bottle titrations are conducted manually and the end-point is detected visually.The precision of both methods was typically less than 0.3% (coefficient of variation) in the firstyear of HOT.
Dissolved oxygen concentrations are reported in µmol kg-1, and are calculated assuming the
samples came to the surface adiabatically (i.e., were collected at their potential temperature). Infact, the deep samples usually warm a little en route to the surface. Because a precalibrated vol-ume of sample is drawn and fixed, the weight of the sample depends on its density at time of col-lection. From HOT-1 until HOT-10, the sample temperatures were not measured immediately be-fore they were fixed, and we have calculated the mass using the potential densities (which will belarger than the true densities). Thus, the oxygen concentrations reported here may be slightlylower than those in the deep ocean. However, on HOT-11 and HOT-12, the sample temperatureswere measured, and Figure VII.B.1 shows that difference between these temperatures and in situtemperature was at most 6°C. The maximum error caused by neglecting the associated densitychange is thus about 0.06%, which is less than the average analytical precision of the oxygentritration.
II.B.3. Dissolved Inorganic Carbon
Samples for dissolved inorganic carbon (DIC) are collected in 250-ml Pyrex bottles, and pre-served immediately with 0.1 ml of a saturated mercuric chloride solution. DIC samples are keptin the dark in a cool location and returned to the laboratory for analysis. The coulometric proce-dures used in our analyses are a slight modification of those described by Johnson et al. (1985).Both wet and dry sodium carbonate standards are used for calibrating the instrument. The preci-sion of our DIC measurements increased as we gained experience with the instrument during the
- 12 -
first year of the program. By the end of 1989, the coefficient of variation (i.e., standard deviation,expressed as a percentage of the mean) for field replicates (those drawn from the same Niskin bot-tle) was approximately 0.1 to 0.2%. The accuracy of our DIC determinations was monitored bycomparison with replicate samples analyzed by a high precision manometer in Charles Keeling’slaboratory. By the end of the first year, replicate analyses showed good agreement.
II.B.4. Inorganic and Organic Nutrients
Samples for the determination of nutrient concentrations are collected in acid-washed 125-mlpolyethylene bottles. During the first year of the HOT program, nutrient samples collected fromJGOFS 1000-m casts were prefiltered through combusted GF/F glass fiber filters. Nutrient sam-ples collected from WOCE casts were not prefiltered. Except for silicate, which average 2–3
µmol kg-1 higher after filtration, the two data sets are comparable.
These samples are then immediately frozen for transport to the laboratory. Before analysis,samples are allowed to thaw slowly at room temperature for 7 to 10 hours (Macdonald et al.,1986). Analyses are conducted at room temperature on a four-channel Technicon Autoanalyzer IIcontinuous flow system, using slight modification of the Technicon procedures for the analysis ofseawater samples.
II.B.4.a. Nitrate plus Nitrite and Dissolved Organic Nitrogen
Inorganic nitrogen is measured as the sum of nitrate plus nitrite. Nitrate is quantitatively re-duced to nitrite in a copperized cadmium reduction column. The nitrite produced, along with thenitrite present in the original sample, is coupled with an aromatic amine, which in turn is reactedwith a second aromatic amine to produce an azo dye. The light extinction due to the dye is thenread spectrophotometrically. Stock standards covering the full range of expected values are pre-pared using dried potassium nitrate in seawater. Working standards are prepared daily by dilutingstock standard in low nutrient surface seawater. The detection limit for nitrate plus nitrite is ap-
proximately 0.03 µM. The coefficient of variation for field replicates is typically 0.3%.
Dissolved organic nitrogen is determined by using ultraviolet (UV) light oxidation (Arm-strong et al., 1966; Walsh, 1989). Samples are photo-oxidized for 24 hours, followed by autoana-lyzer analysis of the oxidation products for nitrate plus nitrite (as above), and ammonium usingthe Berthelot (indophenol) method. Dissolved organic nitrogen is calculated as the difference be-tween the total nitrogen (i.e. nitrate, nitrite, and ammonium) after UV oxidation and nitrate plusnitrite before oxidation. Ammonium is not routinely measured in pre-oxidized samples becausethe water column ammonium concentrations are below the detection limit of approximately 0.05
µM. The coefficient of variation for field replicates of DON averages 4%.
- 13 -
II.B.4.b. Orthophosphate and Dissolved Organic Phosphorus
Orthophosphate (soluble reactive phosphorus) is measured using acidified molybdate reagentand potassium antimonyl tartrate. The resulting compound is reduced to an intensely colored mo-lybdenum blue by ascorbic acid and measured spectrophotometrically. Stock standards are pre-pared using dried potassium phosphate monobasic. Working standards are prepared daily by dilut-ing stock standard in low nutrient surface seawater. The detection limit for phosphorus is
approximately 0.02 µM. The coefficient of variation for field replicates averages 1%.
Dissolved organic phosphorus is measured by photo-oxidation (2–2.5 hours), followed byanalysis of the oxidation products as described above. Dissolved organic phosphorus is calculatedby the difference between the phosphorus content before and after UV treatment (as above). Thecoefficient of variation for field replicates averages 4%.
II.B.4.c. Silicate
Soluble reactive silicate is combined with ammonium molybdate at low pH to produce a yel-low silicomolybdic acid. In order to increase the sensitivity of the reaction, silicomolybdic acid isreduced with ascorbic acid to produce molybdenum blue. Because phosphate also reacts with am-monium molybdate, oxalic acid is added to eliminate phosphate interference. Silicate stock stand-ards are prepared using dried sodium fluorosilicate in seawater in polyethylene containers. Work-ing standards are prepared daily by diluting stock standard in low nutrient surface seawater. The
detection limit for dissolved silicate is approximately 0.3 µM. The coefficient of variation for
field replicates averages 6%.
II.B.5. Particulate Carbon and Nitrogen
Samples for particulate carbon (PC) and particulate nitrogen (PN) are prefiltered through a
202-µm Nitex mesh, and 4–10 l (depending upon the depth) are then pressure filtered through
combusted GF/F glass fiber filters. The filters are stored frozen for analysis in the laboratory.
Both PC and PN are analyzed using a commercial CHN analyzer (Perkin Elmer model 2400).The samples are combusted in a pure oxygen atmosphere and the resultant gaseous end productsare separated chromatographically and measured with a thermal conductivity detector. Standards
are prepared using acetanilide over the range of 20 to 500 µg sample-1. The coefficient of vari-
ation for water column field replicates of both PC and PN averages approximately 12%.
II.B.6. Particulate Phosphorus
Samples for particulate phosphorus (PP) are prefiltered through a 202-µm Nitex mesh andconcentrated by pressure filtration on combusted and acid rinsed GF/F glass fiber filters. The fil-ters are stored frozen for analysis in the laboratory.
- 14 -
In the laboratory, organic compounds are oxidized by high temperature ashing (450°–500°C).The resultant orthophosphate is then extracted with 0.5 N hydrochloric acid at 90°C, neutralizedwith 6 N sodium hydroxide and reacted with a mixed reagent of molybdic acid, ascorbic acid,and trivalent antimony to form phosphomolybdic acid. The compound is then reduced to the molybdenum blue complex by ascorbic acid and the solution is measured spectrophotometrically.
II.B.7. Chlorophyll a and Phaeopigments
Chlorophyll a and phaeopigments are measured fluorometrically using standard techniques(Strickland and Parsons, 1972). Samples for the determination of chlorophyll a and phaeo-pig-ments are collected under subdued light and concentrated on GF/F glass fiber filters. The filtersare extracted immediately in 100% acetone and stored in the dark at -20°C for analysis in thelaboratory. Fluorescence is measured using a Turner fluorometer (Model #110) and 10% hydro-chloric acid is used to separate fluorescence from chlorophyll a and phaeopigments. Thefluorometer is calibrated at least every six months as described by Strickland and Parsons (1972).Analytical precision for both chlorophyll a and phaeopigments is approximately 1%. The coeffi-cient of variation for field replicates drawn from the same Niskin bottle averages approximately6%. For phaeopigments the coefficient of variation for replicates drawn from the same Niskin bot-tle averages 17%.
In addition to the fluorometric determination of pigments, we also measure chlorophylls andcarotenes by high-performance liquid chromatography (HPLC). Seawater samples (4–10 l) arepressure filtered through GF/F filters and stored in liquid nitrogen until extracted in 100% ace-tone. The extracts were concentrated using Sep-Pak cartridges before injection into the HPLC.Chlorophyll a concentrations were determined using the JGOFS chlorophyll intercalibration stand-ard (supplied by R. Bidigare and C. Kennicutt). Analytical precision for chlorophyll a determina-tions (coefficient of variation on replicate analysis of a single sample) averaged 1.7%.
II.B.8. Bacterioplankton
The procedure used to count bacteria is a slight modification of the standard protocols used inenvironmental research laboratories (Hobbie et al., 1977; Porter and Feig, 1980). Samples aredrawn into cleaned opaque polyethylene bottles. The samples are then preserved immediatelywith filtered 10% paraformaldehyde, stained with 4’,6-diamidino-6-phenylindole (DAPI) andstored at 4°C for enumeration in the laboratory.
In the laboratory, 10–40 ml subsamples (depending upon depth) are filtered through Irgalan
Black prestained 0.2-µm Nuclepore filters. Bacterial cells on three replicate filter preparationsfrom each depth are counted using epifluorescence microscopy.
- 15 -
II.B.9. Adenosine 5’-Triphosphate
Samples for the determination of adenosine 5’-triphosphate (ATP) are collected on GF/F filters and extracted in boiling TRIS buffer. The filters are extracted immediately following filtra-tion. Following extraction for 5 minutes in boiling buffer, the samples are frozen (-20°C) foranalysis in the laboratory. ATP concentrations are measured by photometry using the firefly biolu-minescence reaction. The coefficient of variation on replicate samples drawn from the same Ni-skin bottle averaged approximately 15%.
II.C. Primary Productivity
Photosynthetic production of organic matter is measured by the carbon-14 method. Samplesare collected at eight depths, approximately three hours before sunrise, in acid-washed Go-Flobottles. Care is taken to avoid trace metal contamination during sample collection. The Go-Flobottles are therefore deployed using a dedicated hydrowinch, Kevlar line, a metal-free sheave,Teflon messengers, and a stainless steel bottom weight. Samples for incubation are collected in500-ml polycarbonate bottles which are cleaned with high-purity hydrochloric acid and freshly-prepared glass-distilled deionized water. Samples are collected under low light and inoculatedwith a high-purity carbon-14 labelled sodium carbonate solution.
Incubations were conducted in specially constructed on-deck incubators on all cruises during1988–1989. On some cruises during this period, incubations were also conducted in situ in orderto compare these two different methods. On-deck incubations were conducted for both 12- and24-hour periods using an incubation system which simulated both in situ temperature and in situlight quantity and quality. In situ incubations were conducted for 12 hours on a free-floating insitu array. Samples incubated either on deck or in situ were filtered onto GF/F glass fiber filtersas soon as possible after recovery.
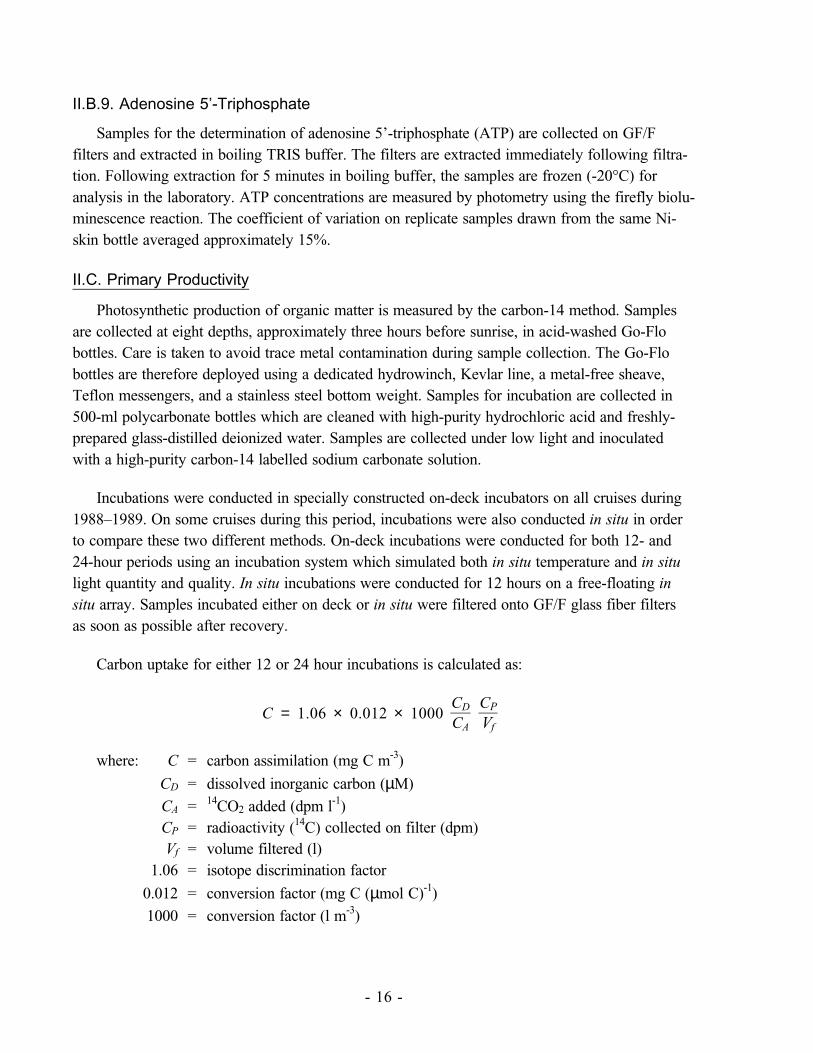
Carbon uptake for either 12 or 24 hour incubations is calculated as:
C = 1.06 × 0.012 × 1000 CD
CA
CP
Vf
where: C = carbon assimilation (mg C m-3)
CD = dissolved inorganic carbon (µM)CA = 14CO2 added (dpm l-1)CP = radioactivity (14C) collected on filter (dpm)Vf = volume filtered (l)
1.06 = isotope discrimination factor
0.012 = conversion factor (mg C (µmol C)-1)1000 = conversion factor (l m-3)
- 16 -

II.D. Particle Flux
Particle flux is measured using sediment traps deployed on a free-floating array which is de-ployed for approximately 72 hours each month.
II.D.1. Sediment Trap Design and Sample Collection
The trap design is patterned after the multitrap system of Knauer et al. (1979). Twelve indi-vidual baffled cylindrical polycarbonate collectors (mouth area = 0.0039 m2) are attached to aPVC cross and are deployed at 150, 300, and 500 m. The array is outfitted with a VHF transmit-ter, an ARGOS satellite transmitter, strobelights, and a radar reflector.
Traps are precleaned with 1M hydrochloric acid and distilled deionized water, then filled witha filtered high-density solution containing 1% formalin as a preservative. The high-density solu-tion is made up of surface seawater augmented with sodium chloride, which prevents advective-diffusive losses of the formalin, as well as flushing of traps during recovery. In order to avoid air-borne contamination of the traps, they are capped immediately after filling and immediately afterrecovery.
II.D.2. Sediment Trap Analyses
Traps are processed from deepest to shallowest to minimize potential contamination. After re-covery, the interface between the trap solution and the overlying seawater is marked, and theseawater is carefully aspirated to a depth of 5 cm above the interface. Beginning on HOT-8, all12 traps from a given depth are aspirated, the entire contents of each are screened through a 335-
µm Nitex mesh to remove swimmers (zooplankton and micronekton which entered the traps
alive). All 12 traps from a given depth are then passed through a single Nitex mesh and the trapsolutions are returned to the individual trap cylinders. The Nitex screen is subsequently preservedin a formalin-seawater solution. The screened contents of three traps from each depth are then fil-tered through individual acid-washed combusted GF/F filters for particulate phosphorus analysis.Six traps are filtered through combusted GF/F filters for particulate carbon and nitrogen analysesand the remaining three traps are used for determination of total particulate mass flux. Replicatealiquots of high density solution, either suspended on the trap line in capped sediment traps, ormaintained in sealed containers, are processed simultaneously with trap samples in order to cor-rect flux measurements for particulate material present in the high-density salt solution. On HOT-1 to -7, trap solutions were combined and replicate aliquots were removed from the com-bined solution for individual determinations. This practice was abandoned on HOT-8 in order topreserve information on variability of particle flux on the scale of the size of individual trap aper-tures.
- 17 -
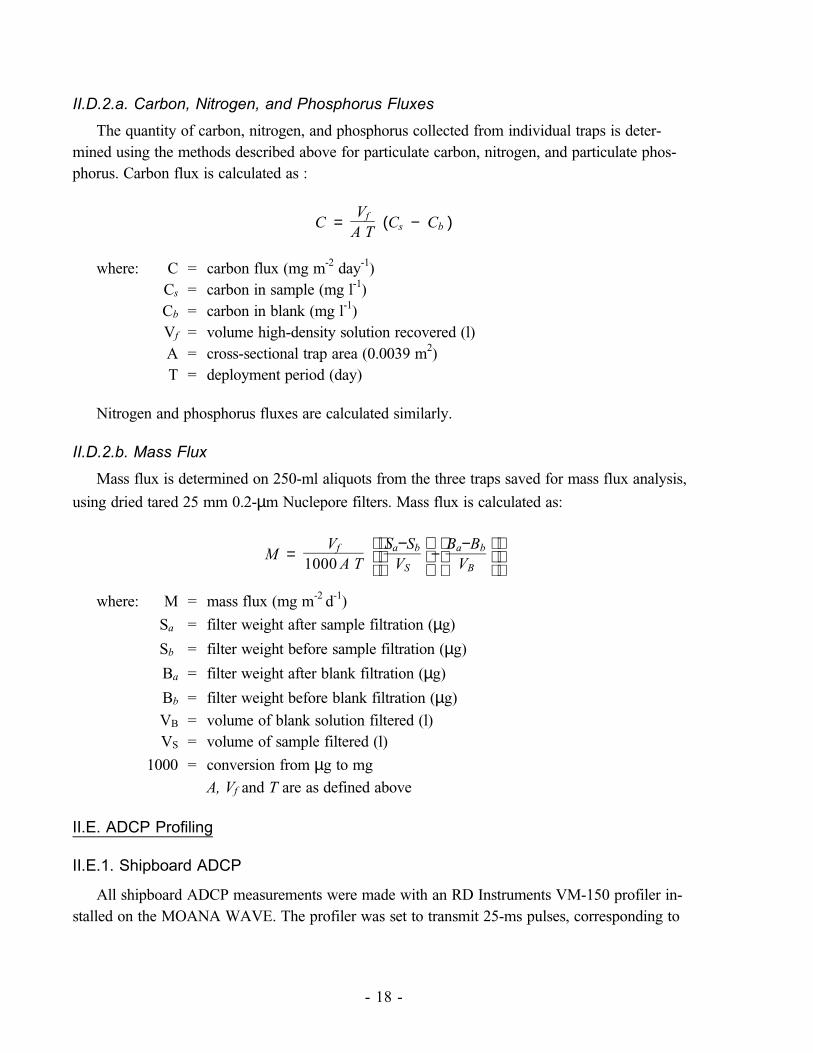
II.D.2.a. Carbon, Nitrogen, and Phosphorus Fluxes
The quantity of carbon, nitrogen, and phosphorus collected from individual traps is deter-mined using the methods described above for particulate carbon, nitrogen, and particulate phos-phorus. Carbon flux is calculated as :
C = Vf
A T (Cs − Cb )
where: C = carbon flux (mg m-2 day-1)Cs = carbon in sample (mg l-1)Cb = carbon in blank (mg l-1)Vf = volume high-density solution recovered (l)A = cross-sectional trap area (0.0039 m2)T = deployment period (day)
Nitrogen and phosphorus fluxes are calculated similarly.
II.D.2.b. Mass Flux
Mass flux is determined on 250-ml aliquots from the three traps saved for mass flux analysis,
using dried tared 25 mm 0.2-µm Nuclepore filters. Mass flux is calculated as:
M = Vf
1000 A T
Sa−Sb
VS −
Ba−Bb
VB
where: M = mass flux (mg m-2 d-1)
Sa = filter weight after sample filtration (µg)
Sb = filter weight before sample filtration (µg)
Ba = filter weight after blank filtration (µg)
Bb = filter weight before blank filtration (µg)
VB = volume of blank solution filtered (l)VS = volume of sample filtered (l)
1000 = conversion from µg to mg
A, Vf and T are as defined above
II.E. ADCP Profiling
II.E.1. Shipboard ADCP
All shipboard ADCP measurements were made with an RD Instruments VM-150 profiler in-stalled on the MOANA WAVE. The profiler was set to transmit 25-ms pulses, corresponding to
- 18 -
8-m vertical resolution. The shallowest velocity estimate was centered at 20 m, and the maximumprofiling range on station usually exceeded 300 m.
The ping rate was about once per second. Profiles were vector averaged in earth coordinatesand recorded in 5-minute ensembles. Profiles were edited using automated screening and visualinspection to remove interference from the ocean bottom in shallow water and from the hydro-graphic wire and/or rosette during CTD casts. The latter was an intermittent problem causing errors of a few cm s-1 usually in only 2 or 3 bins near 50 m depth.
The ship’s motion over the ground was determined from discrete 2-channel Transit satellitefixes and from GPS fixes at the end of each ADCP ensemble, when available. On HOT-11 theTransit receiver was malfunctioning to the point where fixes were deemed unusable, so only GPSfixes were used. All fixes were screened for suitable elevation and other quality parameters, afterwhich a few remaining outliers were removed by hand. The absolute velocity of a reference layer(52–172 m) averaged between fixes was calculated by adding the ship velocity to the ADCP-measured velocity of the reference layer relative to the ship. This absolute reference layer velo-city estimate was then smoothed by convolution with a Blackman window w(t) (Blackman andTukey, 1958) of width T,
w(t) = 0.42 − 0.5 cos (2π t ⁄ T ) + 0.08 cos (4π t ⁄ T ).
For HOT-1, -2, and -3 we used T = 4 hours; for HOT-5, -11, and -12 T was reduced to 2hours. (Transit fix quality on HOT-5 and the GPS coverage on HOT-11 and -12 appeared to war-rant the shorter filter and correspondingly higher resolution.) The smoothed reference layer velo-city added to the velocity of the ship relative to the reference layer is then our best estimate ofthe ship’s velocity over the ground during each ADCP ensemble.
The orientation of the transducer relative to the gyro compass and an amplitude correction fac-tor for the ADCP were determined by standard calibration procedures (Joyce, 1989; Pollard andRead, 1989). Explicit calibration runs were not done during the HOT cruises, so the calibrationcomes from brief periods with simultaneous GPS coverage and either bottom tracking or majorship accelerations, such as arrival on station. Calibration information from adjacent cruises wasused along with that from the HOT cruises. Calibration accuracy (one standard deviation) on theHOT cruises is estimated as 0.5° in orientation and 0.5% in amplitude. The amplitude calibrationtends to be more stable from cruise to cruise than the orientation because the latter is relative to
the gyrocompass, which drifts over a period of days within a range of up to ± 1°. (This has beenobserved by us on other cruises on the MOANA WAVE, and by Pollard and Read [1989] on theRRS DISCOVERY.)
- 19 -

II.E.2. Lowered ADCP
A self-contained ADCP mounted on a rosette sampler was first used for velocity profiling dur-ing a single lowering to 2000 m on HOT-12, November 1989. An RD Instruments SC-300 pro-filer was mounted on the 12-place rosette with the transducer looking downward. The instrumentwas set to transmit 16-m pulses about twice per second, process returns in 16-m bins, and record10-s ensembles of velocities vector-averaged in earth coordinates. Heading was provided by aflux-gate compass and attitude by a 2-axis tilt sensor.
Because the motion of the LADCP over the ground is not known, the strategy for processingthe profiles is to calculate the vertical shear from each 10-s ensemble, average the shears in depthbins covering the depth range of the cast, and integrate this averaged shear profile to get the velocity relative to an unknown constant of integration. The constant can be determined from ac-curate navigation at the start and end of the cast, if available, but this has not been done yet. Simi-larly, one can simply match the absolute shipboard ADCP profile to the overlapping part of theLADCP profile. This has been done.
So far, the depth of the LADCP has been determined only by integrating the vertical velocityof the LADCP relative to the water, as measured by the LADCP. Accumulated errors are a fewtens of meters. It will be possible to do better by using the depth as measured by the CTD, butthis has not been done yet. (The LADCP technique is new; only preliminary data processing andanalysis have been done to date. See Firing and Gordon, 1990, for details.)
II.F. Meteorology
Meteorological data are collected at four-hour intervals while on station. Wind speed and di-rection, atmospheric pressure, wet- and dry- bulb air temperature, sea surface temperature, cloudcover, and sea state are recorded. In addition, meteorological data from an NDBC meteorologicalbuoy (NDBC Buoy 51001) located about 280 km northwest of Kauai (Figure I.1) are availablefrom NODC.
II.G. XBT
XBT casts are generally made spaced seven minutes of latitude apart during the transit fromthe deep-water site to Kaena Point. Sippican T-7 probes having a maximum depth of 750 m areused. The files have been screened for bad and missing data. No other corrections are applied.
II.H. Light Measurements
Incident irradiance at the sea surface was measured on each HOT cruise with a Licor LI-200data logger and cosine collector. Irradiance levels are averaged over 10-minute intervals and inte-grated over the daylight period during the primary production experiment. Beginning on
- 20 -

HOT-10, vertical profiles of Photosynthetically Available Radiation (PAR) were obtained with aBiospherical Instruments model PNF-300 optical profiler.
III. Results
III.A. CTD Profiling
The hydrographic structures observed at the HOT station during the first year of the programare presented in Figures VII.A.10–24, and are described below. First, the surface layer propertiesare given, and then the vertical structures of temperature, salinity, dissolved oxygen, and nutrientsare described. The deep ocean properties are generally consistent with those described by Reid(1965) and Talley and Joyce (1990) from previous measurements north of Oahu. The shallowerfeatures are consistent with those described by Tsuchiya (1968).
III.A.1. Surface Layer
Surface temperatures ranged from 23°C to 26°C, with coolest sea surface in late winter. Sur-face salinities ranged from 34.55 psu to 35.20 psu. The tendency was for freshest surface watersto occur in the spring; however, the lowest sea surface salinity was in August 1989.
Subjectively estimated mixed layer depths varied from less than 10 m to about 115 m. Mostof the time, the mixed layer depth was in the range 40–75 m.
III.A.2. Temperature
Typically, the thermocline at the HOT station extended from about 100 m to 600 m (FigureVII.A.22a). Within each cruise, the repeated CTD profiling revealed vertical displacements of thethermocline with a range of up to 50 m. These displacements are due to internal waves, such asthe internal semidiurnal tide, and they are the primary factor which motivated the burst-modesampling that we adopted.
Potential temperature within 100 m of the bottom is about 1.11°C (Figure VII.A.22b). We areunable to detect any significant changes in the deep temperatures at this early point in the pro-gram.
III.A.3. Salinity
The prominent features in salinity are the shallow maximum, the salinity minimum, and thehigh salinity bottom waters. The salinity maximum is found at potential temperatures rangingfrom 20.5°C to 23°C (~150 m), and the maximum values range from 35.05 psu to 35.35 psu
(Figure VII.A.23a). The 24.4 σθ surface falls in the middle of this range. This isopycnal is venti-
lated just north of the HOT site in the winter time, and near 30°N in the summer (Tsuchiya,1968). The large variability of properties on this surface is certainly related to the proximity to
- 21 -
the ventilation region. There is no clear pattern of seasonal variability in this feature. DuringHOT-7, multiple intrusions of fresher waters into the salinity maximum were seen.
The salinity minimum is associated with North Pacific Intermediate Water (Reid, 1965). It is
usually found at a potential temperature of 6.5°C (about 26.8 σθ), near 500 m. Variations within
the salinity minimum were surprisingly large, ranging from 34.05 psu to 34.15 psu (FigureVII.A.23). High salinity (and low dissolved oxygen) intrusions into the salinity minimum wereobserved with values as high as 34.25 psu. Such intrusions were observed on HOT-2, -4, -9 and -10. This variability is likely to be associated with event-like ventilation of this isopycnal surfaceas it occasionally outcrops in the northwest Pacific in winter.
At potential temperatures above 3.5°C, there is a substantial increase of salinity variance com-
pared to deeper levels, where the θ-S relationship becomes much tighter.
Figure VII.A.23 shows the CTD θ-S relationship at potential temperatures less than 5°C. In
the deep water, salinities range from 34.685 psu to 34.691 psu at temperatures ranging between1.11°–1.12°C. This spread of 0.006 psu is traceable to the salinity values determined from watersamples. There seem to be no systematic offsets from cruise to cruise, so the variability may bereal or due to noise from sampling techniques.
III.A.4. Dissolved Oxygen
A weak dissolved oxygen minimum at temperatures around 19°C is present in the upperocean, with a weak maximum beneath at about 12°C. Occasionally, there is a maximum in dis-solved oxygen just below the surface (above the shallow minimum).
The main dissolved oxygen minimum is found near 4.5°C (750 m), with a value of about 25
µmol kg-1. This value varied little during the first year of measurements.
III.A.5. Inorganic Nutrients
The three sampled inorganic nutrients have low to undetectable concentrations in the surfacelayer, and all show an intermediate depth maximum. Nitrate plus nitrite has a maximum of about
42 µmol kg-1 near 1000 m where a phosphate maximum of about 3.1 µmol kg-1 is also found.The dissolved silica maximum is found at a depth of about 2600 m, with a value of about 165
µmol kg-1.
III.A.6. Fluorescence
In situ fluorescence profiles show the deep pigment maximum, characteristic of the centralnorth Pacific Ocean at about 100 m. Representative fluorescence profiles converted to pigmentconcentrations are shown in Figure VII.A.24. Fluorescence casts used for this figure were taken
- 22 -

at night and converted to pigment concentrations using a global linear regression fit of thefluorometer output to the sum of chlorophyll a and phaeopigment concentrations measured at dis-crete depths. The pigment maximum varied in intensity and depth over the first year of the pro-gram. To date, this variability displays little evidence of a seasonal cycle. The small and deep pig-ment maximum observed on HOT-3 coincided with a deep mixed layer (115 m).
III.B. Water Column Chemical Measurements
Water column chemical measurements are presented in Tables VI.B.1–27. The pressure andtemperature reported with each sample are derived from CTD pressure and temperature readingsat the time of bottle trips. Densities are calculated from temperature and salinity estimated fromthe CTD. Where appropriate, chemical concentrations are expressed per kilogram.
Although approximately 20% of our chemical analyses are analyzed in replicate (see Karl etal., 1990), only mean values are reported here. Whenever possible, we monitor the consistency ofour analytical results between cruises by maintaining reference materials and by monitoring theconcentration of the chemical of interest in the deep sea where month-to-month variability is be-lieved to be small.
The precision of our oxygen analysis on HOT-1 through HOT-12 is shown in Table VI.B.25.Dissolved oxygen concentrations measured on HOT-1 through HOT-12 are plotted at constantpressure and density horizons in the deep ocean in Figure VII.B.2. Oxygen analyses in deepwater indicate that analytical consistency was maintained throughout the first year of the program.
A summary of the precision of our dissolved nutrient analyses during HOT-1 through HOT-12 is shown in Table VI.B.26. In order to evaluate analytical consistency of our nutrientanalyses we collected a set of replicate samples from three depth horizons early in the program.These samples were then kept frozen and one sample was run in replicate with the nutrient sam-ples collected on each HOT cruise. The results of these analyses are presented in Figures VII.B.3–5. In Figures VII.B.6–8, nutrient concentrations are measured on HOT-1 through HOT-12 at con-stant deep water pressure and density horizons. These data indicate that analytical consistencywas maintained for our analyses throughout the first year of our program.
The precision of our fluorometric pigment analyses during HOT-1 through HOT-12 areshown in Table VI.B.27. The precision of this analysis remained relatively constant over the firstyear of the program.
Analysis of algal pigments by HPLC has not been completed for the first year of the pro-gram. However, the comparison between available chlorophyll a data measured by HPLC (Table VI.B.28) and chlorophyll a measured by fluorescence indicates a good correspondence(Figure VII.B.9).
- 23 -

III.C. Primary Productivity
The results of the carbon-14 incubations and pigment determinations made on samples col-lected on Go-Flo casts are presented in Table VI.C.1. Also shown are integrated irradiances meas-ured over the daylight period and estimated percent of surface PAR during incubation. Pigmentconcentrations and carbon-14 incorporation rates reported are the average of triplicate determina-tions. The average coefficient of variation for the carbon assimilation rates over the first twelvecruises was 19.7%. Table VI.C.2. presents rates of primary production and concentrations of chlo-rophyll a and phaeopigment per m2 of ocean surface. Integrated values for pigment concentra-tions and carbon assimilation were calculated using the trapezoid rule. In all cases, shallowest val-ues were extended to 0 m. Primary production rates were extrapolated to zero at 200 m on allcruises except HOT-1, where on-deck primary productions rates were extrapolated to zero at 150m.
Percent irradiance for on-deck incubators was determined by direct measurements of PARwithin seawater-filled incubation chambers. Estimates of in situ percent irradiance on HOT-8 toHOT-11 were estimated using extinction coefficient profiles generated with a Biospherical MERspectroradiometer on HOT-3. Percent irradiance for in situ incubation depths on HOT-12 were de-termined using a Biospherical PNF-300 on the day before primary production incubations wereconducted.
Integrated primary production values for both 12- and 24-hour incubations conducted on deckare shown in Figure VII.C.1. Twelve- and 24-hour production rates are in good agreement, withthe 12-hour results generally being slightly higher the 24-hour measurements. A peak in produc-tion of approximately 1100 mg C m-2 d-1 was observed in late August. On this same cruise, an ex-tensive cyanobacteria (Trichodesimum) bloom was observed near Station ALOHA. The rate ofprimary production over the first twelve HOT cruises averaged between 450 and 550 mg C m-2
day-1, depending on whether the results of 12- or 24-hour incubations are used to compute the av-erage. This rate of production is equivalent to an annual rate of production of between 150 and200 g C m-2 yr-1, and is in good agreement with the estimates of annual production in the NorthPacific Subtropical Gyre obtained by the VERTEX program (Martin et al., 1987). Primary pro-duction rates were measured on-deck and in situ for 12 hours on HOT cruises 8 through 11. Acomparison of the rates of production measured on-deck and in situ is shown in Figure VII.C.2.Good agreement between these estimates was achieved, indicating the on-deck incubation systemadequately reproduces in situ conditions.
III.D. Particle Flux
The sediment trap flux data are presented in Table VI.D.1. We measured the flux of carbon,nitrogen, and phosphorus at all three depths during the period covered by this report. Occasion-ally, especially at deeper depths, elemental fluxes were below detection. Mass flux was measuredbeginning on HOT-8. As described in Section II.D.2., our practice of combining individual trap
- 24 -

contents at each depth for replicate determinations was altered on HOT-8, so that information ofvariability of sinking particulate material on the scale of the trap aperture was not lost in our sam-pling procedure. On HOT-8, samples were prepared both from individual traps and from a com-bined collection in order to compare the results using these two subsamples.
Carbon and nitrogen fluxes measured at 150 m are shown in Figures VII.D.1–2. Variabilityin elemental fluxes appear to be stochastic with no clear evidence of a seasonal cycle. Carbonflux ranged from approximately 20–70 mg C m-2 d-1 and nitrogen flux ranged from about 2–7 mgN m-2 d-1. The C:N flux ratios at 150 m were variable with an average ratio (by atoms) of ap-proximately 7 (Figure VII.D.3). These particle fluxes and elemental ratios are reasonably consis-tent with those measured by the VERTEX program (Martin et al., 1987). Nitrogen flux at 150 m,as a percent of photosynthetic nitrogen assimilation, is shown in Figure VII.D.4. Nitrogen flux atthis depth varies between approximately 3 and 10% of the contemporaneous autotrophic nitrogenproduction rate (calculated from carbon-14 primary production values assuming a C:N ratio [byatoms] of 6.6), and averages 6.4%. This value is consistent with the estimate of new productionfor the oligotrophic central gyres made by Eppley and Peterson (1979) and with field data fromthe VERTEX program (Knauer et al., 1990). Although particle flux rates at 150, 300, and 500 mare quite variable within a single cruise, the carbon and nitrogen fluxes at these three depths aver-aged over the entire year show a consistent decrease with depth (Figures VII.D.5–6).
III.E. ADCP Profiling
III.E.1. Shipboard ADCP
The shipboard ACDP was used on all MOANA WAVE cruises (HOT-1, -2, -3, -5, -11, and -12) to measure the velocity profile in the upper 300 m.
A general picture of the shipboard ADCP data set can be obtained from the plots of reference-layer velocity and position (Figures VII.E.1 to VII.E.6). Gaps in the ADCP data were rare. Themain difficulty was in the navigation data; the differences in resolution and accuracy betweenTransit and GPS data are evident. Neither was flawless, but the GPS, when available, resolvesspatial/temporal gradients that would be missed with Transit. GPS was available 12 hours per dayon HOT-1 and -2, 6.5 hours per day on HOT-3, 10.3 hours per day on HOT-5, and 15.6 hoursper day on HOT-11 and -12. Transit was available on all but HOT-11.
The reference layer velocity shows the effects of both temporal and spatial variability. Pre-dominantly spatial gradients are most obvious on the transits to and from the station. Note, for ex-ample, the oscillations in U and the gradient in V on both transits in HOT-11. However, spatialgradients can also be seen during the period on station. A good example is at day 291 on HOT-11. When the ship moved 25 km to the west, V changed by 40 cm s-1. The presence ofsuch gradients within the ship’s range of motion on station complicates (or contaminates) the in-
- 25 -
terpretation of the velocity record on station as a time series at a fixed location, or a pseudo-mooring. Nevertheless, in most cases this is the most natural way to look at the on-station data.
The raw on-station time series of velocity as a function of depth show obvious variabilitynear tidal and inertial periods. For example, one can see semidiurnal periodicity in the upper lev-els of the HOT-2 record. In HOT-3, at 160 and 180 m the velocity extrema recur at roughly theinertial period (31.0 hours). A good example of a dominant diurnal period is the time series atand below 240 m on HOT-1. To quantify these components of the record, we have performed aleast-squares fit (multiple linear regression) of the velocity to a model containing a mean, a lineartrend, and harmonics at periods of 12.42, 24, and 31 hours. The model components are not or-thogonal over the typical 3-day time series—there are 2.3 inertial cycles and 3 diurnal cycles—soerrors in the model coefficients are correlated.
Looking first at the mean and the trend, we see relatively simple vertical structure; these ve-locity components vary slowly with depth in the upper 300 m, and the flow is nearly unidirec-tional except when weak. Magnitude and direction of the mean current varied from cruise tocruise. The strongest mean current was during HOT-11, the weakest during HOT-3—surprisingbecause it was a period of unusually strong trade winds. In five out of the six cruises, there was awestward component, and in the sixth, HOT-5, the trend shows a swing toward a westward com-ponent at the end of the cruise.
In contrast with the mean and the trend, the harmonic components are highly variable withdepth. Like the mean and trend, the harmonics also vary greatly from cruise to cruise. There is ahint of a pattern in all this variability: the semidiurnal component tends to be strongest in the up-per 150 m. The diurnal and inertial components often peak at middle depths. For example, wehave already noted the concentration of near-inertial energy between 150 and 200 m on HOT-3;the total absence of inertial energy in the mixed layer on that cruise is even more striking. A peakin diurnal energy between 120 and 160 m is a dominant feature of HOT-12 (although the recordis so short that we made no attempt to separate out an inertial component). Although the ampli-tudes and phases of the harmonics are highly variable, there is a clear dominance of clockwise(anticyclonic) rotation of the velocity vector for each component, as one expects for internalwaves in the northern hemisphere. Counterclockwise rotation occurs only when amplitude issmall or ellipticity is high. The direction of vertical phase propagation, however, is not consistent.In some cases (for example, the inertial component at 100 m in HOT-1) the phase reverses over ashort vertical interval, consistent with a standing wave pattern.
Given the variability of the current field on station, the variability seen on the transits to andfrom the station is not surprising. For any given cruise, the currents on the transit to the stationusually look quite different from the currents on the return. There is no clear evidence in thesemeasurements of a consistent current along the windward side of the Hawaiian Island Chain
- 26 -
between the Station ALOHA and Kaena Point (northwest corner of Oahu) (Mysak and Magaard,1983; DeSzoeke and Talley, 1986).
III.E.2. Lowered ADCP
The LADCP was tested on HOT-11 as a means of measuring the velocity profile below 300m. The LADCP profile shows typical velocities of 5–10 cm s-1 throughout the upper 1500 m (Figure VII.E.7). Much of the energy appears to be at vertical wavelengths of 500–1000 m. Noanalysis of this profile has been done yet.
The difference between the downcast (solid lines) and the upcast (dashed) is some unknowncombination of error in the profiles and real change in the shear field during the 1.5 hours of thecast. The difference in shear structure in the top 300 m is real; it is confirmed by the shipboardADCP. At the bottom the profiles should coincide (assuming perfect referencing from the ship-board ADCP—a shaky assumption), since the up- and downcasts are nearly simultaneous there.Hence there seems to be roughly 5 cm s-1 of low vertical wavenumber error in these profiles.
III.F. Meteorology
The meteorological data are summarized in Figures VII.F.1–2. All parameters show slight evi-dence of annual cycles, although the daily and weekly ranges are nearly as high as the annualrange. SST and air and wet-bulb temperatures appear to be loosely correlated, all having lowestvalues in February, but maximum SST leads maximum air temperatures by between one and twomonths. Meteorological data collected at NDBC Buoy 51001 (Figure I.1.) during the period cov-ered by this report are presented in Figure VII.F.3.
III.G. Light measurements
Integrated irradiance measurements made with the on-deck cosine collector on days that pri-mary production experiments were conducted are presented in Table VI.C.2. Vertical profiles ofPAR obtained with the optical profiler on HOT-10 and -11 are presented in Figure VII.G.1. As istypical for this oceanic realm, the 1% light level is at about 100 m.
IV. Cruise Summaries
IV.A. Cruise Summaries
HOT-1. Chief Scientist: R. Lukas / D. KarlHOT-1 was the shakedown cruise of the HOT program, much of the equipment had never
been used, and there were some equipment failures. One conductivity cell and the GeneralOceanics rosette pylon failed. In addition, there were problems with the winch level-wind mecha-nism, and with the slip-rings. The Kahe Point station was abandoned because of these problems.
- 27 -

The sediment traps were tracked using ARGOS for two days after deployment, but we lostcontact with them a few hours before they were due to be retrieved, and despite a 16-hour search,they were not found.
HOT-2. Chief Scientist: E. FiringA problem with the on-deck incubation system prevented the measurement of primary produc-
tion on this cruise. There were no other significant problems on this cruise. After the 36-hourtime-series, a small scale spatial CTD survey was made.
HOT-3. Chief Scientist: C. WinnSampling at Kahe Point was not possible on this cruise because of a problem with the hy-
drowinch. Otherwise, this cruise was successful.
HOT-4. Chief Scientist: S. ChiswellHOT-4 was the first cruise on the SSP KAIMALINO. The cruise was initially delayed for
one day because the electric current required to start the hydrographic winch was more than theKAIMALINO’s breaker-box could supply. The self-starter on the winch was eventually by-passed, and the rest of the cruise was nominal.
HOT-5. Chief Scientist: C. WinnShorting of the cable between the oxygen sensor and the CTD caused depth-dependent shut-
down of the CTD. Diagnosing this problem took much of the cruise, and the sampling programwas seriously impacted.
HOT-6. Chief Scientist: S. ChiswellThere were no major problems on this cruise.
HOT-7. Chief Scientist: C. WinnThe hydrowire was in questionable condition on this cruise and CTD casts were therefore lim-
ited to 2000 dbars. In addition, a faulty sheave caused the hydrowire to part. Although the CTDwas saved, the number of hydrocasts obtained on this cruise was reduced, and no fluorescencedata were obtained.
HOT-8. Chief Scientist: C. WinnThe hydrowire was in questionable condition on this cruise and hydrocasts were limited to
1000 m.
HOT-9. Chief Scientist: R. LukasCTD casts were limited to 2500 dbar because of the short hydrowire. Apart from this, there
were no major problems affecting the data collection, except that the ship broke down during thetransit home. Only three XBT casts were made on the return transit because of poor dead reckon-
- 28 -

ing navigation quality between fixes. On this cruise, a massive surface Trichodesimum bloomwas observed near Station ALOHA.
HOT-10. Chief Scientist: S. ChiswellA new wire had been installed on the winch, allowing us to make 4500 dbar CTD casts. This
was the first cruise that the 24-place rosette was used. Some samples from the first two castswere lost because the Niskin bottle lanyards were not adjusted to the correct length for the newrosette. Otherwise, the cruise went without major incident.
HOT-11. Chief Scientist: S. ChiswellThe T-C duct was used on the CTD for the first time. There were no significant problems dur-
ing this cruise.
HOT-12. Chief Scientist: C. WinnProblems with the ship’s gearbox, combined with tight ship schedules, limited this cruise to
36 hours on station. The sediment traps were therefore not deployed. In addition, the number ofhydrocasts was limited and the Kahe Point station was not visited.
- 29 -

IV.B. Cruise Dates and Personnel
Table IV.B.1: Summary of HOT Cruises, 1988–1989
HOT Ship Depart Return
1 R/V MOANA WAVE 30 October 1988 3 November 1988
2 R/V MOANA WAVE 1 December 1988 4 December 1988
3 R/V MOANA WAVE 7 January 1989 10 January 1989
4 SSP KAIMALINO 26 February 1989 1 March 1989
5 R/V MOANA WAVE 26 March 1989 30 March 1989
6 SSP KAIMALINO 16 May 1989 20 May 1989
7 SSP KAIMALINO 22 June 1989 26 June 1989
8 SSP KAIMALINO 27 July 1989 1 August 1989
9 SSP KAIMALINO 22 August 1989 27 August 1989
10 SSP KAIMALINO 19 September 1989 25 September 1989
11 R/V MOANA WAVE 17 October 1989 20 October 1989
12 R/V MOANA WAVE 27 November 1989 29 November 1989
Table IV.B.2: Ancillary Projects Supported by HOT
HOT Principal Investigator Institution / Program
2 A. Knap Bermuda Biological Station
2 D. Collins Jet Propulsion Laboratory
2 N. Pace University of Indiana
12 S. Emerson University of Washington
7–11 C. Winn UH / Research Experiences for Undergraduates
1–12 F. MacKenzie University of Hawaii
1–12 C. Keeling Scripps Institution of Oceanography
- 30 -

Table IV.B.3: University of Hawaii Cruise Personnel
1 2 3 4 5 6 7 8 9 10 11 12W
OC
E G
rou
p
S. Chiswell, P. I.
E. Firing, P. I.
R. Lukas, P. I.
R. Baleña, Graduate Student
S. Cripe, Graduate Student
G. Parrish, Graduate Student
S. Reid, Graduate Student
N. Schneider, Graduate Student
N. Xu, Graduate Student
E. Loucks, Technician
M. Rosen, Technician
J. Snyder, Technician
D. Karl, P. I.
JGO
FS
Gro
up
C. Winn, P. I.
D. Bird, Scientist
F. Dobbs, Scientist
D. Hebel, Scientist
C. Allen, Graduate Student
J. Dore, Graduate Student
R. Letelier, Graduate Student
J. Reising, Graduate Student
T. Rust, Graduate Student
C. Sabine, Graduate Student
U. Magaard, Technician
G. Tien, Technician
1 2 3 4 5 6 7 8 9 10 11 12Shaded area = cruise participant Solid area = Chief Scientist
- 31 -

V. References
Blackman, R. B. and J. W. Tukey, 1958: The measurement of power spectra. Dover Publications, 190 pp.
Carpenter, J.H., 1965: The accuracy of the Winkler method for dissolved oxygen analysis. Limnology andOceanography, 10, 135–140.
Chiswell, S., 1990: Dynamic response of Sea-Bird CTD pressure sensors to temperature. submitted to Journalof Atmospheric and Oceanic Technology.
DeSzoeke, R. A. and L. D. Talley, 1986: Spatial fluctuations north of the Hawaiian Ridge. Journal of Physical Oceanography, 16, 981–984.
Eppley, R.W. and Peterson, B.J., 1979: Particulate organic matter flux and planktonic new production in thedeep ocean. Nature, 282, 677–680.
Firing, E. and R.L. Gordon, 1990: Deep ocean acoustic doppler current profiling. In Proceedings of theFourth IEEE Working Conference on Current Measurement, April 3–5, 1990, Clinton, Maryland.
Hobbie, J.E., R.J. Daley and S. Jasper, 1977: Use of Nuclepore for counting bacteria by fluorescence micros-copy. Applied and Environmental Microbiology, 33, 1225–1228.
Johnson, K.M., A.E. King and J.McN. Sieburth, 1985: Coulometric TCO2, analysis for marine studies: An in-troduction. Marine Chemistry, 16, 61–82.
Joyce T.M., 1989: On in situ ‘calibration’ of shipboard ADCPs. Journal of Atmospheric and Oceanic Technology, 6, 169–172.
Karl, D.M., C.D. Winn, D.V.W. Hebel and R. Letelier, 1990: Hawaii Ocean Time-series Program Field andLaboratory Protocols, September 1990.
Knauer, G.A., J.H. Martin and K.W. Bruland, 1979: Fluxes of particulate carbon, nitrogen and phosphorus inthe upper water column of the northeast Pacific. Deep-Sea Research, 26A, 97–108.
Knauer, G.A., D.G. Redalje, W.G. Harrison and D.M. Karl, 1990: New production at the VERTEX time-series site. Deep-Sea Research, 37, 1121–1134.
Lueck, R.G., 1990: Thermal inertia of conductivity cells: Theory. submitted to the Journal of Atmosphericand Oceanic Technology.
Lueck, R.G. and Picklo, J.J., 1990: Thermal inertia of conductivity cells: Observations with a Sea-Bird cell.submitted to Journal of Atmospheric and Oceanic Technology.
Macdonald, R.W. F.A. McLaughlin and C.S. Wong, 1986: The storage of reactive silicate samples by fre-ez-ing. Limnology and Oceanography, 31, 1139–1142.
Martin, J.H., G.A. Knauer, D.M. Karl and W.W. Broenkow, 1987: VERTEX: Carbon cycling in the northeastPacific. Deep-Sea Research, 34, 267–285.
Mysak, L. A. and L. Magaard, 1983: Rossby wave driven Eulerian mean flows along non-zonal barriers, withapplication to the Hawaiian Ridge. Journal of Physical Oceanography, 13, 1716–1725.
Owens, W.B. and Millard, R.C., 1985: A new algorithm for CTD oxygen calibration. Journal of PhysicalOceanography, 15, 621–631.
Pollard, R. and J. Read, 1989: A method for calibrating shipmounted Acoustic Doppler Profilers, and the limi-tations of gyro compasses. Journal of Atmospheric and Oceanic Technology, 6, 859–865.
Porter, K.G. and Y.S. Feig, 1980: The use of DAPI for counting and identifying aquatic microflora. Limnology and Oceanography, 25, 943–948.
Reid, J.L., 1965: Intermediate waters of the Pacific Ocean. Johns Hopkins Oceanographic Studies, 2, 85 pp.
- 32 -

Strickland, J.D.H. and T.R. Parsons, 1972: A practical handbook of seawater analysis. Fisheries ResearchBoard of Canada, 167 pp.
Talley, L.D. and T.M. Joyce, 1990: Trans-Pacific sections at 47°N and 152°W: Distribution of properties.Deep-Sea Research, in press.
Tsuchiya, M., 1968: Upper waters of the intertropical Pacific Ocean. Johns Hopkins Oceanographic Studies,4, 49 pp.
UNESCO, 1981: Tenth report of the joint panel on oceanographic tables and standards. UNESCO TechnicalPapers in Marine Science, No. 36, UNESCO, Paris.
Walsh, T.W., 1989: Total dissolved nitrogen in seawater: a new high-temperature combustion method and acomparison with photo-oxidation. Marine Chemistry, 26, 295–311.
- 33 -

VI. Data
VI.A. CTD Profiling
Tables VI.A.1–9: CTD data at NODC standard pressures for Kahe Point station.
Tables VI.A.10–21: CTD data at NODC standard pressures for Station ALOHA.
- 35 -

Station: 1 Cast: 1Time: 0704 Z Date: 1 Dec 88Latitude: 21°20.5’N Longitude: 158°16.3’W
Pressure Depth Temperature Pot. Temp. Salinity Oxygen Pot. Density
dbar m °C °C psu µmol kg-1 kg m-3
0.0 0.0 26.490 26.490 35.007 206.7 22.887
10.0 9.9 26.474 26.471 35.007 206.7 22.893
20.0 19.9 26.380 26.376 35.004 206.3 22.921
30.0 29.8 26.323 26.317 34.989 206.6 22.928
50.0 49.7 26.112 26.101 34.953 204.2 22.969
75.0 74.5 26.051 26.035 35.003 202.6 23.026
100.0 99.4 24.207 24.186 35.072 205.3 23.642
125.0 124.2 22.538 22.513 35.149 195.9 24.187
150.0 149.0 20.859 20.830 35.049 186.4 24.579
200.0 198.7 16.953 16.920 34.736 177.3 25.331
250.0 248.3 14.368 14.331 34.481 173.7 25.717
300.0 297.9 11.625 11.587 34.263 163.0 26.095
400.0 397.1 8.446 8.404 34.153 121.8 26.548
500.0 496.3 6.658 6.612 34.182 72.4 26.827
600.0 595.4 5.719 5.667 34.258 44.1 27.008
700.0 694.5 5.392 5.333 34.331 37.9 27.106
800.0 793.5 4.943 4.878 34.398 37.6 27.212
900.0 892.5 4.659 4.587 34.435 40.3 27.274
1000.0 991.4 4.314 4.236 34.476 44.8 27.345
HOT-2 Table VI.A.1
- 36 -

Station: 1 Cast: 1 Time: 0313 Z Date: 26 Feb 89Latitude: 21°16.1’N Longitude: 158°9.1’W
Pressure Depth Temperature Pot. Temp. Salinity Oxygen Pot. Density
dbar m °C °C psu µmol kg-1 kg m-3
0.0 0.0 24.754 24.754 34.309 235.5 22.895
10.0 9.9 24.765 24.763 34.312 236.7 22.895
20.0 19.9 24.767 24.762 34.313 232.8 22.895
30.0 29.8 24.762 24.756 34.313 232.9 22.898
50.0 49.7 24.762 24.751 34.312 224.4 22.898
75.0 74.5 24.972 24.956 34.721 223.6 23.146
100.0 99.4 23.925 23.904 34.919 220.2 23.610
125.0 124.2 23.474 23.448 35.084 210.0 23.869
150.0 149.0 21.562 21.533 35.124 196.3 24.444
200.0 198.7 17.852 17.817 34.873 195.8 25.221
250.0 248.3 14.982 14.944 34.561 196.2 25.647
300.0 297.9 12.049 12.010 34.293 180.2 26.039
400.0 397.1 8.793 8.750 34.165 123.7 26.504
500.0 496.3 6.994 6.947 34.180 78.2 26.780
600.0 595.4 5.772 5.721 34.237 46.0 26.985
700.0 694.5 5.210 5.153 34.347 33.8 27.140
800.0 793.5 4.788 4.724 34.413 36.9 27.241
900.0 892.5 4.511 4.440 34.458 39.8 27.309
1000.0 991.4 4.104 4.028 34.489 44.3 27.377
Table VI.A.2 HOT-4
- 37 -

Station: 1 Cast: 1 Time: 0406 Z Date: 26 Mar 89Latitude: 21°20.4’N Longitude: 158°16.1’W
Pressure Depth Temperature Pot. Temp. Salinity Oxygen Pot. Density
dbar m °C °C psu µmol kg-1 kg m-3
0.0 0.0 25.235 25.235 34.285 217.2 22.731
10.0 9.9 24.732 24.730 34.283 215.5 22.882
20.0 19.9 24.660 24.656 34.294 211.9 22.914
30.0 29.8 24.606 24.600 34.286 216.2 22.924
50.0 49.7 24.668 24.657 34.468 213.7 23.045
75.0 74.5 23.811 23.795 34.838 214.3 23.581
100.0 99.4 23.550 23.529 34.940 218.3 23.736
125.0 124.2 23.119 23.094 35.019 214.8 23.922
150.0 149.0 22.136 22.106 35.065 196.1 24.239
200.0 198.7 19.244 19.208 34.941 185.6 24.924
250.0 248.3 16.033 15.994 34.684 204.7 25.507
300.0 297.9 13.405 13.362 34.399 200.2 25.855
400.0 397.1 10.099 10.052 34.171 159.1 26.296
500.0 496.3 7.452 7.403 34.153 103.3 26.696
600.0 595.4 5.987 5.935 34.263 41.1 26.979
700.0 694.5 5.263 5.205 34.344 34.7 27.131
800.0 793.5 4.893 4.828 34.408 36.6 27.226
900.0 892.5 4.609 4.538 34.448 41.4 27.290
1000.0 991.4 4.248 4.171 34.482 48.3 27.356
HOT-5 Table VI.A.3
- 38 -
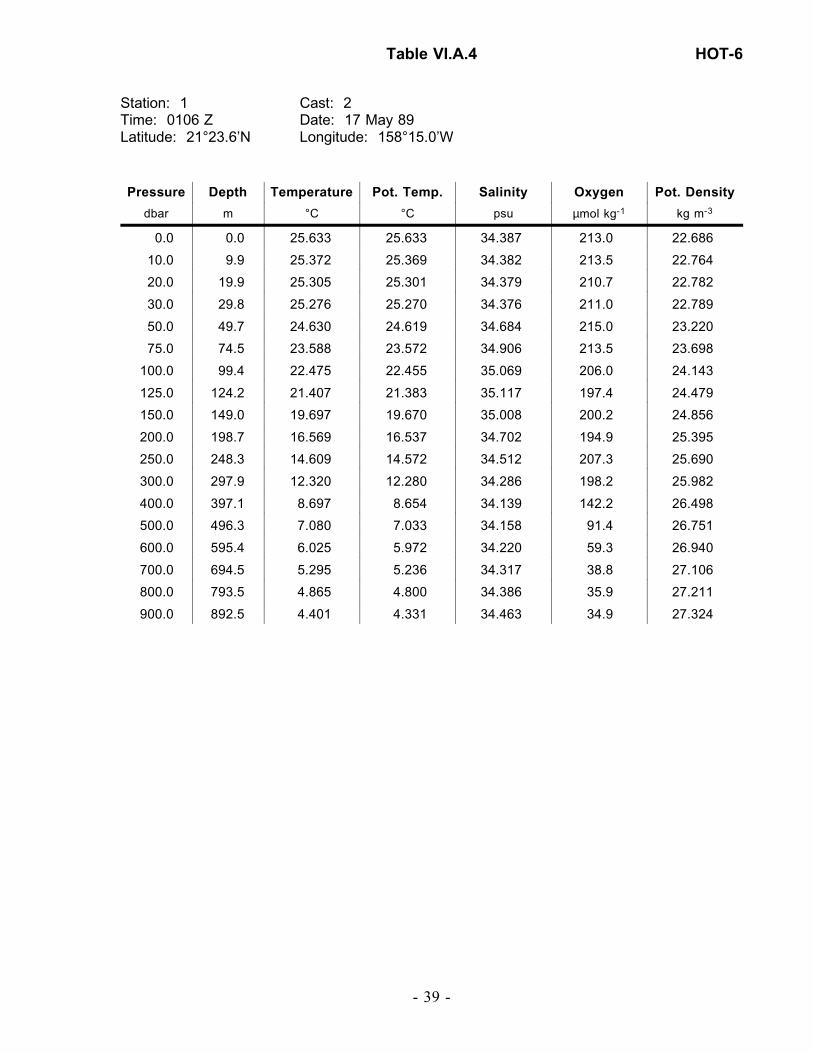
Station: 1 Cast: 2 Time: 0106 Z Date: 17 May 89Latitude: 21°23.6’N Longitude: 158°15.0’W
Pressure Depth Temperature Pot. Temp. Salinity Oxygen Pot. Density
dbar m °C °C psu µmol kg-1 kg m-3
0.0 0.0 25.633 25.633 34.387 213.0 22.686
10.0 9.9 25.372 25.369 34.382 213.5 22.764
20.0 19.9 25.305 25.301 34.379 210.7 22.782
30.0 29.8 25.276 25.270 34.376 211.0 22.789
50.0 49.7 24.630 24.619 34.684 215.0 23.220
75.0 74.5 23.588 23.572 34.906 213.5 23.698
100.0 99.4 22.475 22.455 35.069 206.0 24.143
125.0 124.2 21.407 21.383 35.117 197.4 24.479
150.0 149.0 19.697 19.670 35.008 200.2 24.856
200.0 198.7 16.569 16.537 34.702 194.9 25.395
250.0 248.3 14.609 14.572 34.512 207.3 25.690
300.0 297.9 12.320 12.280 34.286 198.2 25.982
400.0 397.1 8.697 8.654 34.139 142.2 26.498
500.0 496.3 7.080 7.033 34.158 91.4 26.751
600.0 595.4 6.025 5.972 34.220 59.3 26.940
700.0 694.5 5.295 5.236 34.317 38.8 27.106
800.0 793.5 4.865 4.800 34.386 35.9 27.211
900.0 892.5 4.401 4.331 34.463 34.9 27.324
Table VI.A.4 HOT-6
- 39 -

Station: 1 Cast: 1 Time: 0226 Z Date: 23 Jun 89Latitude: 21°19.9’N Longitude: 158°16.7’W
Pressure Depth Temperature Pot. Temp. Salinity Oxygen Pot. Density
dbar m °C °C psu µmol kg-1 kg m-3
0.0 0.0 26.761 26.761 34.540 182.6 22.450
10.0 9.9 26.207 26.205 34.539 185.2 22.624
20.0 19.9 26.097 26.093 34.537 184.4 22.657
30.0 29.8 26.067 26.060 34.539 183.4 22.669
50.0 49.7 25.874 25.863 34.572 182.4 22.755
75.0 74.5 24.648 24.632 34.743 188.6 23.260
100.0 99.4 23.291 23.271 34.886 188.5 23.770
125.0 124.2 22.361 22.336 35.132 185.4 24.225
150.0 149.0 21.144 21.115 35.077 180.2 24.523
200.0 198.7 19.261 19.224 35.035 171.1 24.991
250.0 248.3 14.780 14.743 34.543 191.6 25.676
300.0 297.9 12.053 12.013 34.268 198.7 26.018
400.0 397.1 8.588 8.545 34.092 175.7 26.478
500.0 496.3 6.507 6.462 34.077 124.3 26.764
600.0 595.4 5.428 5.378 34.250 66.6 27.037
700.0 694.5 5.103 5.046 34.348 48.3 27.153
800.0 793.5 4.604 4.541 34.423 46.4 27.270
900.0 892.5 4.315 4.245 34.465 49.2 27.335
1000.0 991.4 4.061 3.985 34.489 51.8 27.381
HOT-7 Table VI.A.5
- 40 -

Station: 1 Cast: 1Time: 0035 Z Date: 28 Jul 89Latitude: 21°21.0’N Longitude: 158°17.5’W
Pressure Depth Temperature Pot. Temp. Salinity Oxygen Pot. Density
dbar m °C °C psu µmol kg-1 kg m-3
0.0 0.0 26.683 26.683 34.595 209.8 22.515
10.0 9.9 26.365 26.362 34.601 213.0 22.621
20.0 19.9 26.305 26.300 34.607 213.4 22.645
30.0 29.8 26.296 26.289 34.608 217.0 22.649
50.0 49.7 26.285 26.274 34.609 212.3 22.655
75.0 74.5 24.607 24.591 34.689 220.7 23.232
100.0 99.4 23.482 23.461 34.943 209.9 23.758
125.0 124.2 21.860 21.836 35.071 196.1 24.319
150.0 149.0 19.942 19.914 35.020 189.9 24.801
200.0 198.7 16.645 16.613 34.720 191.3 25.392
250.0 248.3 12.586 12.552 34.300 187.8 25.939
300.0 297.9 10.829 10.793 34.189 199.5 26.182
400.0 397.1 8.377 8.335 34.087 168.8 26.507
500.0 496.3 6.587 6.541 34.096 104.8 26.769
600.0 595.4 5.391 5.341 34.260 39.3 27.048
700.0 694.5 5.135 5.077 34.392 31.7 27.184
800.0 793.5 4.928 4.863 34.447 31.4 27.253
900.0 892.5 4.513 4.442 34.460 38.3 27.310
1000.0 991.4 4.188 4.111 34.491 44.8 27.370
Table VI.A.6 HOT-8
- 41 -

Station: 1 Cast: 1 Time: 0118 Z Date: 23 Aug 89Latitude: 21°13.7’N Longitude: 158°24.3’W
Pressure Depth Temperature Pot. Temp. Salinity Oxygen Pot. Density
dbar m °C °C psu µmol kg-1 kg m-3
0.0 0.0 27.106 27.106 34.738 208.5 22.489
10.0 9.9 26.698 26.695 34.729 208.5 22.612
20.0 19.9 26.652 26.648 34.728 207.5 22.627
30.0 29.8 26.647 26.640 34.729 207.1 22.630
50.0 49.7 26.567 26.556 34.721 207.7 22.651
75.0 74.5 25.355 25.339 34.794 212.3 23.084
100.0 99.4 23.225 23.204 35.185 217.1 24.016
125.0 124.2 20.944 20.920 35.213 205.6 24.679
150.0 149.0 18.958 18.931 34.997 188.9 25.038
200.0 198.7 16.319 16.287 34.691 181.5 25.445
250.0 248.3 13.005 12.971 34.353 174.5 25.898
300.0 297.9 10.571 10.535 34.208 164.1 26.242
400.0 397.1 7.818 7.778 34.109 128.1 26.607
500.0 496.3 6.466 6.421 34.191 73.0 26.860
600.0 595.4 5.849 5.798 34.288 41.7 27.016
700.0 694.5 5.169 5.112 34.385 33.8 27.175
800.0 793.5 4.740 4.676 34.459 35.7 27.283
900.0 892.5 4.285 4.216 34.495 42.4 27.362
1000.0 991.4 4.119 4.042 34.506 46.9 27.389
HOT-9 Table VI.A.7
- 42 -
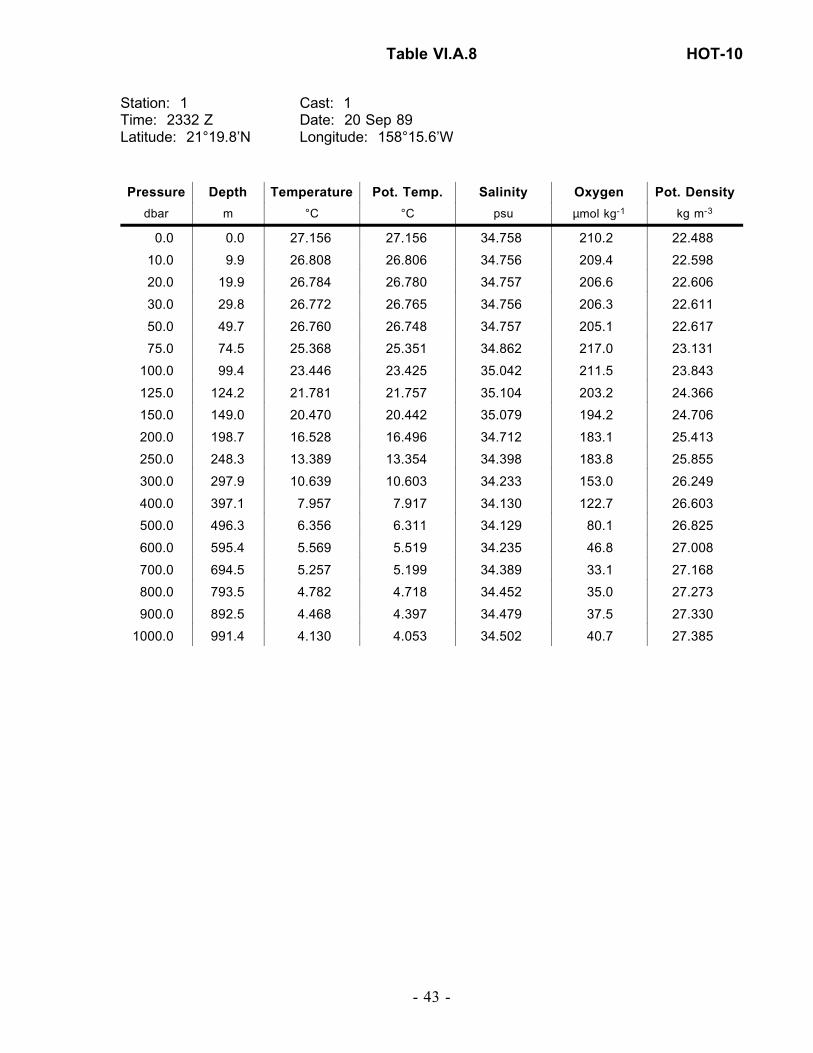
Station: 1 Cast: 1 Time: 2332 Z Date: 20 Sep 89Latitude: 21°19.8’N Longitude: 158°15.6’W
Pressure Depth Temperature Pot. Temp. Salinity Oxygen Pot. Density
dbar m °C °C psu µmol kg-1 kg m-3
0.0 0.0 27.156 27.156 34.758 210.2 22.488
10.0 9.9 26.808 26.806 34.756 209.4 22.598
20.0 19.9 26.784 26.780 34.757 206.6 22.606
30.0 29.8 26.772 26.765 34.756 206.3 22.611
50.0 49.7 26.760 26.748 34.757 205.1 22.617
75.0 74.5 25.368 25.351 34.862 217.0 23.131
100.0 99.4 23.446 23.425 35.042 211.5 23.843
125.0 124.2 21.781 21.757 35.104 203.2 24.366
150.0 149.0 20.470 20.442 35.079 194.2 24.706
200.0 198.7 16.528 16.496 34.712 183.1 25.413
250.0 248.3 13.389 13.354 34.398 183.8 25.855
300.0 297.9 10.639 10.603 34.233 153.0 26.249
400.0 397.1 7.957 7.917 34.130 122.7 26.603
500.0 496.3 6.356 6.311 34.129 80.1 26.825
600.0 595.4 5.569 5.519 34.235 46.8 27.008
700.0 694.5 5.257 5.199 34.389 33.1 27.168
800.0 793.5 4.782 4.718 34.452 35.0 27.273
900.0 892.5 4.468 4.397 34.479 37.5 27.330
1000.0 991.4 4.130 4.053 34.502 40.7 27.385
Table VI.A.8 HOT-10
- 43 -

Station: 1 Cast: 1 Time: 0830 Z Date: 17 Oct 89Latitude: 21°19.2’N Longitude: 158°16.5’W
Pressure Depth Temperature Pot. Temp. Salinity Oxygen Pot. Density
dbar m °C °C psu µmol kg-1 kg m-3
0.0 0.0 27.411 27.411 34.466 202.6 22.186
10.0 9.9 27.036 27.034 34.719 204.8 22.497
20.0 19.9 26.720 26.716 34.776 206.6 22.642
30.0 29.8 26.294 26.287 34.830 208.5 22.817
50.0 49.7 25.298 25.287 34.916 208.6 23.192
75.0 74.5 23.280 23.264 35.150 210.1 23.972
100.0 99.4 21.970 21.951 35.117 199.1 24.322
125.0 124.2 20.575 20.551 35.036 188.9 24.644
150.0 149.0 19.759 19.731 34.989 185.2 24.825
200.0 198.7 17.078 17.045 34.747 178.8 25.310
250.0 248.3 13.390 13.355 34.370 176.6 25.834
300.0 297.9 10.700 10.664 34.210 158.1 26.221
400.0 397.1 8.413 8.371 34.146 121.9 26.548
500.0 496.3 6.500 6.454 34.169 72.8 26.838
600.0 595.4 5.613 5.562 34.250 50.1 27.014
700.0 694.5 5.094 5.037 34.351 40.5 27.156
800.0 793.5 4.728 4.665 34.411 43.2 27.247
900.0 892.5 4.354 4.284 34.464 49.0 27.330
1000.0 991.4 4.019 3.943 34.502 56.5 27.396
HOT-11 Table VI.A.9
- 44 -

Station: 2 Cast: 5Time: 0639 Z Date: 31 Oct 88Latitude: 22°45.2’N Longitude: 158°0.3’W
Pressure Depth Temperature Pot. Temp. Salinity Oxygen Pot. Density
dbar m °C °C psu µmol kg-1 kg m-3
0.0 0.0 26.265 26.265 35.255 221.6 23.145
10.0 9.9 26.264 26.262 35.258 230.9 23.148
20.0 19.9 26.266 26.261 35.259 231.1 23.149
30.0 29.8 26.259 26.253 35.260 229.2 23.152
50.0 49.7 26.259 26.248 35.260 225.2 23.154
75.0 74.5 24.234 24.219 35.237 234.4 23.758
100.0 99.3 22.565 22.545 35.261 223.4 24.264
125.0 124.2 21.536 21.512 35.229 205.6 24.529
150.0 149.0 20.016 19.989 35.126 185.5 24.862
200.0 198.6 17.873 17.838 34.940 189.0 25.267
250.0 248.3 14.360 14.323 34.489 191.2 25.724
300.0 297.9 12.206 12.167 34.254 189.6 25.978
400.0 397.1 9.044 9.000 34.087 176.1 26.404
500.0 496.3 6.869 6.822 34.032 121.7 26.681
600.0 595.4 5.545 5.495 34.123 54.9 26.922
700.0 793.4 4.501 4.438 34.347 26.7 27.221
900.0 892.4 4.248 4.179 34.436 35.1 27.319
1000.0 991.3 3.884 3.809 34.482 44.0 27.394
1100.0 1090.2 3.648 3.567 34.514 51.1 27.443
1200.0 1189.0 3.419 3.331 34.535 56.2 27.483
1300.0 1287.8 3.139 3.046 34.551 61.9 27.522
1400.0 1386.5 2.991 2.891 34.560 67.1 27.544
1500.0 1485.2 2.819 2.713 34.572 73.8 27.569
1750.0 1731.8 2.371 2.250 34.601 87.5 27.632
2000.0 1978.0 2.103 1.965 34.620 99.7 27.670
2500.0 2469.6 1.732 1.556 34.649 117.3 27.724
3000.0 2960.1 1.544 1.326 34.666 135.7 27.755
4000.0 3937.8 1.464 1.146 34.682 158.1 27.780
Table VI.A.10 HOT-1
- 45 -

Station: 2 Cast: 2Time: 2219 Z Date: 1 Dec 88Latitude: 22°46.7’N Longitude: 157°55.6’W
Pressure Depth Temperature Pot. Temp. Salinity Oxygen Pot. Density
dbar m °C °C psu µmol kg-1 kg m-3
0.0 0.0 25.815 25.815 34.955 214.6 23.059
10.0 9.9 25.757 25.754 34.956 229.1 23.079
20.0 19.9 25.743 25.739 34.956 221.9 23.083
30.0 29.8 25.732 25.725 34.955 220.8 23.087
50.0 49.7 25.727 25.716 34.956 216.8 23.090
75.0 74.5 25.200 25.183 34.980 219.2 23.272
100.0 99.3 23.810 23.789 35.075 212.6 23.762
125.0 124.2 22.172 22.147 35.145 209.7 24.289
150.0 149.0 20.985 20.957 35.129 200.7 24.605
200.0 198.6 18.392 18.358 34.977 202.4 25.167
250.0 248.3 15.534 15.495 34.625 209.5 25.574
300.0 297.9 13.523 13.481 34.370 211.2 25.808
400.0 397.1 9.959 9.913 34.138 199.9 26.294
500.0 496.3 7.383 7.334 34.097 127.6 26.661
600.0 595.4 5.667 5.616 34.092 73.9 26.883
700.0 694.4 5.069 5.012 34.260 43.2 27.087
800.0 793.4 4.669 4.605 34.346 39.2 27.201
900.0 892.4 4.260 4.190 34.424 44.3 27.308
1000.0 991.3 3.984 3.908 34.471 49.2 27.375
1100.0 1090.2 3.716 3.635 34.496 52.2 27.422
1200.0 1189.0 3.489 3.401 34.523 55.8 27.467
1300.0 1287.8 3.271 3.177 34.536 59.8 27.498
1400.0 1386.5 3.030 2.930 34.545 62.8 27.529
1500.0 1485.2 2.826 2.720 34.561 66.9 27.560
1750.0 1731.8 2.420 2.298 34.590 76.5 27.619
2000.0 1978.0 2.073 1.936 34.615 86.9 27.669
2500.0 2469.6 1.737 1.562 34.645 102.2 27.721
3000.0 2960.1 1.538 1.320 34.667 124.3 27.756
4000.0 3937.8 1.452 1.134 34.685 153.2 27.783
HOT-2 Table VI.A.11
- 46 -

Station: 2 Cast: 1Time: 0056 Z Date: 8 Jan 89Latitude: 22°46.3’N Longitude: 157°55.0’W
Pressure Depth Temperature Pot. Temp. Salinity Oxygen Pot. Density
dbar m °C °C psu µmol kg-1 kg m-3
0.0 0.0 24.721 24.721 35.032 216.4 23.452
10.0 9.9 24.720 24.718 35.033 215.7 23.453
20.0 19.9 24.726 24.721 35.033 215.6 23.452
30.0 29.8 24.727 24.720 35.032 215.3 23.452
50.0 49.7 24.728 24.717 35.033 214.0 23.454
75.0 74.5 24.733 24.717 35.032 210.9 23.453
100.0 99.3 24.730 24.708 35.035 210.1 23.458
125.0 124.2 23.017 22.991 35.088 207.1 24.005
150.0 149.0 22.160 22.130 35.144 199.3 24.292
200.0 198.6 19.415 19.379 35.045 181.4 24.960
250.0 248.3 16.023 15.983 34.668 181.5 25.497
300.0 297.9 13.793 13.750 34.411 177.0 25.785
400.0 397.1 9.604 9.558 34.139 165.6 26.353
500.0 496.3 7.336 7.288 34.095 119.7 26.666
600.0 595.4 5.901 5.849 34.111 74.8 26.869
700.0 694.4 5.162 5.105 34.247 39.4 27.066
800.0 793.4 4.620 4.557 34.328 28.4 27.193
900.0 892.4 4.263 4.194 34.419 34.5 27.304
1000.0 991.3 3.962 3.887 34.470 42.3 27.376
1100.0 1090.2 3.753 3.671 34.501 46.0 27.423
1200.0 1189.0 3.499 3.411 34.523 50.2 27.466
1300.0 1287.8 3.232 3.139 34.543 56.0 27.508
1400.0 1386.5 3.056 2.955 34.557 59.5 27.536
1500.0 1485.2 2.856 2.749 34.572 64.1 27.566
1750.0 1731.8 2.425 2.303 34.594 75.4 27.622
2000.0 1978.0 2.102 1.964 34.615 83.6 27.666
2500.0 2469.6 1.716 1.541 34.648 103.6 27.725
3000.0 2960.1 1.531 1.313 34.670 126.5 27.759
4000.0 3937.8 1.454 1.137 34.688 152.8 27.785
Table VI.A.12 HOT-3
- 47 -
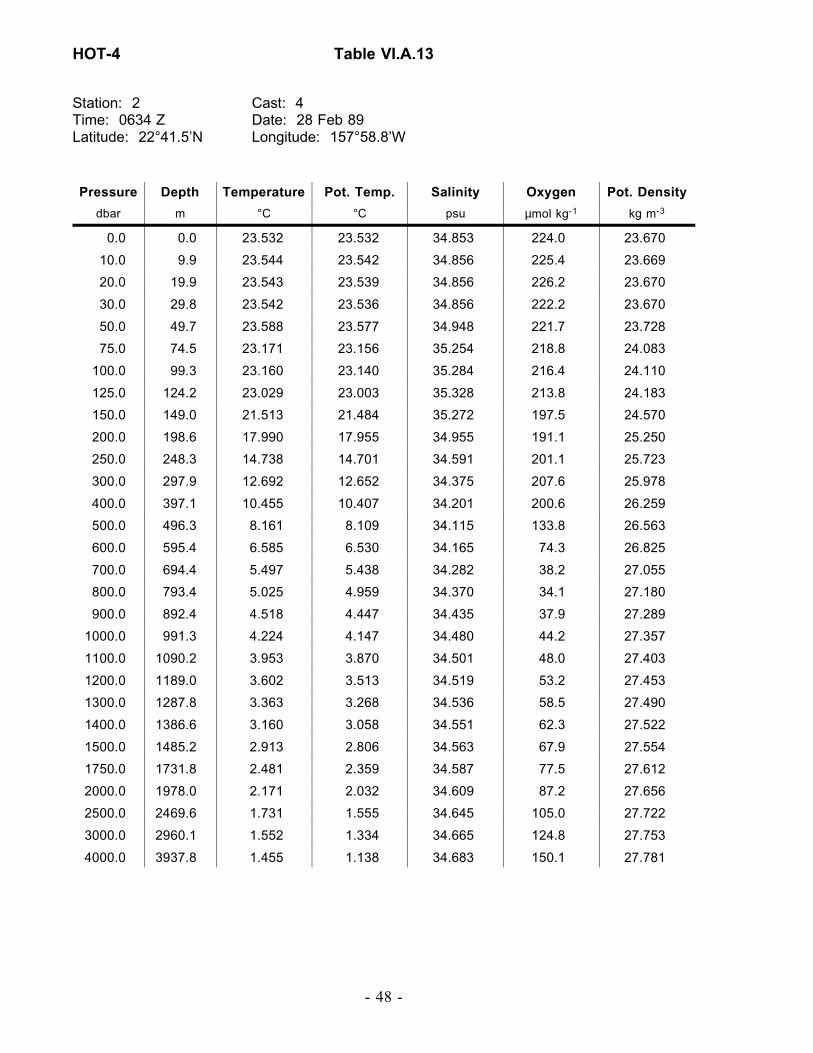
Station: 2 Cast: 4Time: 0634 Z Date: 28 Feb 89Latitude: 22°41.5’N Longitude: 157°58.8’W
Pressure Depth Temperature Pot. Temp. Salinity Oxygen Pot. Density
dbar m °C °C psu µmol kg-1 kg m-3
0.0 0.0 23.532 23.532 34.853 224.0 23.670
10.0 9.9 23.544 23.542 34.856 225.4 23.669
20.0 19.9 23.543 23.539 34.856 226.2 23.670
30.0 29.8 23.542 23.536 34.856 222.2 23.670
50.0 49.7 23.588 23.577 34.948 221.7 23.728
75.0 74.5 23.171 23.156 35.254 218.8 24.083
100.0 99.3 23.160 23.140 35.284 216.4 24.110
125.0 124.2 23.029 23.003 35.328 213.8 24.183
150.0 149.0 21.513 21.484 35.272 197.5 24.570
200.0 198.6 17.990 17.955 34.955 191.1 25.250
250.0 248.3 14.738 14.701 34.591 201.1 25.723
300.0 297.9 12.692 12.652 34.375 207.6 25.978
400.0 397.1 10.455 10.407 34.201 200.6 26.259
500.0 496.3 8.161 8.109 34.115 133.8 26.563
600.0 595.4 6.585 6.530 34.165 74.3 26.825
700.0 694.4 5.497 5.438 34.282 38.2 27.055
800.0 793.4 5.025 4.959 34.370 34.1 27.180
900.0 892.4 4.518 4.447 34.435 37.9 27.289
1000.0 991.3 4.224 4.147 34.480 44.2 27.357
1100.0 1090.2 3.953 3.870 34.501 48.0 27.403
1200.0 1189.0 3.602 3.513 34.519 53.2 27.453
1300.0 1287.8 3.363 3.268 34.536 58.5 27.490
1400.0 1386.6 3.160 3.058 34.551 62.3 27.522
1500.0 1485.2 2.913 2.806 34.563 67.9 27.554
1750.0 1731.8 2.481 2.359 34.587 77.5 27.612
2000.0 1978.0 2.171 2.032 34.609 87.2 27.656
2500.0 2469.6 1.731 1.555 34.645 105.0 27.722
3000.0 2960.1 1.552 1.334 34.665 124.8 27.753
4000.0 3937.8 1.455 1.138 34.683 150.1 27.781
HOT-4 Table VI.A.13
- 48 -

Station: 2 Cast: 3Time: 0116 Z Date: 27 Mar 89Latitude: 22°46.1’N Longitude: 157°53.6’W
Pressure Depth Temperature Pot. Temp. Salinity Oxygen Pot. Density
dbar m °C °C psu µmol kg-1 kg m-3
0.0 0.0 24.637 24.637 34.692 237.2 23.220
10.0 9.9 24.534 24.532 34.692 237.2 23.252
20.0 19.9 24.428 24.423 34.700 236.4 23.290
30.0 29.8 24.325 24.318 34.700 234.6 23.321
50.0 49.7 23.786 23.776 34.865 234.2 23.607
75.0 74.5 23.648 23.632 34.955 221.8 23.717
100.0 99.3 23.290 23.269 35.082 214.7 23.920
125.0 124.2 21.815 21.790 35.065 202.4 24.327
150.0 149.0 20.834 20.806 35.092 193.7 24.618
200.0 198.6 18.685 18.650 34.990 189.7 25.104
250.0 248.3 15.968 15.928 34.691 195.9 25.527
300.0 297.9 13.526 13.483 34.411 202.6 25.839
400.0 397.1 9.942 9.896 34.158 201.5 26.313
500.0 496.3 7.885 7.834 34.064 157.3 26.564
600.0 595.4 6.065 6.012 34.048 92.4 26.799
700.0 694.4 5.073 5.016 34.183 27.026
800.0 793.4 4.894 4.830 34.342 27.173
900.0 892.4 4.532 4.461 34.407 27.265
1000.0 991.3 4.169 4.092 34.461 27.348
1100.0 1090.2 3.750 3.668 34.493 27.417
1200.0 1189.0 3.426 3.339 34.514 27.466
1300.0 1287.8 3.247 3.153 34.529 27.495
1400.0 1386.5 3.065 2.965 34.544 27.525
1500.0 1485.2 2.870 2.763 34.560 27.556
1750.0 1731.8 2.483 2.361 34.594 27.617
2000.0 1978.0 2.149 2.010 34.616 27.664
2500.0 2469.6 1.726 1.550 34.648 27.724
3000.0 2960.1 1.543 1.326 34.669 27.757
Table VI.A.14 HOT-5
- 49 -

Station: 2 Cast: 1 Time: 1804 Z Date: 17 May 89Latitude: 22°47.4’N Longitude: 157°57.2’W
Pressure Depth Temperature Pot. Temp. Salinity Oxygen Pot. Density
dbar m °C °C psu µmol kg-1 kg m-3
0.0 0.0 23.884 23.884 34.952 207.6 23.641
10.0 9.9 23.883 23.881 34.947 210.9 23.638
20.0 19.9 23.883 23.879 34.949 210.9 23.640
30.0 29.8 23.852 23.845 34.951 209.9 23.652
50.0 49.7 22.951 22.941 35.131 209.3 24.051
75.0 74.5 22.521 22.506 35.229 211.4 24.250
100.0 99.3 21.591 21.571 35.231 200.7 24.514
125.0 124.2 20.160 20.137 35.121 187.6 24.819
150.0 149.0 18.283 18.257 34.956 189.4 25.176
200.0 198.6 15.834 15.803 34.651 192.2 25.525
250.0 248.3 13.264 13.229 34.374 203.9 25.862
300.0 297.9 11.500 11.462 34.200 192.6 26.069
400.0 397.1 9.053 9.009 34.108 188.3 26.419
500.0 496.3 6.797 6.751 34.020 140.1 26.681
600.0 595.4 5.438 5.388 34.128 58.9 26.939
700.0 694.4 5.029 4.972 34.253 35.8 27.086
800.0 793.4 4.580 4.517 34.334 30.1 27.201
900.0 892.4 4.313 4.244 34.432 40.4 27.309
1000.0 991.3 4.099 4.023 34.487 47.8 27.376
1100.0 1090.2 3.748 3.666 34.508 52.4 27.429
1200.0 1189.0 3.506 3.418 34.529 55.9 27.470
1300.0 1287.8 3.266 3.172 34.543 60.2 27.504
1400.0 1386.5 3.034 2.934 34.558 64.8 27.538
1500.0 1485.2 2.819 2.713 34.571 70.2 27.569
1750.0 1731.7 2.403 2.282 34.596 80.5 27.625
2000.0 1978.0 2.106 1.968 34.619 90.3 27.669
2500.0 2469.6 1.734 1.559 34.650 109.5 27.725
3000.0 2960.1 1.558 1.340 34.668 126.2 27.755
4000.0 3937.8 1.457 1.139 34.686 151.0 27.784
HOT-6 Table VI.A.15
- 50 -

Station: 2 Cast: 3Time: 0500 Z Date: 24 Jun 89Latitude: 22°48.4’N Longitude: 157°57.6’W
Pressure Depth Temperature Pot. Temp. Salinity Oxygen Pot. Density
dbar m °C °C psu µmol kg-1 kg m-3
0.0 0.0 25.820 25.820 34.565 211.3 22.763
10.0 9.9 25.810 25.808 34.565 211.3 22.767
20.0 19.9 25.696 25.691 34.608 212.1 22.835
30.0 29.8 25.676 25.670 34.610 211.8 22.844
50.0 49.7 25.634 25.622 34.609 209.0 22.857
75.0 74.5 25.038 25.021 34.588 213.7 23.025
100.0 99.3 23.979 23.958 34.844 216.3 23.538
125.0 124.2 23.183 23.158 35.096 210.2 23.963
150.0 149.0 22.509 22.479 35.148 204.9 24.197
200.0 198.6 19.141 19.105 34.901 173.0 24.920
250.0 248.3 16.009 15.970 34.595 154.7 25.444
300.0 297.9 12.934 12.893 34.333 204.3 25.898
400.0 397.1 9.137 9.093 34.108 188.7 26.405
500.0 496.3 6.907 6.861 34.065 113.1 26.701
600.0 595.4 5.663 5.612 34.134 55.3 26.917
700.0 694.4 5.090 5.033 34.272 32.2 27.095
800.0 793.4 4.547 4.484 34.356 26.1 27.223
900.0 892.4 4.207 4.138 34.437 39.2 27.324
1000.0 991.3 3.944 3.868 34.482 42.0 27.388
1100.0 1090.2 3.707 3.626 34.511 47.4 27.435
1200.0 1189.0 3.493 3.405 34.530 50.0 27.472
1300.0 1287.8 3.231 3.137 34.548 57.5 27.511
1400.0 1386.5 3.049 2.949 34.560 63.3 27.538
1500.0 1485.2 2.862 2.756 34.575 70.2 27.568
1750.0 1731.7 2.448 2.326 34.603 81.0 27.627
Table VI.A.16 HOT-7
- 51 -

Station: 2 Cast: 3Time: 0035 Z Date: 29 Jul 89Latitude: 22°49.1’N Longitude: 157°56.1’W
Pressure Depth Temperature Pot. Temp. Salinity Oxygen Pot. Density
dbar m °C °C psu µmol kg-1 kg m-3
0.0 0.0 25.464 25.464 34.921 217.8 23.142
10.0 9.9 25.396 25.394 34.921 217.8 23.163
20.0 19.9 25.354 25.349 34.921 217.4 23.177
30.0 29.8 25.328 25.321 34.920 217.2 23.185
50.0 49.7 24.127 24.116 35.059 228.7 23.653
75.0 74.5 23.224 23.208 35.187 224.4 24.017
100.0 99.3 22.295 22.275 35.266 217.0 24.344
125.0 124.2 21.357 21.333 35.303 213.8 24.635
150.0 149.0 20.016 19.989 35.168 197.7 24.894
200.0 198.6 17.016 16.983 34.816 198.1 25.378
250.0 248.3 13.880 13.844 34.458 208.7 25.801
300.0 297.9 12.027 11.988 34.258 206.9 26.015
400.0 397.1 8.982 8.939 34.082 175.5 26.410
500.0 496.3 6.841 6.794 34.058 106.9 26.705
600.0 595.4 5.197 5.148 34.117 55.2 26.958
700.0 694.4 4.650 4.596 34.236 26.6 27.115
800.0 793.4 4.560 4.497 34.350 25.5 27.217
900.0 892.4 4.160 4.091 34.395 27.0 27.295
1000.0 991.3 3.875 3.800 34.459 37.9 27.377
1100.0 1090.2 3.673 3.592 34.506 47.3 27.434
HOT-8 Table VI.A.17
- 52 -

Station: 2 Cast: 2Time: 1942 Z Date: 23 Aug 89Latitude: 22°47.4’N Longitude: 157°57.4’W
Pressure Depth Temperature Pot. Temp. Salinity Oxygen Pot. Density
dbar m °C °C psu µmol kg-1 kg m-3
0.0 0.0 26.127 26.127 34.663 216.5 22.742
10.0 9.9 26.115 26.113 34.664 218.4 22.746
20.0 19.9 26.112 26.108 34.664 217.1 22.748
30.0 29.8 26.115 26.108 34.664 214.9 22.748
50.0 49.7 26.026 26.015 34.670 214.2 22.782
75.0 74.5 24.713 24.697 34.822 217.2 23.301
100.0 99.3 23.351 23.330 35.130 218.8 23.938
125.0 124.2 22.254 22.229 35.273 214.3 24.362
150.0 149.0 21.354 21.325 35.312 206.5 24.644
200.0 198.6 18.807 18.772 35.006 188.4 25.085
250.0 248.3 15.043 15.005 34.532 196.4 25.611
300.0 297.9 11.437 11.400 34.174 194.6 26.060
400.0 397.1 8.218 8.177 34.063 168.3 26.512
500.0 496.3 7.250 7.202 34.153 86.4 26.724
600.0 595.4 5.833 5.782 34.184 51.7 26.936
700.0 694.4 5.223 5.165 34.273 35.3 27.080
800.0 793.4 4.696 4.632 34.377 34.6 27.223
900.0 892.4 4.351 4.282 34.447 39.7 27.317
1000.0 991.3 4.108 4.032 34.481 44.4 27.370
1100.0 1090.2 3.813 3.731 34.508 50.0 27.423
1200.0 1189.0 3.506 3.418 34.531 55.5 27.472
1300.0 1287.8 3.217 3.124 34.551 60.5 27.515
1400.0 1386.5 3.008 2.908 34.564 64.2 27.545
1500.0 1485.2 2.863 2.757 34.573 67.7 27.566
1750.0 1731.7 2.511 2.388 34.595 77.9 27.616
2000.0 1978.0 2.207 2.067 34.617 89.2 27.659
2500.0 2469.6 1.783 1.607 34.648 108.9 27.720
Table VI.A.18 HOT-9
- 53 -

Station: 2 Cast: 3Time: 2336 Z Date: 21 Sep 89Latitude: 22°44.6’N Longitude: 157°57.9’W
Pressure Depth Temperature Pot. Temp. Salinity Oxygen Pot. Density
dbar m °C °C psu µmol kg-1 kg m-3
0.0 0.0 26.485 26.485 34.787 203.7 22.723
10.0 9.9 26.428 26.426 34.785 205.4 22.740
20.0 19.9 26.394 26.389 34.783 204.8 22.749
30.0 29.8 26.385 26.378 34.783 204.2 22.753
50.0 49.7 26.382 26.371 34.783 204.4 22.755
75.0 74.5 26.221 26.204 34.785 205.3 22.810
100.0 99.3 24.328 24.307 34.949 212.7 23.513
125.0 124.2 22.565 22.539 35.048 200.0 24.104
150.0 149.0 20.370 20.342 34.995 173.4 24.668
200.0 198.6 17.448 17.415 34.810 177.3 25.270
250.0 248.3 14.870 14.833 34.516 184.1 25.636
300.0 297.9 11.828 11.789 34.218 208.7 26.022
400.0 397.1 8.660 8.617 34.105 156.1 26.478
500.0 496.3 6.826 6.779 34.090 95.5 26.732
600.0 595.4 5.561 5.510 34.145 49.8 26.937
700.0 694.4 4.925 4.869 34.283 28.7 27.122
800.0 793.4 4.663 4.600 34.372 29.0 27.223
900.0 892.4 4.414 4.344 34.465 37.6 27.324
1000.0 991.3 4.062 3.986 34.492 44.0 27.384
1100.0 1090.2 3.760 3.678 34.515 49.1 27.433
1200.0 1189.0 3.481 3.394 34.530 53.0 27.473
1300.0 1287.8 3.250 3.156 34.548 57.7 27.510
1400.0 1386.5 3.062 2.962 34.561 63.1 27.538
1500.0 1485.2 2.898 2.791 34.572 66.1 27.562
1750.0 1731.8 2.456 2.334 34.595 75.4 27.620
2000.0 1978.0 2.155 2.016 34.619 88.1 27.665
2500.0 2469.6 1.759 1.584 34.650 106.9 27.723
3000.0 2960.1 1.568 1.350 34.669 122.5 27.755
4000.0 3937.8 1.457 1.139 34.687 146.4 27.785
HOT-10 Table VI.A.19
- 54 -
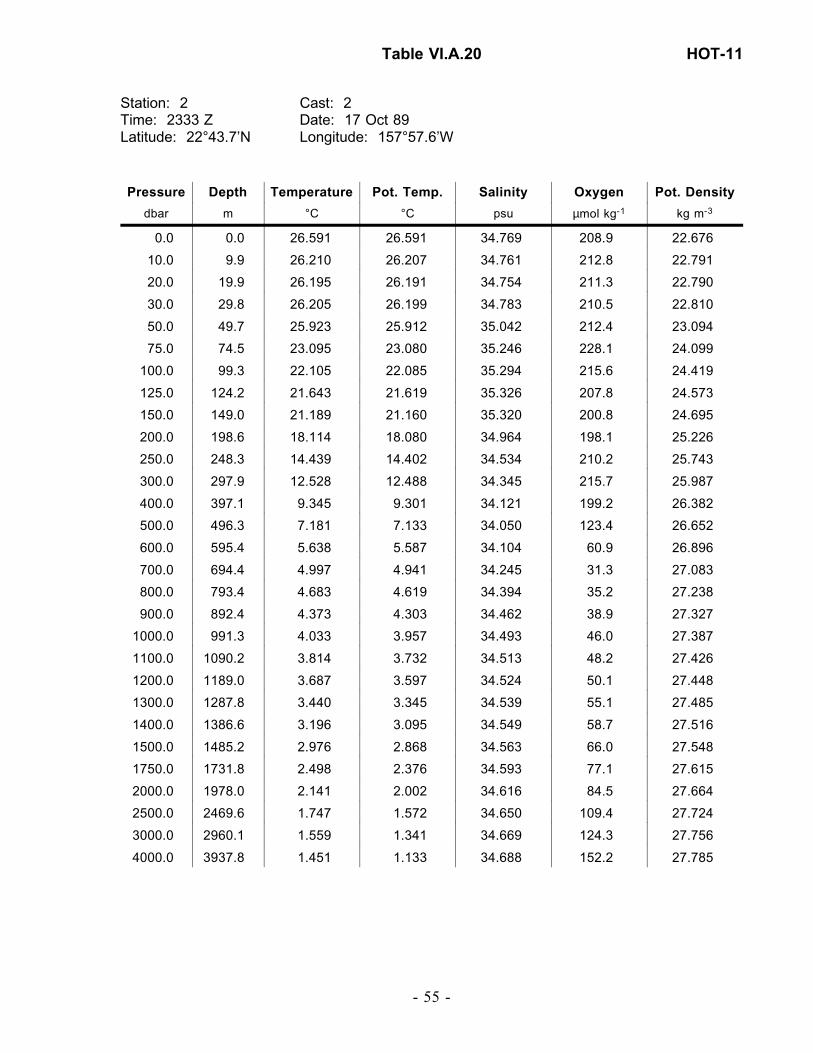
Station: 2 Cast: 2 Time: 2333 Z Date: 17 Oct 89Latitude: 22°43.7’N Longitude: 157°57.6’W
Pressure Depth Temperature Pot. Temp. Salinity Oxygen Pot. Density
dbar m °C °C psu µmol kg-1 kg m-3
0.0 0.0 26.591 26.591 34.769 208.9 22.676
10.0 9.9 26.210 26.207 34.761 212.8 22.791
20.0 19.9 26.195 26.191 34.754 211.3 22.790
30.0 29.8 26.205 26.199 34.783 210.5 22.810
50.0 49.7 25.923 25.912 35.042 212.4 23.094
75.0 74.5 23.095 23.080 35.246 228.1 24.099
100.0 99.3 22.105 22.085 35.294 215.6 24.419
125.0 124.2 21.643 21.619 35.326 207.8 24.573
150.0 149.0 21.189 21.160 35.320 200.8 24.695
200.0 198.6 18.114 18.080 34.964 198.1 25.226
250.0 248.3 14.439 14.402 34.534 210.2 25.743
300.0 297.9 12.528 12.488 34.345 215.7 25.987
400.0 397.1 9.345 9.301 34.121 199.2 26.382
500.0 496.3 7.181 7.133 34.050 123.4 26.652
600.0 595.4 5.638 5.587 34.104 60.9 26.896
700.0 694.4 4.997 4.941 34.245 31.3 27.083
800.0 793.4 4.683 4.619 34.394 35.2 27.238
900.0 892.4 4.373 4.303 34.462 38.9 27.327
1000.0 991.3 4.033 3.957 34.493 46.0 27.387
1100.0 1090.2 3.814 3.732 34.513 48.2 27.426
1200.0 1189.0 3.687 3.597 34.524 50.1 27.448
1300.0 1287.8 3.440 3.345 34.539 55.1 27.485
1400.0 1386.6 3.196 3.095 34.549 58.7 27.516
1500.0 1485.2 2.976 2.868 34.563 66.0 27.548
1750.0 1731.8 2.498 2.376 34.593 77.1 27.615
2000.0 1978.0 2.141 2.002 34.616 84.5 27.664
2500.0 2469.6 1.747 1.572 34.650 109.4 27.724
3000.0 2960.1 1.559 1.341 34.669 124.3 27.756
4000.0 3937.8 1.451 1.133 34.688 152.2 27.785
Table VI.A.20 HOT-11
- 55 -

Station: 2 Cast: 2 Time: 0322 Z Date: 28 Nov 89Latitude: 22°44.7’N Longitude: 158°1.7’W
Pressure Depth Temperature Pot. Temp. Salinity Oxygen Pot. Density
dbar m °C °C psu µmol kg-1 kg m-3
0.0 0.0 25.229 25.229 34.962 214.1 23.244
10.0 9.9 25.227 25.225 34.971 213.6 23.253
20.0 19.9 25.126 25.121 34.970 213.4 23.283
30.0 29.8 25.108 25.101 34.969 213.9 23.289
50.0 49.7 25.088 25.077 34.968 211.2 23.295
75.0 74.5 24.280 24.264 35.087 218.0 23.631
100.0 99.3 22.585 22.565 35.170 206.2 24.189
125.0 124.2 21.275 21.251 35.193 195.6 24.574
150.0 149.0 20.535 20.507 35.185 191.5 24.770
200.0 198.6 18.700 18.665 35.022 191.0 25.125
250.0 248.3 15.639 15.600 34.637 196.8 25.560
300.0 297.9 13.565 13.523 34.408 203.6 25.829
400.0 397.1 9.596 9.551 34.092 180.5 26.318
500.0 496.3 6.968 6.921 34.033 124.4 26.668
600.0 595.4 5.620 5.569 34.103 57.9 26.897
700.0 694.4 5.013 4.956 34.256 27.8 27.090
800.0 793.4 4.592 4.529 34.358 24.8 27.219
900.0 892.4 4.228 4.159 34.438 32.0 27.323
1000.0 991.3 3.920 3.845 34.486 40.2 27.393
1100.0 1090.2 3.658 3.577 34.511 46.3 27.440
1200.0 1189.0 3.402 3.315 34.531 52.0 27.481
1300.0 1287.8 3.191 3.098 34.548 54.6 27.515
1400.0 1386.5 2.983 2.883 34.561 59.1 27.545
1500.0 1485.2 2.765 2.660 34.576 67.3 27.577
1750.0 1731.8 2.407 2.286 34.597 75.9 27.626
2000.0 1978.0 2.140 2.002 34.617 87.0 27.665
2500.0 2469.6 1.750 1.575 34.650 104.1 27.724
3000.0 2960.1 1.562 1.344 34.670 122.8 27.757
4000.0 3937.8 1.459 1.141 34.688 148.4 27.785
HOT-12 Table VI.A.21
- 56 -
VI.B. Water Column Measurements
Tables VI.B.1–12: Salinity and oxygen bottle data for HOT-1 to HOT-12. Also listed are CTD-derived values of pressure, temperature, salinity, potential temperature, and potential density
(σθ) taken at the bottle trips. The CTD oxygen values are taken from the downcasts at the
same potential density surfaces as the respective bottle trip. An entry is made to this table forevery bottle trip where samples were collected for the WOCE or JGOFS groups. Surface val-ues (Bottle 0, pressure 0.0 dbar) are taken from bucket samples.
Tables VI.B.13–24: Nutrient and other bottle data for HOT-1 to HOT-12. Also given, for cross-reference with Tables VI.B.1–12, are station, cast, bottle, and pressure.
Tables VI.B.25–27: Precision of oxygen, nutrient, and pigment analyses.
Table VI.B.28: HPLC analysis of chlorophyll a.
- 57 -
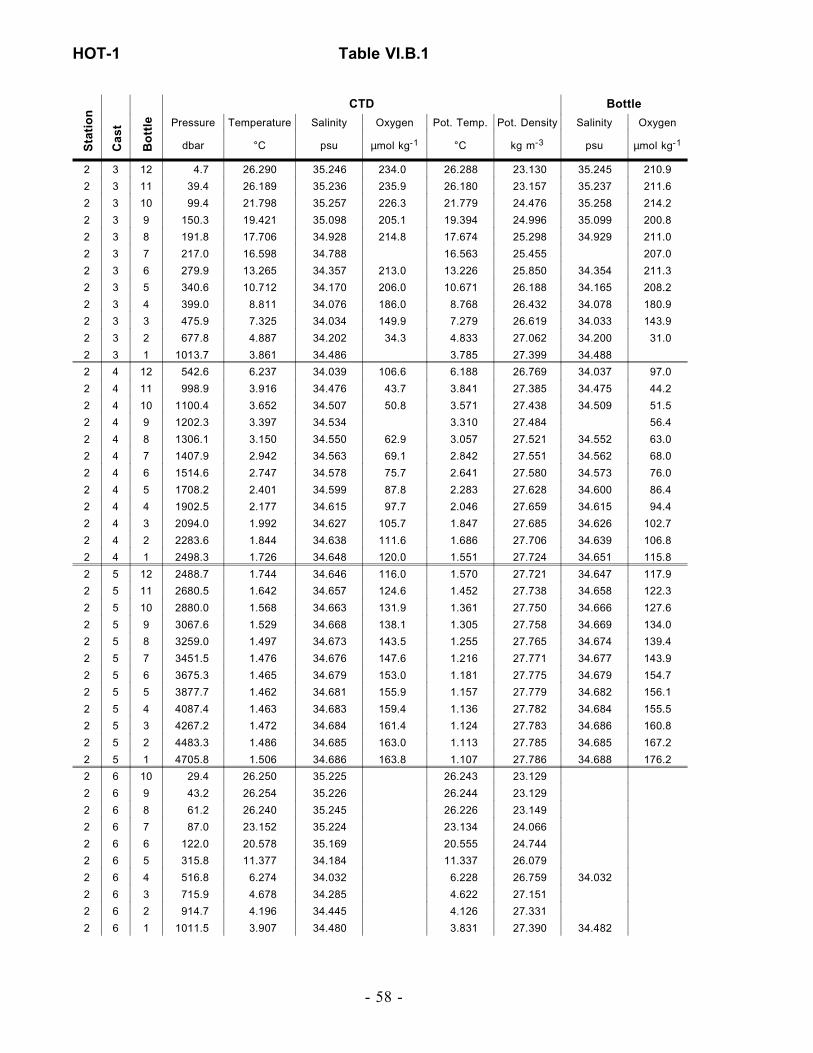
Sta
tio
n
Cas
t
Bo
ttle
CTD Bottle
Pressure Temperature Salinity Oxygen Pot. Temp. Pot. Density Salinity Oxygen
dbar °C psu µmol kg-1 °C kg m-3 psu µmol kg-1
2 3 12 4.7 26.290 35.246 234.0 26.288 23.130 35.245 210.9
2 3 11 39.4 26.189 35.236 235.9 26.180 23.157 35.237 211.6
2 3 10 99.4 21.798 35.257 226.3 21.779 24.476 35.258 214.2
2 3 9 150.3 19.421 35.098 205.1 19.394 24.996 35.099 200.8
2 3 8 191.8 17.706 34.928 214.8 17.674 25.298 34.929 211.0
2 3 7 217.0 16.598 34.788 16.563 25.455 207.0
2 3 6 279.9 13.265 34.357 213.0 13.226 25.850 34.354 211.3
2 3 5 340.6 10.712 34.170 206.0 10.671 26.188 34.165 208.2
2 3 4 399.0 8.811 34.076 186.0 8.768 26.432 34.078 180.9
2 3 3 475.9 7.325 34.034 149.9 7.279 26.619 34.033 143.9
2 3 2 677.8 4.887 34.202 34.3 4.833 27.062 34.200 31.0
2 3 1 1013.7 3.861 34.486 3.785 27.399 34.488
2 4 12 542.6 6.237 34.039 106.6 6.188 26.769 34.037 97.0
2 4 11 998.9 3.916 34.476 43.7 3.841 27.385 34.475 44.2
2 4 10 1100.4 3.652 34.507 50.8 3.571 27.438 34.509 51.5
2 4 9 1202.3 3.397 34.534 3.310 27.484 56.4
2 4 8 1306.1 3.150 34.550 62.9 3.057 27.521 34.552 63.0
2 4 7 1407.9 2.942 34.563 69.1 2.842 27.551 34.562 68.0
2 4 6 1514.6 2.747 34.578 75.7 2.641 27.580 34.573 76.0
2 4 5 1708.2 2.401 34.599 87.8 2.283 27.628 34.600 86.4
2 4 4 1902.5 2.177 34.615 97.7 2.046 27.659 34.615 94.4
2 4 3 2094.0 1.992 34.627 105.7 1.847 27.685 34.626 102.7
2 4 2 2283.6 1.844 34.638 111.6 1.686 27.706 34.639 106.8
2 4 1 2498.3 1.726 34.648 120.0 1.551 27.724 34.651 115.8
2 5 12 2488.7 1.744 34.646 116.0 1.570 27.721 34.647 117.9
2 5 11 2680.5 1.642 34.657 124.6 1.452 27.738 34.658 122.3
2 5 10 2880.0 1.568 34.663 131.9 1.361 27.750 34.666 127.6
2 5 9 3067.6 1.529 34.668 138.1 1.305 27.758 34.669 134.0
2 5 8 3259.0 1.497 34.673 143.5 1.255 27.765 34.674 139.4
2 5 7 3451.5 1.476 34.676 147.6 1.216 27.771 34.677 143.9
2 5 6 3675.3 1.465 34.679 153.0 1.181 27.775 34.679 154.7
2 5 5 3877.7 1.462 34.681 155.9 1.157 27.779 34.682 156.1
2 5 4 4087.4 1.463 34.683 159.4 1.136 27.782 34.684 155.5
2 5 3 4267.2 1.472 34.684 161.4 1.124 27.783 34.686 160.8
2 5 2 4483.3 1.486 34.685 163.0 1.113 27.785 34.685 167.2
2 5 1 4705.8 1.506 34.686 163.8 1.107 27.786 34.688 176.2
2 6 10 29.4 26.250 35.225 26.243 23.129
2 6 9 43.2 26.254 35.226 26.244 23.129
2 6 8 61.2 26.240 35.245 26.226 23.149
2 6 7 87.0 23.152 35.224 23.134 24.066
2 6 6 122.0 20.578 35.169 20.555 24.744
2 6 5 315.8 11.377 34.184 11.337 26.079
2 6 4 516.8 6.274 34.032 6.228 26.759 34.032
2 6 3 715.9 4.678 34.285 4.622 27.151
2 6 2 914.7 4.196 34.445 4.126 27.331
2 6 1 1011.5 3.907 34.480 3.831 27.390 34.482
HOT-1 Table VI.B.1
- 58 -

Sta
tio
n
Cas
t
Bo
ttle
CTD Bottle
Pressure Temperature Salinity Oxygen Pot. Temp. Pot. Density Salinity Oxygen
dbar °C psu µmol kg-1 °C kg m-3 psu µmol kg-1
2 7 5 10.7 26.266 35.223 26.263 23.121
2 7 4 25.5 26.270 35.222 26.264 23.120
2 7 3 42.9 26.264 35.223 26.254 23.124
2 7 2 68.3 23.642 35.222 23.628 23.921
2 7 1 114.4 21.580 35.212 21.558 24.504
2 8 3 2.3 26.273 35.241 26.273 23.132 35.243
2 8 2 497.0 6.740 34.029 6.694 26.696
2 8 1 1013.1 3.799 34.490 3.724 27.409
2 10 10 4.1 26.264 35.246 26.263 23.138 35.198
2 10 9 19.8 26.267 35.233 26.263 23.129
2 10 8 38.8 26.243 35.231 26.235 23.136
2 10 7 68.6 23.406 35.353 23.392 24.089
2 10 6 117.6 21.036 35.290 21.013 24.712
2 10 5 304.9 12.350 34.354 12.310 26.029
2 10 4 506.1 6.600 34.133 6.553 26.796 34.031
2 10 3 753.3 4.523 34.449 4.465 27.298
2 10 2 1011.7 3.876 34.623 3.800 27.507 34.483
2 10 1 1011.5 3.879 34.623 3.803 27.507
2 11 11 16.6 26.272 35.415 26.269 23.264
2 11 10 36.5 26.285 35.385 26.277 23.239
2 11 9 56.4 25.833 35.424 25.821 23.411
2 11 8 77.8 24.279 35.462 24.263 23.914
2 11 7 97.8 23.115 35.452 23.095 24.251
2 11 6 117.3 21.728 35.446 21.704 24.641
2 11 5 137.8 20.455 35.425 20.429 24.973
2 11 4 157.7 19.523 35.337 19.494 25.153
2 11 3 181.8 18.092 35.222 18.061 25.428
2 11 2 204.2 16.973 35.067 16.939 25.581
2 11 1 228.8 15.385 34.883 15.350 25.805
2 12 10 273.5 13.157 34.534 13.119 26.009
2 12 9 303.8 12.069 34.414 12.029 26.129
2 12 8 354.5 10.249 34.408 10.207 26.455
2 12 7 405.3 8.752 34.397 8.708 26.693
2 12 6 505.4 6.225 34.362 6.180 27.026 34.033
2 12 5 602.9 5.290 34.426 5.241 27.192
2 12 4 705.7 4.799 34.566 4.743 27.361
2 12 3 805.2 4.542 34.661 4.478 27.466
2 12 2 906.4 4.295 34.750 4.225 27.563
2 12 1 1008.8 4.013 34.786 3.936 27.623 34.473
2 13 10 7.7 26.279 35.801 26.277 23.553
2 13 9 24.4 26.251 35.518 26.246 23.350
2 13 8 44.2 26.257 35.360 26.247 23.230
2 13 7 69.4 26.065 35.297 26.050 23.244
2 13 6 117.4 22.241 35.346 22.217 24.421
2 13 5 116.7 22.405 35.312 22.381 24.349
2 13 4 310.8 11.849 34.266 11.809 26.055
Table VI.B.1 HOT-1
- 59 -

Sta
tio
n
Cas
t
Bo
ttle
CTD Bottle
Pressure Temperature Salinity Oxygen Pot. Temp. Pot. Density Salinity Oxygen
dbar °C psu µmol kg-1 °C kg m-3 psu µmol kg-1
2 13 3 508.6 6.433 34.186 6.388 26.860
2 13 2 755.8 4.651 34.899 4.591 27.642
2 13 1 1007.2 3.962 34.933 3.885 27.745
2 14 10 11.8 26.339 35.174 26.336 23.061 35.175
2 14 9 11.7 26.345 35.170 26.342 23.056 35.174
2 14 8 52.9 26.249 35.169 26.237 23.089 35.180
2 14 7 117.3 21.267 35.214 21.244 24.591 35.213
2 14 6 115.8 21.362 35.211 21.340 24.563 35.215
2 14 5 368.4 9.515 34.090 9.473 26.330 34.102
2 14 4 493.7 7.054 34.022 7.007 26.648 34.031
2 14 3 692.3 4.818 34.208 4.763 27.075 34.215
2 14 2 836.7 4.400 34.378 4.335 27.256 34.378
2 14 1 1011.2 3.978 34.468 3.901 27.373
2 15 9 8.9 26.313 35.167 221.5 26.311 23.064 35.170 214.9
2 15 8 18.9 26.278 35.168 223.5 26.274 23.076 35.169 218.6
2 15 7 38.9 26.268 35.169 223.0 26.260 23.081 35.169 214.1
2 15 6 66.7 23.901 35.223 221.3 23.887 23.845 35.225 225.7
2 15 5 116.1 20.968 35.165 192.9 20.946 24.635 35.163 200.6
2 15 4 308.4 11.940 34.229 195.0 11.900 26.010 34.232 208.1
2 15 3 508.3 6.702 34.030 115.9 6.655 26.701 34.028 118.3
2 15 2 754.8 4.485 34.347 24.8 4.427 27.222 34.346 28.2
2 15 1 1008.5 3.886 34.484 43.1 3.811 27.395 34.486 47.2
2 16 11 9.9 26.291 35.178 26.289 23.079
2 16 10 10.1 26.288 35.179 26.286 23.081
2 16 9 10.1 26.287 35.179 26.285 23.081
2 16 8 9.9 26.287 35.179 26.284 23.082
2 16 7 10.0 26.285 35.178 167.0 26.283 23.081 35.179 209.0
2 16 6 82.5 23.669 35.236 225.6 23.652 23.925 35.227 224.2
2 16 5 132.5 20.134 35.128 20.110 24.832
2 16 4 354.9 10.516 34.144 185.6 10.474 26.202 34.147 206.3
2 16 3 520.0 6.310 34.031 101.7 6.263 26.753 34.030 103.7
2 16 2 710.4 4.674 34.285 22.0 4.619 27.152 34.284 25.9
2 16 1 1014.9 3.858 34.483 44.3 3.782 27.397 34.485 46.8
2 17 7 28.3 26.283 35.187 194.6 26.277 23.090 35.184 210.2
2 17 6 519.2 6.298 34.033 103.9 6.252 26.757 34.032 100.8
2 17 5 991.2 4.016 34.470 39.9 3.941 27.371 34.467 43.7
2 17 4 1451.7 2.841 34.572 68.5 2.739 27.567 34.573 72.1
2 17 3 1920.7 2.153 34.619 93.3 2.021 27.665 34.616 95.1
2 17 2 2308.2 1.835 34.641 108.0 1.675 27.709 34.640 107.4
2 17 1 2971.9 1.560 34.668 130.2 1.345 27.755 34.667 129.1
HOT-1 Table VI.B.1
- 60 -
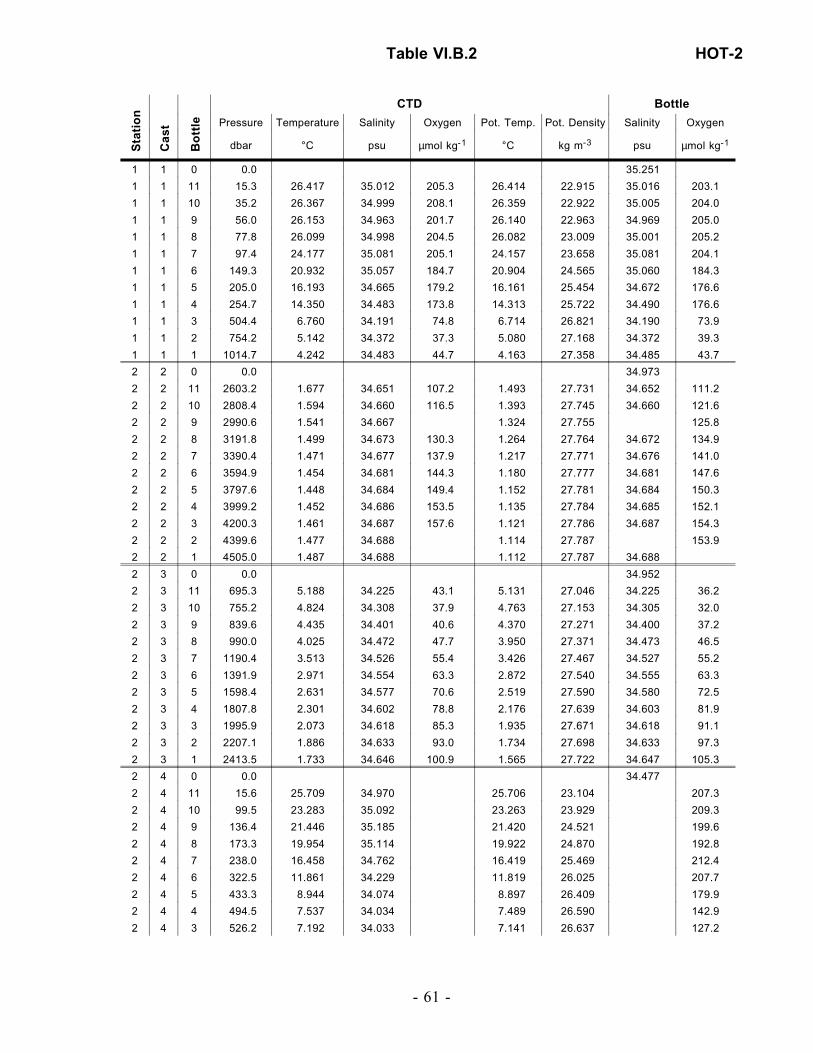
Sta
tio
n
Cas
t
Bo
ttle
CTD Bottle
Pressure Temperature Salinity Oxygen Pot. Temp. Pot. Density Salinity Oxygen
dbar °C psu µmol kg-1 °C kg m-3 psu µmol kg-1
1 1 0 0.0 35.251
1 1 11 15.3 26.417 35.012 205.3 26.414 22.915 35.016 203.1
1 1 10 35.2 26.367 34.999 208.1 26.359 22.922 35.005 204.0
1 1 9 56.0 26.153 34.963 201.7 26.140 22.963 34.969 205.0
1 1 8 77.8 26.099 34.998 204.5 26.082 23.009 35.001 205.2
1 1 7 97.4 24.177 35.081 205.1 24.157 23.658 35.081 204.1
1 1 6 149.3 20.932 35.057 184.7 20.904 24.565 35.060 184.3
1 1 5 205.0 16.193 34.665 179.2 16.161 25.454 34.672 176.6
1 1 4 254.7 14.350 34.483 173.8 14.313 25.722 34.490 176.6
1 1 3 504.4 6.760 34.191 74.8 6.714 26.821 34.190 73.9
1 1 2 754.2 5.142 34.372 37.3 5.080 27.168 34.372 39.3
1 1 1 1014.7 4.242 34.483 44.7 4.163 27.358 34.485 43.7
2 2 0 0.0 34.973
2 2 11 2603.2 1.677 34.651 107.2 1.493 27.731 34.652 111.2
2 2 10 2808.4 1.594 34.660 116.5 1.393 27.745 34.660 121.6
2 2 9 2990.6 1.541 34.667 1.324 27.755 125.8
2 2 8 3191.8 1.499 34.673 130.3 1.264 27.764 34.672 134.9
2 2 7 3390.4 1.471 34.677 137.9 1.217 27.771 34.676 141.0
2 2 6 3594.9 1.454 34.681 144.3 1.180 27.777 34.681 147.6
2 2 5 3797.6 1.448 34.684 149.4 1.152 27.781 34.684 150.3
2 2 4 3999.2 1.452 34.686 153.5 1.135 27.784 34.685 152.1
2 2 3 4200.3 1.461 34.687 157.6 1.121 27.786 34.687 154.3
2 2 2 4399.6 1.477 34.688 1.114 27.787 153.9
2 2 1 4505.0 1.487 34.688 1.112 27.787 34.688
2 3 0 0.0 34.952
2 3 11 695.3 5.188 34.225 43.1 5.131 27.046 34.225 36.2
2 3 10 755.2 4.824 34.308 37.9 4.763 27.153 34.305 32.0
2 3 9 839.6 4.435 34.401 40.6 4.370 27.271 34.400 37.2
2 3 8 990.0 4.025 34.472 47.7 3.950 27.371 34.473 46.5
2 3 7 1190.4 3.513 34.526 55.4 3.426 27.467 34.527 55.2
2 3 6 1391.9 2.971 34.554 63.3 2.872 27.540 34.555 63.3
2 3 5 1598.4 2.631 34.577 70.6 2.519 27.590 34.580 72.5
2 3 4 1807.8 2.301 34.602 78.8 2.176 27.639 34.603 81.9
2 3 3 1995.9 2.073 34.618 85.3 1.935 27.671 34.618 91.1
2 3 2 2207.1 1.886 34.633 93.0 1.734 27.698 34.633 97.3
2 3 1 2413.5 1.733 34.646 100.9 1.565 27.722 34.647 105.3
2 4 0 0.0 34.477
2 4 11 15.6 25.709 34.970 25.706 23.104 207.3
2 4 10 99.5 23.283 35.092 23.263 23.929 209.3
2 4 9 136.4 21.446 35.185 21.420 24.521 199.6
2 4 8 173.3 19.954 35.114 19.922 24.870 192.8
2 4 7 238.0 16.458 34.762 16.419 25.469 212.4
2 4 6 322.5 11.861 34.229 11.819 26.025 207.7
2 4 5 433.3 8.944 34.074 8.897 26.409 179.9
2 4 4 494.5 7.537 34.034 7.489 26.590 142.9
2 4 3 526.2 7.192 34.033 7.141 26.637 127.2
Table VI.B.2 HOT-2
- 61 -
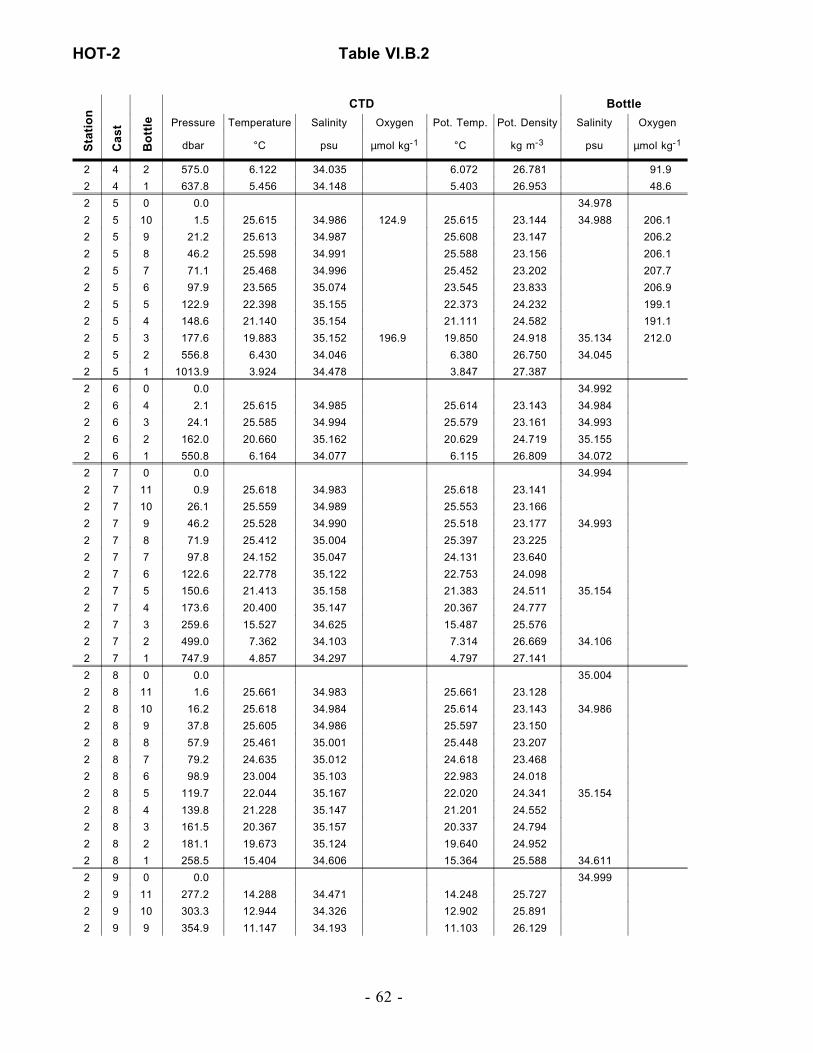
Sta
tio
n
Cas
t
Bo
ttle
CTD Bottle
Pressure Temperature Salinity Oxygen Pot. Temp. Pot. Density Salinity Oxygen
dbar °C psu µmol kg-1 °C kg m-3 psu µmol kg-1
2 4 2 575.0 6.122 34.035 6.072 26.781 91.9
2 4 1 637.8 5.456 34.148 5.403 26.953 48.6
2 5 0 0.0 34.978
2 5 10 1.5 25.615 34.986 124.9 25.615 23.144 34.988 206.1
2 5 9 21.2 25.613 34.987 25.608 23.147 206.2
2 5 8 46.2 25.598 34.991 25.588 23.156 206.1
2 5 7 71.1 25.468 34.996 25.452 23.202 207.7
2 5 6 97.9 23.565 35.074 23.545 23.833 206.9
2 5 5 122.9 22.398 35.155 22.373 24.232 199.1
2 5 4 148.6 21.140 35.154 21.111 24.582 191.1
2 5 3 177.6 19.883 35.152 196.9 19.850 24.918 35.134 212.0
2 5 2 556.8 6.430 34.046 6.380 26.750 34.045
2 5 1 1013.9 3.924 34.478 3.847 27.387
2 6 0 0.0 34.992
2 6 4 2.1 25.615 34.985 25.614 23.143 34.984
2 6 3 24.1 25.585 34.994 25.579 23.161 34.993
2 6 2 162.0 20.660 35.162 20.629 24.719 35.155
2 6 1 550.8 6.164 34.077 6.115 26.809 34.072
2 7 0 0.0 34.994
2 7 11 0.9 25.618 34.983 25.618 23.141
2 7 10 26.1 25.559 34.989 25.553 23.166
2 7 9 46.2 25.528 34.990 25.518 23.177 34.993
2 7 8 71.9 25.412 35.004 25.397 23.225
2 7 7 97.8 24.152 35.047 24.131 23.640
2 7 6 122.6 22.778 35.122 22.753 24.098
2 7 5 150.6 21.413 35.158 21.383 24.511 35.154
2 7 4 173.6 20.400 35.147 20.367 24.777
2 7 3 259.6 15.527 34.625 15.487 25.576
2 7 2 499.0 7.362 34.103 7.314 26.669 34.106
2 7 1 747.9 4.857 34.297 4.797 27.141
2 8 0 0.0 35.004
2 8 11 1.6 25.661 34.983 25.661 23.128
2 8 10 16.2 25.618 34.984 25.614 23.143 34.986
2 8 9 37.8 25.605 34.986 25.597 23.150
2 8 8 57.9 25.461 35.001 25.448 23.207
2 8 7 79.2 24.635 35.012 24.618 23.468
2 8 6 98.9 23.004 35.103 22.983 24.018
2 8 5 119.7 22.044 35.167 22.020 24.341 35.154
2 8 4 139.8 21.228 35.147 21.201 24.552
2 8 3 161.5 20.367 35.157 20.337 24.794
2 8 2 181.1 19.673 35.124 19.640 24.952
2 8 1 258.5 15.404 34.606 15.364 25.588 34.611
2 9 0 0.0 34.999
2 9 11 277.2 14.288 34.471 14.248 25.727
2 9 10 303.3 12.944 34.326 12.902 25.891
2 9 9 354.9 11.147 34.193 11.103 26.129
HOT-2 Table VI.B.2
- 62 -

Sta
tio
n
Cas
t
Bo
ttle
CTD Bottle
Pressure Temperature Salinity Oxygen Pot. Temp. Pot. Density Salinity Oxygen
dbar °C psu µmol kg-1 °C kg m-3 psu µmol kg-1
2 9 8 404.1 9.812 34.144 9.765 26.324 34.135
2 9 7 506.6 7.289 34.064 7.240 26.649 34.068
2 9 6 605.6 6.013 34.136 5.960 26.875
2 9 5 705.7 5.087 34.253 5.029 27.080
2 9 4 805.9 4.574 34.342 4.511 27.208
2 9 3 905.7 4.261 34.439 4.191 27.320
2 9 2 1005.7 3.918 34.475 3.843 27.385
2 9 1 1005.9 3.917 34.474 3.842 27.384 34.476
2 10 0 0.0 34.907
2 10 11 2.1 25.747 34.965 25.747 23.088
2 10 10 5.9 25.753 34.965 25.752 23.086
2 10 9 22.8 25.703 34.968 215.4 25.698 23.105 34.970 205.2
2 10 8 48.6 25.659 34.974 25.648 23.125
2 10 7 73.0 24.986 34.998 24.970 23.351
2 10 6 98.2 23.740 35.108 23.720 23.807
2 10 5 126.0 21.943 35.160 21.918 24.364
2 10 4 152.7 20.373 35.178 20.345 24.807
2 10 3 177.4 19.175 35.077 19.143 25.045
2 10 2 454.5 8.398 34.099 161.3 8.350 26.514 34.103 153.5
2 10 1 1005.4 3.985 34.477 47.6 3.909 27.380 34.479 44.9
2 11 0 0.0 34.919
2 11 11 1.8 25.724 34.982 25.723 23.108 34.987
2 11 10 20.6 25.653 34.983 25.648 23.131
2 11 9 46.6 25.644 34.986 25.634 23.138
2 11 8 73.5 25.490 34.987 25.474 23.188
2 11 7 99.4 23.838 35.053 23.818 23.737
2 11 6 125.0 22.094 35.159 22.069 24.321
2 11 5 150.1 21.225 35.192 21.196 24.588
2 11 4 176.3 19.593 35.107 19.561 24.960
2 11 3 251.3 15.600 34.634 15.561 25.566
2 11 2 304.0 13.220 34.357 13.178 25.859 34.349
2 11 1 506.5 7.568 34.104 7.518 26.640 34.105
2 12 0 0.0 34.686
2 12 5 11.6 25.696 34.999 25.693 23.129 208.5
2 12 4 152.2 21.662 35.160 189.6 21.632 24.443 35.155 199.4
2 12 3 557.5 6.559 34.095 98.2 6.508 26.772 34.096 90.8
2 12 2 755.5 4.855 34.294 4.795 27.139
2 12 1 1006.4 3.987 34.469 3.911 27.373
2 13 0 0.0 34.978
2 13 11 1.7 25.667 34.972 25.667 23.118
2 13 10 21.4 25.663 34.975 201.0 25.658 23.122 34.975 205.7
2 13 9 46.1 25.652 34.991 25.642 23.140
2 13 8 72.3 24.309 35.024 24.294 23.574
2 13 7 96.9 23.403 35.107 23.383 23.906
2 13 6 124.1 22.199 35.149 22.175 24.283
2 13 5 148.8 21.406 35.165 189.9 21.377 24.517 35.181 191.4
Table VI.B.2 HOT-2
- 63 -

Sta
tio
n
Cas
t
Bo
ttle
CTD Bottle
Pressure Temperature Salinity Oxygen Pot. Temp. Pot. Density Salinity Oxygen
dbar °C psu µmol kg-1 °C kg m-3 psu µmol kg-1
2 13 4 175.6 19.955 35.168 19.923 24.912
2 13 3 302.9 12.702 34.305 12.661 25.922
2 13 2 499.1 7.883 34.102 135.1 7.832 26.594 34.108 130.5
2 13 1 1027.6 3.959 34.481 3.881 27.386
2 14 0 0.0 35.003
2 14 4 32.6 25.653 35.003 210.8 25.646 23.148 35.005 204.9
2 14 3 159.4 20.845 35.193 190.2 20.814 24.692 35.186 194.2
2 14 2 208.2 17.819 34.930 17.783 25.273
2 14 1 495.2 7.309 34.079 121.3 7.261 26.657 34.079 120.9
2 15 0 0.0 35.011
2 15 11 1.6 25.650 34.979 25.650 23.128
2 15 10 21.6 25.645 34.980 210.0 25.640 23.132 34.982 203.9
2 15 9 46.4 25.542 34.993 25.532 23.175
2 15 8 72.1 24.962 35.010 24.947 23.366
2 15 7 97.9 23.410 35.104 23.390 23.901
2 15 6 125.8 22.451 35.136 22.426 24.203
2 15 5 151.1 21.355 35.159 189.7 21.325 24.527 35.145 190.1
2 15 4 176.9 19.885 35.141 19.852 24.910
2 15 3 303.9 12.701 34.297 12.660 25.917
2 15 2 543.1 6.347 34.056 101.9 6.298 26.769 34.056 95.4
2 15 1 1021.6 3.884 34.483 3.807 27.395
2 16 0 0.0 34.990
2 16 7 19.3 25.646 34.989 25.642 23.138
2 16 6 302.8 13.087 34.337 13.046 25.871
2 16 5 404.6 9.261 34.105 9.216 26.383 34.103
2 16 4 504.2 7.368 34.102 7.319 26.667
2 16 3 605.2 5.627 34.073 5.576 26.873 34.072
2 16 2 754.1 4.876 34.297 4.815 27.139
2 16 1 1005.3 3.973 34.480 3.898 27.383 34.482
2 18 0 0.0 34.977
2 18 3 23.1 25.662 34.986 25.657 23.131 34.983
2 18 2 141.8 21.433 35.163 21.405 24.509 35.156
2 18 1 538.6 6.865 34.043 6.815 26.690 34.041
2 19 0 0.0 34.969
2 19 3 17.4 25.672 34.979 25.668 23.123 34.978
2 19 2 138.8 21.679 35.172 21.652 24.447 35.169
2 19 1 605.5 6.058 34.097 6.005 26.839 34.097
2 20 0 0.0 34.987
2 20 3 17.6 25.659 34.985 25.655 23.131 34.980
2 20 2 140.0 21.419 35.154 21.392 24.506 35.157
2 20 1 507.4 7.525 34.106 7.475 26.648 34.107
2 21 0 0.0 35.000
2 21 3 25.3 25.665 34.995 25.659 23.138 34.992
2 21 2 144.1 20.867 35.142 20.839 24.647 35.136
2 21 1 507.3 7.438 34.112 7.388 26.666 34.107
2 22 0 0.0 35.000
HOT-2 Table VI.B.2
- 64 -

Sta
tio
n
Cas
t
Bo
ttle
CTD Bottle
Pressure Temperature Salinity Oxygen Pot. Temp. Pot. Density Salinity Oxygen
dbar °C psu µmol kg-1 °C kg m-3 psu µmol kg-1
2 22 3 21.2 25.662 34.996 25.657 23.139 34.994
2 22 2 140.9 20.892 35.149 20.865 24.645 35.142
2 22 1 403.9 9.455 34.114 9.410 26.359 34.117
2 23 0 0.0 34.995
2 23 3 21.4 25.643 34.988 25.638 23.138 34.984
2 23 2 150.4 20.097 35.147 20.069 24.857 35.152
2 23 1 480.0 7.902 34.098 7.854 26.587 34.096
2 24 0 0.0 34.985
2 24 3 15.4 25.643 34.984 25.640 23.135 34.983
2 24 2 140.7 21.889 35.174 21.861 24.390 35.161
2 24 1 403.3 9.527 34.118 9.481 26.350 34.112
2 25 0 0.0 34.974
2 25 3 17.9 25.721 34.970 25.717 23.101 34.968
2 25 2 140.5 21.772 35.171 21.744 24.421 35.162
2 25 1 493.3 7.850 34.067 7.800 26.570 34.060
2 26 0 0.0 35.036
2 26 3 31.4 25.727 35.026 25.720 23.142 35.026
2 26 2 160.6 21.110 35.178 21.080 24.609 35.171
2 26 1 493.6 8.131 34.105 8.080 26.560 34.097
2 27 0 0.0 35.032
2 27 3 25.8 25.680 35.017 25.675 23.149 35.019
2 27 2 158.3 21.169 35.192 21.139 24.604 35.182
2 27 1 492.4 7.954 34.105 7.905 26.585 34.100
2 28 0 0.0 35.030
2 28 2 159.2 21.111 35.146 21.081 24.585 35.146
2 28 1 494.9 7.897 34.109 7.847 26.597 34.104
2 29 0 0.0 35.044
2 29 3 31.9 25.674 35.036 25.667 23.166 35.034
2 29 2 160.7 20.835 35.139 20.805 24.654 35.140
2 29 1 496.6 7.945 34.078 7.894 26.565 34.068
2 30 0 0.0 35.022
2 30 3 32.6 25.653 35.014 25.646 23.156 35.013
2 30 2 160.9 21.377 35.171 21.346 24.531 35.158
2 30 1 495.4 7.834 34.058 7.785 26.566 34.055
2 31 0 0.0 34.993
2 31 3 31.9 25.622 34.990 25.615 23.147 34.988
2 31 2 159.3 21.240 35.161 21.210 24.561 35.150
2 31 1 495.7 7.277 34.075 7.229 26.659 34.069
Table VI.B.2 HOT-2
- 65 -

Sta
tio
n
Cas
t
Bo
ttle
CTD Bottle
Pressure Temperature Salinity Oxygen Pot. Temp. Pot. Density Salinity Oxygen
dbar °C psu µmol kg-1 °C kg m-3 psu µmol kg-1
2 1 0 0.0 35.086
2 1 12 2396.7 1.791 34.643 98.0 1.624 27.714 34.643 101.4
2 1 11 2575.1 1.685 34.653 106.5 1.503 27.731 34.654 110.2
2 1 10 2786.4 1.590 34.663 1.392 27.748 119.9
2 1 9 2987.6 1.538 34.670 125.8 1.322 27.758 34.671 126.6
2 1 8 3197.6 1.493 34.676 134.0 1.257 27.767 34.676 134.3
2 1 7 3402.8 1.470 34.680 1.215 27.774 137.6
2 1 6 3590.0 1.454 34.683 145.2 1.180 27.779 34.683 143.6
2 1 5 3794.8 1.448 34.686 150.1 1.152 27.783 34.685 149.9
2 1 4 4003.6 1.452 34.688 1.134 27.786 150.0
2 1 3 4205.0 1.461 34.689 1.120 27.788
2 1 2 4403.3 1.476 34.690 157.7 1.113 27.789 34.689 155.7
2 1 1 4504.9 1.485 34.690 1.110 27.789 34.690
2 2 0 0.0 35.064
2 2 12 35.9 24.710 35.039 216.5 24.702 23.463 35.042 212.4
2 2 11 204.9 18.796 34.996 181.9 18.760 25.080 35.002 187.5
2 2 10 378.3 10.553 34.170 169.6 10.508 26.217 34.175 181.3
2 2 9 598.6 6.168 34.102 88.4 6.114 26.829 34.104 77.0
2 2 8 757.5 4.808 34.287 32.0 4.748 27.139 34.288 31.8
2 2 7 928.8 4.193 34.445 36.9 4.122 27.332 34.446 41.1
2 2 6 1148.5 3.665 34.515 48.0 3.580 27.443 34.515 51.6
2 2 5 1351.3 3.182 34.551 57.2 3.085 27.519 34.554 60.7
2 2 4 1600.2 2.693 34.582 68.7 2.580 27.589 34.582 73.2
2 2 3 1775.8 2.412 34.598 75.9 2.288 27.627 34.598 78.5
2 2 2 1926.6 2.217 34.610 2.083 27.653 84.4
2 2 1 2201.1 1.909 34.632 91.3 1.757 27.696 34.632 93.7
2 3 0 0.0 35.046
2 3 12 19.7 24.676 35.037 221.3 24.672 23.470 35.037 209.3
2 3 11 118.8 22.966 35.104 215.8 22.941 24.031 35.108 203.8
2 3 10 186.0 19.846 35.075 188.6 19.812 24.869 35.074 185.3
2 3 9 252.9 16.241 34.701 186.7 16.200 25.472 34.711 193.1
2 3 8 334.2 12.237 34.285 174.8 12.193 25.998 34.285 182.3
2 3 7 384.7 10.479 34.183 165.2 10.433 26.240 34.182 172.3
2 3 6 436.6 9.200 34.126 165.3 9.152 26.410 34.125 166.3
2 3 5 504.2 7.503 34.096 124.1 7.454 26.644 34.094 116.8
2 3 4 549.5 6.690 34.079 105.8 6.639 26.742 34.076 100.2
2 3 3 596.9 5.960 34.121 76.2 5.908 26.870 34.120 68.5
2 3 2 710.8 5.077 34.257 36.7 5.019 27.084 34.253 33.4
2 3 1 1016.4 3.970 34.476 43.0 3.893 27.380 34.475 45.1
2 4 0 0.0 35.041
2 4 10 4.9 24.650 35.033 24.649 23.474 209.5
2 4 9 22.8 24.649 35.033 24.645 23.476 208.2
2 4 8 43.3 24.661 35.033 182.3 24.652 23.473 35.032 208.0
2 4 7 72.7 24.664 35.033 24.648 23.474 208.4
2 4 6 97.7 24.669 35.033 24.648 23.474 208.4
2 4 5 122.2 23.985 35.065 23.959 23.704 206.8
HOT-3 Table VI.B.3
- 66 -
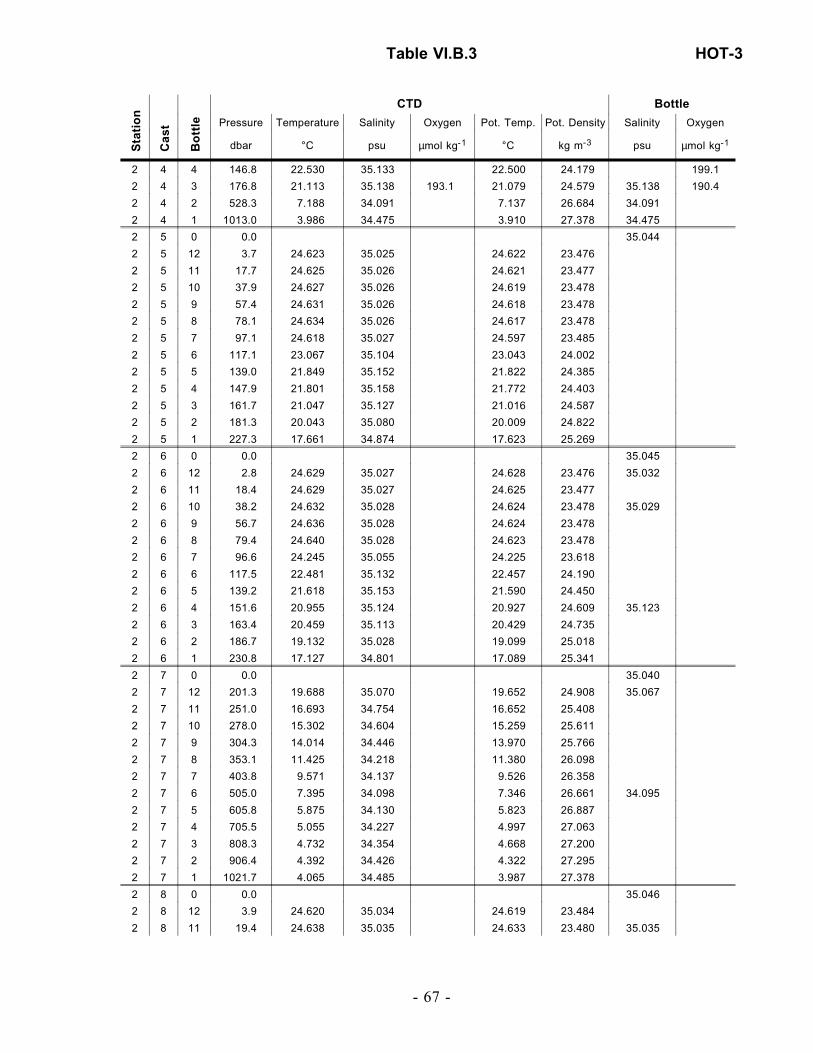
Sta
tio
n
Cas
t
Bo
ttle
CTD Bottle
Pressure Temperature Salinity Oxygen Pot. Temp. Pot. Density Salinity Oxygen
dbar °C psu µmol kg-1 °C kg m-3 psu µmol kg-1
2 4 4 146.8 22.530 35.133 22.500 24.179 199.1
2 4 3 176.8 21.113 35.138 193.1 21.079 24.579 35.138 190.4
2 4 2 528.3 7.188 34.091 7.137 26.684 34.091
2 4 1 1013.0 3.986 34.475 3.910 27.378 34.475
2 5 0 0.0 35.044
2 5 12 3.7 24.623 35.025 24.622 23.476
2 5 11 17.7 24.625 35.026 24.621 23.477
2 5 10 37.9 24.627 35.026 24.619 23.478
2 5 9 57.4 24.631 35.026 24.618 23.478
2 5 8 78.1 24.634 35.026 24.617 23.478
2 5 7 97.1 24.618 35.027 24.597 23.485
2 5 6 117.1 23.067 35.104 23.043 24.002
2 5 5 139.0 21.849 35.152 21.822 24.385
2 5 4 147.9 21.801 35.158 21.772 24.403
2 5 3 161.7 21.047 35.127 21.016 24.587
2 5 2 181.3 20.043 35.080 20.009 24.822
2 5 1 227.3 17.661 34.874 17.623 25.269
2 6 0 0.0 35.045
2 6 12 2.8 24.629 35.027 24.628 23.476 35.032
2 6 11 18.4 24.629 35.027 24.625 23.477
2 6 10 38.2 24.632 35.028 24.624 23.478 35.029
2 6 9 56.7 24.636 35.028 24.624 23.478
2 6 8 79.4 24.640 35.028 24.623 23.478
2 6 7 96.6 24.245 35.055 24.225 23.618
2 6 6 117.5 22.481 35.132 22.457 24.190
2 6 5 139.2 21.618 35.153 21.590 24.450
2 6 4 151.6 20.955 35.124 20.927 24.609 35.123
2 6 3 163.4 20.459 35.113 20.429 24.735
2 6 2 186.7 19.132 35.028 19.099 25.018
2 6 1 230.8 17.127 34.801 17.089 25.341
2 7 0 0.0 35.040
2 7 12 201.3 19.688 35.070 19.652 24.908 35.067
2 7 11 251.0 16.693 34.754 16.652 25.408
2 7 10 278.0 15.302 34.604 15.259 25.611
2 7 9 304.3 14.014 34.446 13.970 25.766
2 7 8 353.1 11.425 34.218 11.380 26.098
2 7 7 403.8 9.571 34.137 9.526 26.358
2 7 6 505.0 7.395 34.098 7.346 26.661 34.095
2 7 5 605.8 5.875 34.130 5.823 26.887
2 7 4 705.5 5.055 34.227 4.997 27.063
2 7 3 808.3 4.732 34.354 4.668 27.200
2 7 2 906.4 4.392 34.426 4.322 27.295
2 7 1 1021.7 4.065 34.485 3.987 27.378
2 8 0 0.0 35.046
2 8 12 3.9 24.620 35.034 24.619 23.484
2 8 11 19.4 24.638 35.035 24.633 23.480 35.035
Table VI.B.3 HOT-3
- 67 -
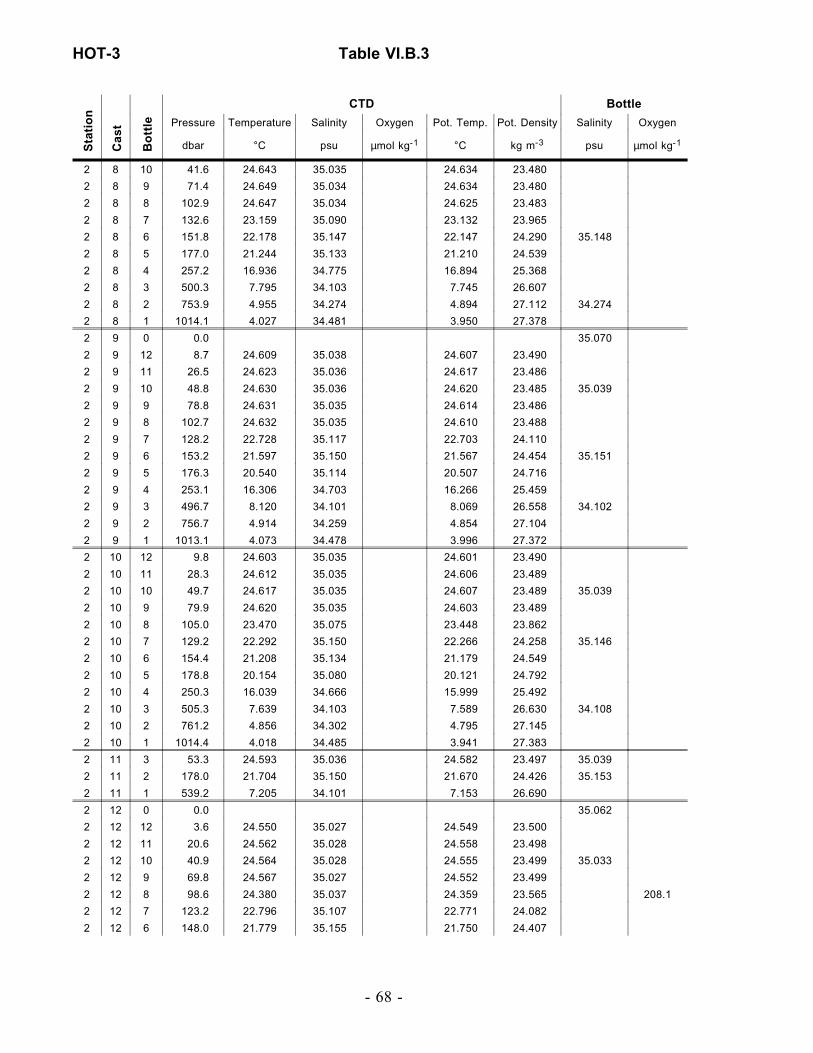
Sta
tio
n
Cas
t
Bo
ttle
CTD Bottle
Pressure Temperature Salinity Oxygen Pot. Temp. Pot. Density Salinity Oxygen
dbar °C psu µmol kg-1 °C kg m-3 psu µmol kg-1
2 8 10 41.6 24.643 35.035 24.634 23.480
2 8 9 71.4 24.649 35.034 24.634 23.480
2 8 8 102.9 24.647 35.034 24.625 23.483
2 8 7 132.6 23.159 35.090 23.132 23.965
2 8 6 151.8 22.178 35.147 22.147 24.290 35.148
2 8 5 177.0 21.244 35.133 21.210 24.539
2 8 4 257.2 16.936 34.775 16.894 25.368
2 8 3 500.3 7.795 34.103 7.745 26.607
2 8 2 753.9 4.955 34.274 4.894 27.112 34.274
2 8 1 1014.1 4.027 34.481 3.950 27.378
2 9 0 0.0 35.070
2 9 12 8.7 24.609 35.038 24.607 23.490
2 9 11 26.5 24.623 35.036 24.617 23.486
2 9 10 48.8 24.630 35.036 24.620 23.485 35.039
2 9 9 78.8 24.631 35.035 24.614 23.486
2 9 8 102.7 24.632 35.035 24.610 23.488
2 9 7 128.2 22.728 35.117 22.703 24.110
2 9 6 153.2 21.597 35.150 21.567 24.454 35.151
2 9 5 176.3 20.540 35.114 20.507 24.716
2 9 4 253.1 16.306 34.703 16.266 25.459
2 9 3 496.7 8.120 34.101 8.069 26.558 34.102
2 9 2 756.7 4.914 34.259 4.854 27.104
2 9 1 1013.1 4.073 34.478 3.996 27.372
2 10 12 9.8 24.603 35.035 24.601 23.490
2 10 11 28.3 24.612 35.035 24.606 23.489
2 10 10 49.7 24.617 35.035 24.607 23.489 35.039
2 10 9 79.9 24.620 35.035 24.603 23.489
2 10 8 105.0 23.470 35.075 23.448 23.862
2 10 7 129.2 22.292 35.150 22.266 24.258 35.146
2 10 6 154.4 21.208 35.134 21.179 24.549
2 10 5 178.8 20.154 35.080 20.121 24.792
2 10 4 250.3 16.039 34.666 15.999 25.492
2 10 3 505.3 7.639 34.103 7.589 26.630 34.108
2 10 2 761.2 4.856 34.302 4.795 27.145
2 10 1 1014.4 4.018 34.485 3.941 27.383
2 11 3 53.3 24.593 35.036 24.582 23.497 35.039
2 11 2 178.0 21.704 35.150 21.670 24.426 35.153
2 11 1 539.2 7.205 34.101 7.153 26.690
2 12 0 0.0 35.062
2 12 12 3.6 24.550 35.027 24.549 23.500
2 12 11 20.6 24.562 35.028 24.558 23.498
2 12 10 40.9 24.564 35.028 24.555 23.499 35.033
2 12 9 69.8 24.567 35.027 24.552 23.499
2 12 8 98.6 24.380 35.037 24.359 23.565 208.1
2 12 7 123.2 22.796 35.107 22.771 24.082
2 12 6 148.0 21.779 35.155 21.750 24.407
HOT-3 Table VI.B.3
- 68 -

Sta
tio
n
Cas
t
Bo
ttle
CTD Bottle
Pressure Temperature Salinity Oxygen Pot. Temp. Pot. Density Salinity Oxygen
dbar °C psu µmol kg-1 °C kg m-3 psu µmol kg-1
2 12 5 172.0 20.805 35.125 20.772 24.653 35.124
2 12 4 251.6 17.089 34.803 17.047 25.353 189.8
2 12 3 503.5 7.527 34.098 7.477 26.641 34.099
2 12 2 758.9 4.766 34.276 4.706 27.135 22.7
2 12 1 1005.6 4.112 34.472 4.036 27.363
2 13 0 0.0 35.022
2 13 12 4.1 24.527 35.018 24.526 23.500
2 13 11 22.5 24.532 35.020 24.527 23.501
2 13 10 42.7 24.537 35.021 24.528 23.501
2 13 9 72.1 24.544 35.021 24.529 23.501
2 13 8 97.3 24.550 35.022 24.529 23.502 208.7
2 13 7 122.0 23.072 35.089 23.047 23.990
2 13 6 152.9 21.686 35.151 21.656 24.430
2 13 5 175.0 20.231 35.090 20.199 24.779
2 13 4 254.6 15.834 34.639 15.794 25.518
2 13 3 504.6 7.520 34.093 7.470 26.639
2 13 2 754.7 4.922 34.292 4.861 27.130 28.7
2 13 1 1016.2 3.954 34.484 3.878 27.389
2 14 0 0.0 35.050
2 14 3 84.9 24.595 35.036 24.577 23.498 35.041
2 14 2 163.4 21.574 35.139 21.542 24.452 35.152
2 14 1 485.3 8.295 34.118 8.244 26.545 34.120
2 15 0 0.0 35.049
2 15 6 54.4 24.556 35.035 24.545 23.507 35.041
2 15 5 95.5 24.569 35.035 24.549 23.506
2 15 4 120.3 22.874 35.102 22.849 24.056
2 15 3 133.1 22.151 35.144 22.125 24.294
2 15 2 152.9 21.099 35.130 21.070 24.575 35.134
2 15 1 523.5 7.312 34.092 7.262 26.667 34.098
Table VI.B.3 HOT-3
- 69 -

Sta
tio
n
Cas
t
Bo
ttle
CTD Bottle
Pressure Temperature Salinity Oxygen Pot. Temp. Pot. Density Salinity Oxygen
dbar °C psu µmol kg-1 °C kg m-3 psu µmol kg-1
1 2 0 0.0 34.814
1 2 12 6.9 24.624 34.439 215.2 24.623 23.033 34.388 215.8
1 2 11 46.6 24.614 34.436 215.6 24.604 23.037 34.398 215.2
1 2 10 73.4 24.802 34.921 215.5 24.787 23.348 34.904 214.1
1 2 9 99.4 23.471 35.089 205.9 23.450 23.872 35.095 204.4
1 2 8 125.1 21.444 35.112 191.3 21.419 24.466 35.112 191.7
1 2 7 150.8 20.138 35.056 184.5 20.110 24.777 35.066 184.9
1 2 6 201.7 18.640 34.956 18.605 25.089 190.0
1 2 5 305.4 12.676 34.335 180.2 12.634 25.951 34.337 180.3
1 2 4 404.5 8.921 34.162 130.5 8.877 26.482 34.161 131.1
1 2 3 504.8 7.102 34.177 78.9 7.054 26.763 34.175 77.2
1 2 2 754.5 5.045 34.384 32.9 4.983 27.189 34.384 33.1
1 2 1 1015.1 4.053 34.504 45.7 3.975 27.395 34.504 46.3
2 1 0 0.0 34.827
2 1 12 8.7 23.548 34.839 23.546 23.655
2 1 11 18.8 23.547 34.837 23.543 23.654
2 1 10 38.5 23.557 34.830 23.549 23.647
2 1 9 58.4 23.570 34.832 23.558 23.646 34.821
2 1 8 78.4 23.254 35.268 23.238 24.070
2 1 7 98.4 23.159 35.307 23.138 24.128
2 1 6 108.2 23.088 35.328 23.066 24.165
2 1 5 118.3 22.910 35.333 22.886 24.221
2 1 4 131.3 22.273 35.326 22.246 24.398
2 1 3 141.4 21.576 35.239 21.548 24.527
2 1 2 151.3 20.670 35.176 20.641 24.726
2 1 1 163.0 19.520 35.103 19.491 24.974
2 2 0 0.0 34.820
2 2 12 179.4 18.152 34.957 18.121 25.210
2 2 11 226.3 15.444 34.653 15.409 25.615
2 2 10 250.9 14.298 34.533 14.261 25.772
2 2 9 270.4 13.178 34.382 13.141 25.887
2 2 8 299.8 12.485 34.352 12.445 26.001
2 2 7 402.2 9.711 34.146 9.665 26.342
2 2 6 502.1 7.629 34.117 7.580 26.642
2 2 5 602.8 6.087 34.126 6.034 26.858
2 2 4 703.8 5.346 34.286 5.288 27.076
2 2 3 806.7 4.938 34.378 4.873 27.197
2 2 2 908.3 4.484 34.440 4.412 27.297
2 2 1 1005.0 4.144 34.479 4.067 27.365
2 3 12 3.2 23.529 34.851 23.528 23.669 213.4
2 3 11 21.5 23.544 34.851 23.539 23.666 212.7
2 3 10 47.5 23.442 35.099 23.432 23.885 214.0
2 3 9 99.0 23.113 35.326 23.093 24.156 214.5
2 3 8 151.9 20.189 35.158 20.161 24.841 195.3
2 3 7 201.0 16.284 34.750 16.252 25.498 207.4
2 3 6 226.3 15.337 34.651 15.302 25.637 209.6
HOT-4 Table VI.B.4
- 70 -

Sta
tio
n
Cas
t
Bo
ttle
CTD Bottle
Pressure Temperature Salinity Oxygen Pot. Temp. Pot. Density Salinity Oxygen
dbar °C psu µmol kg-1 °C kg m-3 psu µmol kg-1
2 3 5 251.1 13.986 34.482 13.950 25.798 214.2
2 3 4 302.7 12.399 34.344 12.359 26.011 217.5
2 3 3 504.8 7.626 34.124 7.576 26.648 106.8
2 3 2 753.5 5.206 34.338 5.143 27.134 33.8
2 3 1 1016.3 4.175 34.481 4.096 27.363 45.2
2 4 0 0.0 34.845
2 4 12 2399.1 1.805 34.637 100.7 1.638 27.709 34.639 100.8
2 4 11 2601.8 1.683 34.650 109.1 1.500 27.729 34.651 110.1
2 4 10 2804.0 1.605 34.658 117.4 1.404 27.743 34.658 117.8
2 4 9 3005.6 1.550 34.666 125.5 1.332 27.754 34.665 126.0
2 4 8 3197.6 1.512 34.671 132.3 1.276 27.762 34.671 131.4
2 4 7 3400.3 1.482 34.676 139.0 1.226 27.770 34.676 138.6
2 4 6 3599.3 1.467 34.679 142.7 1.191 27.775 34.679 143.0
2 4 5 3800.9 1.452 34.682 147.3 1.156 27.780 34.681 147.2
2 4 4 4000.3 1.455 34.684 150.8 1.137 27.782 34.684 150.2
2 4 3 4202.8 1.466 34.685 1.125 27.784
2 4 2 4396.5 1.479 34.686 153.1 1.116 27.785 34.685 153.6
2 4 1 4549.7 1.492 34.686 1.112 27.786
2 5 11 201.7 16.418 34.776 16.385 25.488 207.2
2 5 10 404.4 9.900 34.156 201.7 9.854 26.318 34.161 201.1
2 5 9 601.2 6.244 34.195 57.4 6.190 26.893 34.191 56.3
2 5 8 787.3 5.037 34.369 33.7 4.973 27.178 34.369 34.7
2 5 7 998.7 4.185 34.475 43.1 4.108 27.357 34.476 43.8
2 5 6 1201.2 3.701 34.525 52.6 3.611 27.448 34.525 52.1
2 5 5 1395.3 3.105 34.552 63.5 3.004 27.527 34.551 62.1
2 5 4 1601.6 2.701 34.582 73.5 2.588 27.588 34.581 74.6
2 5 3 1802.9 2.384 34.599 82.8 2.259 27.630 34.599 81.8
2 5 2 2003.6 2.137 34.615 88.3 1.998 27.663 34.615 89.0
2 5 1 2201.3 1.942 34.626 94.0 1.789 27.689 34.628 93.9
2 6 0 0.0 34.786
2 6 8 5.8 23.478 34.844 23.477 23.679
2 6 7 22.1 23.530 34.875 23.525 23.688
2 6 6 41.8 23.547 34.959 23.538 23.748
2 6 5 71.8 23.207 35.304 23.193 24.110
2 6 4 99.6 22.965 35.345 22.945 24.213
2 6 3 123.2 22.505 35.346 22.480 24.347 35.336
2 6 2 151.1 19.419 35.111 19.392 25.006
2 6 1 177.4 17.143 34.862 17.114 25.382 34.863
2 7 0 0.0 34.896
2 7 12 47.0 23.349 35.175 23.340 23.969 214.0
2 7 11 131.0 22.215 35.320 207.5 22.189 24.410 35.337 208.0
2 7 10 162.1 19.852 35.119 19.822 24.900 195.6
2 7 9 203.7 16.500 34.785 16.467 25.475 207.4
2 7 8 299.8 12.496 34.354 12.455 26.001 216.0
2 7 7 355.4 10.805 34.229 10.762 26.218 212.3
2 7 6 423.7 8.816 34.130 144.0 8.770 26.473 34.131 144.8
Table VI.B.4 HOT-4
- 71 -

Sta
tio
n
Cas
t
Bo
ttle
CTD Bottle
Pressure Temperature Salinity Oxygen Pot. Temp. Pot. Density Salinity Oxygen
dbar °C psu µmol kg-1 °C kg m-3 psu µmol kg-1
2 7 5 571.5 6.496 34.167 6.443 26.838 66.2
2 7 4 678.0 5.564 34.292 5.507 27.055 38.5
2 7 3 745.5 5.102 34.361 5.041 27.164 36.0
2 7 2 810.5 4.625 34.437 4.561 27.278 38.7
2 7 1 980.2 4.164 34.486 4.089 27.368 44.7
2 8 0 0.0 34.895
2 8 12 5.0 23.424 34.918 23.423 23.750
2 8 11 22.2 23.438 34.927 23.433 23.754 34.890
2 8 10 42.0 23.240 35.212 23.231 24.029
2 8 9 71.8 23.131 35.313 23.116 24.139
2 8 8 100.2 22.858 35.342 22.838 24.241
2 8 7 126.4 22.010 35.320 21.985 24.466
2 8 6 148.4 20.511 35.181 20.483 24.773 35.178
2 8 5 177.6 18.641 35.022 18.610 25.138
2 8 4 247.7 14.717 34.569 14.680 25.710
2 8 3 303.2 12.567 34.363 12.526 25.994
2 8 2 507.7 7.666 34.136 7.616 26.652 34.136
2 8 1 756.4 5.195 34.350 5.132 27.145
2 9 0 0.0 34.896
2 9 2 5.5 23.359 34.935 23.358 23.783
2 9 1 106.2 23.020 35.312 22.999 24.172
2 10 0 0.0 34.911
2 10 3 22.7 23.389 34.936 23.384 23.775 34.896
2 10 2 121.9 22.057 35.312 22.033 24.447 35.325
2 10 1 468.7 8.017 34.129 7.970 26.595 34.124
HOT-4 Table VI.B.4
- 72 -

Sta
tio
n
Cas
t
Bo
ttle
CTD Bottle
Pressure Temperature Salinity Oxygen Pot. Temp. Pot. Density Salinity Oxygen
dbar °C psu µmol kg-1 °C kg m-3 psu µmol kg-1
1 1 0 0.0 34.602
1 1 12 10.1 24.771 34.315 218.3 24.769 22.896 34.307 216.5
1 1 11 71.0 24.708 34.771 216.8 24.692 23.263 34.678 216.7
1 1 10 127.6 22.979 35.064 218.6 22.953 23.998 35.008 220.7
1 1 9 145.3 22.147 35.069 202.6 22.118 24.238 35.069 203.2
1 1 8 196.3 19.561 34.956 19.526 24.853 187.6
1 1 7 242.0 16.616 34.740 197.2 16.577 25.415 34.763 196.3
1 1 6 367.7 11.616 34.247 198.1 11.569 26.086 34.239 199.6
1 1 5 452.5 8.629 34.134 145.0 8.581 26.506 34.131 146.1
1 1 4 520.7 7.199 34.178 99.4 7.149 26.751 34.170 95.0
1 1 3 585.3 6.204 34.240 52.3 6.151 26.933 34.236 54.0
1 1 2 759.1 5.108 34.384 36.2 5.045 27.182 34.382 38.0
1 1 1 998.0 4.253 34.485 48.9 4.176 27.358 34.484 48.2
2 1 0 0.0 34.668
2 1 9 3.0 24.357 34.715 24.356 23.322 34.666
2 1 8 22.9 24.331 34.712 24.326 23.328
2 1 7 42.7 24.137 34.742 24.128 23.410
2 1 6 74.6 23.799 34.927 23.783 23.652
2 1 5 152.4 21.636 35.065 21.606 24.378
2 1 4 178.7 20.663 35.096 20.629 24.669
2 1 3 258.2 16.814 34.759 16.771 25.384
2 1 2 305.8 13.766 34.414 13.723 25.793
2 1 1 500.5 8.024 34.066 7.973 26.545 34.059
2 2 0 0.0 34.645
2 5 0 0.0 34.638
2 5 12 26.7 24.130 34.786 239.3 24.124 23.444 34.649 244.9
2 5 11 111.1 23.072 35.176 212.2 23.049 24.055 35.137 211.8
2 5 10 144.1 21.417 35.094 197.2 21.389 24.460 35.071 199.8
2 5 9 212.0 19.001 34.987 188.9 18.963 25.022 34.969 191.1
2 5 8 266.8 16.453 34.726 191.7 16.410 25.443 34.709 195.3
2 5 7 351.8 12.238 34.301 210.6 12.192 26.010 34.293 210.1
2 5 6 386.6 10.720 34.190 192.0 10.673 26.204 34.179 193.5
2 5 5 423.0 9.820 34.149 9.771 26.327 199.9
2 5 4 453.2 9.110 34.114 190.8 9.060 26.415 34.107 191.1
2 5 3 535.0 7.178 34.047 145.3 7.127 26.651 34.039 144.0
2 5 2 570.5 6.455 34.041 117.2 6.403 26.743 34.035 114.8
2 5 1 633.5 5.533 34.092 65.0 5.480 26.900 34.080 66.7
2 8 0 0.0 34.649
2 8 12 4.6 24.334 34.707 24.333 23.322
2 8 11 23.7 24.294 34.727 24.289 23.351 34.676
2 8 10 40.8 23.919 34.784 23.911 23.506
2 8 9 72.4 23.732 34.900 23.717 23.651
2 8 8 97.2 23.628 34.963 23.608 23.731
2 8 7 122.5 23.371 35.196 23.346 23.983
2 8 6 149.5 21.834 35.049 21.805 24.311 35.047
2 8 5 177.2 20.516 35.040 20.482 24.665
Table VI.B.5 HOT-5
- 73 -

Sta
tio
n
Cas
t
Bo
ttle
CTD Bottle
Pressure Temperature Salinity Oxygen Pot. Temp. Pot. Density Salinity Oxygen
dbar °C psu µmol kg-1 °C kg m-3 psu µmol kg-1
2 8 4 255.2 16.661 34.755 16.620 25.417
2 8 3 507.4 7.703 34.055 7.653 26.582
2 8 2 755.7 4.828 34.295 4.768 27.143 34.286
2 8 1 1025.0 4.116 34.477 4.037 27.367 34.473
2 11 0 0.0 34.682
2 11 12 225.0
2 11 11 250.0 34.752 194.0
2 11 10 275.0 203.7
2 11 9 300.0 197.5
2 11 8 400.0 211.8
2 11 7 500.0 34.051 159.3
2 11 5 700.0 37.8
2 11 4 750.0 27.9
2 11 3 800.0 31.7
2 11 2 900.0 35.7
2 11 1 1000.0 34.462 41.0
2 12 0 0.0 34.687
2 12 11 25.0 34.689
2 12 3 500.0 34.045
2 12 1 1000.0 34.469
2 13 0 0.0 34.685
2 13 4 125.0 34.675
2 13 2 500.0 34.031
2 13 1 1000.0 34.491
2 16 0 0.0 34.704
2 16 12 40.8 23.755 34.876 23.746 23.624 216.5
2 16 11 71.7 23.326 34.937 226.8 23.311 23.797 34.930 217.9
2 16 10 81.6 23.307 34.967 23.290 23.826 217.9
2 16 9 92.5 23.310 35.034 23.291 23.877 217.6
2 16 8 101.9 23.229 35.125 23.208 23.970 216.0
2 16 7 111.7 23.091 35.160 23.069 24.037 213.6
2 16 6 121.6 22.049 35.085 206.6 22.025 24.277 35.087 203.9
2 16 5 127.4 21.899 35.087 21.874 24.321 202.2
2 16 4 133.7 21.406 35.068 21.380 24.443 199.1
2 16 3 143.6 20.912 35.117 20.884 24.616 197.8
2 16 2 152.5 20.756 35.109 20.727 24.652 196.9
2 16 1 200.2 18.826 34.980 190.3 18.791 25.060 34.956 191.5
HOT-5 Table VI.B.5
- 74 -

Sta
tio
n
Cas
t
Bo
ttle
CTD Bottle
Pressure Temperature Salinity Oxygen Pot. Temp. Pot. Density Salinity Oxygen
dbar °C psu µmol kg-1 °C kg m-3 psu µmol kg-1
1 2 0 0.0 35.197
1 2 12 41.8 25.184 34.433 211.3 25.175 22.861 34.449 213.0
1 2 11 61.8 23.944 34.859 219.9 23.931 23.556 34.845 218.7
1 2 10 110.8 21.494 35.123 196.9 21.472 24.459 35.148 202.4
1 2 9 162.5 18.552 34.893 191.6 18.524 25.061 34.906 185.2
1 2 8 211.2 15.917 34.655 15.884 25.509 183.5
1 2 7 281.0 12.803 34.340 12.764 25.929 192.0
1 2 6 336.8 10.606 34.198 172.8 10.566 26.228 34.192 175.3
1 2 5 411.0 8.684 34.143 138.2 8.640 26.504 34.138 137.9
1 2 4 530.0 6.801 34.161 85.4 6.752 26.792 34.157 78.8
1 2 3 630.2 5.794 34.242 50.6 5.740 26.986 34.231 48.1
1 2 2 756.5 5.080 34.360 35.7 5.018 27.166 34.355 37.4
1 2 1 899.0 4.414 34.462 38.2 4.344 27.322 34.462 42.3
2 1 12 2378.0 1.793 34.646 106.3 1.628 27.716 34.648 107.8
2 1 11 2578.9 1.692 34.655 112.9 1.510 27.733 34.657 114.9
2 1 10 2779.0 1.616 34.662 119.4 1.418 27.745 34.663 122.1
2 1 9 2980.5 1.567 34.668 125.0 1.350 27.755 34.668 125.9
2 1 8 3184.0 1.525 34.674 129.6 1.290 27.763 34.673 132.5
2 1 7 3389.0 1.492 34.678 135.7 1.237 27.771 34.678 137.6
2 1 6 3591.4 1.463 34.683 143.0 1.188 27.778 34.682 144.2
2 1 5 3794.5 1.451 34.686 1.156 27.783
2 1 4 3996.5 1.455 34.688 150.9 1.138 27.785 34.687 151.6
2 1 3 4200.0 1.465 34.689 154.3 1.125 27.787 34.687 152.4
2 1 2 4403.3 1.478 34.690 156.1 1.115 27.788 34.689 154.5
2 1 1 4507.1 1.487 34.690 157.4 1.111 27.789 34.691 154.2
2 2 0 0.0 34.955
2 2 11 13.8 24.051 34.981 24.048 23.614 34.948
2 2 10 30.1 23.947 34.986 23.941 23.650
2 2 9 49.9 22.973 35.249 22.962 24.135
2 2 8 79.9 22.205 35.235 22.189 24.345
2 2 7 154.7 17.688 34.890 17.661 25.271 34.894
2 2 6 179.2 16.454 34.734 16.425 25.446
2 2 5 254.4 12.696 34.321 12.661 25.934
2 2 4 303.2 11.250 34.210 11.212 26.122
2 2 3 503.0 6.568 34.034 6.522 26.722 34.029
2 2 2 752.5 4.676 34.318 4.616 27.178
2 2 1 1011.1 4.051 34.505 3.974 27.395
2 3 0 0.0 34.962
2 3 12 701.7 4.899 34.273 30.3 4.842 27.117 34.275 31.0
2 3 11 801.0 4.506 34.363 27.2 4.443 27.232 34.365 29.9
2 3 10 901.6 4.241 34.461 43.2 4.171 27.340 34.460 42.5
2 3 9 1002.3 3.980 34.493 48.9 3.904 27.393 34.493 48.3
2 3 8 1102.7 3.720 34.515 53.2 3.638 27.437 34.515 52.5
2 3 7 1251.5 3.302 34.545 61.1 3.212 27.503 34.545 60.1
2 3 6 1401.5 2.983 34.565 68.1 2.884 27.549 34.566 67.5
2 3 5 1552.2 2.722 34.583 74.2 2.613 27.586 34.582 74.4
Table VI.B.6 HOT-6
- 75 -

Sta
tio
n
Cas
t
Bo
ttle
CTD Bottle
Pressure Temperature Salinity Oxygen Pot. Temp. Pot. Density Salinity Oxygen
dbar °C psu µmol kg-1 °C kg m-3 psu µmol kg-1
2 3 4 1701.8 2.489 34.594 79.3 2.371 27.616 34.594 78.8
2 3 3 1852.4 2.268 34.609 86.5 2.140 27.647 34.609 85.6
2 3 2 2004.2 2.110 34.622 93.3 1.971 27.671 34.622 92.8
2 3 1 2210.4 1.932 34.635 100.8 1.778 27.696 34.634 100.2
2 4 0 0.0 34.981
2 4 12 30.7 23.837 35.028 220.4 23.831 23.715 34.992 215.9
2 4 11 87.1 22.053 35.260 216.7 22.036 24.407 35.275 215.3
2 4 10 136.1 19.225 35.076 189.0 19.200 25.029 35.085 198.2
2 4 9 201.0 16.046 34.688 195.0 16.015 25.505 34.682 198.0
2 4 8 281.2 12.125 34.269 212.2 12.088 26.005 34.263 211.4
2 4 7 324.4 10.722 34.194 202.2 10.683 26.205 34.181 205.2
2 4 6 386.6 9.186 34.120 195.0 9.144 26.406 34.119 192.6
2 4 5 464.2 7.446 34.043 156.3 7.400 26.609 34.042 157.5
2 4 4 512.5 6.632 34.025 134.5 6.585 26.707 34.022 127.8
2 4 3 561.2 5.929 34.062 84.5 5.881 26.826 34.055 81.5
2 4 2 611.3 5.456 34.135 47.1 5.405 26.942 34.132 46.9
2 4 1 668.3 5.100 34.223 31.2 5.046 27.054 34.220 29.4
2 5 0 0.0 34.964
2 5 12 4.5 23.983 34.983 224.1 23.982 23.635 34.953 215.6
2 5 11 19.5 23.977 34.985 23.973 23.640 215.6
2 5 10 39.4 22.959 35.204 22.951 24.104 215.4
2 5 9 59.4 22.443 35.295 22.431 24.322 213.6
2 5 8 79.0 21.615 35.285 21.600 24.548 216.8
2 5 7 99.0 20.573 35.185 202.6 20.554 24.756 35.172 202.5
2 5 6 108.7 20.150 35.154 20.129 24.847 199.2
2 5 5 119.1 19.596 35.091 19.575 24.944 196.3
2 5 4 129.0 18.991 35.022 18.968 25.047 195.2
2 5 3 139.8 18.534 34.992 18.510 25.140 195.3
2 5 2 159.7 17.808 34.907 17.781 25.255 197.4
2 5 1 179.6 16.467 34.738 198.8 16.438 25.446 34.743 197.1
2 6 0 0.0 35.019
2 6 12 199.7 16.111 34.688 16.079 25.490 34.684
2 6 11 250.6 13.676 34.421 13.640 25.815
2 6 10 273.5 12.643 34.313 12.606 25.939
2 6 9 300.4 11.445 34.208 11.407 26.085
2 6 8 349.7 10.191 34.152 10.150 26.265
2 6 7 400.4 9.094 34.108 9.051 26.412
2 6 6 502.7 6.751 34.021 6.705 26.688 34.022
2 6 5 603.0 5.578 34.099 5.527 26.899
2 6 4 702.3 4.955 34.278 4.898 27.114
2 6 3 801.9 4.562 34.390 4.499 27.248
2 6 2 904.1 4.263 34.460 4.194 27.336
2 6 1 1007.2 3.919 34.493 3.844 27.399 34.493
2 7 0 0.0 34.997
2 7 12 29.5 23.065 35.167 23.059 24.045
2 7 11 49.6 22.860 35.248 22.850 24.167
HOT-6 Table VI.B.6
- 76 -

Sta
tio
n
Cas
t
Bo
ttle
CTD Bottle
Pressure Temperature Salinity Oxygen Pot. Temp. Pot. Density Salinity Oxygen
dbar °C psu µmol kg-1 °C kg m-3 psu µmol kg-1
2 7 10 79.6 21.893 35.286 21.877 24.471
2 7 9 104.4 20.280 35.145 20.261 24.805
2 7 8 129.1 18.573 34.997 18.550 25.134 35.021
2 7 7 153.7 17.331 34.846 17.306 25.324
2 7 6 178.9 16.120 34.687 16.092 25.486
2 7 5 252.9 12.755 34.328 12.721 25.928
2 7 4 302.6 10.935 34.183 10.898 26.158
2 7 3 502.6 6.585 34.019 6.539 26.708 34.017
2 7 2 902.3 4.282 34.434 4.213 27.314
2 7 1 1012.1 3.908 34.481 3.832 27.391 34.481
2 8 0 0.0 34.981
2 8 12 1.3 24.025 34.990 24.025 23.628
2 8 11 20.8 23.899 35.002 23.895 23.676
2 8 10 40.9 23.033 35.171 23.024 24.058
2 8 9 73.5 22.510 35.245 22.495 24.265 35.260
2 8 8 98.2 21.344 35.199 21.325 24.558
2 8 7 125.2 19.678 35.088 19.655 24.921
2 8 6 149.8 18.128 34.938 18.103 25.201
2 8 5 174.6 16.769 34.777 16.741 25.406
2 8 4 252.3 12.452 34.310 12.419 25.973
2 8 3 467.5 6.767 34.013 6.724 26.679 34.050
2 8 2 767.5 4.695 34.351 4.635 27.202
2 8 1 1011.0 3.891 34.490 3.816 27.400 34.490
2 9 0 0.0 34.983
2 9 12 2.9 24.055 34.992 24.054 23.621
2 9 11 21.7 23.888 35.010 23.884 23.685
2 9 10 42.6 23.075 35.203 23.066 24.070
2 9 9 73.3 22.601 35.240 22.587 24.236
2 9 8 97.4 22.068 35.268 22.048 24.409 35.287
2 9 7 122.6 20.717 35.154 20.694 24.695
2 9 6 149.7 19.506 35.069 19.479 24.952
2 9 5 173.9 18.486 34.999 18.456 25.159
2 9 4 251.1 13.683 34.417 13.648 25.810
2 9 3 302.3 11.698 34.242 11.659 26.065 34.243
2 9 2 756.1 4.681 34.316 4.621 27.176
2 9 1 755.9 4.684 34.317 4.625 27.176 34.317
2 10 0 0.0 34.987
2 10 3 93.3 21.991 35.245 21.973 24.413 35.264
2 10 2 501.8 6.996 34.023 6.949 26.656 34.024
2 10 1 1017.0 3.985 34.483 3.908 27.384 34.483
2 11 0 0.0 35.003
2 11 4 105.8 20.111 35.117 20.091 24.828 35.138
2 11 3 500.5 6.874 34.023 6.828 26.672 34.023
2 11 2 500.5 6.862 34.022 6.815 26.674 34.023
2 11 1 1010.2 3.929 34.487 3.853 27.393 34.487
2 13 0 0.0 35.033
Table VI.B.6 HOT-6
- 77 -

Sta
tio
n
Cas
t
Bo
ttle
CTD Bottle
Pressure Temperature Salinity Oxygen Pot. Temp. Pot. Density Salinity Oxygen
dbar °C psu µmol kg-1 °C kg m-3 psu µmol kg-1
2 13 10 3.9 23.866 35.032 23.865 23.707 35.024
2 13 9 21.8 23.819 35.052 23.815 23.737
2 13 8 42.8 22.895 35.206 22.887 24.124
2 13 7 73.5 22.409 35.243 22.394 24.293 35.273
2 13 6 99.6 20.463 35.148 20.444 24.758
2 13 5 124.1 18.863 35.009 18.841 25.070
2 13 4 149.8 18.053 34.936 18.027 25.217
2 13 3 176.3 16.784 34.772 16.755 25.398
2 13 2 252.6 13.328 34.389 13.293 25.861
2 13 1 304.0 11.450 34.206 11.412 26.083 34.200
2 14 0 0.0 35.054
2 14 11 4.7 23.893 35.008 23.892 23.681 34.980
2 14 10 24.4 23.852 35.026 23.847 23.708
2 14 9 44.7 22.959 35.194 22.950 24.097
2 14 8 74.0 22.322 35.253 22.307 24.325 35.270
2 14 7 98.9 21.270 35.201 21.251 24.580
2 14 6 98.8 21.275 35.205 21.256 24.581
2 14 5 123.8 19.918 35.095 19.895 24.863
2 14 4 153.7 18.608 35.010 18.581 25.136
2 14 3 153.1 18.616 35.013 18.589 25.136
2 14 2 203.7 15.948 34.678 15.916 25.520
2 14 1 257.4 13.729 34.423 13.692 25.806 34.415
2 15 0 0.0 35.013
2 15 12 2.9 23.886 35.016 23.885 23.689 34.988
2 15 11 23.0 23.846 35.025 23.841 23.709
2 15 10 45.8 22.857 35.208 22.848 24.137
2 15 9 74.4 22.437 35.250 22.422 24.290 35.269
2 15 8 106.9 20.475 35.141 20.455 24.750
2 15 7 126.9 19.365 35.039 19.342 24.965
2 15 6 151.8 18.135 34.956 18.109 25.213
2 15 5 176.8 16.529 34.656 16.500 25.369
2 15 4 256.8 12.440 34.293 12.406 25.962
2 15 3 305.8 10.733 34.156 10.696 26.173
2 15 2 504.6 6.573 34.013 6.527 26.705 34.017
2 15 1 1012.3 3.924 34.475 3.848 27.385
2 16 0 0.0 34.990
2 16 3 13.8 23.942 35.019 23.939 23.675
2 16 2 2076.9 2.001 34.629 1.858 27.685
2 16 1 2025.1 2.052 34.624 1.913 27.677
2 17 0 0.0 34.995
2 17 7 107.9 35.285
2 18 0 0.0 35.046
2 18 12 37.7 23.067 35.225 23.059 24.089 35.198
2 18 11 67.7 22.420 35.245 22.407 24.291
2 18 10 77.3 22.178 35.264 22.163 24.374 35.291
2 18 9 87.5 21.509 35.246 21.492 24.547
HOT-6 Table VI.B.6
- 78 -
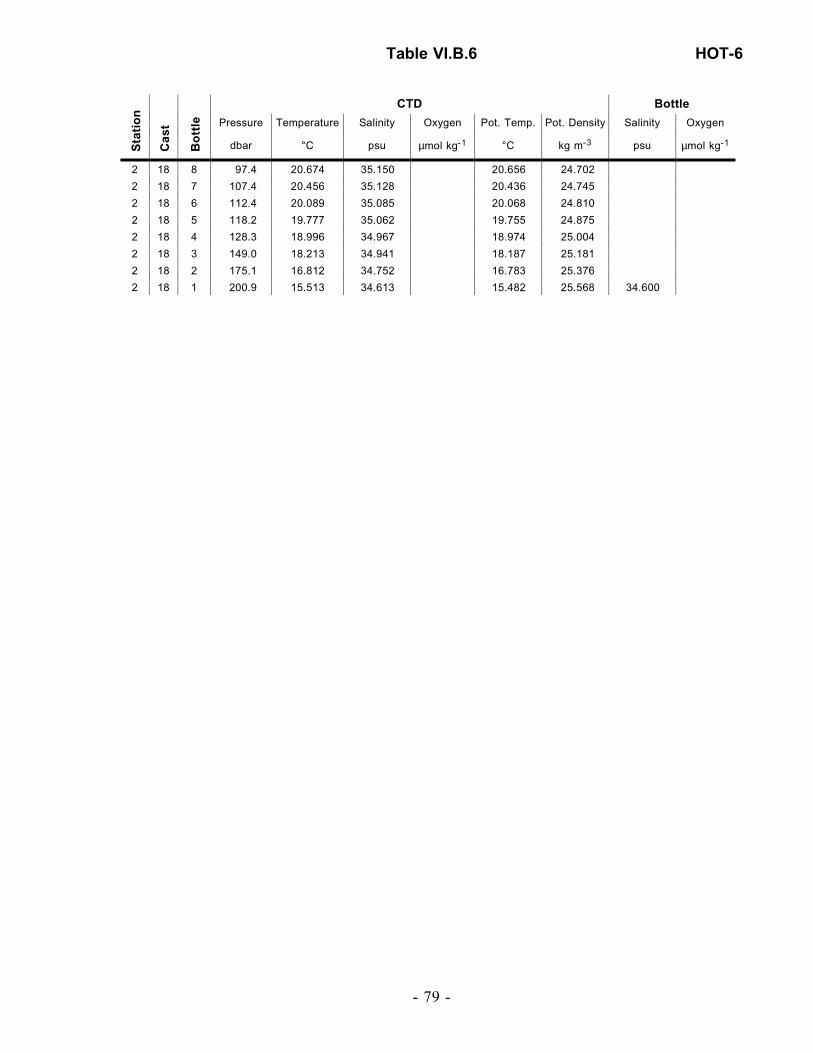
Sta
tio
n
Cas
t
Bo
ttle
CTD Bottle
Pressure Temperature Salinity Oxygen Pot. Temp. Pot. Density Salinity Oxygen
dbar °C psu µmol kg-1 °C kg m-3 psu µmol kg-1
2 18 8 97.4 20.674 35.150 20.656 24.702
2 18 7 107.4 20.456 35.128 20.436 24.745
2 18 6 112.4 20.089 35.085 20.068 24.810
2 18 5 118.2 19.777 35.062 19.755 24.875
2 18 4 128.3 18.996 34.967 18.974 25.004
2 18 3 149.0 18.213 34.941 18.187 25.181
2 18 2 175.1 16.812 34.752 16.783 25.376
2 18 1 200.9 15.513 34.613 15.482 25.568 34.600
Table VI.B.6 HOT-6
- 79 -
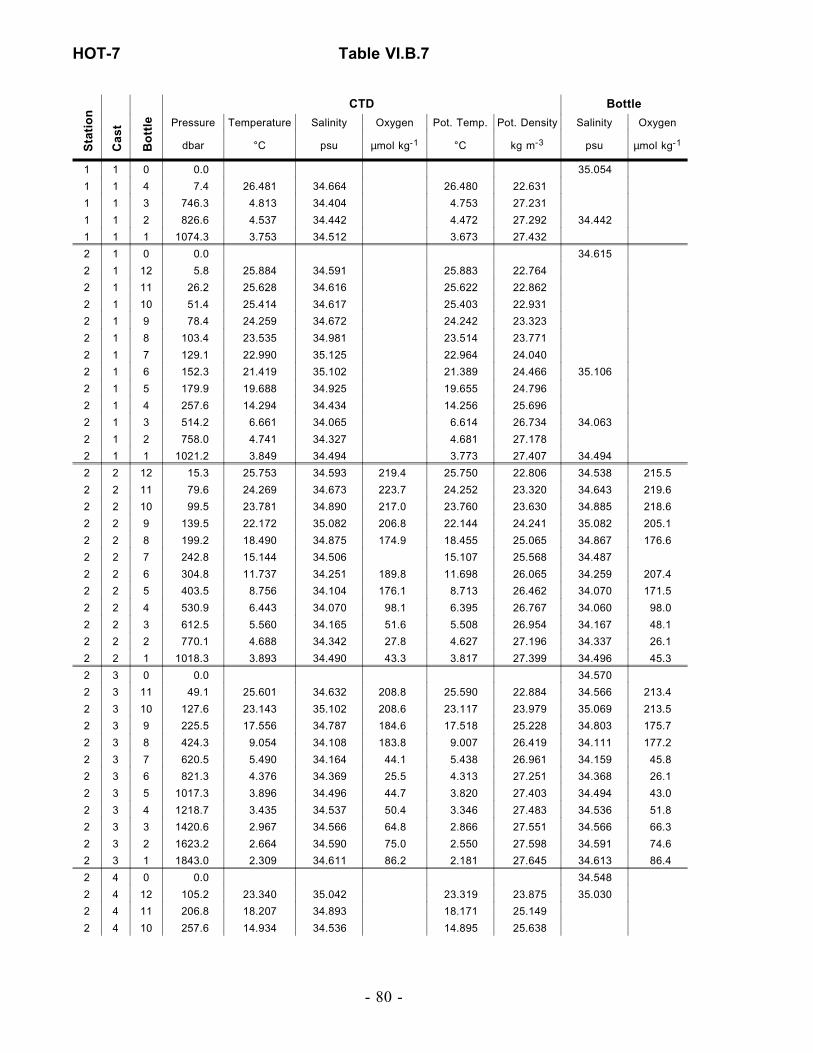
Sta
tio
n
Cas
t
Bo
ttle
CTD Bottle
Pressure Temperature Salinity Oxygen Pot. Temp. Pot. Density Salinity Oxygen
dbar °C psu µmol kg-1 °C kg m-3 psu µmol kg-1
1 1 0 0.0 35.054
1 1 4 7.4 26.481 34.664 26.480 22.631
1 1 3 746.3 4.813 34.404 4.753 27.231
1 1 2 826.6 4.537 34.442 4.472 27.292 34.442
1 1 1 1074.3 3.753 34.512 3.673 27.432
2 1 0 0.0 34.615
2 1 12 5.8 25.884 34.591 25.883 22.764
2 1 11 26.2 25.628 34.616 25.622 22.862
2 1 10 51.4 25.414 34.617 25.403 22.931
2 1 9 78.4 24.259 34.672 24.242 23.323
2 1 8 103.4 23.535 34.981 23.514 23.771
2 1 7 129.1 22.990 35.125 22.964 24.040
2 1 6 152.3 21.419 35.102 21.389 24.466 35.106
2 1 5 179.9 19.688 34.925 19.655 24.796
2 1 4 257.6 14.294 34.434 14.256 25.696
2 1 3 514.2 6.661 34.065 6.614 26.734 34.063
2 1 2 758.0 4.741 34.327 4.681 27.178
2 1 1 1021.2 3.849 34.494 3.773 27.407 34.494
2 2 12 15.3 25.753 34.593 219.4 25.750 22.806 34.538 215.5
2 2 11 79.6 24.269 34.673 223.7 24.252 23.320 34.643 219.6
2 2 10 99.5 23.781 34.890 217.0 23.760 23.630 34.885 218.6
2 2 9 139.5 22.172 35.082 206.8 22.144 24.241 35.082 205.1
2 2 8 199.2 18.490 34.875 174.9 18.455 25.065 34.867 176.6
2 2 7 242.8 15.144 34.506 15.107 25.568 34.487
2 2 6 304.8 11.737 34.251 189.8 11.698 26.065 34.259 207.4
2 2 5 403.5 8.756 34.104 176.1 8.713 26.462 34.070 171.5
2 2 4 530.9 6.443 34.070 98.1 6.395 26.767 34.060 98.0
2 2 3 612.5 5.560 34.165 51.6 5.508 26.954 34.167 48.1
2 2 2 770.1 4.688 34.342 27.8 4.627 27.196 34.337 26.1
2 2 1 1018.3 3.893 34.490 43.3 3.817 27.399 34.496 45.3
2 3 0 0.0 34.570
2 3 11 49.1 25.601 34.632 208.8 25.590 22.884 34.566 213.4
2 3 10 127.6 23.143 35.102 208.6 23.117 23.979 35.069 213.5
2 3 9 225.5 17.556 34.787 184.6 17.518 25.228 34.803 175.7
2 3 8 424.3 9.054 34.108 183.8 9.007 26.419 34.111 177.2
2 3 7 620.5 5.490 34.164 44.1 5.438 26.961 34.159 45.8
2 3 6 821.3 4.376 34.369 25.5 4.313 27.251 34.368 26.1
2 3 5 1017.3 3.896 34.496 44.7 3.820 27.403 34.494 43.0
2 3 4 1218.7 3.435 34.537 50.4 3.346 27.483 34.536 51.8
2 3 3 1420.6 2.967 34.566 64.8 2.866 27.551 34.566 66.3
2 3 2 1623.2 2.664 34.590 75.0 2.550 27.598 34.591 74.6
2 3 1 1843.0 2.309 34.611 86.2 2.181 27.645 34.613 86.4
2 4 0 0.0 34.548
2 4 12 105.2 23.340 35.042 23.319 23.875 35.030
2 4 11 206.8 18.207 34.893 18.171 25.149
2 4 10 257.6 14.934 34.536 14.895 25.638
HOT-7 Table VI.B.7
- 80 -
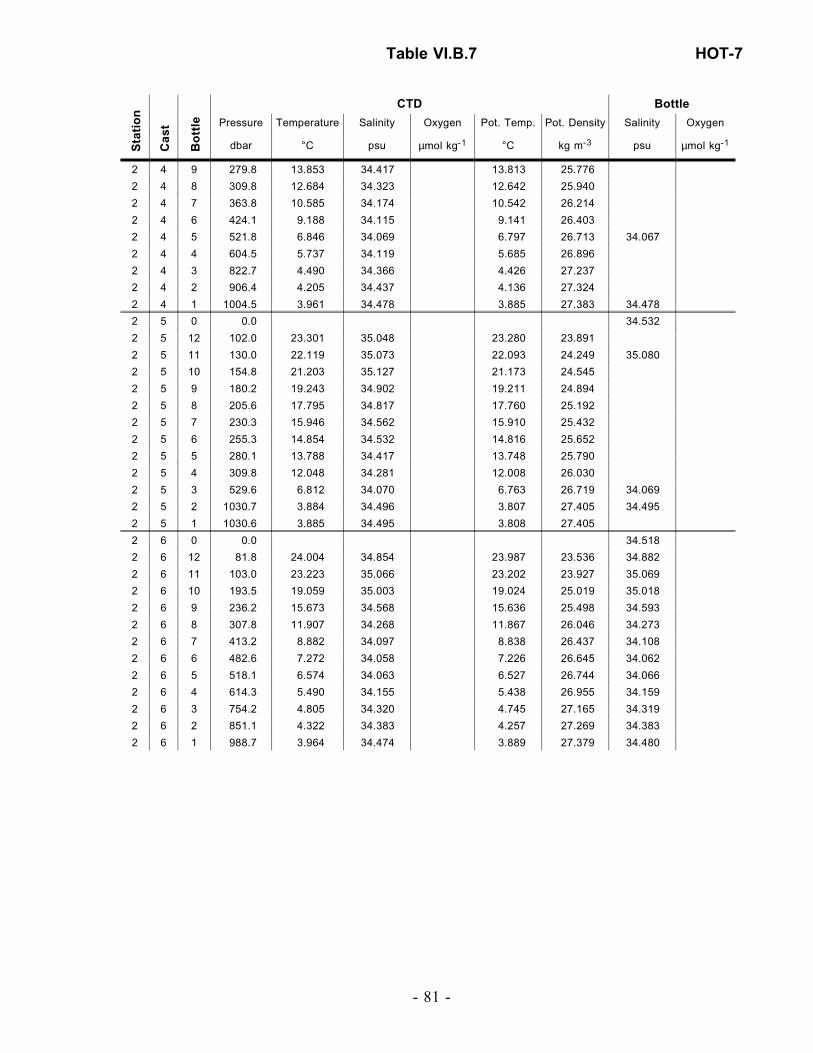
Sta
tio
n
Cas
t
Bo
ttle
CTD Bottle
Pressure Temperature Salinity Oxygen Pot. Temp. Pot. Density Salinity Oxygen
dbar °C psu µmol kg-1 °C kg m-3 psu µmol kg-1
2 4 9 279.8 13.853 34.417 13.813 25.776
2 4 8 309.8 12.684 34.323 12.642 25.940
2 4 7 363.8 10.585 34.174 10.542 26.214
2 4 6 424.1 9.188 34.115 9.141 26.403
2 4 5 521.8 6.846 34.069 6.797 26.713 34.067
2 4 4 604.5 5.737 34.119 5.685 26.896
2 4 3 822.7 4.490 34.366 4.426 27.237
2 4 2 906.4 4.205 34.437 4.136 27.324
2 4 1 1004.5 3.961 34.478 3.885 27.383 34.478
2 5 0 0.0 34.532
2 5 12 102.0 23.301 35.048 23.280 23.891
2 5 11 130.0 22.119 35.073 22.093 24.249 35.080
2 5 10 154.8 21.203 35.127 21.173 24.545
2 5 9 180.2 19.243 34.902 19.211 24.894
2 5 8 205.6 17.795 34.817 17.760 25.192
2 5 7 230.3 15.946 34.562 15.910 25.432
2 5 6 255.3 14.854 34.532 14.816 25.652
2 5 5 280.1 13.788 34.417 13.748 25.790
2 5 4 309.8 12.048 34.281 12.008 26.030
2 5 3 529.6 6.812 34.070 6.763 26.719 34.069
2 5 2 1030.7 3.884 34.496 3.807 27.405 34.495
2 5 1 1030.6 3.885 34.495 3.808 27.405
2 6 0 0.0 34.518
2 6 12 81.8 24.004 34.854 23.987 23.536 34.882
2 6 11 103.0 23.223 35.066 23.202 23.927 35.069
2 6 10 193.5 19.059 35.003 19.024 25.019 35.018
2 6 9 236.2 15.673 34.568 15.636 25.498 34.593
2 6 8 307.8 11.907 34.268 11.867 26.046 34.273
2 6 7 413.2 8.882 34.097 8.838 26.437 34.108
2 6 6 482.6 7.272 34.058 7.226 26.645 34.062
2 6 5 518.1 6.574 34.063 6.527 26.744 34.066
2 6 4 614.3 5.490 34.155 5.438 26.955 34.159
2 6 3 754.2 4.805 34.320 4.745 27.165 34.319
2 6 2 851.1 4.322 34.383 4.257 27.269 34.383
2 6 1 988.7 3.964 34.474 3.889 27.379 34.480
Table VI.B.7 HOT-7
- 81 -

Sta
tio
n
Cas
t
Bo
ttle
CTD Bottle
Pressure Temperature Salinity Oxygen Pot. Temp. Pot. Density Salinity Oxygen
dbar °C psu µmol kg-1 °C kg m-3 psu µmol kg-1
1 1 0 0.0 35.277
1 1 12 18.2 26.303 34.694 208.3 26.299 22.711 34.667 208.3
1 1 11 67.1 24.802 34.759 218.7 24.788 23.225 34.742 216.4
1 1 10 126.4 20.866 35.073 192.4 20.842 24.594 35.101 194.8
1 1 9 166.2 17.978 34.847 182.0 17.949 25.168 34.886 185.9
1 1 8 240.5 12.755 34.313 172.8 12.722 25.917 34.299 167.7
1 1 7 320.1 9.888 34.156 175.6 9.852 26.319 34.141 177.9
1 1 6 449.6 6.952 34.096 106.4 6.910 26.719 34.080 106.7
1 1 5 539.7 5.811 34.221 54.2 5.765 26.966 34.215 49.6
1 1 4 629.4 5.070 34.302 32.8 5.019 27.119 34.293 34.6
1 1 3 729.5 5.097 34.427 32.7 5.037 27.217 34.424 34.1
1 1 2 879.5 4.534 34.466 38.9 4.464 27.312 34.464 40.8
1 1 1 1033.5 4.102 34.503 47.2 4.022 27.388 34.505 46.2
2 1 0 0.0 35.016
2 1 12 6.3 25.331 34.942 25.329 23.199 34.905
2 1 11 26.0 25.332 34.941 25.326 23.199 34.907
2 1 10 47.8 25.245 34.956 25.235 23.238 34.978
2 1 9 77.1 23.008 35.217 22.992 24.102
2 1 8 103.3 22.067 35.271 22.047 24.412
2 1 7 129.0 20.776 35.220 20.751 24.730 35.237
2 1 6 155.4 19.237 35.056 19.209 25.012
2 1 5 180.9 17.944 34.957 17.913 25.261 34.934
2 1 4 257.8 13.661 34.417 13.624 25.815 34.414
2 1 3 509.6 6.470 34.037 6.424 26.737 34.040
2 1 2 761.7 4.591 34.322 4.531 27.190 34.325
2 1 1 1019.6 3.727 34.496 3.652 27.420 34.500
2 2 0 0.0 34.939
2 2 12 54.3 23.718 35.144 228.6 23.706 23.839 35.113 226.8
2 2 11 98.5 22.623 35.259 222.9 22.604 24.245 35.253 220.6
2 2 10 148.5 20.217 35.179 195.9 20.189 24.849 35.187 199.7
2 2 9 206.8 16.689 34.754 198.5 16.655 25.408 34.773 198.3
2 2 8 288.0 11.961 34.257 209.7 11.923 26.027 34.257 211.3
2 2 7 403.5 8.606 34.073 170.8 8.564 26.461 34.069 170.1
2 2 6 483.8 6.962 34.057 115.3 6.916 26.688 34.069 110.0
2 2 5 564.3 5.635 34.062 78.6 5.587 26.863 34.058 74.4
2 2 4 635.0 5.194 34.127 44.2 5.142 26.967 34.123 47.5
2 2 3 765.2 4.696 34.307 30.0 4.635 27.167 34.307 25.1
2 2 2 855.6 4.391 34.388 29.2 4.325 27.265 34.386 29.1
2 2 1 1012.3 3.800 34.477 40.9 3.725 27.398 34.481 42.1
2 3 0 0.0 34.927
2 3 12 203.2 17.071 34.807 17.037 25.359
2 3 11 227.7 16.174 34.720 16.138 25.501
2 3 10 255.7 14.239 34.479 14.202 25.743
2 3 9 304.7 11.905 34.239 11.865 26.024
2 3 8 355.2 10.001 34.131 9.960 26.281
2 3 7 406.6 8.701 34.075 8.658 26.447
HOT-8 Table VI.B.8
- 82 -

Sta
tio
n
Cas
t
Bo
ttle
CTD Bottle
Pressure Temperature Salinity Oxygen Pot. Temp. Pot. Density Salinity Oxygen
dbar °C psu µmol kg-1 °C kg m-3 psu µmol kg-1
2 3 6 505.4 6.541 34.045 6.496 26.735
2 3 5 605.0 5.152 34.132 5.103 26.975
2 3 4 705.1 4.637 34.243 4.582 27.122
2 3 3 804.4 4.442 34.374 4.380 27.248
2 3 2 905.7 4.057 34.422 3.989 27.327
2 3 1 1006.9 3.847 34.473 3.772 27.390
2 4 0 0.0 34.976
2 4 12 204.9 15.792 34.657 203.3 15.760 25.539 34.667 201.6
2 4 11 228.0 15.248 34.581 204.3 15.213 25.603 34.583 198.1
2 4 10 253.5 13.644 34.411 206.1 13.608 25.814 34.408 207.3
2 4 9 304.8 11.501 34.205 197.8 11.462 26.073 34.205 199.3
2 4 8 356.0 9.934 34.120 190.4 9.893 26.283 34.120 191.2
2 4 7 405.7 8.719 34.073 170.3 8.676 26.443 34.072 172.6
2 4 6 507.6 6.560 34.048 100.7 6.514 26.734 34.044 100.7
2 4 5 605.7 5.224 34.106 53.9 5.175 26.946 34.104 53.6
2 4 4 708.3 4.628 34.259 24.0 4.573 27.136 34.258 23.6
2 4 3 808.1 4.388 34.385 26.6 4.326 27.263 34.385 28.2
2 4 2 909.9 4.036 34.429 31.6 3.968 27.335 34.427 33.2
2 4 1 1012.5 3.800 34.482 41.8 3.725 27.402 34.482 44.3
2 5 0 0.0 34.937
2 5 12 5.6 25.401 34.976 213.8 25.400 23.203 34.922 212.0
2 5 11 27.4 25.402 34.977 213.5 25.396 23.205 34.920 212.3
2 5 10 46.8 25.359 34.974 214.0 25.349 23.217 34.917 212.0
2 5 9 61.8 23.950 35.123 224.5 23.937 23.755 35.066 226.6
2 5 8 77.3 23.120 35.229 225.4 23.104 24.079 35.192 225.2
2 5 7 87.8 22.579 35.275 219.7 22.561 24.270 35.254 220.4
2 5 6 98.5 22.167 35.296 213.9 22.147 24.403 35.283 218.5
2 5 5 109.3 21.756 35.306 215.3 21.735 24.526 35.298 215.3
2 5 4 119.2 21.490 35.308 212.5 21.467 24.601 35.300 214.8
2 5 3 130.5 21.101 35.288 213.9 21.076 24.694 35.301 213.8
2 5 2 156.0 19.358 35.108 195.8 19.330 25.020 35.111 196.6
2 5 1 181.1 17.636 34.785 196.2 17.606 25.205 34.888 193.9
2 6 0 0.0 34.952
2 6 3 14.4 25.344 34.970 25.341 23.216 34.915
2 6 2 108.2 21.385 35.296 21.364 24.621 35.304
2 6 1 544.3 5.779 34.046 5.733 26.832 34.040
2 7 0 0.0 34.928
2 7 12 52.2 23.569 35.162 23.558 23.896 35.126
2 7 11 95.9 21.758 35.305 21.739 24.524 35.303
2 7 10 216.9 16.181 34.718 16.146 25.498 34.715
2 7 9 300.9 11.604 34.210 11.566 26.058 34.211
2 7 8 361.2 9.826 34.119 9.785 26.301 34.117
2 7 7 472.6 7.298 34.052 7.253 26.637 34.049
2 7 6 513.5 6.594 34.058 6.547 26.738 34.056
2 7 5 612.8 5.191 34.108 5.141 26.952 34.107
2 7 4 749.9 4.564 34.316 4.506 27.188 34.314
Table VI.B.8 HOT-8
- 83 -

Sta
tio
n
Cas
t
Bo
ttle
CTD Bottle
Pressure Temperature Salinity Oxygen Pot. Temp. Pot. Density Salinity Oxygen
dbar °C psu µmol kg-1 °C kg m-3 psu µmol kg-1
2 7 3 828.0 4.320 34.395 4.257 27.278 34.393
2 7 2 973.2 3.858 34.465 3.786 27.383 34.467
2 7 1 1019.5 3.783 34.485 3.707 27.407 34.489
2 8 0 0.0 34.935
2 8 3 106.0 21.757 35.311 21.736 24.530 35.311
2 8 2 529.4 6.026 34.055 5.980 26.809 34.051
2 8 1 1021.1 3.829 34.502 3.753 27.415 34.502
2 9 0 0.0 34.940
2 9 12 6.0 25.388 34.976 25.387 23.206 34.920
2 9 11 25.3 25.341 34.973 25.336 23.220 34.922
2 9 10 47.7 24.654 35.056 24.644 23.493 35.013
2 9 9 77.6 22.722 35.284 22.707 24.235 35.260
2 9 8 106.1 21.582 35.307 21.562 24.575 35.300
2 9 7 125.0 20.845 35.217 20.821 24.709 35.226
2 9 6 153.2 19.561 35.098 19.533 24.960 35.103
2 9 5 181.9 16.880 34.796 16.851 25.394 34.784
2 9 4 257.7 13.079 34.337 13.044 25.871 34.334
2 9 3 510.9 6.735 34.064 6.688 26.724 34.066
2 9 2 761.1 4.554 34.316 4.495 27.190 34.319
2 9 1 1022.7 3.851 34.496 3.774 27.409 34.494
2 10 0 0.0 35.002
2 10 12 5.7 25.429 34.975 25.428 23.193 34.922
2 10 11 5.6 25.428 34.976 25.426 23.194 34.920
2 10 10 25.9 25.371 34.973 25.366 23.211 34.920
2 10 9 45.9 25.170 34.979 25.160 23.279 34.962
2 10 8 76.9 22.785 35.281 22.770 24.215 35.251
2 10 7 102.9 22.010 35.297 21.990 24.448 35.288
2 10 6 128.7 21.383 35.298 21.358 24.624 35.288
2 10 5 128.6 21.383 35.294 21.358 24.621 35.287
2 10 4 155.4 20.148 35.161 20.119 24.854 35.174
2 10 3 180.6 18.226 34.937 18.195 25.176 34.973
2 10 2 257.7 13.642 34.393 13.606 25.800 34.387
2 10 1 257.3 13.678 34.391 13.641 25.792 34.387
2 11 0 0.0 34.980
2 11 3 6.4 25.393 34.974 25.391 23.204 34.925
2 11 2 114.9 21.482 35.276 21.460 24.579 35.259
2 11 1 509.0 6.684 34.060 6.638 26.727 34.060
2 12 0 0.0 34.952
2 12 3 11.5 25.356 34.970 25.353 23.212 34.919
2 12 2 107.1 21.450 35.290 21.429 24.598 35.288
2 12 1 543.5 5.927 34.042 5.880 26.811 34.045
2 13 12 4.6 25.286 34.913 25.285 23.190 34.921
2 13 11 15.6 25.293 34.912 25.290 23.188 34.920
2 13 10 30.3 25.291 34.912 25.284 23.190 34.921
2 13 9 45.9 25.233 34.925 25.223 23.219 34.935
2 13 8 60.1 23.644 35.151 23.631 23.866 35.151
HOT-8 Table VI.B.8
- 84 -

Sta
tio
n
Cas
t
Bo
ttle
CTD Bottle
Pressure Temperature Salinity Oxygen Pot. Temp. Pot. Density Salinity Oxygen
dbar °C psu µmol kg-1 °C kg m-3 psu µmol kg-1
2 13 7 76.8 22.761 35.250 22.746 24.198 35.253
2 13 6 92.4 22.196 35.277 22.177 24.380 35.283
2 13 5 102.6 21.717 35.258 21.697 24.500 35.274
2 13 4 112.1 21.438 35.274 21.416 24.590 35.275
2 13 3 122.0 20.755 35.208 20.732 24.726
2 13 2 128.9 20.573 35.200 20.549 24.769 35.208
2 13 1 149.2 19.543 35.111 19.516 24.974 35.121
2 14 0 0.0 34.947
2 14 12 7.6 25.344 34.901 25.342 23.164 34.915
2 14 11 27.8 25.298 34.903 25.292 23.180 34.916
2 14 10 47.4 24.969 34.969 24.958 23.332 34.958
2 14 9 76.2 22.764 35.242 22.748 24.191 35.214
2 14 8 105.0 21.555 35.275 21.535 24.558 35.285
2 14 7 129.8 20.459 35.196 20.434 24.797 35.206
2 14 6 154.2 18.347 34.962 18.321 25.165 34.965
2 14 5 180.7 17.082 34.775 17.052 25.330 34.786
2 14 4 255.7 13.006 34.320 12.971 25.873 34.323
2 14 3 507.4 6.709 34.057 6.662 26.722 34.058
2 14 2 762.2 4.533 34.336 4.474 27.208 34.337
2 14 1 1017.9 3.860 34.494 3.784 27.406 34.494
2 15 0 0.0 35.007
2 15 3 29.1 25.332 34.900 25.326 23.168 34.916
2 15 2 123.2 21.433 35.243 21.409 24.569 35.255
2 15 1 553.9 5.891 34.046 5.843 26.819 34.046
Table VI.B.8 HOT-8
- 85 -

Sta
tio
n
Cas
t
Bo
ttle
CTD Bottle
Pressure Temperature Salinity Oxygen Pot. Temp. Pot. Density Salinity Oxygen
dbar °C psu µmol kg-1 °C kg m-3 psu µmol kg-1
1 1 0 0.0 34.729
1 1 12 5.4 26.755 34.718 209.1 26.754 22.585 34.713 208.3
1 1 11 70.3 25.728 34.660 213.4 25.712 22.868 34.669 214.2
1 1 10 117.4 22.059 35.226 210.1 22.036 24.381 35.222 212.7
1 1 9 149.9 20.209 35.142 193.5 20.181 24.823 35.142 196.4
1 1 8 208.0 16.199 34.671 180.7 16.166 25.458 34.666 179.8
1 1 7 266.3 11.727 34.269 11.693 26.079 170.9
1 1 6 352.1 8.691 34.127 147.1 8.653 26.489 34.125 150.8
1 1 5 430.9 7.173 34.120 109.6 7.132 26.708 34.115 107.1
1 1 4 539.4 6.227 34.246 52.9 6.179 26.934 34.245 51.1
1 1 3 633.0 5.663 34.321 36.3 5.609 27.065 34.322 35.9
1 1 2 727.4 5.034 34.416 33.3 4.975 27.215 34.415 35.2
1 1 1 1026.1 3.981 34.517 46.5 3.903 27.412 34.517 47.7
2 1 0 0.0 34.672
2 1 12 10.1 26.121 34.663 26.118 22.744 34.661
2 1 11 26.0 26.122 34.661 26.116 22.744
2 1 10 46.7 26.121 34.662 26.110 22.746
2 1 9 77.6 24.925 34.784 24.908 23.208
2 1 8 104.6 23.658 35.082 23.637 23.812
2 1 7 129.2 22.430 35.281 22.404 24.319
2 1 6 154.3 21.391 35.311 21.361 24.633 35.309
2 1 5 181.3 20.593 35.211 20.558 24.775
2 1 4 258.5 14.941 34.522 14.902 25.626
2 1 3 509.9 7.251 34.184 7.202 26.748
2 1 2 761.7 4.816 34.344 4.755 27.183
2 1 1 1026.9 4.002 34.496 3.924 27.393 34.496
2 2 0 0.0 34.668
2 2 12 779.3 4.734 34.377 31.7 4.672 27.218 34.378 32.4
2 2 11 911.2 4.251 34.454 41.2 4.181 27.333 34.454 42.0
2 2 10 1053.8 3.885 34.504 49.1 3.806 27.411 34.504 48.5
2 2 9 1198.1 3.472 34.534 55.7 3.384 27.477 34.534 55.8
2 2 8 1352.3 3.084 34.561 63.2 2.988 27.535 34.560 62.7
2 2 7 1499.7 2.868 34.573 67.7 2.762 27.566 34.573 68.6
2 2 6 1649.7 2.649 34.587 73.8 2.533 27.597 34.587 74.9
2 2 5 1802.7 2.442 34.600 79.5 2.316 27.626 34.596 80.5
2 2 4 1952.6 2.227 34.615 88.5 2.091 27.656 34.615 88.7
2 2 3 2100.3 2.055 34.627 94.8 1.909 27.680 34.627 95.8
2 2 2 2303.7 1.895 34.640 1.734 27.704
2 2 1 2508.2 1.776 34.648 109.6 1.599 27.721 34.649 107.7
2 3 0 0.0 34.691
2 3 12 4.5 26.309 34.669 26.308 22.689
2 3 11 59.9 25.448 34.724 214.5 25.435 23.002 34.716 214.2
2 3 10 91.6 23.391 35.115 215.9 23.372 23.915 35.113 216.5
2 3 9 139.3 21.204 35.287 204.5 21.177 24.665 35.287 205.2
2 3 8 191.7 18.464 34.967 186.1 18.431 25.141 34.962 188.2
2 3 7 227.3 16.624 34.743 193.5 16.587 25.415 34.739 196.1
HOT-9 Table VI.B.9
- 86 -

Sta
tio
n
Cas
t
Bo
ttle
CTD Bottle
Pressure Temperature Salinity Oxygen Pot. Temp. Pot. Density Salinity Oxygen
dbar °C psu µmol kg-1 °C kg m-3 psu µmol kg-1
2 3 6 299.8 12.297 34.238 12.257 25.948 195.0
2 3 5 357.1 10.135 34.129 191.1 10.094 26.257 34.126 188.8
2 3 4 483.7 7.065 34.049 122.2 7.020 26.667 34.047 125.3
2 3 3 523.7 7.024 34.179 69.8 6.974 26.776 34.174 69.2
2 3 2 563.4 6.243 34.158 67.0 6.193 26.863 34.154 60.7
2 3 1 678.3 5.279 34.267 36.0 5.223 27.069 34.260 34.0
2 4 0 0.0 34.682
2 4 12 203.8 16.995 34.804 16.961 25.374 195.7
2 4 11 230.9 15.797 34.637 15.760 25.524 195.9
2 4 10 255.6 14.070 34.432 14.033 25.742 197.1
2 4 9 305.4 11.808 34.207 11.768 26.018 195.1
2 4 8 355.5 9.885 34.131 9.844 26.300 195.2
2 4 7 408.1 8.507 34.081 172.8 8.464 26.482 34.073 172.6
2 4 6 508.4 7.545 34.229 7.495 26.742
2 4 5 612.9 5.776 34.206 5.723 26.960 46.3
2 4 4 709.8 5.036 34.308 4.979 27.129 31.7
2 4 3 814.6 4.587 34.422 4.523 27.271 34.7
2 4 2 919.3 4.194 34.479 4.124 27.359 41.9
2 4 1 1022.2 3.911 34.508 46.2 3.835 27.412 34.508 47.1
2 5 0 0.0 34.684
2 5 12 4.8 26.260 34.680 26.259 22.713 208.8
2 5 11 25.8 26.140 34.674 26.134 22.748 208.5
2 5 10 45.8 26.019 34.680 26.009 22.791 209.9
2 5 9 61.6 25.075 34.798 25.061 23.172 215.2
2 5 8 76.1 23.885 35.000 23.869 23.681 216.2
2 5 7 87.3 23.377 35.129 23.359 23.929 216.7
2 5 6 97.4 23.079 35.183 23.059 24.057 216.4
2 5 5 109.0 22.841 35.230 22.819 24.162 216.8
2 5 4 118.0 22.486 35.268 22.463 24.293 215.6
2 5 3 130.5 21.998 35.287 213.9 21.972 24.446 35.282 211.7
2 5 2 157.0 20.976 35.266 20.946 24.712 201.5
2 5 1 181.8 19.145 35.058 19.112 25.038 190.1
2 6 0 0.0 34.685
2 6 12 4.8 26.215 34.681 26.214 22.728 34.689
2 6 11 4.8 26.214 34.681 26.213 22.728 34.674
2 6 10 25.7 26.196 34.677 26.190 22.733
2 6 9 25.7 26.205 34.674 26.200 22.727 34.671
2 6 8 46.7 26.132 34.672 26.122 22.750
2 6 7 77.4 25.041 34.800 25.024 23.185
2 6 6 103.1 23.041 35.191 23.020 24.075
2 6 5 128.1 22.342 35.272 22.317 24.337
2 6 4 155.8 21.566 35.295 21.536 24.573
2 6 3 179.7 19.859 35.130 19.826 24.908
2 6 2 207.7 18.031 34.931 17.995 25.221
2 6 1 269.1 14.132 34.432 14.093 25.729
2 7 0 0.0 34.689
Table VI.B.9 HOT-9
- 87 -

Sta
tio
n
Cas
t
Bo
ttle
CTD Bottle
Pressure Temperature Salinity Oxygen Pot. Temp. Pot. Density Salinity Oxygen
dbar °C psu µmol kg-1 °C kg m-3 psu µmol kg-1
2 7 4 13.8 26.184 34.673 26.181 22.732 34.673
2 7 3 136.6 21.996 35.272 21.969 24.435 35.273
2 7 2 531.9 6.454 34.144 6.406 26.824 34.146
2 7 1 1023.0 3.997 34.493 3.920 27.391 34.492
2 9 0 0.0 34.737
2 9 3 146.9 21.529 35.311 21.500 24.595 35.297
2 9 2 459.5 7.361 34.040 7.316 26.619 34.040
2 9 1 1025.0 3.986 34.489 3.908 27.389 34.489
2 11 0 0.0 34.772
2 11 3 157.0 20.883 35.264 20.853 24.736 35.263
2 11 2 470.6 7.511 34.080 7.465 26.629 34.065
2 11 1 1021.1 3.969 34.488 3.891 27.390 34.488
2 12 0 0.0 34.706
2 12 12 128.4 22.006 35.271 21.981 24.431 35.273
2 12 11 181.1 19.789 35.125 19.756 24.922 35.133
2 12 10 181.1 19.794 35.124 19.761 24.920
2 12 9 181.0 19.812 35.128 19.779 24.919 35.134
2 12 8 257.9 14.924 34.522 14.885 25.629
2 12 7 511.1 7.508 34.209 7.457 26.732 34.210
2 12 6 510.2 7.516 34.210 7.466 26.731
2 12 5 760.1 4.862 34.343 4.801 27.177 34.343
2 12 4 760.0 4.862 34.343 4.801 27.177
2 12 3 1020.0 3.911 34.495 3.834 27.401 34.496
2 12 2 1020.1 3.910 34.495 3.834 27.401
2 12 1 1020.3 3.910 34.495 3.833 27.401 34.494
2 13 0 0.0 34.711
2 13 9 3.6 26.353 34.687 26.352 22.689 34.681
2 13 8 27.0 26.170 34.680 26.164 22.742 34.679
2 13 7 46.7 26.080 34.671 26.070 22.765 34.669
2 13 6 78.2 24.011 34.965 23.995 23.618 34.970
2 13 5 105.8 22.997 35.202 22.976 24.096 35.206
2 13 4 130.7 21.765 35.296 21.740 24.517 35.292
2 13 3 157.8 20.582 35.222 20.552 24.785 35.218
2 13 2 486.3 7.682 34.169 7.634 26.675 34.158
2 13 1 1020.3 3.937 34.496 3.860 27.399 34.496
2 14 0 0.0 34.700
2 14 4 37.7 26.167 34.665 26.159 22.733 34.679
2 14 3 140.9 21.653 35.284 21.625 24.540 35.291
2 14 2 554.5 6.171 34.149 6.122 26.865 34.147
2 14 1 1032.0 3.894 34.497 3.817 27.404 34.496
2 15 0 0.0 34.696
2 15 4 28.3 26.164 34.673 26.158 22.740 34.696
2 15 3 137.5 21.814 35.277 21.787 24.489 35.276
2 15 2 549.1 6.434 34.144 6.385 26.827 34.145
2 15 1 1022.9 4.000 34.492 3.922 27.390 34.492
2 16 0 0.0 34.696
HOT-9 Table VI.B.9
- 88 -
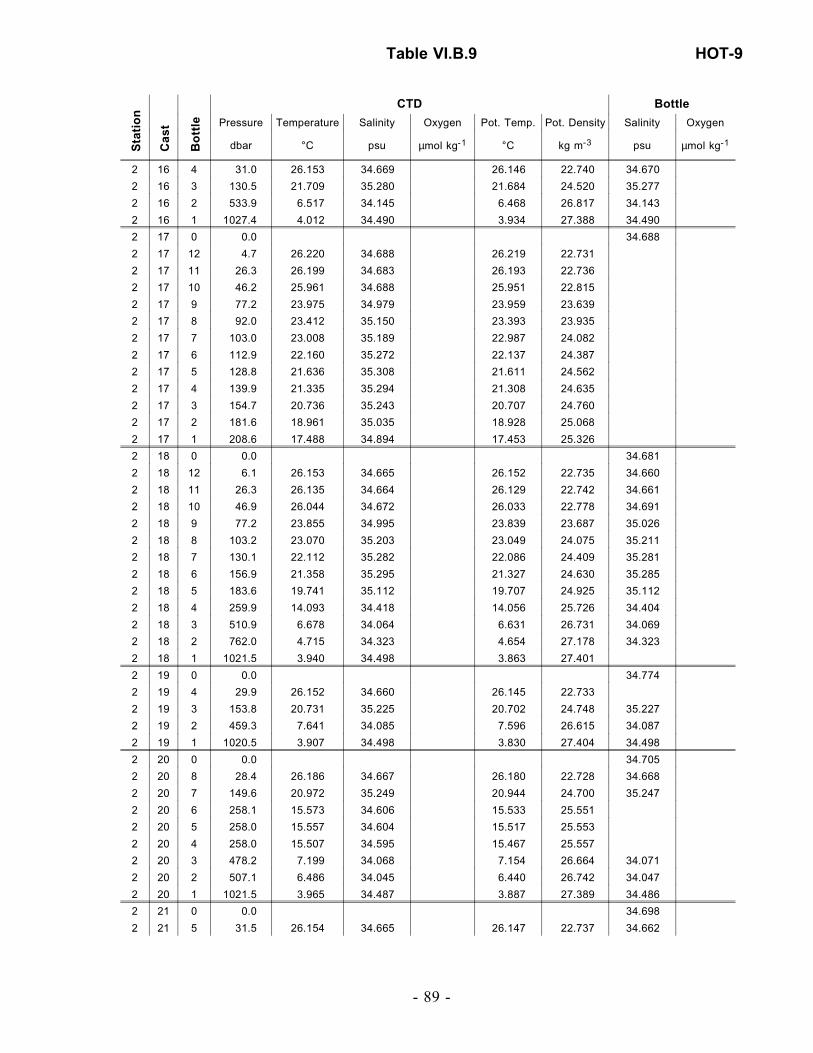
Sta
tio
n
Cas
t
Bo
ttle
CTD Bottle
Pressure Temperature Salinity Oxygen Pot. Temp. Pot. Density Salinity Oxygen
dbar °C psu µmol kg-1 °C kg m-3 psu µmol kg-1
2 16 4 31.0 26.153 34.669 26.146 22.740 34.670
2 16 3 130.5 21.709 35.280 21.684 24.520 35.277
2 16 2 533.9 6.517 34.145 6.468 26.817 34.143
2 16 1 1027.4 4.012 34.490 3.934 27.388 34.490
2 17 0 0.0 34.688
2 17 12 4.7 26.220 34.688 26.219 22.731
2 17 11 26.3 26.199 34.683 26.193 22.736
2 17 10 46.2 25.961 34.688 25.951 22.815
2 17 9 77.2 23.975 34.979 23.959 23.639
2 17 8 92.0 23.412 35.150 23.393 23.935
2 17 7 103.0 23.008 35.189 22.987 24.082
2 17 6 112.9 22.160 35.272 22.137 24.387
2 17 5 128.8 21.636 35.308 21.611 24.562
2 17 4 139.9 21.335 35.294 21.308 24.635
2 17 3 154.7 20.736 35.243 20.707 24.760
2 17 2 181.6 18.961 35.035 18.928 25.068
2 17 1 208.6 17.488 34.894 17.453 25.326
2 18 0 0.0 34.681
2 18 12 6.1 26.153 34.665 26.152 22.735 34.660
2 18 11 26.3 26.135 34.664 26.129 22.742 34.661
2 18 10 46.9 26.044 34.672 26.033 22.778 34.691
2 18 9 77.2 23.855 34.995 23.839 23.687 35.026
2 18 8 103.2 23.070 35.203 23.049 24.075 35.211
2 18 7 130.1 22.112 35.282 22.086 24.409 35.281
2 18 6 156.9 21.358 35.295 21.327 24.630 35.285
2 18 5 183.6 19.741 35.112 19.707 24.925 35.112
2 18 4 259.9 14.093 34.418 14.056 25.726 34.404
2 18 3 510.9 6.678 34.064 6.631 26.731 34.069
2 18 2 762.0 4.715 34.323 4.654 27.178 34.323
2 18 1 1021.5 3.940 34.498 3.863 27.401
2 19 0 0.0 34.774
2 19 4 29.9 26.152 34.660 26.145 22.733
2 19 3 153.8 20.731 35.225 20.702 24.748 35.227
2 19 2 459.3 7.641 34.085 7.596 26.615 34.087
2 19 1 1020.5 3.907 34.498 3.830 27.404 34.498
2 20 0 0.0 34.705
2 20 8 28.4 26.186 34.667 26.180 22.728 34.668
2 20 7 149.6 20.972 35.249 20.944 24.700 35.247
2 20 6 258.1 15.573 34.606 15.533 25.551
2 20 5 258.0 15.557 34.604 15.517 25.553
2 20 4 258.0 15.507 34.595 15.467 25.557
2 20 3 478.2 7.199 34.068 7.154 26.664 34.071
2 20 2 507.1 6.486 34.045 6.440 26.742 34.047
2 20 1 1021.5 3.965 34.487 3.887 27.389 34.486
2 21 0 0.0 34.698
2 21 5 31.5 26.154 34.665 26.147 22.737 34.662
Table VI.B.9 HOT-9
- 89 -

Sta
tio
n
Cas
t
Bo
ttle
CTD Bottle
Pressure Temperature Salinity Oxygen Pot. Temp. Pot. Density Salinity Oxygen
dbar °C psu µmol kg-1 °C kg m-3 psu µmol kg-1
2 21 4 104.3 22.732 35.254 22.711 24.211
2 21 3 131.3 21.675 35.305 21.650 24.549 35.304
2 21 2 438.4 7.822 34.052 7.778 26.562 34.052
2 21 1 1023.7 3.981 34.487 3.904 27.388 34.487
2 22 0 0.0 34.691
2 22 6 7.4 26.285 34.681 26.284 22.706
2 22 5 49.2 26.042 34.678 26.031 22.783
2 22 4 106.8 22.326 35.274 22.304 24.342
2 22 3 258.6 13.437 34.356 13.400 25.814
2 22 2 512.0 6.569 34.041 6.522 26.728
2 22 1 1010.6 4.004 34.489 3.927 27.387
2 23 0 0.0 34.687
2 23 3 36.9 26.121 34.657 26.112 22.742 34.657
2 23 2 469.3 7.469 34.046 7.423 26.609 34.051
2 23 1 1029.1 3.909 34.491 3.832 27.398 34.491
2 24 0 0.0 34.695
2 24 12 6.6 26.201 34.687 26.199 22.737
2 24 11 26.6 26.191 34.677 26.185 22.734
2 24 10 47.6 25.806 34.772 25.795 22.926
2 24 9 78.0 24.310 34.918 24.294 23.494
2 24 8 102.9 23.051 35.077 23.030 23.985
2 24 7 125.9 22.267 35.269 22.242 24.355
2 24 6 157.0 21.440 35.296 21.410 24.608 35.290
2 24 5 183.1 20.167 35.169 20.133 24.857
2 24 4 258.9 14.211 34.448 14.173 25.725
2 24 3 508.5 7.060 34.132 7.012 26.733 34.130
2 24 2 760.6 4.691 34.331 4.631 27.187
2 24 1 1021.2 3.977 34.495 3.899 27.395 34.495
HOT-9 Table VI.B.9
- 90 -
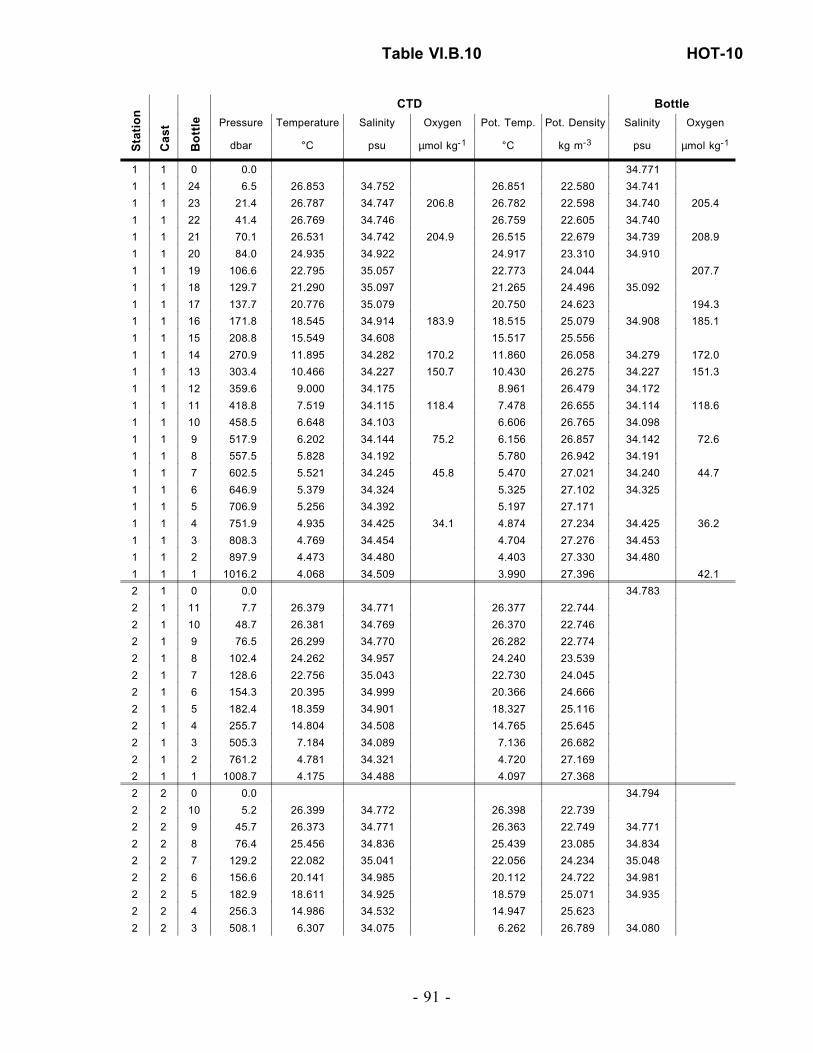
Sta
tio
n
Cas
t
Bo
ttle
CTD Bottle
Pressure Temperature Salinity Oxygen Pot. Temp. Pot. Density Salinity Oxygen
dbar °C psu µmol kg-1 °C kg m-3 psu µmol kg-1
1 1 0 0.0 34.771
1 1 24 6.5 26.853 34.752 26.851 22.580 34.741
1 1 23 21.4 26.787 34.747 206.8 26.782 22.598 34.740 205.4
1 1 22 41.4 26.769 34.746 26.759 22.605 34.740
1 1 21 70.1 26.531 34.742 204.9 26.515 22.679 34.739 208.9
1 1 20 84.0 24.935 34.922 24.917 23.310 34.910
1 1 19 106.6 22.795 35.057 22.773 24.044 207.7
1 1 18 129.7 21.290 35.097 21.265 24.496 35.092
1 1 17 137.7 20.776 35.079 20.750 24.623 194.3
1 1 16 171.8 18.545 34.914 183.9 18.515 25.079 34.908 185.1
1 1 15 208.8 15.549 34.608 15.517 25.556
1 1 14 270.9 11.895 34.282 170.2 11.860 26.058 34.279 172.0
1 1 13 303.4 10.466 34.227 150.7 10.430 26.275 34.227 151.3
1 1 12 359.6 9.000 34.175 8.961 26.479 34.172
1 1 11 418.8 7.519 34.115 118.4 7.478 26.655 34.114 118.6
1 1 10 458.5 6.648 34.103 6.606 26.765 34.098
1 1 9 517.9 6.202 34.144 75.2 6.156 26.857 34.142 72.6
1 1 8 557.5 5.828 34.192 5.780 26.942 34.191
1 1 7 602.5 5.521 34.245 45.8 5.470 27.021 34.240 44.7
1 1 6 646.9 5.379 34.324 5.325 27.102 34.325
1 1 5 706.9 5.256 34.392 5.197 27.171
1 1 4 751.9 4.935 34.425 34.1 4.874 27.234 34.425 36.2
1 1 3 808.3 4.769 34.454 4.704 27.276 34.453
1 1 2 897.9 4.473 34.480 4.403 27.330 34.480
1 1 1 1016.2 4.068 34.509 3.990 27.396 42.1
2 1 0 0.0 34.783
2 1 11 7.7 26.379 34.771 26.377 22.744
2 1 10 48.7 26.381 34.769 26.370 22.746
2 1 9 76.5 26.299 34.770 26.282 22.774
2 1 8 102.4 24.262 34.957 24.240 23.539
2 1 7 128.6 22.756 35.043 22.730 24.045
2 1 6 154.3 20.395 34.999 20.366 24.666
2 1 5 182.4 18.359 34.901 18.327 25.116
2 1 4 255.7 14.804 34.508 14.765 25.645
2 1 3 505.3 7.184 34.089 7.136 26.682
2 1 2 761.2 4.781 34.321 4.720 27.169
2 1 1 1008.7 4.175 34.488 4.097 27.368
2 2 0 0.0 34.794
2 2 10 5.2 26.399 34.772 26.398 22.739
2 2 9 45.7 26.373 34.771 26.363 22.749 34.771
2 2 8 76.4 25.456 34.836 25.439 23.085 34.834
2 2 7 129.2 22.082 35.041 22.056 24.234 35.048
2 2 6 156.6 20.141 34.985 20.112 24.722 34.981
2 2 5 182.9 18.611 34.925 18.579 25.071 34.935
2 2 4 256.3 14.986 34.532 14.947 25.623
2 2 3 508.1 6.307 34.075 6.262 26.789 34.080
Table VI.B.10 HOT-10
- 91 -

Sta
tio
n
Cas
t
Bo
ttle
CTD Bottle
Pressure Temperature Salinity Oxygen Pot. Temp. Pot. Density Salinity Oxygen
dbar °C psu µmol kg-1 °C kg m-3 psu µmol kg-1
2 2 2 759.9 4.791 34.339 4.731 27.182 34.338
2 2 1 1019.1 4.083 34.491 4.005 27.381 34.495
2 3 24 704.6 4.973 34.275 4.916 27.110
2 3 23 803.6 4.700 34.409 29.7 4.636 27.248 34.409 31.6
2 3 22 903.7 4.406 34.466 37.7 4.336 27.326 34.466 37.5
2 3 21 1004.2 4.056 34.491 3.979 27.384
2 3 20 1103.9 3.787 34.514 49.2 3.704 27.430 34.515 48.0
2 3 19 1252.4 3.411 34.536 3.319 27.485
2 3 18 1404.6 3.104 34.559 61.6 3.003 27.533 34.559 61.6
2 3 17 1552.7 2.819 34.575 68.1 2.709 27.572 34.575 67.1
2 3 16 1699.4 2.543 34.589 72.9 2.424 27.608 34.589 72.9
2 3 15 1851.8 2.314 34.608 80.4 2.185 27.643 34.609 83.3
2 3 14 2002.5 2.124 34.620 88.7 1.985 27.669 34.622 89.8
2 3 13 2199.8 1.935 34.635 97.1 1.782 27.696 34.633 98.8
2 3 12 2396.9 1.794 34.646 1.626 27.717
2 3 11 2600.0 1.678 34.656 1.495 27.734
2 3 10 2801.3 1.585 34.665 1.385 27.750
2 3 9 2996.1 1.542 34.671 1.324 27.759
2 3 8 3189.4 1.505 34.675 130.8 1.270 27.766 34.675 134.6
2 3 7 3392.2 1.480 34.680 136.3 1.225 27.773 34.681 134.6
2 3 6 3597.7 1.465 34.683 1.189 27.777
2 3 5 3801.6 1.457 34.685 1.161 27.781
2 3 4 4003.1 1.456 34.687 1.138 27.785
2 3 3 4197.5 1.465 34.688 1.125 27.787
2 3 2 4397.2 1.476 34.689 150.0 1.114 27.788 34.689 152.4
2 3 1 4525.9 1.485 34.690 1.108 27.789 34.689
2 4 0 0.0 34.783
2 4 24 7.2 26.373 34.779 208.8 26.372 22.752 34.775 205.5
2 4 23 86.7 25.317 34.845 213.3 25.298 23.135 34.850 213.8
2 4 22 96.6 24.290 34.934 218.3 24.270 23.513 34.929 215.4
2 4 21 108.3 23.759 34.987 213.2 23.736 23.711 34.988 213.8
2 4 20 123.4 22.673 35.011 205.8 22.648 24.045 35.014 206.2
2 4 19 132.9 22.195 35.048 194.6 22.169 24.209 35.047 201.3
2 4 18 143.8 20.215 34.976 188.4 20.188 24.695 34.982 182.3
2 4 17 182.8 18.597 34.912 170.1 18.565 25.065 34.908 178.1
2 4 16 217.7 16.290 34.677 187.7 16.255 25.441 34.679 182.2
2 4 15 274.2 12.894 34.309 179.0 12.857 25.887 34.309 176.5
2 4 14 285.2 12.614 34.282 170.0 12.576 25.921 34.283 180.0
2 4 13 303.2 11.465 34.188 203.4 11.427 26.066 34.195 203.3
2 4 12 345.0 9.980 34.112 195.0 9.940 26.269 34.113 194.3
2 4 11 404.4 8.894 34.122 149.9 8.851 26.454 34.125 152.0
2 4 10 465.2 7.401 34.103 114.4 7.356 26.663 34.104 107.6
2 4 9 489.7 6.709 34.079 90.6 6.664 26.739 34.081 92.6
2 4 8 509.3 6.339 34.070 88.1 6.294 26.781 34.073 82.8
2 4 7 538.1 5.883 34.105 63.3 5.837 26.866 34.107 60.8
2 4 6 601.6 5.427 34.173 40.8 5.377 26.976 34.176 40.5
HOT-10 Table VI.B.10
- 92 -
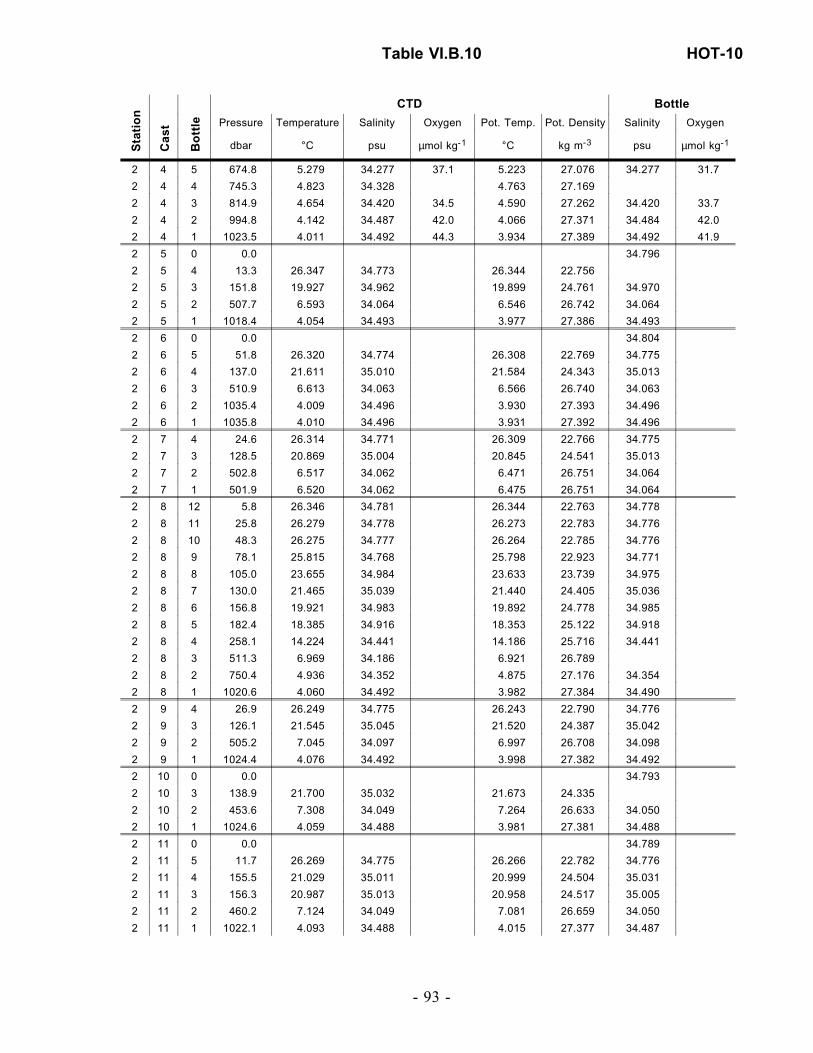
Sta
tio
n
Cas
t
Bo
ttle
CTD Bottle
Pressure Temperature Salinity Oxygen Pot. Temp. Pot. Density Salinity Oxygen
dbar °C psu µmol kg-1 °C kg m-3 psu µmol kg-1
2 4 5 674.8 5.279 34.277 37.1 5.223 27.076 34.277 31.7
2 4 4 745.3 4.823 34.328 4.763 27.169
2 4 3 814.9 4.654 34.420 34.5 4.590 27.262 34.420 33.7
2 4 2 994.8 4.142 34.487 42.0 4.066 27.371 34.484 42.0
2 4 1 1023.5 4.011 34.492 44.3 3.934 27.389 34.492 41.9
2 5 0 0.0 34.796
2 5 4 13.3 26.347 34.773 26.344 22.756
2 5 3 151.8 19.927 34.962 19.899 24.761 34.970
2 5 2 507.7 6.593 34.064 6.546 26.742 34.064
2 5 1 1018.4 4.054 34.493 3.977 27.386 34.493
2 6 0 0.0 34.804
2 6 5 51.8 26.320 34.774 26.308 22.769 34.775
2 6 4 137.0 21.611 35.010 21.584 24.343 35.013
2 6 3 510.9 6.613 34.063 6.566 26.740 34.063
2 6 2 1035.4 4.009 34.496 3.930 27.393 34.496
2 6 1 1035.8 4.010 34.496 3.931 27.392 34.496
2 7 4 24.6 26.314 34.771 26.309 22.766 34.775
2 7 3 128.5 20.869 35.004 20.845 24.541 35.013
2 7 2 502.8 6.517 34.062 6.471 26.751 34.064
2 7 1 501.9 6.520 34.062 6.475 26.751 34.064
2 8 12 5.8 26.346 34.781 26.344 22.763 34.778
2 8 11 25.8 26.279 34.778 26.273 22.783 34.776
2 8 10 48.3 26.275 34.777 26.264 22.785 34.776
2 8 9 78.1 25.815 34.768 25.798 22.923 34.771
2 8 8 105.0 23.655 34.984 23.633 23.739 34.975
2 8 7 130.0 21.465 35.039 21.440 24.405 35.036
2 8 6 156.8 19.921 34.983 19.892 24.778 34.985
2 8 5 182.4 18.385 34.916 18.353 25.122 34.918
2 8 4 258.1 14.224 34.441 14.186 25.716 34.441
2 8 3 511.3 6.969 34.186 6.921 26.789
2 8 2 750.4 4.936 34.352 4.875 27.176 34.354
2 8 1 1020.6 4.060 34.492 3.982 27.384 34.490
2 9 4 26.9 26.249 34.775 26.243 22.790 34.776
2 9 3 126.1 21.545 35.045 21.520 24.387 35.042
2 9 2 505.2 7.045 34.097 6.997 26.708 34.098
2 9 1 1024.4 4.076 34.492 3.998 27.382 34.492
2 10 0 0.0 34.793
2 10 3 138.9 21.700 35.032 21.673 24.335
2 10 2 453.6 7.308 34.049 7.264 26.633 34.050
2 10 1 1024.6 4.059 34.488 3.981 27.381 34.488
2 11 0 0.0 34.789
2 11 5 11.7 26.269 34.775 26.266 22.782 34.776
2 11 4 155.5 21.029 35.011 20.999 24.504 35.031
2 11 3 156.3 20.987 35.013 20.958 24.517 35.005
2 11 2 460.2 7.124 34.049 7.081 26.659 34.050
2 11 1 1022.1 4.093 34.488 4.015 27.377 34.487
Table VI.B.10 HOT-10
- 93 -
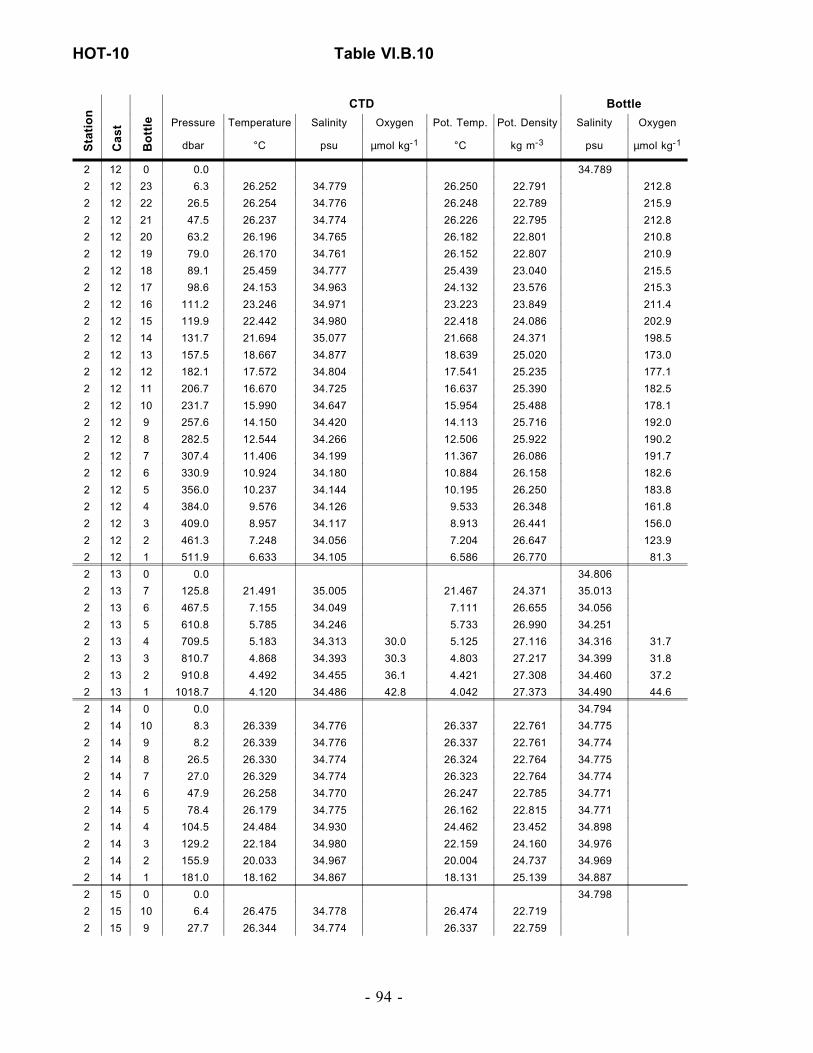
Sta
tio
n
Cas
t
Bo
ttle
CTD Bottle
Pressure Temperature Salinity Oxygen Pot. Temp. Pot. Density Salinity Oxygen
dbar °C psu µmol kg-1 °C kg m-3 psu µmol kg-1
2 12 0 0.0 34.789
2 12 23 6.3 26.252 34.779 26.250 22.791 212.8
2 12 22 26.5 26.254 34.776 26.248 22.789 215.9
2 12 21 47.5 26.237 34.774 26.226 22.795 212.8
2 12 20 63.2 26.196 34.765 26.182 22.801 210.8
2 12 19 79.0 26.170 34.761 26.152 22.807 210.9
2 12 18 89.1 25.459 34.777 25.439 23.040 215.5
2 12 17 98.6 24.153 34.963 24.132 23.576 215.3
2 12 16 111.2 23.246 34.971 23.223 23.849 211.4
2 12 15 119.9 22.442 34.980 22.418 24.086 202.9
2 12 14 131.7 21.694 35.077 21.668 24.371 198.5
2 12 13 157.5 18.667 34.877 18.639 25.020 173.0
2 12 12 182.1 17.572 34.804 17.541 25.235 177.1
2 12 11 206.7 16.670 34.725 16.637 25.390 182.5
2 12 10 231.7 15.990 34.647 15.954 25.488 178.1
2 12 9 257.6 14.150 34.420 14.113 25.716 192.0
2 12 8 282.5 12.544 34.266 12.506 25.922 190.2
2 12 7 307.4 11.406 34.199 11.367 26.086 191.7
2 12 6 330.9 10.924 34.180 10.884 26.158 182.6
2 12 5 356.0 10.237 34.144 10.195 26.250 183.8
2 12 4 384.0 9.576 34.126 9.533 26.348 161.8
2 12 3 409.0 8.957 34.117 8.913 26.441 156.0
2 12 2 461.3 7.248 34.056 7.204 26.647 123.9
2 12 1 511.9 6.633 34.105 6.586 26.770 81.3
2 13 0 0.0 34.806
2 13 7 125.8 21.491 35.005 21.467 24.371 35.013
2 13 6 467.5 7.155 34.049 7.111 26.655 34.056
2 13 5 610.8 5.785 34.246 5.733 26.990 34.251
2 13 4 709.5 5.183 34.313 30.0 5.125 27.116 34.316 31.7
2 13 3 810.7 4.868 34.393 30.3 4.803 27.217 34.399 31.8
2 13 2 910.8 4.492 34.455 36.1 4.421 27.308 34.460 37.2
2 13 1 1018.7 4.120 34.486 42.8 4.042 27.373 34.490 44.6
2 14 0 0.0 34.794
2 14 10 8.3 26.339 34.776 26.337 22.761 34.775
2 14 9 8.2 26.339 34.776 26.337 22.761 34.774
2 14 8 26.5 26.330 34.774 26.324 22.764 34.775
2 14 7 27.0 26.329 34.774 26.323 22.764 34.774
2 14 6 47.9 26.258 34.770 26.247 22.785 34.771
2 14 5 78.4 26.179 34.775 26.162 22.815 34.771
2 14 4 104.5 24.484 34.930 24.462 23.452 34.898
2 14 3 129.2 22.184 34.980 22.159 24.160 34.976
2 14 2 155.9 20.033 34.967 20.004 24.737 34.969
2 14 1 181.0 18.162 34.867 18.131 25.139 34.887
2 15 0 0.0 34.798
2 15 10 6.4 26.475 34.778 26.474 22.719
2 15 9 27.7 26.344 34.774 26.337 22.759
HOT-10 Table VI.B.10
- 94 -

Sta
tio
n
Cas
t
Bo
ttle
CTD Bottle
Pressure Temperature Salinity Oxygen Pot. Temp. Pot. Density Salinity Oxygen
dbar °C psu µmol kg-1 °C kg m-3 psu µmol kg-1
2 15 8 47.4 26.336 34.773 26.325 22.762
2 15 7 78.0 25.813 34.773 25.795 22.928
2 15 6 104.1 24.172 34.958 24.150 23.567
2 15 5 155.7 20.615 35.004 20.585 24.611
2 15 4 181.0 18.558 34.923 18.526 25.083
2 15 3 257.8 14.170 34.427 14.133 25.717
2 15 2 510.3 7.266 34.187 7.216 26.748
2 15 1 752.0 4.861 34.334 4.801 27.170
2 16 0 0.0 34.806
Table VI.B.10 HOT-10
- 95 -

Sta
tio
n
Cas
t
Bo
ttle
CTD Bottle
Pressure Temperature Salinity Oxygen Pot. Temp. Pot. Density Salinity Oxygen
dbar °C psu µmol kg-1 °C kg m-3 psu µmol kg-1
1 1 0 0.0 34.479
1 1 23 7.4 27.030 34.804 204.6 27.029 22.563 34.718 204.8
1 1 22 27.2 26.362 34.899 208.1 26.355 22.848 34.821 208.7
1 1 21 47.3 25.244 34.993 208.2 25.233 23.266 34.920 208.8
1 1 20 63.0 23.887 35.186 216.6 23.874 23.821 35.091 215.4
1 1 19 77.3 23.079 35.207 209.5 23.063 24.074 35.158 209.8
1 1 18 98.0 21.812 35.136 196.2 21.793 24.380 35.107 197.5
1 1 17 108.5 20.726 35.065 187.7 20.706 24.625 35.047 188.9
1 1 16 118.5 20.338 35.034 187.2 20.316 24.705 35.026 186.8
1 1 15 129.4 19.868 34.999 186.2 19.844 24.803 34.996 185.6
1 1 14 154.5 19.073 34.947 182.8 19.046 24.970 34.947 184.9
1 1 13 180.8 17.877 34.845 17.846 25.192
1 1 12 205.9 15.337 34.574 178.9 15.305 25.577 34.599 180.4
1 1 11 231.4 14.177 34.455 178.2 14.143 25.736 34.455 178.3
1 1 10 260.0 13.070 34.352 174.6 13.034 25.884 34.353 176.2
1 1 9 308.9 10.601 34.215 154.6 10.564 26.242 34.213 156.4
1 1 8 357.3 9.642 34.188 143.3 9.601 26.385 34.183 143.4
1 1 7 405.8 8.385 34.153 121.0 8.343 26.558 34.151 120.2
1 1 6 507.4 6.414 34.188 66.5 6.368 26.864 34.186 63.0
1 1 5 598.0 5.578 34.264 48.5 5.527 27.030 34.259 50.8
1 1 4 704.5 5.068 34.363 5.010 27.169 34.361
1 1 3 808.6 4.639 34.425 4.575 27.267
1 1 2 920.2 4.311 34.478 50.0 4.240 27.345 34.477 49.5
1 1 1 1011.9 3.979 34.504 56.9 3.903 27.402 34.505 58.1
2 1 0 0.0 34.790
2 1 13 0.3 26.187 34.822 26.187 22.843 34.776
2 1 12 25.2 26.168 34.835 26.162 22.860 34.791
2 1 11 45.1 26.020 35.062 26.010 23.079 35.018
2 1 10 74.2 23.241 35.245 23.226 24.056 35.244
2 1 9 102.4 22.115 35.312 22.095 24.430 35.313
2 1 8 129.2 21.674 35.338 21.648 24.575 35.340
2 1 7 155.4 21.312 35.328 21.282 24.668 35.331
2 1 6 179.6 20.306 35.191 20.272 24.837 35.235
2 1 5 252.8 15.719 34.670 15.680 25.567 34.673
2 1 4 504.6 7.715 34.056 7.665 26.582 34.048
2 1 3 531.2 7.108 34.067 7.057 26.676
2 1 2 760.8 4.816 34.333 4.755 27.175 34.341
2 1 1 1019.8 4.003 34.507 3.925 27.402 34.499
2 2 23 801.0 4.759 34.335 4.695 27.183 26.9
2 2 22 900.6 4.444 34.434 4.373 27.297 35.2
2 2 21 1000.7 4.148 34.485 4.071 27.369 34.5
2 2 20 1099.7 3.897 34.510 48.2 3.814 27.415 34.509 48.1
2 2 19 1249.7 3.539 34.536 3.447 27.473
2 2 18 1397.8 3.171 34.556 59.6 3.070 27.525 34.556 60.3
2 2 17 1548.1 2.902 34.571 65.0 2.791 27.562 34.571 65.0
2 2 16 1697.9 2.624 34.587 73.4 2.505 27.600 34.588 96.0
HOT-11 Table VI.B.11
- 96 -
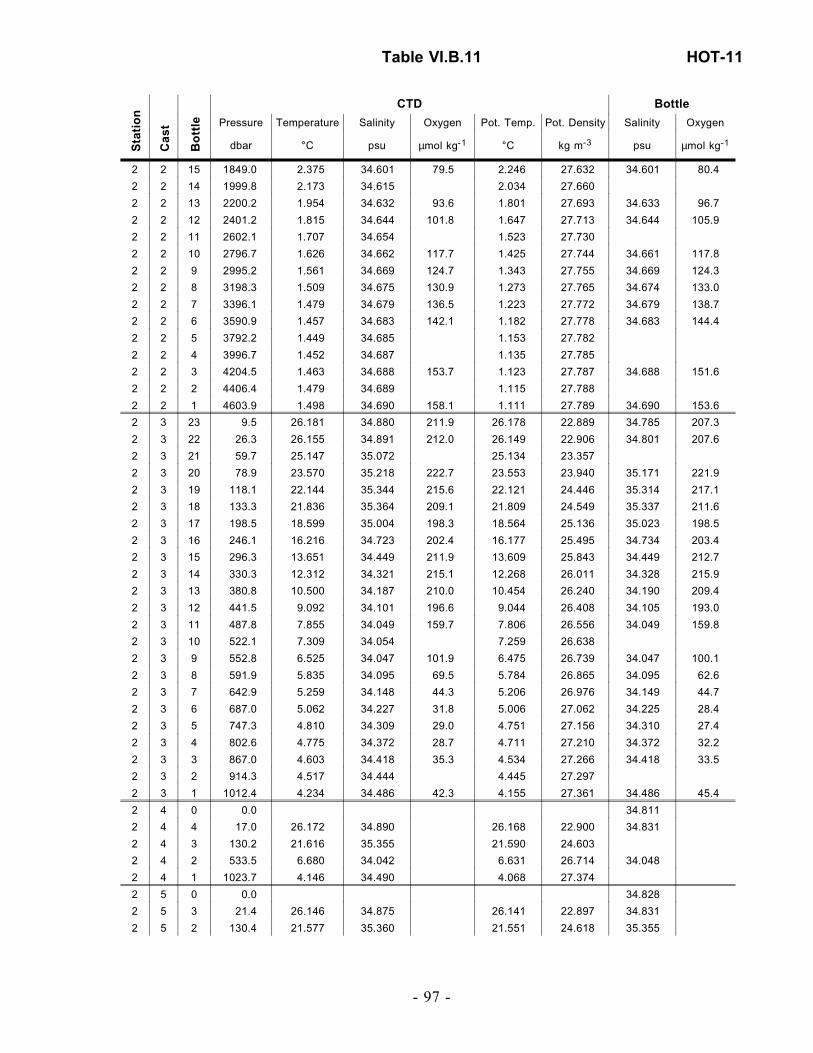
Sta
tio
n
Cas
t
Bo
ttle
CTD Bottle
Pressure Temperature Salinity Oxygen Pot. Temp. Pot. Density Salinity Oxygen
dbar °C psu µmol kg-1 °C kg m-3 psu µmol kg-1
2 2 15 1849.0 2.375 34.601 79.5 2.246 27.632 34.601 80.4
2 2 14 1999.8 2.173 34.615 2.034 27.660
2 2 13 2200.2 1.954 34.632 93.6 1.801 27.693 34.633 96.7
2 2 12 2401.2 1.815 34.644 101.8 1.647 27.713 34.644 105.9
2 2 11 2602.1 1.707 34.654 1.523 27.730
2 2 10 2796.7 1.626 34.662 117.7 1.425 27.744 34.661 117.8
2 2 9 2995.2 1.561 34.669 124.7 1.343 27.755 34.669 124.3
2 2 8 3198.3 1.509 34.675 130.9 1.273 27.765 34.674 133.0
2 2 7 3396.1 1.479 34.679 136.5 1.223 27.772 34.679 138.7
2 2 6 3590.9 1.457 34.683 142.1 1.182 27.778 34.683 144.4
2 2 5 3792.2 1.449 34.685 1.153 27.782
2 2 4 3996.7 1.452 34.687 1.135 27.785
2 2 3 4204.5 1.463 34.688 153.7 1.123 27.787 34.688 151.6
2 2 2 4406.4 1.479 34.689 1.115 27.788
2 2 1 4603.9 1.498 34.690 158.1 1.111 27.789 34.690 153.6
2 3 23 9.5 26.181 34.880 211.9 26.178 22.889 34.785 207.3
2 3 22 26.3 26.155 34.891 212.0 26.149 22.906 34.801 207.6
2 3 21 59.7 25.147 35.072 25.134 23.357
2 3 20 78.9 23.570 35.218 222.7 23.553 23.940 35.171 221.9
2 3 19 118.1 22.144 35.344 215.6 22.121 24.446 35.314 217.1
2 3 18 133.3 21.836 35.364 209.1 21.809 24.549 35.337 211.6
2 3 17 198.5 18.599 35.004 198.3 18.564 25.136 35.023 198.5
2 3 16 246.1 16.216 34.723 202.4 16.177 25.495 34.734 203.4
2 3 15 296.3 13.651 34.449 211.9 13.609 25.843 34.449 212.7
2 3 14 330.3 12.312 34.321 215.1 12.268 26.011 34.328 215.9
2 3 13 380.8 10.500 34.187 210.0 10.454 26.240 34.190 209.4
2 3 12 441.5 9.092 34.101 196.6 9.044 26.408 34.105 193.0
2 3 11 487.8 7.855 34.049 159.7 7.806 26.556 34.049 159.8
2 3 10 522.1 7.309 34.054 7.259 26.638
2 3 9 552.8 6.525 34.047 101.9 6.475 26.739 34.047 100.1
2 3 8 591.9 5.835 34.095 69.5 5.784 26.865 34.095 62.6
2 3 7 642.9 5.259 34.148 44.3 5.206 26.976 34.149 44.7
2 3 6 687.0 5.062 34.227 31.8 5.006 27.062 34.225 28.4
2 3 5 747.3 4.810 34.309 29.0 4.751 27.156 34.310 27.4
2 3 4 802.6 4.775 34.372 28.7 4.711 27.210 34.372 32.2
2 3 3 867.0 4.603 34.418 35.3 4.534 27.266 34.418 33.5
2 3 2 914.3 4.517 34.444 4.445 27.297
2 3 1 1012.4 4.234 34.486 42.3 4.155 27.361 34.486 45.4
2 4 0 0.0 34.811
2 4 4 17.0 26.172 34.890 26.168 22.900 34.831
2 4 3 130.2 21.616 35.355 21.590 24.603
2 4 2 533.5 6.680 34.042 6.631 26.714 34.048
2 4 1 1023.7 4.146 34.490 4.068 27.374
2 5 0 0.0 34.828
2 5 3 21.4 26.146 34.875 26.141 22.897 34.831
2 5 2 130.4 21.577 35.360 21.551 24.618 35.355
Table VI.B.11 HOT-11
- 97 -

Sta
tio
n
Cas
t
Bo
ttle
CTD Bottle
Pressure Temperature Salinity Oxygen Pot. Temp. Pot. Density Salinity Oxygen
dbar °C psu µmol kg-1 °C kg m-3 psu µmol kg-1
2 5 1 500.3 6.965 34.039 6.918 26.673 34.053
2 6 0 0.0 34.829
2 6 10 4.6 26.159 34.864 26.158 22.883 34.818
2 6 9 24.6 26.127 34.878 26.122 22.905 34.834
2 6 8 46.4 25.929 34.977 25.919 23.043 34.934
2 6 7 76.6 23.628 35.188 23.612 23.900 35.148
2 6 6 99.5 22.558 35.303 22.538 24.298 35.297
2 6 5 124.8 21.955 35.341 21.930 24.498
2 6 4 155.2 21.596 35.366 21.565 24.619 35.346
2 6 3 185.6 20.987 35.324 20.952 24.755 35.309
2 6 2 511.4 7.442 34.057 7.392 26.622 34.057
2 6 1 1023.5 4.104 34.499 4.026 27.385 34.498
2 7 0 0.0 34.820
2 7 4 9.3 26.143 34.853 26.141 22.881 34.811
2 7 3 151.2 21.626 35.361 21.597 24.606 35.343
2 7 2 510.6 7.637 34.046 7.587 26.585 34.046
2 7 1 1033.6 4.053 34.498 3.974 27.390 34.498
2 8 0 0.0 34.821
2 8 12 5.7 26.154 34.856 26.153 22.879
2 8 11 25.6 26.023 34.949 26.017 22.992 34.903
2 8 10 45.3 25.802 35.012 25.792 23.109 34.963
2 8 9 77.1 23.223 35.271 23.207 24.081 35.272
2 8 8 101.8 22.039 35.329 22.019 24.464 35.331
2 8 7 130.2 21.657 35.357 21.632 24.593 35.350
2 8 6 155.2 21.317 35.356 21.287 24.688 35.345
2 8 5 180.0 20.576 35.263 20.542 24.820 35.272
2 8 4 258.6 15.106 34.597 15.066 25.648 34.608
2 8 3 507.2 7.015 34.039 6.967 26.666 34.041
2 8 2 756.2 4.862 34.299 4.801 27.142 34.298
2 8 1 1027.6 4.104 34.493 4.025 27.380 34.494
2 9 0 0.0 34.824
2 9 4 5.8 26.259 34.863 26.257 22.852 34.819
2 9 3 134.9 21.571 35.362 21.545 24.621 35.354
2 9 2 503.9 7.602 34.052 7.552 26.595 34.050
2 9 1 1017.9 4.146 34.489 4.068 27.373 34.489
2 10 0 0.0 34.830
2 10 3 22.1 26.123 34.874 26.118 22.903 34.831
2 10 2 131.5 21.583 35.369 21.558 24.623 35.356
2 10 1 542.2 6.473 34.052 6.423 26.750 34.050
2 11 0 0.0 34.865
2 11 3 21.4 26.236 34.871 26.232 22.866 34.833
2 11 2 129.9 21.787 35.355 21.761 24.555 35.366
2 11 1 540.1 6.668 34.042 6.618 26.716 34.045
2 12 0 0.0 34.838
2 12 23 4.9 26.219 34.885 26.218 22.881 34.844
2 12 22 25.2 26.223 34.884 26.218 22.880 34.844
HOT-11 Table VI.B.11
- 98 -

Sta
tio
n
Cas
t
Bo
ttle
CTD Bottle
Pressure Temperature Salinity Oxygen Pot. Temp. Pot. Density Salinity Oxygen
dbar °C psu µmol kg-1 °C kg m-3 psu µmol kg-1
2 12 21 25.2 26.225 34.884 26.220 22.879
2 12 20 46.7 25.828 35.015 25.818 23.103
2 12 19 46.6 25.831 35.013 25.821 23.101 34.971
2 12 18 75.4 23.436 35.262 23.420 24.012
2 12 17 75.3 23.435 35.261 23.420 24.012 35.244
2 12 16 90.6 22.466 35.302 22.448 24.322 35.295
2 12 15 90.3 22.511 35.300 22.492 24.308
2 12 14 101.3 22.133 35.324 22.113 24.434
2 12 13 101.3 22.136 35.323 22.116 24.432 35.324
2 12 12 112.3 21.917 35.341 21.895 24.508 35.340
2 12 11 112.1 21.921 35.340 21.898 24.506 35.338
2 12 10 126.5 21.681 35.356 21.656 24.586 35.350
2 12 9 126.4 21.685 35.355 21.660 24.584 35.349
2 12 8 136.8 21.607 35.368 21.581 24.616 35.358
2 12 7 136.5 21.608 35.367 21.581 24.615 35.357
2 12 6 153.9 21.495 35.373 21.465 24.652 35.359
2 12 5 154.0 21.498 35.373 21.468 24.651 35.357
2 12 4 178.8 20.620 35.281 20.586 24.822 35.285
2 12 3 178.9 20.622 35.282 20.588 24.821 35.269
2 12 2 208.9 18.206 34.968 18.170 25.207 35.033
2 12 1 208.6 18.242 34.969 18.206 25.199 34.994
2 13 0 0.0 34.851
2 13 3 16.4 26.194 34.882 26.191 22.887 34.840
2 13 2 128.2 21.619 35.368 21.594 24.612 35.362
2 13 1 568.7 6.215 34.066 6.164 26.794 34.066
2 14 4 8.6 26.179 34.875 26.177 22.886 34.833
2 14 3 131.5 21.745 35.354 21.719 24.567
2 14 2 555.3 6.526 34.045 6.475 26.737 34.044
2 14 1 1024.5 4.082 34.493 4.004 27.383 34.493
2 15 0 0.0 34.883
2 15 10 5.4 26.102 34.911 26.101 22.937 34.864
2 15 9 20.3 26.107 34.910 26.102 22.936
2 15 8 45.3 26.088 34.933 26.077 22.961
2 15 7 80.1 23.752 35.173 23.736 23.852
2 15 6 103.4 22.538 35.307 22.517 24.307
2 15 5 123.4 21.916 35.340 21.892 24.508 35.324
2 15 4 164.8 21.394 35.361 21.362 24.671
2 15 3 182.6 20.855 35.305 20.820 24.776
2 15 2 556.4 6.397 34.077 6.346 26.779
2 15 1 1018.4 4.163 34.498 4.084 27.378 34.498
2 16 0 0.0 34.866
2 16 17 4.8 26.136 34.888 206.8 26.135 22.909 34.843 207.3
2 16 16 25.5 26.098 34.896 209.4 26.093 22.928 34.854 208.0
2 16 15 45.4 25.771 35.016 210.3 25.761 23.122 34.971 210.3
2 16 14 61.7 24.089 35.139 221.7 24.076 23.726 35.120 219.9
2 16 13 76.4 23.235 35.273 224.6 23.219 24.079 35.239 225.0
Table VI.B.11 HOT-11
- 99 -

Sta
tio
n
Cas
t
Bo
ttle
CTD Bottle
Pressure Temperature Salinity Oxygen Pot. Temp. Pot. Density Salinity Oxygen
dbar °C psu µmol kg-1 °C kg m-3 psu µmol kg-1
2 16 12 86.7 22.606 35.297 223.5 22.588 24.279 35.288 223.1
2 16 11 96.5 22.279 35.310 215.5 22.260 24.382 35.306 216.7
2 16 10 106.4 22.000 35.323 212.4 21.979 24.471 35.319 214.1
2 16 9 116.8 21.814 35.334 208.3 21.791 24.532 35.329 215.9
2 16 8 129.7 21.648 35.348 206.5 21.623 24.589 35.339 207.7
2 16 7 153.9 21.263 35.342 200.3 21.233 24.692 35.331 202.6
2 16 6 181.7 20.075 35.205 198.7 20.042 24.908 35.210 199.8
2 16 5 207.3 18.564 35.013 196.4 18.528 25.152 35.043 199.0
2 16 4 234.3 16.285 34.721 16.248 25.477 196.8
2 16 3 258.0 15.248 34.614 207.5 15.208 25.629 34.615 204.9
2 16 2 555.7 6.339 34.069 6.289 26.780 34.069
2 16 1 1021.1 4.134 34.491 4.055 27.376 34.491
2 17 0 0.0 34.843
2 17 17 6.8 26.177 34.885 26.175 22.894
2 17 16 28.8 26.001 34.950 25.995 22.999 34.908
2 17 15 28.7 25.996 34.953 25.990 23.003 34.915
2 17 14 28.8 25.983 34.962 25.977 23.014
2 17 13 279.2 13.344 34.413 13.305 25.877
2 17 12 301.2 13.005 34.379 216.6 12.963 25.920 34.378 213.5
2 17 11 330.9 12.348 34.324 217.3 12.304 26.006 34.322 215.2
2 17 10 358.2 11.726 34.274 217.6 11.680 26.086 34.275 222.0
2 17 9 383.2 10.895 34.225 215.7 10.848 26.200 34.227 213.1
2 17 8 412.9 9.948 34.162 209.7 9.900 26.315 34.165 206.5
2 17 7 460.2 8.329 34.068 161.7 8.281 26.500 34.066 164.2
2 17 6 508.3 7.349 34.040 139.1 7.300 26.621 34.039 140.8
2 17 5 612.1 5.845 34.130 56.5 5.792 26.891 34.129 55.1
2 17 4 705.8 5.334 34.299 33.6 5.275 27.088 34.297 38.0
2 17 3 814.0 4.873 34.394 33.3 4.807 27.217 34.394 30.7
2 17 2 903.6 4.603 34.439 38.2 4.531 27.283 34.440 35.7
2 17 1 1016.8 4.116 34.493 45.5 4.038 27.379 34.492 42.6
2 18 23 6.0 26.178 34.879 26.176 22.889
2 18 22 25.1 26.036 34.947 26.031 22.986 34.911
2 18 21 25.0 26.042 34.946 26.036 22.983
2 18 20 45.3 25.099 35.072 25.089 23.371 34.898
2 18 19 45.2 25.075 35.077 25.065 23.382
2 18 18 75.7 23.576 35.194 23.560 23.919
2 18 17 75.6 23.576 35.194 23.560 23.919
2 18 16 101.3 22.431 35.305 22.411 24.335 35.307
2 18 15 128.2 21.888 35.336 21.863 24.513 35.328
2 18 14 127.8 21.892 35.336 21.867 24.512
2 18 12 155.6 21.217 35.338 21.187 24.701 35.326
2 18 11 155.6 21.219 35.338 21.189 24.701
2 18 10 183.2 18.825 35.039 18.793 25.105 35.064
2 18 9 183.0 18.852 35.040 18.820 25.098
2 18 8 260.8 14.329 34.514 14.291 25.751
2 18 7 260.4 14.341 34.515 14.303 25.749
HOT-11 Table VI.B.11
- 100 -

Sta
tio
n
Cas
t
Bo
ttle
CTD Bottle
Pressure Temperature Salinity Oxygen Pot. Temp. Pot. Density Salinity Oxygen
dbar °C psu µmol kg-1 °C kg m-3 psu µmol kg-1
2 18 6 509.3 6.951 34.037 6.904 26.674
2 18 5 509.8 6.943 34.036 6.895 26.674
2 18 4 751.1 5.038 34.321 4.977 27.139 34.279
2 18 3 752.1 5.030 34.321 4.969 27.141
2 18 2 1011.8 4.225 34.482 4.147 27.359
2 18 1 1012.7 4.222 34.483 4.144 27.360 34.487
Table VI.B.11 HOT-11
- 101 -
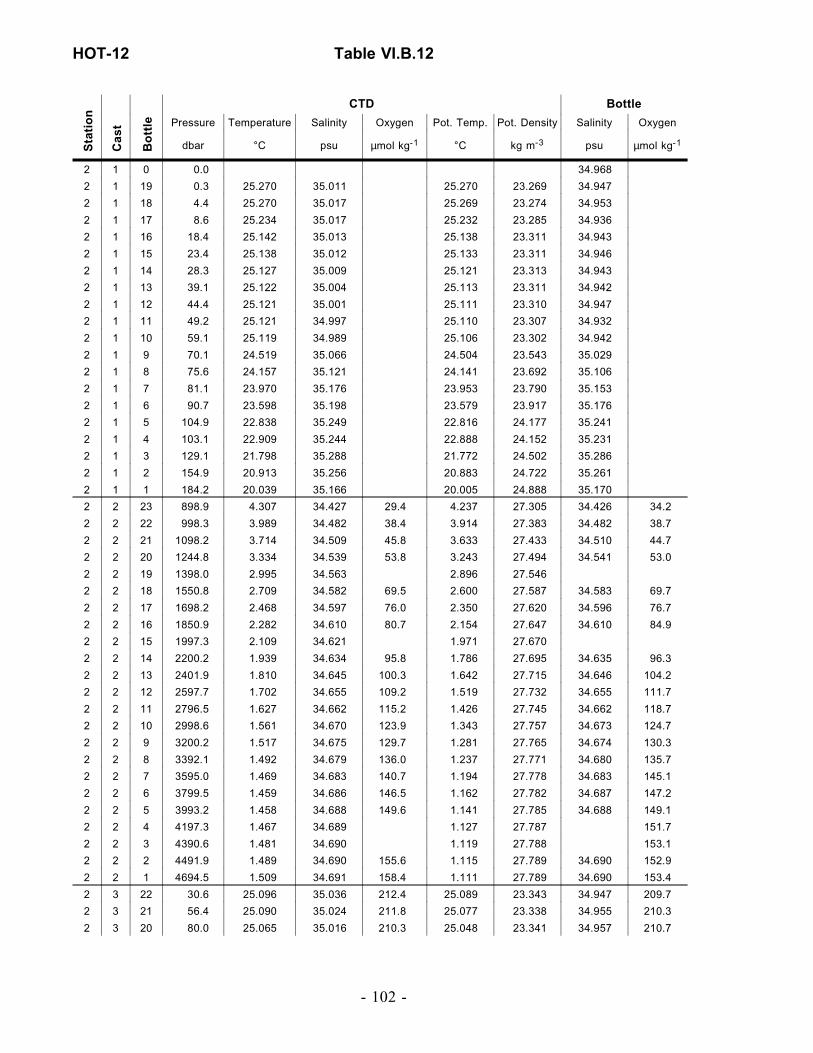
Sta
tio
n
Cas
t
Bo
ttle
CTD Bottle
Pressure Temperature Salinity Oxygen Pot. Temp. Pot. Density Salinity Oxygen
dbar °C psu µmol kg-1 °C kg m-3 psu µmol kg-1
2 1 0 0.0 34.968
2 1 19 0.3 25.270 35.011 25.270 23.269 34.947
2 1 18 4.4 25.270 35.017 25.269 23.274 34.953
2 1 17 8.6 25.234 35.017 25.232 23.285 34.936
2 1 16 18.4 25.142 35.013 25.138 23.311 34.943
2 1 15 23.4 25.138 35.012 25.133 23.311 34.946
2 1 14 28.3 25.127 35.009 25.121 23.313 34.943
2 1 13 39.1 25.122 35.004 25.113 23.311 34.942
2 1 12 44.4 25.121 35.001 25.111 23.310 34.947
2 1 11 49.2 25.121 34.997 25.110 23.307 34.932
2 1 10 59.1 25.119 34.989 25.106 23.302 34.942
2 1 9 70.1 24.519 35.066 24.504 23.543 35.029
2 1 8 75.6 24.157 35.121 24.141 23.692 35.106
2 1 7 81.1 23.970 35.176 23.953 23.790 35.153
2 1 6 90.7 23.598 35.198 23.579 23.917 35.176
2 1 5 104.9 22.838 35.249 22.816 24.177 35.241
2 1 4 103.1 22.909 35.244 22.888 24.152 35.231
2 1 3 129.1 21.798 35.288 21.772 24.502 35.286
2 1 2 154.9 20.913 35.256 20.883 24.722 35.261
2 1 1 184.2 20.039 35.166 20.005 24.888 35.170
2 2 23 898.9 4.307 34.427 29.4 4.237 27.305 34.426 34.2
2 2 22 998.3 3.989 34.482 38.4 3.914 27.383 34.482 38.7
2 2 21 1098.2 3.714 34.509 45.8 3.633 27.433 34.510 44.7
2 2 20 1244.8 3.334 34.539 53.8 3.243 27.494 34.541 53.0
2 2 19 1398.0 2.995 34.563 2.896 27.546
2 2 18 1550.8 2.709 34.582 69.5 2.600 27.587 34.583 69.7
2 2 17 1698.2 2.468 34.597 76.0 2.350 27.620 34.596 76.7
2 2 16 1850.9 2.282 34.610 80.7 2.154 27.647 34.610 84.9
2 2 15 1997.3 2.109 34.621 1.971 27.670
2 2 14 2200.2 1.939 34.634 95.8 1.786 27.695 34.635 96.3
2 2 13 2401.9 1.810 34.645 100.3 1.642 27.715 34.646 104.2
2 2 12 2597.7 1.702 34.655 109.2 1.519 27.732 34.655 111.7
2 2 11 2796.5 1.627 34.662 115.2 1.426 27.745 34.662 118.7
2 2 10 2998.6 1.561 34.670 123.9 1.343 27.757 34.673 124.7
2 2 9 3200.2 1.517 34.675 129.7 1.281 27.765 34.674 130.3
2 2 8 3392.1 1.492 34.679 136.0 1.237 27.771 34.680 135.7
2 2 7 3595.0 1.469 34.683 140.7 1.194 27.778 34.683 145.1
2 2 6 3799.5 1.459 34.686 146.5 1.162 27.782 34.687 147.2
2 2 5 3993.2 1.458 34.688 149.6 1.141 27.785 34.688 149.1
2 2 4 4197.3 1.467 34.689 1.127 27.787 151.7
2 2 3 4390.6 1.481 34.690 1.119 27.788 153.1
2 2 2 4491.9 1.489 34.690 155.6 1.115 27.789 34.690 152.9
2 2 1 4694.5 1.509 34.691 158.4 1.111 27.789 34.690 153.4
2 3 22 30.6 25.096 35.036 212.4 25.089 23.343 34.947 209.7
2 3 21 56.4 25.090 35.024 211.8 25.077 23.338 34.955 210.3
2 3 20 80.0 25.065 35.016 210.3 25.048 23.341 34.957 210.7
HOT-12 Table VI.B.12
- 102 -

Sta
tio
n
Cas
t
Bo
ttle
CTD Bottle
Pressure Temperature Salinity Oxygen Pot. Temp. Pot. Density Salinity Oxygen
dbar °C psu µmol kg-1 °C kg m-3 psu µmol kg-1
2 3 19 99.3 23.269 35.108 214.0 23.248 23.946 35.078 210.3
2 3 18 121.6 22.019 35.261 204.8 21.995 24.419 35.247 207.7
2 3 17 147.2 20.587 35.191 194.8 20.559 24.760 35.201 205.5
2 3 16 166.3 19.388 35.064 19.358 24.979
2 3 15 226.9 16.073 34.689 200.1 16.037 25.501 34.696 204.2
2 3 14 299.8 11.769 34.217 200.3 11.731 26.032 34.217 202.0
2 3 13 342.7 10.207 34.130 196.8 10.167 26.245 34.133 196.6
2 3 12 407.0 8.591 34.064 170.5 8.548 26.456 34.067 169.7
2 3 11 437.0 8.287 34.062 162.3 8.242 26.501 34.072 157.0
2 3 10 467.1 7.522 34.042 141.7 7.476 26.598 34.045 145.3
2 3 9 505.2 6.812 34.043 117.7 6.765 26.697 34.047 112.3
2 3 8 569.9 5.832 34.108 57.9 5.783 26.875 34.109 59.6
2 3 7 598.9 5.569 34.129 54.7 5.518 26.924 34.126 47.7
2 3 6 621.4 5.427 34.151 44.3 5.376 26.958 34.148 41.4
2 3 5 689.9 5.082 34.242 30.0 5.026 27.072 34.243 28.7
2 3 4 763.1 4.684 34.327 25.1 4.623 27.185 34.327 23.1
2 3 3 825.6 4.462 34.387 27.5 4.398 27.257 34.387 27.5
2 3 2 905.9 4.228 34.440 32.5 4.159 27.324 34.440 32.3
2 3 1 1023.0 3.901 34.490 40.9 3.825 27.399 34.492 42.5
2 4 0 0.0 34.973
2 4 13 80.1 25.060 35.016 25.042 23.342 34.950
2 4 12 101.3 23.487 35.087 23.466 23.866 35.040
2 4 11 122.5 22.749 35.186 22.724 24.156 35.150
2 4 10 142.4 21.535 35.251 21.507 24.548 35.232
2 4 9 163.1 20.566 35.201 20.536 24.774
2 4 8 184.5 19.012 35.041 18.979 25.059 35.040
2 4 7 205.6 18.181 34.943 18.146 25.193 34.935
2 4 6 256.4 15.606 34.647 15.566 25.575 34.636
2 4 5 308.5 12.960 34.343 12.918 25.901 34.334
2 4 4 358.0 10.775 34.164 10.732 26.173 34.155
2 4 3 407.6 9.264 34.085 9.219 26.367 34.079
2 4 2 508.3 6.971 34.042 6.923 26.675 34.032
2 4 1 809.7 4.471 34.396 4.408 27.263 34.396
2 5 12 4.6 25.066 35.000 25.065 23.323
2 5 11 26.6 25.070 35.010 25.065 23.331
2 5 10 47.4 25.064 35.005 25.054 23.330 34.933
2 5 9 78.0 24.377 35.017 24.360 23.549
2 5 8 104.0 22.992 35.145 22.971 24.054 35.122
2 5 7 129.0 22.066 35.259 22.041 24.405
2 5 6 155.2 20.448 35.184 20.419 24.792
2 5 5 179.9 19.144 35.076 19.112 25.051 35.076
2 5 4 254.3 15.297 34.595 15.259 25.604 34.605
2 5 3 508.5 6.627 34.042 6.581 26.721 34.040
2 5 2 760.8 4.713 34.323 4.653 27.178 34.323
2 5 1 1012.1 3.990 34.482 3.914 27.383 34.482
2 6 13 5.8 25.073 35.019 25.072 23.336 210.9
Table VI.B.12 HOT-12
- 103 -

Sta
tio
n
Cas
t
Bo
ttle
CTD Bottle
Pressure Temperature Salinity Oxygen Pot. Temp. Pot. Density Salinity Oxygen
dbar °C psu µmol kg-1 °C kg m-3 psu µmol kg-1
2 6 12 25.3 25.071 35.020 213.4 25.066 23.338 34.935 210.7
2 6 11 45.6 25.072 35.019 212.2 25.062 23.339 34.936 211.9
2 6 10 61.6 25.059 35.017 209.6 25.046 23.342 34.936 209.7
2 6 9 76.5 24.905 35.024 24.889 23.395 210.3
2 6 8 86.6 23.689 35.089 213.4 23.671 23.808 35.010 212.6
2 6 7 96.3 23.150 35.165 212.5 23.130 24.022 35.107 210.0
2 6 6 106.7 22.819 35.205 22.797 24.149 209.2
2 6 5 119.6 22.043 35.272 207.4 22.019 24.421 35.233 204.0
2 6 4 130.6 21.628 35.275 201.8 21.602 24.539 35.233 201.2
2 6 3 155.4 20.340 35.203 192.0 20.311 24.835 35.172 201.2
2 6 2 181.5 18.876 35.048 194.3 18.844 25.099 35.018 194.5
2 6 1 201.3 17.886 34.912 194.3 17.851 25.242 34.912 195.4
2 7 0 0.0 34.946
2 7 14 231.2 16.367 34.741 202.0 16.329 25.473 34.735 201.7
2 7 13 256.3 14.873 34.549 202.1 14.835 25.661 34.526 202.0
2 7 12 281.2 13.410 34.383 204.8 13.371 25.841 34.389 204.0
2 7 11 306.4 12.160 34.255 203.6 12.120 25.989 34.255 202.1
2 7 10 331.5 10.904 34.163 198.5 10.863 26.149 34.177 200.2
2 7 9 356.6 10.228 34.125 196.6 10.186 26.237 34.127 194.1
2 7 8 381.6 9.648 34.108 189.8 9.605 26.322 34.116 190.2
2 7 7 409.8 8.667 34.065 169.8 8.624 26.445 34.067 171.0
2 7 6 509.4 6.700 34.035 122.4 6.653 26.705 34.036 115.0
2 7 5 610.8 5.512 34.143 46.8 5.460 26.942 34.143 47.3
2 7 4 709.0 4.883 34.287 26.4 4.827 27.130 34.287 26.4
2 7 3 812.1 4.522 34.376 25.5 4.459 27.242 34.379 24.2
2 7 2 911.6 4.207 34.446 35.0 4.138 27.331 34.445 32.7
2 7 1 1019.4 3.940 34.488 41.8 3.864 27.393 34.488 40.2
2 8 0 0.0 34.950
2 8 11 11.2 25.102 35.011 25.099 23.322
2 8 10 112.5 22.288 35.242 22.266 24.328 35.196
2 8 9 134.7 21.287 35.264 21.261 24.625 35.230
2 8 8 154.5 20.465 35.217 20.436 24.813 35.193
2 8 7 164.5 20.241 35.200 20.210 24.860 35.174
2 8 6 177.3 19.842 35.161 19.809 24.936 35.136
2 8 5 196.8 19.386 35.119 19.351 25.023 35.099
2 8 4 507.9 6.674 34.036 6.627 26.710 34.038
2 8 3 610.4 5.516 34.141 5.465 26.940 34.140
2 8 2 710.5 4.892 34.286 4.836 27.128 34.285
2 8 1 810.4 4.555 34.370 4.491 27.233 34.286
HOT-12 Table VI.B.12
- 104 -

2 3 12 4.7 0.09 0.02 0.91
2 3 11 39.4 0.08 0.04 1.11
2 3 10 99.4 0.14 0.21 1.50
2 3 9 150.3 0.27 2.07 2.10
2 3 8 191.8 0.31 2.26 2.89
2 3 7 217.0 0.39 3.79 3.49
2 3 6 279.9 0.67 8.01 7.66
2 3 5 340.6 1.07 13.95 16.19
2 3 4 399.0 1.55 20.73 28.41
2 3 3 475.9 2.05 26.87 43.20
2 3 2 677.8 2.97 40.18 92.63
2 4 12 542.6 2.40 32.42 60.67
2 4 11 998.9 0.01 1.33 24.33
2 4 3 2094.0 0.01 1.66 22.66
2 5 10 2880.0 37.05 161.06
2 5 9 3067.6 0.03 1.86 22.47
2 5 4 4087.4 0.03 2.51 22.37
2 5 1 4705.8 0.00 2.42 25.11
2 7 5 10.7 0.07 0.00 0.52 0.20 5.01 41.99 0.24 0.31
2 7 4 25.5 0.08 0.04 0.71 0.13 0.08
2 7 3 42.9 0.09 0.02 0.31 0.19 0.05
2 7 2 68.3 0.08 0.00 0.91 0.29 0.30
2 7 1 114.4 0.16 0.40 1.70 0.32 0.04
2 10 10 4.1 3.66
2 10 9 19.8 3.55
2 10 8 38.8 4.65
2 10 7 68.6 2.85
2 10 6 117.6 1.25
2 10 5 304.9 0.82
2 10 4 506.1 0.50
- 105 -
Tab
le VI.B
.13 H
OT-1
ST
AT
ION
CA
ST
BO
TT
LE
Pressure DIC PO4NO2
+ NO3SiO4 DOP DON DOC PC PN PP Chl. a Phaeo. Bacteria ATP
dbar µmol kg-1 µmol kg-1 µmol kg-1 µmol kg-1 µmol kg-1 µmol kg-1 µmol kg-1 µmol kg-1 µmol kg-1 nmol kg-1 mg m-3 mg m-3 105 ml-1 mg m-3

2 10 3 753.3 0.23
2 10 2 1011.7 0.19
2 11 11 16.6 0.08 0.02 0.71 0.20 5.53 40.03
2 11 10 36.5 0.09 0.00 0.71 0.19 5.44 39.15
2 11 9 56.4 0.07 0.02 0.71 0.20 5.83 38.66
2 11 8 77.8 0.08 0.00 1.11 0.18 5.85 34.56
2 11 7 97.8 0.09 0.00 1.70 0.17 5.23 35.73
2 11 6 117.3 0.14 0.36 1.50 0.14 4.61 32.12
2 11 5 137.8 0.22 1.30 2.10
2 11 4 157.7 0.29 2.37 2.50
2 11 3 181.8 0.34 3.07 3.10
2 11 2 204.2 0.42 4.21 4.08 0.10 3.80 27.83
2 11 1 228.8 0.47 4.92 5.08
2 12 9 303.8 0.86 10.89 11.24
2 12 8 354.5 1.16 15.32 17.98
2 12 7 405.3 1.54 20.90 28.70
2 12 6 505.4 2.38 32.55 59.87 0.04 2.10 26.87
2 12 5 602.9 2.82 38.40 80.70
2 12 4 705.7 3.05 41.23 96.37 0.03 1.70 26.67
2 12 3 805.2 3.08 41.17 103.51
2 12 2 906.4 3.07 41.49 109.06 0.03 2.32 23.64
2 13 10 7.7 25.24
2 13 9 24.4 24.54
2 13 8 44.2 26.73
2 13 7 69.4 32.47
2 13 4 310.8 2.65
2 13 3 508.6 2.65
2 13 2 755.8 0.95
2 13 1 1007.2 0.64
2 14 7 117.3 15.97
- 106 -
HO
T-1Tab
le VI.B
.13
ST
AT
ION
CA
ST
BO
TT
LE
Pressure DIC PO4NO2
+ NO3SiO4 DOP DON DOC PC PN PP Chl. a Phaeo. Bacteria ATP
dbar µmol kg-1 µmol kg-1 µmol kg-1 µmol kg-1 µmol kg-1 µmol kg-1 µmol kg-1 µmol kg-1 µmol kg-1 nmol kg-1 mg m-3 mg m-3 105 ml-1 mg m-3

2 15 9 8.9 15.8
2 15 8 18.9 19.9
2 15 7 38.9 15.1
2 15 6 66.7 20.8
2 15 5 116.1 7.9
2 15 4 308.4 4.1
2 15 3 508.3 4.4
2 15 2 754.8 5.0
2 15 1 1008.5 5.0
- 107 -
Tab
le VI.B
.13 H
OT-1
ST
AT
ION
CA
ST
BO
TT
LE
Pressure DIC PO4NO2
+ NO3SiO4 DOP DON DOC PC PN PP Chl. a Phaeo. Bacteria ATP
dbar µmol kg-1 µmol kg-1 µmol kg-1 µmol kg-1 µmol kg-1 µmol kg-1 µmol kg-1 µmol kg-1 µmol kg-1 nmol kg-1 mg m-3 mg m-3 105 ml-1 mg m-3

1 1 11 15.3 0.08 0.07 1.03
1 1 10 35.2 0.09 0.07 1.03
1 1 9 56.0 0.09 0.07 1.03 0.17 5.16 38.28
1 1 8 77.8 0.09 0.02 1.22
1 1 7 97.4 0.12 0.05 1.03
1 1 6 149.3 0.31 2.55 2.79
1 1 5 205.0 0.64 7.55 6.72 0.08 4.74 31.18
1 1 4 254.7 0.86 10.31 9.86
1 1 3 504.4 2.54 33.66 60.29
1 1 2 754.2 3.03 40.54 87.85 0.06 2.87 23.61
1 1 1 1014.7 3.06 41.41 104.42
2 2 11 2603.2 2.71 38.67 161.29 0.09 2.47 17.11
2 2 10 2808.4 2.65 38.02 161.29
2 2 9 2990.6 2.64 37.58 158.65
2 2 8 3191.8 2.60 37.14 158.94 0.06 2.35 18.37
2 2 7 3390.4 2.57 36.71 156.39
2 2 6 3594.9 2.54 36.49 154.43 0.07 2.49 18.70
2 2 5 3797.6 2.53 36.16 153.44 0.08 2.68 21.18
2 2 4 3999.2 2.52 35.89 150.31
2 2 3 4200.3 2.53 35.83 149.53 0.04 2.40 16.85
2 2 2 4399.6 2.52 35.83 150.50
2 2 1 4505.0 2.52 35.72 148.54 0.06 2.30 18.32
2 3 11 695.3 2.97 39.89 85.41
2 3 10 755.2 3.05 41.08 93.64
2 3 9 839.6 3.06 41.52 102.46
2 3 8 990.0 3.06 41.51 110.30 0.05 2.50 22.33
2 3 7 1190.4 3.05 41.47 121.10 0.06 2.31 20.43
2 3 6 1391.9 3.01 41.07 132.86 0.04 1.59 22.41
2 3 5 1598.4 2.97 40.64 142.67 0.02 2.01 20.42
2 3 4 1807.8 2.91 40.09 149.54 0.04 2.33 19.45
- 108 -
HO
T-2 Tab
le VI.B
.14
ST
AT
ION
CA
ST
BO
TT
LE
Pressure DIC PO4NO2
+ NO3SiO4 DOP DON DOC PC PN PP Chl. a Phaeo. Bacteria ATP
dbar µmol kg-1 µmol kg-1 µmol kg-1 µmol kg-1 µmol kg-1 µmol kg-1 µmol kg-1 µmol kg-1 µmol kg-1 nmol kg-1 mg m-3 mg m-3 105 ml-1 mg m-3

2 3 3 1995.9 2.82 39.94 153.95
2 3 2 2207.1 2.78 39.44 158.35 0.08 2.86 17.05
2 3 1 2413.5 2.72 38.78 162.28
2 4 11 15.6 0.09 0.07 0.05 0.15 5.04 39.79
2 4 10 99.5 0.11 0.18 1.22
2 4 9 136.4 0.19 0.12 1.82
2 4 8 173.3 0.25 2.23 2.01
2 4 7 238.0 0.34 3.43 3.58
2 4 6 322.5 0.87 11.29 11.43
2 4 5 433.3 1.49 20.20 26.54
2 4 4 494.5 1.94 26.47 41.26
2 4 3 526.2 2.09 28.43 45.78
2 4 2 575.0 2.46 33.67 61.28
2 4 1 637.8 2.84 38.36 78.93
2 5 10 1.5 1938 0.09 0.05 1.03 0.18 5.01 43.65 0.20
2 5 9 21.2 1941 0.09 0.05 1.03 0.19 0.01
2 5 8 46.2 1935 0.08 0.07 0.05 0.18 0.01
2 5 7 71.1 1940 0.08 0.05 1.03 0.38 0.08
2 5 6 97.9 0.12 0.21 1.03 0.12 5.26 37.50 0.27 0.48
2 5 5 122.9 1986 0.18 0.72 2.01 0.17 0.15
2 5 4 148.6 2007 0.22 1.61 2.21 0.09 6.41 32.66 0.04 0.05
2 5 3 177.6 2014 0.23 2.03 2.40 0.03 0.04
2 7 11 0.9 1936 1.30 0.058
2 7 10 26.1 1938 1.13 0.083
2 7 9 46.2 0.019
2 7 8 71.9 2.06 0.071
2 7 7 97.8 3.26 0.027
2 7 6 122.6 3.06 0.018
2 7 5 150.6 1.27 0.040
2 7 4 173.6 0.011
- 109 -
Table V
I.B.14
HO
T-2
ST
AT
ION
CA
ST
BO
TT
LE
Pressure DIC PO4NO2
+ NO3SiO4 DOP DON DOC PC PN PP Chl. a Phaeo. Bacteria ATP
dbar µmol kg-1 µmol kg-1 µmol kg-1 µmol kg-1 µmol kg-1 µmol kg-1 µmol kg-1 µmol kg-1 µmol kg-1 nmol kg-1 mg m-3 mg m-3 105 ml-1 mg m-3

2 7 3 259.6 0.013
2 7 2 499.0 0.013
2 7 1 747.9 0.74 0.012
2 8 11 1.6 1941 0.09 0.05 1.42
2 8 10 16.2 0.08 0.05 1.42
2 8 9 37.8 0.09 0.07 1.42
2 8 8 57.9 0.08 0.07 1.22
2 8 7 79.2 0.11 0.07 1.42
2 8 6 98.9 0.15 0.55 1.56
2 8 5 119.7 0.16 0.76 2.01
2 8 4 139.8 0.22 1.59 2.99
2 8 3 161.5 0.22 1.77 2.21
2 8 2 181.1 0.23 2.05 2.01
2 8 1 258.5 2029 0.48 5.35 5.29
2 9 11 277.2 0.57 6.72 6.72 0.08 4.25 29.12
2 9 10 303.3 0.74 9.21 8.87
2 9 9 354.9 0.99 13.14 13.98 0.07 3.22 27.43
2 9 8 404.1 1.25 16.96 20.84 0.06 3.43 27.57
2 9 7 506.6 2.07 28.10 45.58 0.08 2.89 26.23
2 9 6 605.6 2.71 36.29 69.12 0.06 2.27 26.93
2 9 5 705.7 3.01 40.32 88.74 0.04 2.51 23.40
2 9 4 805.9 3.11 41.85 93.20 0.06 2.47 22.62
2 9 3 905.7 3.07 41.62 107.37 0.06 2.56 24.32
2 9 2 1005.7 3.07 41.72 114.52 0.04 2.84 24.45
2 11 11 1.8 24.39
2 11 10 20.6 62.60
2 11 9 46.6 43.69
2 11 8 73.5 40.84
2 11 7 99.4 43.25
2 11 6 125.0 16.19
- 110 -
HO
T-2 Tab
le VI.B
.14
ST
AT
ION
CA
ST
BO
TT
LE
Pressure DIC PO4NO2
+ NO3SiO4 DOP DON DOC PC PN PP Chl. a Phaeo. Bacteria ATP
dbar µmol kg-1 µmol kg-1 µmol kg-1 µmol kg-1 µmol kg-1 µmol kg-1 µmol kg-1 µmol kg-1 µmol kg-1 nmol kg-1 mg m-3 mg m-3 105 ml-1 mg m-3
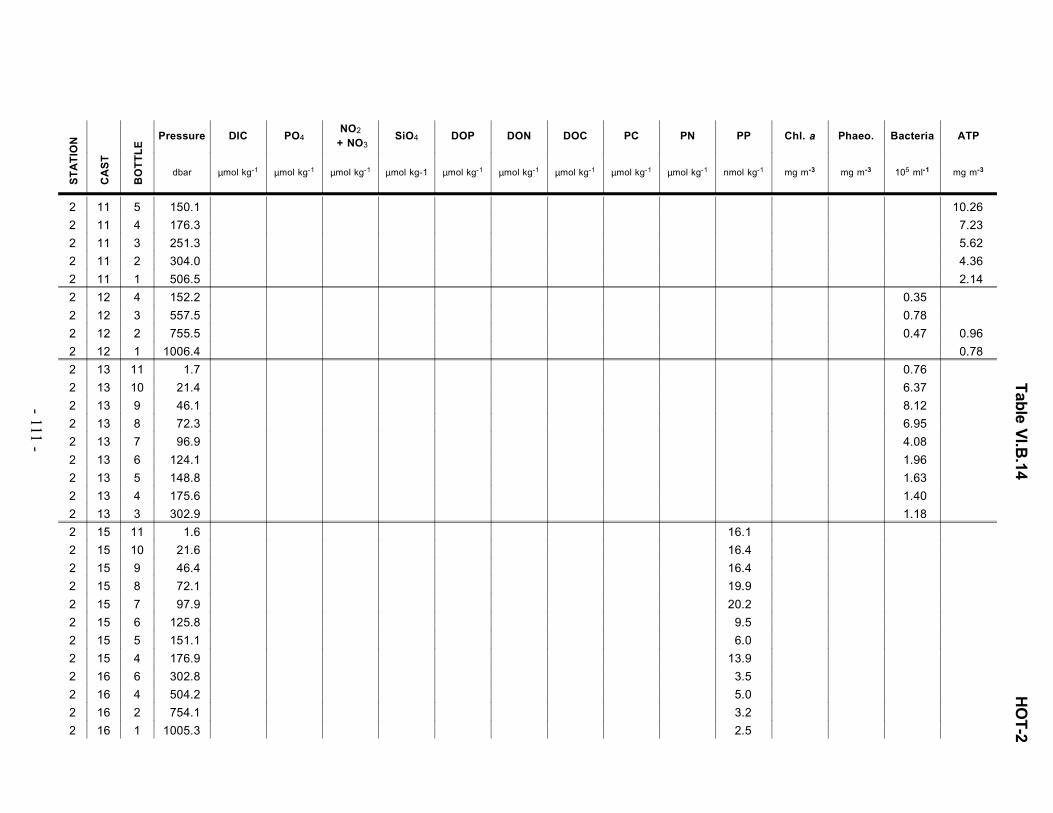
2 11 5 150.1 10.26
2 11 4 176.3 7.23
2 11 3 251.3 5.62
2 11 2 304.0 4.36
2 11 1 506.5 2.14
2 12 4 152.2 0.35
2 12 3 557.5 0.78
2 12 2 755.5 0.47 0.96
2 12 1 1006.4 0.78
2 13 11 1.7 0.76
2 13 10 21.4 6.37
2 13 9 46.1 8.12
2 13 8 72.3 6.95
2 13 7 96.9 4.08
2 13 6 124.1 1.96
2 13 5 148.8 1.63
2 13 4 175.6 1.40
2 13 3 302.9 1.18
2 15 11 1.6 16.1
2 15 10 21.6 16.4
2 15 9 46.4 16.4
2 15 8 72.1 19.9
2 15 7 97.9 20.2
2 15 6 125.8 9.5
2 15 5 151.1 6.0
2 15 4 176.9 13.9
2 16 6 302.8 3.5
2 16 4 504.2 5.0
2 16 2 754.1 3.2
2 16 1 1005.3 2.5
- 111 -
Table V
I.B.14
HO
T-2
ST
AT
ION
CA
ST
BO
TT
LE
Pressure DIC PO4NO2
+ NO3SiO4 DOP DON DOC PC PN PP Chl. a Phaeo. Bacteria ATP
dbar µmol kg-1 µmol kg-1 µmol kg-1 µmol kg-1 µmol kg-1 µmol kg-1 µmol kg-1 µmol kg-1 µmol kg-1 nmol kg-1 mg m-3 mg m-3 105 ml-1 mg m-3

- 112 -
HO
T-2 Tab
le VI.B
.14
ST
AT
ION
CA
ST
BO
TT
LE
Pressure DIC PO4NO2
+ NO3SiO4 DOP DON DOC PC PN PP Chl. a Phaeo. Bacteria ATP
dbar µmol kg-1 µmol kg-1 µmol kg-1 µmol kg-1 µmol kg-1 µmol kg-1 µmol kg-1 µmol kg-1 µmol kg-1 nmol kg-1 mg m-3 mg m-3 105 ml-1 mg m-3

2 1 12 2396.7 2363 2.79 39.42 160.74
2 1 11 2575.1 2357 2.75 38.72 160.33
2 1 10 2786.4 2344 2.71 38.15 159.94
2 1 9 2987.6 2349 2.68 37.73 158.77
2 1 7 3402.8 2340 2.59 36.99 156.80
2 1 6 3590.0 2334 2.56 36.57 155.43
2 1 5 3794.8 2318 2.56 36.36 152.49
2 1 4 4003.6 2300 2.52 36.25 153.46 0.03 2.74 23.80
2 1 2 4403.3 2288 2.52 36.20 149.54
2 1 1 4504.9 2267 2.53 35.94 148.95
2 2 12 35.9 0.09 0.02 1.33
2 2 11 204.9 0.32 3.41 2.30
2 2 10 378.3 1.26 16.68 18.41
2 2 9 598.6 2.56 34.80 63.58
2 2 8 757.5 2321 3.04 41.11 93.62
2 2 7 928.8 2345 3.06 41.63 107.75
2 2 6 1148.5 2353 3.02 41.52 117.55
2 2 5 1351.3 2360 3.00 41.41 126.97
2 2 4 1600.2 2358 2.96 40.89 138.17
2 2 3 1775.8 2361 2.90 40.46 143.07
2 2 2 1926.6 2356 2.87 40.26 148.96 0.01 2.77 22.80
2 2 1 2201.1 2371 2.82 39.73 156.81
2 3 12 19.7 1967 0.09 0.02 0.93
2 3 11 118.8 1996 0.13 0.38 1.91
2 3 10 186.0 2045 0.30 2.75 1.91
2 3 9 252.9 2055 0.46 5.20 4.27
2 3 8 334.2 2096 1.02 13.00 13.10
2 3 7 384.7 2117 1.34 17.59 19.59
2 3 6 436.6 2141 1.55 20.96 26.86
2 3 5 504.2 2204 2.14 28.69 45.51
- 113 -
Table V
I.B.15
HO
T-3
ST
AT
ION
CA
ST
BO
TT
LE
Pressure DIC PO4NO2
+ NO3SiO4 DOP DON DOC PC PN PP Chl. a Phaeo. Bacteria ATP
dbar µmol kg-1 µmol kg-1 µmol kg-1 µmol kg-1 µmol kg-1 µmol kg-1 µmol kg-1 µmol kg-1 µmol kg-1 nmol kg-1 mg m-3 mg m-3 105 ml-1 mg m-3

2 3 4 549.5 2233 2.35 31.85 54.94
2 3 3 596.9 2266 2.68 36.01 68.29
2 3 2 710.8 2312 3.00 40.38 88.12
2 3 1 1016.4 2347 3.04 41.61 111.67
2 4 10 4.9 1961 0.07 0.02 0.93 0.19 0.12
2 4 9 22.8 1960 0.07 0.04 0.93 0.26 0.09
2 4 8 43.3 1964 0.07 0.02 1.33 0.23 0.07
2 4 7 72.7 1956 0.07 0.04 1.13 0.24 0.07
2 4 6 97.7 1968 0.09 0.04 1.23 0.27 0.05
2 4 5 122.2 1976 0.12 0.11 0.73 0.24 0.27
2 4 4 146.8 2008 0.16 0.61 0.93 0.14 0.25
2 4 3 176.8 2022 0.21 1.49 1.52 0.06 0.06
2 6 12 2.8 0.07 0.02 0.93 0.18 5.88 38.43
2 6 11 18.4 0.07 0.00 0.93
2 6 10 38.2 0.07 0.02 1.13 0.18 5.26 36.29
2 6 9 56.7 0.07 0.04 1.33
2 6 8 79.4 0.09 0.04 1.13 0.17 5.23 38.05
2 6 7 96.6 0.10 0.10 1.13
2 6 6 117.5 0.14 0.49 0.93 0.14 5.02 30.58
2 6 5 139.2 0.18 1.02 1.13
2 6 4 151.6 0.24 1.81 1.91
2 6 3 163.4 0.27 2.09 1.72
2 6 2 186.7 0.34 3.20 3.09 0.06 4.24 30.77
2 6 1 230.8 0.43 4.60 3.78
2 7 12 201.3 0.32 2.82 2.30
2 7 11 251.0 2056 0.47 5.16 4.27 0.07 3.65 26.73
2 7 10 278.0 2052 0.51 5.72 5.26
2 7 9 304.3 2062 0.64 7.71 7.21
2 7 8 353.1 2100 1.11 14.22 15.07 0.09 5.14 26.74
2 7 7 403.8 2128 1.49 19.55 24.30
- 114 -
HO
T-3Tab
le VI.B
.15
ST
AT
ION
CA
ST
BO
TT
LE
Pressure DIC PO4NO2
+ NO3SiO4 DOP DON DOC PC PN PP Chl. a Phaeo. Bacteria ATP
dbar µmol kg-1 µmol kg-1 µmol kg-1 µmol kg-1 µmol kg-1 µmol kg-1 µmol kg-1 µmol kg-1 µmol kg-1 nmol kg-1 mg m-3 mg m-3 105 ml-1 mg m-3
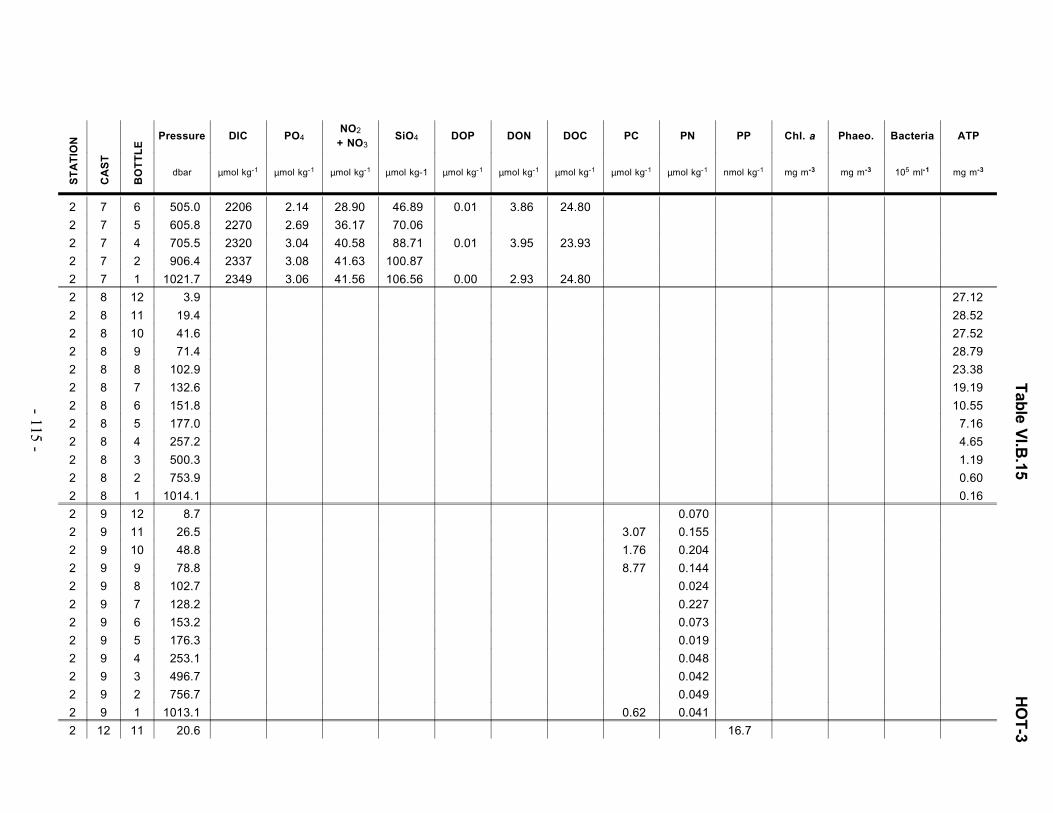
2 7 6 505.0 2206 2.14 28.90 46.89 0.01 3.86 24.80
2 7 5 605.8 2270 2.69 36.17 70.06
2 7 4 705.5 2320 3.04 40.58 88.71 0.01 3.95 23.93
2 7 2 906.4 2337 3.08 41.63 100.87
2 7 1 1021.7 2349 3.06 41.56 106.56 0.00 2.93 24.80
2 8 12 3.9 27.12
2 8 11 19.4 28.52
2 8 10 41.6 27.52
2 8 9 71.4 28.79
2 8 8 102.9 23.38
2 8 7 132.6 19.19
2 8 6 151.8 10.55
2 8 5 177.0 7.16
2 8 4 257.2 4.65
2 8 3 500.3 1.19
2 8 2 753.9 0.60
2 8 1 1014.1 0.16
2 9 12 8.7 0.070
2 9 11 26.5 3.07 0.155
2 9 10 48.8 1.76 0.204
2 9 9 78.8 8.77 0.144
2 9 8 102.7 0.024
2 9 7 128.2 0.227
2 9 6 153.2 0.073
2 9 5 176.3 0.019
2 9 4 253.1 0.048
2 9 3 496.7 0.042
2 9 2 756.7 0.049
2 9 1 1013.1 0.62 0.041
2 12 11 20.6 16.7
- 115 -
Table V
I.B.15
HO
T-3
ST
AT
ION
CA
ST
BO
TT
LE
Pressure DIC PO4NO2
+ NO3SiO4 DOP DON DOC PC PN PP Chl. a Phaeo. Bacteria ATP
dbar µmol kg-1 µmol kg-1 µmol kg-1 µmol kg-1 µmol kg-1 µmol kg-1 µmol kg-1 µmol kg-1 µmol kg-1 nmol kg-1 mg m-3 mg m-3 105 ml-1 mg m-3

2 12 9 69.8 8.2
2 12 8 98.6 12.6
2 12 7 123.2 10.1
2 12 6 148.0 8.5
2 12 5 172.0 8.2
2 12 4 251.6 5.0
2 12 1 1005.6 4.4
2 13 12 4.1 6.09
2 13 8 97.3 4.10
2 13 7 122.0 1.55
2 13 6 152.9 0.95
2 13 5 175.0 0.78
2 13 3 504.6 0.51
2 13 2 754.7 0.42
2 13 1 1016.2 0.21
- 116 -
HO
T-3Tab
le VI.B
.15
ST
AT
ION
CA
ST
BO
TT
LE
Pressure DIC PO4NO2
+ NO3SiO4 DOP DON DOC PC PN PP Chl. a Phaeo. Bacteria ATP
dbar µmol kg-1 µmol kg-1 µmol kg-1 µmol kg-1 µmol kg-1 µmol kg-1 µmol kg-1 µmol kg-1 µmol kg-1 nmol kg-1 mg m-3 mg m-3 105 ml-1 mg m-3

1 2 12 6.9 0.20 0.05 1.71
1 2 11 46.6 0.18 0.05 1.61
1 2 10 73.4 0.17 0.05 1.51
1 2 9 99.4 0.15 0.11 1.71
1 2 8 125.1 0.24 1.72 2.49
1 2 7 150.8 0.32 2.76 3.08
1 2 6 201.7 0.38 3.56 3.47
1 2 5 305.4 1.00 12.37 13.84
1 2 4 404.5 1.86 24.21 34.27
1 2 3 504.8 2.46 32.37 54.70
1 2 2 754.5 3.02 40.50 91.05
1 2 1 1015.1 3.01 41.38 109.42
2 1 12 8.7 0.09 0.07 1.32
2 1 11 18.8 0.09 0.05 0.93
2 1 10 38.5 0.09 0.07 0.73
2 1 9 58.4 0.09 0.05 0.73
2 1 8 78.4 0.04 0.05 1.12
2 1 7 98.4 0.04 0.07 0.83
2 1 6 108.2 0.04 0.05 1.12
2 1 5 118.3 0.08 0.07 0.73
2 1 4 131.3 0.07 0.29 1.12
2 1 3 141.4 0.13 0.98 1.51
2 1 2 151.3 0.17 1.53 1.71
2 1 1 163.0 0.22 2.16 2.10
2 2 12 179.4 0.31 3.23 3.27
2 2 11 226.3 0.43 4.91 5.03
2 2 10 250.9 0.53 6.57 6.59 0.08 4.29 25.60
2 2 9 270.4 0.63 7.80 8.94
2 2 8 299.8 0.71 9.29 11.09
2 2 7 402.2 1.19 16.50 21.66 0.04 3.67 25.01
- 117 -
Table V
I.B.16
HO
T-4
ST
AT
ION
CA
ST
BO
TT
LE
Pressure DIC PO4NO2
+ NO3SiO4 DOP DON DOC PC PN PP Chl. a Phaeo. Bacteria ATP
dbar µmol kg-1 µmol kg-1 µmol kg-1 µmol kg-1 µmol kg-1 µmol kg-1 µmol kg-1 µmol kg-1 µmol kg-1 nmol kg-1 mg m-3 mg m-3 105 ml-1 mg m-3

2 2 6 502.1 2.18 28.69 45.90
2 2 5 602.8 2.66 35.71 68.19
2 2 4 703.8 2.95 39.83 84.22 0.02 1.96 24.29
2 2 3 806.7 3.03 40.83 91.61
2 2 2 908.3 3.03 41.16 100.83
2 2 1 1005.0 3.03 41.28 107.67 0.00 2.10 27.20
2 3 7 201.0 2024 0.36 3.97 4.44
2 4 12 2399.1 2.77 39.15 160.43
2 4 11 2601.8 2.72 38.70 161.02
2 4 10 2804.0 2.67 38.15 161.02
2 4 9 3005.6 2.65 37.59 159.45
2 4 8 3197.6 2.61 37.20 158.77
2 4 7 3400.3 2.58 36.70 156.52
2 4 6 3599.3 2.57 36.48 153.59
2 4 5 3800.9 2.54 36.25 153.59
2 4 4 4000.3 2.53 35.92 151.63
2 4 2 4396.5 2.51 35.69 149.28
2 5 11 201.7 0.36 3.83 3.86
2 5 10 404.4 1.18 16.32 19.90
2 5 9 601.2 2.67 36.05 65.65
2 5 8 787.3 2.98 40.72 91.05
2 5 7 998.7 3.02 41.61 107.67
2 5 6 1201.2 3.03 41.55 117.44
2 5 4 1601.6 2.90 40.83 137.96
2 5 3 1802.9 2.85 40.27 145.78
2 5 2 2003.6 2.83 39.94 152.22
2 5 1 2201.3 2.79 39.60 157.50
2 6 8 5.8 0.09 0.02 0.73 0.13 0.05
2 6 7 22.1 0.09 0.02 0.54 0.13 0.05
2 6 6 41.8 0.09 0.02 1.71 0.19 5.92 32.90 0.17 0.06
- 118 -
HO
T-4Tab
le VI.B
.16
ST
AT
ION
CA
ST
BO
TT
LE
Pressure DIC PO4NO2
+ NO3SiO4 DOP DON DOC PC PN PP Chl. a Phaeo. Bacteria ATP
dbar µmol kg-1 µmol kg-1 µmol kg-1 µmol kg-1 µmol kg-1 µmol kg-1 µmol kg-1 µmol kg-1 µmol kg-1 nmol kg-1 mg m-3 mg m-3 105 ml-1 mg m-3

2 6 5 71.8 0.07 0.05 1.32 0.19 0.13
2 6 4 99.6 0.05 0.07 0.73 0.18 5.41 35.81 0.22 0.20
2 6 3 123.2 0.07 0.21 2.10 0.17 0.23
2 6 2 151.1 0.23 2.31 2.49 0.13 4.76 27.87 0.06 0.10
2 6 1 177.4 0.29 3.11 4.25 0.02 0.03
2 7 12 47.0 0.08 0.05 0.93
2 7 11 131.0 0.11 0.24 1.71
2 7 10 162.1 0.24 1.91 2.88
2 7 9 203.7 0.39 3.95 3.86
2 7 8 299.8 0.75 9.72 9.82
2 7 7 355.4 0.99 13.38 15.99
2 7 6 423.7 1.79 23.74 33.38
2 7 5 571.5 2.59 34.94 61.74
2 7 4 678.0 2.90 39.39 80.31
2 7 3 745.5 2.98 40.72 89.10
2 7 2 810.5 3.03 41.49 98.48
2 7 1 980.2 3.03 41.61 107.27
2 8 12 5.0 0.255 4.42 30.68
2 8 11 22.2 5.38 43.76
2 8 10 42.0 0.180 3.93 42.35
2 8 9 71.8 1.73 0.242 4.50 30.69
2 8 8 100.2 0.227 3.51 25.08
2 8 7 126.4 2.21 0.120 2.74 19.82
2 8 6 148.4 1.45 0.113 1.65 12.73
2 8 5 177.6 0.73 0.061 0.97 8.68
2 8 4 247.7 0.50 0.032 0.63 4.89
2 8 3 303.2 0.45 0.047 0.62 3.92
2 8 2 507.7 0.84 1.98
2 8 1 756.4 0.27 0.98
- 119 -
Table V
I.B.16
HO
T-4
ST
AT
ION
CA
ST
BO
TT
LE
Pressure DIC PO4NO2
+ NO3SiO4 DOP DON DOC PC PN PP Chl. a Phaeo. Bacteria ATP
dbar µmol kg-1 µmol kg-1 µmol kg-1 µmol kg-1 µmol kg-1 µmol kg-1 µmol kg-1 µmol kg-1 µmol kg-1 nmol kg-1 mg m-3 mg m-3 105 ml-1 mg m-3

- 120 -
HO
T-4Tab
le VI.B
.16
ST
AT
ION
CA
ST
BO
TT
LE
Pressure DIC PO4NO2
+ NO3SiO4 DOP DON DOC PC PN PP Chl. a Phaeo. Bacteria ATP
dbar µmol kg-1 µmol kg-1 µmol kg-1 µmol kg-1 µmol kg-1 µmol kg-1 µmol kg-1 µmol kg-1 µmol kg-1 nmol kg-1 mg m-3 mg m-3 105 ml-1 mg m-3
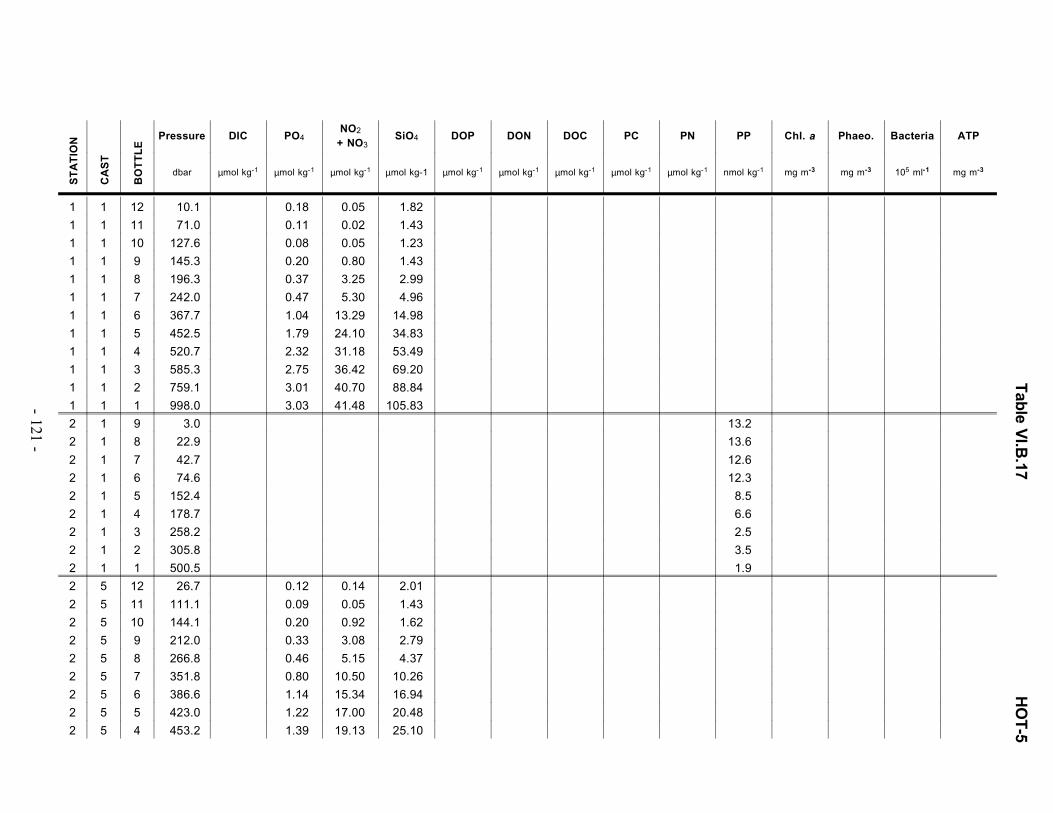
1 1 12 10.1 0.18 0.05 1.82
1 1 11 71.0 0.11 0.02 1.43
1 1 10 127.6 0.08 0.05 1.23
1 1 9 145.3 0.20 0.80 1.43
1 1 8 196.3 0.37 3.25 2.99
1 1 7 242.0 0.47 5.30 4.96
1 1 6 367.7 1.04 13.29 14.98
1 1 5 452.5 1.79 24.10 34.83
1 1 4 520.7 2.32 31.18 53.49
1 1 3 585.3 2.75 36.42 69.20
1 1 2 759.1 3.01 40.70 88.84
1 1 1 998.0 3.03 41.48 105.83
2 1 9 3.0 13.2
2 1 8 22.9 13.6
2 1 7 42.7 12.6
2 1 6 74.6 12.3
2 1 5 152.4 8.5
2 1 4 178.7 6.6
2 1 3 258.2 2.5
2 1 2 305.8 3.5
2 1 1 500.5 1.9
2 5 12 26.7 0.12 0.14 2.01
2 5 11 111.1 0.09 0.05 1.43
2 5 10 144.1 0.20 0.92 1.62
2 5 9 212.0 0.33 3.08 2.79
2 5 8 266.8 0.46 5.15 4.37
2 5 7 351.8 0.80 10.50 10.26
2 5 6 386.6 1.14 15.34 16.94
2 5 5 423.0 1.22 17.00 20.48
2 5 4 453.2 1.39 19.13 25.10
- 121 -
Table V
I.B.17
HO
T-5
ST
AT
ION
CA
ST
BO
TT
LE
Pressure DIC PO4NO2
+ NO3SiO4 DOP DON DOC PC PN PP Chl. a Phaeo. Bacteria ATP
dbar µmol kg-1 µmol kg-1 µmol kg-1 µmol kg-1 µmol kg-1 µmol kg-1 µmol kg-1 µmol kg-1 µmol kg-1 nmol kg-1 mg m-3 mg m-3 105 ml-1 mg m-3

2 5 3 535.0 1.96 27.28 45.24
2 5 2 570.5 2.27 31.07 55.46
2 5 1 633.5 2.69 36.76 73.14
2 8 11 23.7 4.73
2 8 10 40.8 7.31
2 8 9 72.4 8.27
2 8 8 97.2 5.88
2 8 7 122.5 3.75
2 8 6 149.5 1.96
2 8 5 177.2 2.32
2 8 4 255.2 1.64
2 8 3 507.4 0.71
2 8 2 755.7 0.31
2 8 1 1025.0 0.22
2 11 12 225.0 0.35 3.58 3.19
2 11 11 250.0 0.43 4.81 4.17 4.07
2 11 10 275.0 0.50 5.86 5.55
2 11 9 300.0 0.67 8.09 7.90 4.29
2 11 8 400.0 1.03 14.18 16.15
2 11 7 500.0 1.82 25.26 38.34 1.93
2 11 5 700.0 2.94 39.86 84.49
2 11 4 750.0 1.07
2 11 3 800.0 3.05 41.86 92.34
2 11 2 900.0 3.04 41.59 100.58
2 11 1 1000.0 3.03 41.63 107.46 0.63
2 12 12 5.0 1.56 0.149
2 12 11 25.0 1.68 0.181
2 12 10 45.0 1.67 0.184
2 12 9 75.0 1.94 0.107
2 12 8 100.0 1.67 0.121
- 122 -
HO
T-5Tab
le VI.B
.17
ST
AT
ION
CA
ST
BO
TT
LE
Pressure DIC PO4NO2
+ NO3SiO4 DOP DON DOC PC PN PP Chl. a Phaeo. Bacteria ATP
dbar µmol kg-1 µmol kg-1 µmol kg-1 µmol kg-1 µmol kg-1 µmol kg-1 µmol kg-1 µmol kg-1 µmol kg-1 nmol kg-1 mg m-3 mg m-3 105 ml-1 mg m-3
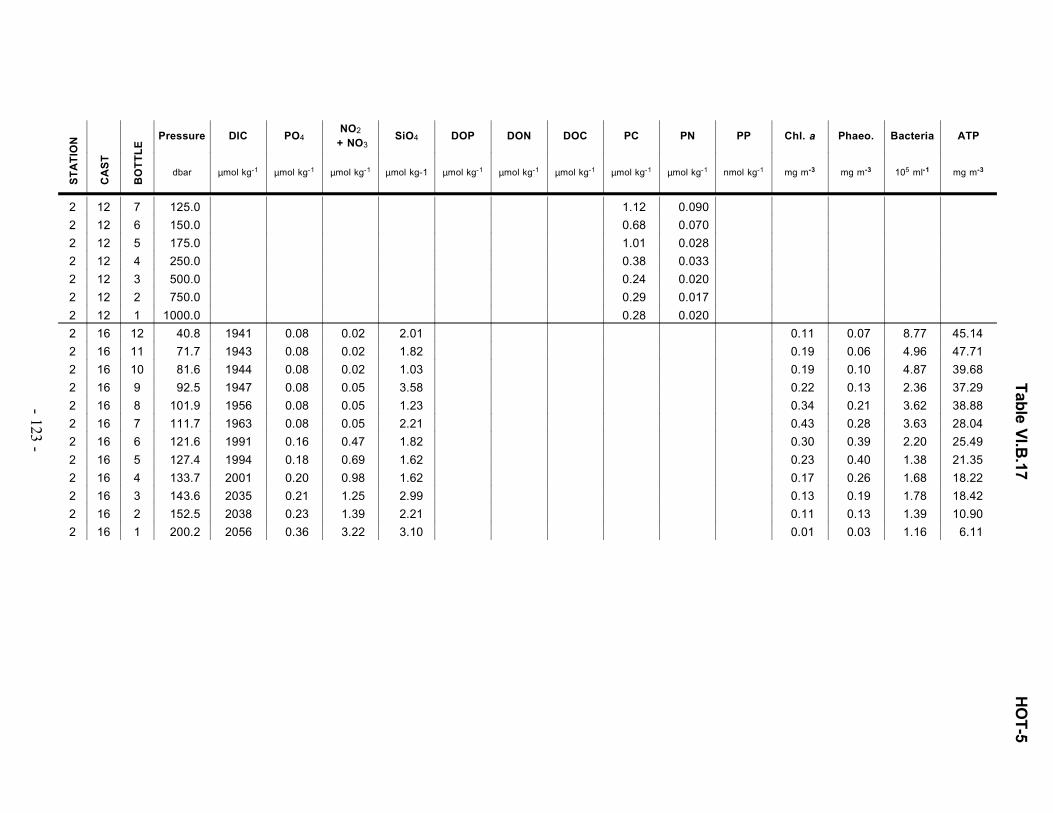
2 12 7 125.0 1.12 0.090
2 12 6 150.0 0.68 0.070
2 12 5 175.0 1.01 0.028
2 12 4 250.0 0.38 0.033
2 12 3 500.0 0.24 0.020
2 12 2 750.0 0.29 0.017
2 12 1 1000.0 0.28 0.020
2 16 12 40.8 1941 0.08 0.02 2.01 0.11 0.07 8.77 45.14
2 16 11 71.7 1943 0.08 0.02 1.82 0.19 0.06 4.96 47.71
2 16 10 81.6 1944 0.08 0.02 1.03 0.19 0.10 4.87 39.68
2 16 9 92.5 1947 0.08 0.05 3.58 0.22 0.13 2.36 37.29
2 16 8 101.9 1956 0.08 0.05 1.23 0.34 0.21 3.62 38.88
2 16 7 111.7 1963 0.08 0.05 2.21 0.43 0.28 3.63 28.04
2 16 6 121.6 1991 0.16 0.47 1.82 0.30 0.39 2.20 25.49
2 16 5 127.4 1994 0.18 0.69 1.62 0.23 0.40 1.38 21.35
2 16 4 133.7 2001 0.20 0.98 1.62 0.17 0.26 1.68 18.22
2 16 3 143.6 2035 0.21 1.25 2.99 0.13 0.19 1.78 18.42
2 16 2 152.5 2038 0.23 1.39 2.21 0.11 0.13 1.39 10.90
2 16 1 200.2 2056 0.36 3.22 3.10 0.01 0.03 1.16 6.11
- 123 -
Table V
I.B.17
HO
T-5
ST
AT
ION
CA
ST
BO
TT
LE
Pressure DIC PO4NO2
+ NO3SiO4 DOP DON DOC PC PN PP Chl. a Phaeo. Bacteria ATP
dbar µmol kg-1 µmol kg-1 µmol kg-1 µmol kg-1 µmol kg-1 µmol kg-1 µmol kg-1 µmol kg-1 µmol kg-1 nmol kg-1 mg m-3 mg m-3 105 ml-1 mg m-3

1 2 12 41.8 1961 0.14 0.03 1.32
1 2 11 61.8 1987 0.12 0.01 1.12
1 2 10 110.8 2036 0.18 0.92 1.71
1 2 9 162.5 2074 0.40 4.12 3.27
1 2 6 336.8 2142 1.27 17.01 20.06
1 2 5 411.0 2199 1.82 24.57 33.93
1 2 4 530.0 2316 2.46 33.24 57.36
1 2 3 630.2 2319 2.79 38.00 74.94
1 2 2 756.5 2409 2.98 40.89 89.58
1 2 1 899.0 2360 3.03 41.58 103.83
2 1 12 2378.0 2.76 38.67 158.18
2 1 11 2578.9 2.75 38.34 159.84
2 1 10 2779.0 2377 2.71
2 1 9 2980.5 2.68 37.68 160.42
2 1 8 3184.0 2.64 37.12 158.86
2 1 7 3389.0 2.61 36.78 156.90
2 1 6 3591.4 2.59 36.45 155.53
2 1 4 3996.5 2357 2.54 35.89 152.03
2 1 3 4200.0 2.54 35.89 151.05
2 1 2 4403.3 2.52 35.66 150.07
2 1 1 4507.1 2353 2.53 35.66 149.68
2 2 11 13.8 17.0
2 2 10 30.1 18.6
2 2 9 49.9 14.5
2 2 8 79.9 19.5
2 2 4 303.2 2.8
2 3 12 701.7 2347 2.96 41.14 92.51
2 3 11 801.0 3.04 41.81 102.27
2 3 10 901.6 2366 3.00 41.69 106.16
2 3 9 1002.3 2366 3.01 41.58 111.34
- 124 -
HO
T-6 Tab
le VI.B
.18
ST
AT
ION
CA
ST
BO
TT
LE
Pressure DIC PO4NO2
+ NO3SiO4 DOP DON DOC PC PN PP Chl. a Phaeo. Bacteria ATP
dbar µmol kg-1 µmol kg-1 µmol kg-1 µmol kg-1 µmol kg-1 µmol kg-1 µmol kg-1 µmol kg-1 µmol kg-1 nmol kg-1 mg m-3 mg m-3 105 ml-1 mg m-3
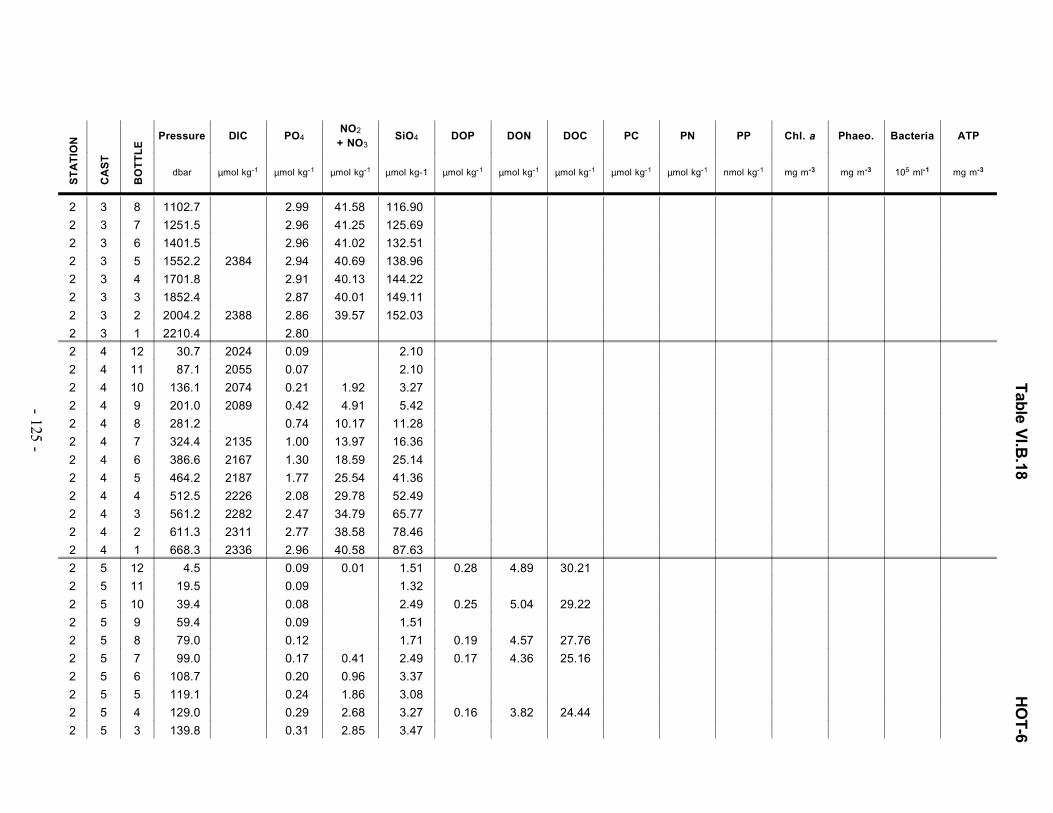
2 3 8 1102.7 2.99 41.58 116.90
2 3 7 1251.5 2.96 41.25 125.69
2 3 6 1401.5 2.96 41.02 132.51
2 3 5 1552.2 2384 2.94 40.69 138.96
2 3 4 1701.8 2.91 40.13 144.22
2 3 3 1852.4 2.87 40.01 149.11
2 3 2 2004.2 2388 2.86 39.57 152.03
2 3 1 2210.4 2.80
2 4 12 30.7 2024 0.09 2.10
2 4 11 87.1 2055 0.07 2.10
2 4 10 136.1 2074 0.21 1.92 3.27
2 4 9 201.0 2089 0.42 4.91 5.42
2 4 8 281.2 0.74 10.17 11.28
2 4 7 324.4 2135 1.00 13.97 16.36
2 4 6 386.6 2167 1.30 18.59 25.14
2 4 5 464.2 2187 1.77 25.54 41.36
2 4 4 512.5 2226 2.08 29.78 52.49
2 4 3 561.2 2282 2.47 34.79 65.77
2 4 2 611.3 2311 2.77 38.58 78.46
2 4 1 668.3 2336 2.96 40.58 87.63
2 5 12 4.5 0.09 0.01 1.51 0.28 4.89 30.21
2 5 11 19.5 0.09 1.32
2 5 10 39.4 0.08 2.49 0.25 5.04 29.22
2 5 9 59.4 0.09 1.51
2 5 8 79.0 0.12 1.71 0.19 4.57 27.76
2 5 7 99.0 0.17 0.41 2.49 0.17 4.36 25.16
2 5 6 108.7 0.20 0.96 3.37
2 5 5 119.1 0.24 1.86 3.08
2 5 4 129.0 0.29 2.68 3.27 0.16 3.82 24.44
2 5 3 139.8 0.31 2.85 3.47
- 125 -
Table V
I.B.18
HO
T-6
ST
AT
ION
CA
ST
BO
TT
LE
Pressure DIC PO4NO2
+ NO3SiO4 DOP DON DOC PC PN PP Chl. a Phaeo. Bacteria ATP
dbar µmol kg-1 µmol kg-1 µmol kg-1 µmol kg-1 µmol kg-1 µmol kg-1 µmol kg-1 µmol kg-1 µmol kg-1 nmol kg-1 mg m-3 mg m-3 105 ml-1 mg m-3

2 5 2 159.7 0.34 3.23 3.86 0.11 4.21 25.59
2 5 1 179.6 0.42 4.45 4.64
2 6 12 199.7 0.42 4.81 4.64 0.16 4.18 31.51
2 6 11 250.6 0.58 7.30 7.17
2 6 10 273.5 0.68 8.90 8.74
2 6 9 300.4 0.91 12.23 12.25 0.14 3.46 22.39
2 6 8 349.7 1.13 15.57 17.73
2 6 7 400.4 1.37 19.23 25.34
2 6 6 502.7 2.05 28.79 50.15 0.08 3.55 24.67
2 6 5 603.0 2.74 37.57 76.90
2 6 4 702.3 3.00 40.89 91.54 0.07 3.55 22.07
2 6 3 801.9 3.04 41.78 100.32
2 6 2 904.1 3.03 41.55 106.16
2 6 1 1007.2 3.03 41.78 113.00 0.09 2.91 20.62
2 7 12 29.5 1.49
2 7 11 49.6 5.37
2 7 10 79.6 5.18
2 7 9 104.4 2.43
2 7 8 129.1 1.78
2 7 7 153.7 1.89
2 7 6 178.9 1.51
2 7 5 252.9 1.44
2 7 4 302.6 0.96
2 7 3 502.6 0.46
2 7 2 902.3 0.30
2 7 1 1012.1 0.25
2 8 12 1.3 1.64 0.272
2 8 11 20.8 2.19 0.300
2 8 10 40.9 1.96 0.293
2 8 9 73.5 1.63 0.223
- 126 -
HO
T-6 Tab
le VI.B
.18
ST
AT
ION
CA
ST
BO
TT
LE
Pressure DIC PO4NO2
+ NO3SiO4 DOP DON DOC PC PN PP Chl. a Phaeo. Bacteria ATP
dbar µmol kg-1 µmol kg-1 µmol kg-1 µmol kg-1 µmol kg-1 µmol kg-1 µmol kg-1 µmol kg-1 µmol kg-1 nmol kg-1 mg m-3 mg m-3 105 ml-1 mg m-3

2 8 8 98.2 1.85 0.272
2 8 7 125.2 1.15 0.209
2 8 6 149.8 0.54 0.098
2 8 5 174.6 0.50 0.077
2 8 4 252.3 0.35 0.056
2 8 3 467.5 0.27 0.035
2 8 2 767.5 0.35 0.070
2 8 1 1011.0 0.15 0.021
2 15 12 2.9 19.81
2 15 11 23.0 29.98
2 15 10 45.8 39.86
2 15 9 74.4 32.87
2 15 8 106.9 42.99
2 15 7 126.9 16.18
2 15 6 151.8 15.03
2 15 5 176.8 8.05
2 15 4 256.8 4.54
2 15 3 305.8 2.33
2 15 2 504.6 1.97
2 15 1 1012.3 0.00
2 17 12 40.6 2.00 0.530
2 17 11 71.3 2.08 0.321
2 17 10 81.0 1.89 0.237
2 17 9 92.5 1.91 0.293
2 17 8 102.0 1.63 0.202
2 17 7 107.9 1.61 0.209
2 17 6 112.0 1.60 0.244
2 17 5 123.7 2.91 0.328
2 17 4 132.0 1.86 0.265
2 17 3 151.9 1.26 0.223
- 127 -
Table V
I.B.18
HO
T-6
ST
AT
ION
CA
ST
BO
TT
LE
Pressure DIC PO4NO2
+ NO3SiO4 DOP DON DOC PC PN PP Chl. a Phaeo. Bacteria ATP
dbar µmol kg-1 µmol kg-1 µmol kg-1 µmol kg-1 µmol kg-1 µmol kg-1 µmol kg-1 µmol kg-1 µmol kg-1 nmol kg-1 mg m-3 mg m-3 105 ml-1 mg m-3

2 17 2 176.7 0.72 0.105
2 17 1 204.4 0.50 0.084
- 128 -
HO
T-6 Tab
le VI.B
.18
ST
AT
ION
CA
ST
BO
TT
LE
Pressure DIC PO4NO2
+ NO3SiO4 DOP DON DOC PC PN PP Chl. a Phaeo. Bacteria ATP
dbar µmol kg-1 µmol kg-1 µmol kg-1 µmol kg-1 µmol kg-1 µmol kg-1 µmol kg-1 µmol kg-1 µmol kg-1 nmol kg-1 mg m-3 mg m-3 105 ml-1 mg m-3

2 1 12 5.8 12.3
2 1 11 26.2 15.8
2 1 10 51.4 15.5
2 1 9 78.4 17.7
2 1 8 103.4 10.4
2 1 7 129.1 9.5
2 1 6 152.3 7.3
2 1 5 179.9 4.4
2 1 4 257.6 3.8
2 1 3 514.2 3.2
2 1 2 758.0 1.9
2 1 1 1021.2 1.9
2 2 12 15.3 0.14 0.05 0.92
2 2 11 79.6 0.12 0.02 0.92
2 2 10 99.5 0.16 0.02 1.30
2 2 9 139.5 0.17 0.36 1.30
2 2 8 199.2 0.47 5.05 3.80
2 2 6 304.8 0.87 11.61 12.07
2 2 5 403.5 1.56 21.51 29.19
2 2 4 530.9 2.35 32.41 58.44
2 2 3 612.5 2.79 38.08 76.52
2 2 2 770.1 3.05 41.63 96.90
2 2 1 1018.3 41.85 113.04
2 3 11 49.1 0.16 0.02 1.30
2 3 10 127.6 0.08 0.05 1.30
2 3 9 225.5 0.50 5.73 4.38
2 3 8 424.3 1.45 20.06 26.31
2 3 7 620.5 2.76 38.31 76.52
2 3 6 821.3 3.05 42.07 103.43
2 3 5 1017.3 3.02 41.96 112.46
- 129 -
Table V
I.B.19
HO
T-7
ST
AT
ION
CA
ST
BO
TT
LE
Pressure DIC PO4NO2
+ NO3SiO4 DOP DON DOC PC PN PP Chl. a Phaeo. Bacteria ATP
dbar µmol kg-1 µmol kg-1 µmol kg-1 µmol kg-1 µmol kg-1 µmol kg-1 µmol kg-1 µmol kg-1 µmol kg-1 nmol kg-1 mg m-3 mg m-3 105 ml-1 mg m-3

2 3 4 1218.7 2.97 41.63 122.07
2 3 3 1420.6 2.91 40.85 137.46
2 3 2 1623.2 2.89 40.51 137.45
2 3 1 1843.0 39.91 145.44
2 4 12 105.2 0.07 0.04 3.22 0.21 5.34 31.09
2 4 10 257.6 0.58 7.21 7.26 0.11 4.28 23.01
2 4 9 279.8 0.67 8.33 8.23 0.08 3.77 22.37
2 4 8 309.8 0.73 9.35 9.58 0.20 3.26 20.60
2 4 7 363.8 1.19 15.84 17.84 0.11 4.02 20.44
2 4 6 424.1 1.45 19.88 25.93 0.14 4.55 21.23
2 4 5 521.8 2.24 30.71 51.51 0.07 3.10 20.91
2 4 4 604.5 2.69 36.82 71.71 0.03 2.88 19.56
2 4 3 822.7 3.09 0.00 2.38 19.65
2 4 2 906.4 3.06 41.93 107.28 0.13 3.45 19.65
2 4 1 1004.5 3.05 41.93 112.46 0.01 2.38 21.54
2 5 12 102.0 4.22
2 5 11 130.0 3.78
2 5 10 154.8 2.09
2 5 9 180.2 1.59
2 5 8 205.6 1.37
2 5 7 230.3 1.13
2 5 6 255.3 0.74
2 5 5 280.1 0.61
2 5 4 309.8 0.73
2 5 3 529.6 0.51
2 5 2 1030.7 0.23
- 130 -
HO
T-7Tab
le VI.B
.19
ST
AT
ION
CA
ST
BO
TT
LE
Pressure DIC PO4NO2
+ NO3SiO4 DOP DON DOC PC PN PP Chl. a Phaeo. Bacteria ATP
dbar µmol kg-1 µmol kg-1 µmol kg-1 µmol kg-1 µmol kg-1 µmol kg-1 µmol kg-1 µmol kg-1 µmol kg-1 nmol kg-1 mg m-3 mg m-3 105 ml-1 mg m-3

1 1 12 18.2 0.14 0.02 2.40
1 1 11 67.1 0.15 0.04 2.03
1 1 10 126.4 0.27 1.79 2.97
1 1 9 166.2 0.45 4.38 3.82
1 1 8 240.5 1.09 13.21 12.68
1 1 7 320.1 1.41 18.21 22.21
1 1 6 449.6 2.28 30.47 51.64
1 1 5 539.7 2.82 37.74 73.70
1 1 4 629.4 3.02 40.35 87.84
1 1 3 729.5 3.06 40.86 88.77
1 1 2 879.5 3.06 41.17 99.15
1 1 1 1033.5 3.08 41.38 107.91
2 1 12 6.3 18.9
2 1 10 47.8 13.6
2 1 9 77.1 11.3
2 1 8 103.3 12.3
2 1 7 129.0 8.5
2 1 6 155.4 5.4
2 1 5 180.9 5.7
2 1 4 257.8 3.8
2 1 3 509.6 4.1
2 1 1 1019.6 2.2
2 2 12 54.3 0.07 0.02 0.90
2 2 11 98.5 0.09 0.02 0.90
2 2 10 148.5 0.21 1.34 1.65
2 2 9 206.8 0.42 4.30 3.72
2 2 8 288.0 0.83 10.63 10.33
2 2 7 403.5 1.59 21.77 29.38
2 2 6 483.8 2.25 30.41 49.19
2 2 5 564.3 2.65 36.16 68.99
- 131 -
Table V
I.B.20
HO
T-8
ST
AT
ION
CA
ST
BO
TT
LE
Pressure DIC PO4NO2
+ NO3SiO4 DOP DON DOC PC PN PP Chl. a Phaeo. Bacteria ATP
dbar µmol kg-1 µmol kg-1 µmol kg-1 µmol kg-1 µmol kg-1 µmol kg-1 µmol kg-1 µmol kg-1 µmol kg-1 nmol kg-1 mg m-3 mg m-3 105 ml-1 mg m-3

2 2 4 635.0 2.88 39.19 80.30
2 2 3 765.2 3.10 41.68 96.33
2 2 2 855.6 41.99 103.20
2 2 1 1012.3 41.88 114.80
2 4 12 204.9 0.48 4.92 7.49 0.22 4.53 19.05 0.02 0.01
2 4 11 228.0 2062 0.54 5.91 5.61 0.24 4.78 20.07
2 4 10 253.5 0.64 7.45 7.49 0.39 4.27 20.51
2 4 9 304.8 1.01 12.41 13.35 0.15 4.07 19.42
2 4 8 356.0 1.29 16.75 20.95 0.15 3.83 19.84
2 4 7 405.7 2150 1.59 21.09 28.82 0.07 3.68 19.66
2 4 6 507.6 2.38 31.76 55.79 0.05 3.03 20.68
2 4 5 605.7 2302 2.84 38.32 79.36 0.07 2.75 19.58
2 4 4 708.3 3.12 41.59 98.21 0.07 2.36 22.46
2 4 2 909.9 2354 3.13 41.99 112.35 0.06 2.06 20.76
2 4 1 1012.5 3.10 41.79 115.74 0.06 2.21 20.76
2 5 12 5.6 1965 0.10 0.02 1.46 0.21 4.88 33.66 0.13 0.03
2 5 11 27.4 1964 0.10 0.02 1.52 0.21 5.32 30.29 0.13 0.01
2 5 10 46.8 1965 0.11 0.02 2.22 0.24 6.36 36.10 0.16 0.06
2 5 9 61.8 0.09 0.02 1.28 0.22 5.89 27.77 0.14 0.05
2 5 8 77.3 1987 0.07 0.02 1.28 0.21 5.23 35.07 0.19 0.09
2 5 7 87.8 0.10 0.02 1.28 0.14 5.01 23.25 0.22 0.11
2 5 6 98.5 0.14 0.04 1.84 0.14 5.47 24.81 0.37 0.16
2 5 5 109.3 0.12 0.04 1.84 0.17 5.10 23.95 0.36 0.29
2 5 4 119.2 2013 0.13 0.06 1.28 0.12 5.06 25.83 0.28 0.42
2 5 3 130.5 0.13 0.12 1.28 0.18 5.51 23.25 0.26 0.27
2 5 2 156.0 0.27 1.99 2.60 0.24 4.42 19.67 0.10 0.15
2 5 1 181.1 2061 0.39 3.66 2.97 0.12 4.03 18.42 0.01 0.10
2 9 12 6.0 39.92
2 9 11 25.3 8.08 38.02
2 9 10 47.7 5.66 31.80
- 132 -
HO
T-8Tab
le VI.B
.20
ST
AT
ION
CA
ST
BO
TT
LE
Pressure DIC PO4NO2
+ NO3SiO4 DOP DON DOC PC PN PP Chl. a Phaeo. Bacteria ATP
dbar µmol kg-1 µmol kg-1 µmol kg-1 µmol kg-1 µmol kg-1 µmol kg-1 µmol kg-1 µmol kg-1 µmol kg-1 nmol kg-1 mg m-3 mg m-3 105 ml-1 mg m-3
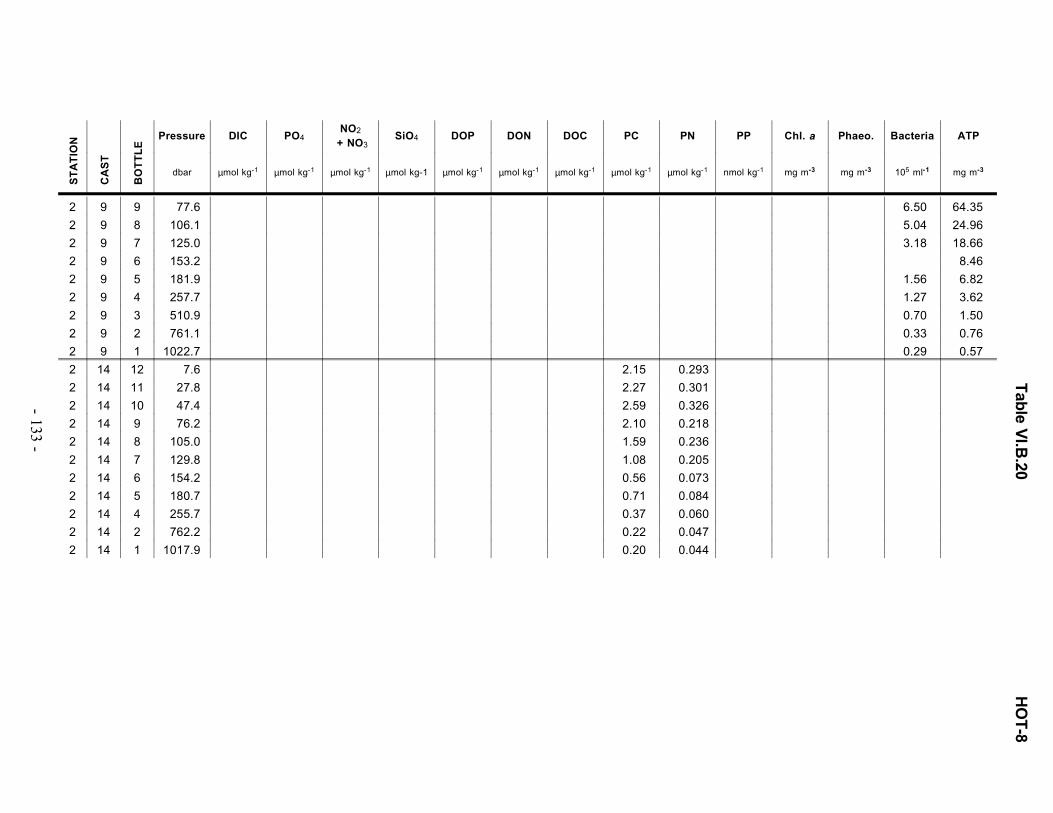
2 9 9 77.6 6.50 64.35
2 9 8 106.1 5.04 24.96
2 9 7 125.0 3.18 18.66
2 9 6 153.2 8.46
2 9 5 181.9 1.56 6.82
2 9 4 257.7 1.27 3.62
2 9 3 510.9 0.70 1.50
2 9 2 761.1 0.33 0.76
2 9 1 1022.7 0.29 0.57
2 14 12 7.6 2.15 0.293
2 14 11 27.8 2.27 0.301
2 14 10 47.4 2.59 0.326
2 14 9 76.2 2.10 0.218
2 14 8 105.0 1.59 0.236
2 14 7 129.8 1.08 0.205
2 14 6 154.2 0.56 0.073
2 14 5 180.7 0.71 0.084
2 14 4 255.7 0.37 0.060
2 14 2 762.2 0.22 0.047
2 14 1 1017.9 0.20 0.044
- 133 -
Table V
I.B.20
HO
T-8
ST
AT
ION
CA
ST
BO
TT
LE
Pressure DIC PO4NO2
+ NO3SiO4 DOP DON DOC PC PN PP Chl. a Phaeo. Bacteria ATP
dbar µmol kg-1 µmol kg-1 µmol kg-1 µmol kg-1 µmol kg-1 µmol kg-1 µmol kg-1 µmol kg-1 µmol kg-1 nmol kg-1 mg m-3 mg m-3 105 ml-1 mg m-3

1 1 12 5.4 0.10 0.04 1.81
1 1 11 70.3 0.11 0.04 1.44
1 1 10 117.4 0.13 0.49 1.62
1 1 9 149.9 0.23 1.96 2.18
1 1 8 208.0 0.63 7.08 6.43
1 1 7 266.3 1.18 14.84 16.42
1 1 6 352.1 1.72 23.00 32.70
1 1 5 430.9 2.25 29.90 50.28
1 1 4 539.4 2.76 36.47 68.96
1 1 3 633.0 2.95 39.12 79.31
1 1 2 727.4 3.03 40.81 91.32
1 1 1 1026.1 3.06 41.55 111.30
2 1 12 10.1 8.2
2 1 11 26.0 24.3
2 1 10 46.7 11.7
2 1 9 77.6 10.1
2 1 8 104.6 6.0
2 1 7 129.2 10.7
2 1 4 258.5 11.7
2 1 3 509.9 7.9
2 1 2 761.7 0.0
2 1 1 1026.9 9.1
2 2 12 779.3 3.05 41.13 95.96
2 2 11 911.2 3.05 41.34 106.12
2 2 10 1053.8 3.05 41.34 113.14
2 2 9 1198.1 3.02 41.24 120.91
2 2 8 1352.3 2.99 41.02 130.16
2 2 7 1499.7 2.98 40.70 134.78
2 2 6 1649.7 2.94 40.49 139.40
2 2 5 1802.7 2.91 40.28 143.10
- 134 -
HO
T-9 Tab
le VI.B
.21
ST
AT
ION
CA
ST
BO
TT
LE
Pressure DIC PO4NO2
+ NO3SiO4 DOP DON DOC PC PN PP Chl. a Phaeo. Bacteria ATP
dbar µmol kg-1 µmol kg-1 µmol kg-1 µmol kg-1 µmol kg-1 µmol kg-1 µmol kg-1 µmol kg-1 µmol kg-1 nmol kg-1 mg m-3 mg m-3 105 ml-1 mg m-3
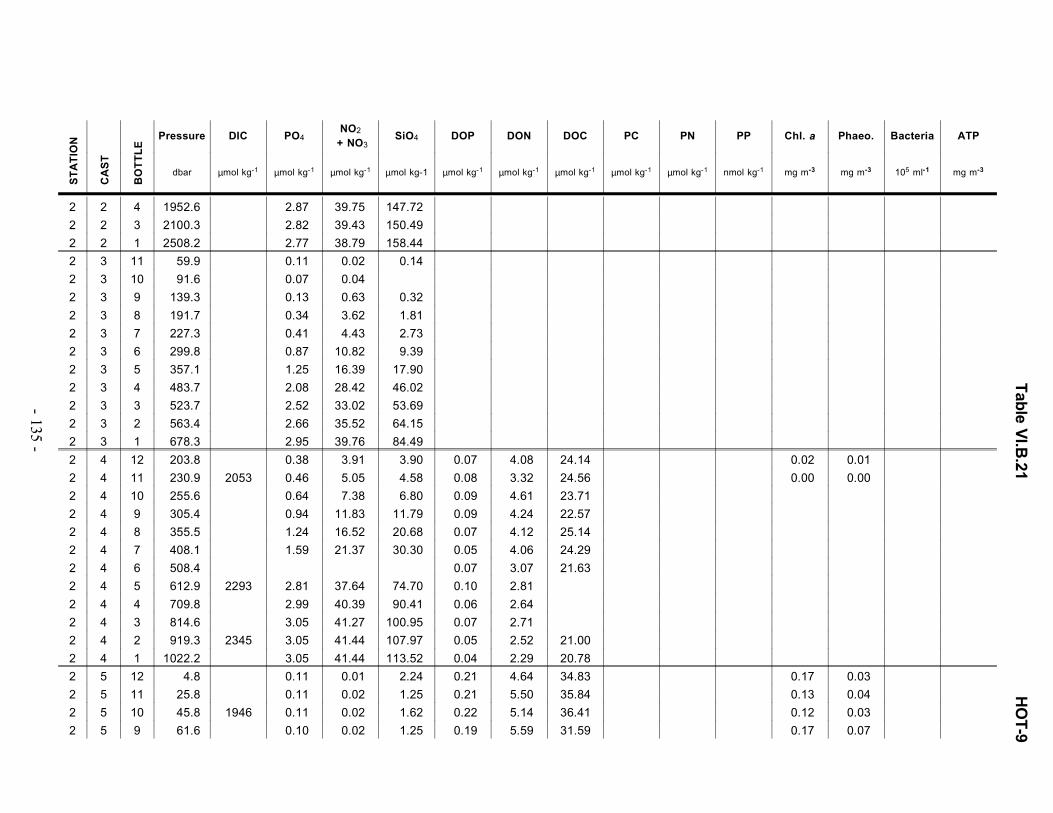
2 2 4 1952.6 2.87 39.75 147.72
2 2 3 2100.3 2.82 39.43 150.49
2 2 1 2508.2 2.77 38.79 158.44
2 3 11 59.9 0.11 0.02 0.14
2 3 10 91.6 0.07 0.04
2 3 9 139.3 0.13 0.63 0.32
2 3 8 191.7 0.34 3.62 1.81
2 3 7 227.3 0.41 4.43 2.73
2 3 6 299.8 0.87 10.82 9.39
2 3 5 357.1 1.25 16.39 17.90
2 3 4 483.7 2.08 28.42 46.02
2 3 3 523.7 2.52 33.02 53.69
2 3 2 563.4 2.66 35.52 64.15
2 3 1 678.3 2.95 39.76 84.49
2 4 12 203.8 0.38 3.91 3.90 0.07 4.08 24.14 0.02 0.01
2 4 11 230.9 2053 0.46 5.05 4.58 0.08 3.32 24.56 0.00 0.00
2 4 10 255.6 0.64 7.38 6.80 0.09 4.61 23.71
2 4 9 305.4 0.94 11.83 11.79 0.09 4.24 22.57
2 4 8 355.5 1.24 16.52 20.68 0.07 4.12 25.14
2 4 7 408.1 1.59 21.37 30.30 0.05 4.06 24.29
2 4 6 508.4 0.07 3.07 21.63
2 4 5 612.9 2293 2.81 37.64 74.70 0.10 2.81
2 4 4 709.8 2.99 40.39 90.41 0.06 2.64
2 4 3 814.6 3.05 41.27 100.95 0.07 2.71
2 4 2 919.3 2345 3.05 41.44 107.97 0.05 2.52 21.00
2 4 1 1022.2 3.05 41.44 113.52 0.04 2.29 20.78
2 5 12 4.8 0.11 0.01 2.24 0.21 4.64 34.83 0.17 0.03
2 5 11 25.8 0.11 0.02 1.25 0.21 5.50 35.84 0.13 0.04
2 5 10 45.8 1946 0.11 0.02 1.62 0.22 5.14 36.41 0.12 0.03
2 5 9 61.6 0.10 0.02 1.25 0.19 5.59 31.59 0.17 0.07
- 135 -
Table V
I.B.21
HO
T-9
ST
AT
ION
CA
ST
BO
TT
LE
Pressure DIC PO4NO2
+ NO3SiO4 DOP DON DOC PC PN PP Chl. a Phaeo. Bacteria ATP
dbar µmol kg-1 µmol kg-1 µmol kg-1 µmol kg-1 µmol kg-1 µmol kg-1 µmol kg-1 µmol kg-1 µmol kg-1 nmol kg-1 mg m-3 mg m-3 105 ml-1 mg m-3

2 5 8 76.1 1974 0.08 0.02 1.25 0.21 6.63 29.93 0.25 0.17
2 5 7 87.3 0.07 0.00 0.88 0.18 5.14 29.85 0.34 0.28
2 5 6 97.4 0.06 0.01 1.06 0.18 4.94 31.00 0.31 0.32
2 5 5 109.0 0.06 0.02 1.25 0.18 5.51 29.22 0.32 0.33
2 5 4 118.0 1990 0.06 0.04 1.25 0.19 5.21 28.13 0.25 0.32
2 5 3 130.5 0.07 0.13 1.06 0.15 4.81 26.56 0.19 0.03
2 5 2 157.0 0.14 0.91 1.71 0.13 4.35 27.55 0.01 0.02
2 5 1 181.8 2044 0.27 2.75 2.35 0.11 3.97 27.41 0.00 0.01
2 12 12 128.4 1.86 15.98
2 12 11 181.1 7.43
2 12 10 181.1 1.10
2 12 9 181.0 5.57
2 12 8 257.9 0.41
2 12 7 511.1 3.73
2 12 6 510.2 0.33
2 12 5 760.1 1.18
2 12 4 760.0 0.18
2 12 2 1020.1 0.20 0.64
2 12 1 1020.3 0.72
2 13 9 3.6 23.78
2 13 8 27.0 38.91
2 13 7 46.7 41.58
2 13 6 78.2 33.82
2 13 5 105.8 22.37
2 13 4 130.7 14.84
2 13 3 157.8 9.33
2 18 12 6.1 1.96 0.317
2 18 11 26.3 2.10 0.348
2 18 10 46.9 1.78 0.310
2 18 9 77.2 1.62 0.284
- 136 -
HO
T-9 Tab
le VI.B
.21
ST
AT
ION
CA
ST
BO
TT
LE
Pressure DIC PO4NO2
+ NO3SiO4 DOP DON DOC PC PN PP Chl. a Phaeo. Bacteria ATP
dbar µmol kg-1 µmol kg-1 µmol kg-1 µmol kg-1 µmol kg-1 µmol kg-1 µmol kg-1 µmol kg-1 µmol kg-1 nmol kg-1 mg m-3 mg m-3 105 ml-1 mg m-3
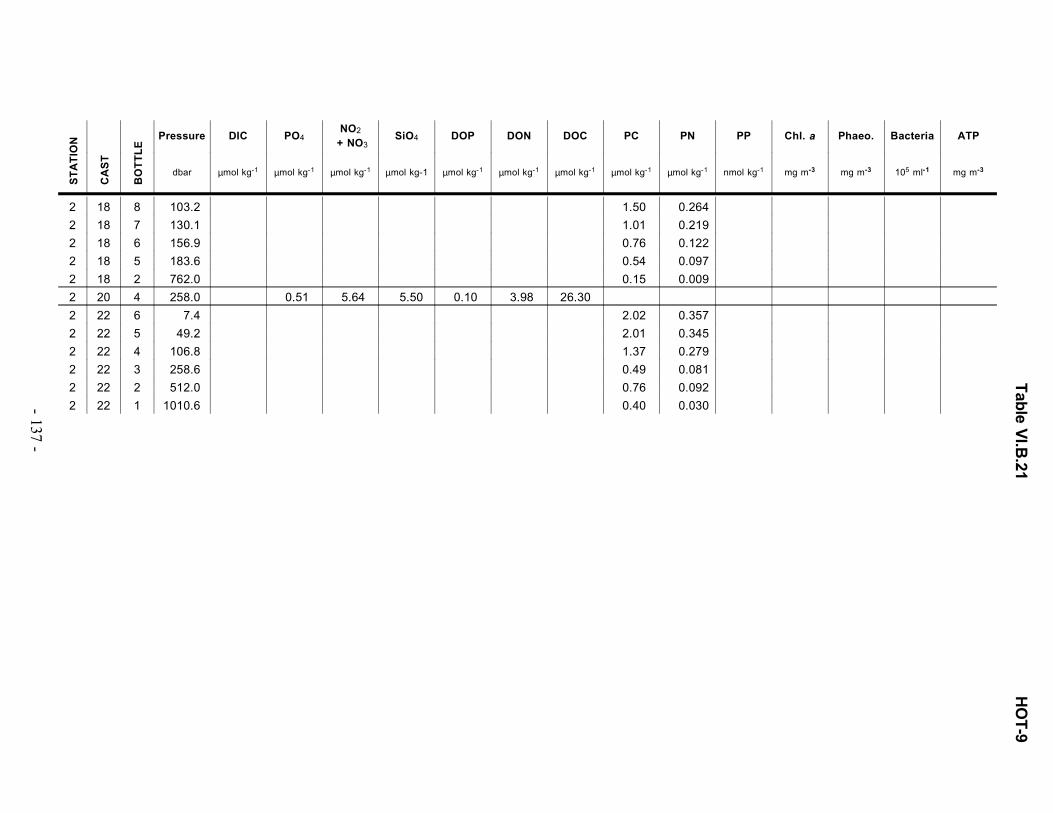
2 18 8 103.2 1.50 0.264
2 18 7 130.1 1.01 0.219
2 18 6 156.9 0.76 0.122
2 18 5 183.6 0.54 0.097
2 18 2 762.0 0.15 0.009
2 20 4 258.0 0.51 5.64 5.50 0.10 3.98 26.30
2 22 6 7.4 2.02 0.357
2 22 5 49.2 2.01 0.345
2 22 4 106.8 1.37 0.279
2 22 3 258.6 0.49 0.081
2 22 2 512.0 0.76 0.092
2 22 1 1010.6 0.40 0.030- 137 -
Table V
I.B.21
HO
T-9
ST
AT
ION
CA
ST
BO
TT
LE
Pressure DIC PO4NO2
+ NO3SiO4 DOP DON DOC PC PN PP Chl. a Phaeo. Bacteria ATP
dbar µmol kg-1 µmol kg-1 µmol kg-1 µmol kg-1 µmol kg-1 µmol kg-1 µmol kg-1 µmol kg-1 µmol kg-1 nmol kg-1 mg m-3 mg m-3 105 ml-1 mg m-3

1 1 23 21.4 0.08 0.03 2.40
1 1 21 70.1 0.09 0.03 1.17
1 1 17 137.7 0.23 2.18 2.20
1 1 16 171.8 0.40 4.48 3.43
1 1 14 270.9 1.12 14.72 15.54
1 1 13 303.4 1.47 19.51 24.36
1 1 11 418.8 2.07 28.58 45.90
1 1 9 517.9 2.56 35.14 65.39
1 1 7 602.5 2.85 38.78 79.75
1 1 4 751.9 3.01 41.17 92.65
1 1 1 1016.2 3.04 41.98 101.06
2 2 9 45.7 23.7
2 2 8 76.4 23.3
2 2 7 129.2 11.0
2 2 6 156.6 7.9
2 2 5 182.9 7.9
2 2 4 256.3 6.3
2 2 3 508.1 2.5
2 2 2 759.9 3.5
2 2 1 1019.1 2.5
2 3 23 803.6 3.01 41.80 97.17
2 3 22 903.7 3.04 42.00 103.32
2 3 20 1103.9 3.02 41.90 105.16
2 3 18 1404.6 2.93 41.59 129.97
2 3 17 1552.7 2.92 41.48 136.13
2 3 16 1699.4 2.89 41.06 141.87
2 3 15 1851.8 2.83 40.65 146.38
2 3 14 2002.5 2356 2.79 40.23 149.04
2 3 13 2199.8 2.79 39.71 154.57
2 3 8 3189.4 2.54 37.32 156.62
- 138 -
HO
T-10 Tab
le VI.B
.22
ST
AT
ION
CA
ST
BO
TT
LE
Pressure DIC PO4NO2
+ NO3SiO4 DOP DON DOC PC PN PP Chl. a Phaeo. Bacteria ATP
dbar µmol kg-1 µmol kg-1 µmol kg-1 µmol kg-1 µmol kg-1 µmol kg-1 µmol kg-1 µmol kg-1 µmol kg-1 nmol kg-1 mg m-3 mg m-3 105 ml-1 mg m-3

2 3 7 3392.2 2.52 36.90 154.57
2 3 2 4397.2 2313 2.43 36.22 148.57
2 3 1 4525.9 2.48 36.16 149.03
2 4 24 7.2 0.09 0.05 0.76
2 4 23 86.7 0.11 0.07 0.76
2 4 22 96.6 0.08 0.05 0.56
2 4 21 108.3 0.08 0.07 0.56
2 4 20 123.4 0.13 0.14 0.76
2 4 19 132.9 0.16 0.69 0.76
2 4 18 143.8 0.33 3.19 1.79
2 4 17 182.8 0.42 4.78 2.61
2 4 16 217.7 0.54 6.45 4.66
2 4 15 274.2 0.93 12.01 9.59
2 4 14 285.2 0.95 12.18 10.00
2 4 13 303.2 0.92 12.84 11.02
2 4 12 345.0 1.21 16.53 17.80
2 4 11 404.4 1.67 22.63 28.46
2 4 10 465.2 2.17 29.51 45.49
2 4 9 489.7 2.37 32.53 53.70
2 4 8 509.3 2.48 33.99 59.23
2 4 7 538.1 2.70 36.80 67.44
2 4 6 601.6 2.87 39.41 78.73
2 4 5 674.8 2.97 40.44 83.85
2 4 3 814.9 3.04 41.69 97.17
2 4 2 994.8 3.05 41.95 107.42
2 4 1 1023.5 3.04 41.90 110.50
2 8 12 5.8 27.93
2 8 11 25.8 44.60
2 8 10 48.3 57.78
2 8 9 78.1 41.08
- 139 -
Table V
I.B.22
HO
T-10
ST
AT
ION
CA
ST
BO
TT
LE
Pressure DIC PO4NO2
+ NO3SiO4 DOP DON DOC PC PN PP Chl. a Phaeo. Bacteria ATP
dbar µmol kg-1 µmol kg-1 µmol kg-1 µmol kg-1 µmol kg-1 µmol kg-1 µmol kg-1 µmol kg-1 µmol kg-1 nmol kg-1 mg m-3 mg m-3 105 ml-1 mg m-3

2 8 8 105.0 23.09
2 8 7 130.0 16.74
2 8 6 156.8 9.31
2 8 5 182.4 6.44
2 8 4 258.1 5.13
2 8 3 511.3 4.10
2 8 2 750.4 1.47
2 8 1 1020.6 1.12
2 12 23 6.3 1944 0.06 0.07 1.17 0.22 5.15 37.66 0.10 0.02
2 12 22 26.5 0.06 0.05 0.76 0.21 5.72 36.40 0.02
2 12 21 47.5 1949 0.06 0.03 0.97 0.21 5.28 52.78 0.15 0.01
2 12 20 63.2 0.06 0.03 0.56 0.21 6.04 44.22 0.09 0.03
2 12 19 79.0 0.06 0.03 0.56 0.20 5.85 34.31 0.07 0.00
2 12 18 89.1 0.25 0.08
2 12 17 98.6 0.06 0.04 1.10 0.19 5.16 35.28 0.44 0.05
2 12 16 111.2 0.09 0.07 0.56 0.17 4.66 34.86 0.31 0.30
2 12 15 119.9 1998 0.17 0.38 0.97 0.13 4.95 31.22 0.26 0.29
2 12 14 131.7 0.19 0.93 1.17 0.15 4.50 32.20 0.20 0.28
2 12 13 157.5 0.47 5.29 3.02 0.98 4.36 23.30 0.05 0.07
2 12 12 182.1 0.48 5.53 3.84 0.11 4.26 25.66 0.02 0.02
2 12 11 206.7 0.51 5.95 5.07 0.09 4.01 28.82 0.01 0.02
2 12 10 231.7 2059 0.50 5.86 4.25 0.08 3.74 27.33
2 12 9 257.6 0.66 8.16 7.33 0.09 4.17 23.77
2 12 8 282.5 0.88 11.34 10.61 0.10 4.13 25.69
2 12 7 307.4 1.03 13.57 13.69 0.11 5.12 32.46
2 12 6 330.9 1.17 15.55 16.15 0.09 4.30 26.58
2 12 5 356.0 1.27 17.01 22.17 0.07 4.11 23.01
2 12 4 384.0 1.54 20.33 24.98 0.07 3.81 23.27
2 12 2 461.3 2.05 28.58 45.49 0.08 3.11 24.29
2 12 1 511.9 2.44 33.37 57.18 0.07 2.97 22.50
- 140 -
HO
T-10 Tab
le VI.B
.22
ST
AT
ION
CA
ST
BO
TT
LE
Pressure DIC PO4NO2
+ NO3SiO4 DOP DON DOC PC PN PP Chl. a Phaeo. Bacteria ATP
dbar µmol kg-1 µmol kg-1 µmol kg-1 µmol kg-1 µmol kg-1 µmol kg-1 µmol kg-1 µmol kg-1 µmol kg-1 nmol kg-1 mg m-3 mg m-3 105 ml-1 mg m-3

2 13 5 610.8 2.85 38.68 75.64 0.08 2.72 25.69
2 13 4 709.5 3.00 40.66 86.91 0.04 2.10 22.00
2 13 3 810.7 3.03 41.38 94.09 0.05 2.28 24.33
2 13 2 910.8 3.05 41.80 100.86 0.02 2.33 23.29
2 13 1 1018.7 2387 3.04 41.80 108.45 0.04 1.99 21.94
2 15 9 27.7 2.32
2 15 8 47.4 2.35
2 15 7 78.0 2.36 0.398
2 15 6 104.1 1.81 0.237
2 15 5 155.7 1.11 0.174
2 15 4 181.0 0.82 0.091
2 15 3 257.8 0.74 0.091
2 15 2 510.3 0.46 0.049
2 15 1 752.0 0.37 0.035
- 141 -
Table V
I.B.22
HO
T-10
ST
AT
ION
CA
ST
BO
TT
LE
Pressure DIC PO4NO2
+ NO3SiO4 DOP DON DOC PC PN PP Chl. a Phaeo. Bacteria ATP
dbar µmol kg-1 µmol kg-1 µmol kg-1 µmol kg-1 µmol kg-1 µmol kg-1 µmol kg-1 µmol kg-1 µmol kg-1 nmol kg-1 mg m-3 mg m-3 105 ml-1 mg m-3

1 1 23 7.4 0.08 0.75 0.09 0.02
1 1 22 27.2 0.08 0.95 0.13 0.04
1 1 21 47.3 0.08 0.95 0.25 0.08
1 1 20 63.0 0.06 0.95 0.24 0.13
1 1 19 77.3 0.29 0.26
1 1 18 98.0 0.17 1.01 1.36 0.23 0.26
1 1 17 108.5 0.27 2.44 1.95 0.10 0.13
1 1 16 118.5 0.30 2.86 2.35 0.06 0.10
1 1 15 129.4 0.34 3.37 2.75 0.04 0.07
1 1 14 154.5 0.39 4.14 3.36 0.02 0.07
1 1 12 205.9 0.67 8.10 6.97 0.00 0.03
1 1 11 231.4 0.82 10.12 9.17
1 1 10 260.0 0.97 12.15 11.38
1 1 9 308.9 1.44 18.76 22.22
1 1 8 357.3 1.65 21.98 27.23
1 1 7 405.8 1.95 26.42 37.27
1 1 6 507.4 2.61 35.35 63.36
1 1 5 598.0 2.84 38.80 78.41
1 1 4 704.5 2.98 40.58 89.43
1 1 2 920.2 3.01 41.41 103.47
1 1 1 1011.9 3.01 41.40 110.09
2 1 13 0.3 23.0
2 1 12 25.2 20.2
2 1 11 45.1 23.0
2 1 10 74.2 16.7
2 1 9 102.4 6.9
2 1 8 129.2 14.5
2 1 7 155.4 6.0
2 1 6 179.6 5.7
2 1 5 252.8 4.4
- 142 -
HO
T-11Tab
le VI.B
.23
ST
AT
ION
CA
ST
BO
TT
LE
Pressure DIC PO4NO2
+ NO3SiO4 DOP DON DOC PC PN PP Chl. a Phaeo. Bacteria ATP
dbar µmol kg-1 µmol kg-1 µmol kg-1 µmol kg-1 µmol kg-1 µmol kg-1 µmol kg-1 µmol kg-1 µmol kg-1 nmol kg-1 mg m-3 mg m-3 105 ml-1 mg m-3

2 1 4 504.6 5.4
2 1 2 760.8 0.0
2 1 1 1019.8 1.9
2 2 23 801.0 3.07 41.77 96.46
2 2 22 900.6 3.04 41.89 101.46
2 2 21 1000.7 3.04 41.88 101.46
2 2 20 1099.7 3.03 41.88 111.49
2 2 19 1249.7 41.88 111.49
2 2 18 1397.8 2.99 41.53 127.14
2 2 17 1548.1 2.96 41.29 133.56
2 2 16 1697.9 2.92 40.82 139.17
2 2 15 1849.0 2.89 40.57 146.20
2 2 14 1999.8 40.57 146.19
2 2 13 2200.2 2.80 39.62 154.61
2 2 12 2401.2 2.77 39.03 157.22
2 2 11 2602.1 2.75 39.03 158.62
2 2 10 2796.7 2.68 38.31 159.62
2 2 9 2995.2 37.72 157.79
2 2 8 3198.3 2.60 37.24 155.21
2 2 7 3396.1 2.56 36.77 155.21
2 2 6 3590.9 2.53 36.52 153.20
2 2 5 3792.2 2.52 36.29 150.59
2 2 3 4204.5 2.50 35.93 149.59
2 2 2 4406.4 35.81 141.16
2 2 1 4603.9 35.81 148.59
2 3 23 9.5 0.06 8.58
2 3 22 26.3 0.05 0.15
2 3 20 78.9 0.03 4.96
2 3 19 118.1 0.03 0.01 0.35
2 3 18 133.3 0.06 0.18 0.35
- 143 -
Table V
I.B.23
HO
T-11
ST
AT
ION
CA
ST
BO
TT
LE
Pressure DIC PO4NO2
+ NO3SiO4 DOP DON DOC PC PN PP Chl. a Phaeo. Bacteria ATP
dbar µmol kg-1 µmol kg-1 µmol kg-1 µmol kg-1 µmol kg-1 µmol kg-1 µmol kg-1 µmol kg-1 µmol kg-1 nmol kg-1 mg m-3 mg m-3 105 ml-1 mg m-3

2 3 17 198.5 0.24 2.63 1.76
2 3 16 246.1 0.37 4.43 3.36
2 3 15 296.3 0.60 7.70 7.38
2 3 14 330.3 0.74 9.89 9.18
2 3 13 380.8 1.05 14.48 15.60
2 3 12 441.5 1.36 19.03 23.93
2 3 11 487.8 1.75 24.65 36.28
2 3 9 552.8 2.35 32.38 55.34
2 3 8 591.9 2.70 36.78 68.99
2 3 7 642.9 2.92 39.52 81.02
2 3 6 687.0 3.03 40.94 99.08
2 3 5 747.3 3.07 41.65 95.05
2 3 4 802.6 3.07 41.54 95.45
2 3 3 867.0 3.08 41.77 99.06
2 3 1 1012.4 3.08 41.88 105.48
2 8 12 5.7 23.34
2 8 11 25.6 34.74
2 8 10 45.3 27.47
2 8 9 77.1 24.35
2 8 8 101.8 16.12
2 8 7 130.2 9.29
2 8 6 155.2 5.10
2 8 5 180.0 5.58
2 8 4 258.6 4.08
2 8 3 507.2 1.01
2 8 2 756.2 0.52
2 8 1 1027.6 0.48
2 16 17 4.8 1951 0.08 0.01 1.76 0.19 5.81 35.00 0.08 0.06
2 16 16 25.5 1952 0.06 0.04 1.55 0.18 5.66 36.63 0.10 0.05
2 16 15 45.4 0.06 0.01 2.75 0.19 5.66 39.06 0.13 0.06
- 144 -
HO
T-11Tab
le VI.B
.23
ST
AT
ION
CA
ST
BO
TT
LE
Pressure DIC PO4NO2
+ NO3SiO4 DOP DON DOC PC PN PP Chl. a Phaeo. Bacteria ATP
dbar µmol kg-1 µmol kg-1 µmol kg-1 µmol kg-1 µmol kg-1 µmol kg-1 µmol kg-1 µmol kg-1 µmol kg-1 nmol kg-1 mg m-3 mg m-3 105 ml-1 mg m-3
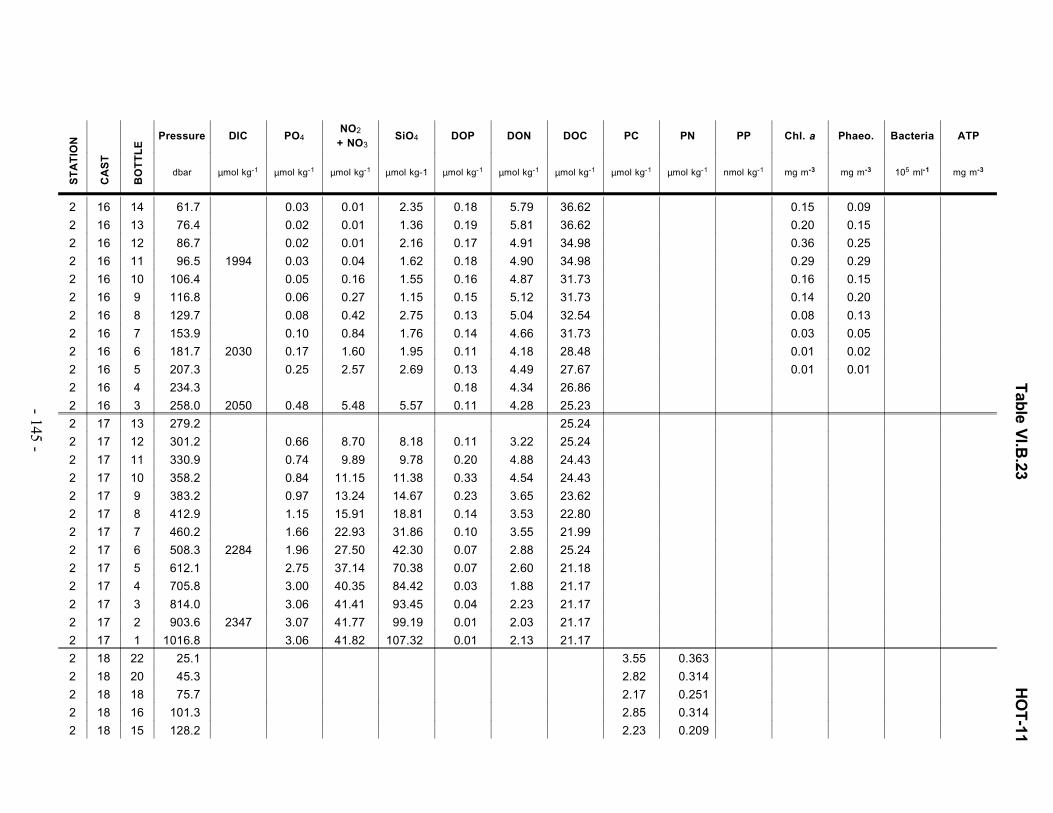
2 16 14 61.7 0.03 0.01 2.35 0.18 5.79 36.62 0.15 0.09
2 16 13 76.4 0.02 0.01 1.36 0.19 5.81 36.62 0.20 0.15
2 16 12 86.7 0.02 0.01 2.16 0.17 4.91 34.98 0.36 0.25
2 16 11 96.5 1994 0.03 0.04 1.62 0.18 4.90 34.98 0.29 0.29
2 16 10 106.4 0.05 0.16 1.55 0.16 4.87 31.73 0.16 0.15
2 16 9 116.8 0.06 0.27 1.15 0.15 5.12 31.73 0.14 0.20
2 16 8 129.7 0.08 0.42 2.75 0.13 5.04 32.54 0.08 0.13
2 16 7 153.9 0.10 0.84 1.76 0.14 4.66 31.73 0.03 0.05
2 16 6 181.7 2030 0.17 1.60 1.95 0.11 4.18 28.48 0.01 0.02
2 16 5 207.3 0.25 2.57 2.69 0.13 4.49 27.67 0.01 0.01
2 16 4 234.3 0.18 4.34 26.86
2 16 3 258.0 2050 0.48 5.48 5.57 0.11 4.28 25.23
2 17 13 279.2 25.24
2 17 12 301.2 0.66 8.70 8.18 0.11 3.22 25.24
2 17 11 330.9 0.74 9.89 9.78 0.20 4.88 24.43
2 17 10 358.2 0.84 11.15 11.38 0.33 4.54 24.43
2 17 9 383.2 0.97 13.24 14.67 0.23 3.65 23.62
2 17 8 412.9 1.15 15.91 18.81 0.14 3.53 22.80
2 17 7 460.2 1.66 22.93 31.86 0.10 3.55 21.99
2 17 6 508.3 2284 1.96 27.50 42.30 0.07 2.88 25.24
2 17 5 612.1 2.75 37.14 70.38 0.07 2.60 21.18
2 17 4 705.8 3.00 40.35 84.42 0.03 1.88 21.17
2 17 3 814.0 3.06 41.41 93.45 0.04 2.23 21.17
2 17 2 903.6 2347 3.07 41.77 99.19 0.01 2.03 21.17
2 17 1 1016.8 3.06 41.82 107.32 0.01 2.13 21.17
2 18 22 25.1 3.55 0.363
2 18 20 45.3 2.82 0.314
2 18 18 75.7 2.17 0.251
2 18 16 101.3 2.85 0.314
2 18 15 128.2 2.23 0.209
- 145 -
Table V
I.B.23
HO
T-11
ST
AT
ION
CA
ST
BO
TT
LE
Pressure DIC PO4NO2
+ NO3SiO4 DOP DON DOC PC PN PP Chl. a Phaeo. Bacteria ATP
dbar µmol kg-1 µmol kg-1 µmol kg-1 µmol kg-1 µmol kg-1 µmol kg-1 µmol kg-1 µmol kg-1 µmol kg-1 nmol kg-1 mg m-3 mg m-3 105 ml-1 mg m-3

2 18 12 155.6 1.11 0.105
2 18 10 183.2 1.05 0.119
2 18 8 260.8 0.68 0.077
2 18 6 509.3 0.72 0.056
2 18 4 751.1 0.59 0.063
2 18 1 1012.7 0.78 0.063
- 146 -
HO
T-11Tab
le VI.B
.23
ST
AT
ION
CA
ST
BO
TT
LE
Pressure DIC PO4NO2
+ NO3SiO4 DOP DON DOC PC PN PP Chl. a Phaeo. Bacteria ATP
dbar µmol kg-1 µmol kg-1 µmol kg-1 µmol kg-1 µmol kg-1 µmol kg-1 µmol kg-1 µmol kg-1 µmol kg-1 nmol kg-1 mg m-3 mg m-3 105 ml-1 mg m-3

2 2 23 898.9 3.06 42.12 105.45
2 2 22 998.3 3.04 42.00 112.16
2 2 21 1098.2 3.03 41.88 117.61
2 2 20 1244.8 3.02 41.53 124.87
2 2 18 1550.8 2.92 40.93 138.48
2 2 17 1698.2 2.87 40.58 143.02
2 2 16 1850.9 2.85 40.23 145.73
2 2 14 2200.2 2.78 39.47 154.18
2 2 13 2401.9 2.75 39.06 156.62
2 2 12 2597.7 2.73 38.59 161.16
2 2 11 2796.5 2.66 38.23 159.35
2 2 10 2998.6 2348 2.61 37.65 157.17
2 2 9 3200.2 2.58 37.29 156.62
2 2 8 3392.1 2.55 36.93 155.72
2 2 7 3595.0 2.53 36.58 152.99
2 2 6 3799.5 2.51 36.29 152.36
2 2 5 3993.2 2336 2.50 36.11 150.82
2 2 4 4197.3 2.50 36.00 148.09
2 2 3 4390.6 2.49 36.00 148.45
2 2 2 4491.9 2.46 35.88 147.54
2 2 1 4694.5 2.49 35.76 147.54
2 3 22 30.6 0.08 0.04 0.68
2 3 21 56.4 0.07 0.01 0.14
2 3 20 80.0 0.07 0.04 0.50
2 3 19 99.3 0.10 0.06 0.32
2 3 18 121.6 0.11 0.41 0.50
2 3 17 147.2 0.19 1.35 0.86
2 3 15 226.9 0.40 4.70 3.77
2 3 14 299.8 0.88 11.72 11.39
2 3 13 342.7 1.16 15.91 17.76
- 147 -
Table V
I.B.24
HO
T-12
ST
AT
ION
CA
ST
BO
TT
LE
Pressure DIC PO4NO2
+ NO3SiO4 DOP DON DOC PC PN PP Chl. a Phaeo. Bacteria ATP
dbar µmol kg-1 µmol kg-1 µmol kg-1 µmol kg-1 µmol kg-1 µmol kg-1 µmol kg-1 µmol kg-1 µmol kg-1 nmol kg-1 mg m-3 mg m-3 105 ml-1 mg m-3

2 3 12 407.0 1.59 21.90 29.56
2 3 11 437.0 1.69 23.55 33.19
2 3 10 467.1 1.87 26.38 40.46
2 3 9 505.2 2.20 30.61 51.36
2 3 8 569.9 2.70 36.83 70.06
2 3 7 598.9 2.79 38.02 74.60
2 3 6 621.4 2.87 38.84 78.59
2 3 5 689.9 3.00 40.59 88.21
2 3 4 763.1 3.08 41.83 97.65
2 3 3 825.6 3.10 42.24 98.19
2 3 2 905.9 3.08 42.24 102.99
2 3 1 1023.0 3.07 42.12 107.63
2 5 12 4.6 27.79
2 5 11 26.6 26.63
2 5 10 47.4 34.89
2 5 9 78.0 23.18
2 5 8 104.0 17.07
2 5 7 129.0 10.94
2 5 6 155.2 9.11
2 5 5 179.9 6.68
2 5 4 254.3 2.61
2 5 3 508.5 0.93
2 5 2 760.8 0.67
2 5 1 1012.1 0.51
2 6 13 5.8 1951 0.08 0.01 1.04 0.19 5.40 29.49 0.10 0.03
2 6 12 25.3 1959 0.07 0.04 1.23 0.19 5.50 30.85 0.12 0.03
2 6 11 45.6 0.07 0.01 2.14 0.19 5.20 28.31 0.13 0.03
2 6 10 61.6 0.11 0.01 0.68 0.57 6.69 26.64 0.18 0.05
2 6 9 76.5 1962 0.07 0.01 1.23 0.20 5.65 24.32 0.25 0.13
2 6 8 86.6 0.08 0.01 1.23 0.18 5.11 25.34 0.30 0.26
- 148 -
HO
T-12Tab
le VI.B
.24
ST
AT
ION
CA
ST
BO
TT
LE
Pressure DIC PO4NO2
+ NO3SiO4 DOP DON DOC PC PN PP Chl. a Phaeo. Bacteria ATP
dbar µmol kg-1 µmol kg-1 µmol kg-1 µmol kg-1 µmol kg-1 µmol kg-1 µmol kg-1 µmol kg-1 µmol kg-1 nmol kg-1 mg m-3 mg m-3 105 ml-1 mg m-3
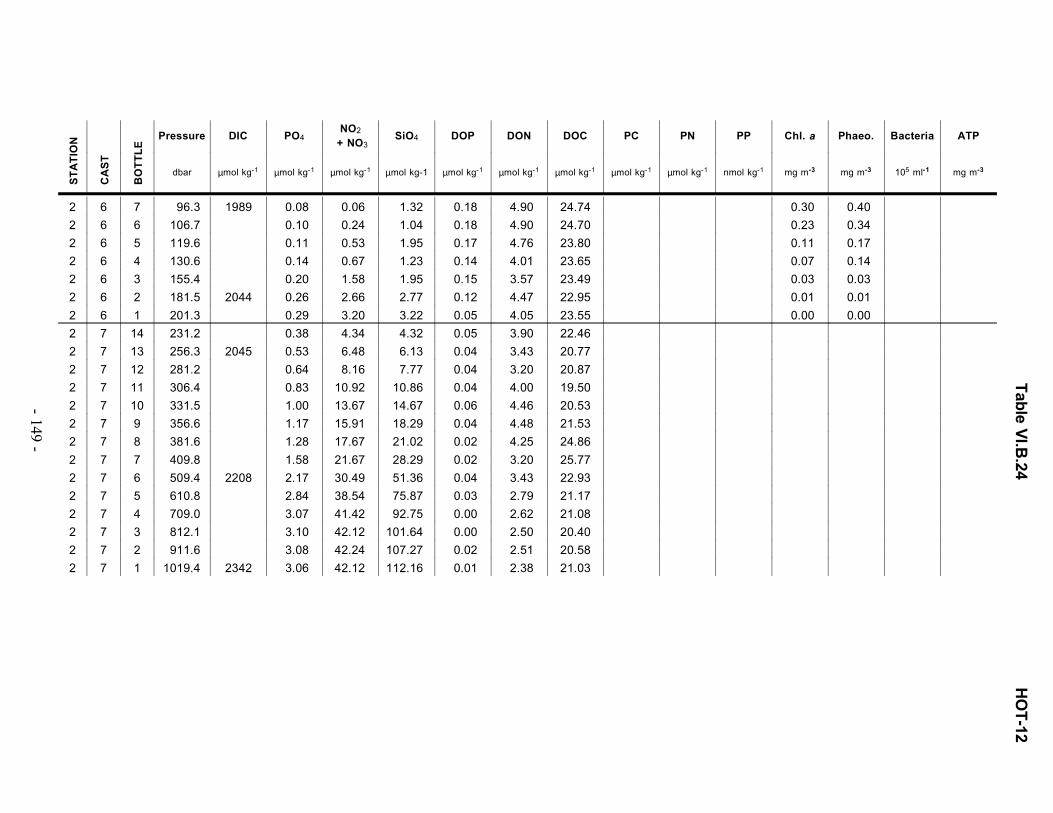
2 6 7 96.3 1989 0.08 0.06 1.32 0.18 4.90 24.74 0.30 0.40
2 6 6 106.7 0.10 0.24 1.04 0.18 4.90 24.70 0.23 0.34
2 6 5 119.6 0.11 0.53 1.95 0.17 4.76 23.80 0.11 0.17
2 6 4 130.6 0.14 0.67 1.23 0.14 4.01 23.65 0.07 0.14
2 6 3 155.4 0.20 1.58 1.95 0.15 3.57 23.49 0.03 0.03
2 6 2 181.5 2044 0.26 2.66 2.77 0.12 4.47 22.95 0.01 0.01
2 6 1 201.3 0.29 3.20 3.22 0.05 4.05 23.55 0.00 0.00
2 7 14 231.2 0.38 4.34 4.32 0.05 3.90 22.46
2 7 13 256.3 2045 0.53 6.48 6.13 0.04 3.43 20.77
2 7 12 281.2 0.64 8.16 7.77 0.04 3.20 20.87
2 7 11 306.4 0.83 10.92 10.86 0.04 4.00 19.50
2 7 10 331.5 1.00 13.67 14.67 0.06 4.46 20.53
2 7 9 356.6 1.17 15.91 18.29 0.04 4.48 21.53
2 7 8 381.6 1.28 17.67 21.02 0.02 4.25 24.86
2 7 7 409.8 1.58 21.67 28.29 0.02 3.20 25.77
2 7 6 509.4 2208 2.17 30.49 51.36 0.04 3.43 22.93
2 7 5 610.8 2.84 38.54 75.87 0.03 2.79 21.17
2 7 4 709.0 3.07 41.42 92.75 0.00 2.62 21.08
2 7 3 812.1 3.10 42.12 101.64 0.00 2.50 20.40
2 7 2 911.6 3.08 42.24 107.27 0.02 2.51 20.58
2 7 1 1019.4 2342 3.06 42.12 112.16 0.01 2.38 21.03
- 149 -
Table V
I.B.24
HO
T-12
ST
AT
ION
CA
ST
BO
TT
LE
Pressure DIC PO4NO2
+ NO3SiO4 DOP DON DOC PC PN PP Chl. a Phaeo. Bacteria ATP
dbar µmol kg-1 µmol kg-1 µmol kg-1 µmol kg-1 µmol kg-1 µmol kg-1 µmol kg-1 µmol kg-1 µmol kg-1 nmol kg-1 mg m-3 mg m-3 105 ml-1 mg m-3

Table VI.B.25
- 150 -
Precision of Winkler Titration
HOTCRUISE CV(%)a Nb
1 NDd -2 0.28 43 0.14 34 0.30 105 0.07 126 NDd -7 NDd -8 0.19 49 0.05 6
10c 0.58 311c 0.16 312c 0.21 5
a - Coefficient of variation expressed as the difference between replicates as a percentage of the meanwhen duplicate samples were collected, and as the standard deviation as a percentage of the meanfor samples collected in triplicate.
b - Number of depths from which replicates were collected. Only replicates from depth where 02concentrations exceed 100 umol kg-1 were included in this analysis.
c - Triplicates were collected at each depth. On all other cruises duplicates were analyzed.
d - No replicate samples were collected on HOT-1. Equipment problems prevented replicate samplecollection on HOT-6 and HOT-7.

Table VI.B.26
- 151 -
Precision of Dissolved Nutrient Analysis
Phosphorus Nitrate + Nitrite SilicaHOTCRUISE Analyticala Fieldb Analytical Field Analytical Field
1 0.4 - 0.4 - 0.3 -2 0.1 - 0.2 - 0.6 -3 0.2 1.6 0.8 - 0.4 0.04 0.4 1.0 0.3 1.1 0.4 3.35 0.1 - 0.2 - 0.1 -6 0.4 - 0.3 - 1.3 -7 0.3 2.0 0.6 0.1 0.5 3.58 0.2 0.8 0.2 0.2 1.2 8.99 0.1 1.1 0.2 0.0 0.3 7.510 0.7 0.4 0.2 0.2 0.8 3.911 0.4 0.2 0.2 0.1 0.1 10.012 0.4 0.2 0.3 0.0 0.9 -
a - Average coefficient of variation (standard deviation as a percentage of the mean) for analyticalreplicates (i.e., replicate analysis of a single sample).
b - Average coefficient of variation (standard deviation as a percentage of the mean) for field replicates(i.e., analysis of replicate samples from the same Niskin bottle).
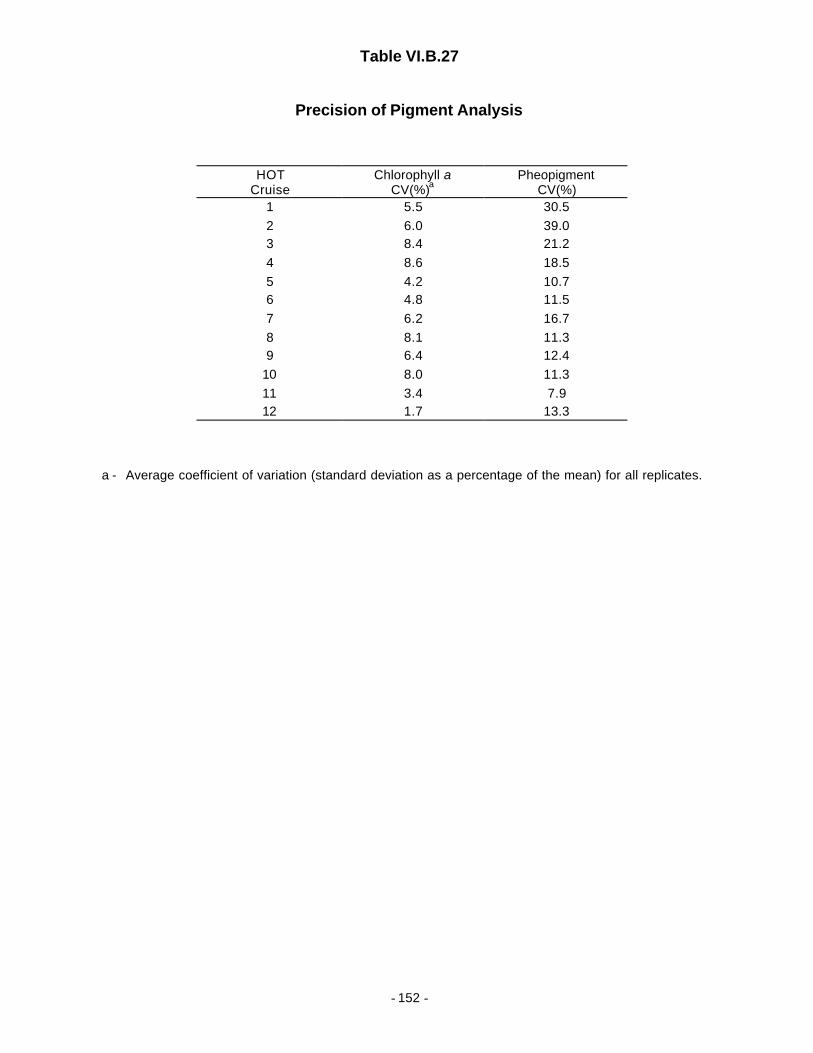
Table VI.B.27
- 152 -
Precision of Pigment Analysis
HOTCruise
Chlorophyll aCV(%)a
PheopigmentCV(%)
1 5.5 30.52 6.0 39.03 8.4 21.24 8.6 18.55 4.2 10.76 4.8 11.57 6.2 16.78 8.1 11.39 6.4 12.4
10 8.0 11.311 3.4 7.912 1.7 13.3
a - Average coefficient of variation (standard deviation as a percentage of the mean) for all replicates.

Table VI.B.28
- 153 -
HPLC Analysis of Chlorophyll a
Cruise Cast Pressure(decibar) n mean Chl a
(mg/m3)C.V.(%)
HOT-1 7 114.4 3 0.364 0.9927 68.3 3 0.272 1.817 42.9 3 0.237 0.8827 25.5 3 0.229 0.837 10.7 3 0.224 1.43
HOT-2 10 177.4 3 0.0304 2.2410 152.7 1 0.033710 126.0 1 0.1410 98.2 3 0.361 0.53210 73.0 1 0.33110 48.6 1 0.20110 22.8 1 0.20310 2.1 3 0.204 0.34
HOT-3 4 176.8 3 0.0706 8.784 146.8 1 0.1424 122.2 1 0.2454 97.7 3 0.284 0.4084 72.7 1 0.2314 43.3 1 0.2154 22.8 1 0.1994 4.9 3 0.199 0.779

VI.C. Primary Productivity
Tables VI.C.1–2: Summaries of primary production and pigment data.
- 154 -
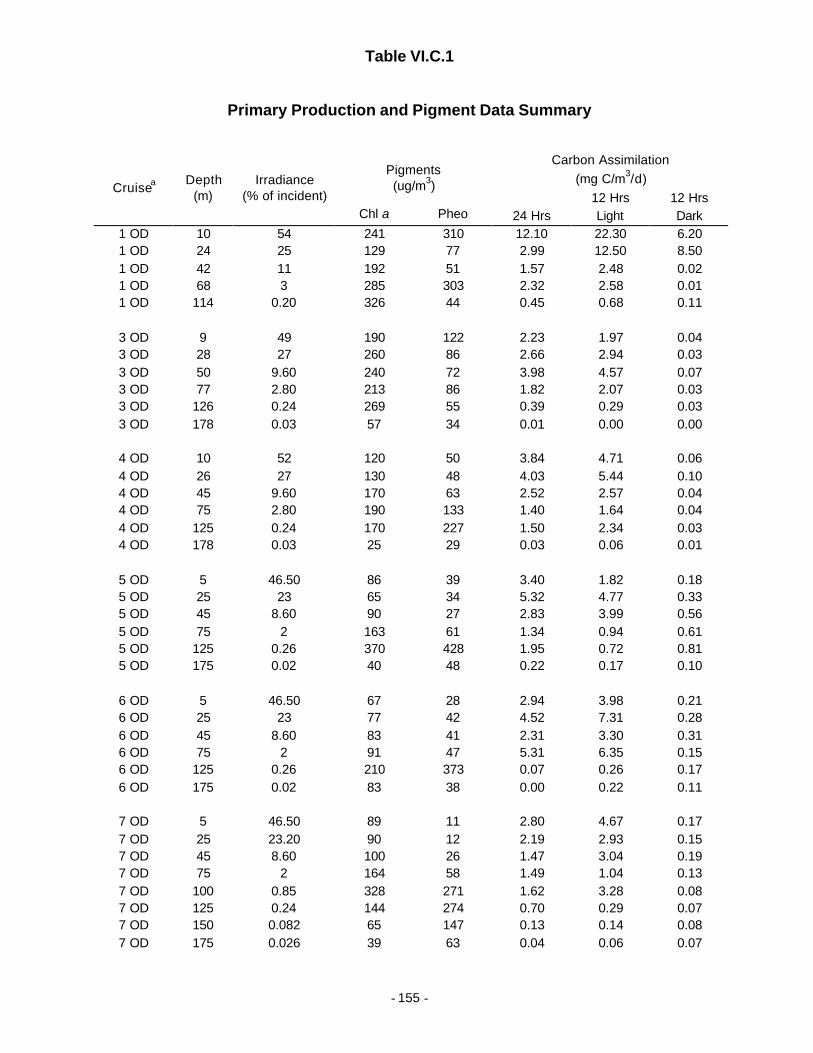
Table VI.C.1
- 155 -
Primary Production and Pigment Data Summary
Carbon Assimilation(mg C/m3/d)
Pigments(ug/m3)
rs12 Hrs 12 Hrs
Cruisea Depth(m)
Irradiance(% of incident)
Chl a Pheo 24 Hrs Light Dark1 OD 10 54 241 310 12.10 22.30 6.201 OD 24 25 129 77 2.99 12.50 8.501 OD 42 11 192 51 1.57 2.48 0.021 OD 68 3 285 303 2.32 2.58 0.011 OD 114 0.20 326 44 0.45 0.68 0.11
3 OD 9 49 190 122 2.23 1.97 0.043 OD 28 27 260 86 2.66 2.94 0.033 OD 50 9.60 240 72 3.98 4.57 0.073 OD 77 2.80 213 86 1.82 2.07 0.033 OD 126 0.24 269 55 0.39 0.29 0.033 OD 178 0.03 57 34 0.01 0.00 0.00
4 OD 10 52 120 50 3.84 4.71 0.064 OD 26 27 130 48 4.03 5.44 0.104 OD 45 9.60 170 63 2.52 2.57 0.044 OD 75 2.80 190 133 1.40 1.64 0.044 OD 125 0.24 170 227 1.50 2.34 0.034 OD 178 0.03 25 29 0.03 0.06 0.01
5 OD 5 46.50 86 39 3.40 1.82 0.185 OD 25 23 65 34 5.32 4.77 0.335 OD 45 8.60 90 27 2.83 3.99 0.565 OD 75 2 163 61 1.34 0.94 0.615 OD 125 0.26 370 428 1.95 0.72 0.815 OD 175 0.02 40 48 0.22 0.17 0.10
6 OD 5 46.50 67 28 2.94 3.98 0.216 OD 25 23 77 42 4.52 7.31 0.286 OD 45 8.60 83 41 2.31 3.30 0.316 OD 75 2 91 47 5.31 6.35 0.156 OD 125 0.26 210 373 0.07 0.26 0.176 OD 175 0.02 83 38 0.00 0.22 0.11
7 OD 5 46.50 89 11 2.80 4.67 0.177 OD 25 23.20 90 12 2.19 2.93 0.157 OD 45 8.60 100 26 1.47 3.04 0.197 OD 75 2 164 58 1.49 1.04 0.137 OD 100 0.85 328 271 1.62 3.28 0.087 OD 125 0.24 144 274 0.70 0.29 0.077 OD 150 0.082 65 147 0.13 0.14 0.087 OD 175 0.026 39 63 0.04 0.06 0.07
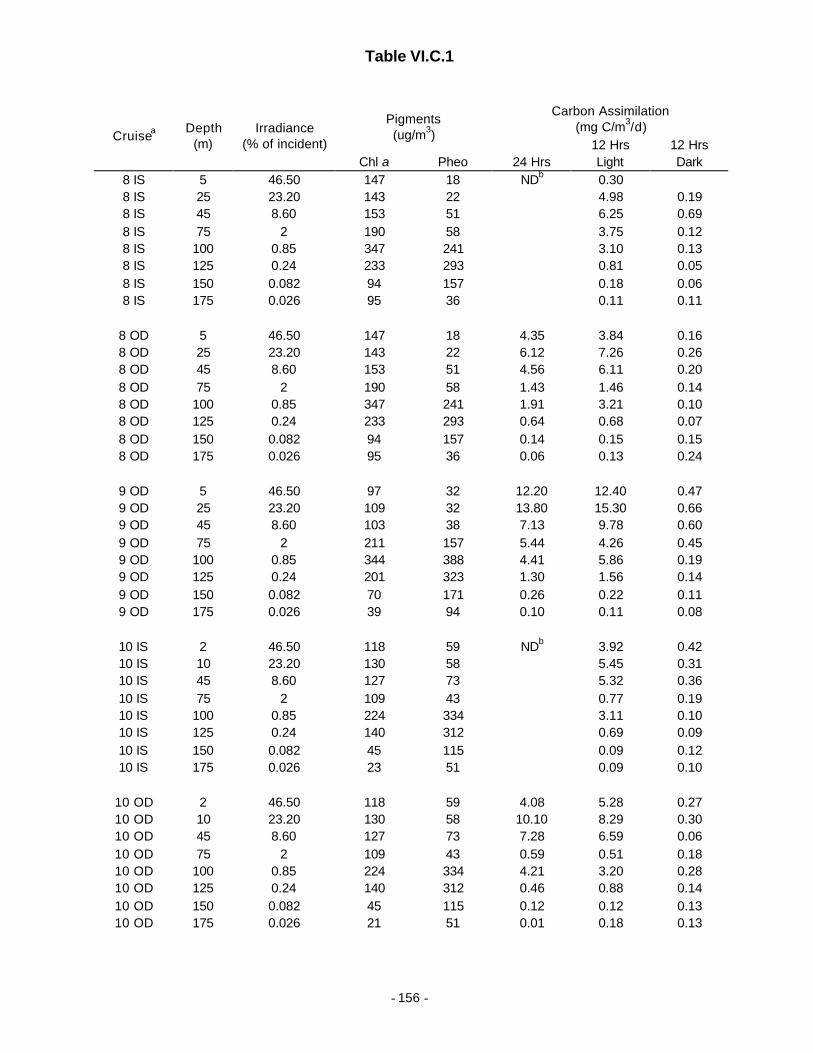
Table VI.C.1
- 156 -
Carbon Assimilation(mg C/m3/d)Pigments
(ug/m3)12 Hrs 12 Hrs
Cruisea Depth(m)
Irradiance(% of incident)
Chl a Pheo 24 Hrs Light Dark8 IS 5 46.50 147 18 NDb 0.308 IS 25 23.20 143 22 4.98 0.198 IS 45 8.60 153 51 6.25 0.698 IS 75 2 190 58 3.75 0.128 IS 100 0.85 347 241 3.10 0.138 IS 125 0.24 233 293 0.81 0.058 IS 150 0.082 94 157 0.18 0.068 IS 175 0.026 95 36 0.11 0.11
8 OD 5 46.50 147 18 4.35 3.84 0.168 OD 25 23.20 143 22 6.12 7.26 0.268 OD 45 8.60 153 51 4.56 6.11 0.208 OD 75 2 190 58 1.43 1.46 0.148 OD 100 0.85 347 241 1.91 3.21 0.108 OD 125 0.24 233 293 0.64 0.68 0.078 OD 150 0.082 94 157 0.14 0.15 0.158 OD 175 0.026 95 36 0.06 0.13 0.24
9 OD 5 46.50 97 32 12.20 12.40 0.479 OD 25 23.20 109 32 13.80 15.30 0.669 OD 45 8.60 103 38 7.13 9.78 0.609 OD 75 2 211 157 5.44 4.26 0.459 OD 100 0.85 344 388 4.41 5.86 0.199 OD 125 0.24 201 323 1.30 1.56 0.149 OD 150 0.082 70 171 0.26 0.22 0.119 OD 175 0.026 39 94 0.10 0.11 0.08
10 IS 2 46.50 118 59 NDb 3.92 0.4210 IS 10 23.20 130 58 5.45 0.3110 IS 45 8.60 127 73 5.32 0.3610 IS 75 2 109 43 0.77 0.1910 IS 100 0.85 224 334 3.11 0.1010 IS 125 0.24 140 312 0.69 0.0910 IS 150 0.082 45 115 0.09 0.1210 IS 175 0.026 23 51 0.09 0.10
10 OD 2 46.50 118 59 4.08 5.28 0.2710 OD 10 23.20 130 58 10.10 8.29 0.3010 OD 45 8.60 127 73 7.28 6.59 0.0610 OD 75 2 109 43 0.59 0.51 0.1810 OD 100 0.85 224 334 4.21 3.20 0.2810 OD 125 0.24 140 312 0.46 0.88 0.1410 OD 150 0.082 45 115 0.12 0.12 0.1310 OD 175 0.026 21 51 0.01 0.18 0.13

Table VI.C.1
- 157 -
Carbon Assimilation(mg C/m3/d)Pigments
(ug/m3)12 Hrs 12 Hrs
Cruisea Depth(m)
Irradiance(% of incident)
Chl a Pheo 24 Hrs Light Dark11 IS 5 46.50 120 44 NDb 5.20 0.2311 IS 20 23.20 111 39 3.58 0.2811 IS 45 8.60 207 95 6.55 0.2211 IS 80 2 259 280 3.72 0.1111 IS 100 0.85 154 218 1.16 0.0811 IS 120 0.24 70 122 0.30 0.0711 IS 160 0.082 20 28 0.06 0.0911 IS 175 0.026 23 24 0.06 0.06
11 OD 5 46.50 120 44 3.86 4.60 0.3511 OD 20 23.20 111 39 3.80 3.46 0.3911 OD 45 8.60 207 95 3.55 5.32 0.3511 OD 80 2 259 280 1.17 2.84 0.1711 OD 100 0.85 154 218 1.14 1.13 0.1411 OD 120 0.24 70 122 0.11 0.19 0.1111 OD 160 0.082 20 28 0.06 0.10 0.1111 OD 175 0.026 23 24 0.06 0.09 0.08
12 IS 2 46.50 110 14 NDb 2.39 0.1812 IS 10 23.20 107 22 2.85 0.1812 IS 20 8.60 109 32 7.03 0.2112 IS 45 2 115 37 3.18 0.1812 IS 65 0.85 218 80 4.49 0.1612 IS 95 0.24 275 323 2.39 0.0612 IS 110 0.082 214 325 0.69 0.0712 IS 140 0.026 52 108 0.10 0.05
12 OD 2 46.50 110 14 2.65 2.79 0.1412 OD 10 23.20 107 22 4.12 4.95 0.1412 OD 20 8.60 109 32 2.13 3.04 0.1712 OD 45 2 115 37 0.37 0.80 0.1512 OD 65 0.85 218 80 0.53 1.46 0.1212 OD 95 0.24 275 323 0.37 0.41 0.0612 OD 110 0.082 214 325 0.03 0.15 0.0612 OD 140 0.026 52 108 0.01 0.07 0.05
a – OD=On-deck incubation; IS=in-situ incubation.
b – ND=Not determined
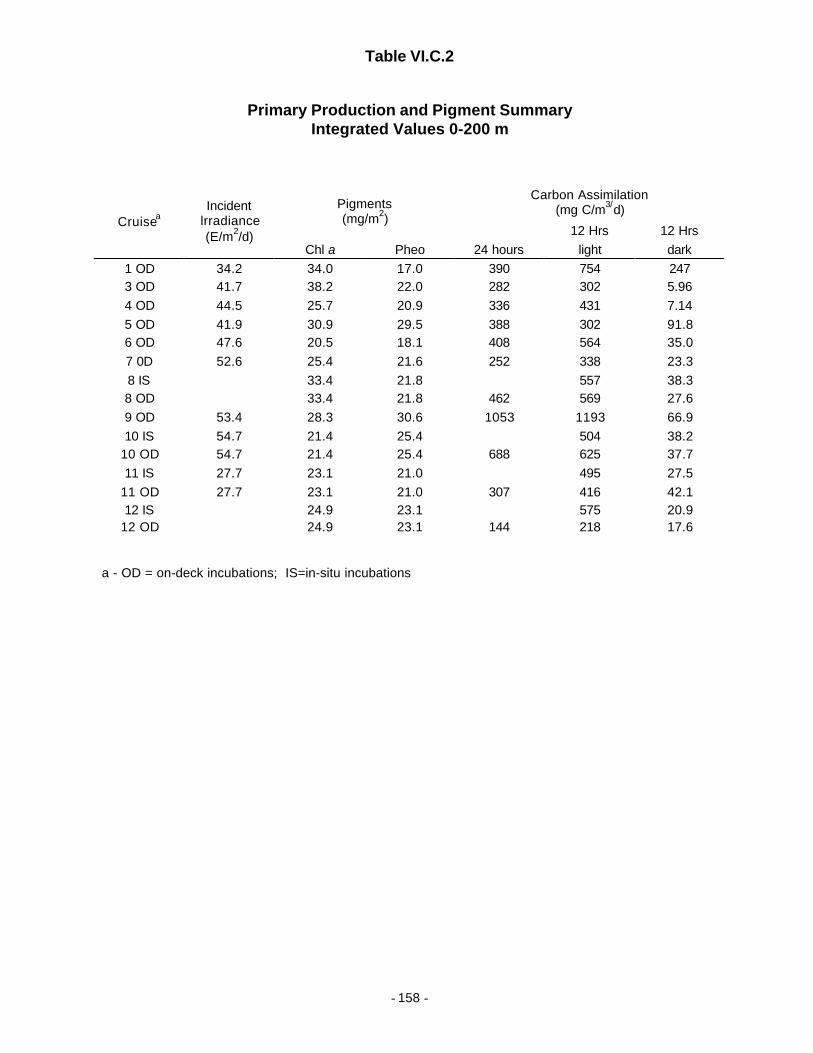
Table VI.C.2
- 158 -
Primary Production and Pigment SummaryIntegrated Values 0-200 m
Carbon Assimilation(mg C/m3/d)Pigments
(mg/m2)12 Hrs 12 Hrs
CruiseaIncident
lrradiance(E/m2/d)
Chl a Pheo 24 hours light dark1 OD 34.2 34.0 17.0 390 754 2473 OD 41.7 38.2 22.0 282 302 5.964 OD 44.5 25.7 20.9 336 431 7.145 OD 41.9 30.9 29.5 388 302 91.86 OD 47.6 20.5 18.1 408 564 35.07 0D 52.6 25.4 21.6 252 338 23.38 IS 33.4 21.8 557 38.38 OD 33.4 21.8 462 569 27.69 OD 53.4 28.3 30.6 1053 1193 66.910 IS 54.7 21.4 25.4 504 38.2
10 OD 54.7 21.4 25.4 688 625 37.711 IS 27.7 23.1 21.0 495 27.5
11 OD 27.7 23.1 21.0 307 416 42.112 IS 24.9 23.1 575 20.9
12 OD 24.9 23.1 144 218 17.6
a - OD = on-deck incubations; IS=in-situ incubations

VI.D. Particle Flux
Table VI.D.1: Sediment trap fluxes for HOT-2 to HOT-11.
- 159 -
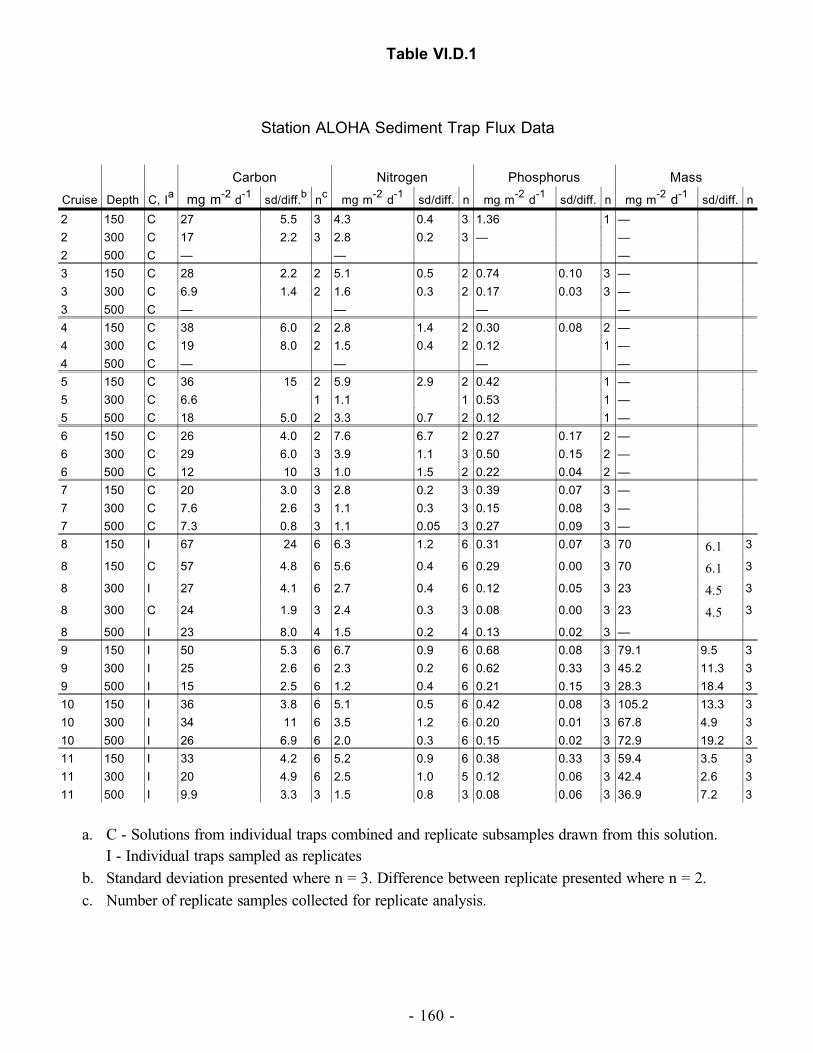
Station ALOHA Sediment Trap Flux Data
Carbon Nitrogen Phosphorus Mass
Cruise Depth C, Ia mg m-2 d-1 sd/diff.b nc mg m-2 d-1 sd/diff. n mg m-2 d-1 sd/diff. n mg m-2 d-1 sd/diff. n
2 150 C 27 5.5 3 4.3 0.4 3 1.36 1 —
2 300 C 17 2.2 3 2.8 0.2 3 — —
2 500 C — — —
3 150 C 28 2.2 2 5.1 0.5 2 0.74 0.10 3 —
3 300 C 6.9 1.4 2 1.6 0.3 2 0.17 0.03 3 —
3 500 C — — — —
4 150 C 38 6.0 2 2.8 1.4 2 0.30 0.08 2 —
4 300 C 19 8.0 2 1.5 0.4 2 0.12 1 —
4 500 C — — — —
5 150 C 36 15 2 5.9 2.9 2 0.42 1 —
5 300 C 6.6 1 1.1 1 0.53 1 —
5 500 C 18 5.0 2 3.3 0.7 2 0.12 1 —
6 150 C 26 4.0 2 7.6 6.7 2 0.27 0.17 2 —
6 300 C 29 6.0 3 3.9 1.1 3 0.50 0.15 2 —
6 500 C 12 10 3 1.0 1.5 2 0.22 0.04 2 —
7 150 C 20 3.0 3 2.8 0.2 3 0.39 0.07 3 —
7 300 C 7.6 2.6 3 1.1 0.3 3 0.15 0.08 3 —
7 500 C 7.3 0.8 3 1.1 0.05 3 0.27 0.09 3 —
8 150 I 67 24 6 6.3 1.2 6 0.31 0.07 3 70 6.1 3
8 150 C 57 4.8 6 5.6 0.4 6 0.29 0.00 3 70 6.1 3
8 300 I 27 4.1 6 2.7 0.4 6 0.12 0.05 3 23 4.5 3
8 300 C 24 1.9 3 2.4 0.3 3 0.08 0.00 3 23 4.5 3
8 500 I 23 8.0 4 1.5 0.2 4 0.13 0.02 3 —
9 150 I 50 5.3 6 6.7 0.9 6 0.68 0.08 3 79.1 9.5 3
9 300 I 25 2.6 6 2.3 0.2 6 0.62 0.33 3 45.2 11.3 3
9 500 I 15 2.5 6 1.2 0.4 6 0.21 0.15 3 28.3 18.4 3
10 150 I 36 3.8 6 5.1 0.5 6 0.42 0.08 3 105.2 13.3 3
10 300 I 34 11 6 3.5 1.2 6 0.20 0.01 3 67.8 4.9 3
10 500 I 26 6.9 6 2.0 0.3 6 0.15 0.02 3 72.9 19.2 3
11 150 I 33 4.2 6 5.2 0.9 6 0.38 0.33 3 59.4 3.5 3
11 300 I 20 4.9 6 2.5 1.0 5 0.12 0.06 3 42.4 2.6 3
11 500 I 9.9 3.3 3 1.5 0.8 3 0.08 0.06 3 36.9 7.2 3
a. C - Solutions from individual traps combined and replicate subsamples drawn from this solution.I - Individual traps sampled as replicates
b. Standard deviation presented where n = 3. Difference between replicate presented where n = 2.c. Number of replicate samples collected for replicate analysis.
Table VI.D.1
- 160 -

VII. Figures
VII.A. CTD Profiling
Figures VII.A.1–9: CTD and nutrient data taken at Kahe Point. Upper left panel: Temperature, sa-
linity, dissolved oxygen and density (σθ) as a function of pressure. Also plotted are the bottle
salinities (*) and oxygens (o). Lower left panel: Temperature and salinity as a function ofpressure to 1000 dbar from all CTD casts. Upper right: Potential temperature-property plotsfor nutrients (NO2+NO3, PO4, SiO4) and oxygen for all water samples. Lower right: Potentialtemperature-Property plots for salinity and oxygen. Also plotted are all the oxygen bottle data.
Figures VII.A.10a–21a: Staggered temperature and salinity profiles to 1000 dbar for StationALOHA.
Figures VII.A.10b–21b: CTD and nutrient data taken at Station ALOHA, as in Figures VII.A.1–9, except that upper left panel shows data from the deepest casts, and lower right panel shows
θ-S profiles from all casts, but θ-O profile from only the deepest cast.
Figure VII.A.22: Pressure–potential temperature for the deep casts of HOT-1 to HOT-12: a) 0–5000 dbar, b) 2500–5000 dbar
Figure VII.A.23: Potential temperature-salinity for the deep casts of HOT-1 to HOT-12:
a) full water column, b) θ < 5°C.
Figure VII.A.24: Vertical profiles of pigments. Fluorescence traces were converted to pigmentconcentrations using a global linear regression fit of pigment concentrations measured at dis-crete depths to fluorescence traces collected during 1988–1989.
- 161 -

Figure VII.A.1
0
200
400
600
800
1000
Pre
ssur
e (
dba
r )
0 10 20 30Temperature ( oC )
34 35 36 37Salinity
-300 -200 -100 0 100 200 300Oxygen ( µmol/kg )
22 24 26 28σθ ( kg/m3 )
0
5
10
15
20
25
30
Pot
entia
l Tem
pera
ture
( o
C )
0 10 20 30 40 50 NO2+NO3 ( µmol/kg )
0 2 4SRP ( µmol/kg )
0 100 200Silicate ( µmol/kg )
0 100 200 300O2 ( µmol/kg )
0
5
10
15
20
25
30
Pot
entia
l Tem
pera
ture
( o
C )
34.0 34.5 35.0 Salinity
0 100 200 300Oxygen ( µmol/kg )
Kahe Pt. HOT 2

Figure VII.A.2
0
200
400
600
800
1000
Pre
ssur
e (
dba
r )
0 10 20 30Temperature ( oC )
34 35 36 37Salinity
-300 -200 -100 0 100 200 300Oxygen ( µmol/kg )
22 24 26 28σθ ( kg/m3 )
0
5
10
15
20
25
30
Pot
entia
l Tem
pera
ture
( o
C )
0 10 20 30 40 50 NO2+NO3 ( µmol/kg )
0 2 4SRP ( µmol/kg )
0 100 200Silicate ( µmol/kg )
0 100 200 300O2 ( µmol/kg )
0
5
10
15
20
25
30
Pot
entia
l Tem
pera
ture
( o
C )
34.0 34.5 35.0 Salinity
0 100 200 300Oxygen ( µmol/kg )
Kahe Pt. HOT 4

Figure VII.A.3
0
200
400
600
800
1000
Pre
ssur
e (
dba
r )
0 10 20 30Temperature ( oC )
34 35 36 37Salinity
-300 -200 -100 0 100 200 300Oxygen ( µmol/kg )
22 24 26 28σθ ( kg/m3 )
0
5
10
15
20
25
30
Pot
entia
l Tem
pera
ture
( o
C )
0 10 20 30 40 50 NO2+NO3 ( µmol/kg )
0 2 4SRP ( µmol/kg )
0 100 200Silicate ( µmol/kg )
0 100 200 300O2 ( µmol/kg )
0
5
10
15
20
25
30
Pot
entia
l Tem
pera
ture
( o
C )
34.0 34.5 35.0 Salinity
0 100 200 300Oxygen ( µmol/kg )
Kahe Pt. HOT 5

Figure VII.A.4
0
200
400
600
800
1000
Pre
ssur
e (
dba
r )
0 10 20 30Temperature ( oC )
34 35 36 37Salinity
-300 -200 -100 0 100 200 300Oxygen ( µmol/kg )
22 24 26 28σθ ( kg/m3 )
0
5
10
15
20
25
30
Pot
entia
l Tem
pera
ture
( o
C )
0 10 20 30 40 50 NO2+NO3 ( µmol/kg )
0 2 4SRP ( µmol/kg )
0 100 200Silicate ( µmol/kg )
0 100 200 300O2 ( µmol/kg )
0
5
10
15
20
25
30
Pot
entia
l Tem
pera
ture
( o
C )
34.0 34.5 35.0 Salinity
0 100 200 300Oxygen ( µmol/kg )
Kahe Pt. HOT 6

Figure VII.A.5
0
200
400
600
800
1000
Pre
ssur
e (
dba
r )
0 10 20 30Temperature ( oC )
34 35 36 37Salinity
-300 -200 -100 0 100 200 300Oxygen ( µmol/kg )
22 24 26 28σθ ( kg/m3 )
0
5
10
15
20
25
30
Pot
entia
l Tem
pera
ture
( o
C )
0 10 20 30 40 50 NO2+NO3 ( µmol/kg )
0 2 4SRP ( µmol/kg )
0 100 200Silicate ( µmol/kg )
0 100 200 300O2 ( µmol/kg )
0
5
10
15
20
25
30
Pot
entia
l Tem
pera
ture
( o
C )
34.0 34.5 35.0 Salinity
0 100 200 300Oxygen ( µmol/kg )
Kahe Pt. HOT 7
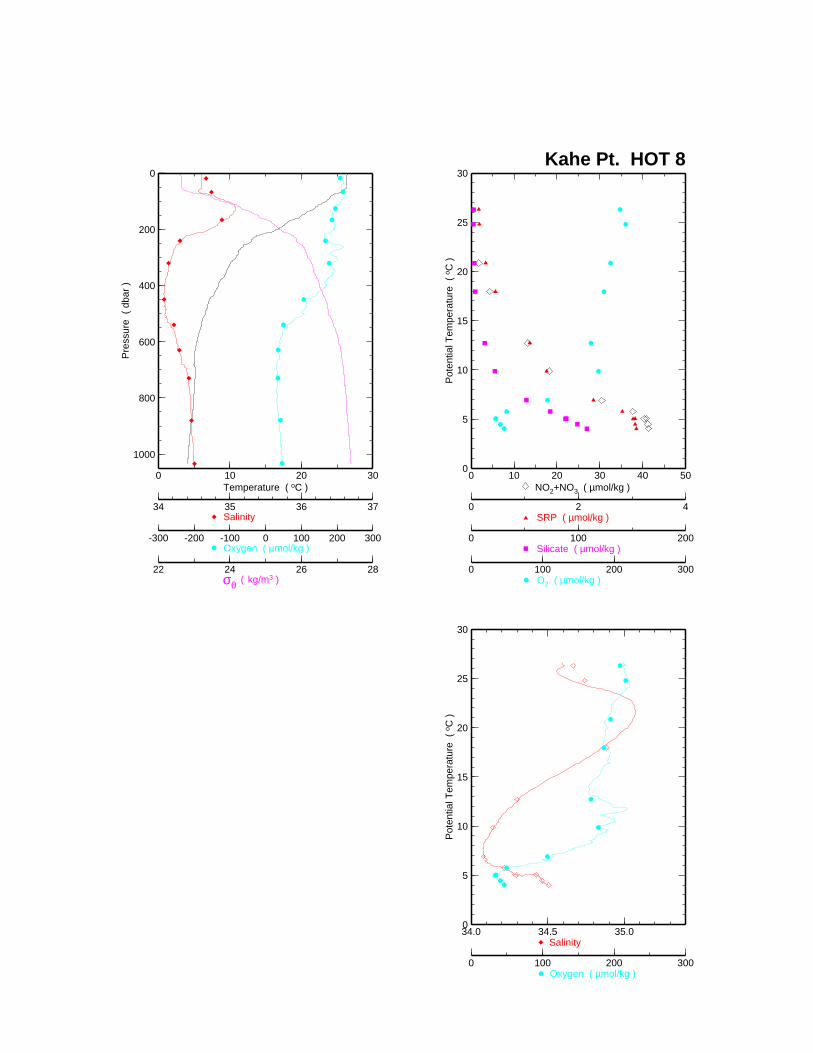
Figure VII.A.6
0
200
400
600
800
1000
Pre
ssur
e (
dba
r )
0 10 20 30Temperature ( oC )
34 35 36 37Salinity
-300 -200 -100 0 100 200 300Oxygen ( µmol/kg )
22 24 26 28σθ ( kg/m3 )
0
5
10
15
20
25
30
Pot
entia
l Tem
pera
ture
( o
C )
0 10 20 30 40 50 NO2+NO3 ( µmol/kg )
0 2 4SRP ( µmol/kg )
0 100 200Silicate ( µmol/kg )
0 100 200 300O2 ( µmol/kg )
0
5
10
15
20
25
30
Pot
entia
l Tem
pera
ture
( o
C )
34.0 34.5 35.0 Salinity
0 100 200 300Oxygen ( µmol/kg )
Kahe Pt. HOT 8
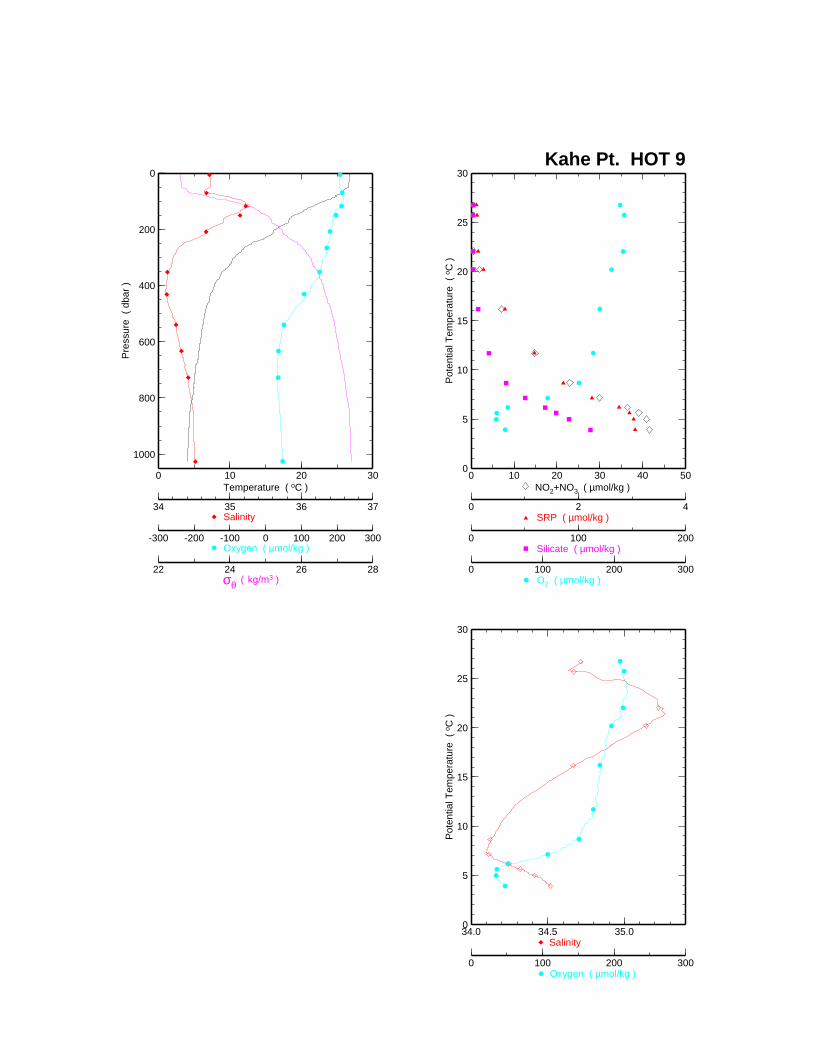
Figure VII.A.7
0
200
400
600
800
1000
Pre
ssur
e (
dba
r )
0 10 20 30Temperature ( oC )
34 35 36 37Salinity
-300 -200 -100 0 100 200 300Oxygen ( µmol/kg )
22 24 26 28σθ ( kg/m3 )
0
5
10
15
20
25
30
Pot
entia
l Tem
pera
ture
( o
C )
0 10 20 30 40 50 NO2+NO3 ( µmol/kg )
0 2 4SRP ( µmol/kg )
0 100 200Silicate ( µmol/kg )
0 100 200 300O2 ( µmol/kg )
0
5
10
15
20
25
30
Pot
entia
l Tem
pera
ture
( o
C )
34.0 34.5 35.0 Salinity
0 100 200 300Oxygen ( µmol/kg )
Kahe Pt. HOT 9
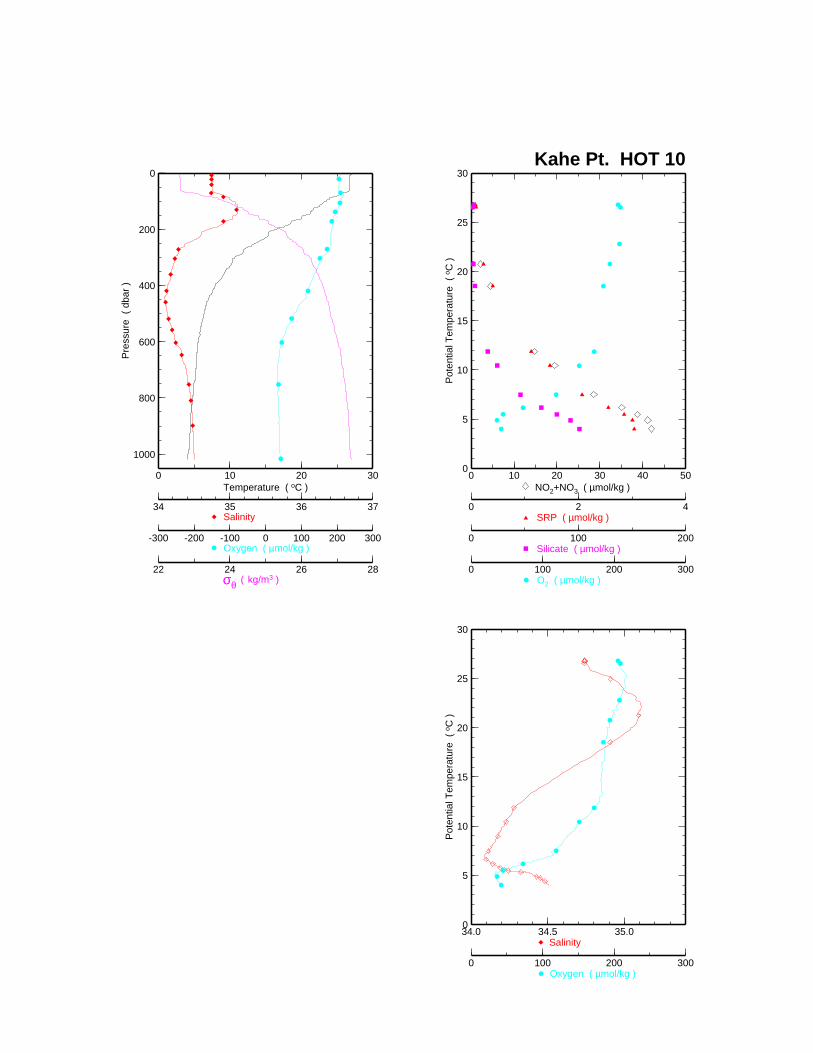
Figure VII.A.8
0
200
400
600
800
1000
Pre
ssur
e (
dba
r )
0 10 20 30Temperature ( oC )
34 35 36 37Salinity
-300 -200 -100 0 100 200 300Oxygen ( µmol/kg )
22 24 26 28σθ ( kg/m3 )
0
5
10
15
20
25
30
Pot
entia
l Tem
pera
ture
( o
C )
0 10 20 30 40 50 NO2+NO3 ( µmol/kg )
0 2 4SRP ( µmol/kg )
0 100 200Silicate ( µmol/kg )
0 100 200 300O2 ( µmol/kg )
0
5
10
15
20
25
30
Pot
entia
l Tem
pera
ture
( o
C )
34.0 34.5 35.0 Salinity
0 100 200 300Oxygen ( µmol/kg )
Kahe Pt. HOT 10
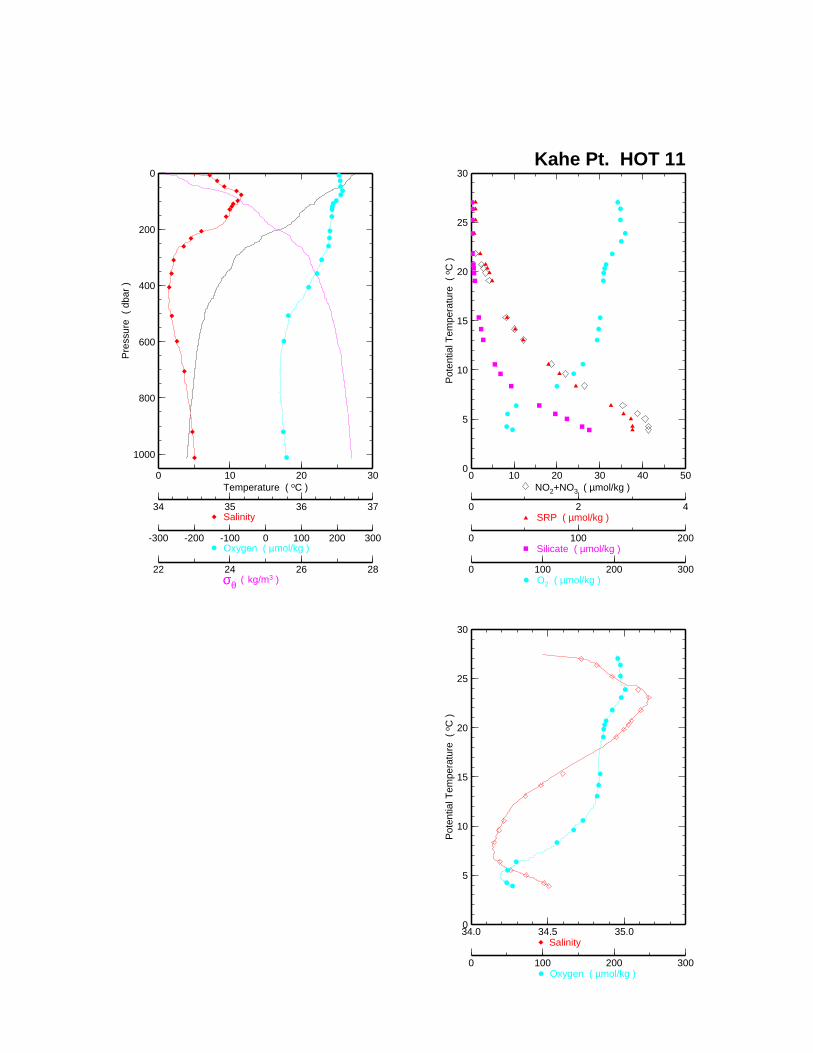
Figure VII.A.9
0
200
400
600
800
1000
Pre
ssur
e (
dba
r )
0 10 20 30Temperature ( oC )
34 35 36 37Salinity
-300 -200 -100 0 100 200 300Oxygen ( µmol/kg )
22 24 26 28σθ ( kg/m3 )
0
5
10
15
20
25
30
Pot
entia
l Tem
pera
ture
( o
C )
0 10 20 30 40 50 NO2+NO3 ( µmol/kg )
0 2 4SRP ( µmol/kg )
0 100 200Silicate ( µmol/kg )
0 100 200 300O2 ( µmol/kg )
0
5
10
15
20
25
30
Pot
entia
l Tem
pera
ture
( o
C )
34.0 34.5 35.0 Salinity
0 100 200 300Oxygen ( µmol/kg )
Kahe Pt. HOT 11

Figure V
II.A.10.a
0
200
400
600
800
1000
Pre
ssur
e (
dba
r )
0 10 20 30 40 50 60 70 80Temperature ( oC )
30 O
ct 21
34
30 O
ct 22
50
31 O
ct 00
56
31 O
ct 03
12
31 O
ct 06
39
31 O
ct 12
21
31 O
ct 14
54
31 O
ct 16
45
31 O
ct 18
59
1 Nov 0
522
1 Nov 1
111
1 Nov 1
250
1 Nov 2
036
1 Nov 2
316
2 Nov 0
202
2 Nov 0
609
2 Nov 0
857
0
200
400
600
800
1000
Pre
ssur
e (
dba
r )
34 35 36 37 38Salinity
30 O
ct 21
34
30 O
ct 22
50
31 O
ct 00
56
31 O
ct 03
12
31 O
ct 06
39
31 O
ct 12
21
31 O
ct 14
54
31 O
ct 16
45
31 O
ct 18
59
1 Nov 2
316
2 Nov 0
202
2 Nov 0
609
2 Nov 0
857
Statio
n A
LO
HA
HO
T 1

Figure VII.A.10.b
0
1000
2000
3000
4000
5000
Pre
ssur
e (
dba
r )
0 10 20 30Temperature ( oC )
34 35 36 37Salinity
-300 -200 -100 0 100 200 300Oxygen ( µmol/kg )
22 24 26 28σθ ( kg/m3 )
0
200
400
600
800
1000
Pre
ssur
e (
dba
r )
0 10 20 30Temperature ( oC )
34.0 34.5 35.0 35.5Salinity
0
5
10
15
20
25
30
Pot
entia
l Tem
pera
ture
( o C
)
0 10 20 30 40 50 NO2+NO3 ( µmol/kg )
0 2 4SRP ( µmol/kg )
0 100 200Silicate ( µmol/kg )
0 100 200 300O2 ( µmol/kg )
0
5
10
15
20
25
30
Pot
entia
l Tem
pera
ture
( o C
)
34.0 34.5 35.0 35.5 Salinity
0 100 200 300Oxygen ( µmol/kg )
Station ALOHA HOT 1
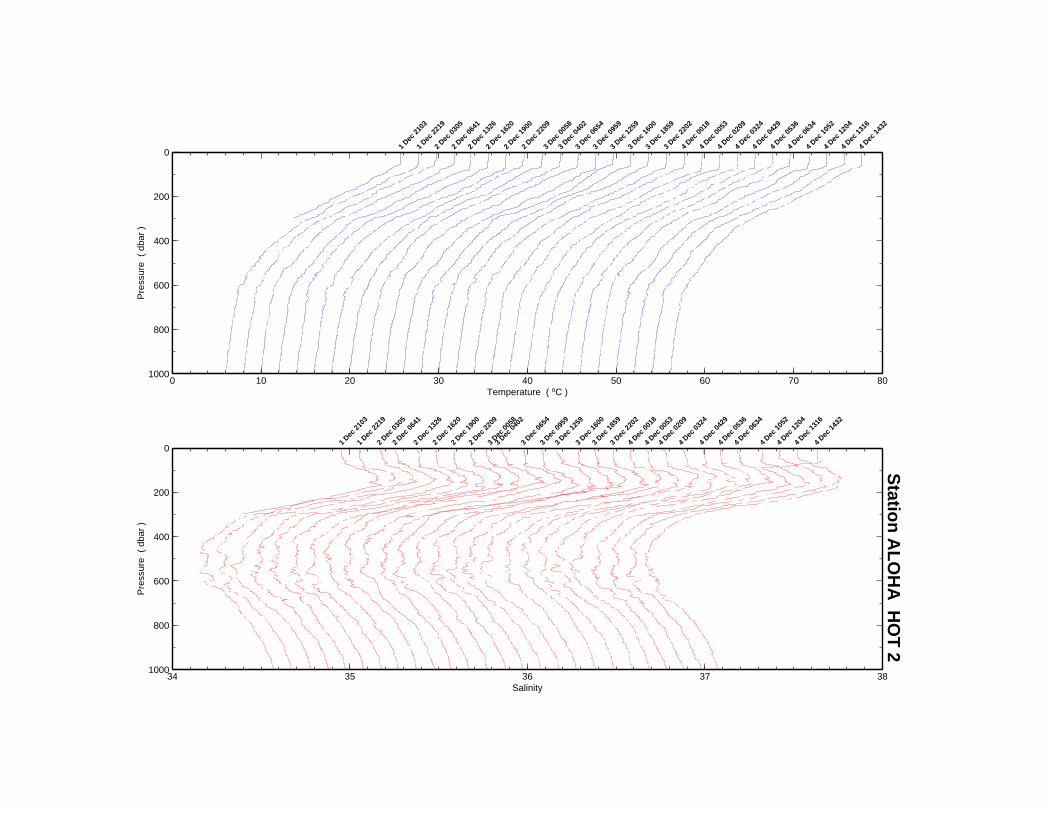
Figure V
II.A.11.a
0
200
400
600
800
1000
Pre
ssur
e (
dba
r )
0 10 20 30 40 50 60 70 80Temperature ( oC )
1 Dec
2103
1 D
ec 22
19
2 Dec
0305
2 D
ec 06
41
2 Dec
1326
2 D
ec 16
20
2 Dec
1900
2 D
ec 22
09
3 Dec
0058
3 Dec
0402
3 D
ec 06
54
3 Dec
0959
3 D
ec 12
59
3 Dec
1600
3 D
ec 18
59
3 Dec
2202
4 D
ec 00
18
4 Dec
0053
4 D
ec 02
09
4 Dec
0324
4 D
ec 04
29
4 Dec
0536
4 D
ec 06
34
4 Dec
1052
4 D
ec 12
04
4 Dec
1316
4 D
ec 14
32
0
200
400
600
800
1000
Pre
ssur
e (
dba
r )
34 35 36 37 38Salinity
1 Dec
2103
1 D
ec 22
19
2 Dec
0305
2 Dec
0641
2 D
ec 13
26
2 Dec
1620
2 D
ec 19
00
2 Dec
2209
3 D
ec 00
58
3 Dec
0402
3 D
ec 06
54
3 Dec
0959
3 Dec
1259
3 D
ec 16
00
3 Dec
1859
3 D
ec 22
02
4 Dec
0018
4 D
ec 00
53
4 Dec
0209
4 D
ec 03
24
4 Dec
0429
4 D
ec 05
36
4 Dec
0634
4 D
ec 10
52
4 Dec
1204
4 D
ec 13
16
4 Dec
1432
Statio
n A
LO
HA
HO
T 2

Figure VII.A.11.b
0
1000
2000
3000
4000
5000
Pre
ssur
e (
dba
r )
0 10 20 30Temperature ( oC )
34 35 36 37Salinity
-300 -200 -100 0 100 200 300Oxygen ( µmol/kg )
22 24 26 28σθ ( kg/m3 )
0
200
400
600
800
1000
Pre
ssur
e (
dba
r )
0 10 20 30Temperature ( oC )
34.0 34.5 35.0 35.5Salinity
0
5
10
15
20
25
30
Pot
entia
l Tem
pera
ture
( o C
)
0 10 20 30 40 50 NO2+NO3 ( µmol/kg )
0 2 4SRP ( µmol/kg )
0 100 200Silicate ( µmol/kg )
0 100 200 300O2 ( µmol/kg )
0
5
10
15
20
25
30
Pot
entia
l Tem
pera
ture
( o C
)
34.0 34.5 35.0 35.5 Salinity
0 100 200 300Oxygen ( µmol/kg )
Station ALOHA HOT 2

Figure V
II.A.12.a
0
200
400
600
800
1000
Pre
ssur
e (
dba
r )
0 10 20 30 40 50 60 70 80Temperature ( oC )
8 Jan
0056
8 J
an 05
19
8 Jan
0939
8 J
an 13
28
8 Jan
2007
8 J
an 22
50
9 Jan
0157
9 J
an 05
01
9 Jan
0800
9 J
an 11
19
9 Jan
1411
9 J
an 18
34
9 Jan
2243
10
Jan 04
14
10 Ja
n 0949
0
200
400
600
800
1000
Pre
ssur
e (
dba
r )
34 35 36 37 38Salinity
8 Jan
0056
8 J
an 05
19
8 Jan
0939
8 Jan
1328
8 J
an 20
07
8 Jan
2250
9 Jan
0157
9 J
an 05
01
9 Jan
0800
9 J
an 11
19
9 Jan
1411
9 J
an 18
34
9 Jan
2243
10
Jan 04
14
10 Ja
n 0949
Statio
n A
LO
HA
HO
T 3

Figure VII.A.12.b
0
1000
2000
3000
4000
5000
Pre
ssur
e (
dba
r )
0 10 20 30Temperature ( oC )
34 35 36 37Salinity
-300 -200 -100 0 100 200 300Oxygen ( µmol/kg )
22 24 26 28σθ ( kg/m3 )
0
200
400
600
800
1000
Pre
ssur
e (
dba
r )
0 10 20 30Temperature ( oC )
34.0 34.5 35.0 35.5Salinity
0
5
10
15
20
25
30
Pot
entia
l Tem
pera
ture
( o
C )
0 10 20 30 40 50 NO2+NO3 ( µmol/kg )
0 2 4SRP ( µmol/kg )
0 100 200Silicate ( µmol/kg )
0 100 200 300O2 ( µmol/kg )
0
5
10
15
20
25
30
Pot
entia
l Tem
pera
ture
( o
C )
34.0 34.5 35.0 35.5 Salinity
0 100 200 300Oxygen ( µmol/kg )
Station ALOHA HOT 3
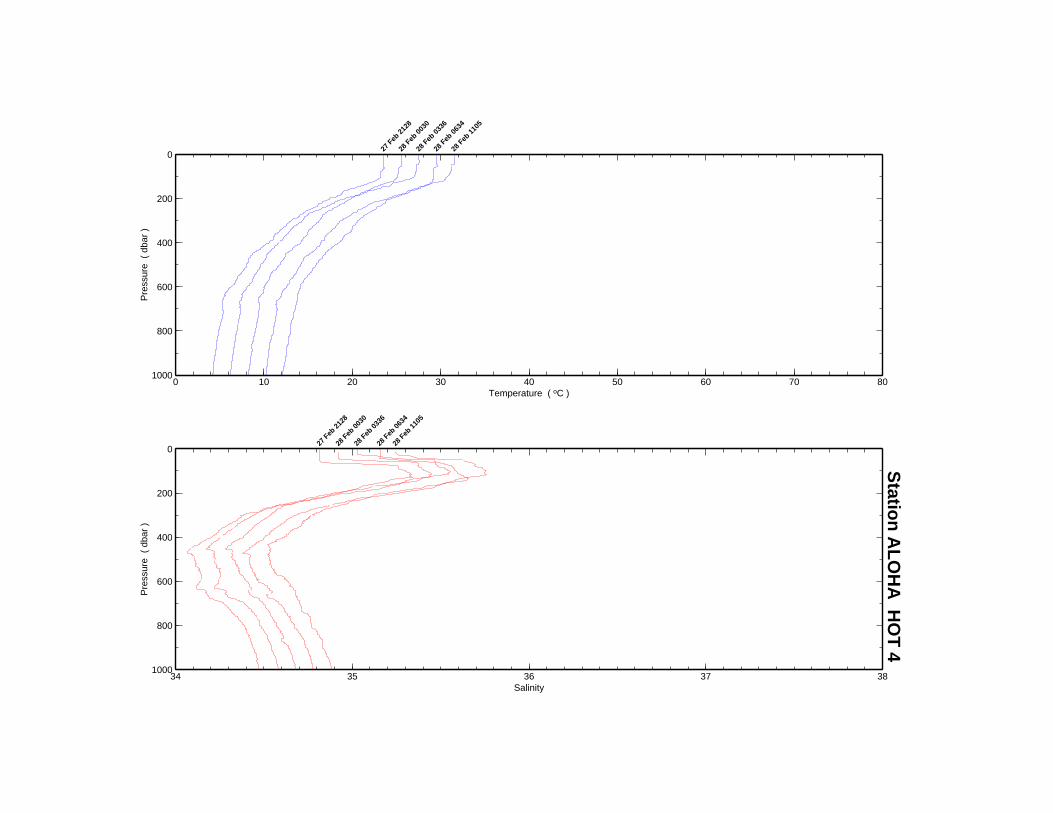
Figure V
II.A.13.a
0
200
400
600
800
1000
Pre
ssur
e (
dba
r )
0 10 20 30 40 50 60 70 80Temperature ( oC )
27 F
eb 21
28
28 F
eb 00
30
28 F
eb 03
36
28 F
eb 06
34
28 F
eb 11
05
0
200
400
600
800
1000
Pre
ssur
e (
dba
r )
34 35 36 37 38Salinity
27 F
eb 21
28
28 F
eb 00
30
28 F
eb 03
36
28 F
eb 06
34
28 F
eb 11
05
Statio
n A
LO
HA
HO
T 4

Figure VII.A.13.b
0
1000
2000
3000
4000
5000
Pre
ssur
e (
dba
r )
0 10 20 30Temperature ( oC )
34 35 36 37Salinity
-300 -200 -100 0 100 200 300Oxygen ( µmol/kg )
22 24 26 28σθ ( kg/m3 )
0
200
400
600
800
1000
Pre
ssur
e (
dba
r )
0 10 20 30Temperature ( oC )
34.0 34.5 35.0 35.5Salinity
0
5
10
15
20
25
30
Pot
entia
l Tem
pera
ture
( o
C )
0 10 20 30 40 50 NO2+NO3 ( µmol/kg )
0 2 4SRP ( µmol/kg )
0 100 200Silicate ( µmol/kg )
0 100 200 300O2 ( µmol/kg )
0
5
10
15
20
25
30
Pot
entia
l Tem
pera
ture
( o
C )
34.0 34.5 35.0 35.5 Salinity
0 100 200 300Oxygen ( µmol/kg )
Station ALOHA HOT 4

Figure V
II.A.14a
0
200
400
600
800
1000
Pre
ssur
e (
dba
r )
0 10 20 30 40 50 60 70 80Temperature ( oC )
26 M
ar 19
10
26 M
ar 21
14
27 M
ar 01
16
27 M
ar 04
12
27 M
ar 07
29
27 M
ar 10
45
27 M
ar 15
44
27 M
ar 18
13
27 M
ar 19
57
27 M
ar 22
16
29 M
ar 01
06
29 M
ar 02
35
29 M
ar 09
57
29 M
ar 18
56
0
200
400
600
800
1000
Pre
ssur
e (
dba
r )
34 35 36 37 38Salinity
26 M
ar 19
10
26 M
ar 21
14
27 M
ar 01
16
27 M
ar 04
12
27 M
ar 07
29
27 M
ar 10
45
27 M
ar 15
44
27 M
ar 18
13
27 M
ar 19
57
27 M
ar 22
16
29 M
ar 01
06
29 M
ar 02
35
29 M
ar 09
57
29 M
ar 18
56
Statio
n A
LO
HA
HO
T 5
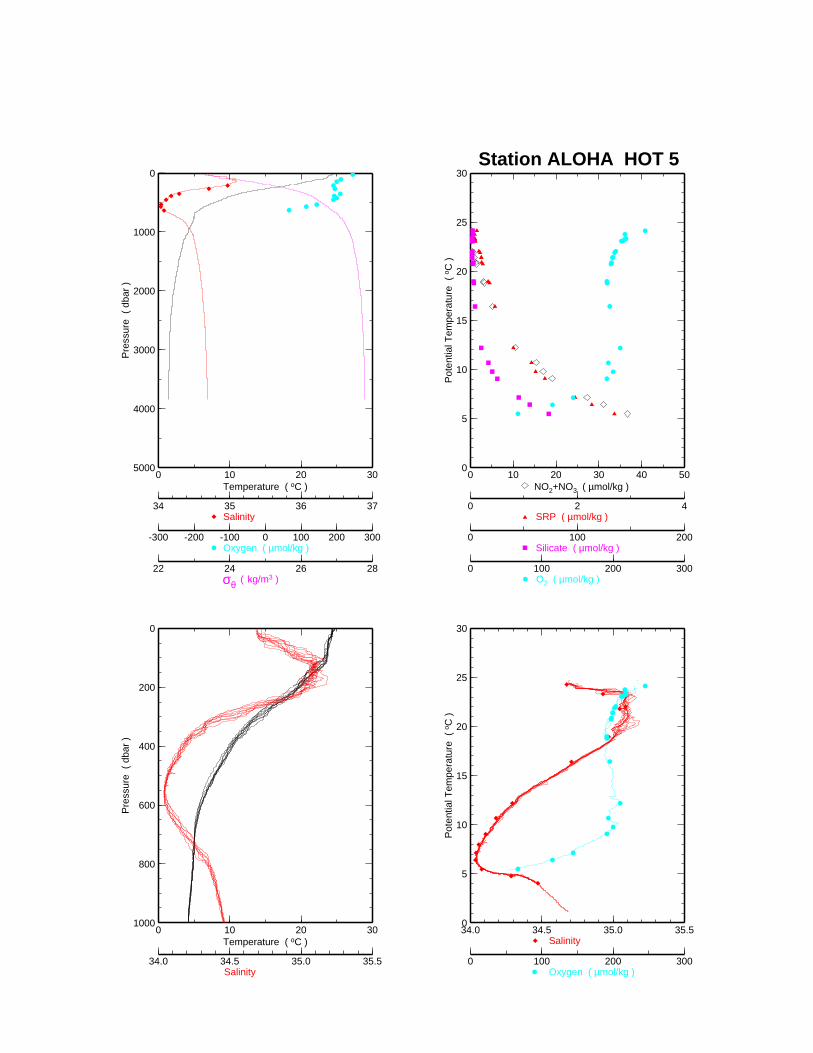
Figure VII.A.14b
0
1000
2000
3000
4000
5000
Pre
ssur
e (
dba
r )
0 10 20 30Temperature ( oC )
34 35 36 37Salinity
-300 -200 -100 0 100 200 300Oxygen ( µmol/kg )
22 24 26 28σθ ( kg/m3 )
0
200
400
600
800
1000
Pre
ssur
e (
dba
r )
0 10 20 30Temperature ( oC )
34.0 34.5 35.0 35.5Salinity
0
5
10
15
20
25
30
Pot
entia
l Tem
pera
ture
( o
C )
0 10 20 30 40 50 NO2+NO3 ( µmol/kg )
0 2 4SRP ( µmol/kg )
0 100 200Silicate ( µmol/kg )
0 100 200 300O2 ( µmol/kg )
0
5
10
15
20
25
30
Pot
entia
l Tem
pera
ture
( o
C )
34.0 34.5 35.0 35.5 Salinity
0 100 200 300Oxygen ( µmol/kg )
Station ALOHA HOT 5

Figure V
II.A.15a
0
200
400
600
800
1000
Pre
ssur
e (
dba
r )
0 10 20 30 40 50 60 70 80Temperature ( oC )
17 M
ay 18
04
17 M
ay 23
42
18 M
ay 01
36
18 M
ay 05
26
18 M
ay 08
25
18 M
ay 11
23
18 M
ay 18
48
18 M
ay 22
01
19 M
ay 01
00
19 M
ay 03
58
19 M
ay 06
56
19 M
ay 08
24
19 M
ay 10
32
19 M
ay 12
57
0
200
400
600
800
1000
Pre
ssur
e (
dba
r )
34 35 36 37 38Salinity
17 M
ay 18
04
17 M
ay 23
42
18 M
ay 01
36
18 M
ay 05
26
18 M
ay 08
25
18 M
ay 11
23
18 M
ay 18
48
18 M
ay 22
01
19 M
ay 01
00
19 M
ay 03
58
19 M
ay 06
56
19 M
ay 08
24
19 M
ay 10
32
19 M
ay 12
57
Statio
n A
LO
HA
HO
T 6

Figure VII.A.15b
0
1000
2000
3000
4000
5000
Pre
ssur
e (
dba
r )
0 10 20 30Temperature ( oC )
34 35 36 37Salinity
-300 -200 -100 0 100 200 300Oxygen ( µmol/kg )
22 24 26 28σθ ( kg/m3 )
0
200
400
600
800
1000
Pre
ssur
e (
dba
r )
0 10 20 30Temperature ( oC )
34.0 34.5 35.0 35.5Salinity
0
5
10
15
20
25
30
Pot
entia
l Tem
pera
ture
( o
C )
0 10 20 30 40 50 NO2+NO3 ( µmol/kg )
0 2 4SRP ( µmol/kg )
0 100 200Silicate ( µmol/kg )
0 100 200 300O2 ( µmol/kg )
0
5
10
15
20
25
30
Pot
entia
l Tem
pera
ture
( o
C )
34.0 34.5 35.0 35.5 Salinity
0 100 200 300Oxygen ( µmol/kg )
Station ALOHA HOT 6

Figure V
II.A.16a
0
200
400
600
800
1000
Pre
ssur
e (
dba
r )
0 10 20 30 40 50 60 70 80Temperature ( oC )
23 Ju
n 2335
24
Jun 01
56
24 Ju
n 0500
24
Jun 08
28
24 Ju
n 1057
24 Ju
n 1722
0
200
400
600
800
1000
Pre
ssur
e (
dba
r )
34 35 36 37 38Salinity
23 Ju
n 2335
24 Ju
n 0156
24
Jun 05
00
24 Ju
n 0828
24
Jun 10
57
24 Ju
n 1722
Statio
n A
LO
HA
HO
T 7
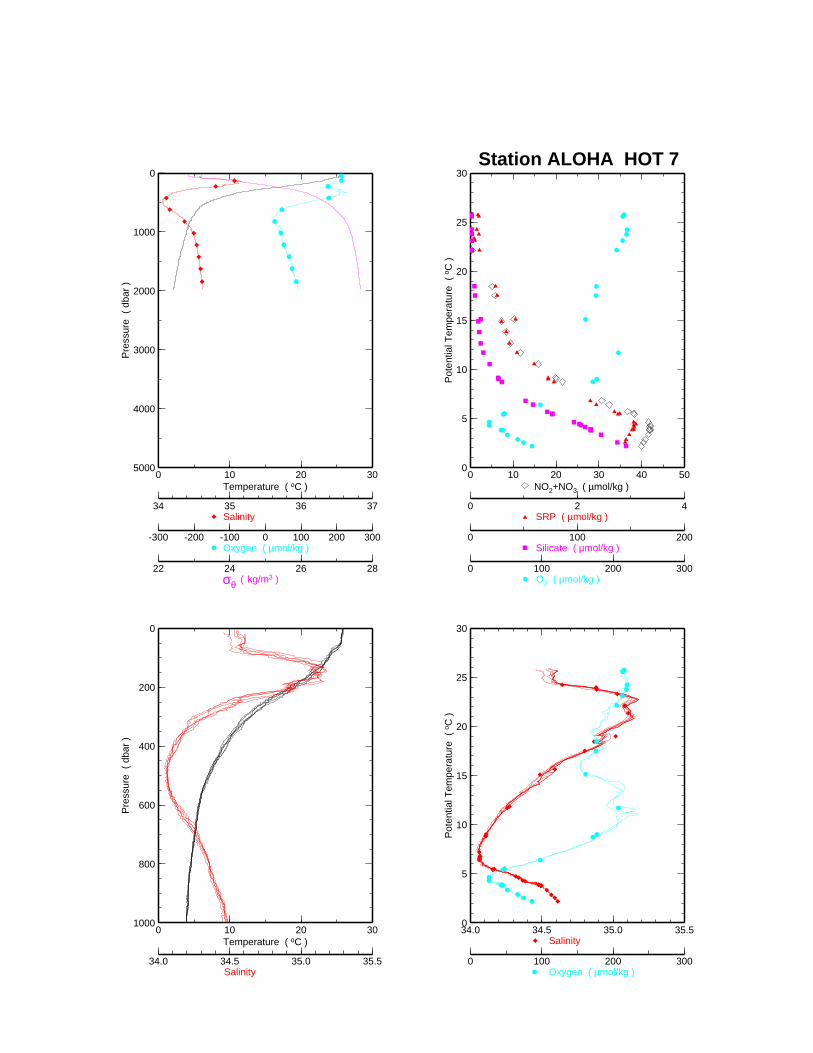
Figure VII.A.16b
0
1000
2000
3000
4000
5000
Pre
ssur
e (
dba
r )
0 10 20 30Temperature ( oC )
34 35 36 37Salinity
-300 -200 -100 0 100 200 300Oxygen ( µmol/kg )
22 24 26 28σθ ( kg/m3 )
0
200
400
600
800
1000
Pre
ssur
e (
dba
r )
0 10 20 30Temperature ( oC )
34.0 34.5 35.0 35.5Salinity
0
5
10
15
20
25
30
Pot
entia
l Tem
pera
ture
( o
C )
0 10 20 30 40 50 NO2+NO3 ( µmol/kg )
0 2 4SRP ( µmol/kg )
0 100 200Silicate ( µmol/kg )
0 100 200 300O2 ( µmol/kg )
0
5
10
15
20
25
30
Pot
entia
l Tem
pera
ture
( o
C )
34.0 34.5 35.0 35.5 Salinity
0 100 200 300Oxygen ( µmol/kg )
Station ALOHA HOT 7

Figure V
II.A.17a
0
200
400
600
800
1000
Pre
ssur
e (
dba
r )
0 10 20 30 40 50 60 70 80Temperature ( oC )
28 Ju
l 214
1 29
Jul 0
035
29 Ju
l 032
5 29
Jul 0
627
29 Ju
l 094
1 29
Jul 1
610
29 Ju
l 185
8 30
Jul 0
058
30 Ju
l 034
0 30
Jul 0
654
0
200
400
600
800
1000
Pre
ssur
e (
dba
r )
34 35 36 37 38Salinity
28 Ju
l 214
1
29 Ju
l 003
5 29
Jul 0
325
29 Ju
l 062
7
29 Ju
l 094
1
29 Ju
l 161
0 29
Jul 1
858
30 Ju
l 005
8
30 Ju
l 034
0 30
Jul 0
654
Statio
n A
LO
HA
HO
T 8

Figure VII.A.17b
0
1000
2000
3000
4000
5000
Pre
ssur
e (
dba
r )
0 10 20 30Temperature ( oC )
34 35 36 37Salinity
-300 -200 -100 0 100 200 300Oxygen ( µmol/kg )
22 24 26 28σθ ( kg/m3 )
0
200
400
600
800
1000
Pre
ssur
e (
dba
r )
0 10 20 30Temperature ( oC )
34.0 34.5 35.0 35.5Salinity
0
5
10
15
20
25
30
Pot
entia
l Tem
pera
ture
( o
C )
0 10 20 30 40 50 NO2+NO3 ( µmol/kg )
0 2 4SRP ( µmol/kg )
0 100 200Silicate ( µmol/kg )
0 100 200 300O2 ( µmol/kg )
0
5
10
15
20
25
30
Pot
entia
l Tem
pera
ture
( o
C )
34.0 34.5 35.0 35.5 Salinity
0 100 200 300Oxygen ( µmol/kg )
Station ALOHA HOT 8

Figure V
II.A.18a
0
200
400
600
800
1000
Pre
ssur
e (
dba
r )
0 10 20 30 40 50 60 70 80Temperature ( oC )
23 A
ug 1733
23 A
ug 1942
23
Aug 22
58
24 A
ug 0204
24 A
ug 0459
24 A
ug 0757
24 A
ug 1101
0
200
400
600
800
1000
Pre
ssur
e (
dba
r )
34 35 36 37 38Salinity
23 A
ug 1733
23 A
ug 1942
23 A
ug 2258
24
Aug 02
04
24 A
ug 0459
24 A
ug 0757
24 A
ug 1101
Statio
n A
LO
HA
HO
T 9

Figure VII.A.18b
0
1000
2000
3000
4000
5000
Pre
ssur
e (
dba
r )
0 10 20 30Temperature ( oC )
34 35 36 37Salinity
-300 -200 -100 0 100 200 300Oxygen ( µmol/kg )
22 24 26 28σθ ( kg/m3 )
0
200
400
600
800
1000
Pre
ssur
e (
dba
r )
0 10 20 30Temperature ( oC )
34.0 34.5 35.0 35.5Salinity
0
5
10
15
20
25
30
Pot
entia
l Tem
pera
ture
( o
C )
0 10 20 30 40 50 NO2+NO3 ( µmol/kg )
0 2 4SRP ( µmol/kg )
0 100 200Silicate ( µmol/kg )
0 100 200 300O2 ( µmol/kg )
0
5
10
15
20
25
30
Pot
entia
l Tem
pera
ture
( o
C )
34.0 34.5 35.0 35.5 Salinity
0 100 200 300Oxygen ( µmol/kg )
Station ALOHA HOT 9
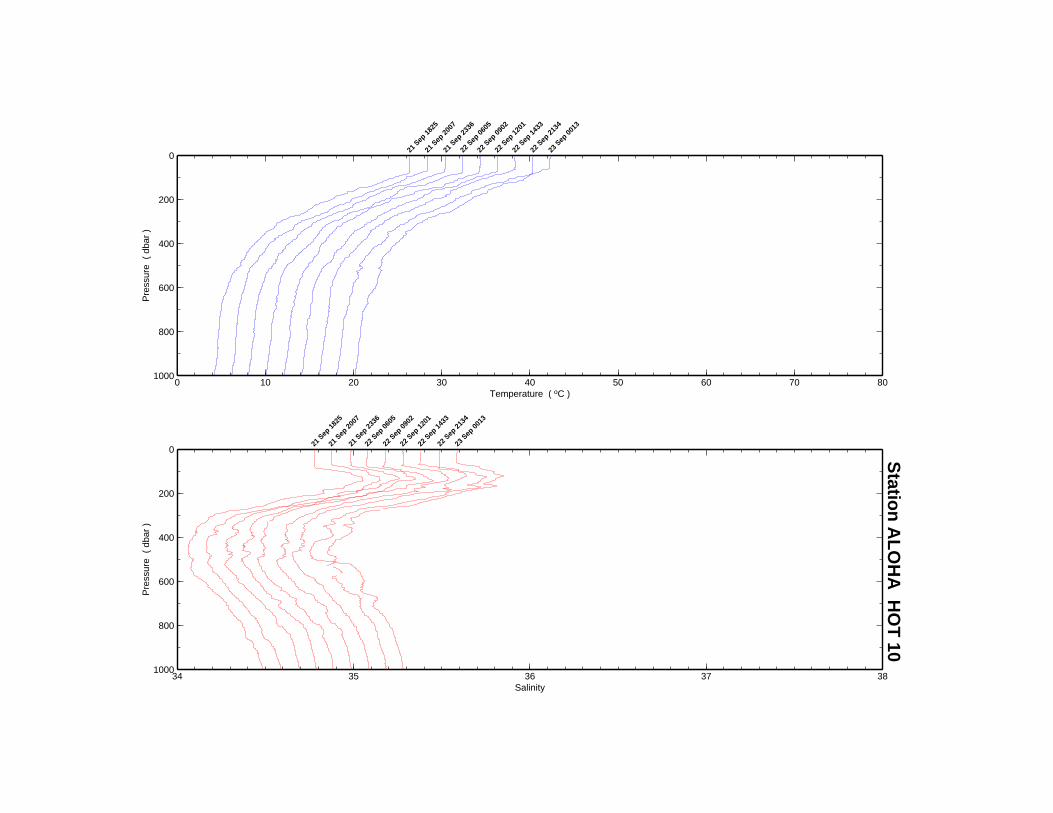
Figure V
II.A.19a
0
200
400
600
800
1000
Pre
ssur
e (
dba
r )
0 10 20 30 40 50 60 70 80Temperature ( oC )
21 S
ep 18
25
21 S
ep 20
07
21 S
ep 23
36
22 S
ep 06
05
22 S
ep 09
02
22 S
ep 12
01
22 S
ep 14
33
22 S
ep 21
34
23 S
ep 00
13
0
200
400
600
800
1000
Pre
ssur
e (
dba
r )
34 35 36 37 38Salinity
21 S
ep 18
25
21 S
ep 20
07
21 S
ep 23
36
22 S
ep 06
05
22 S
ep 09
02
22 S
ep 12
01
22 S
ep 14
33
22 S
ep 21
34
23 S
ep 00
13
Statio
n A
LO
HA
HO
T 10

Figure VII.A.19b
0
1000
2000
3000
4000
5000
Pre
ssur
e (
dba
r )
0 10 20 30Temperature ( oC )
34 35 36 37Salinity
-300 -200 -100 0 100 200 300Oxygen ( µmol/kg )
22 24 26 28σθ ( kg/m3 )
0
200
400
600
800
1000
Pre
ssur
e (
dba
r )
0 10 20 30Temperature ( oC )
34.0 34.5 35.0 35.5Salinity
0
5
10
15
20
25
30
Pot
entia
l Tem
pera
ture
( o
C )
0 10 20 30 40 50 NO2+NO3 ( µmol/kg )
0 2 4SRP ( µmol/kg )
0 100 200Silicate ( µmol/kg )
0 100 200 300O2 ( µmol/kg )
0
5
10
15
20
25
30
Pot
entia
l Tem
pera
ture
( o
C )
34.0 34.5 35.0 35.5 Salinity
0 100 200 300Oxygen ( µmol/kg )
Station ALOHA HOT 10

Figure V
II.A.20a
0
200
400
600
800
1000
Pre
ssur
e (
dba
r )
0 10 20 30 40 50 60 70 80Temperature ( oC )
17 O
ct 20
08
17 O
ct 23
33
18 O
ct 05
27
18 O
ct 08
33
18 O
ct 11
01
18 O
ct 20
32
18 O
ct 23
16
19 O
ct 01
06
19 O
ct 06
10
19 O
ct 08
15
19 O
ct 11
08
19 O
ct 14
10
0
200
400
600
800
1000
Pre
ssur
e (
dba
r )
34 35 36 37 38Salinity
17 O
ct 20
08
17 O
ct 23
33
18 O
ct 05
27
18 O
ct 08
33
18 O
ct 11
01
18 O
ct 20
32
18 O
ct 23
16
19 O
ct 01
06
19 O
ct 06
10
19 O
ct 08
15
19 O
ct 11
08
19 O
ct 14
10
Statio
n A
LO
HA
HO
T 11

Figure VII.A.20b
0
1000
2000
3000
4000
5000
Pre
ssur
e (
dba
r )
0 10 20 30Temperature ( oC )
34 35 36 37Salinity
-300 -200 -100 0 100 200 300Oxygen ( µmol/kg )
22 24 26 28σθ ( kg/m3 )
0
200
400
600
800
1000
Pre
ssur
e (
dba
r )
0 10 20 30Temperature ( oC )
34.0 34.5 35.0 35.5Salinity
0
5
10
15
20
25
30
Pot
entia
l Tem
pera
ture
( o
C )
0 10 20 30 40 50 NO2+NO3 ( µmol/kg )
0 2 4SRP ( µmol/kg )
0 100 200Silicate ( µmol/kg )
0 100 200 300O2 ( µmol/kg )
0
5
10
15
20
25
30
Pot
entia
l Tem
pera
ture
( o
C )
34.0 34.5 35.0 35.5 Salinity
0 100 200 300Oxygen ( µmol/kg )
Station ALOHA HOT 11

Figure V
II.A.21a
0
200
400
600
800
1000
Pre
ssur
e (
dba
r )
0 10 20 30 40 50 60 70 80Temperature ( oC )
28 N
ov 003
1
28 N
ov 032
2
28 N
ov 094
0
28 N
ov 142
0
28 N
ov 172
8
28 N
ov 194
8
28 N
ov 233
9 29
Nov 0
155
29 N
ov 052
8
0
200
400
600
800
1000
Pre
ssur
e (
dba
r )
34 35 36 37 38Salinity
28 N
ov 003
1 28
Nov 0
322
28 N
ov 094
0
28 N
ov 142
0
28 N
ov 172
8
28 N
ov 194
8
28 N
ov 233
9 29
Nov 0
155
29 N
ov 052
8
Statio
n A
LO
HA
HO
T 12
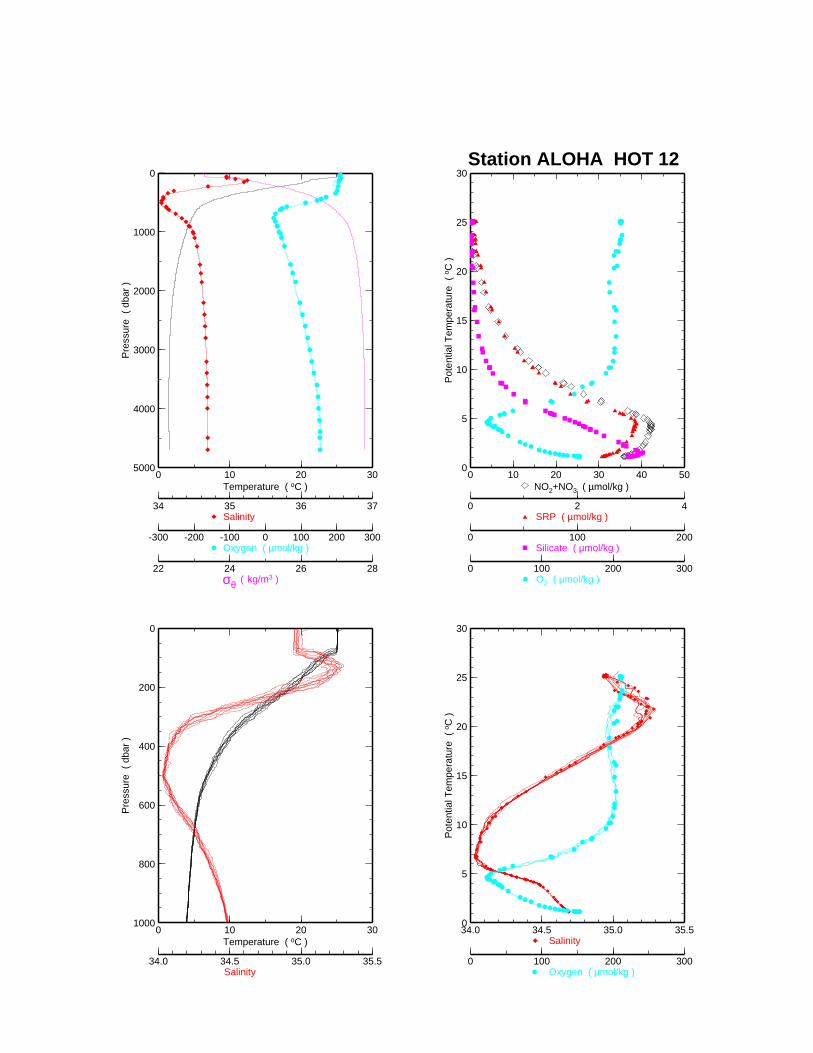
Figure VII.A.21b
0
1000
2000
3000
4000
5000
Pre
ssur
e (
dba
r )
0 10 20 30Temperature ( oC )
34 35 36 37Salinity
-300 -200 -100 0 100 200 300Oxygen ( µmol/kg )
22 24 26 28σθ ( kg/m3 )
0
200
400
600
800
1000
Pre
ssur
e (
dba
r )
0 10 20 30Temperature ( oC )
34.0 34.5 35.0 35.5Salinity
0
5
10
15
20
25
30
Pot
entia
l Tem
pera
ture
( o
C )
0 10 20 30 40 50 NO2+NO3 ( µmol/kg )
0 2 4SRP ( µmol/kg )
0 100 200Silicate ( µmol/kg )
0 100 200 300O2 ( µmol/kg )
0
5
10
15
20
25
30
Pot
entia
l Tem
pera
ture
( o
C )
34.0 34.5 35.0 35.5 Salinity
0 100 200 300Oxygen ( µmol/kg )
Station ALOHA HOT 12
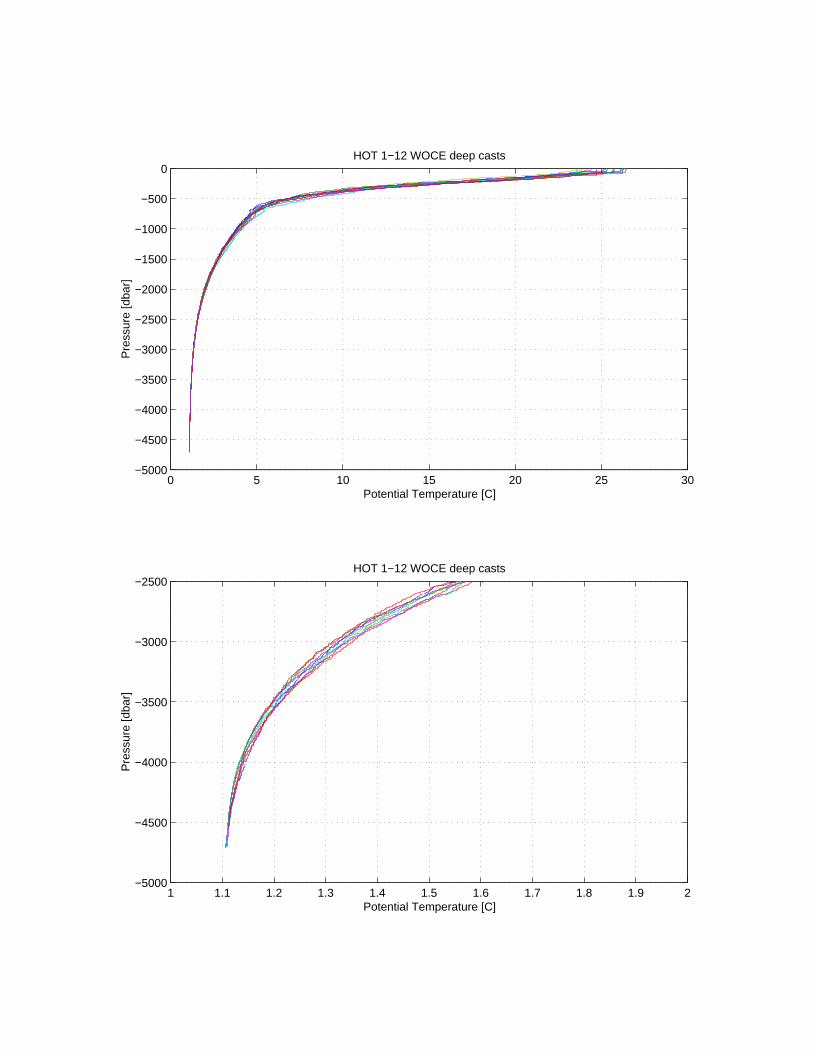
Figure VII.A.22
0 5 10 15 20 25 30−5000
−4500
−4000
−3500
−3000
−2500
−2000
−1500
−1000
−500
0
Potential Temperature [C]
Pre
ssur
e [d
bar]
HOT 1−12 WOCE deep casts
1 1.1 1.2 1.3 1.4 1.5 1.6 1.7 1.8 1.9 2−5000
−4500
−4000
−3500
−3000
−2500
Potential Temperature [C]
Pre
ssur
e [d
bar]
HOT 1−12 WOCE deep casts
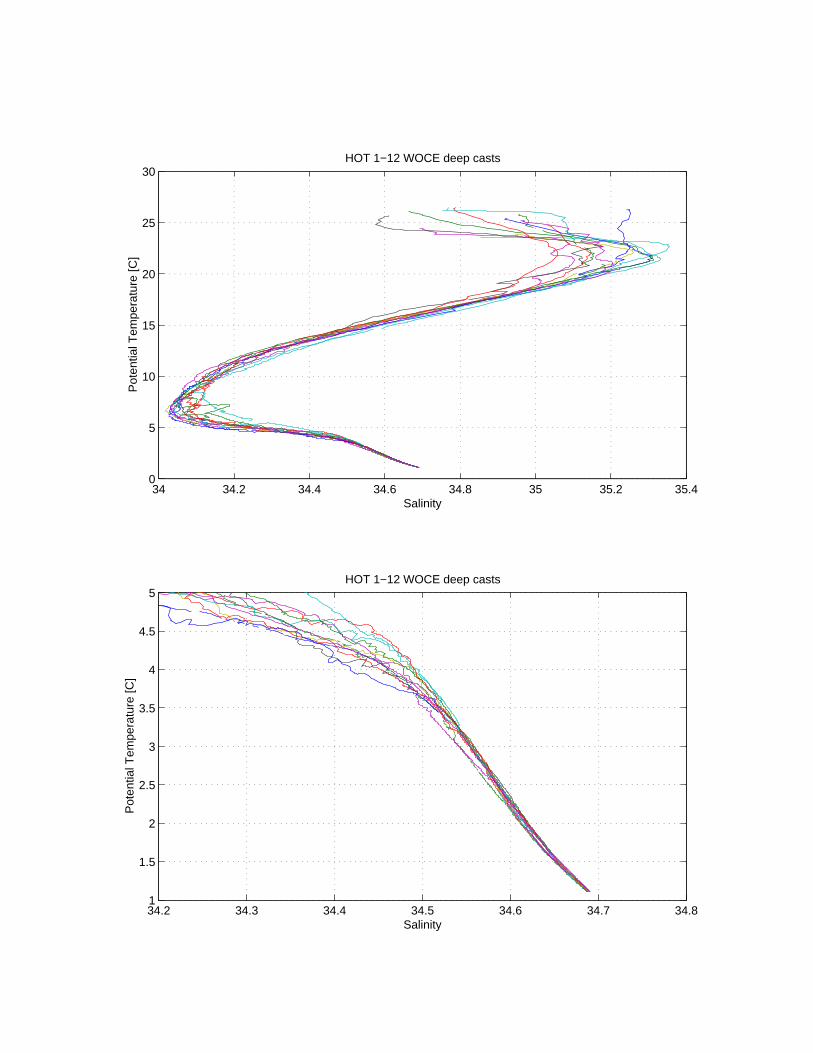
Figure VII.A.23
34 34.2 34.4 34.6 34.8 35 35.2 35.40
5
10
15
20
25
30
Salinity
Pot
entia
l Tem
pera
ture
[C]
HOT 1−12 WOCE deep casts
34.2 34.3 34.4 34.5 34.6 34.7 34.81
1.5
2
2.5
3
3.5
4
4.5
5
Salinity
Pot
entia
l Tem
pera
ture
[C]
HOT 1−12 WOCE deep casts
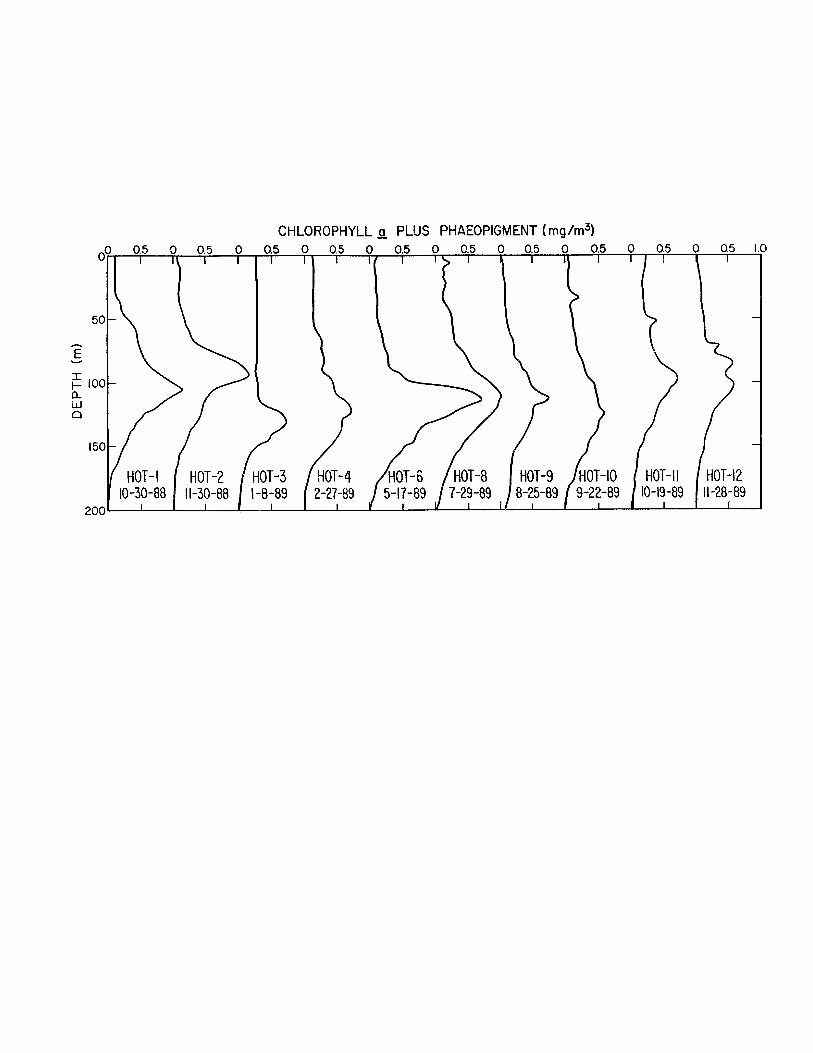
Figure VII.A.24

VII.B. Water Column Measurements
Figure VII.B.1: Difference between in situ temperature and sample temperature at the time the
oxygen was fixed (δ temperature) for HOT-11 and -12.
Figure VII.B.2: Dissolved oxygen in deep water versus time during 1988–1989. Upper panelshows oxygen concentrations at 3 isopycnals. Lower panel shows oxygen concentrations at 3depths. Concentration at these locations were interpolated from determinations at the two clos-est depth horizons.
Figure VII.B.3: Nitrate plus nitrite determined for replicate samples versus time during 1989 and1990. Replicate samples were collected from the same Niskin bottles at three depths early inthe first year of the program and then one sample from each depth was analyzed with nutrientsamples from each subsequent HOT cruise. The first point in each panel is the mean of 17replicate samples collected from a single Niskin bottle. The error bars represent the standarddeviation of these analyses. Subsequent points in each panel are the mean of three analyses ofone of the replicates analyzed previously and maintained at -20°C. Error bars for these pointsare the standard deviation of these 3 analyses.
Figure VII.B.4: As in Figure VII.B.3, except for phosphate.
Figure VII.B.5: As in Figure VII.B.3, expect for silicate.
Figure VII.B.6: Nitrate plus nitrite in deep water versus time during 1988–1989. Upper panelshows nitrate plus nitrite at 3 isopycnals. Lower panel shows nitrate plus nitrite at 3 depth ho-rizons. Nitrate plus nitrite concentrations at each depth were interpolated from the two nearestdepths.
Figure VII.B.7: As in Figure VII.B.6, except for phosphate.
Figure VII.B.8: As in Figure VII.B.6, except for silicate.
Figure VII.B.9: Chlorophyll a measured by fluorometry versus chlorophyll a measured byHPLC. Individual samples were collected from separate casts on each HOT cruise. The slopeof the regression is not different than 1 at p = 0.001. Error bars represent standard deviationsfrom each analysis when available.
- 198 -

Figure VII.B.1

Figure VII.B.2(Top), Figure VII.B.6(Bottom)
80
90
100
110
120
130
140
150
160
umol
/kg
HOT 2−100 Dissolved Oxygen (o − 27.782, x − 27.758, * − 27.675)
O J A J O J A J O J A J O J A J O J A J O J A J O J A J O J A J O J A J O J A J O1989 1990 1991 1992 1993 1994 1995 1996 1997 1998
34
35
36
37
38
39
40
41
42
umol
/kg
HOT 2−100 Dissolved Nitrate & Nitrite (o − 27.782, x − 27.758, * − 27.675)
O J A J O J A J O J A J O J A J O J A J O J A J O J A J O J A J O J A J O J A J O1989 1990 1991 1992 1993 1994 1995 1996 1997 1998

Figure VII.B.3

Figure VII.B.4

Figure VII.B.5

Figure VII.B.7(Top), VII.B.8(Bottom)
2.4
2.5
2.6
2.7
2.8
2.9
umol
/kg
HOT 2−100 Soluble Reactive Phosphorus (o − 27.782, x − 27.758, * − 27.675)
O J A J O J A J O J A J O J A J O J A J O J A J O J A J O J A J O J A J O J A J O1989 1990 1991 1992 1993 1994 1995 1996 1997 1998
144
146
148
150
152
154
156
158
160
162
164
umol
/kg
HOT 2−100 Dissolved Silica (o − 27.782, x − 27.758, * − 27.675)
O J A J O J A J O J A J O J A J O J A J O J A J O J A J O J A J O J A J O J A J O1989 1990 1991 1992 1993 1994 1995 1996 1997 1998

Figure VII.B.9

VII.C. Primary Productivity
Figure VII.C.1: Integrated primary production rates for HOT-1 through HOT-12. Results of both12- and 24-hour on-deck incubations are shown.
Figure VII.C.2: Simultaneous rates of primary production measured on deck and in situ. Incuba-tions were conducted for 12 hours and subsamples from the same Niskin bottle were incu-bated both on deck and in situ at each depth.
- 206 -
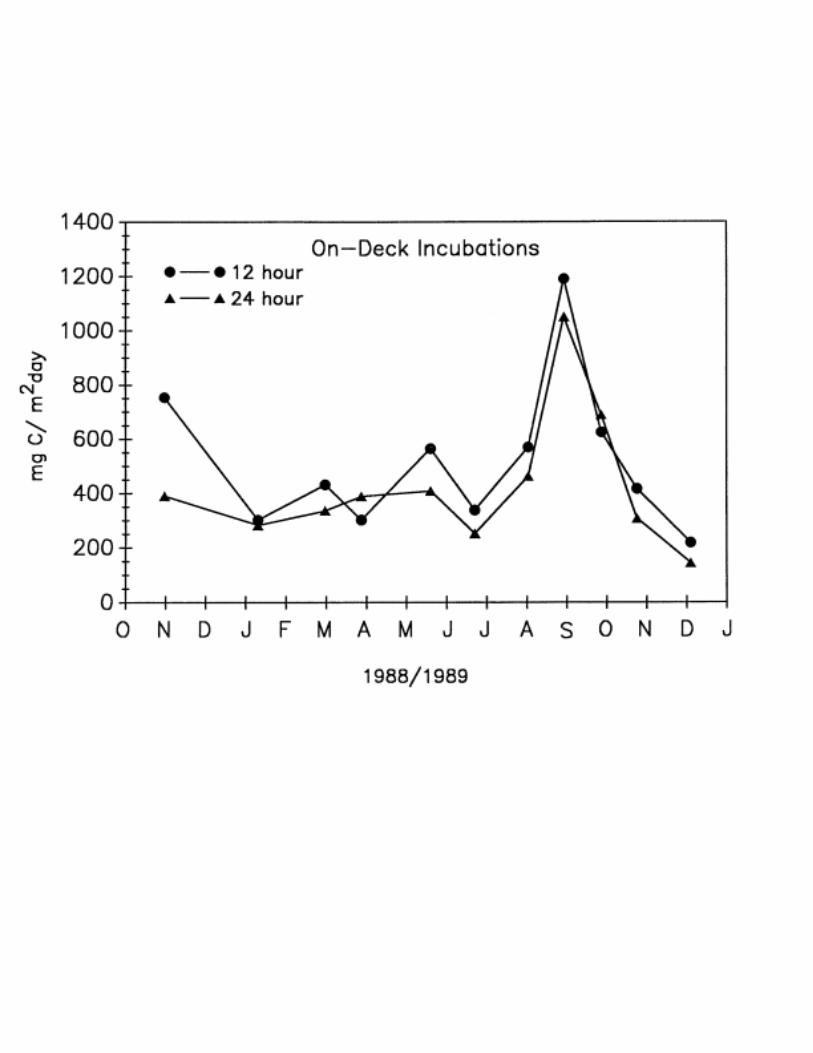
Figure VII.C.1

Figure VII.C.2
0
200
400
600
800
1000
1200
O J A J O J A J O J A J O J A J O J A J O J A J O J A J O J A J O J A J O J A J O1989 1990 1991 1992 1993 1994 1995 1996 1997 1998
Prim
ary
Pro
duct
ion
(mg
C m
−2 d
−1)
Sampling Date
0
100
200
300
400
500
600
700
800
900
1000
O J A J O J A J O J A J O J A J O J A J O J A J O J A J O J A J O J A J O J A J O1989 1990 1991 1992 1993 1994 1995 1996 1997 1998
Prim
ary
Pro
duct
ion
(mg
C m
−2 d
−1)
Sampling Date

VII.D. Particle Flux
Figure VII.D.1: Carbon flux measured at 150 m during 1988– 1989. Error bars represent thestandard deviation of replicate analyses.
Figure VII.D.2: Nitrogen flux measured at 150 m during 1988–1989. Error bars represent thestandard deviations of replicate analyses.
Figure VII.D.3: Carbon:Nitrogen ratio measured at 150 m during 1988–1989. Error bars repre-sent the standard deviations estimated by propagating errors associated with individual meas-urements of carbon and nitrogen.
Figure VII.D.4: Nitrogen flux as a percent of photosynthetic nitrogen production. Photosyntheticnitrogen production was calculated using the contemporaneous rate of primary production us-ing the carbon-14 method and assuming that nitrogen was incorporated at a C:N rate (by at-oms) of 106:16.
Figure VII.D.5: Carbon flux versus depth during 1988–1989. Data points represent the averageflux at each depth using all data collected on HOT-1 through HOT-12. Error bars are 95%confidence intervals on the mean.
Figure VII.D.6: Nitrogen flux versus depth during 1988–1989. Data points represent the averageflux at each depth using all data collected on HOT-1 through HOT-12. Error bars are 95%confidence intervals on the mean.
- 209 -
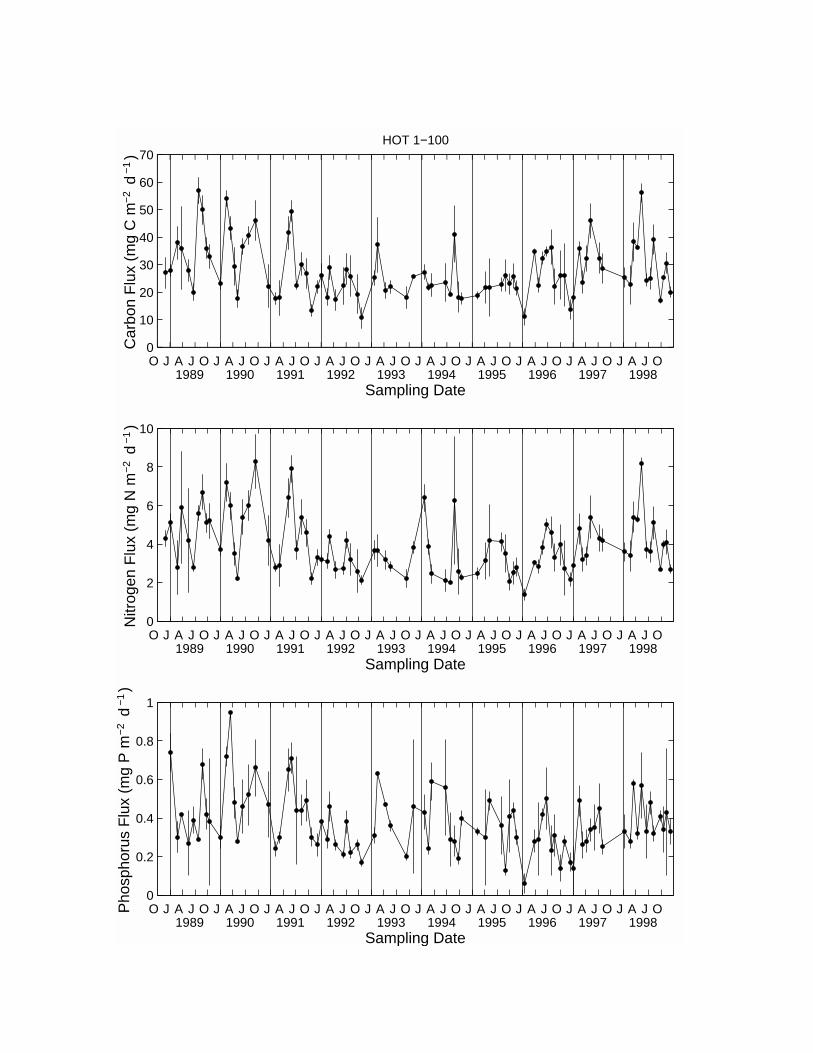
Figure VII.D.1(Top), VII.D.2(Middle)
0
10
20
30
40
50
60
70HOT 1−100
O J A J O J A J O J A J O J A J O J A J O J A J O J A J O J A J O J A J O J A J O1989 1990 1991 1992 1993 1994 1995 1996 1997 1998
Car
bon
Flu
x (m
g C
m −
2 d
−1)
Sampling Date
0
2
4
6
8
10
O J A J O J A J O J A J O J A J O J A J O J A J O J A J O J A J O J A J O J A J O1989 1990 1991 1992 1993 1994 1995 1996 1997 1998
Nitr
ogen
Flu
x (m
g N
m −
2 d
−1)
Sampling Date
0
0.2
0.4
0.6
0.8
1
O J A J O J A J O J A J O J A J O J A J O J A J O J A J O J A J O J A J O J A J O1989 1990 1991 1992 1993 1994 1995 1996 1997 1998
Pho
spho
rus
Flu
x (m
g P
m −
2 d
−1)
Sampling Date
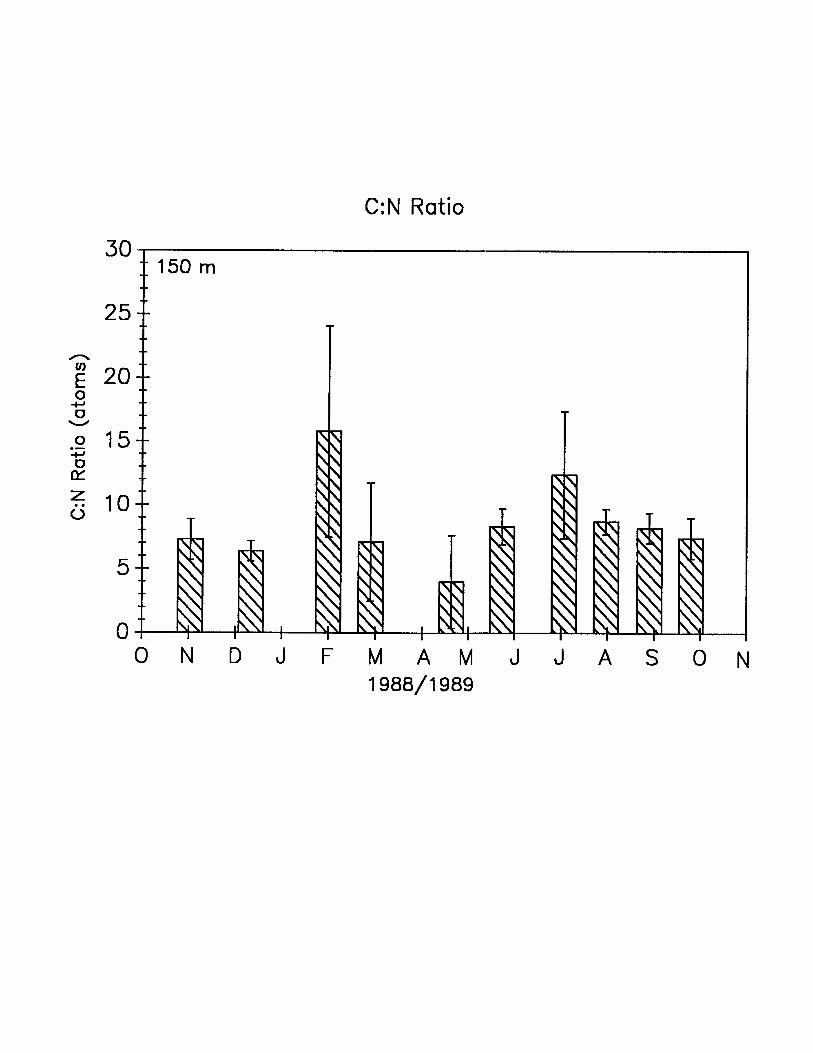
Figure VII.D.3
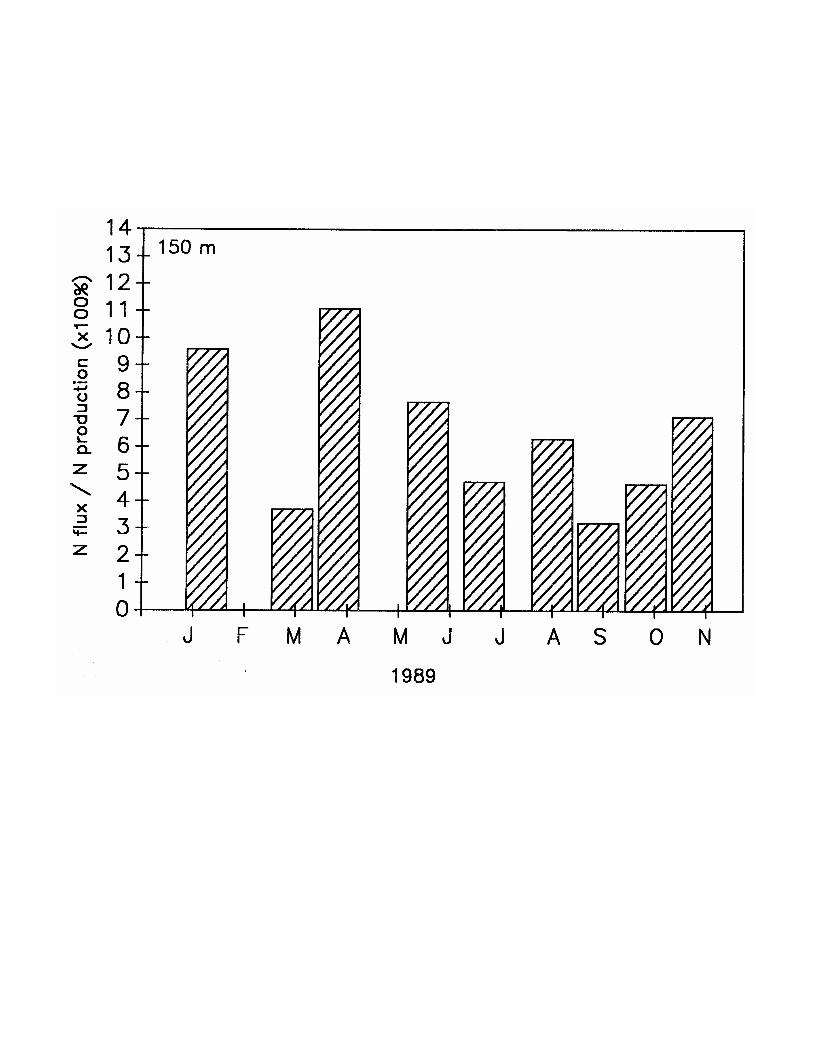
Figure VII.D.4
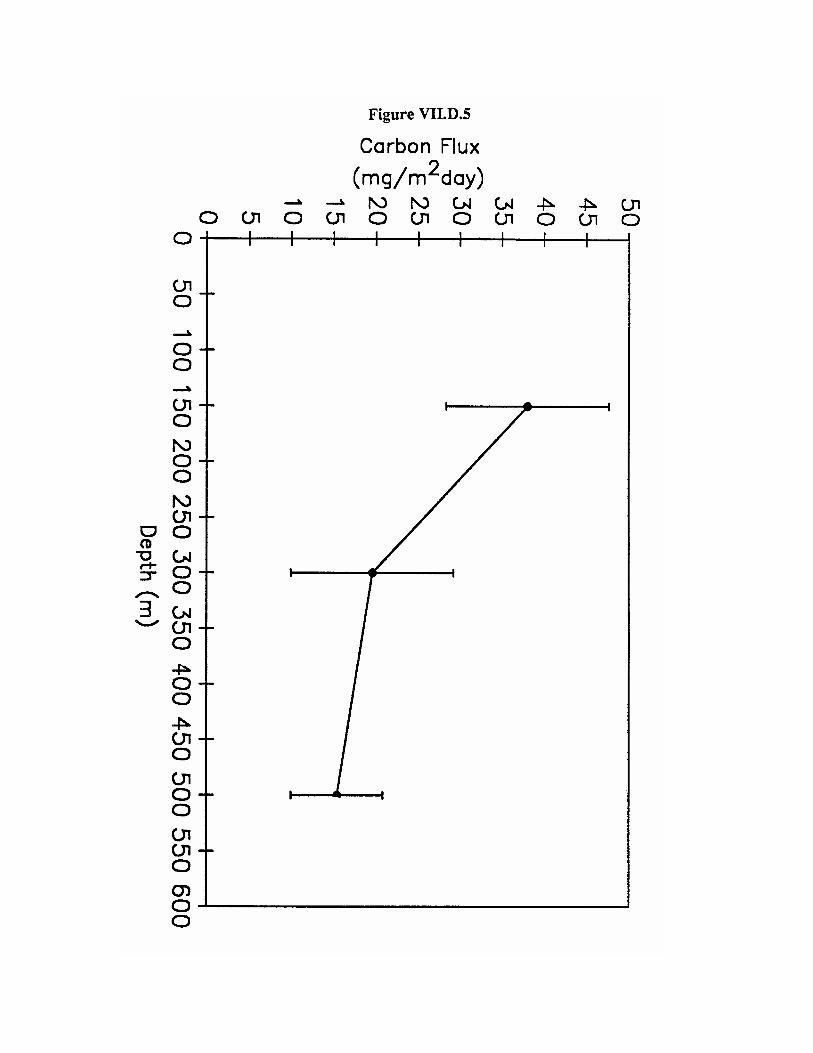


VII.E. ADCP Profiling
For each cruise with shipboard ADCP, the following figures (VII.E.1–6) are provided:
Navigation: Reference layer velocity and ship’s longitude and latitude as functions of time. Timeis given in days from the beginning of the year; for example, noon on January 1 is 0.5 deci-mal days. The reference layer velocity is shown averaged between fixes (steppy curves), andsmoothed, as used in the final velocity estimates (smooth curves). Plus signs near the bottomof the reference layer velocity plots indicate ADCP data gaps. The ship’s position is shownby asterisks at fixes and by a continuous curve (actually closely spaced dots) as determinedby fixes together with the ADCP data.
Velocity field on station: The top panel shows hourly averages at 20-m depth intervals while theship was at Station ALOHA. The orientation of each stick gives the direction of the current:up is northward, to the right is eastward. The bottom panel shows the results of a least-squares fit of the hourly averages to a mean, trend, semidiurnal, and diurnal tides, and an iner-tial cycle. In the first column, the arrow shows the mean current, and the headless stick showsthe sum of the mean plus the trend at the end of the station. For each harmonic, the current el-lipse is shown in the first column. The orientation of the stick in the second column showsthe direction of that harmonic component of the current at the beginning of the station, andthe arrowhead at the end of the stick shows the direction of rotation of the current vectoraround the ellipse. Only the mean and trend were fitted for HOT-11, because the recordlength was less than 3 days, there was no Transit navigation, and there were large signals dueto spatial rather than temporal gradients. For HOT-12 the tides were included in the fit inspite of the short record length, because the variability in the raw data looks largely tidal.
Velocity field on the transits to and from the station: Velocity is shown as a function of latitude,averaged in 10-minute time intervals.
Figure VII.E.7: Velocity profile during HOT-12, made with the self-contained ADCP: zonal com-ponent (top), and meridional component (bottom). Solid curves are the downcast, dashed arethe upcast. Each curve is referenced by fitting the overlapping part of the simultaneous ship-board ADCP profile.
- 215 -
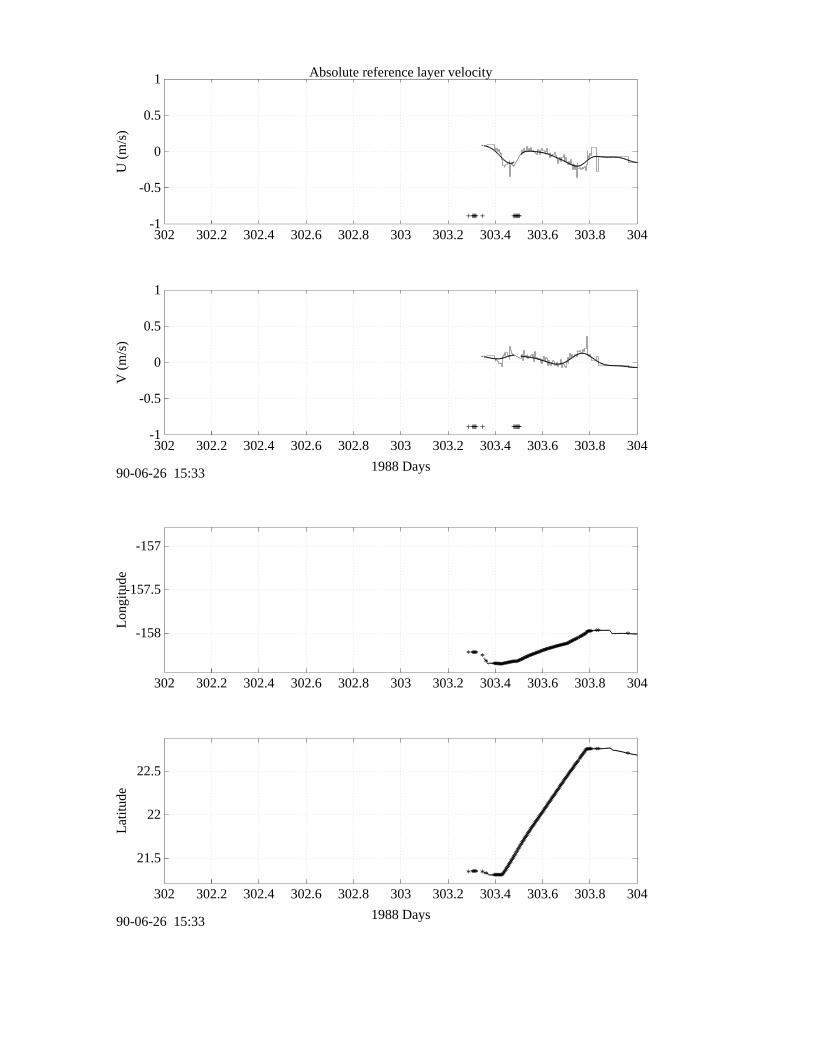
Figure VII.E.1
-1
-0.5
0
0.5
1
302 302.2 302.4 302.6 302.8 303 303.2 303.4 303.6 303.8 304
+++++++ ++++++++
.......................................................................................................................
.............................................................
U (
m/s
)
Absolute reference layer velocity
-1
-0.5
0
0.5
1
302 302.2 302.4 302.6 302.8 303 303.2 303.4 303.6 303.8 304
+++++++ ++++++++
...................................... ..............................................................................................................................................
V (
m/s
)
1988 Days90-06-26 15:33
-158
-157.5
-157
302 302.2 302.4 302.6 302.8 303 303.2 303.4 303.6 303.8 304
...................................... ..................................
.....................................
.......................................................................
****** ** ************************************
************************************
*********************************
*************** *
Lon
gitu
de
21.5
22
22.5
302 302.2 302.4 302.6 302.8 303 303.2 303.4 303.6 303.8 304
......................................
........................................................................................
......................................................
****** ** ************************************************************************************************************************ *
Lat
itude
1988 Days90-06-26 15:33

Figure VII.E.1 (cont’d)
-1
-0.5
0
0.5
1
304 304.2 304.4 304.6 304.8 305 305.2 305.4 305.6 305.8 306
...........................................................................................................................................................................................................................
........................................................................................................................................
.........................................................................................................................................................................................................
...................
U (
m/s
)
Absolute reference layer velocity
-1
-0.5
0
0.5
1
304 304.2 304.4 304.6 304.8 305 305.2 305.4 305.6 305.8 306
....................................................................................................................................................................................
..............................................................................................................................................................................
.............................................................................................................................................................................................................................
V (
m/s
)
1988 Days90-06-26 15:33
-158.1
-158
-157.9
304 304.2 304.4 304.6 304.8 305 305.2 305.4 305.6 305.8 306
.............................................................................................................................
...............................................................................................
....................................................
........................................................................................................
............
..........................................................................
.......................................................................
..........................................* * * * ********************** *************
***********************************************************************************************
************ **
*
** ********************
** **************
******************************************************************************************************** *
**
*
*
Lon
gitu
de
22.6
22.7
22.8
22.9
304 304.2 304.4 304.6 304.8 305 305.2 305.4 305.6 305.8 306
...........
....................................................
.........................................
................................................................
........................................................................................................
..........................................
.....................
.................................................................................................
................................................................
................
............................................
...................* * * * **********************
*******************************************************
****************************************************************
* ** *
**
***************************************
****************************
************************************************************
*************
** * * *
Lat
itude
1988 Days90-06-26 15:34
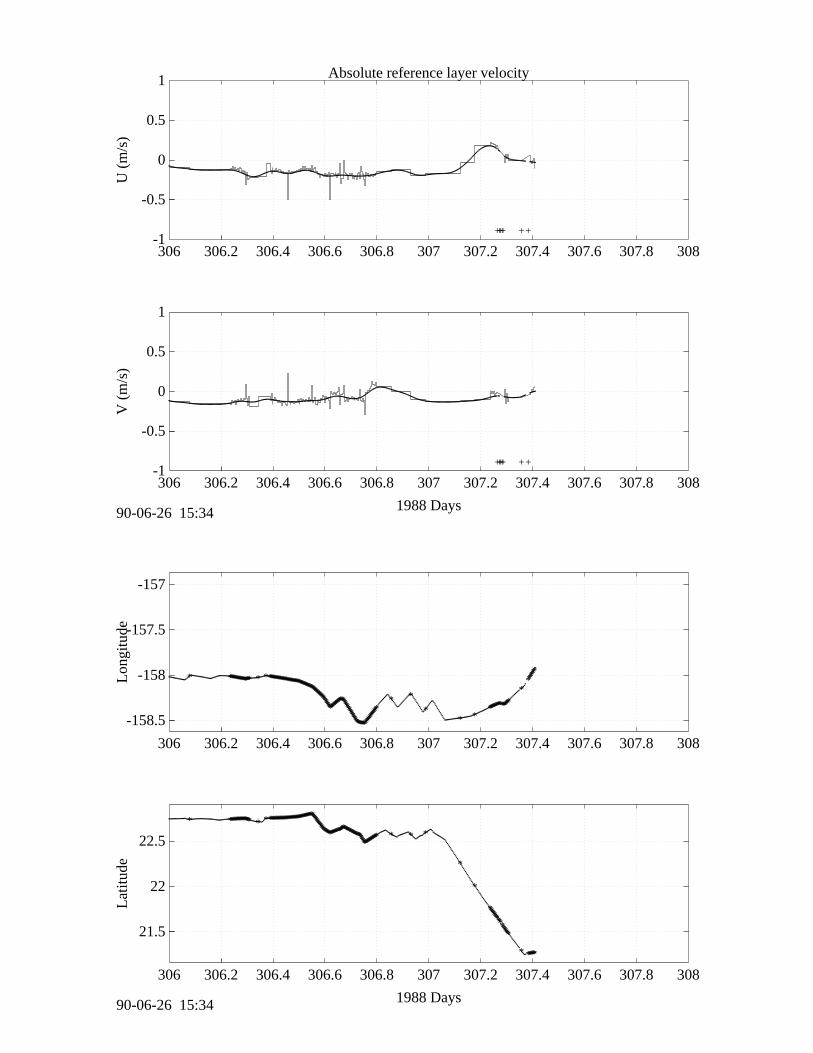
Figure VII.E.1 (cont’d)
-1
-0.5
0
0.5
1
306 306.2 306.4 306.6 306.8 307 307.2 307.4 307.6 307.8 308
+++++ ++
................................................................................................................................................................................................................................................................................................................................
................
............................... ....................... .......
U (
m/s
)
Absolute reference layer velocity
-1
-0.5
0
0.5
1
306 306.2 306.4 306.6 306.8 307 307.2 307.4 307.6 307.8 308
+++++ ++
.............................................................................................................................................................................................................................
.................................................................................................................................................. ....................... .......
V (
m/s
)
1988 Days90-06-26 15:34
-158.5
-158
-157.5
-157
306 306.2 306.4 306.6 306.8 307 307.2 307.4 307.6 307.8 308
..............................................................................................................................................................................................................................
................
..................................................
..................................................................
............. ..............
.........
.......
* ********************** * ***************************************************************************************************************
*********
* **
* ********************
**
********L
ongi
tude
21.5
22
22.5
306 306.2 306.4 306.6 306.8 307 307.2 307.4 307.6 307.8 308
....................................................................................................................................................................................................................................
.........................................................
......................................................................................................... .......
* ********************** * ************************************************************************************************************************ * * *
*
*
********************
* ********
Lat
itude
1988 Days90-06-26 15:34

Figure VII.E.1 (cont’d)
-300
-250
-200
-150
-100
-50
0
303.5 304 304.5 305 305.5 306 306.5 307
Dep
th (
m)
0.5 m/s
HOT-1 (MW8812) velocity
1988 days
-300
-250
-200
-150
-100
-50
0
0 0.5 1 1.5 2 2.5 3 3.5 4
Dep
th (
m)
0.1 m/s
Dep
th (
m)
Dep
th (
m)
Dep
th (
m)
Dep
th (
m)
Dep
th (
m)
Dep
th (
m)
Dep
th (
m)
HOT-1 (MW8812) 88/10/31 20:01 - 88/11/03 22:58
mean+ trend
semidiurnal12.42 hrs
diurnal24 hrs
inertial31 hrs
90-06-25 15:11

Figure VII.E.1 (cont’d)
-300
-250
-200
-150
-100
-50
0
21 21.2 21.4 21.6 21.8 22 22.2 22.4 22.6 22.8 23
Dep
th (
m)
0.5 m/s
MW8812 (HOT-1), 158W Northbound
Latitude90-06-26 15:52
-300
-250
-200
-150
-100
-50
0
21 21.2 21.4 21.6 21.8 22 22.2 22.4 22.6 22.8 23
Dep
th (
m)
0.5 m/s
MW8812 (HOT-1), 158W Southbound
Latitude90-06-26 15:52

Figure VII.E.2
-1
-0.5
0
0.5
1
334 334.2 334.4 334.6 334.8 335 335.2 335.4 335.6 335.8 336
++ ++ + ++ +++++
.......... ............
............................ .................................................................................
................................................................
U (
m/s
)
Absolute reference layer velocity
-1
-0.5
0
0.5
1
334 334.2 334.4 334.6 334.8 335 335.2 335.4 335.6 335.8 336
++ ++ + ++ +++++
.......... ............ ............................
.................................................................................................................................................
V (
m/s
)
1988 Days89- 8-25 14:44
-158
-157.5
-157
334 334.2 334.4 334.6 334.8 335 335.2 335.4 335.6 335.8 336
...................... ............................ .................
...................................
.........................
....................................................................
Lon
gitu
de
21.5
22
22.5
334 334.2 334.4 334.6 334.8 335 335.2 335.4 335.6 335.8 336
.......... ............ ...............
.............
.................................................................................................................................................
Lat
itude
1988 Days89- 8-25 14:44

Figure VII.E.2 (cont’d)
-1
-0.5
0
0.5
1
336 336.2 336.4 336.6 336.8 337 337.2 337.4 337.6 337.8 338
..........................................................................................................................................................
......................................................................................................................................................................................................................................................................................................................................................................................................................................U
(m
/s)
Absolute reference layer velocity
-1
-0.5
0
0.5
1
336 336.2 336.4 336.6 336.8 337 337.2 337.4 337.6 337.8 338
..........................................................................................................................................
...........................................................................................................................
...........................................................................................................................................................................................................................................................................................................................
V (
m/s
)
1988 Days89- 8-25 14:45
-158.1
-158
-157.9
336 336.2 336.4 336.6 336.8 337 337.2 337.4 337.6 337.8 338
................................................................................................................................................................................................................
................................................................................................................................................................................................................
................................................................................................................................................................Lon
gitu
de
22.7
22.8
22.9
336 336.2 336.4 336.6 336.8 337 337.2 337.4 337.6 337.8 338
......................................................................................................................................................
...........................................................................................................................................
.........................................................................................................................................
.............
..........................................................................
.......................
........................................
Lat
itude
1988 Days89- 8-25 14:45

Figure VII.E.2 (cont’d)
-1
-0.5
0
0.5
1
338 338.2 338.4 338.6 338.8 339 339.2 339.4 339.6 339.8 340
+
....................................
....................................................................................................................................................................................................................................................................................
........... ............................
U (
m/s
)
Absolute reference layer velocity
-1
-0.5
0
0.5
1
338 338.2 338.4 338.6 338.8 339 339.2 339.4 339.6 339.8 340
+
..............................................................................................................................................................................................................................................................................................................................
..... ............................
V (
m/s
)
1988 Days89- 8-25 14:46
-158
-157.5
-157
338 338.2 338.4 338.6 338.8 339 339.2 339.4 339.6 339.8 340
.................................................................................................................................
.................................................................................................................................................................................................. ....................
........
Lon
gitu
de
21.5
22
22.5
338 338.2 338.4 338.6 338.8 339 339.2 339.4 339.6 339.8 340
...................................................................................................................................................................................................................................................................................................................................
............................
Lat
itude
1988 Days89- 8-25 14:47

Figure VII.E.2 (cont’d)
-300
-250
-200
-150
-100
-50
0
335.5 336 336.5 337 337.5 338 338.5 339
Dep
th (
m)
0.5 m/s
HOT-2 (MW8814) velocity
1988 days
-300
-250
-200
-150
-100
-50
0
Dep
th (
m)
0.1 m/s
Dep
th (
m)
Dep
th (
m)
Dep
th (
m)
Dep
th (
m)
Dep
th (
m)
Dep
th (
m)
Dep
th (
m)
HOT-2 (MW8814) 88/12/01 20:00 - 88/12/04 19:00
mean+ trend
semidiurnal12.42 hrs
diurnal24 hrs
inertial31 hrs
90-06-25 15:17
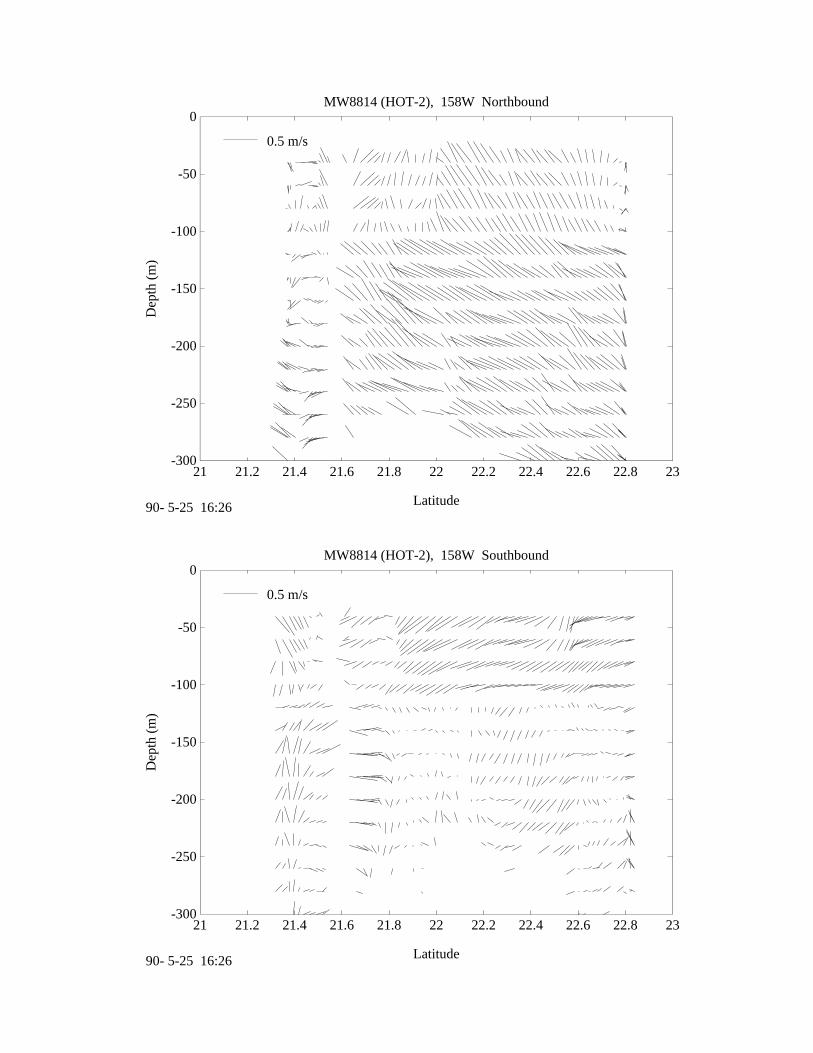
Figure VII.E.2 (cont’d)
-300
-250
-200
-150
-100
-50
0
21 21.2 21.4 21.6 21.8 22 22.2 22.4 22.6 22.8 23
Dep
th (
m)
0.5 m/s
MW8814 (HOT-2), 158W Northbound
Latitude90- 5-25 16:26
-300
-250
-200
-150
-100
-50
0
21 21.2 21.4 21.6 21.8 22 22.2 22.4 22.6 22.8 23
Dep
th (
m)
0.5 m/s
MW8814 (HOT-2), 158W Southbound
Latitude90- 5-25 16:26

Figure VII.E.3
-1
-0.5
0
0.5
1
6 6.2 6.4 6.6 6.8 7 7.2 7.4 7.6 7.8 8
+++++ +
..................................... ............... ..... ...................
............................
....................................................................................................................
.............................................................................................................................................................................................................................................
U (
m/s
)
Absolute reference layer velocity
-1
-0.5
0
0.5
1
6 6.2 6.4 6.6 6.8 7 7.2 7.4 7.6 7.8 8
+++++ +
..................................... ............... ..... ..
.....................................................................................................................................................
..................................................................................................................................
.......................................................................................................................
V (
m/s
)
1989 Days89- 5-10 17:10
-158
-157.5
-157
6 6.2 6.4 6.6 6.8 7 7.2 7.4 7.6 7.8 8
..................................... ............... ..... ..
...........................
................
.....................................................................................................................................................................
..............................................................................................................................................................................................
Lon
gitu
de
21.5
22
22.5
6 6.2 6.4 6.6 6.8 7 7.2 7.4 7.6 7.8 8
..........................
...........
.........
......
..... .
...........
..........
...............
.............
..............................................................................................................................................................................................................................................................................................................................................................
Lat
itude
1989 Days89- 5-10 17:11

Figure VII.E.3 (cont’d)
-1
-0.5
0
0.5
1
8 8.2 8.4 8.6 8.8 9 9.2 9.4 9.6 9.8 10
..................................................................................................................................................................
.......................................................................................................................................................................................
................................................................................................................
.....................................
................................................................................U
(m
/s)
Absolute reference layer velocity
-1
-0.5
0
0.5
1
8 8.2 8.4 8.6 8.8 9 9.2 9.4 9.6 9.8 10
.................................................................................................................................................................................
.........................................................................................................................................................................................
...............................................................................................
.....................................................................................................................
V (
m/s
)
1989 Days89- 5-10 17:11
-158.2
-158
-157.8
8 8.2 8.4 8.6 8.8 9 9.2 9.4 9.6 9.8 10
......................................................................
.................................................................................................
.............................................................................
.........................................................
................................................................
.................................
............................................................................................................................
....................................................
Lon
gitu
de
22.4
22.6
22.8
8 8.2 8.4 8.6 8.8 9 9.2 9.4 9.6 9.8 10
..............................................................................................................................................................................................................................................
...................................................................................................................................................................................................................................................................................................................................
Lat
itude
1989 Days89- 5-10 17:12

Figure VII.E.3 (cont’d)
-1
-0.5
0
0.5
1
10 10.2 10.4 10.6 10.8 11 11.2 11.4 11.6 11.8 12
+++++
..............................
......................................... ...........
U (
m/s
)
Absolute reference layer velocity
-1
-0.5
0
0.5
1
10 10.2 10.4 10.6 10.8 11 11.2 11.4 11.6 11.8 12
+++++
..................................................................................
V (
m/s
)
1989 Days89- 5-10 17:12
-158
-157.5
10 10.2 10.4 10.6 10.8 11 11.2 11.4 11.6 11.8 12
.........................................................
..............
...........
Lon
gitu
de
21.5
22
10 10.2 10.4 10.6 10.8 11 11.2 11.4 11.6 11.8 12
....................................................................... ...........
Lat
itude
1989 Days89- 5-10 17:12
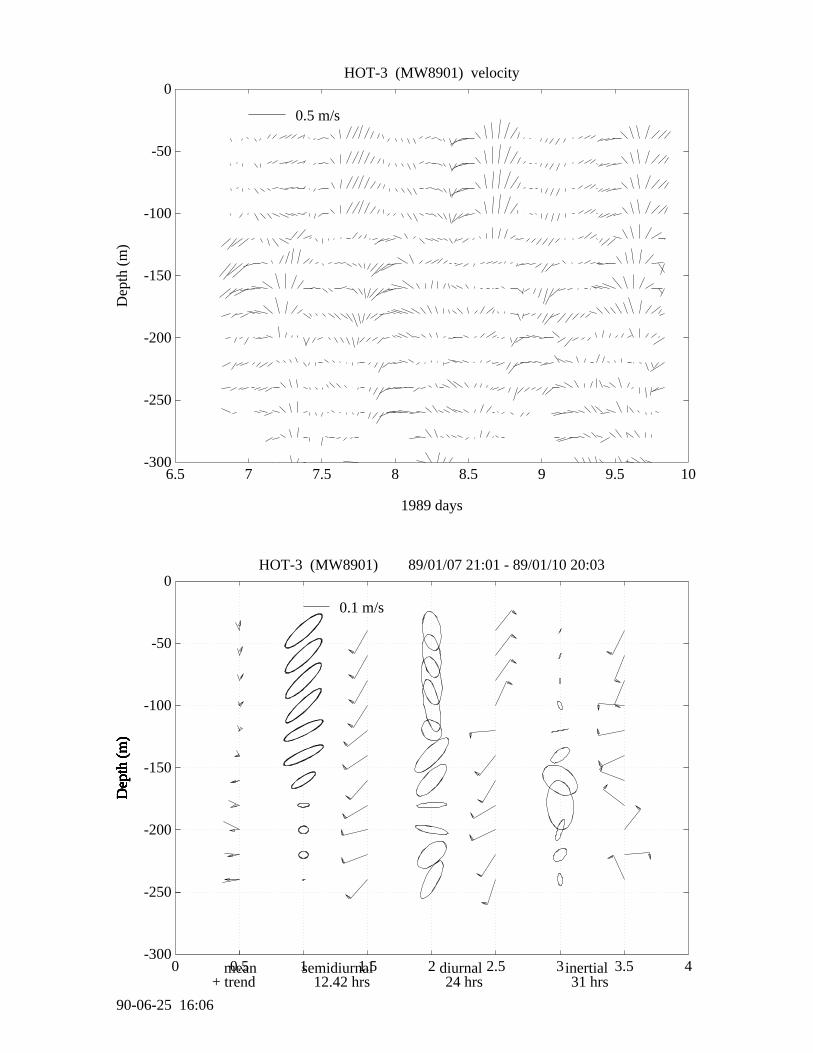
Figure VII.E.3 (cont’d)
-300
-250
-200
-150
-100
-50
0
6.5 7 7.5 8 8.5 9 9.5 10
Dep
th (
m)
0.5 m/s
HOT-3 (MW8901) velocity
1989 days
-300
-250
-200
-150
-100
-50
0
0 0.5 1 1.5 2 2.5 3 3.5 4
Dep
th (
m)
0.1 m/s
Dep
th (
m)
Dep
th (
m)
Dep
th (
m)
Dep
th (
m)
Dep
th (
m)
Dep
th (
m)
Dep
th (
m)
HOT-3 (MW8901) 89/01/07 21:01 - 89/01/10 20:03
mean+ trend
semidiurnal12.42 hrs
diurnal24 hrs
inertial31 hrs
90-06-25 16:06

Figure VII.E.3 (cont’d)
21 21.5 22 22.5 23 23.5−300
−250
−200
−150
−100
−50
00.1 m/s
158W Northbound
Latitude
Dep
th (
m)
HOT−3
21 21.5 22 22.5 23 23.5−300
−250
−200
−150
−100
−50
00.1 m/s
158W Southbound
Latitude
Dep
th (
m)

Figure VII.E.4
-1
-0.5
0
0.5
1
84 84.2 84.4 84.6 84.8 85 85.2 85.4 85.6 85.8 86
+
...............................................................................................
.................................................................................................................................................................... ................................................................
.....................
.................................................................................................................................................................................................................................................................................................................................................................................
U (
m/s
)
Absolute reference layer velocity
-1
-0.5
0
0.5
1
84 84.2 84.4 84.6 84.8 85 85.2 85.4 85.6 85.8 86
+
............................................................................................................................................
................................................
.......................................................................
.............................................
.........................................................................................................................................................................................................................................................................................................................................................................................................................
V (
m/s
)
1989 Days90- 5- 9 15:15
-158
-157.5
-157
84 84.2 84.4 84.6 84.8 85 85.2 85.4 85.6 85.8 86
...................................................................................................................................................................................................................................................................
.................................................
.................
..............................................................................................................................................................................................................................................................................................................
......................................................................................***************************************************************************************************************************************************************************************************************************************** * *
** * * * ********************* * ************************************************************************************************* * * * * * * * *********************************
Lon
gitu
de
21.5
22
22.5
84 84.2 84.4 84.6 84.8 85 85.2 85.4 85.6 85.8 86
.......................................................................................................................................................
............................................
................................................................
.................
................
..........................
......................................................................................................................................................................................................................
.....................................................................................................................................................................................
********************************************************************************************************************************************
************************************************************
********************************
*
*
*
** * * * ********************* * ************************************************************************************************* * * * * * * * *********************************
Lat
itude
1989 Days90- 5- 9 15:15
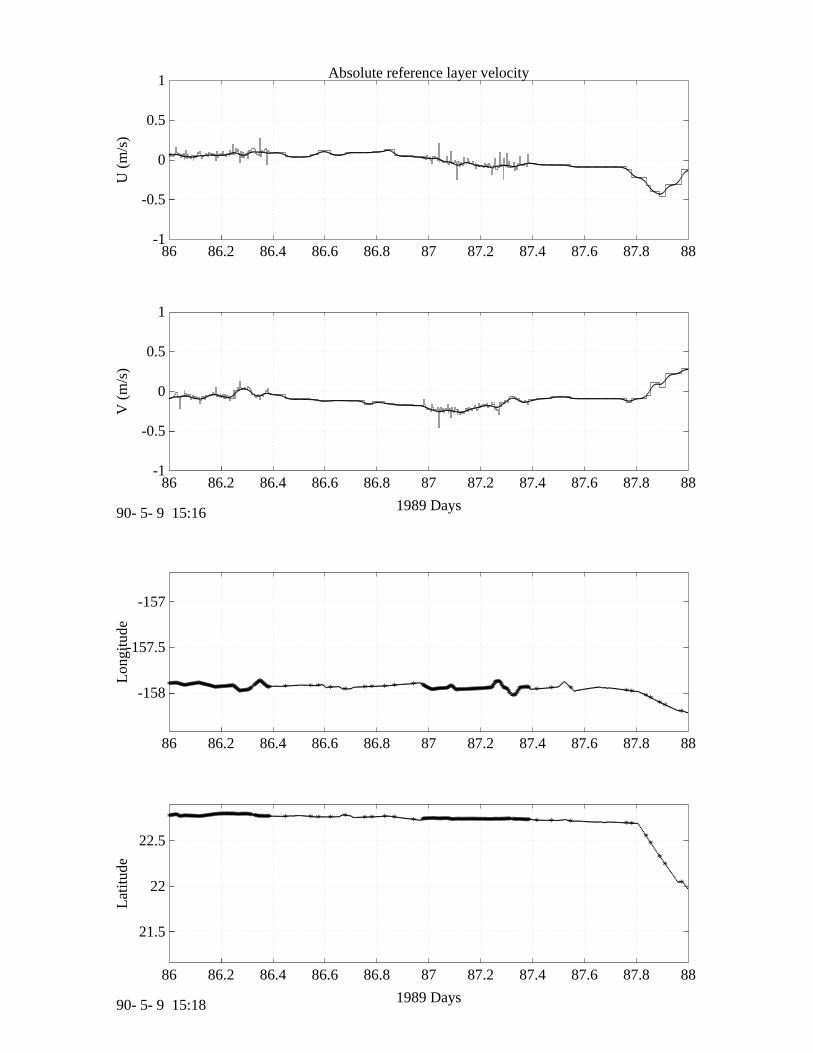
Figure VII.E.4 (cont’d)
-1
-0.5
0
0.5
1
86 86.2 86.4 86.6 86.8 87 87.2 87.4 87.6 87.8 88
.........................................................................................................................................................................................................................................................................................................................................................................................................................................................................................................................................................................
.......................U
(m
/s)
Absolute reference layer velocity
-1
-0.5
0
0.5
1
86 86.2 86.4 86.6 86.8 87 87.2 87.4 87.6 87.8 88
...........................................................................................................................................................................................................................................................................................................................................................
......................................................................................................................................................................................
...................
.......................
.....
V (
m/s
)
1989 Days90- 5- 9 15:16
-158
-157.5
-157
86 86.2 86.4 86.6 86.8 87 87.2 87.4 87.6 87.8 88
.....................................................................................................................................................................................................................................................................................
...............................................................................................................
............................................................................................................................................................................................
************************************************************************************************************** * * * * * * * * * * ********************************************************************************
************************************* * * * ** ** **
*
Lon
gitu
de
21.5
22
22.5
86 86.2 86.4 86.6 86.8 87 87.2 87.4 87.6 87.8 88
................................................................................................................................................................................................................................................................................................................................................................................................................................................................................................................................................................................................
************************************************************************************************************** * * * * * * * * * * ********************************************************************************************************************* * * * ****
**
*
Lat
itude
1989 Days90- 5- 9 15:18

Figure VII.E.4 (cont’d)
-1
-0.5
0
0.5
1
88 88.2 88.4 88.6 88.8 89 89.2 89.4 89.6 89.8 90
...........................................................................................................
.............................................
U (
m/s
)
Absolute reference layer velocity
-1
-0.5
0
0.5
1
88 88.2 88.4 88.6 88.8 89 89.2 89.4 89.6 89.8 90
........................................................................................................................................................
V (
m/s
)
1989 Days90- 5- 8 17: 5
-158
-157.5
-157
88 88.2 88.4 88.6 88.8 89 89.2 89.4 89.6 89.8 90
...........................................................................
.............................................................................
***************************************************************************
***********************************************************************L
ongi
tude
21.5
22
22.5
88 88.2 88.4 88.6 88.8 89 89.2 89.4 89.6 89.8 90
........................................................................................................................................................
**************************************************************************************************************************************************
Lat
itude
1989 Days90- 5- 8 17: 5

Figure VII.E.4 (cont’d)
-300
-250
-200
-150
-100
-50
0
84.5 85 85.5 86 86.5 87 87.5 88
Dep
th (
m)
0.5 m/s
HOT-5 (MW8905) velocity
1989 days
-300
-250
-200
-150
-100
-50
0
Dep
th (
m)
0.1 m/s
Dep
th (
m)
Dep
th (
m)
Dep
th (
m)
Dep
th (
m)
Dep
th (
m)
Dep
th (
m)
Dep
th (
m)
HOT-5 (MW8905) 89/03/26 17:00 - 89/03/29 19:00
mean+ trend
semidiurnal12.42 hrs
diurnal24 hrs
inertial31 hrs
90-06-25 16:11

Figure VII.E.4 (cont’d)
-300
-250
-200
-150
-100
-50
0
21 21.2 21.4 21.6 21.8 22 22.2 22.4 22.6 22.8 23
Dep
th (
m)
0.5 m/s
MW8905 (HOT-5), 158W Northbound
Latitude90- 5-25 16:36
-300
-250
-200
-150
-100
-50
0
21 21.2 21.4 21.6 21.8 22 22.2 22.4 22.6 22.8 23
Dep
th (
m)
0.5 m/s
MW8905 (HOT-5), 158W Southbound
Latitude90- 5-25 16:36

Figure VII.E.5
−1
−0.5
0
0.5
1
U (
m/s
)
Absolute Reference Layer Velocity HOT−11
289 289.2 289.4 289.6 289.8 290 290.2 290.4 290.6 290.8 291−1
−0.5
0
0.5
1
V (
m/s
)
1989 Days
−158
−157.5
−157
Long
itude
289 289.2 289.4 289.6 289.8 290 290.2 290.4 290.6 290.8 291
21.5
22
22.5
Latit
ude
1989 Days
99−
8−
25 1
0:22
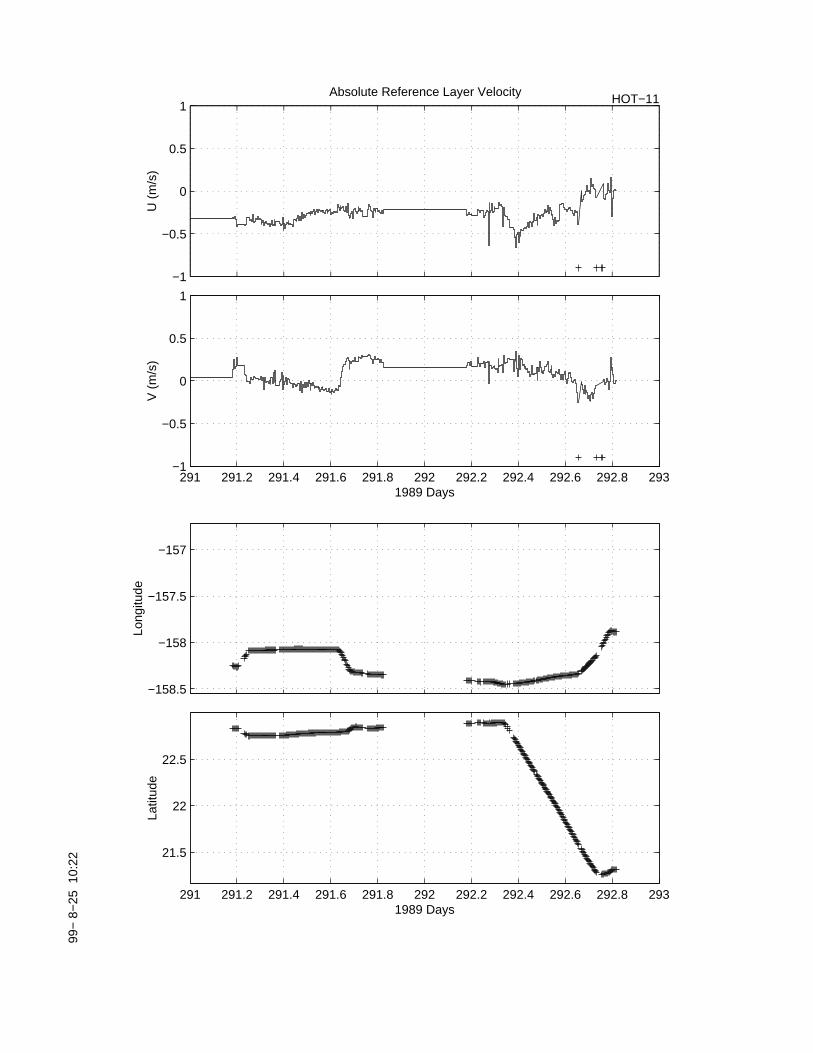
Figure VII.E.5 (cont’d)
−1
−0.5
0
0.5
1
U (
m/s
)
Absolute Reference Layer Velocity HOT−11
291 291.2 291.4 291.6 291.8 292 292.2 292.4 292.6 292.8 293−1
−0.5
0
0.5
1
V (
m/s
)
1989 Days
−158.5
−158
−157.5
−157
Long
itude
291 291.2 291.4 291.6 291.8 292 292.2 292.4 292.6 292.8 293
21.5
22
22.5
Latit
ude
1989 Days
99−
8−
25 1
0:22

Figure VII.E.5 (cont’d)
-300
-250
-200
-150
-100
-50
0
289.5 290 290.5 291 291.5 292 292.5 293
Dep
th (
m)
0.5 m/s
HOT-11 (MW8913) velocity
1989 days
-300
-250
-200
-150
-100
-50
0
Dep
th (
m)
0.1 m/s
Dep
th (
m)
HOT-11 (MW8913) 89/10/17 18:00 - 89/10/20 08:00
mean+ trend
90-06-25 15:56
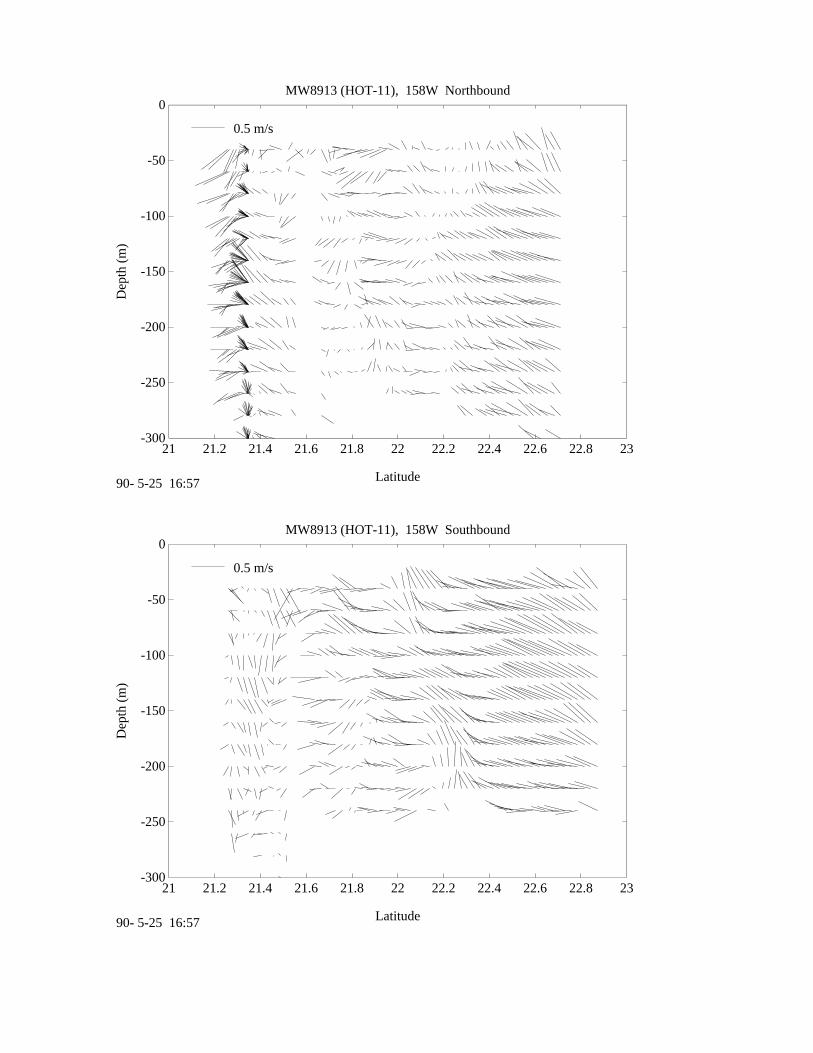
Figure VII.E.5 (cont’d)
-300
-250
-200
-150
-100
-50
0
21 21.2 21.4 21.6 21.8 22 22.2 22.4 22.6 22.8 23
Dep
th (
m)
0.5 m/s
MW8913 (HOT-11), 158W Northbound
Latitude90- 5-25 16:57
-300
-250
-200
-150
-100
-50
0
21 21.2 21.4 21.6 21.8 22 22.2 22.4 22.6 22.8 23
Dep
th (
m)
0.5 m/s
MW8913 (HOT-11), 158W Southbound
Latitude90- 5-25 16:57

Figure VII.E.6
-1
-0.5
0
0.5
1
330 330.2 330.4 330.6 330.8 331 331.2 331.4 331.6 331.8 332
+++ +
.........................................
..............................................
..................................................................................................................................................................................................................................................................................................
...................................................................................................................
U (
m/s
)
Absolute reference layer velocity
-1
-0.5
0
0.5
1
330 330.2 330.4 330.6 330.8 331 331.2 331.4 331.6 331.8 332
+++ +
............... ..................................................................................................................................................................................
..........................................................................
.................................................................................................................................................................................................................................
V (
m/s
)
1989 Days90- 5- 7 16: 9
-158
-157.5
-157
330 330.2 330.4 330.6 330.8 331 331.2 331.4 331.6 331.8 332
............... ..........................
................................
.............................................................................................................................................................................................................................................
......................................................................................................................................................................................
*************************************
********************************
************************************************* * * * * * *************************************************************************************************************************************************************************** ** *
Lon
gitu
de
21.5
22
22.5
330 330.2 330.4 330.6 330.8 331 331.2 331.4 331.6 331.8 332
...............
............................................................................
.................................................................................................................................................................................................................................................................................................................................................................................................................
*************************
**********
****************************************************
******************************* * * * * * *************************************************************************************************************************************************************************** ** *
Lat
itude
1989 Days90- 5- 7 16: 9

Figure VII.E.6 (cont’d)
-1
-0.5
0
0.5
1
332 332.2 332.4 332.6 332.8 333 333.2 333.4 333.6 333.8 334
.............................................................................................................................................................................................................
..................................................
......................
......................
U (
m/s
)
Absolute reference layer velocity
-1
-0.5
0
0.5
1
332 332.2 332.4 332.6 332.8 333 333.2 333.4 333.6 333.8 334
......................................................................................................................................................................................
..............................................................................................
............
...........
V (
m/s
)
1989 Days90- 5- 7 16:10
-158
-157.5
-157
332 332.2 332.4 332.6 332.8 333 333.2 333.4 333.6 333.8 334
................................................................................................................................................................................................................................................................................
...........................
* ******************************************************************************************************************************************************************************************************************************
***********************
Lon
gitu
de
21.5
22
22.5
332 332.2 332.4 332.6 332.8 333 333.2 333.4 333.6 333.8 334
...........................................................................................................................................................................................................................................................................................................
* ****************************************************************************************************************************************************************************************************************************************************
*
Lat
itude
1989 Days90- 5- 7 16:11

Figure VII.E.6 (cont’d)
-300
-250
-200
-150
-100
-50
0
329.5 330 330.5 331 331.5 332 332.5 333
Dep
th (
m)
0.5 m/s
HOT-12 (MW8915) velocity
1989 days
-300
-250
-200
-150
-100
-50
0
0 0.5 1 1.5 2 2.5 3 3.5 4
Dep
th (
m)
0.1 m/s
Dep
th (
m)
Dep
th (
m)
Dep
th (
m)
Dep
th (
m)
Dep
th (
m)
HOT-12 (MW8915) 89/11/27 15:00 - 89/11/29 07:00
mean+ trend
semidiurnal12.42 hrs
diurnal24 hrs
90-06-25 14:50

Figure VII.E.6 (cont’d)
-300
-250
-200
-150
-100
-50
0
21 21.2 21.4 21.6 21.8 22 22.2 22.4 22.6 22.8 23
Dep
th (
m)
0.5 m/s
MW8915 (HOT-12), 158W Northbound
Latitude90- 5-25 17: 2
-300
-250
-200
-150
-100
-50
0
21 21.2 21.4 21.6 21.8 22 22.2 22.4 22.6 22.8 23
Dep
th (
m)
0.5 m/s
MW8915 (HOT-12), 158W Southbound
Latitude90- 5-25 17: 2

Figure VII.E.7
−40 −30 −20 −10 0 10 20 30 40
0
500
1000
1500
2000
2500
Dep
th (
m)
U (cm/s)
HOT 12 LADCP Absolute Zonal Current
−40 −30 −20 −10 0 10 20 30 40
0
500
1000
1500
2000
2500
Dep
th (
m)
V (cm/s)
HOT 12 LADCP Absolute Meridional Current

VII.F. Meteorology
Figure VII.F.1: Atmospheric pressure and sea surface temperature (SST) from 4-hourly observa-tions made at station ALOHA.
Figure VII.F.2: As in VII.F.1, except for air temperature and wet-bulb temperature.
Figure VII.F.3: Meteorological data from NDBC Buoy 51001: a) SST, b) wave height, c) windspeed.
- 245 -
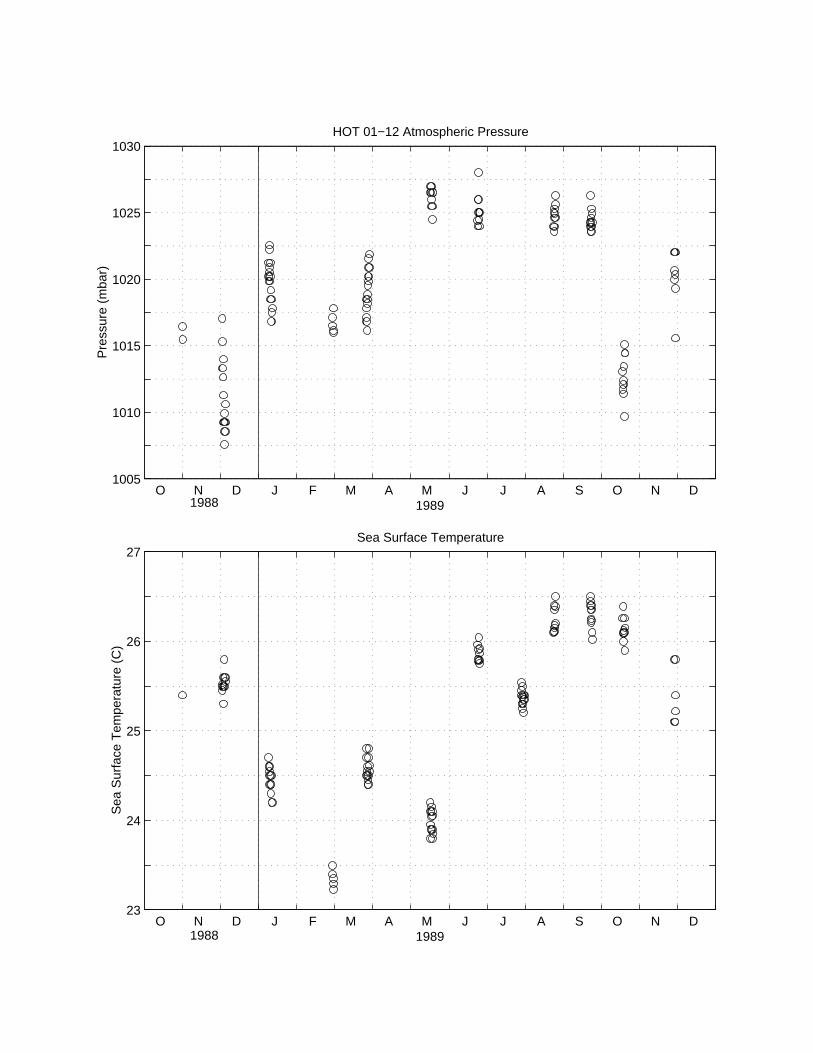
Figure VII.F.1
O N D J F M A M J J A S O N D 1005
1010
1015
1020
1025
1030
19891988
Pre
ssur
e (m
bar)
HOT 01−12 Atmospheric Pressure
O N D J F M A M J J A S O N D 23
24
25
26
27
19891988
Sea
Sur
face
Tem
pera
ture
(C
)
Sea Surface Temperature

Figure VII.F.2
O N D J F M A M J J A S O N D 20
21
22
23
24
25
26
27
28
19891988
Dry
bul
b ai
r te
mpe
ratu
re (
C)
HOT 01−12 Dry Bulb Air Temperature
O N D J F M A M J J A S O N D 19
20
21
22
23
24
25
26
27
19891988
Wet
bul
b ai
r te
mpe
ratu
re (
C)
Wet Bulb Air Temperature

Figure VII.F.3

VII.G. Light
Figure VII.G.1: Percent of surface irradiance versus depth. Data were obtained using optical pro-filer at mid-day on both HOT-11 and HOT-12.
- 249 -

Figure VII.G.1

VII.H. Station locations and sediment-trap tracks
Figures VII.H.1–12: Station positions for each cruise. The dotted circle denotes the nominal 10-km radius HOT Station.
- 251 -

Figure VII.H.1(Top), VII.H.2(Bottom)
HOT−1 Cast Coordinates
22 30
22 40
22 50
23 00
158 20 158 10 158 157 50 157 40
Latit
ude
(N)
Longitude (W)
12
34567891011121314151617
HOT−2 Cast Coordinates
22 30
22 40
22 50
23 00
158 20 158 10 158 157 50 157 40
Latit
ude
(N)
Longitude (W)
12345678
9101112
13141516
1718 19202122232425
262728
293031

Figure VII.H.3(Top), VII.H.4(Bottom)
HOT−3 Cast Coordinates
22 30
22 40
22 50
23 00
158 20 158 10 158 157 50 157 40
Latit
ude
(N)
Longitude (W)
123456 789101112131415
HOT−4 Cast Coordinates
22 30
22 40
22 50
23 00
158 20 158 10 158 157 50 157 40
Latit
ude
(N)
Longitude (W)
1
2345
6789
10

Figure VII.H.5(Top), VII.H.6(Bottom)
HOT−5 Cast Coordinates
22 30
22 40
22 50
23 00
158 20 158 10 158 157 50 157 40
Latit
ude
(N)
Longitude (W)
12 3456
7 89 10
16171819
20
21
HOT−6 Cast Coordinates
22 30
22 40
22 50
23 00
158 20 158 10 158 157 50 157 40
Latit
ude
(N)
Longitude (W)
12345
678910
11121314
15161718

Figure VII.H.7(Top), VII.H.8(Bottom)
HOT−7 Cast Coordinates
22 30
22 40
22 50
23 00
158 20 158 10 158 157 50 157 40
Latit
ude
(N)
Longitude (W)
123456
7
9
HOT−8 Cast Coordinates
22 30
22 40
22 50
23 00
158 20 158 10 158 157 50 157 40
Latit
ude
(N)
Longitude (W)
123
456
789
101112
13141516
17
18

Figure VII.H.9(Top), VII.H.10(Bottom)
HOT−9 Cast Coordinates
22 30
22 40
22 50
23 00
158 20 158 10 158 157 50 157 40
Latit
ude
(N)
Longitude (W)
123
4567910111213
141516171819
2021222324
HOT−10 Cast Coordinates
22 30
22 40
22 50
23 00
158 20 158 10 158 157 50 157 40
Latit
ude
(N)
Longitude (W)
12
345 67 89
101112
131415
161718
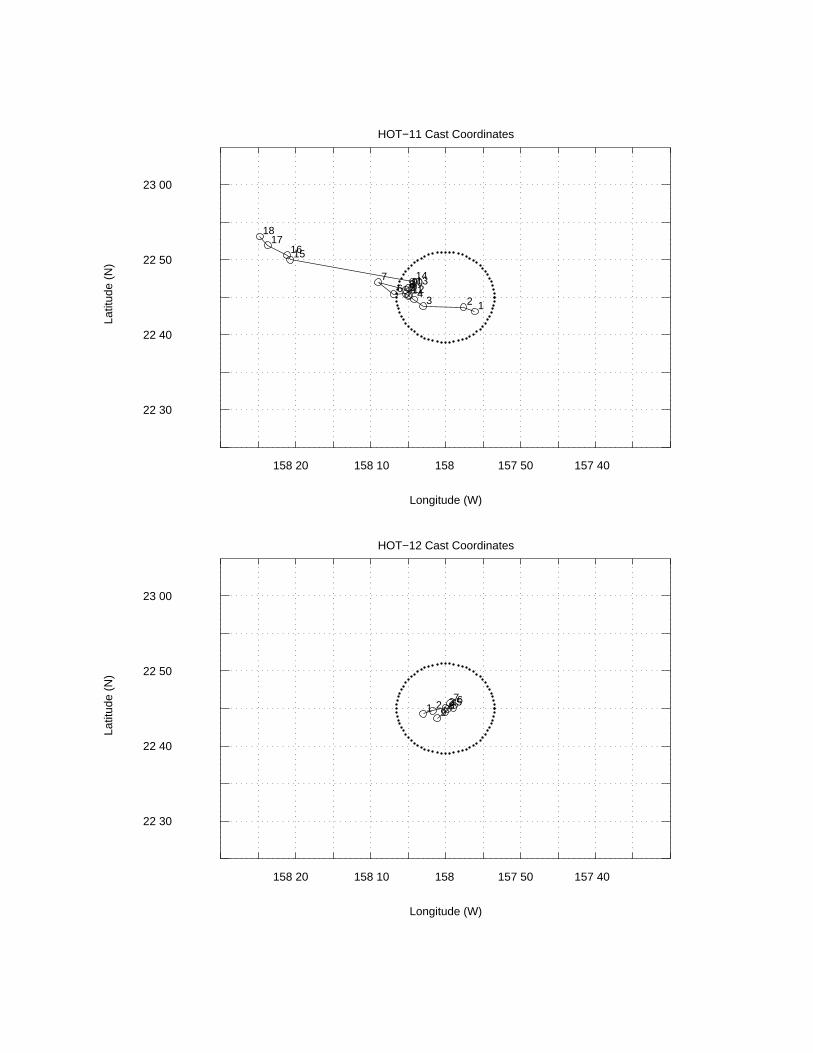
Figure VII.H.11(Top), VII.H.12(Bottom)
HOT−11 Cast Coordinates
22 30
22 40
22 50
23 00
158 20 158 10 158 157 50 157 40
Latit
ude
(N)
Longitude (W)
1234
567
891011121314
151617
18
HOT−12 Cast Coordinates
22 30
22 40
22 50
23 00
158 20 158 10 158 157 50 157 40
Latit
ude
(N)
Longitude (W)
1 2 3456789
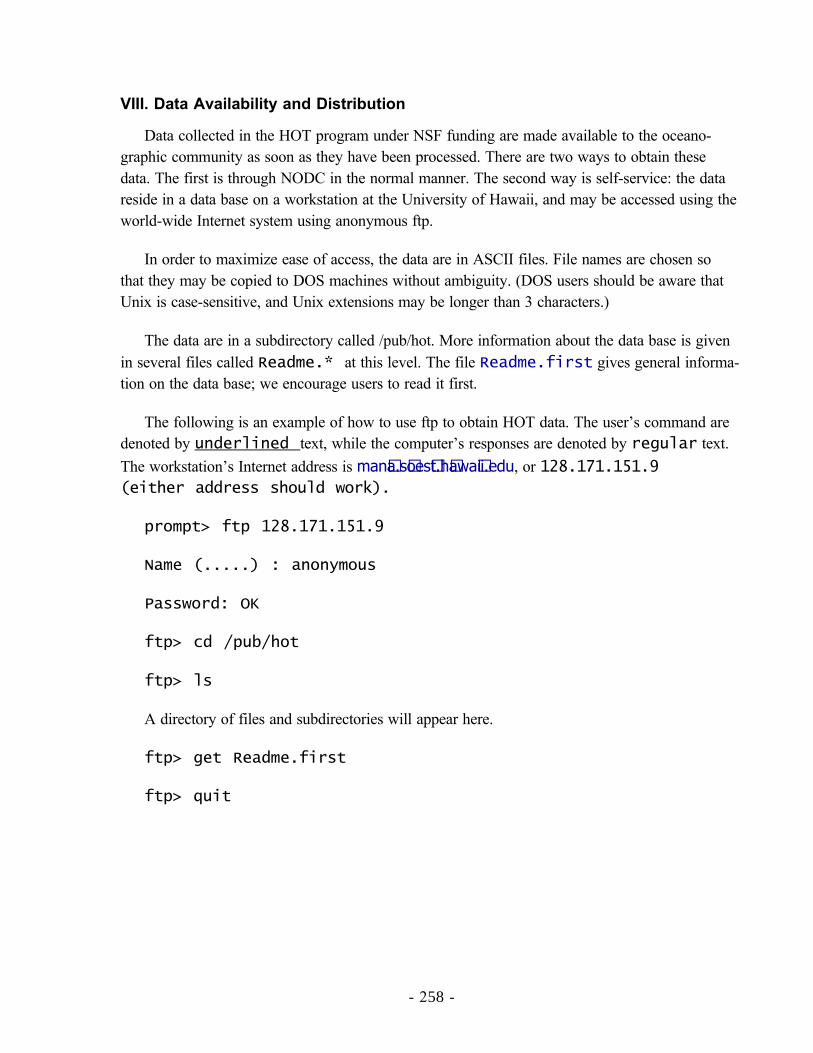
VIII. Data Availability and Distribution
Data collected in the HOT program under NSF funding are made available to the oceano-graphic community as soon as they have been processed. There are two ways to obtain thesedata. The first is through NODC in the normal manner. The second way is self-service: the datareside in a data base on a workstation at the University of Hawaii, and may be accessed using theworld-wide Internet system using anonymous ftp.
In order to maximize ease of access, the data are in ASCII files. File names are chosen sothat they may be copied to DOS machines without ambiguity. (DOS users should be aware thatUnix is case-sensitive, and Unix extensions may be longer than 3 characters.)
The data are in a subdirectory called /pub/hot. More information about the data base is given
in several files called Readme.* at this level. The file Readme.first gives general informa-tion on the data base; we encourage users to read it first.
The following is an example of how to use ftp to obtain HOT data. The user’s command aredenoted by underlined text, while the computer’s responses are denoted by regular text.
The workstation’s Internet address is man a.s oes t.h awa ii.edu, or 128.171.151.9(either address should work).
prompt> ftp 128.171.151.9
Name (.....) : anonymous
Password: OK
ftp> cd /pub/hot
ftp> ls
A directory of files and subdirectories will appear here.
ftp> get Readme.first
ftp> quit
- 258 -


![[ger] Fremdenverkehr 1988-1989 : Statistisches Jahrbuch](https://img.pdfslide.net/doc/110x75/62c41c085f06a2745d1a4606/ger-fremdenverkehr-1988-1989-statistisches-jahrbuch-.jpg)