Embed Size (px)
Citation preview

Hayes C. I. O’Connor, L. M. Lawrence, A. C. St. Lawrence, K. M. Janicki, L. K. Warren and S.
The effect of dietary fish oil supplementation on exercising horses
2004. 82:2978-2984. J Anim Sci
http://jas.fass.org/cgi/content/full/82/10/2978the World Wide Web at:
The online version of this article, along with updated information and services, is located on
www.asas.org
by on February 25, 2009. jas.fass.orgDownloaded from
The effect of dietary fish oil supplementation on exercising horses
C. I. O’Connor1, L. M. Lawrence, A. C. St. Lawrence, K. M. Janicki,L. K. Warren, and S. Hayes
Department of Animal Sciences, University of Kentucky, Lexington 40546
ABSTRACT: Ten horses of Thoroughbred or Stan-dardbred breeding were used to study the effects ofdietary fish oil supplementation on the metabolic re-sponse to a high-intensity incremental exercise test.Horses were assigned to either a fish oil (n = 6) orcorn oil (n = 4) treatment. The fish oil (Omega Protein,Hammond, LA) contained 10.6% eicosapentaenoic acidand 8% docosahexaenoic acid. Each horse received timo-thy hay and a textured concentrate at a rate necessaryto meet its energy needs. The supplemental oil was top-dressed on the concentrate daily at a rate of 324 mg/kg BW. Horses received their assigned diet for 63 d,during which time they were exercised 5 d/wk in a roundpen or on a treadmill. During wk 1, horses exercised for10 min at a trot. After wk 1, exercise time and intensitywere increased so that at wk 5, exercise time in theround pen increased to 30 min (10 min of cantering and20 min of trotting) per day. Starting at wk 6, horseswere exercised 3 d/wk in the round pen for 30 min and2 d/wk on a treadmill for 20 min. After 63 d, all horsesperformed an exercise test consisting of a 5-min warm-up at 1.9 m/s, 0% grade, followed by a step test on a10% grade at incremental speeds of 2 to 8 m/s. Blood
Key Words: Dietary Fat, Equine, Exercise, Fish Oil, Horse, Omega-3 Fatty Acids
2004 American Society of Animal Science. All rights reserved. J. Anim. Sci. 2004. 82:2978–2984
Introduction
Because of its energy density, fat is often added tothe diets of exercising horses; however, little attentionhas been given to the effects of dietary fatty acid (FA)composition on the metabolic responses of exercisinghorses. The most common fats used in horse diets arecorn oil and soybean oil, although animal fat has beenused. These fats are not good sources of the omega-3FA, eicosapentaenoic acid (EPA) and docosahexaenoicacid (DHA). Conversely, fish oil is an excellent sourceof EPA and DHA. In other species, these dietary omega-
1Correspondence: Dept. of Anim. Sci., Michigan State Univ., EastLansing 48824 (e-mail: [email protected]).
Received March 1, 2004.Accepted July 6, 2004.
2978
samples were taken throughout exercise. During exer-cise, horses receiving fish oil had a lower heart rate(treatment × time interaction; P < 0.05) and tended tohave lower packed cell volume (treatment effect; P =0.087). Plasma lactate concentrations were not affectedby treatment. Plasma glucose concentrations were notdifferent between groups during exercise but werelower (treatment × time interaction; P < 0.01) for thefish oil group during recovery. Serum insulin tended tobe lower in fish oil horses throughout exercise (treat-ment effect; P = 0.064). There was a tendency for glu-cose:insulin ratios to be higher for fish oil-treated horsesthroughout exercise (treatment effect; P = 0.065).Plasma FFA were lower (treatment × time interaction;P < 0.01) in horses receiving fish oil than in horsesreceiving corn oil during the initial stages of the exer-cise test. Serum glycerol concentrations also were lowerin fish oil-treated horses (P < 0.05). Serum cholesterolconcentrations were lower in horses receiving fish oil(treatment effect; P < 0.05), but serum triglycerideswere not affected by treatment (P = 0.55). These datasuggest that addition of fish oil to the diet alters exercisemetabolism in conditioned horses.
3 FA have had beneficial effects, including decreasingblood lipid concentrations and increasing membranefluidity and insulin sensitivity (Mueller and Talbert,1988; Simopoulos, 1991). Many researchers have hy-pothesized that omega-3 FA supplementation wouldprovide benefits during exercise. Lortet and Verger(1995) reported that exercised rats receiving fish oilhad a decreased resting heart rate and mean aorticpressure compared with rats fed lard or sunflower oil.Brilla and Landerholm (1990) reported that fish oil in-creased maximal oxygen consumption (VO2max) in menwho exercised 3 h/wk for 10 wk. However, Raastad etal. (1997) found that 10.5 wk of fish oil supplementationdid not affect endurance, heart rate, or VO2max of profes-sional male soccer players.
The amount of omega-3 FA given to humans has var-ied. Raastad et al. (1997) provided approximately 2.6g/d, whereas Brilla and Landerholm (1990) provided 4
by on February 25, 2009. jas.fass.orgDownloaded from

Fish oil supplementation to horses 2979
g/d. Supplementation rates as high as 9 g/d have beenused in patients with coronary artery disease (Vaceket al., 1989). Because no previous studies on omega-3FA supplementation of horses had been conducted, weestimated that an appropriate daily intake for horseswould be about 60 mg of omega-3 FA/kg BW. Therefore,the objective of this project was to investigate whether9 wk of omega-3 FA supplementation at a rate of 60mg/kg BW would affect the metabolic response of horsesto exercise.
Materials and Methods
Treatments
Ten mature geldings (one Standardbred and nineThoroughbreds) with a BW of 560 ± 63 kg and previoustreadmill experience were used in this study. All horsesremained clinically healthy and sound for the durationof the study. Horses were individually housed in 4- ×15-m partially covered pens, except in the week beforeexercise testing when they were individually housed inbox stalls. The experimental design and all procedureswere approved by the Institutional Animal Care andUse Committee of the University of Kentucky. Beforethe start of the experiment, horses were acclimated toa basal diet of timothy hay and concentrate for 1 wk,and then randomly assigned either to a corn oil (n = 4)or fish oil (n = 6) treatment group. More horses wereinitially allocated to the fish oil group in case somehorses would not consume the fish oil. Horses were fedtimothy hay (0700) at 1.7% BW (as-fed) and texturedconcentrate (barley, corn, soybean meal, molasses, oats,and supplement pellet) at approximately 0.6% BW(0700 and 1630; Hallway Feeds, Lexington, KY). Duringthe study, the amount of concentrate was adjusted asworkload increased. The concentrate was divided intotwo meals per day at 0700 and 1600. At the end of thestudy, the diet supplied, on average, 28 Mcal of DE/d,with the oil providing 5.7% of the total DE, which metthe requirements for moderate work (NRC, 1989). Men-haden fish oil (Omega Protein, Inc., Hammond, LA) orcorn oil (Hallway Feeds) was top-dressed on the morn-ing concentrate at a rate of 324 mg of oil/kg BW. Therewere no antioxidants added to either the fish or corn oil.Horses received these treatments for 63 d. The nutrientand FA compositions of the feeds are shown in Table 1.
Conditioning Program
Before the start of the study the horses had beenhoused on pasture with no forced exercise for at least3 mo. Once horses were assigned to dietary treatments,they began a conditioning program. During the first 5wk, horses were exercised 5 d/wk in a 14-m diameterround pen with sand footing. During wk 1, horses exer-cised at a trot for 10 min/d. During the following weeksexercise time and intensity was increased so that at wk5, exercise time in the round pen increased to 30 min/
Table 1. Nutrient composition of feedstuffs on a DM basis
Textured Timothy Corn FishItema feedb hay oilb oilc
DM 89.1% 91.2% — —Ether extract 6.5% 1.7% — —CP 14.8% 9.3% — —DE, Mcal/kg 3.56 2.02 8.98 8.98NDF 17.8% 58% — —ADF 9.4% 23.5% — —Ca 0.93% 0.49% — —P 0.71% 0.26% — —K 1.01% 1.83% — —Na 0.311% 0.002% — —C14:0 0.139 1.627 0.069 6.734C18:2 38.815 15.758 52.942 1.700C18:3-n6 0.039 0.467 0.091 1.034C18:3 n3 3.716 26.682 3.224 1.365C20:0 0.465 2.352 0.344 0.532C20:1 0.607 0.663 0.770 1.726C20:2 0.071 0.950 0.092 1.005C20:3-n6 0.029 0.356 0.036 0.447C20:3-n3 0.025 0.661 0.000 0.990C20:4 0.033 0.348 0.000 0.527C20:5 0.076 0.360 0.048 10.620C22:0 0.268 1.659 0.169 0.383C22:1 0.156 0.485 0.051 0.376C22:2 0.084 1.041 0.011 0.083C22:4 0.043 0.261 0.263 0.276C22:5 0.014 0.760 0.100 1.664C24:0 0.264 1.647 0.181 0.042C22:6 0.060 0.247 0.339 8.008
aFatty acids are listed as a percentage of the lipid in the sample.bObtained from Hallway Feeds, Lexington, KY.cObtained from Omega Protein, Inc., Hammond, LA.
d (10 min of cantering and 20 min of trotting). Startingwk 6, horses were exercised 3 d/wk in the round penfor 30 min and 2 d/wk on a treadmill for 20 min. Thetreadmill workout consisted of a 5-min trot at 4.5 m/s,3-min canter at 6.5 m/s, 5-min trot at 4.5 m/s, 2-mincanter at 6.5 m/s, and a 5-min trot at 4.5 m/s. On daysthe horses were not exercised, they were turned out inpairs for no more than 30 min in a 20- × 40-m dirtpaddock.
Exercise Testing Procedures
At the end of wk 8, horses were moved to the exercisetesting facility. Horses were housed in box stalls andexercised only on a high-speed treadmill (Sato I, EquineDynamics, Lexington, KY). Three days per week, thehorses completed a 30-min workout consisting of a 5-min walk at 1.9 m/s on a 0% grade followed by a 5-mintrot at 4.5 m/s, 3-min canter at 6.5 m/s, 5 min at 4.5m/s, 2 min at 6.5 m/s, 5 min at 4.5 m/s, and then 5 minat 1.9 m/s. Two days per week, the horses completed a23-min workout consisting of 5 min at 1.9 m/s on a 0%grade followed by a 4-min, 4-m/s trot on a 10% grade,2 min at 5 m/s, 2 min at 6 m/s, and then, while at awalk, the treadmill was lowered to a 0% grade, and theworkout was finished with 4 min at 4 m/s and 5 min at1.9 m/s. During wk 10, each horse performed a standard
by on February 25, 2009. jas.fass.orgDownloaded from

O’Connor et al.2980
exercise test. All exercise tests were conducted in atemperature-controlled testing facility (20°C) on a high-speed treadmill between 0700 and 1100 each testingday. Each exercise test began with a 5-min warm-upwalk (1.9 m/s), with the treadmill surface in a horizontalposition. During the fifth minute, the treadmill waselevated to a 10% (6°) incline. The treadmill speed wasincreased to 2 m/s for the start of the exercise test. Every2 min thereafter, the treadmill speed was increased 1m/s until 8 m/s (a moderate gallop) was reached. Uponcompletion of 2 min at 8 m/s, the treadmill speed wasdecreased to 1.9 m/s and the treadmill surface was re-turned to horizontal. The horse then completed a 10-min cool-down walk at 1.9 m/s. The horse was takenoff the treadmill and hand-walked for an additional20 min.
To ensure that all horses would be tested in a similarfeeding state, all feed was removed 12 h before theexercise test. Additionally, horses were not fed theirmorning ration on the day of testing. On the morningof testing, an indwelling catheter was placed in the leftjugular vein of each horse under local anesthesia forblood sampling. Blood samples were taken before theexercise test (Pre) and during the last 20 s of the warm-up and each exercise speed. Additional blood sampleswere taken every 2 min for the first 10 min of cool-down, and then every 5 min for the last 20 min of handwalking. Blood samples were also taken 1, 3, 6, 8, and24 h after the completion of the 8.0-m/s portion of theexercise test. Before exercise testing, horses were alsofitted with an on-board heart rate monitor (EquistatHR-8AE, EQB, Unionville, PA). Heart rate was re-corded during the last 5 s of each speed during theexercise test and every 2 min during the first 10 minof the cool down.
Laboratory Analyses
Plasma was analyzed simultaneously for glucose andlactate with a glucose/lactate autoanalyzer (YSI 2300STAT PLUS, Yellow Springs Instrument Co., YellowSprings, OH). Serum triglyceride, glycerol, creatine ki-nase (CK), and aspartate amino transferase (AST) con-centrations were determined using commercially avail-able kits (Sigma Diagnostics, St. Louis, MO). The tri-glyceride assay is based on the measurement of glycerol,thus all triglyceride values were corrected for glycerolpresent in each sample. Serum cholesterol and plasmaFFA concentrations were also determined through theuse of commercial kits (Cholesterol CII and NEFA C,Wako Chemicals, Richmond, VA). Serum insulin con-centrations were determined using a solid phase 125IRIA (Coat-A-Count, Diagnostic Products Co., LosAngeles, CA). Packed cell volume was determined withwhole blood that was drawn into a microcapillary tube,centrifuged, and read using a microcapillary reader.All laboratory procedures were performed in duplicateexcept packed cell volume, which was performed in trip-licate. Interassay variation was <5% for all assays ex-
Figure 1. Heart rate (beats per minute) response before(Pre) and during the exercise test, and through the firstpart of recovery when horses received the corn oil (n =4) or fish oil (n = 6) treatment. Heart rate increased duringthe exercise test (time effect; P < 0.01), and horses receiv-ing the fish oil treatment had lower heart rates (treatment× time interaction; P < 0.05). **Fish oil vs. corn oil differ,P < 0.01. *Fish oil vs. corn oil differ, P < 0.05.
cept glycerol, which had an interassay variation of<10%.
Statistical Analyses
Differences in plasma and serum variables betweenthe corn and fish oil groups were analyzed using theSAS (SAS Inst., Inc., Cary, NC) mixed covariance test(mixed COVTEST) procedure with repeated measures.The mixed covariance test was used because of unequaltreatment sizes. The class variables were defined ashorse, treatment, and time. Time was the repeated vari-able and the covariance structure was defined as com-pound symmetry. Data were separated into exerciseand recovery samples and analyzed separately. Sig-nificance was declared at P < 0.05, and because of thesmall number of horses in each treatment, trends wererecognized at 0.05 < P < 0.10. Differences between treat-ments at individual time points were examined when-ever treatment × time interactions had P < 0.10. Datawere summarized as least squares means ± SEM.
Results
In both treatments, heart rate increased as treadmillspeed increased (time effect; P < 0.01; Figure 1). Restingheart rates were the same for both treatment groups,but horses receiving the fish oil treatment had lowerheart rates throughout the exercise test (treatment ×time interaction; P < 0.05). By 2 min after exercise, theheart rates for both treatment groups were similar andremained the same throughout recovery. Packed cellvolume increased throughout the exercise test (time
by on February 25, 2009. jas.fass.orgDownloaded from

Fish oil supplementation to horses 2981
Figure 2. Mean packed cell volume before (Pre), duringthe exercise test, and following the completion (Post) ofthe exercise test when horses received either the corn oil(n = 4) or fish oil (n = 6) treatment. Packed cell volumeincreased during the exercise test (time effect; P < 0.01)when horses received either the corn oil or fish oil treat-ment. There was a trend for horses receiving the fish oiltreatment to have lower packed cell volume (treatmenteffect; P = 0.087).
effect; P < 0.01) in both treatment groups (Figure 2).There was a trend for horses receiving the fish oil treat-ment to have lower packed cell volume during exercise(treatment effect; P = 0.087). Plasma lactate concentra-tion (Figure 3) increased during exercise resulting inpeak concentrations of over 12.0 mmol/L at 2 min afterexercise in both groups (time effect; P < 0.01). Fish oilsupplementation did not affect plasma lactate concen-tration during exercise (P = 0.62). During recovery, lac-tate concentrations decreased similarly in both groups(time effect; P < 0.01).
Figure 3. Plasma lactate response before (Pre), duringthe exercise test, and throughout recovery when horsesreceived either the corn oil (n = 4) or fish oil (n = 6)treatment (time effect; P < 0.01). Fish oil supplementationdid not affect plasma lactate concentration.
Figure 4. Plasma glucose response before (Pre), duringthe exercise test, and throughout recovery when horseswere fed the corn oil (n = 4) or fish oil (n = 6) treatment.Fish oil-treated horses had lower (treatment × time inter-action; P < 0.01) plasma glucose concentrations from 10to 30 min of recovery. *Fish oil vs. corn oil differ, P <0.05. †Fish oil vs. corn oil differ, P < 0.10.
At the onset of exercise, plasma glucose concentra-tions in horses receiving fish oil were not different fromhorses receiving the corn oil treatment (P = 0.95).Plasma glucose concentration increased slightlythroughout exercise and continued to increase duringearly recovery in both treatment groups (time effect;P < 0.01; Figure 4). During recovery, plasma glucoseconcentration of the corn oil-treated horses continuedto rise until 10 min after exercise, whereas the plasmaglucose concentration of the fish oil-treated horses lev-eled out at 4 min after exercise. Horses fed the fish oiltreatment had lower glucose concentrations from 10min after exercise to the end of recovery at 30 min afterexercise (treatment × time interaction; P < 0.01).
Serum insulin (Figure 5) decreased throughout exer-cise in both groups (time effect; P < 0.01), and therewas a trend for insulin concentrations to be lower in fishoil-treated horses (treatment effect; P = 0.064). Plasmaglucose to serum insulin ratios were calculated (datanot shown) and found to increase throughout exercisein both groups (time effect; P < 0.01). There was a trendfor glucose:insulin ratios to be higher for the fish oil-treated horses throughout exercise (treatment effect;P = 0.065). Plasma FFA concentrations (Figure 6) de-creased throughout exercise in both treatments (treat-ment × time interaction; P < 0.01) and were lower forfish oil-supplemented horses at rest, 1.9, 2, 3 (P < 0.05),4, and 5 m/s (P < 0.10) than for the corn oil-supple-mented horses. Serum glycerol concentrations (Figure7) increased throughout exercise for both treatments(time effect; P < 0.01) and were lower in horses fed thefish oil treatment (treatment effect; P < 0.05).
Serum cholesterol was lower (treatment effect; P <0.05) for fish oil-supplemented horses (Figure 8). Serumtriglyceride concentrations (Figure 9) increased during
by on February 25, 2009. jas.fass.orgDownloaded from
O’Connor et al.2982
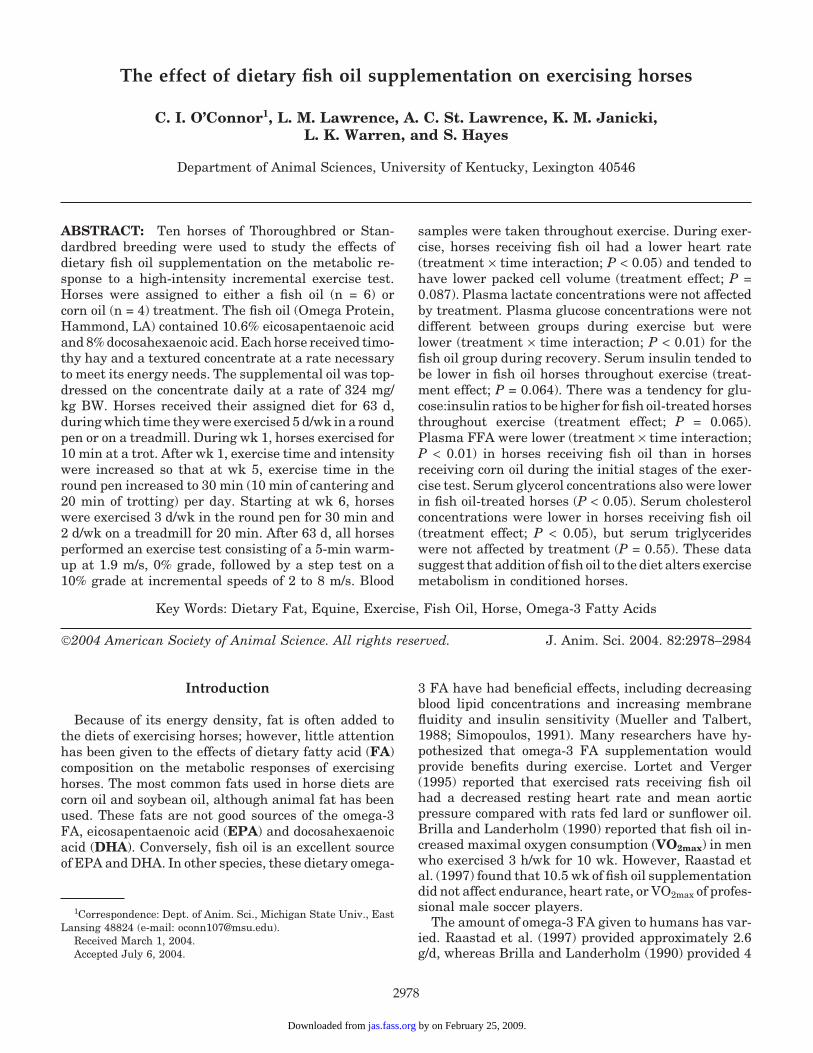
Figure 5. Serum insulin response before (Pre), duringthe exercise test, and following the completion of theexercise test (Post) when horses received either the cornoil (n = 4) or fish oil (n = 6) treatment. Insulin concentra-tions decreased throughout exercise in both treatments(time effect; P < 0.01). There was a trend for fish oil-treated horses to have lower insulin concentrations (treat-ment effect; P = 0.064).
exercise (time effect; P < 0.01), but there were no effectsof fish oil supplementation. The AST and CK activitiesincreased in both treatments (time effect; P < 0.01) untilapproximately 6 h after exercise, and then began todecrease (data not shown). Neither variable increasedabove normal levels, nor were they affected by fish oiltreatment.
Discussion
The effects of fish oil supplementation have beenstudied extensively in a variety of animals, but not
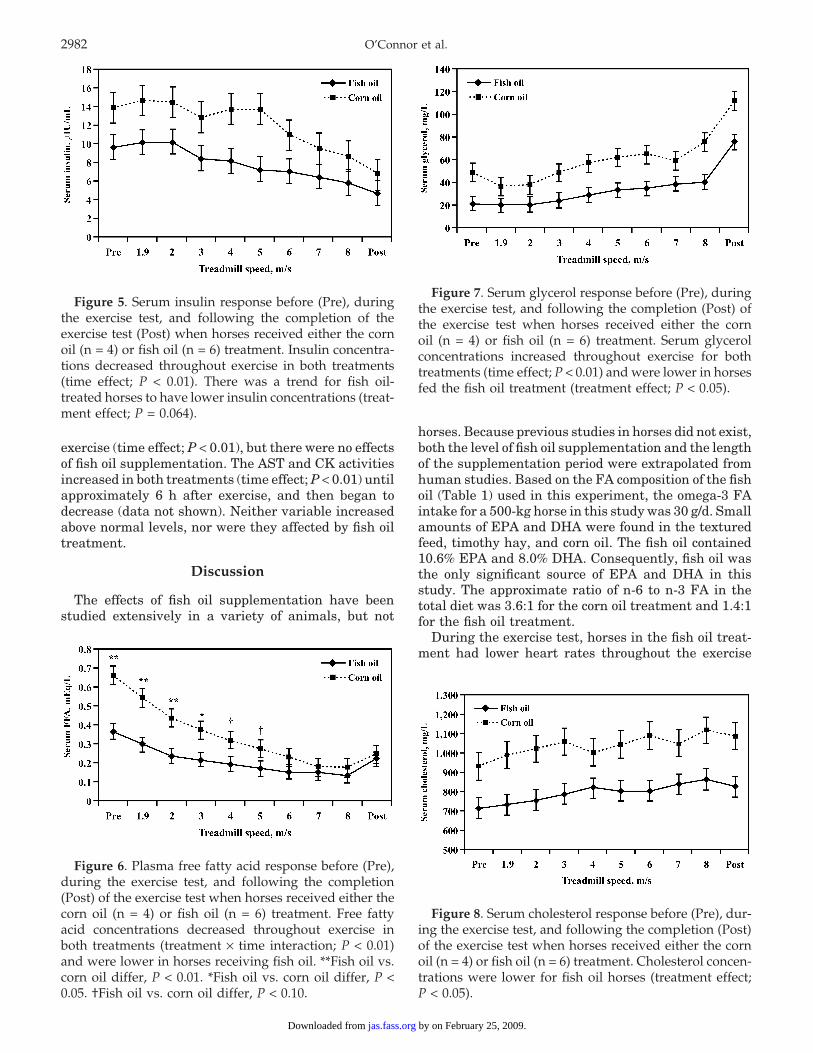
Figure 6. Plasma free fatty acid response before (Pre),during the exercise test, and following the completion(Post) of the exercise test when horses received either thecorn oil (n = 4) or fish oil (n = 6) treatment. Free fattyacid concentrations decreased throughout exercise inboth treatments (treatment × time interaction; P < 0.01)and were lower in horses receiving fish oil. **Fish oil vs.corn oil differ, P < 0.01. *Fish oil vs. corn oil differ, P <0.05. †Fish oil vs. corn oil differ, P < 0.10.
Figure 7. Serum glycerol response before (Pre), duringthe exercise test, and following the completion (Post) ofthe exercise test when horses received either the cornoil (n = 4) or fish oil (n = 6) treatment. Serum glycerolconcentrations increased throughout exercise for bothtreatments (time effect; P < 0.01) and were lower in horsesfed the fish oil treatment (treatment effect; P < 0.05).
horses. Because previous studies in horses did not exist,both the level of fish oil supplementation and the lengthof the supplementation period were extrapolated fromhuman studies. Based on the FA composition of the fishoil (Table 1) used in this experiment, the omega-3 FAintake for a 500-kg horse in this study was 30 g/d. Smallamounts of EPA and DHA were found in the texturedfeed, timothy hay, and corn oil. The fish oil contained10.6% EPA and 8.0% DHA. Consequently, fish oil wasthe only significant source of EPA and DHA in thisstudy. The approximate ratio of n-6 to n-3 FA in thetotal diet was 3.6:1 for the corn oil treatment and 1.4:1for the fish oil treatment.
During the exercise test, horses in the fish oil treat-ment had lower heart rates throughout the exercise
Figure 8. Serum cholesterol response before (Pre), dur-ing the exercise test, and following the completion (Post)of the exercise test when horses received either the cornoil (n = 4) or fish oil (n = 6) treatment. Cholesterol concen-trations were lower for fish oil horses (treatment effect;P < 0.05).
by on February 25, 2009. jas.fass.orgDownloaded from
Fish oil supplementation to horses 2983
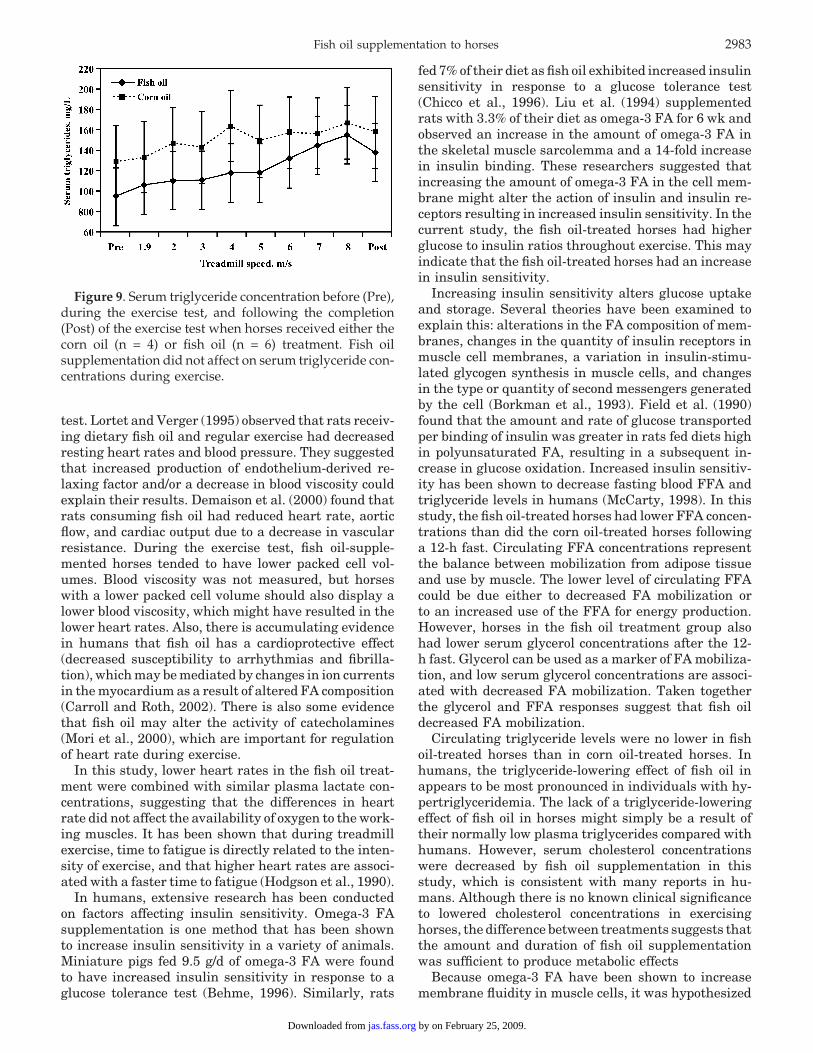
Figure 9. Serum triglyceride concentration before (Pre),during the exercise test, and following the completion(Post) of the exercise test when horses received either thecorn oil (n = 4) or fish oil (n = 6) treatment. Fish oilsupplementation did not affect on serum triglyceride con-centrations during exercise.
test. Lortet and Verger (1995) observed that rats receiv-ing dietary fish oil and regular exercise had decreasedresting heart rates and blood pressure. They suggestedthat increased production of endothelium-derived re-laxing factor and/or a decrease in blood viscosity couldexplain their results. Demaison et al. (2000) found thatrats consuming fish oil had reduced heart rate, aorticflow, and cardiac output due to a decrease in vascularresistance. During the exercise test, fish oil-supple-mented horses tended to have lower packed cell vol-umes. Blood viscosity was not measured, but horseswith a lower packed cell volume should also display alower blood viscosity, which might have resulted in thelower heart rates. Also, there is accumulating evidencein humans that fish oil has a cardioprotective effect(decreased susceptibility to arrhythmias and fibrilla-tion), which may be mediated by changes in ion currentsin the myocardium as a result of altered FA composition(Carroll and Roth, 2002). There is also some evidencethat fish oil may alter the activity of catecholamines(Mori et al., 2000), which are important for regulationof heart rate during exercise.
In this study, lower heart rates in the fish oil treat-ment were combined with similar plasma lactate con-centrations, suggesting that the differences in heartrate did not affect the availability of oxygen to the work-ing muscles. It has been shown that during treadmillexercise, time to fatigue is directly related to the inten-sity of exercise, and that higher heart rates are associ-ated with a faster time to fatigue (Hodgson et al., 1990).
In humans, extensive research has been conductedon factors affecting insulin sensitivity. Omega-3 FAsupplementation is one method that has been shownto increase insulin sensitivity in a variety of animals.Miniature pigs fed 9.5 g/d of omega-3 FA were foundto have increased insulin sensitivity in response to aglucose tolerance test (Behme, 1996). Similarly, rats
fed 7% of their diet as fish oil exhibited increased insulinsensitivity in response to a glucose tolerance test(Chicco et al., 1996). Liu et al. (1994) supplementedrats with 3.3% of their diet as omega-3 FA for 6 wk andobserved an increase in the amount of omega-3 FA inthe skeletal muscle sarcolemma and a 14-fold increasein insulin binding. These researchers suggested thatincreasing the amount of omega-3 FA in the cell mem-brane might alter the action of insulin and insulin re-ceptors resulting in increased insulin sensitivity. In thecurrent study, the fish oil-treated horses had higherglucose to insulin ratios throughout exercise. This mayindicate that the fish oil-treated horses had an increasein insulin sensitivity.
Increasing insulin sensitivity alters glucose uptakeand storage. Several theories have been examined toexplain this: alterations in the FA composition of mem-branes, changes in the quantity of insulin receptors inmuscle cell membranes, a variation in insulin-stimu-lated glycogen synthesis in muscle cells, and changesin the type or quantity of second messengers generatedby the cell (Borkman et al., 1993). Field et al. (1990)found that the amount and rate of glucose transportedper binding of insulin was greater in rats fed diets highin polyunsaturated FA, resulting in a subsequent in-crease in glucose oxidation. Increased insulin sensitiv-ity has been shown to decrease fasting blood FFA andtriglyceride levels in humans (McCarty, 1998). In thisstudy, the fish oil-treated horses had lower FFA concen-trations than did the corn oil-treated horses followinga 12-h fast. Circulating FFA concentrations representthe balance between mobilization from adipose tissueand use by muscle. The lower level of circulating FFAcould be due either to decreased FA mobilization orto an increased use of the FFA for energy production.However, horses in the fish oil treatment group alsohad lower serum glycerol concentrations after the 12-h fast. Glycerol can be used as a marker of FA mobiliza-tion, and low serum glycerol concentrations are associ-ated with decreased FA mobilization. Taken togetherthe glycerol and FFA responses suggest that fish oildecreased FA mobilization.
Circulating triglyceride levels were no lower in fishoil-treated horses than in corn oil-treated horses. Inhumans, the triglyceride-lowering effect of fish oil inappears to be most pronounced in individuals with hy-pertriglyceridemia. The lack of a triglyceride-loweringeffect of fish oil in horses might simply be a result oftheir normally low plasma triglycerides compared withhumans. However, serum cholesterol concentrationswere decreased by fish oil supplementation in thisstudy, which is consistent with many reports in hu-mans. Although there is no known clinical significanceto lowered cholesterol concentrations in exercisinghorses, the difference between treatments suggests thatthe amount and duration of fish oil supplementationwas sufficient to produce metabolic effects
Because omega-3 FA have been shown to increasemembrane fluidity in muscle cells, it was hypothesized
by on February 25, 2009. jas.fass.orgDownloaded from

O’Connor et al.2984
that omega-3 FA supplementation might alter suscepti-bility to exercise induced muscle damage. Creatine ki-nase and AST are intracellular enzymes in muscle cellsnot typically present in serum. Large increases of theseenzymes in the serum following exercise are indicativeof muscle damage. Hock et al. (1987) found a significantdecrease in the amount of CK released from myocardialcells following ischemic damage to the heart in rats fed5% of their diet as fish oil for 4 wk. Studies performedin rodents suggest that EPA may be able to preventmuscle damage through inhibition of the cycloxygenasepathway (Jackson et al., 1988; Tisdale, 1996). However,in these studies, muscle damage was induced throughartificial methods, and therefore their results may notbe transferable to exercise-induced muscle damage. Inthe horse, a 20- to 200-fold increase in CK is indicativeof ultrastructural damage to muscle cells (Valberg,1996). In the current study, both CK and AST activitiesincreased in the serum post exercise; however, the val-ues were still within the normal range. It is possiblethat a longer, lower-intensity exercise test would bea better model for evaluating the effect of fish oil onsusceptibility of horses to muscle damage (Siciliano, etal. 1995).
Literature Cited
Behme, M. T. 1996. Dietary fish oil supplementation enhances insulinsensitivity in miniature pigs. J. Nutr. 126:1549–1553.
Borkman, M., L. H. Storlein, D. A. Pan, A. B. Jenkins, D. J. Chisholm,and L. V. Campbell. 1993. The relation between insulin sensitiv-ity and the fatty acid composition of skeletal muscle phospholip-ids. N. Engl. J. Med. 328:238–244.
Brilla, L. B., and T. E. Landerholm. 1990. Effect of fish oil supplemen-tation and exercise on serum lipids and aerobic fitness. J. SportsMed. Phys. Fitness 30:173–180.
Carroll, D. N., and M. T. Roth. 2002. Evidence for the caridoprotectiveeffects of omega-3 fatty acids. Ann. Pharmacother. 36:1950–1956.
Chicco, A., M. E. D’Alessandro, L. Karabatas, R. Gutman, and Y. B.Lombardo. 1996. Effect of moderate levels of dietary fish oil oninsulin secretion and sensitivity, and pancreas insulin contentin normal rats. Ann. Nutr. Metab. 40:61–70.
Demaison, L., J. Blet, J. P. Sergiel, S. Gregoire, and D. Argaud.2000. Effect of dietary polyunsaturated fatty acids on contractilefunction of hearts isolated from sedentary and trained rats. Re-prod. Nutr. Dev. 40:113–125.
Field, C. J., E. A. Ryan, A. B. Thomson, and M. T. Clandinin. 1990.Diet fat composition alters membrane phospholipids composi-tion, insulin binding, and glucose metabolism in adipocytes fromcontrol and diabetic animals. J. Biol. Chem. 265:11143–11150.
Hock, C. E., M. A. Holahan, and D. K. Reibel. 1987. Effect of dietaryfish oil on myocardial phospholipids and myocardial ischemicdamage. Am. J. Physiol. 252:H554–H560.
Hodgson, D. R., R. J. Rose, T. B. Kelso, L. J. McCutcheon, W. M. Bayly,and P. D. Gollnick. 1990. Respiratory and metabolic responses inthe horse during moderate and heavy exercise. Pflugers Arch.Eur. J. Physiol. 417:73–78.
Jackson, M. J., J. Roberts, and R. H. T. Edwards. 1988. Effects ofdietary-fish-oil feeding on muscle growth and damage in the rat.Br. J. Nutr. 60:217–224.
Liu, S., V. E. Baracos, H. A. Quinney, and M. T. Clandinin. 1994.Dietary omega-3 and polyunsaturated fatty acids modify fattyacyl composition and insulin binding in skeletal-muscle sarco-lemma. Biochem. J. 299:831–837.
Lortet, S., and P. Verger. 1995. Alteration of cardiovascular functionin trained rats fed with fish oil. Int. J. Sports Med. 16:519–521.
McCarty, M. F. 1998. Complementary measures for promoting insulinsensitivity in skeletal muscle. Med. Hypoth. 51:451–464.
Mori, T. A., G. F. Watts, V. Burke, E. Hilme, I. B. Puddey, and L. J.Beilin. 2000. Differential effects of eicosapentaenoic acid anddocasahexaenoic acid on vascular reactivity of the forearm micro-circulation in hyperlipidemic, overweight men. Circulation102:1264–1269.
Mueller, B. A., and R. L. Talbert. 1988. Biological mechanisms andcardiovascular effects of omega-3 fatty acids. Clin. Pharm.7:795–807.
NRC. 1989. Pages 42–44 in Nutrient Requirements of Horses. 5threv. ed. Natl. Acad. Press, Washington, DC.
Raastad, T., A. T. Hostmark, and S. B. Stromme. 1997. Omega-3fatty acid supplementation does not improve maximal aerobicpower, anaerobic threshold and running performance in well-trained soccer players. Scand. J. Med. Sci. Sports 7:25–31.
Siciliano, P. D., L. M. Lawrence, K. Danielsen, D. Powell, and K. N.Thompson. 1995. Effect of conditioning and exercise type onserum creatine kinase and aspartate aminotransferase activity.Equine Vet. J. Suppl. 18:243–247.
Simopoulos, A. P. 1991. Omega-3 fatty acids in health and diseaseand in growth and development. Am. J. Clin. Nutr. 54:438–463.
Tisdale, M. J. 1996. Inhibition of lipolysis and muscle protein degreda-tion by EPA in cancer cachexia. Nutrition 12:S31–S33.
Vacek, J. L., W. S. Harris, and K. Haffey. 1989. Short-term effectsof omega-3 fatty acids on exercise test parameters in patientswith known coronary artery disease. Biomed. Pharmacother.43:375–379.
Valberg, S. J. 1996. Muscular causes on exercise intolerance in horses.Vet.Clin. N. Am. Equine Pract. 12:495–515.
by on February 25, 2009. jas.fass.orgDownloaded from

References http://jas.fass.org/cgi/content/full/82/10/2978#BIBL
This article cites 16 articles, 5 of which you can access for free at:
Citations http://jas.fass.org/cgi/content/full/82/10/2978#otherarticles
This article has been cited by 2 HighWire-hosted articles:
by on February 25, 2009. jas.fass.orgDownloaded from