Embed Size (px)
Citation preview
HbA1c controversies: more strings to its bow?
Prof. Eric S. KilpatrickDepartment of Clinical Biochemistry
Hull Royal Infirmary/Hull York Medical School
What’s going on with HbA1c?

What’s going on with HbA1c?
• HbA1c: a brief history
• How should we report HbA1c?
• Using HbA1c to diagnose diabetes
What’s going on with HbA1c?
• HbA1c: a brief history
• How should we report HbA1c?
• Using HbA1c to diagnose diabetes
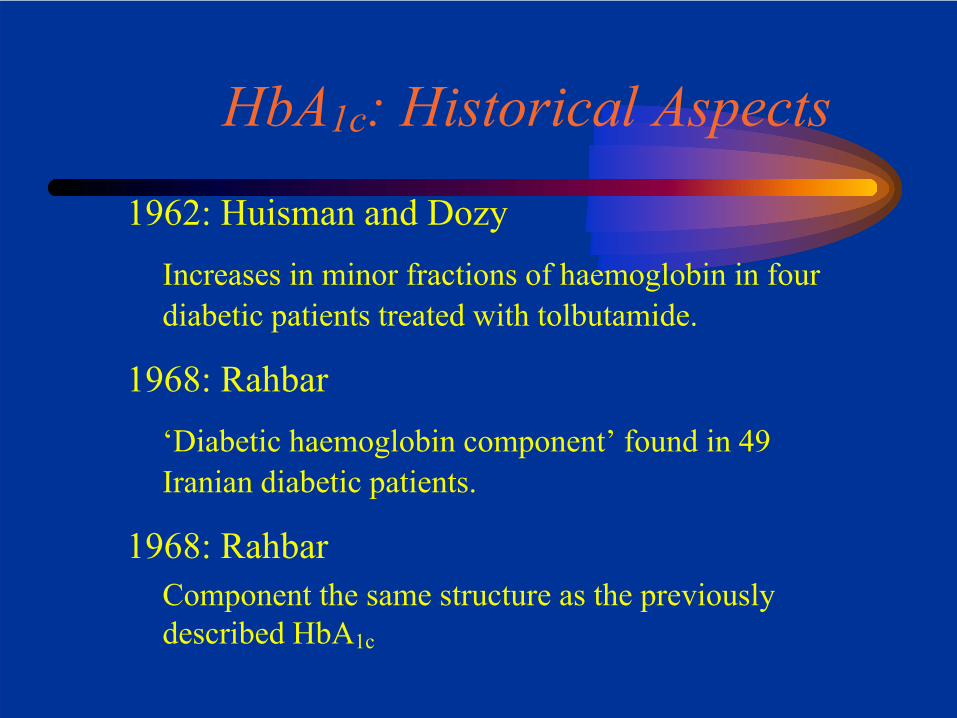
HbA1c: Historical Aspects
1962: Huisman and DozyIncreases in minor fractions of haemoglobin in four diabetic patients treated with tolbutamide.
1968: Rahbar‘Diabetic haemoglobin component’ found in 49 Iranian diabetic patients.
1968: RahbarComponent the same structure as the previously described HbA1c
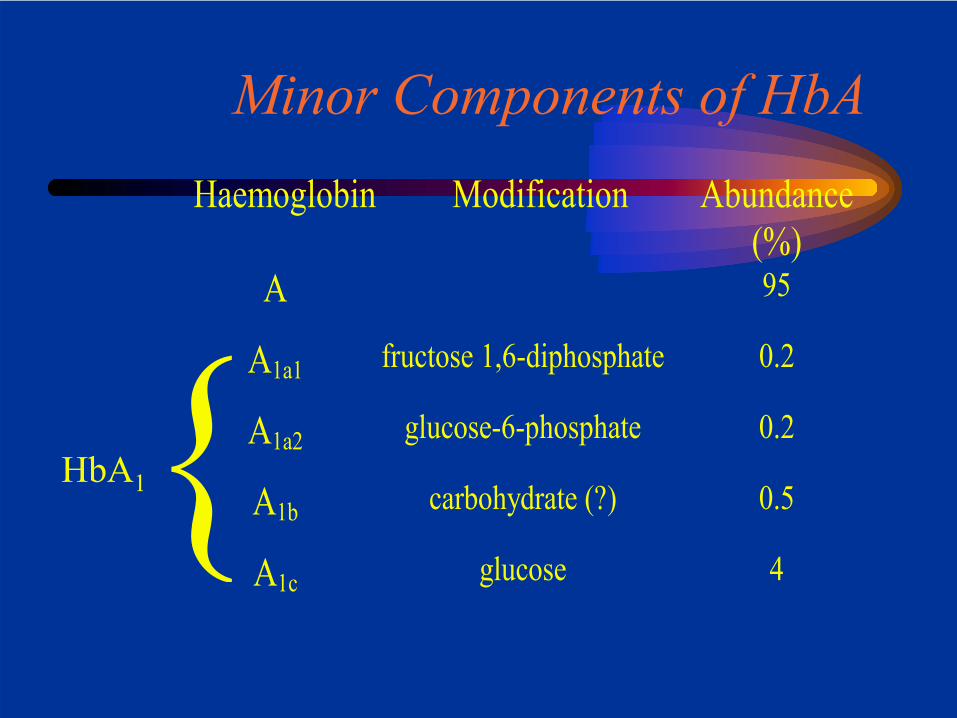
Minor Components of HbAHaemoglobin Modification Abundance
(%)A 95
A1a1 fructose 1,6-diphosphate 0.2
A1a2 glucose-6-phosphate 0.2
A1b carbohydrate (?) 0.5
A1c glucose 4
HbA1
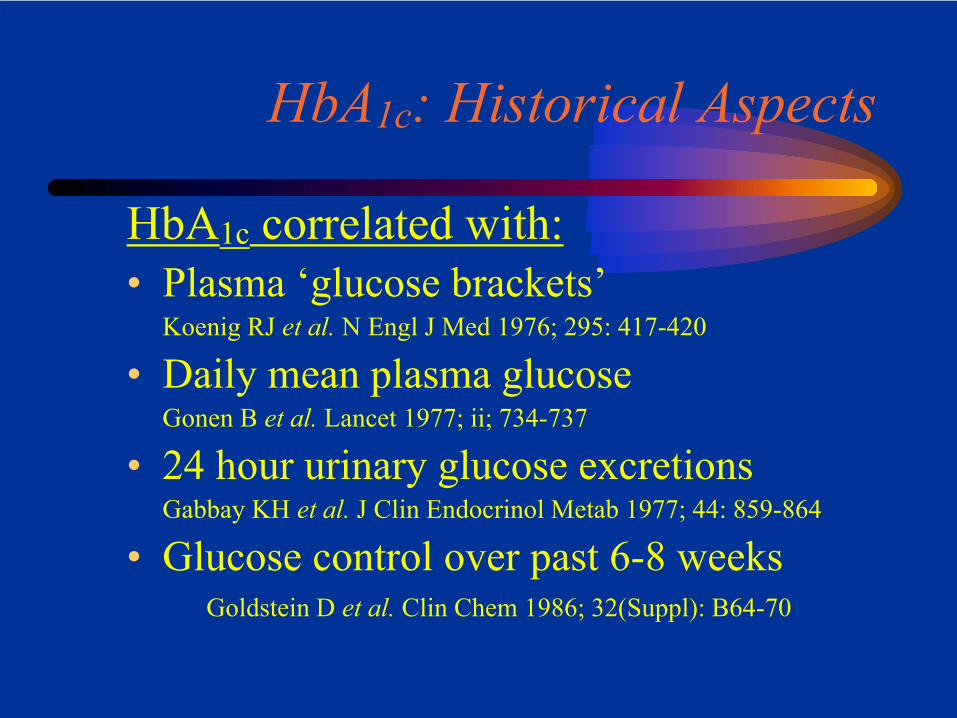
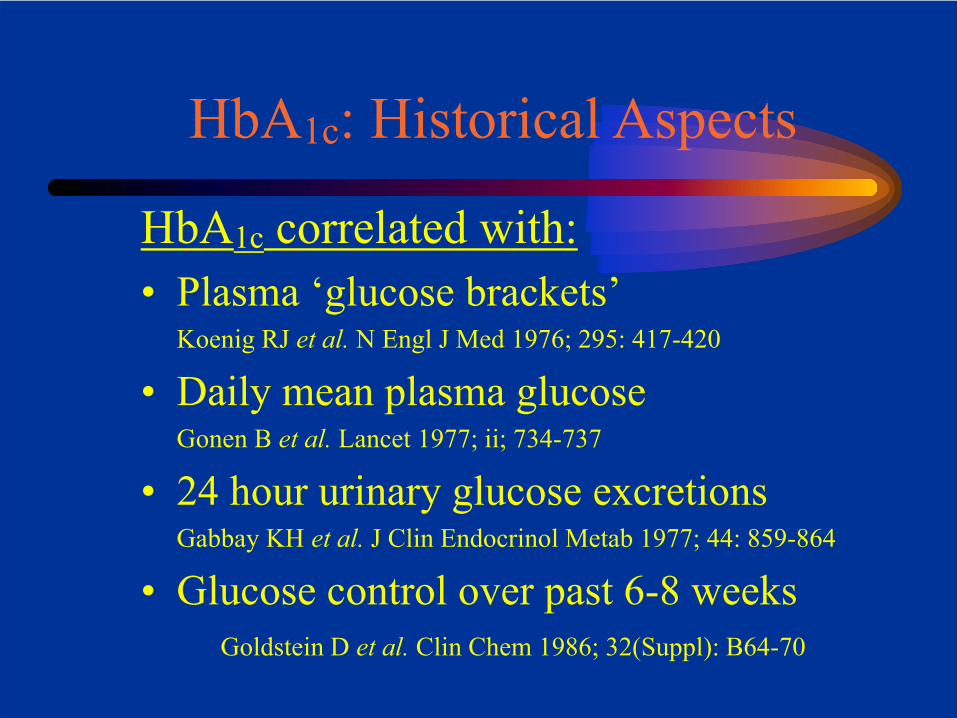
HbA1c: Historical Aspects
HbA1c correlated with:• Plasma ‘glucose brackets’
Koenig RJ et al. N Engl J Med 1976; 295: 417-420
• Daily mean plasma glucoseGonen B et al. Lancet 1977; ii; 734-737
• 24 hour urinary glucose excretionsGabbay KH et al. J Clin Endocrinol Metab 1977; 44: 859-864
• Glucose control over past 6-8 weeksGoldstein D et al. Clin Chem 1986; 32(Suppl): B64-70
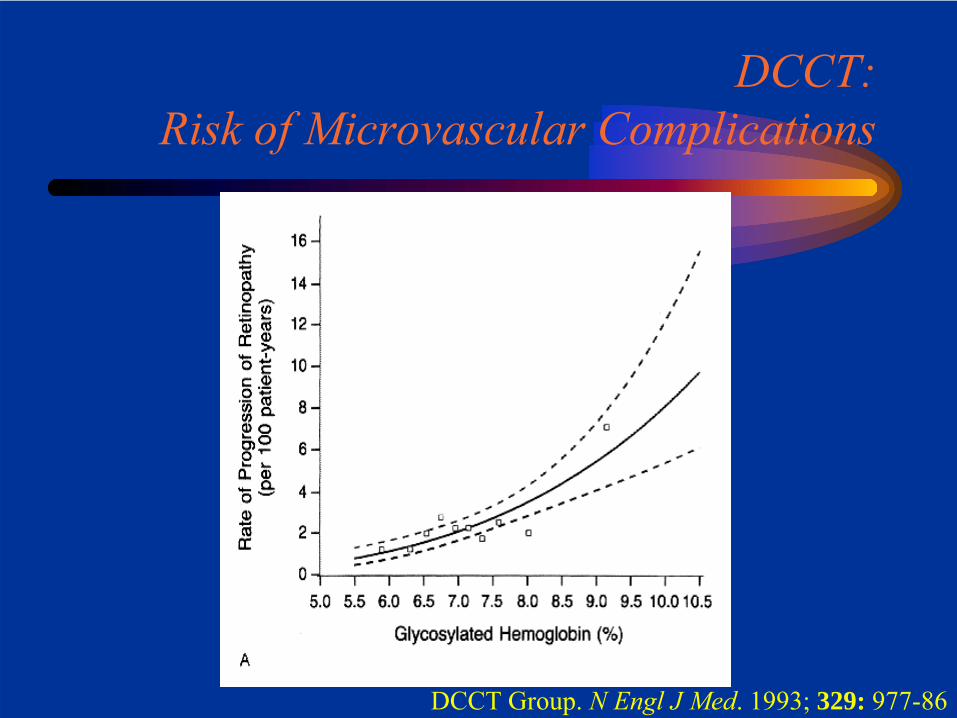
DCCT: Risk of Microvascular Complications
DCCT Group. N Engl J Med. 1993; 329: 977-86
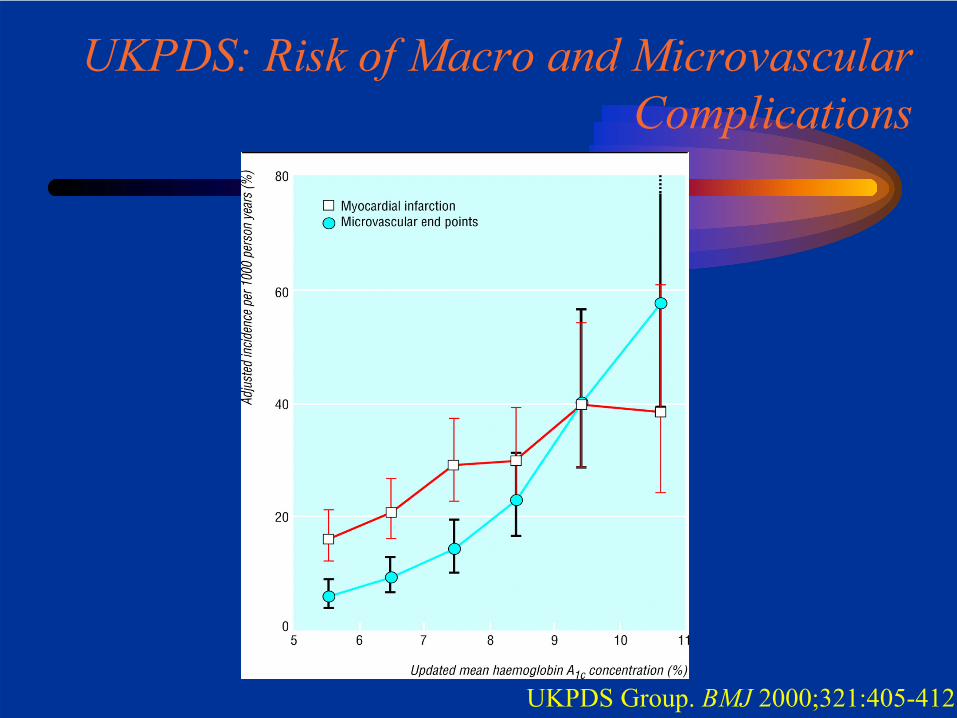
UKPDS: Risk of Macro and Microvascular Complications
UKPDS Group. BMJ 2000;321:405-412
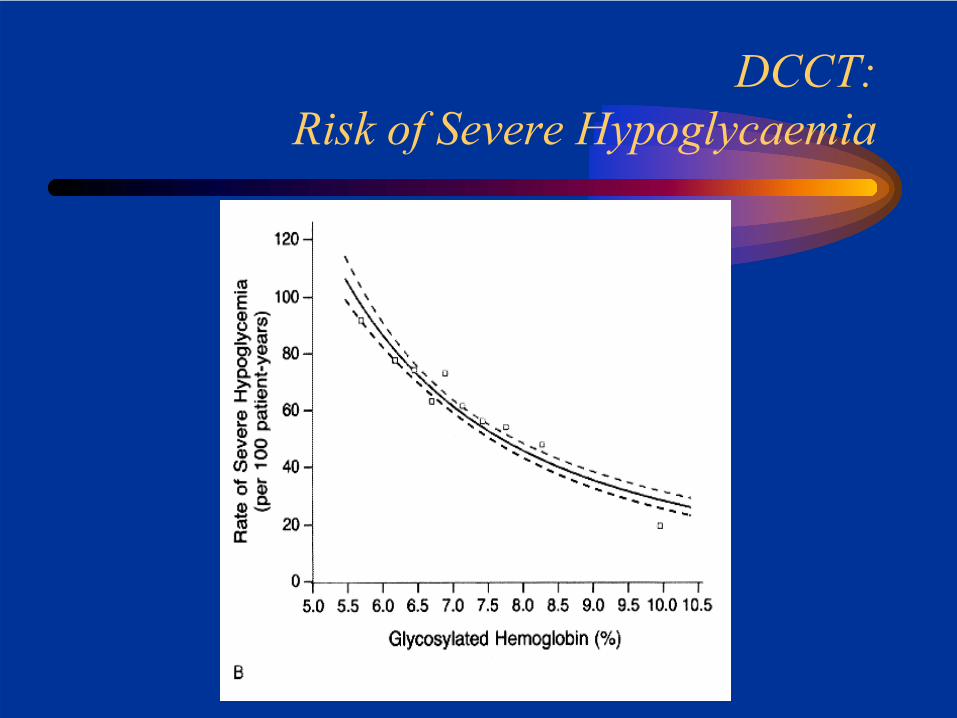
DCCT: Risk of Severe Hypoglycaemia
HbA1c: Historical Aspects
HbA1c correlated with:• Plasma ‘glucose brackets’
Koenig RJ et al. N Engl J Med 1976; 295: 417-420
• Daily mean plasma glucoseGonen B et al. Lancet 1977; ii; 734-737
• 24 hour urinary glucose excretionsGabbay KH et al. J Clin Endocrinol Metab 1977; 44: 859-864
• Glucose control over past 6-8 weeksGoldstein D et al. Clin Chem 1986; 32(Suppl): B64-70
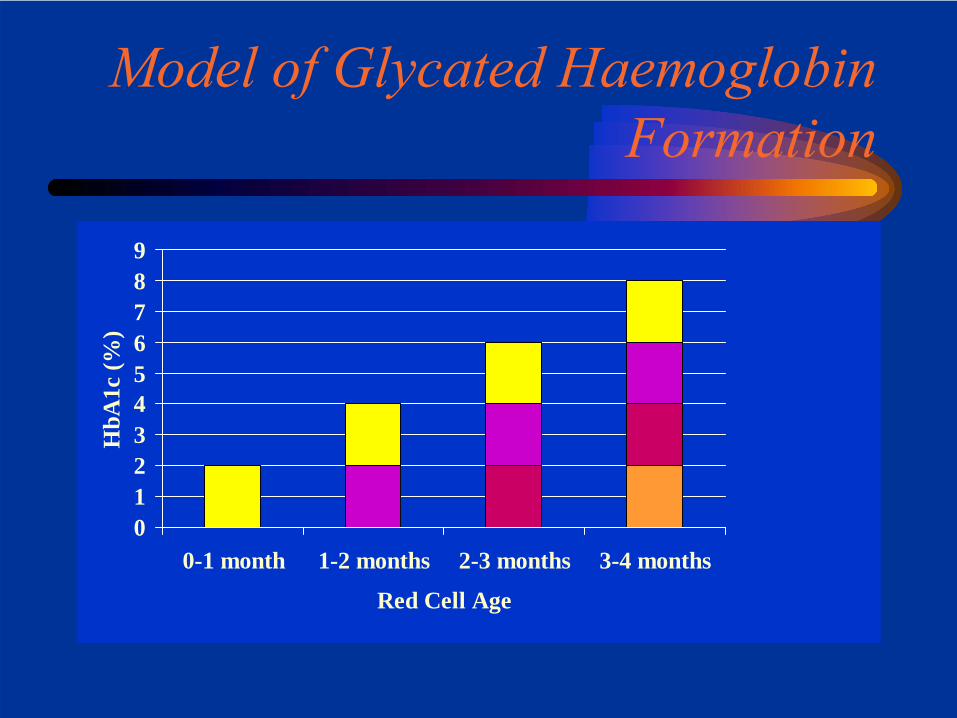
Model of Glycated Haemoglobin Formation
0123456789
0-1 month 1-2 months 2-3 months 3-4 months
Red Cell Age
HbA
1c (%
)
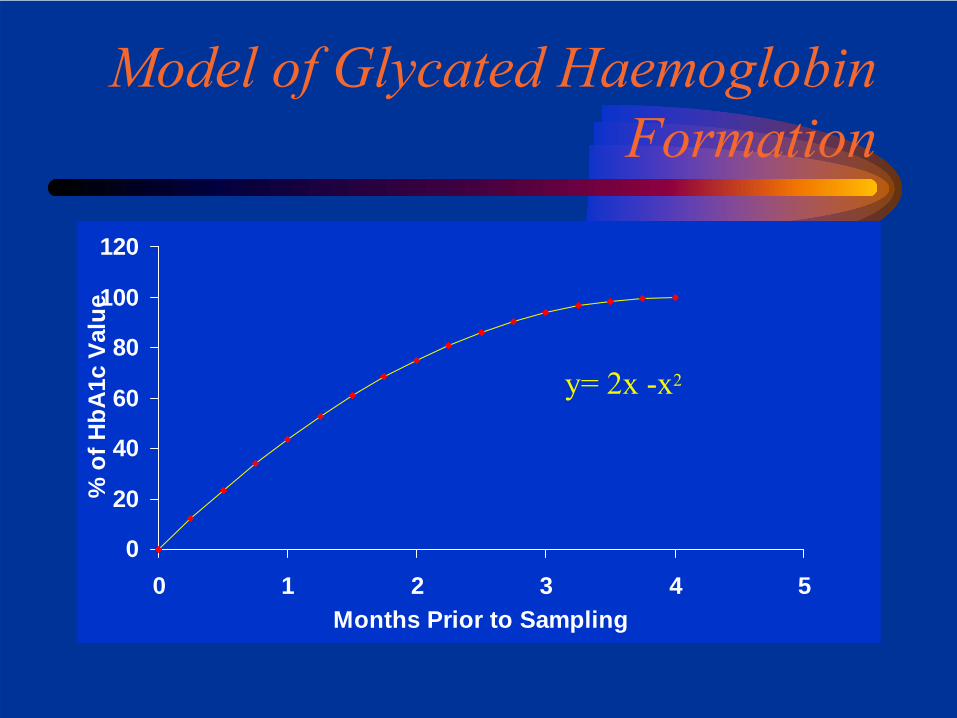
Model of Glycated Haemoglobin Formation
0
20
40
60
80
100
120
0 1 2 3 4 5Months Prior to Sampling
% o
f HbA
1c V
alue
y= 2x -x2
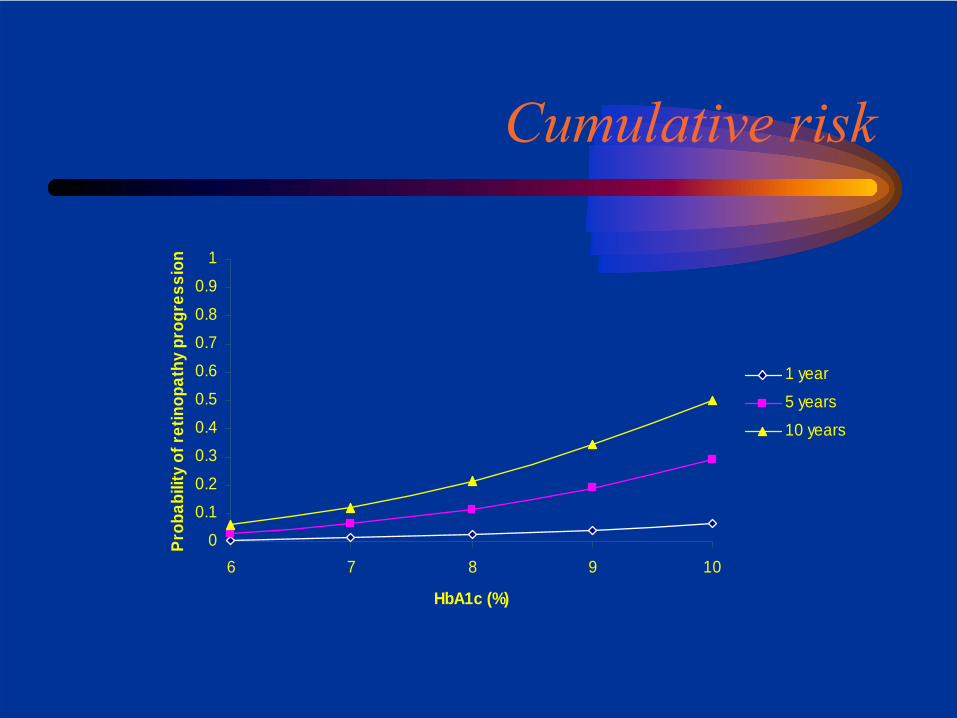
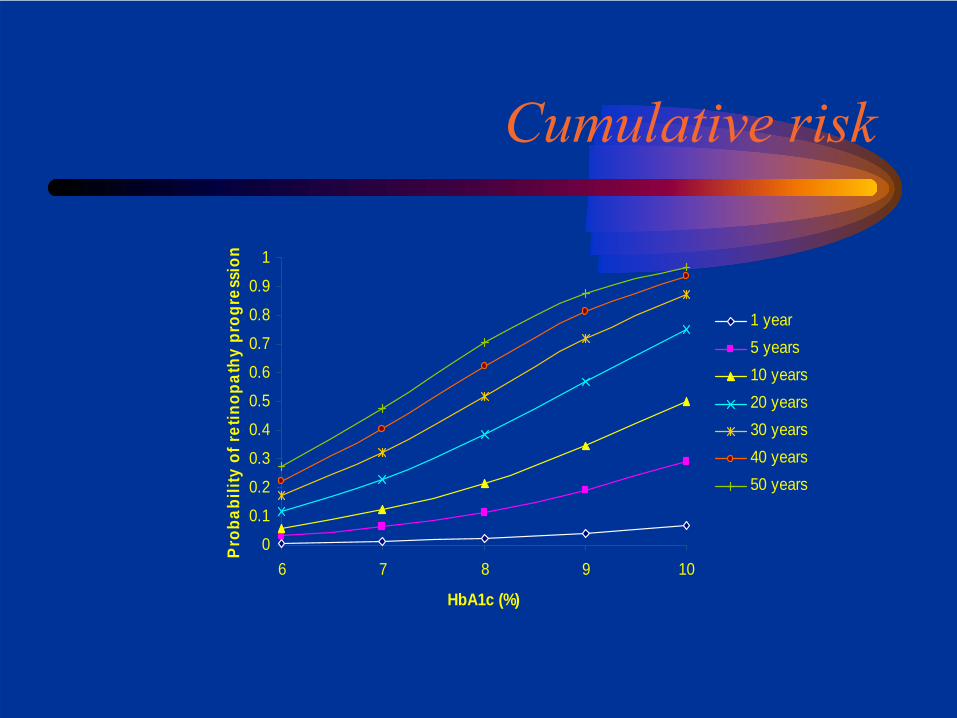
Playing the odds
If I develop diabetes tomorrow
• What are the chances I will remain complication-free for the rest of my life?
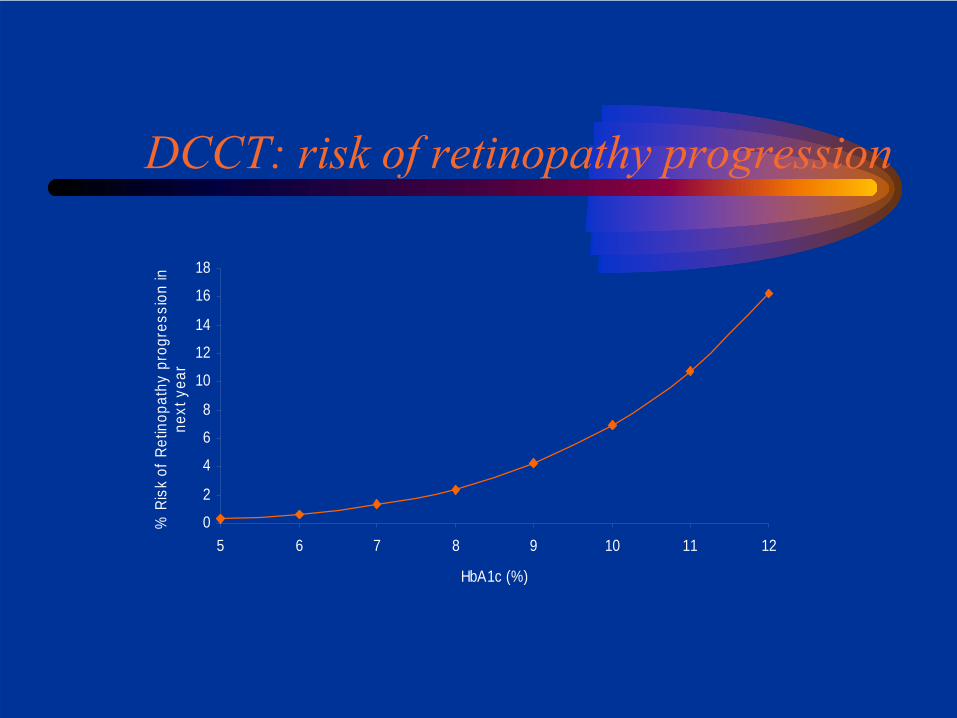
DCCT: risk of retinopathy progression
0
2
4
6
8
10
12
14
16
18
5 6 7 8 9 10 11 12
HbA1c (%)
% R
isk
of R
etin
opat
hy p
rogr
essi
on in
ne
xt y
ear
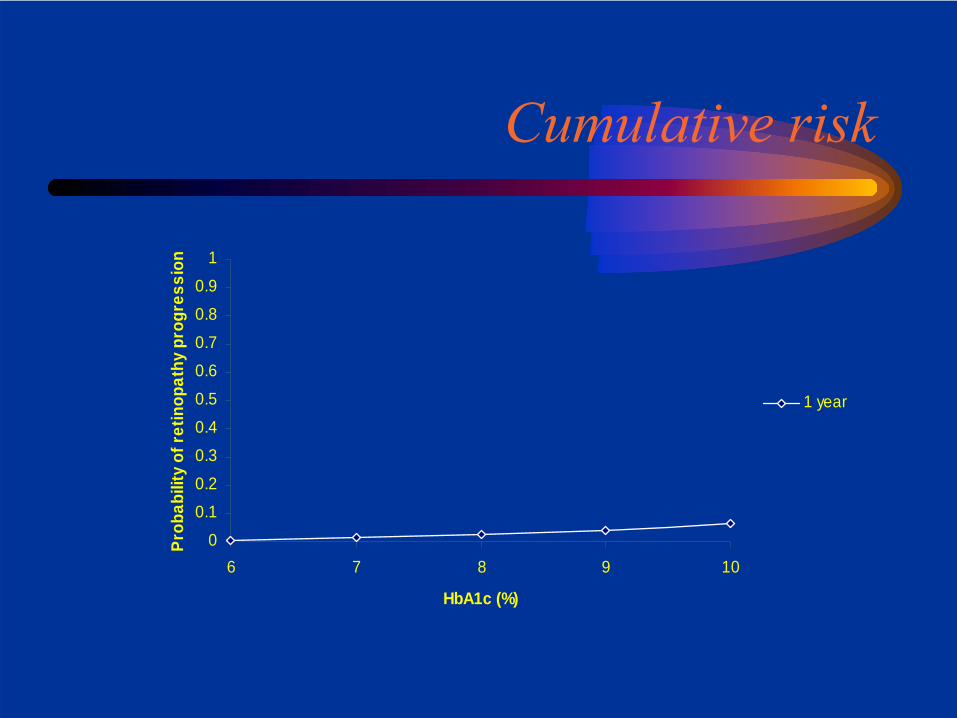
Cumulative risk
0
0.10.2
0.3
0.4
0.5
0.6
0.7
0.8
0.9
1
6 7 8 9 10
HbA1c (%)
Prob
abili
ty o
f ret
inop
athy
pro
gres
sion
1 year

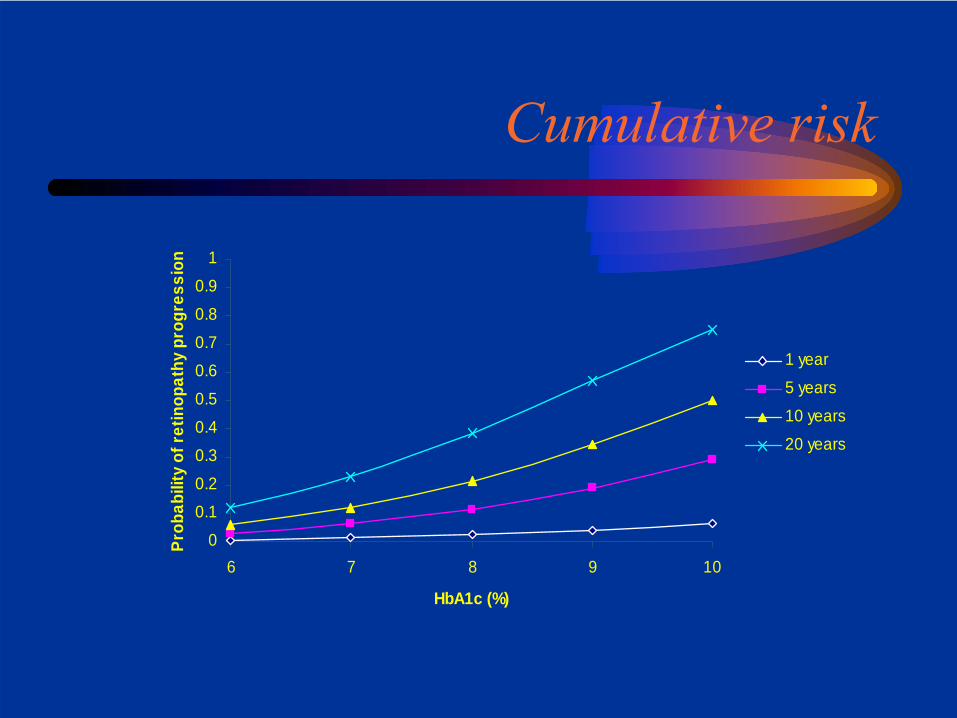
Cumulative risk
0
0.10.2
0.3
0.4
0.5
0.6
0.7
0.8
0.9
1
6 7 8 9 10
HbA1c (%)
Prob
abili
ty o
f ret
inop
athy
pro
gres
sion
1 year
5 years
Cumulative risk
0
0.10.2
0.3
0.4
0.5
0.6
0.7
0.8
0.9
1
6 7 8 9 10
HbA1c (%)
Prob
abili
ty o
f ret
inop
athy
pro
gres
sion
1 year
5 years
10 years
Cumulative risk
0
0.10.2
0.3
0.4
0.5
0.6
0.7
0.8
0.9
1
6 7 8 9 10
HbA1c (%)
Prob
abili
ty o
f ret
inop
athy
pro
gres
sion
1 year
5 years
10 years
20 years
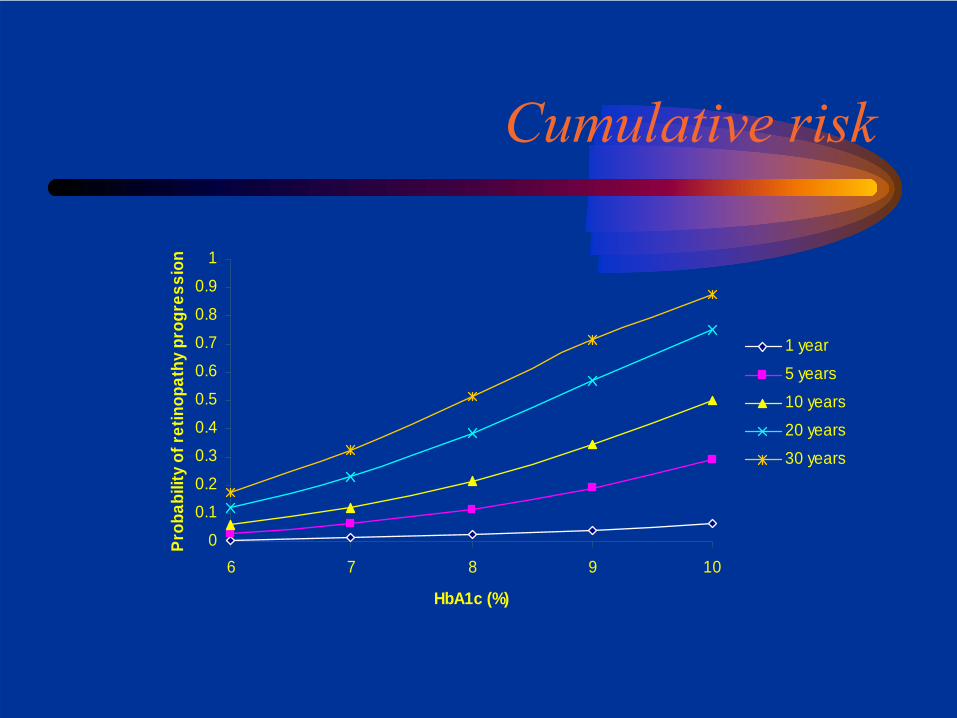
Cumulative risk
0
0.10.2
0.3
0.4
0.5
0.6
0.7
0.8
0.9
1
6 7 8 9 10
HbA1c (%)
Prob
abili
ty o
f ret
inop
athy
pro
gres
sion
1 year
5 years
10 years
20 years
30 years
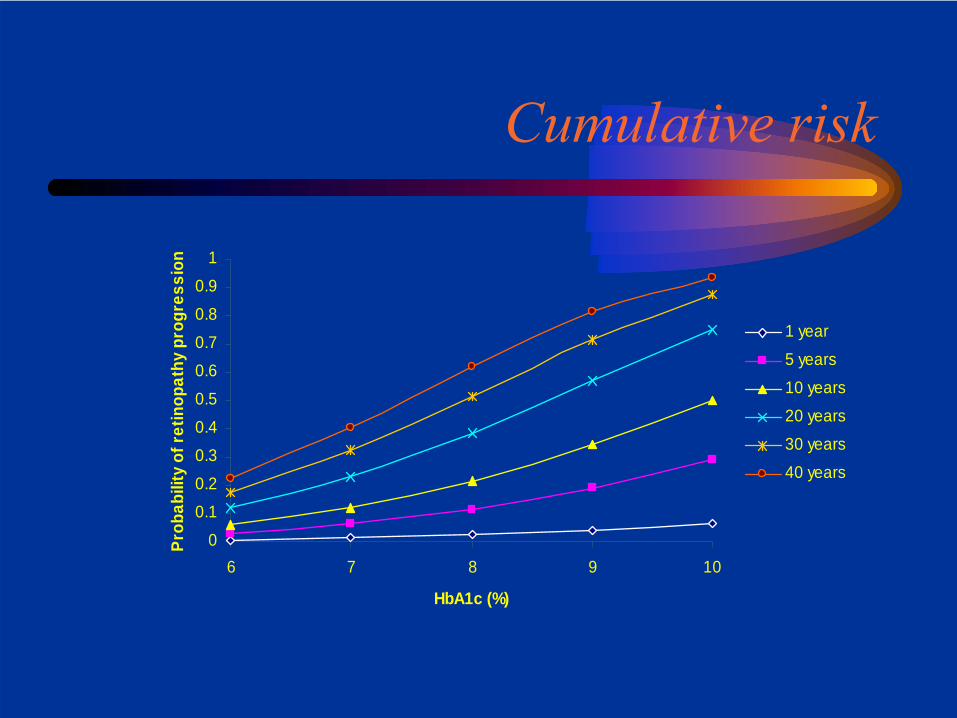
Cumulative risk
0
0.10.2
0.3
0.4
0.5
0.6
0.7
0.8
0.9
1
6 7 8 9 10
HbA1c (%)
Prob
abili
ty o
f ret
inop
athy
pro
gres
sion
1 year
5 years
10 years
20 years
30 years
40 years
Cumulative risk
0
0.1
0.2
0.3
0.4
0.5
0.6
0.7
0.8
0.9
1
6 7 8 9 10
HbA1c (%)
Prob
abili
ty o
f ret
inop
athy
pro
gres
sion
1 year5 years10 years20 years30 years40 years50 years
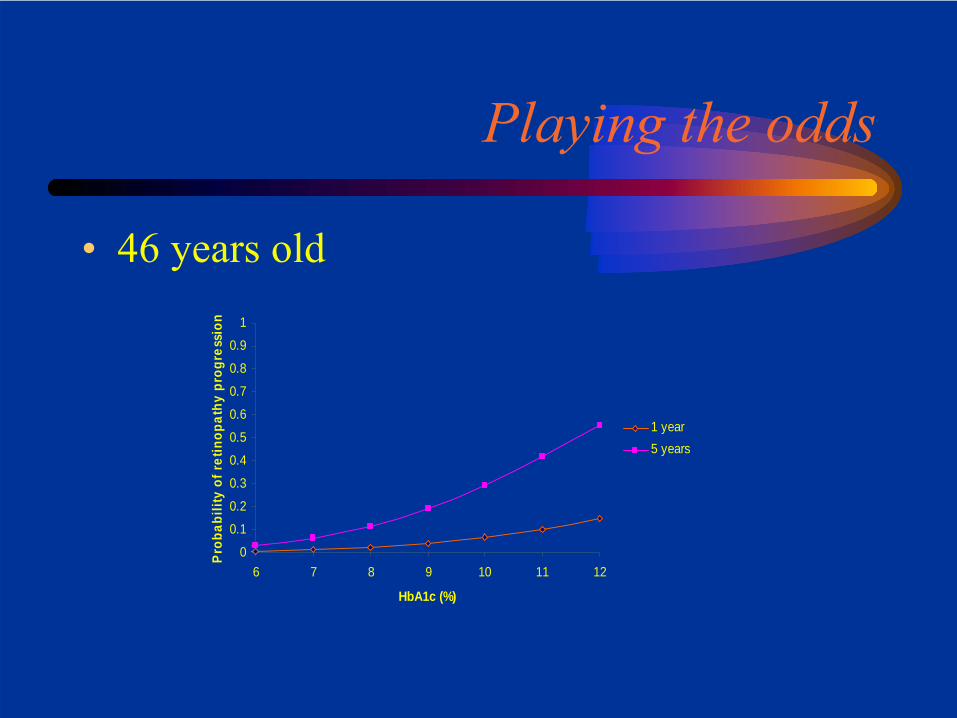
Playing the odds
• 46 years old
0
0.1
0.2
0.3
0.4
0.5
0.6
0.7
0.8
0.9
1
6 7 8 9 10 11 12
HbA1c (%)
Pro
babi
lity
of r
etin
opat
hy p
rogr
essi
on
1 year5 years
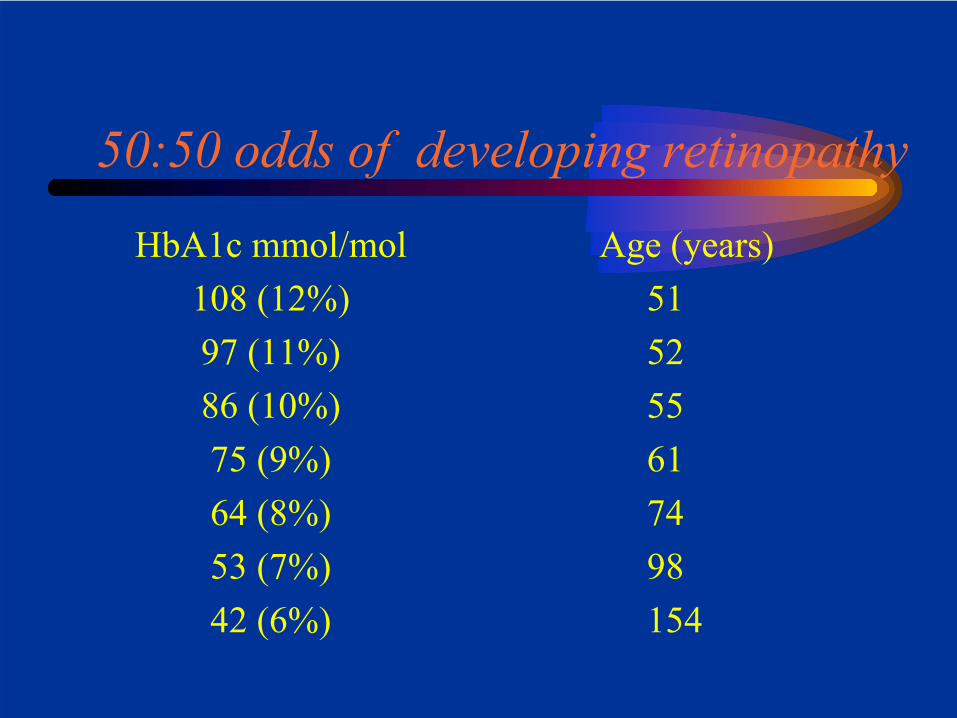
50:50 odds of developing retinopathy
HbA1c mmol/mol108 (12%)97 (11%)86 (10%)75 (9%)64 (8%)53 (7%)42 (6%)
Age (years)51 52 55 6174 98 154
What’s going on with HbA1c?
• HbA1c: a brief history
• How should we report HbA1c?
• Using HbA1c to diagnose diabetes
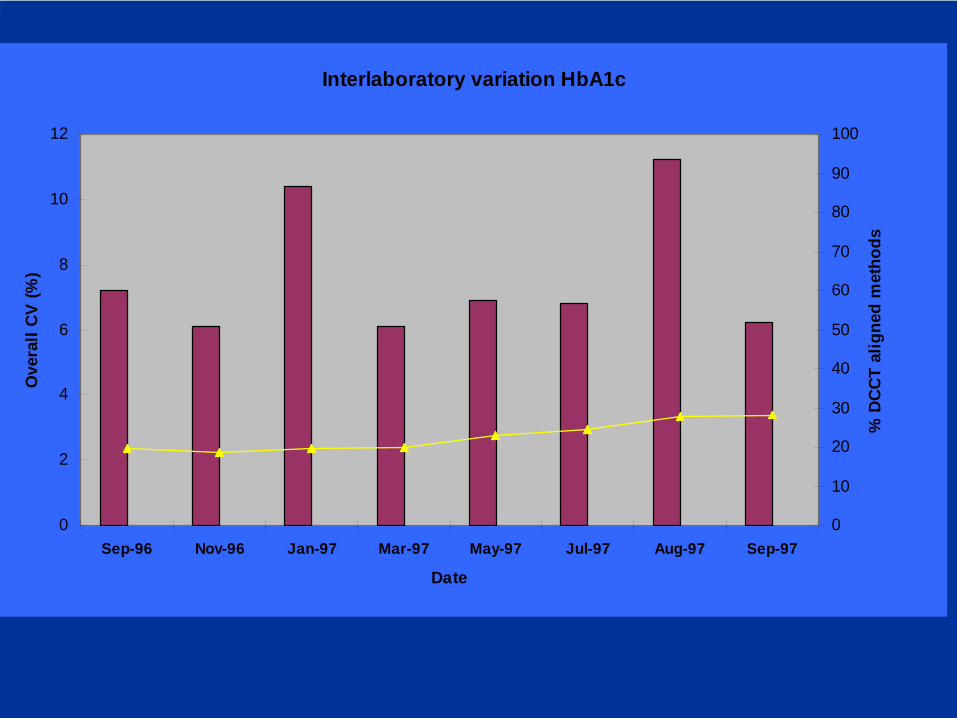
Interlaboratory variation HbA1c
0
2
4
6
8
10
12
Sep-96 Nov-96 Jan-97 Mar-97 May-97 Jul-97 Aug-97 Sep-97
Date
Ove
rall
CV
(%)
0
10
20
30
40
50
60
70
80
90
100
% D
CCT
alig
ned
met
hods
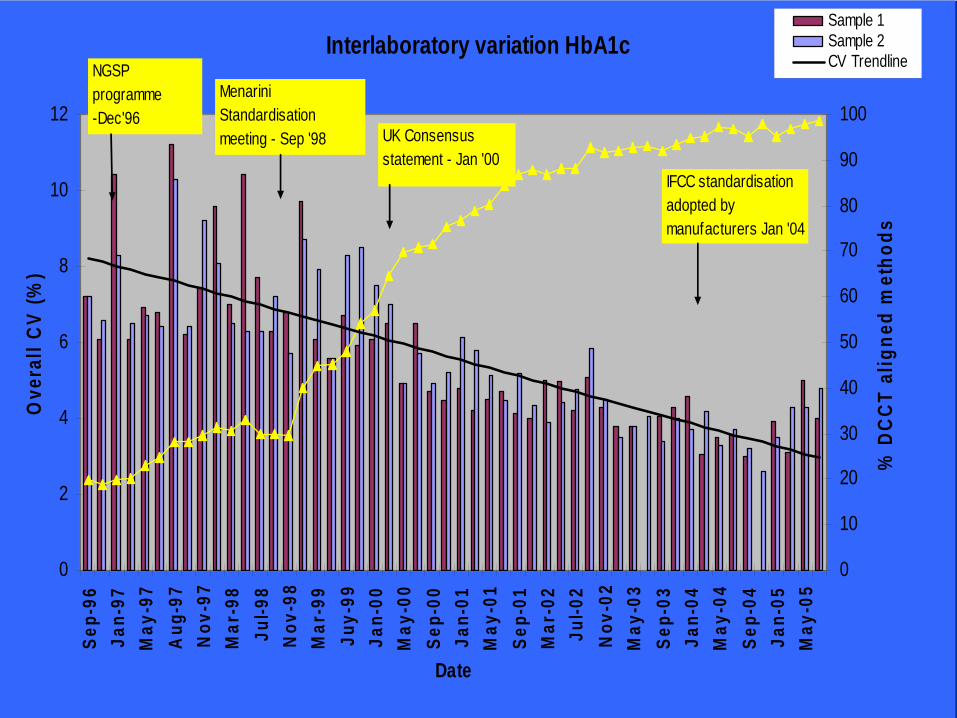
Interlaboratory variation HbA1c
0
2
4
6
8
10
12Se
p-96
Jan-
97M
ay-9
7A
ug-9
7N
ov-9
7M
ar-9
8Ju
l-98
Nov
-98
Mar
-99
Juy-
99Ja
n-00
May
-00
Sep-
00Ja
n-01
May
-01
Sep-
01M
ar-0
2Ju
l-02
Nov
-02
May
-03
Sep-
03Ja
n-04
May
-04
Sep-
04Ja
n-05
May
-05
Date
Ove
rall
CV
(%)
0
10
20
30
40
50
60
70
80
90
100
% D
CCT
alig
ned
met
hods
Sample 1Sample 2CV TrendlineNGSP
programme-Dec'96
Menarini Standardisationmeeting - Sep '98 UK Consensus
statement - Jan '00IFCC standardisation adopted by manufacturers Jan '04
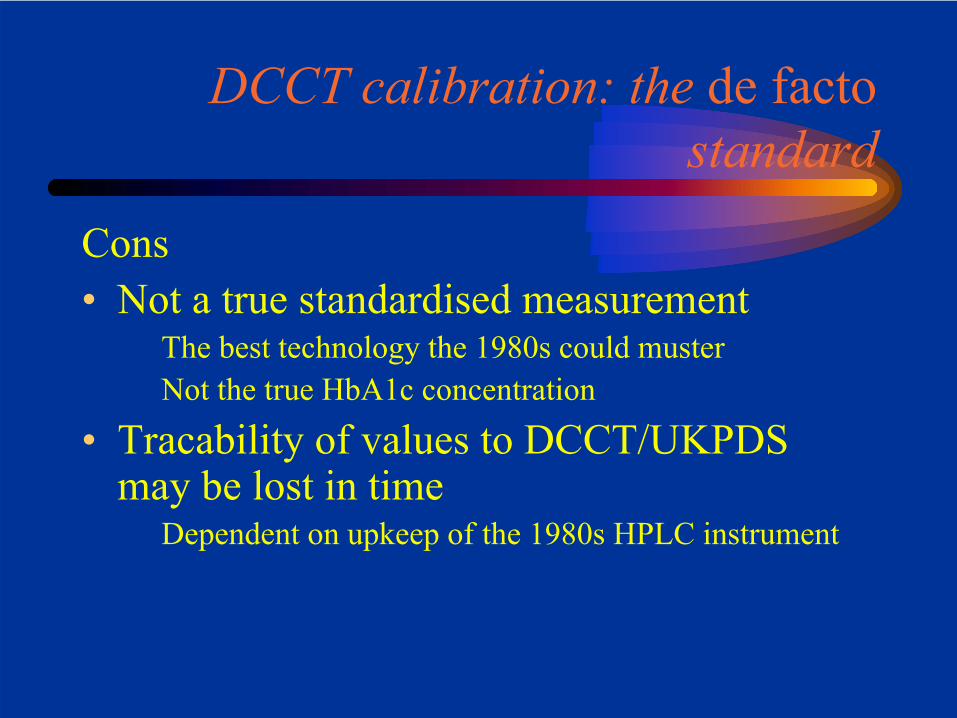
DCCT calibration: the de factostandard
Cons• Not a true standardised measurement
The best technology the 1980s could musterNot the true HbA1c concentration
• Tracability of values to DCCT/UKPDS may be lost in time
Dependent on upkeep of the 1980s HPLC instrument
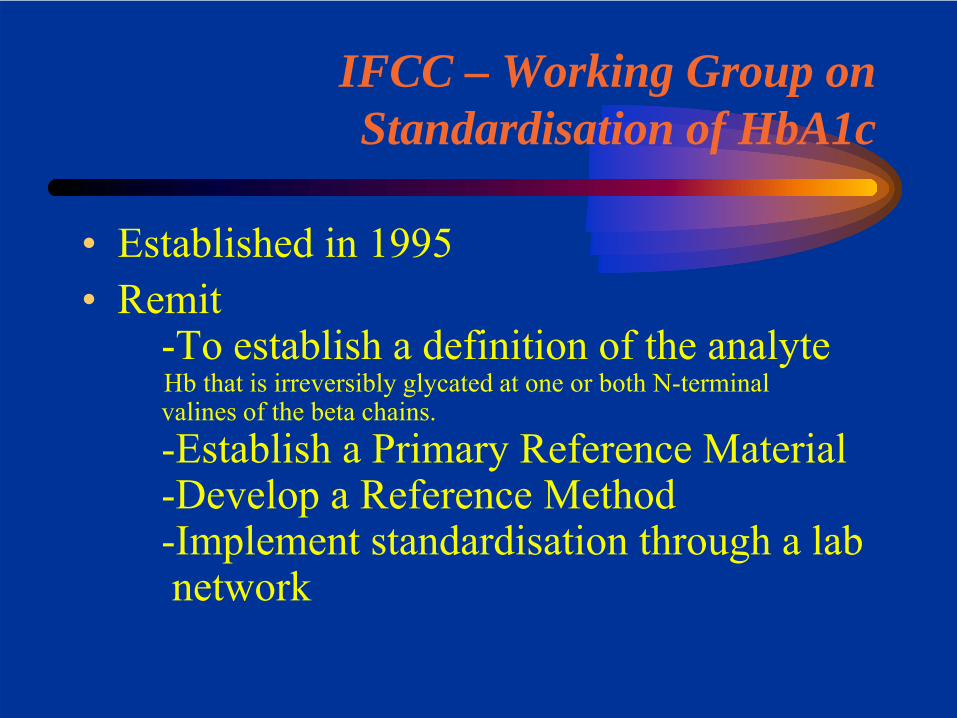
IFCC – Working Group on Standardisation of HbA1c
• Established in 1995• Remit
-To establish a definition of the analyteHb that is irreversibly glycated at one or both N-terminal valines of the beta chains.-Establish a Primary Reference Material-Develop a Reference Method-Implement standardisation through a labnetwork
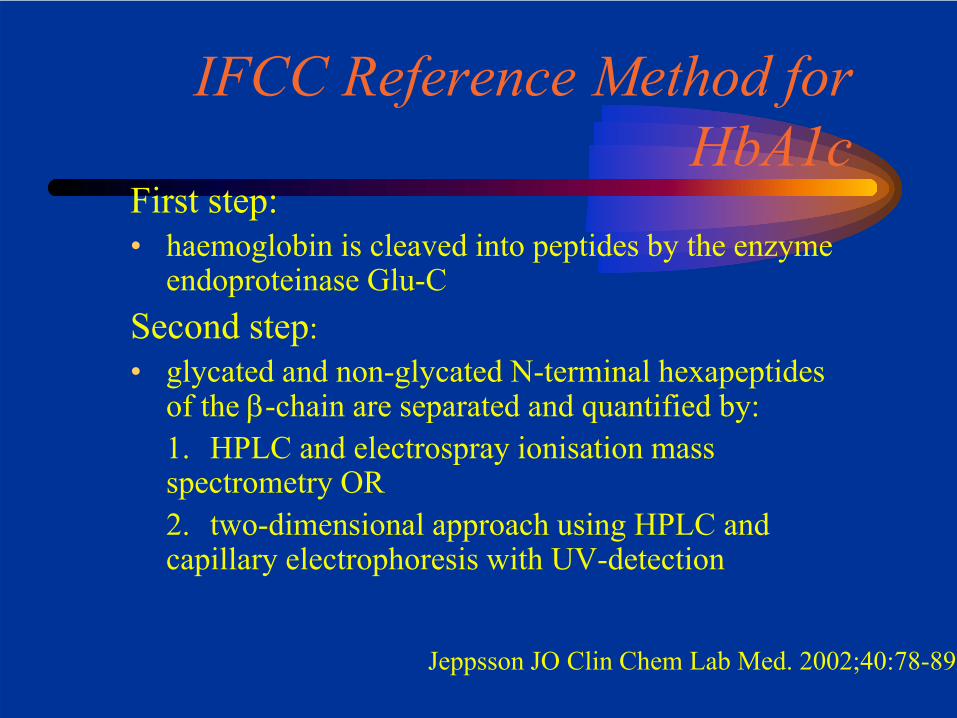
IFCC Reference Method for HbA1c
First step:• haemoglobin is cleaved into peptides by the enzyme
endoproteinase Glu-CSecond step:• glycated and non-glycated N-terminal hexapeptides
of the β-chain are separated and quantified by:1. HPLC and electrospray ionisation mass spectrometry OR2. two-dimensional approach using HPLC and capillary electrophoresis with UV-detection
Jeppsson JO Clin Chem Lab Med. 2002;40:78-89
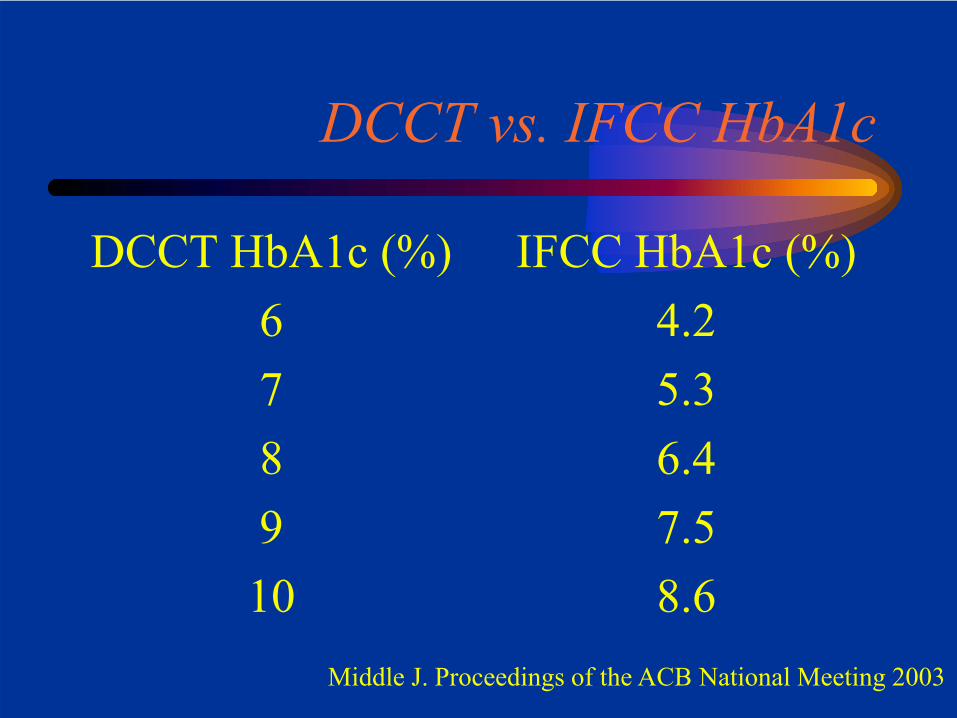
DCCT vs. IFCC HbA1c
DCCT HbA1c (%)678910
IFCC HbA1c (%)4.25.36.47.58.6
Middle J. Proceedings of the ACB National Meeting 2003
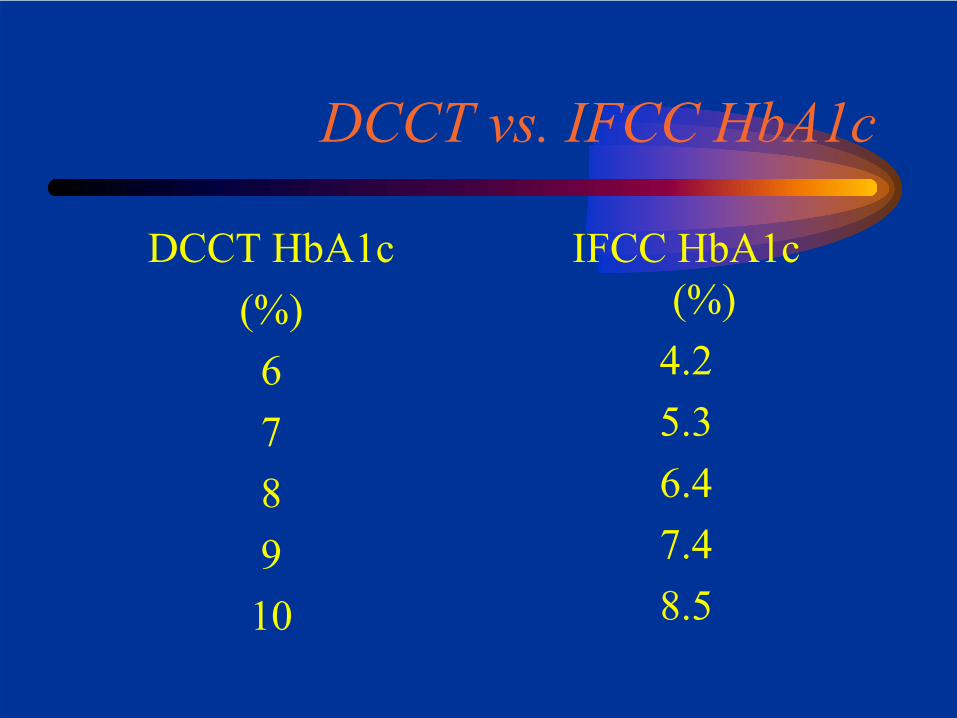
DCCT vs. IFCC HbA1c
DCCT HbA1c(%)678910
IFCC HbA1c(%)
4.25.36.47.48.5
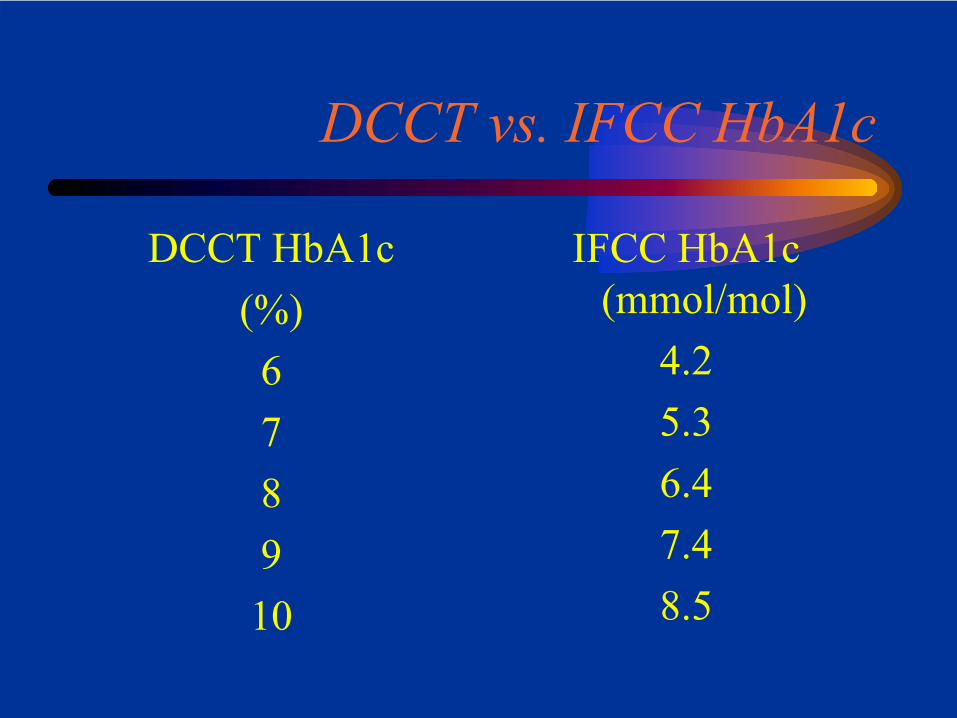
DCCT vs. IFCC HbA1c
DCCT HbA1c(%)678910
IFCC HbA1c(mmol/mol)
4.25.36.47.48.5
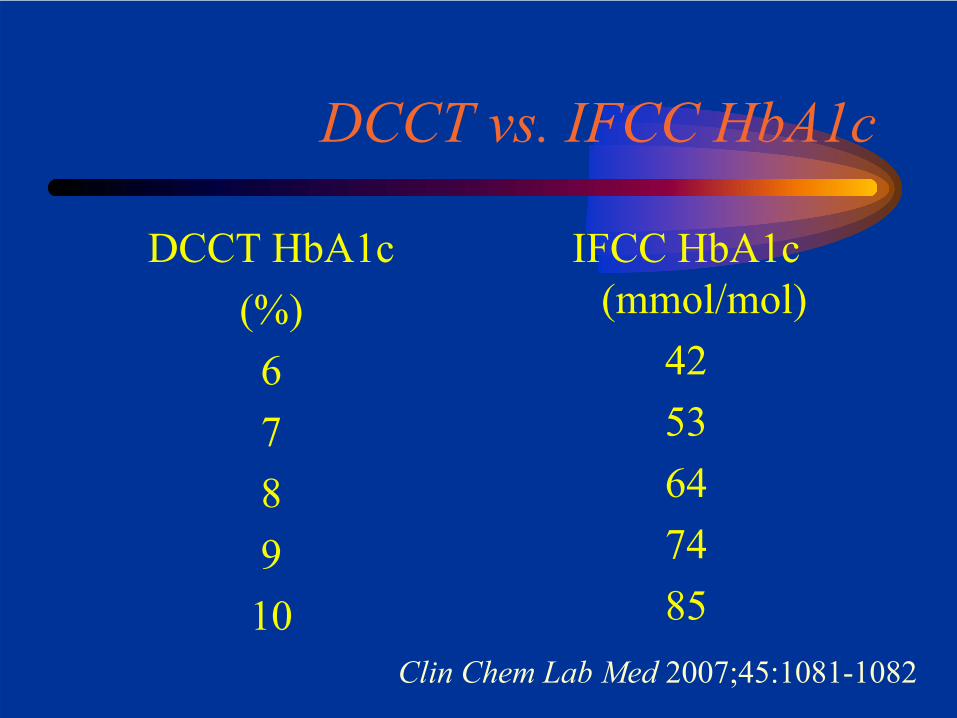
DCCT vs. IFCC HbA1c
DCCT HbA1c(%)678910
IFCC HbA1c(mmol/mol)
4253647485
Clin Chem Lab Med 2007;45:1081-1082
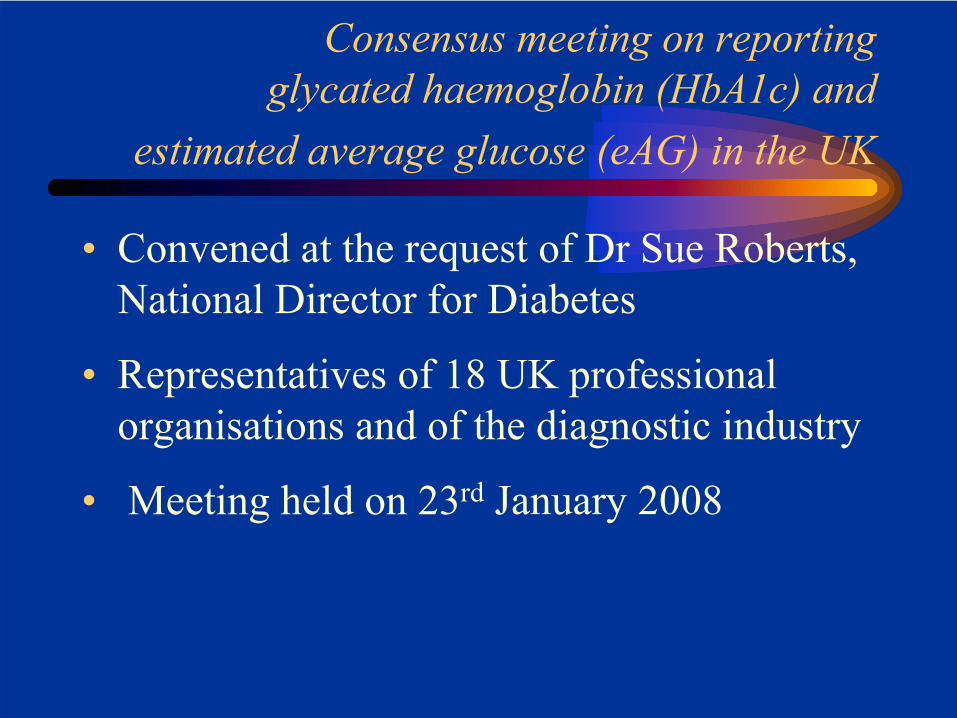
Consensus meeting on reportingglycated haemoglobin (HbA1c) and
estimated average glucose (eAG) in the UK
• Convened at the request of Dr Sue Roberts, National Director for Diabetes
• Representatives of 18 UK professional organisations and of the diagnostic industry
• Meeting held on 23rd January 2008
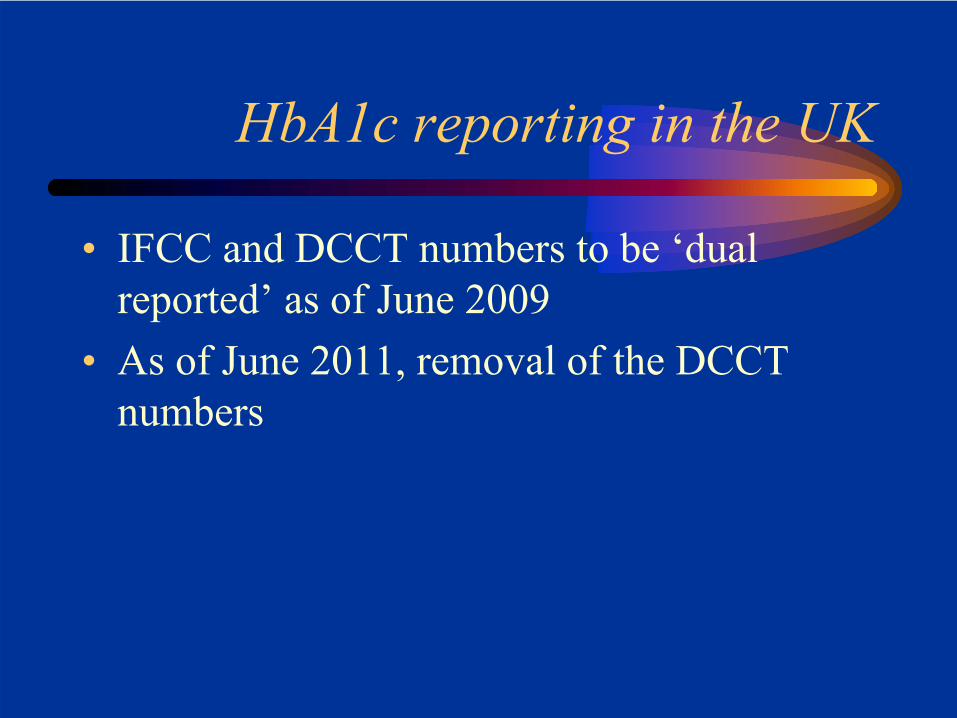
HbA1c reporting in the UK
• IFCC and DCCT numbers to be ‘dual reported’ as of June 2009
• As of June 2011, removal of the DCCT numbers

DCCT vs. IFCC HbA1c
DCCT HbA1c(%)678910
IFCC HbA1c(mmol/mol)
4253647485
Clin Chem Lab Med 2007;45:1081-1082
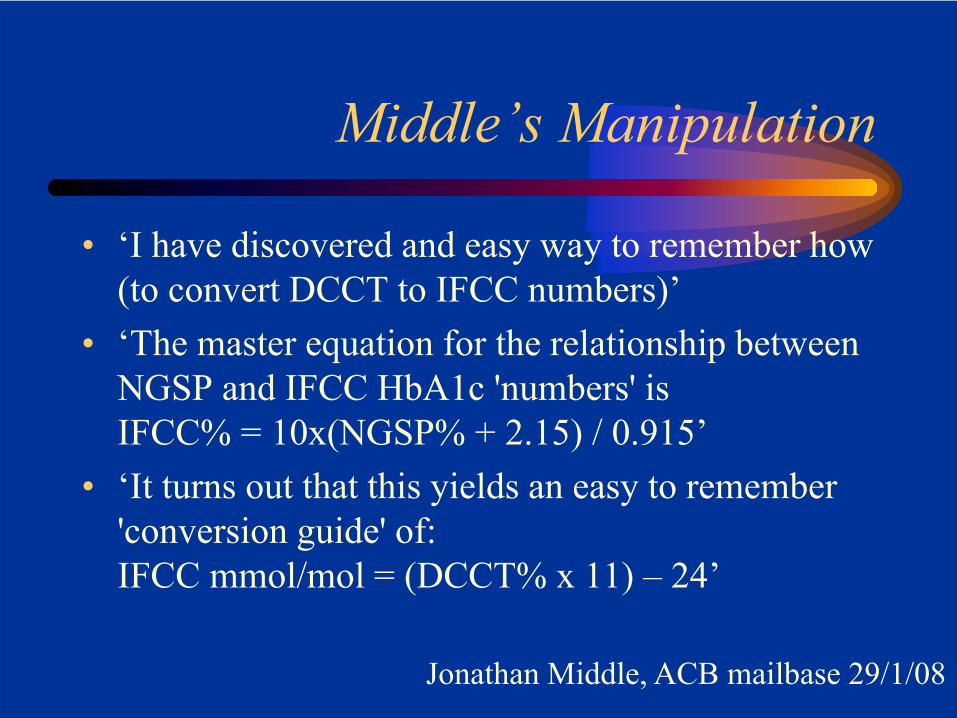
Middle’s Manipulation
• ‘I have discovered and easy way to remember how (to convert DCCT to IFCC numbers)’
• ‘The master equation for the relationship between NGSP and IFCC HbA1c 'numbers' isIFCC% = 10x(NGSP% + 2.15) / 0.915’
• ‘It turns out that this yields an easy to remember 'conversion guide' of:IFCC mmol/mol = (DCCT% x 11) – 24’
Jonathan Middle, ACB mailbase 29/1/08
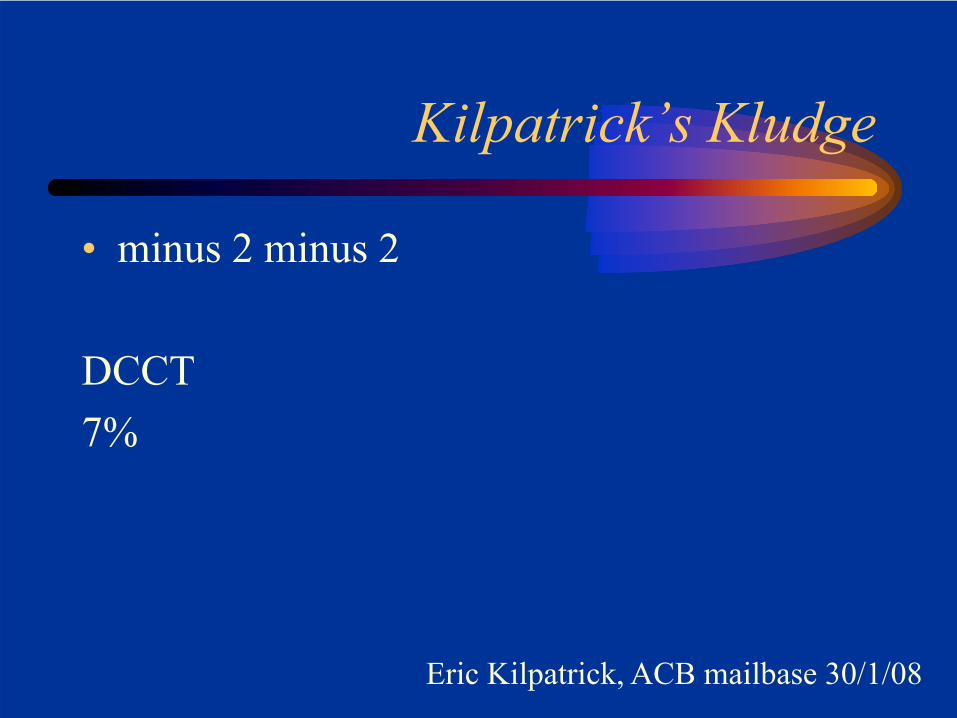
Kilpatrick’s Kludge
• minus 2 minus 2
DCCT7%
Eric Kilpatrick, ACB mailbase 30/1/08

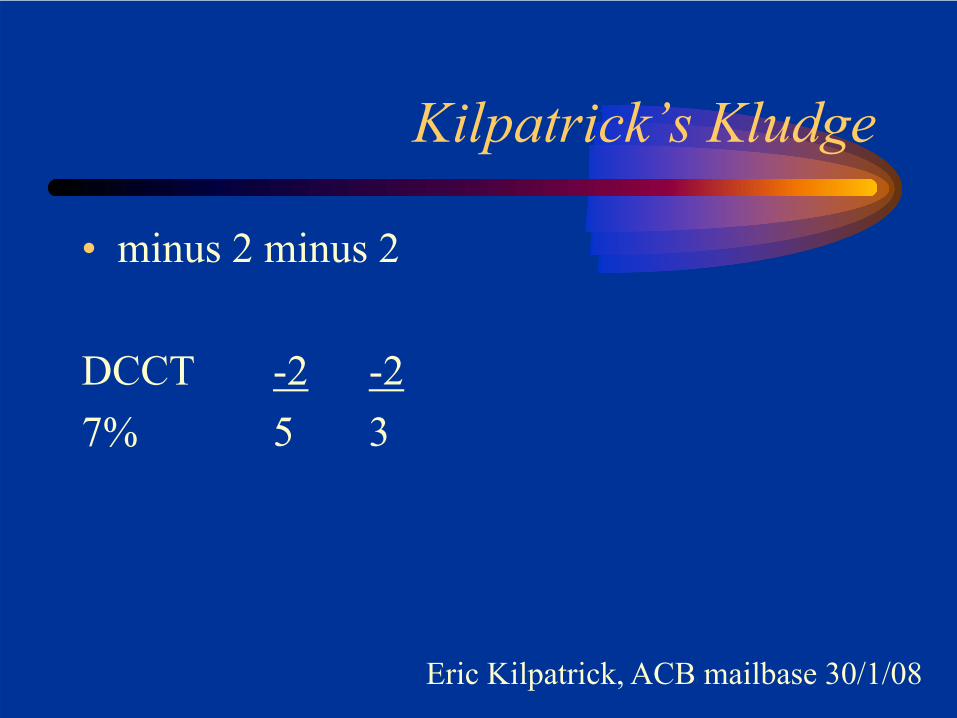
Kilpatrick’s Kludge
• minus 2 minus 2
DCCT -27% 5
Eric Kilpatrick, ACB mailbase 30/1/08
Kilpatrick’s Kludge
• minus 2 minus 2
DCCT -2 -27% 5 3
Eric Kilpatrick, ACB mailbase 30/1/08
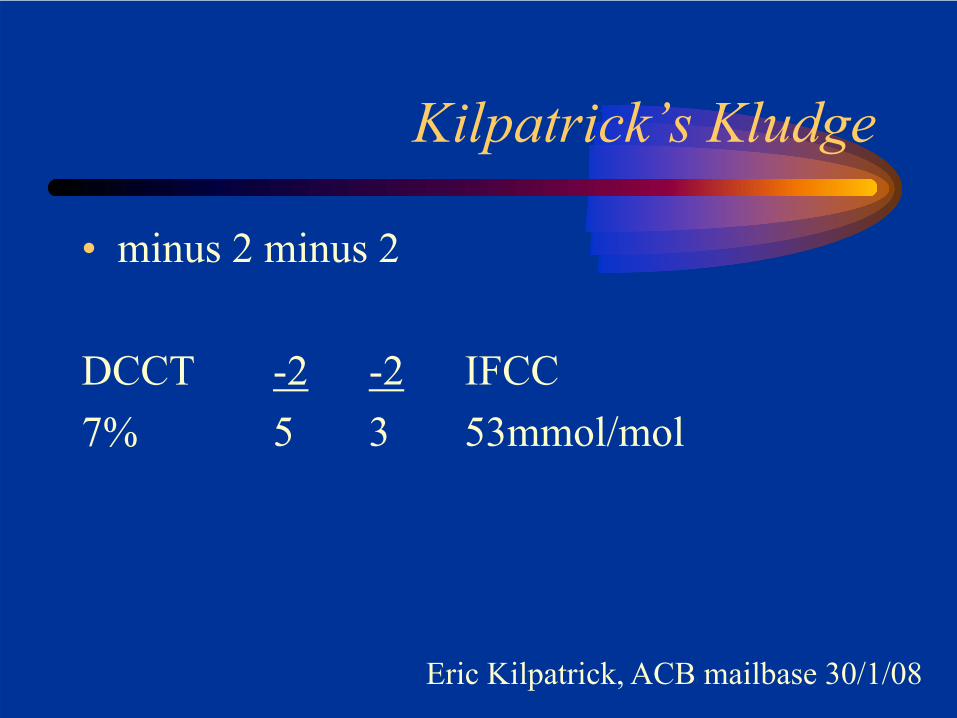
Kilpatrick’s Kludge
• minus 2 minus 2
DCCT -2 -2 IFCC7% 5 3 53mmol/mol
Eric Kilpatrick, ACB mailbase 30/1/08
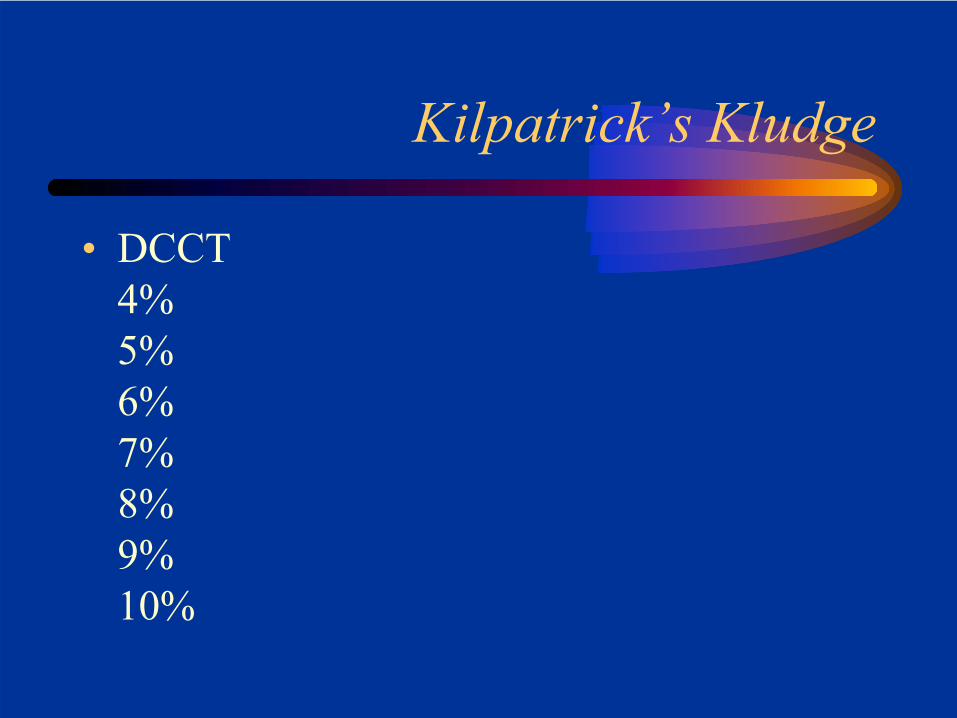
Kilpatrick’s Kludge
• DCCT 4%5%6%7%8%9%10%
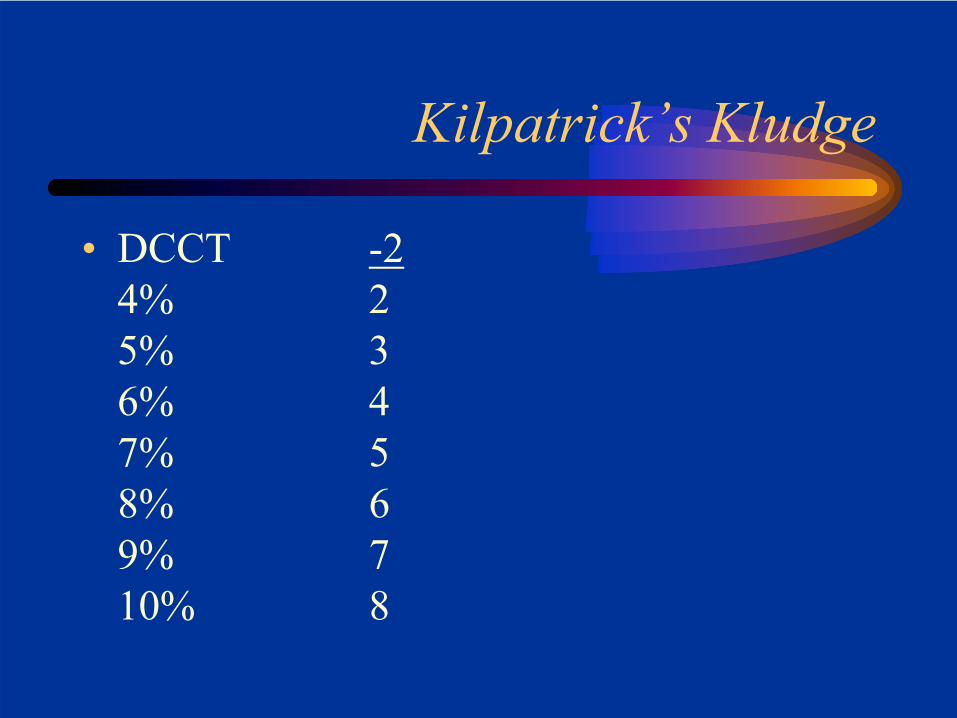
Kilpatrick’s Kludge
• DCCT -24% 25% 36% 47% 58% 69% 710% 8
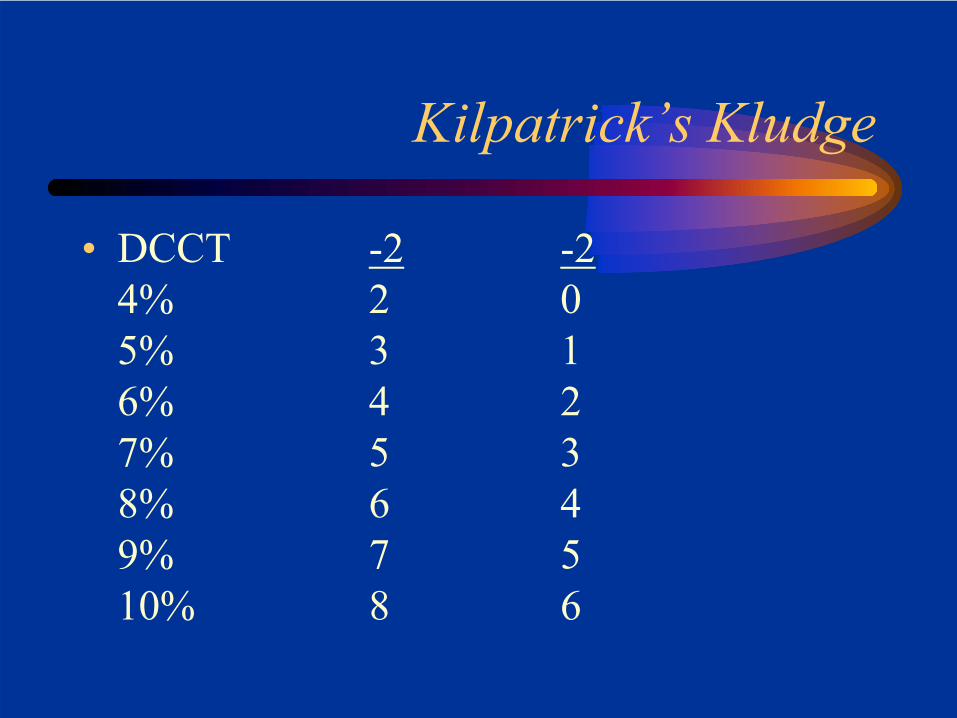
Kilpatrick’s Kludge
• DCCT -2 -24% 2 05% 3 16% 4 27% 5 38% 6 49% 7 510% 8 6

Kilpatrick’s Kludge
• DCCT -2 -24% 2 05% 3 16% 4 27% 5 38% 6 49% 7 510% 8 6
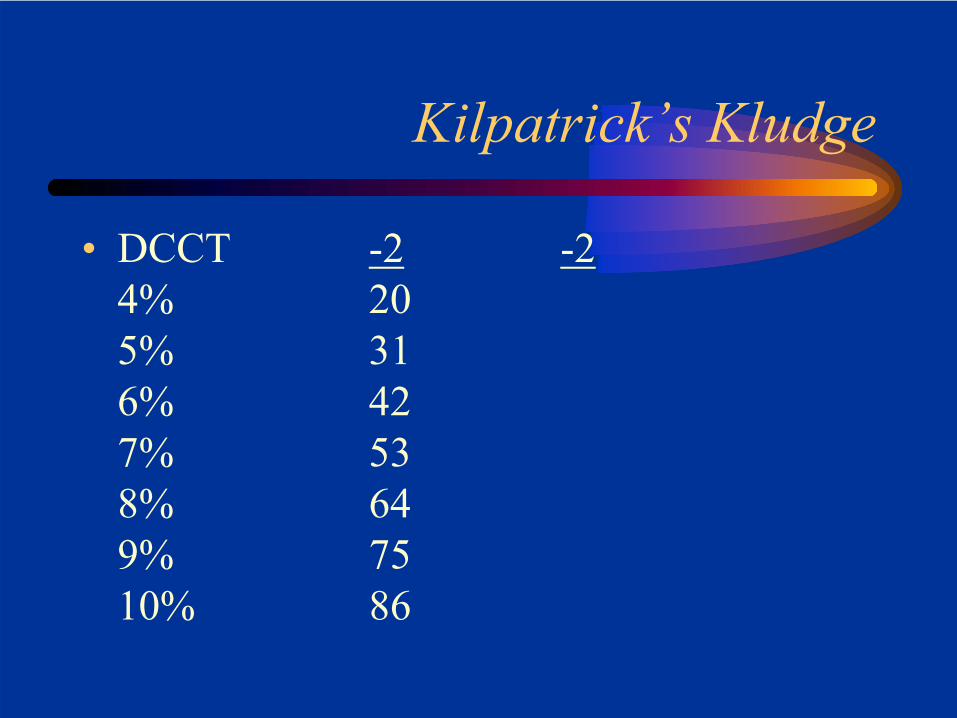
Kilpatrick’s Kludge
• DCCT -2 -24% 205% 316% 427% 538% 649% 7510% 86
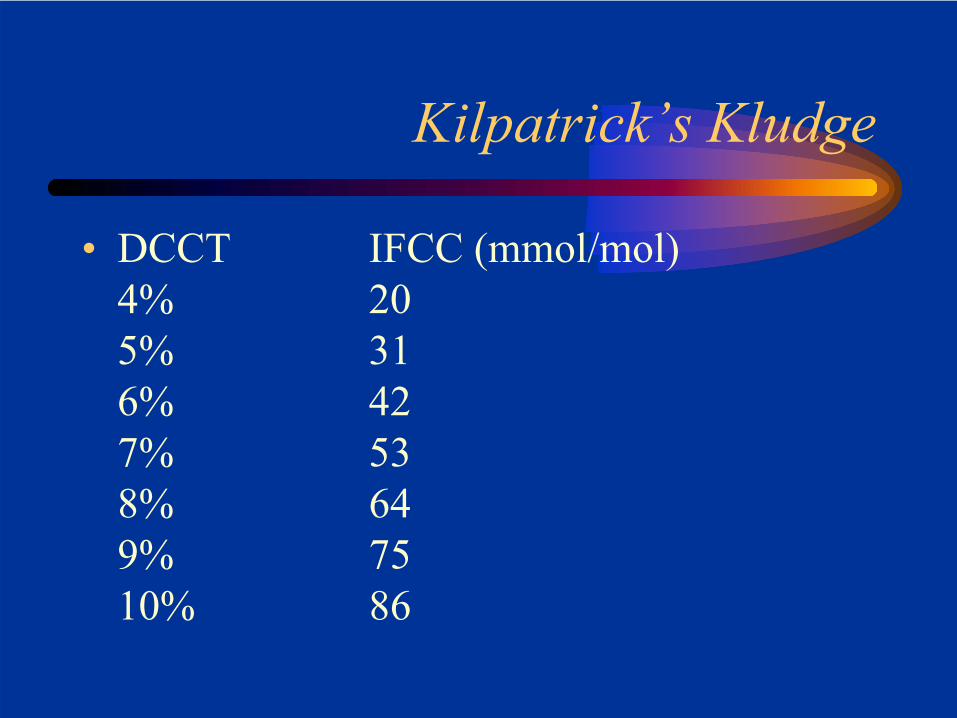
Kilpatrick’s Kludge
• DCCT IFCC (mmol/mol)4% 205% 316% 427% 538% 649% 7510% 86
What’s going on with HbA1c?
• HbA1c: a brief history
• How should we report HbA1c?
• Using HbA1c to diagnose diabetes
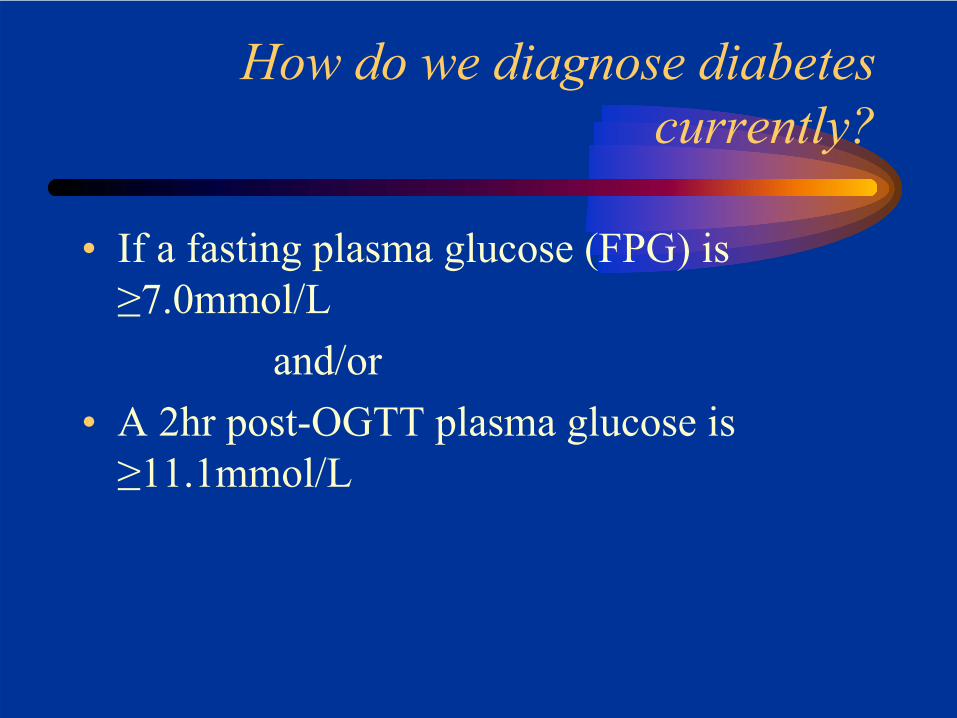
How do we diagnose diabetes currently?
• If a fasting plasma glucose (FPG) is ≥7.0mmol/L
and/or• A 2hr post-OGTT plasma glucose is ≥11.1mmol/L
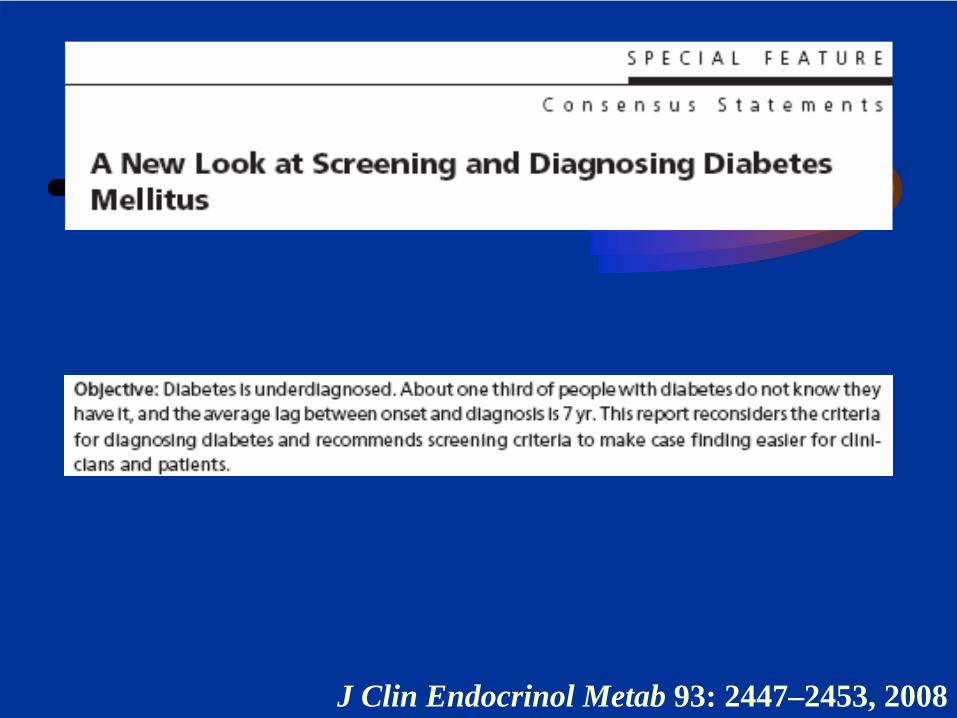
J Clin Endocrinol Metab 93: 2447–2453, 2008
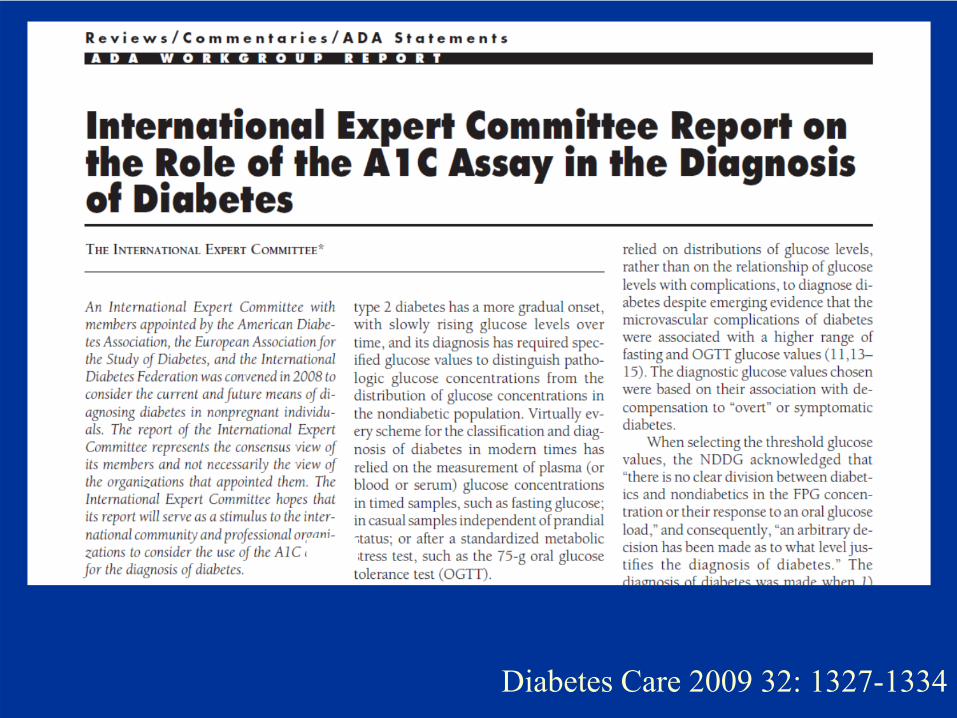
Diabetes Care 2009 32: 1327-1334
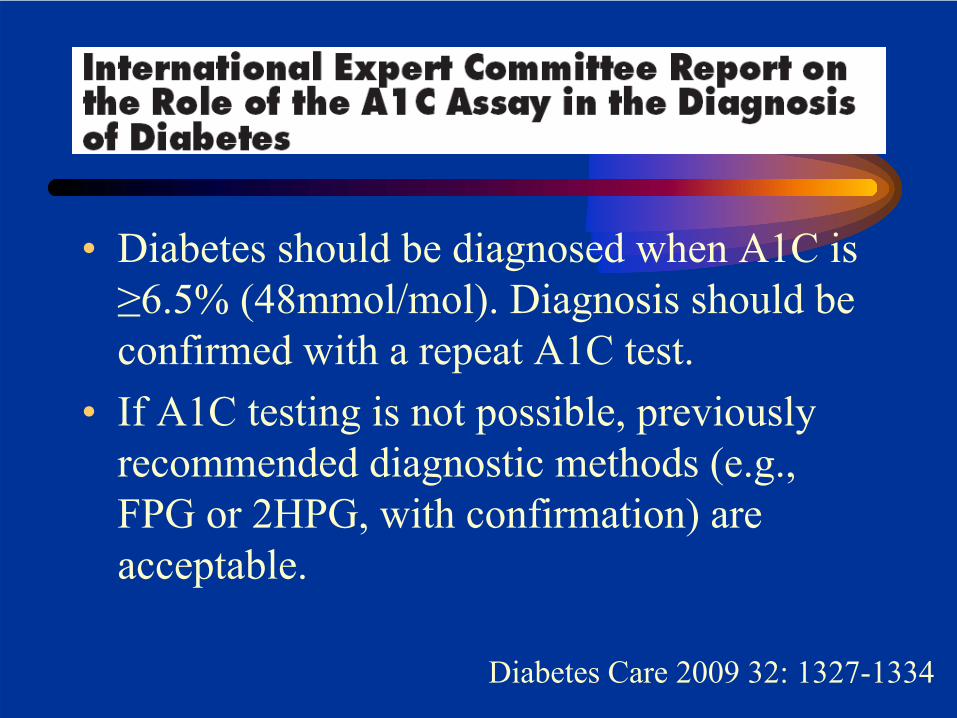
• Diabetes should be diagnosed when A1C is ≥6.5% (48mmol/mol). Diagnosis should be confirmed with a repeat A1C test.
• If A1C testing is not possible, previously recommended diagnostic methods (e.g., FPG or 2HPG, with confirmation) are acceptable.
Diabetes Care 2009 32: 1327-1334
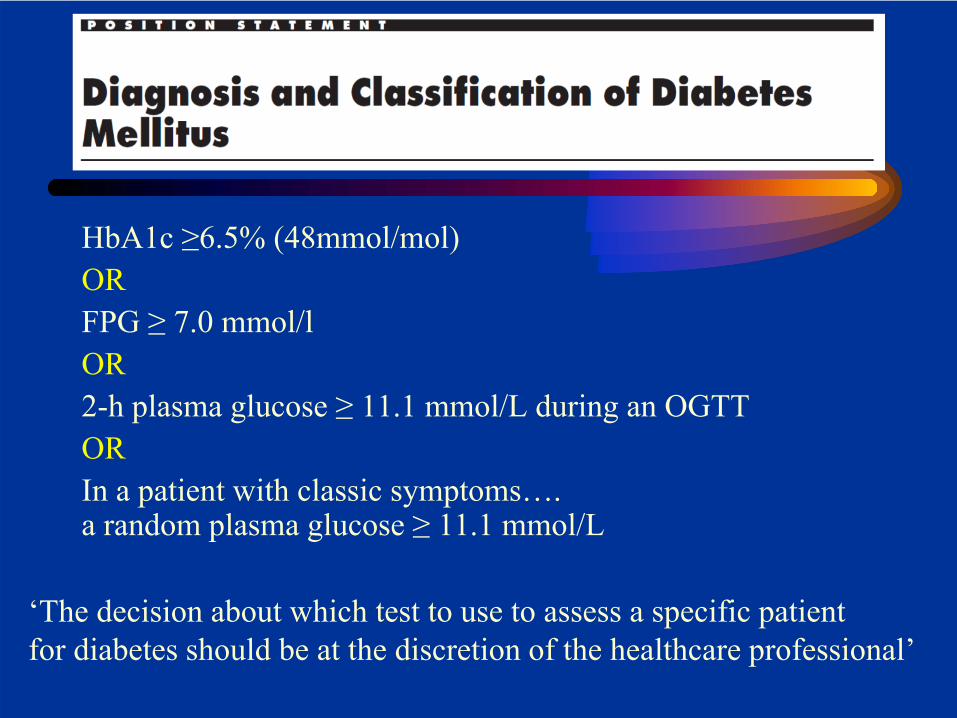
HbA1c ≥6.5% (48mmol/mol) ORFPG ≥ 7.0 mmol/lOR2-h plasma glucose ≥ 11.1 mmol/L during an OGTTORIn a patient with classic symptoms….a random plasma glucose ≥ 11.1 mmol/L
‘The decision about which test to use to assess a specific patientfor diabetes should be at the discretion of the healthcare professional’
Advantages in using HbA1c
• Assesses glycaemia over previous weeks/months
• Lower biological variability than FPG or 2hr
• Already used to guide management• IFCC standardisation should help with
harmonising results between labs
Advantages in using HbA1c
• Does not require a fasting sample• Does not require a fasting sample• Does not require a fasting sample• Does not require a fasting sample• Does not require a fasting sample• Does not require a fasting sample
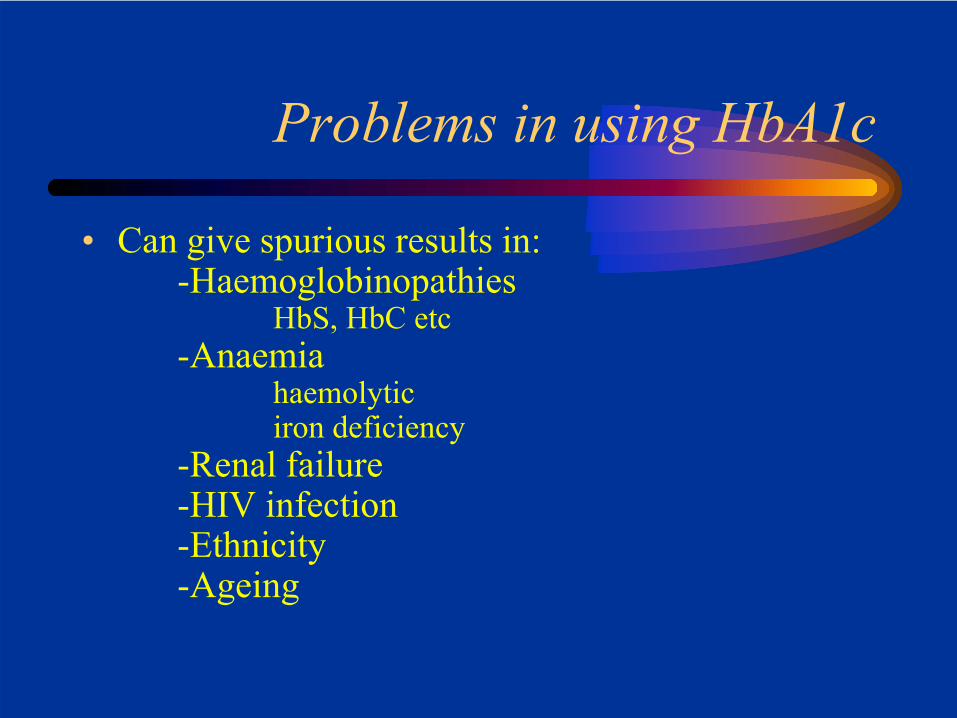
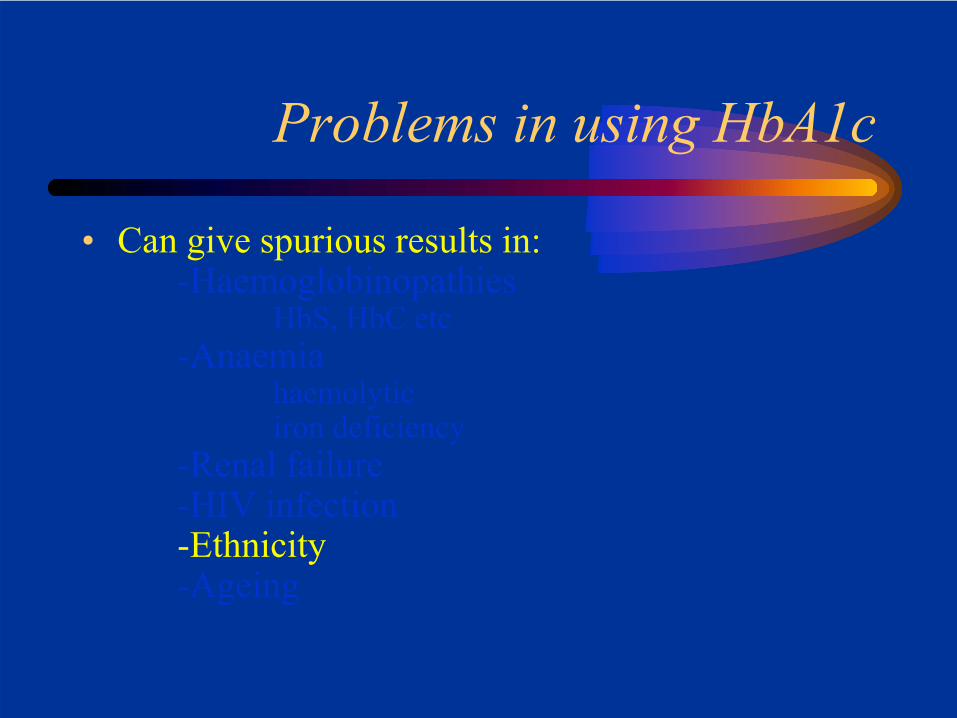
Problems in using HbA1c
• Can give spurious results in:-Haemoglobinopathies
HbS, HbC etc-Anaemia
haemolyticiron deficiency
-Renal failure-HIV infection-Ethnicity-Ageing
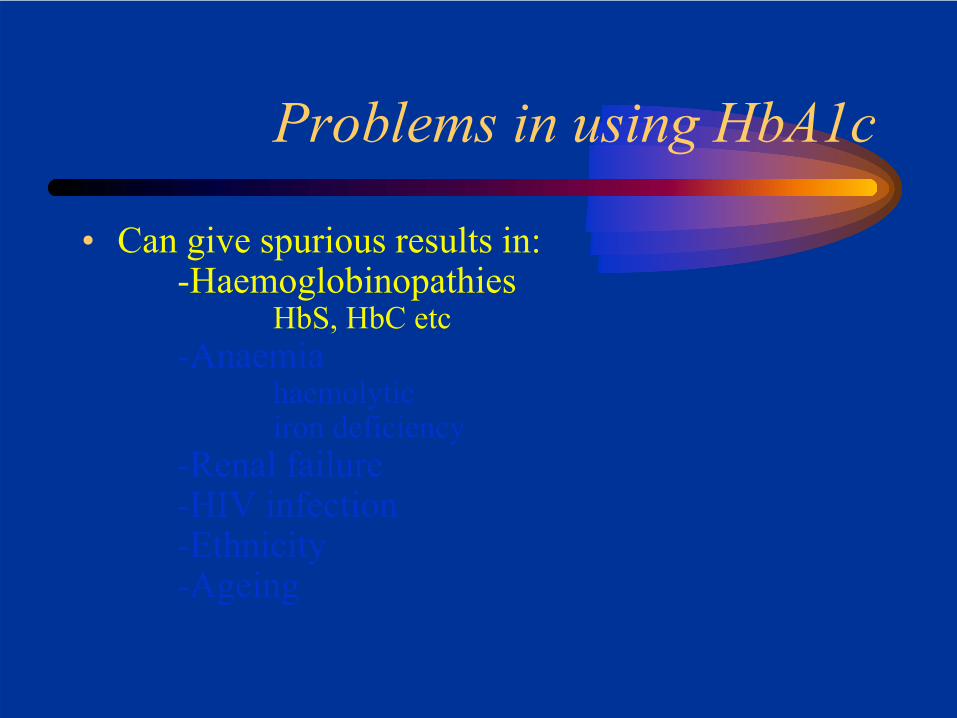
Problems in using HbA1c
• Can give spurious results in:-Haemoglobinopathies
HbS, HbC etc-Anaemia
haemolyticiron deficiency
-Renal failure-HIV infection-Ethnicity-Ageing
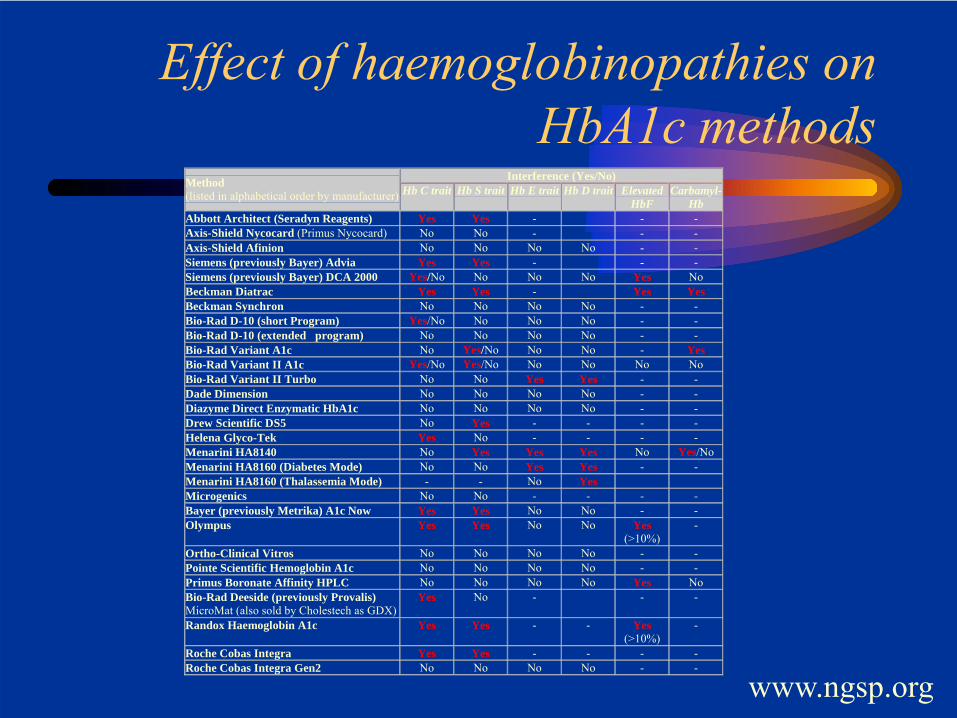
Effect of haemoglobinopathies on HbA1c methods
Interference (Yes/No) Method (listed in alphabetical order by manufacturer) Hb C trait Hb S trait Hb E trait Hb D trait Elevated
HbF Carbamyl-
Hb Abbott Architect (Seradyn Reagents) Yes Yes - - - Axis-Shield Nycocard (Primus Nycocard) No No - - - Axis-Shield Afinion No No No No - - Siemens (previously Bayer) Advia Yes Yes - - - Siemens (previously Bayer) DCA 2000 Yes/No No No No Yes No Beckman Diatrac Yes Yes - Yes Yes Beckman Synchron No No No No - - Bio-Rad D-10 (short Program) Yes/No No No No - - Bio-Rad D-10 (extended program) No No No No - - Bio-Rad Variant A1c No Yes/No No No - Yes Bio-Rad Variant II A1c Yes/No Yes/No No No No No Bio-Rad Variant II Turbo No No Yes Yes - - Dade Dimension No No No No - - Diazyme Direct Enzymatic HbA1c No No No No - - Drew Scientific DS5 No Yes - - - - Helena Glyco-Tek Yes No - - - - Menarini HA8140 No Yes Yes Yes No Yes/No Menarini HA8160 (Diabetes Mode) No No Yes Yes - - Menarini HA8160 (Thalassemia Mode) - - No Yes Microgenics No No - - - - Bayer (previously Metrika) A1c Now Yes Yes No No - - Olympus Yes Yes No No Yes
(>10%) -
Ortho-Clinical Vitros No No No No - - Pointe Scientific Hemoglobin A1c No No No No - - Primus Boronate Affinity HPLC No No No No Yes No Bio-Rad Deeside (previously Provalis) MicroMat (also sold by Cholestech as GDX)
Yes No - - -
Randox Haemoglobin A1c Yes Yes - - Yes (>10%)
-
Roche Cobas Integra Yes Yes - - - - Roche Cobas Integra Gen2 No No No No - -
www.ngsp.org
For People of African, Mediterranean, or Southeast Asian Heritage:
Important Information about Diabetes Blood Tests
When to Suspect that a Patient with Diabetes Has a Hemoglobinopathy
http://diabetes.niddk.nih.gov/dm/pubs/hemovari-A1C/index.htm
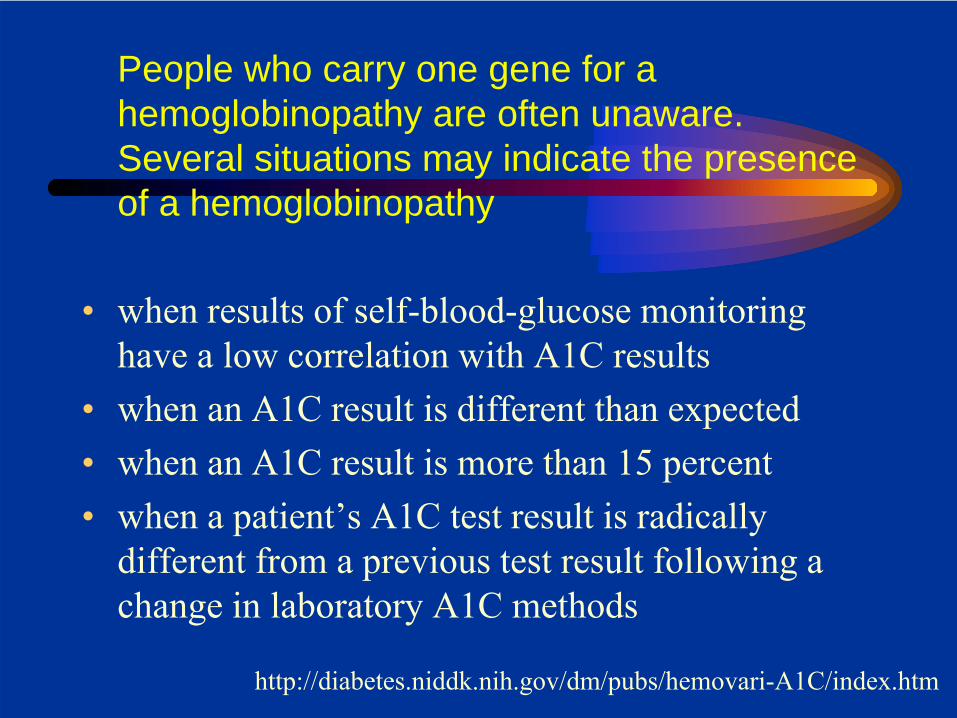
People who carry one gene for a hemoglobinopathy are often unaware. Several situations may indicate the presence of a hemoglobinopathy
• when results of self-blood-glucose monitoring have a low correlation with A1C results
• when an A1C result is different than expected • when an A1C result is more than 15 percent • when a patient’s A1C test result is radically
different from a previous test result following a change in laboratory A1C methods
http://diabetes.niddk.nih.gov/dm/pubs/hemovari-A1C/index.htm
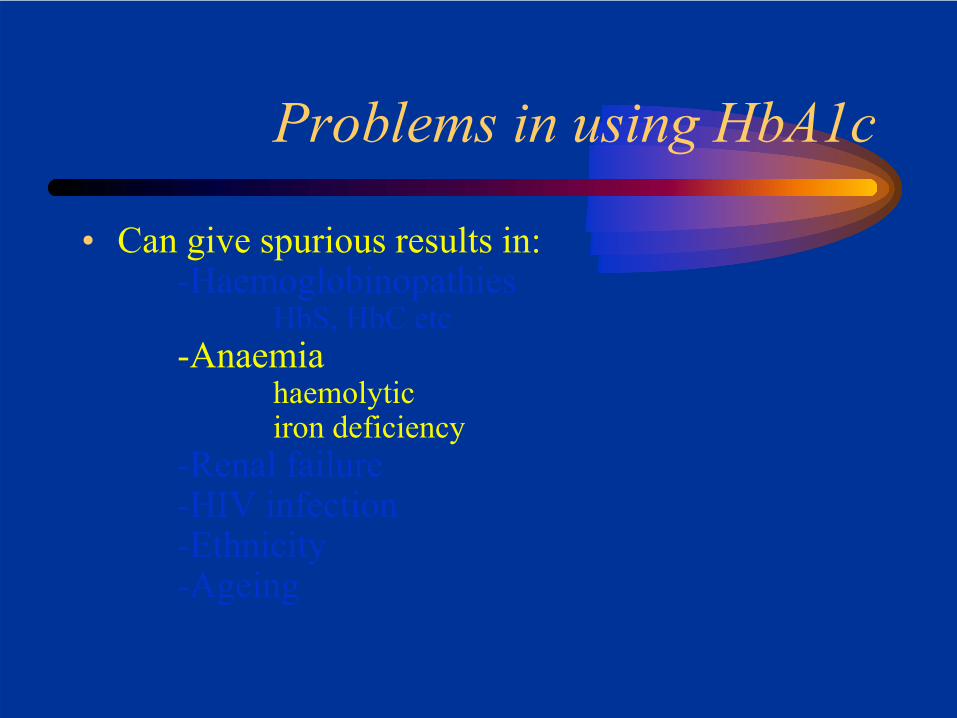
Problems in using HbA1c
• Can give spurious results in:-Haemoglobinopathies
HbS, HbC etc-Anaemia
haemolyticiron deficiency
-Renal failure-HIV infection-Ethnicity-Ageing
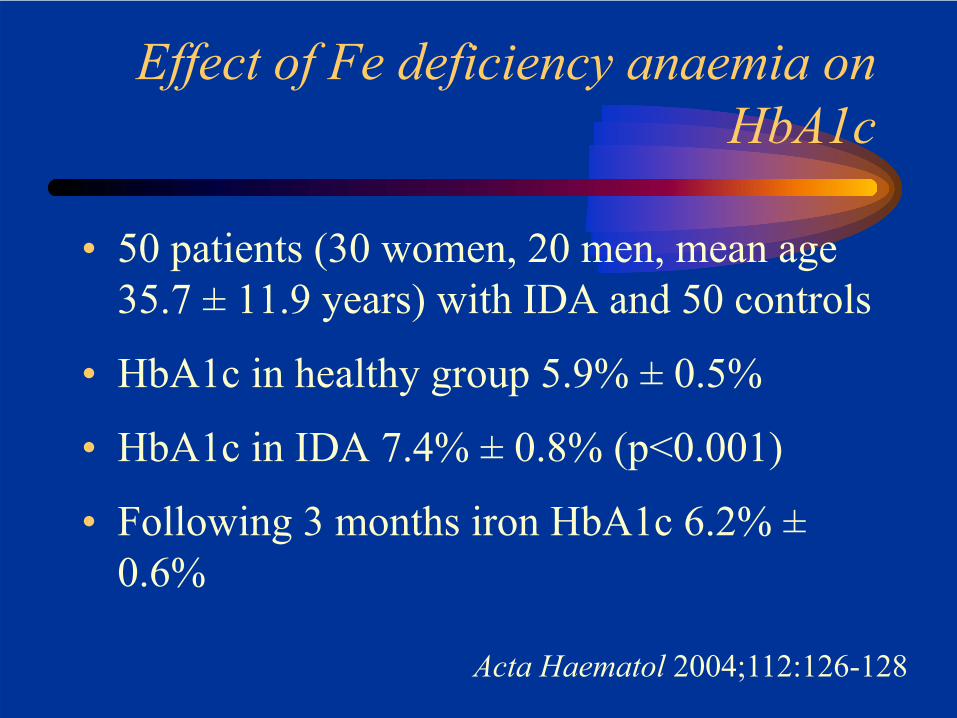
Effect of Fe deficiency anaemia on HbA1c
• 50 patients (30 women, 20 men, mean age 35.7 ± 11.9 years) with IDA and 50 controls
• HbA1c in healthy group 5.9% ± 0.5%
• HbA1c in IDA 7.4% ± 0.8% (p<0.001)
• Following 3 months iron HbA1c 6.2% ±0.6%
Acta Haematol 2004;112:126-128
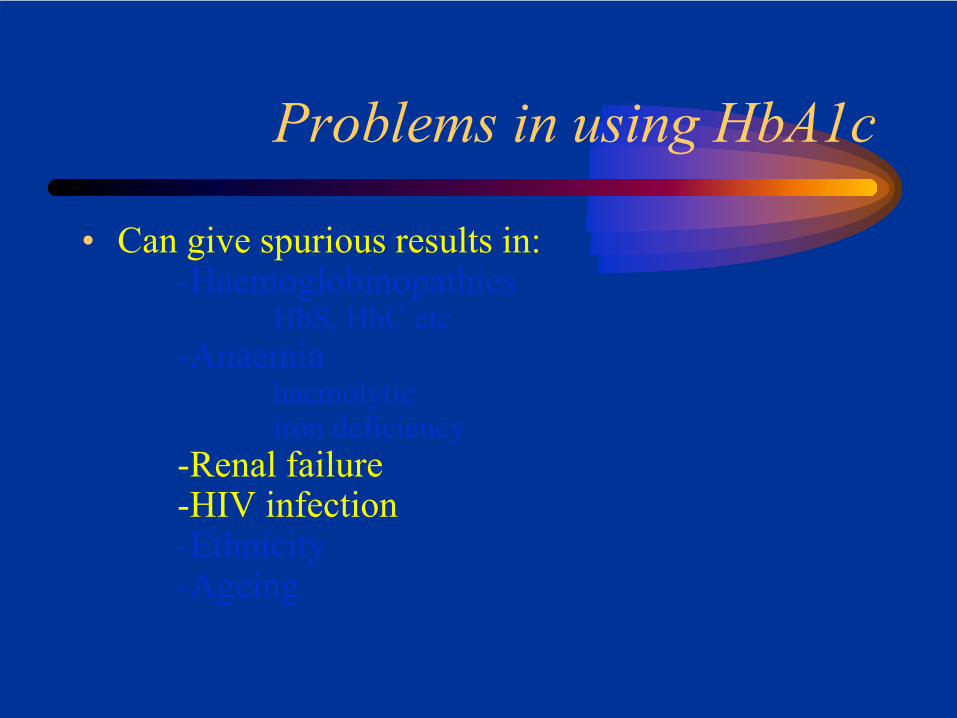
Problems in using HbA1c
• Can give spurious results in:-Haemoglobinopathies
HbS, HbC etc-Anaemia
haemolyticiron deficiency
-Renal failure-HIV infection-Ethnicity-Ageing
Problems in using HbA1c
• Can give spurious results in:-Haemoglobinopathies
HbS, HbC etc-Anaemia
haemolyticiron deficiency
-Renal failure-HIV infection-Ethnicity-Ageing
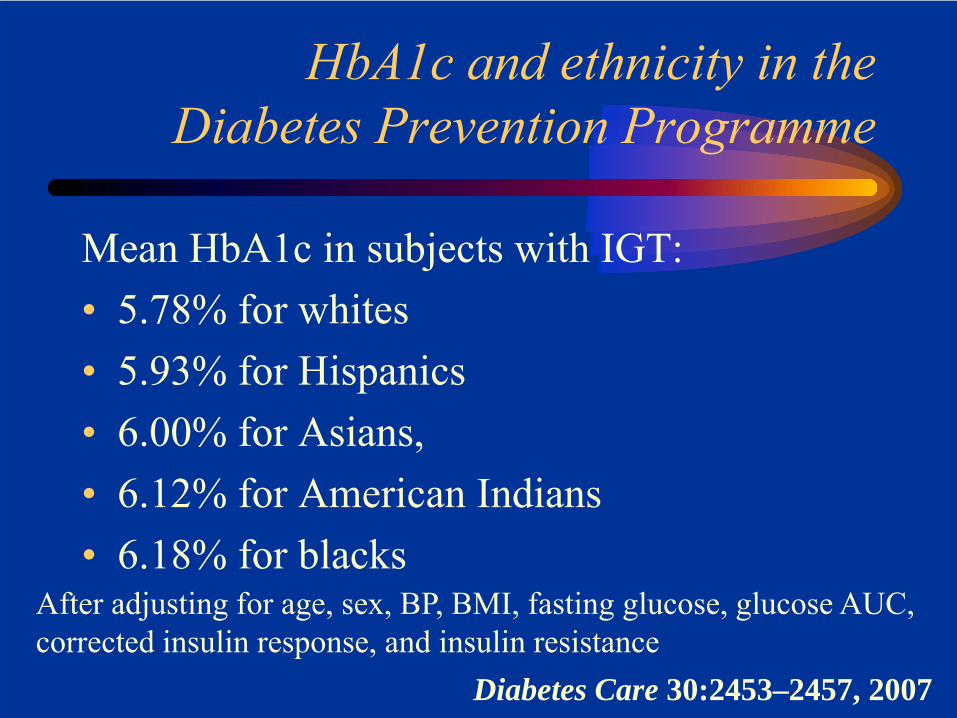
HbA1c and ethnicity in theDiabetes Prevention Programme
Mean HbA1c in subjects with IGT:• 5.78% for whites• 5.93% for Hispanics• 6.00% for Asians,• 6.12% for American Indians• 6.18% for blacks
After adjusting for age, sex, BP, BMI, fasting glucose, glucose AUC,corrected insulin response, and insulin resistance
Diabetes Care 30:2453–2457, 2007
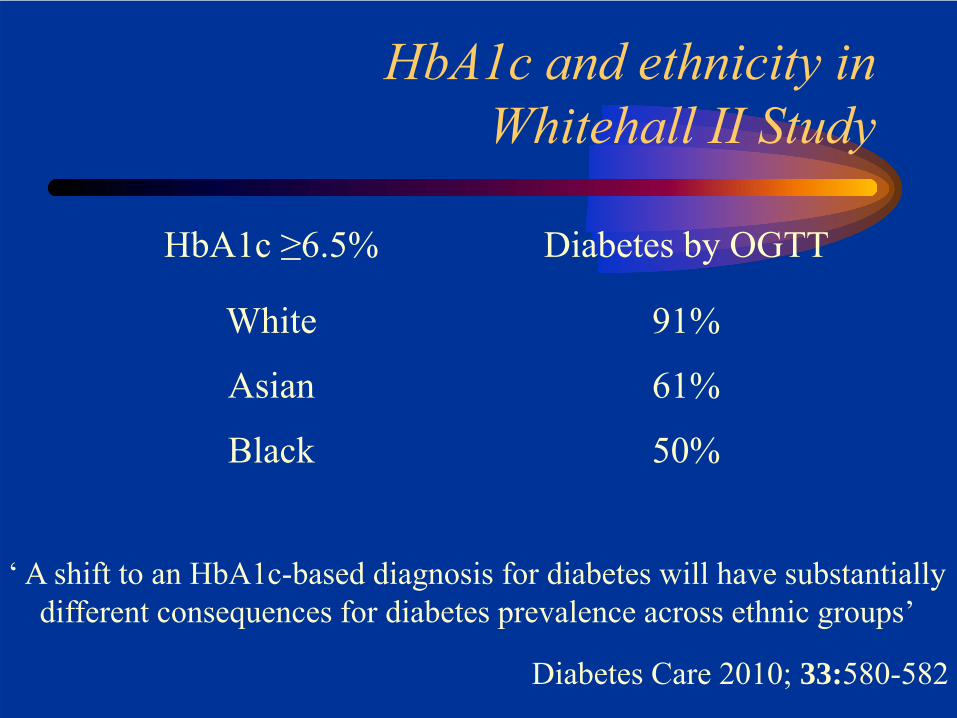
HbA1c and ethnicity inWhitehall II Study
HbA1c ≥6.5%
White
Asian
Black
Diabetes by OGTT
91%
61%
50%
Diabetes Care 2010; 33:580-582
‘ A shift to an HbA1c-based diagnosis for diabetes will have substantiallydifferent consequences for diabetes prevalence across ethnic groups’
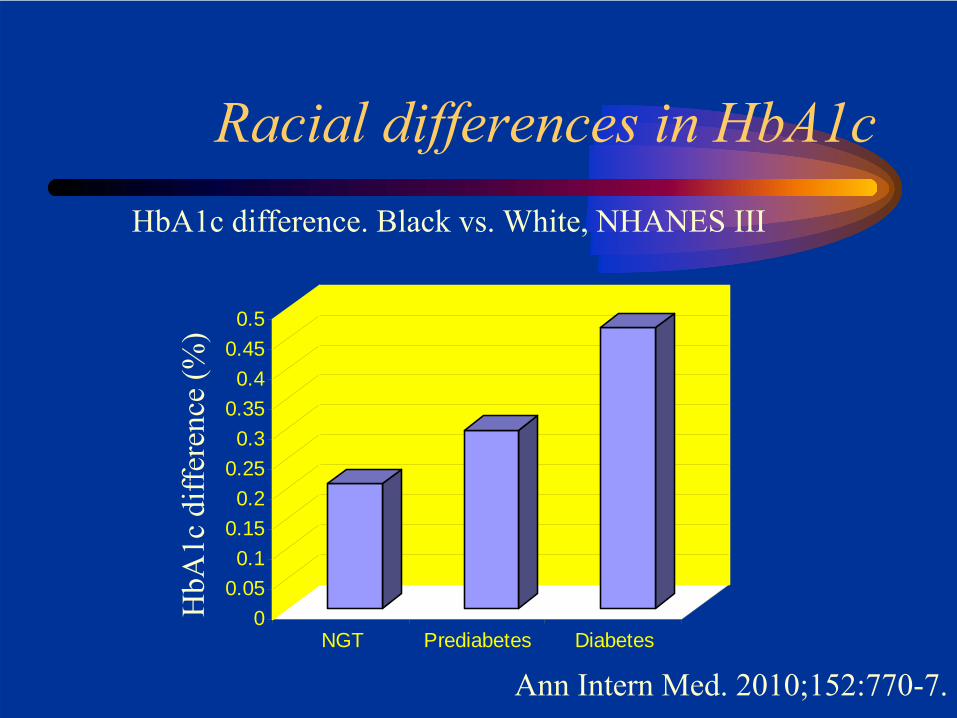
Racial differences in HbA1c
00.050.1
0.150.2
0.250.3
0.350.4
0.450.5
NGT Prediabetes Diabetes
HbA
1c d
iffer
ence
(%)
HbA1c difference. Black vs. White, NHANES III
Ann Intern Med. 2010;152:770-7.

Problems in using HbA1c
• Can give spurious results in:-Haemoglobinopathies
HbS, HbC etc-Anaemia
haemolyticiron deficiency
-Renal failure-HIV infection-Ethnicity-Ageing
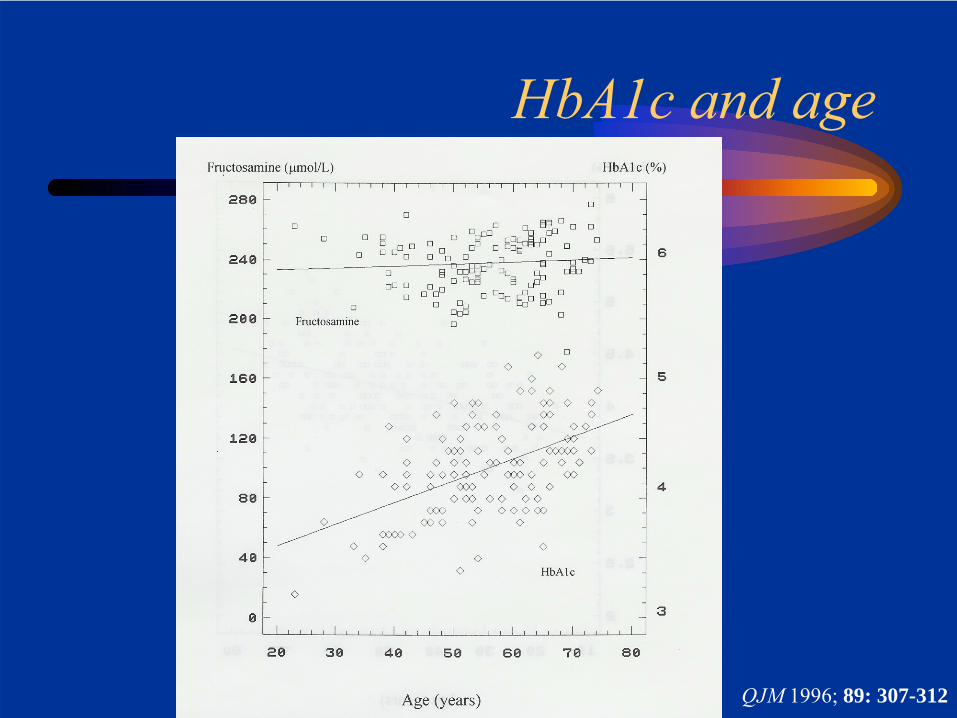
HbA1c and age
QJM 1996; 89: 307-312
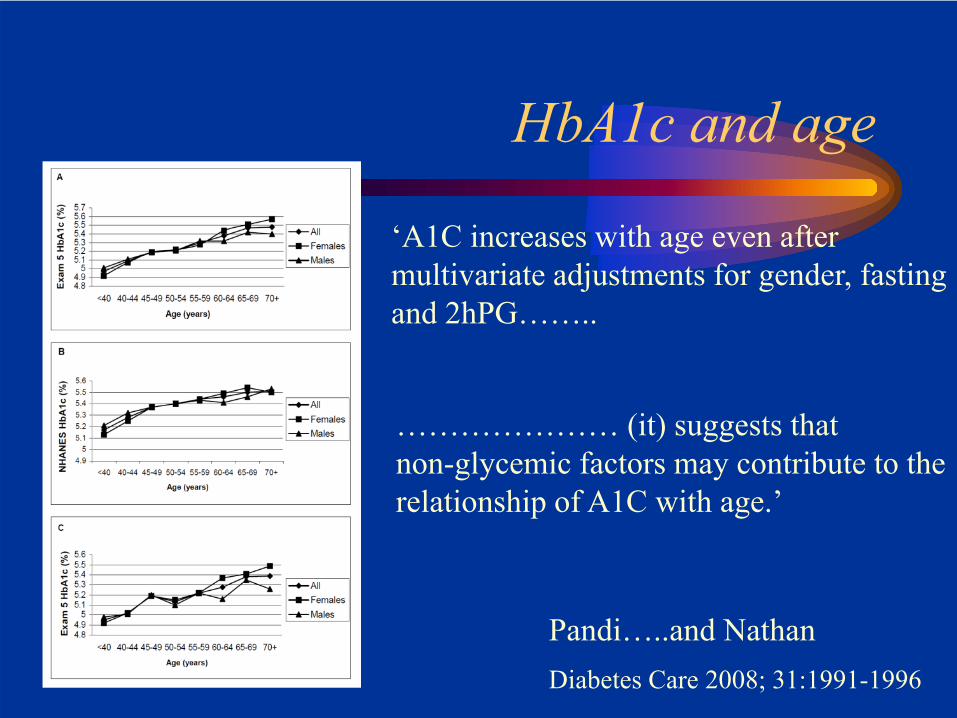
HbA1c and age
‘A1C increases with age even aftermultivariate adjustments for gender, fastingand 2hPG……..
Diabetes Care 2008; 31:1991-1996
………………… (it) suggests thatnon-glycemic factors may contribute to therelationship of A1C with age.’
Pandi…..and Nathan
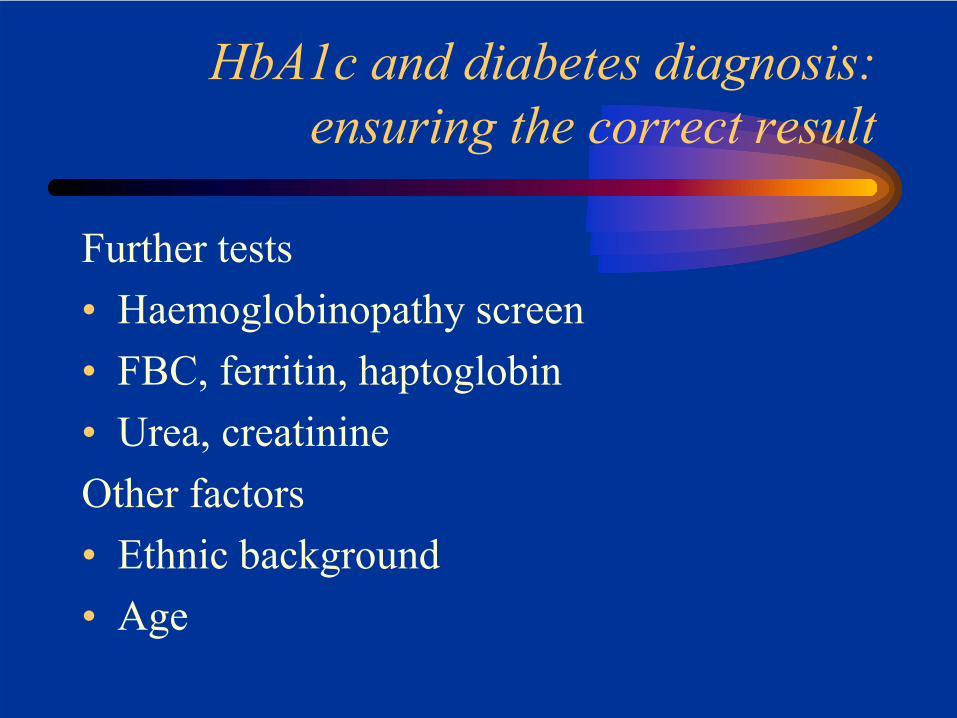
HbA1c and diabetes diagnosis: ensuring the correct result
Further tests• Haemoglobinopathy screen• FBC, ferritin, haptoglobin• Urea, creatinineOther factors• Ethnic background• Age
Glucose and diabetes diagnosis: ensuring the correct result
• Make sure the patient is fasting
The proposed cut-off for diagnosis
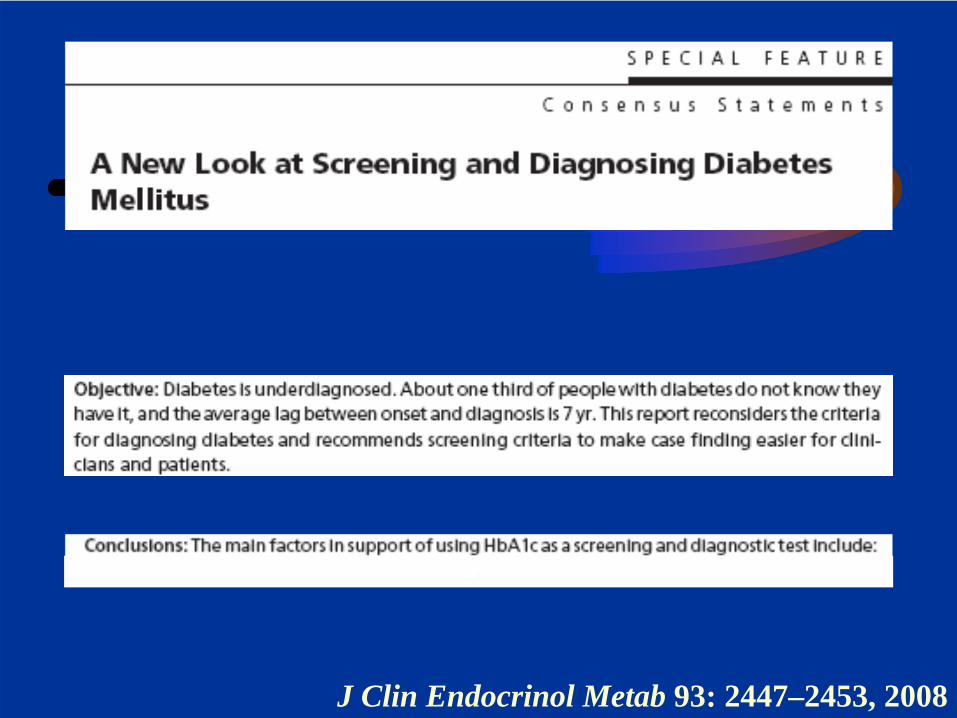
J Clin Endocrinol Metab 93: 2447–2453, 2008

• Diabetes should be diagnosed when A1C is ≥6.5% (48mmol/mol). Diagnosis should be confirmed with a repeat A1C test.
• If A1C testing is not possible, previously recommended diagnostic methods (e.g., FPG or 2HPG, with confirmation) are acceptable.
Diabetes Care 2009 32: 1327-1334
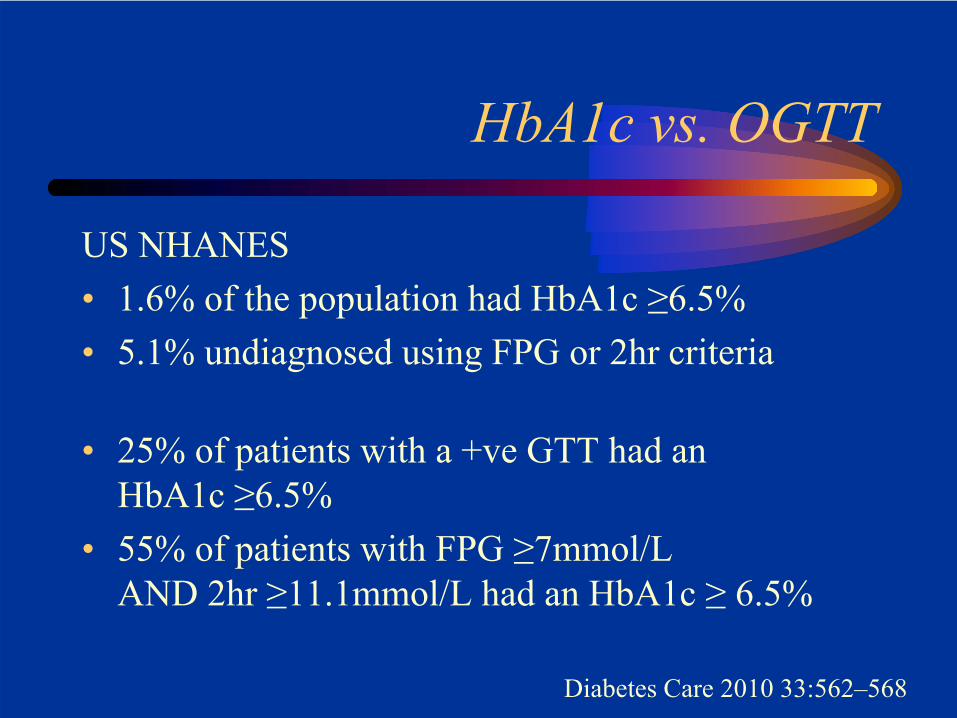
HbA1c vs. OGTT
US NHANES• 1.6% of the population had HbA1c ≥6.5%• 5.1% undiagnosed using FPG or 2hr criteria
• 25% of patients with a +ve GTT had anHbA1c ≥6.5%
• 55% of patients with FPG ≥7mmol/LAND 2hr ≥11.1mmol/L had an HbA1c ≥ 6.5%
Diabetes Care 2010 33:562–568
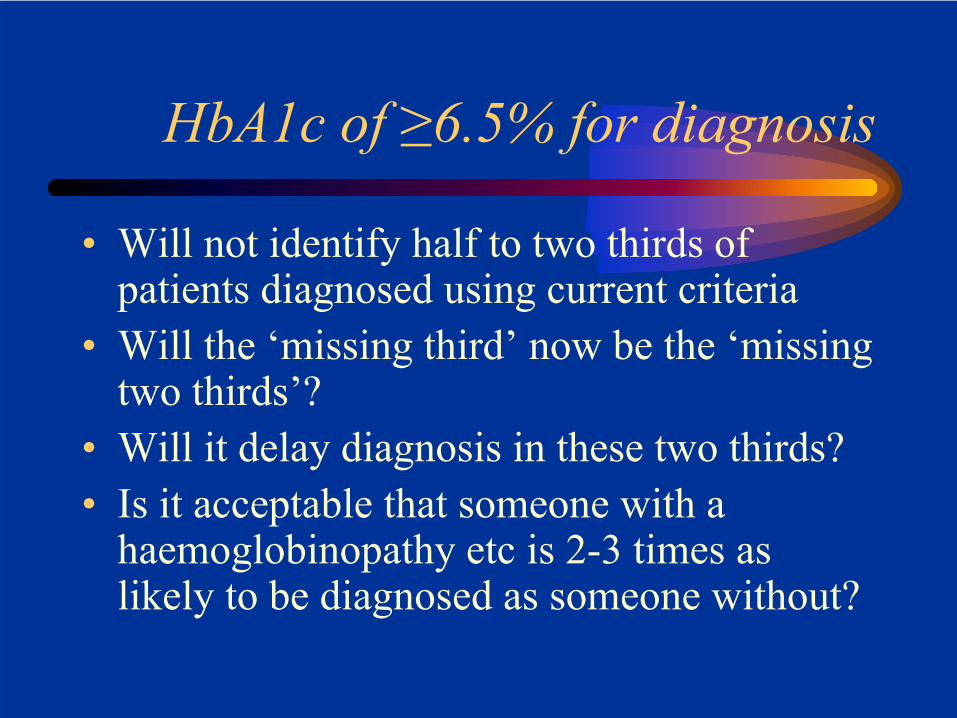
HbA1c of ≥6.5% for diagnosis
• Will not identify half to two thirds of patients diagnosed using current criteria
• Will the ‘missing third’ now be the ‘missing two thirds’?
• Will it delay diagnosis in these two thirds?• Is it acceptable that someone with a
haemoglobinopathy etc is 2-3 times as likely to be diagnosed as someone without?
What about type 1 diabetes?
Could HbA1c criteria lead to a (critical) delay in diagnosis?
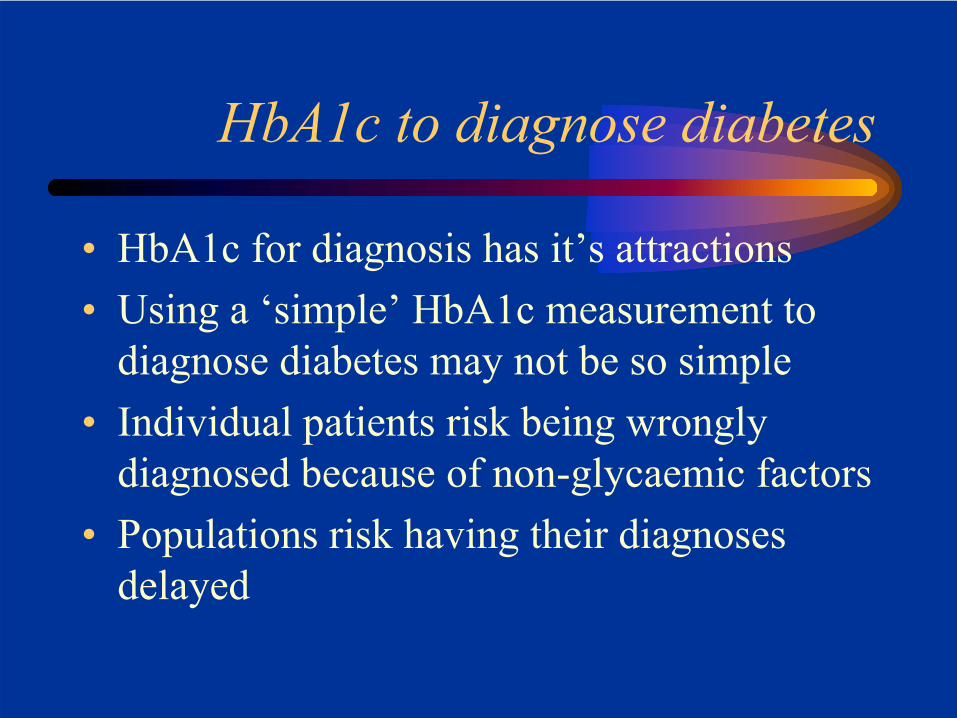
HbA1c to diagnose diabetes
• HbA1c for diagnosis has it’s attractions• Using a ‘simple’ HbA1c measurement to
diagnose diabetes may not be so simple• Individual patients risk being wrongly
diagnosed because of non-glycaemic factors• Populations risk having their diagnoses
delayed
But Doctor, WHO
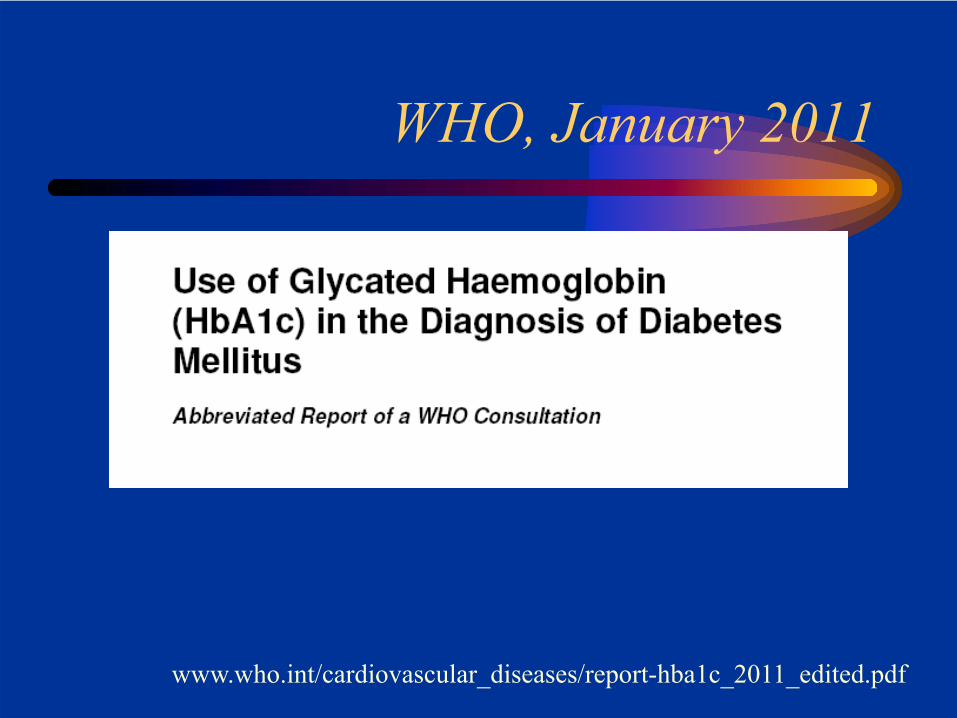
WHO, January 2011
www.who.int/cardiovascular_diseases/report-hba1c_2011_edited.pdf
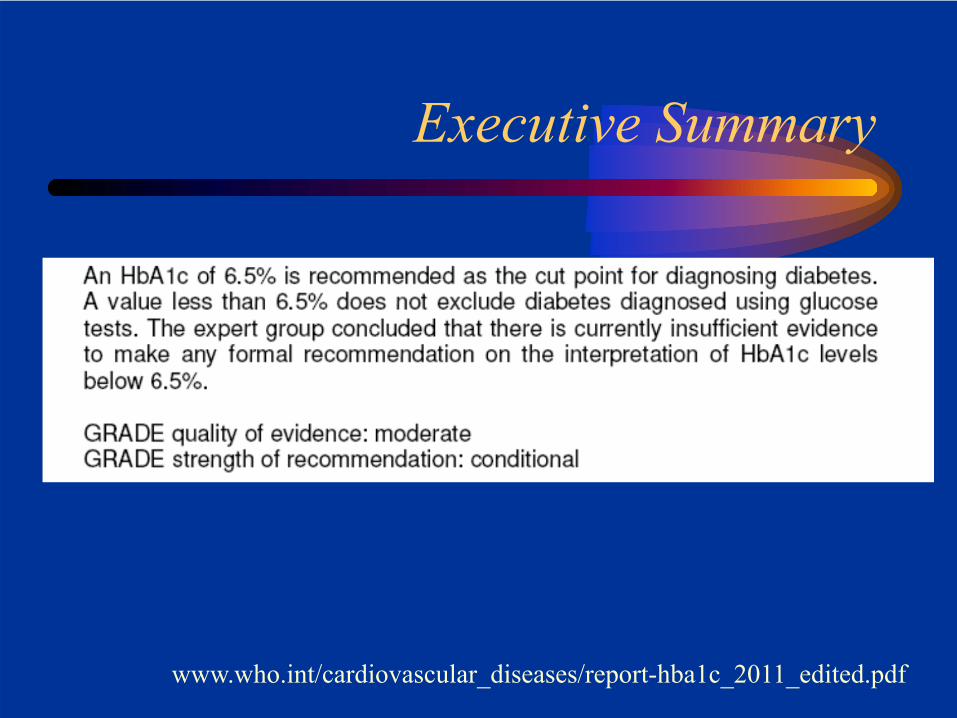
Executive Summary
www.who.int/cardiovascular_diseases/report-hba1c_2011_edited.pdf
What’s going on with HbA1c?
• HbA1c: a brief history
• How should we report HbA1c?
• Using HbA1c to diagnose diabetes
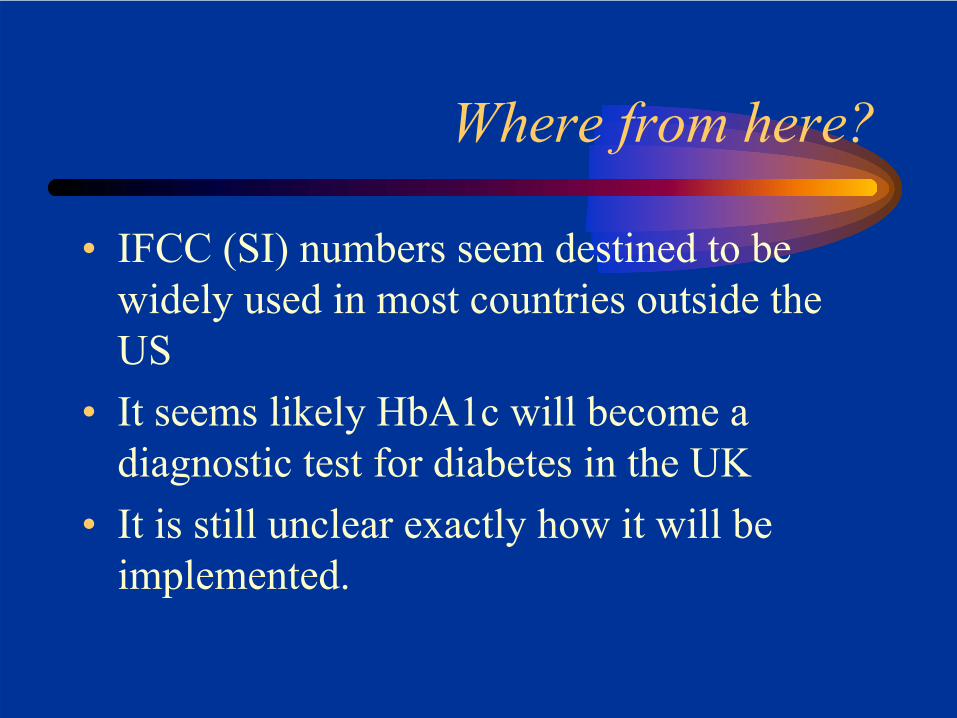
Where from here?
• IFCC (SI) numbers seem destined to be widely used in most countries outside the US
• It seems likely HbA1c will become a diagnostic test for diabetes in the UK
• It is still unclear exactly how it will be implemented.