Embed Size (px)
Citation preview
1
HCI Lecture 7:
Formal models II: STNs
Hiroshi Shimodaira
Key points: – Motivation – State transition networks – Rules for drawing – State charts – Automated usability checks - Limitations
2
Motivation
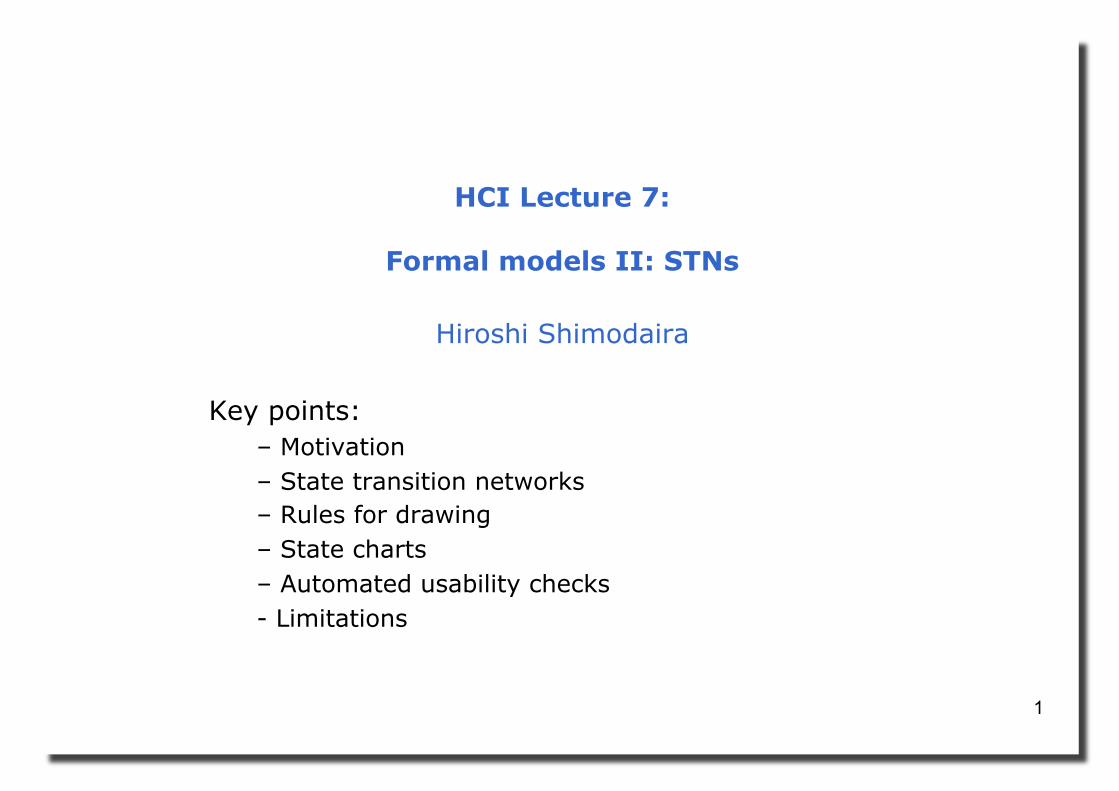
Task analysis methods (such as GOMS) tend to focus on the user’s actions as a sequence of steps to achieve a goal
We defined ‘goal’ as a desired state of the application system: user actions change the system state
We could describe all the possible states and interactions in the form of a State Transition Network (STN). (cf. grammars, event algebras)
Action State
Interface
Input
Output
3
Example
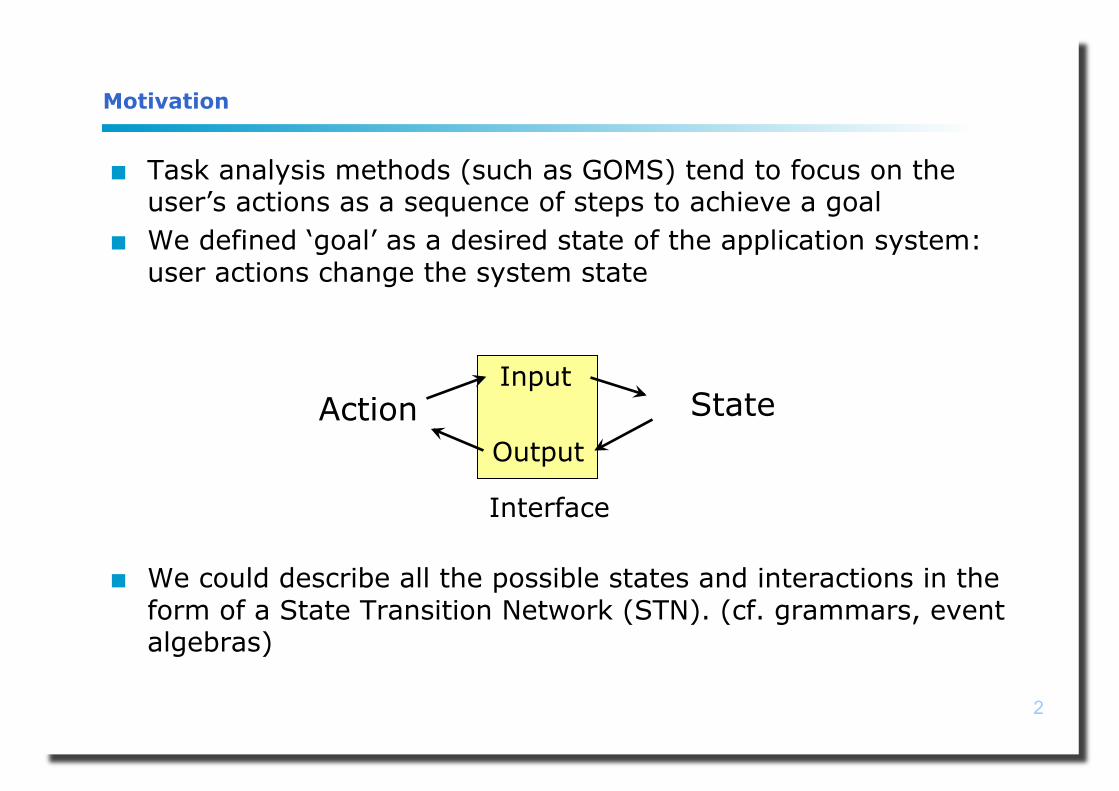
State transition networks – Nodes/circles represent states of the device – Edges/arcs represent inputs or actions
– Example
4
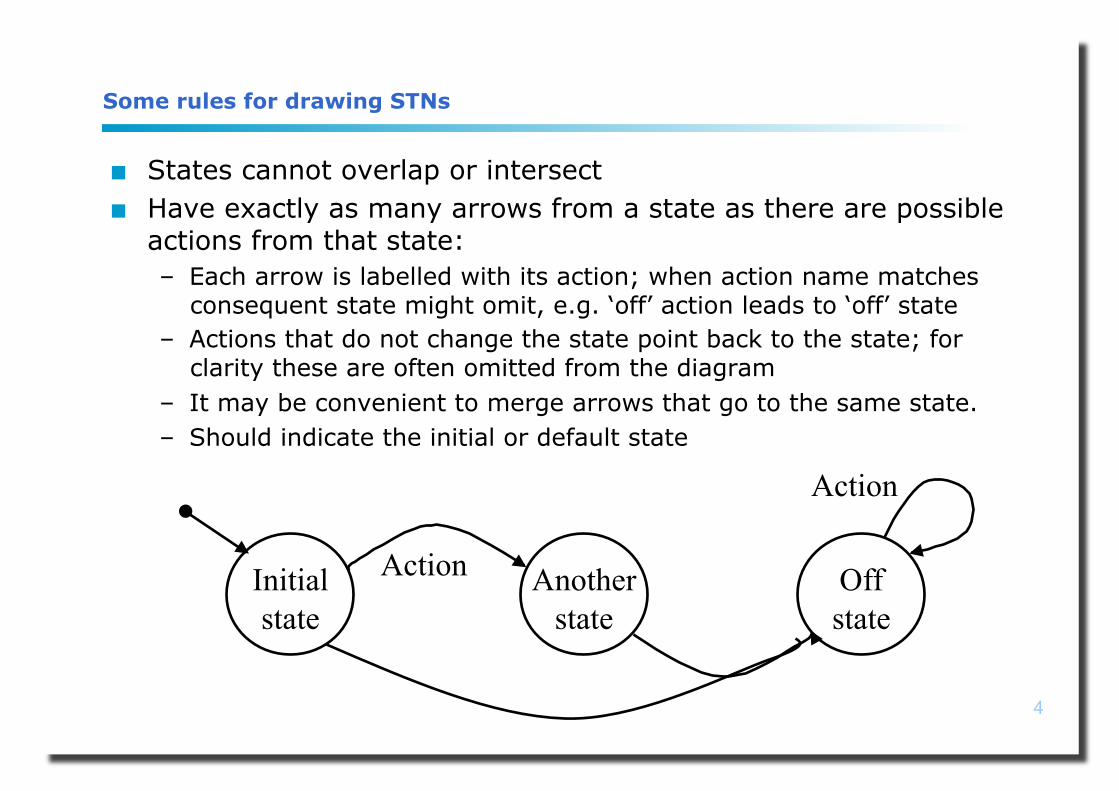
Some rules for drawing STNs
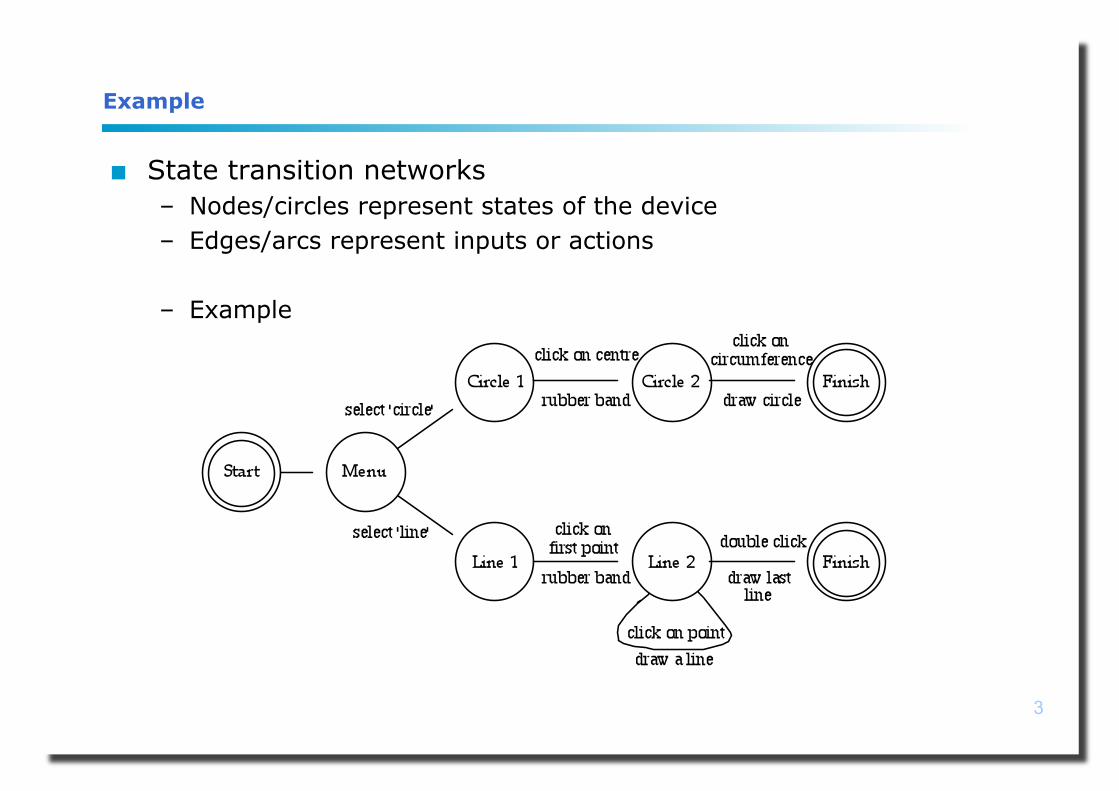
States cannot overlap or intersect Have exactly as many arrows from a state as there are possible
actions from that state: – Each arrow is labelled with its action; when action name matches
consequent state might omit, e.g. ‘off’ action leads to ‘off’ state – Actions that do not change the state point back to the state; for
clarity these are often omitted from the diagram – It may be convenient to merge arrows that go to the same state. – Should indicate the initial or default state
Initial state
Another state
Off state
Action
Action
5
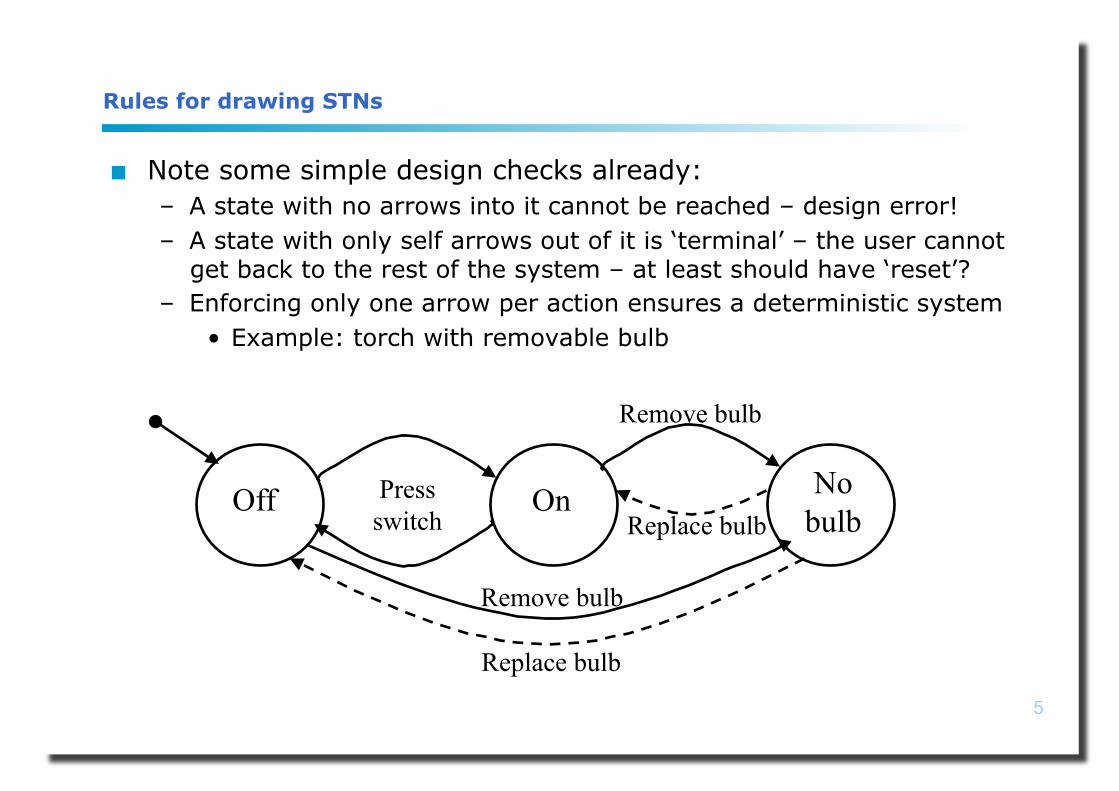
Rules for drawing STNs
Note some simple design checks already: – A state with no arrows into it cannot be reached – design error! – A state with only self arrows out of it is ‘terminal’ – the user cannot
get back to the rest of the system – at least should have ‘reset’? – Enforcing only one arrow per action ensures a deterministic system
• Example: torch with removable bulb
Off On No bulb
Press switch
Remove bulb
Remove bulb
Replace bulb
Replace bulb
6
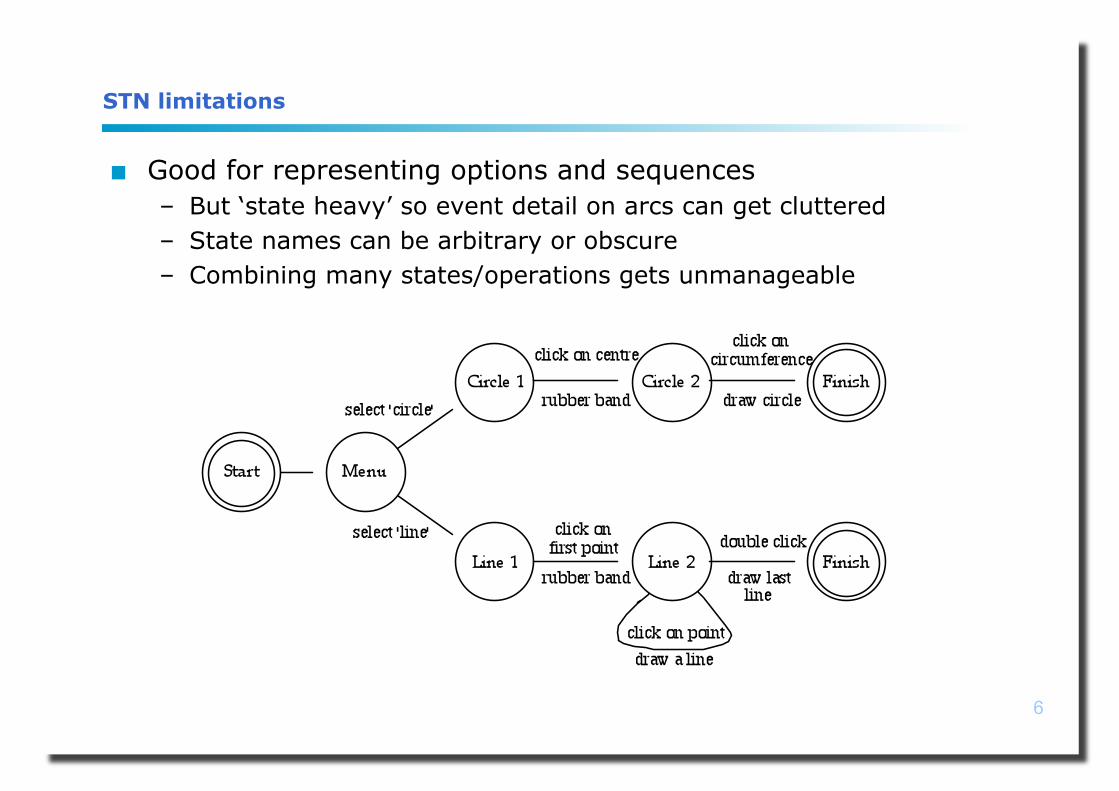
STN limitations
Good for representing options and sequences – But ‘state heavy’ so event detail on arcs can get cluttered – State names can be arbitrary or obscure – Combining many states/operations gets unmanageable
7
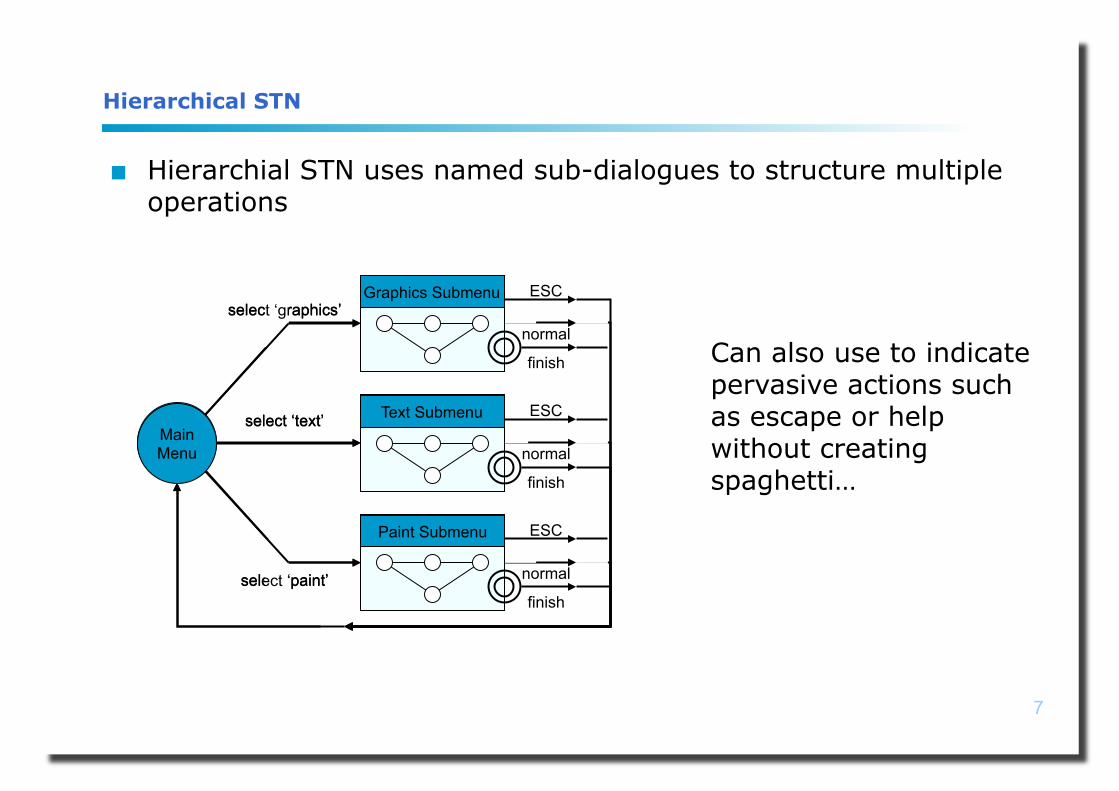
Hierarchical STN
Hierarchial STN uses named sub-dialogues to structure multiple operations
Graphics Submenu
Text Submenu
Paint Submenu
Main Menu
select ‘graphics’
select ‘paint’
select ‘text’
Can also use to indicate pervasive actions such as escape or help without creating spaghetti…
Graphics Submenu
Text Submenu
Paint Submenu
Main Menu
select ‘graphics’
select ‘paint’
select ‘text’
normal
finish
ESC
normal
finish
ESC
normal
finish
ESC
8
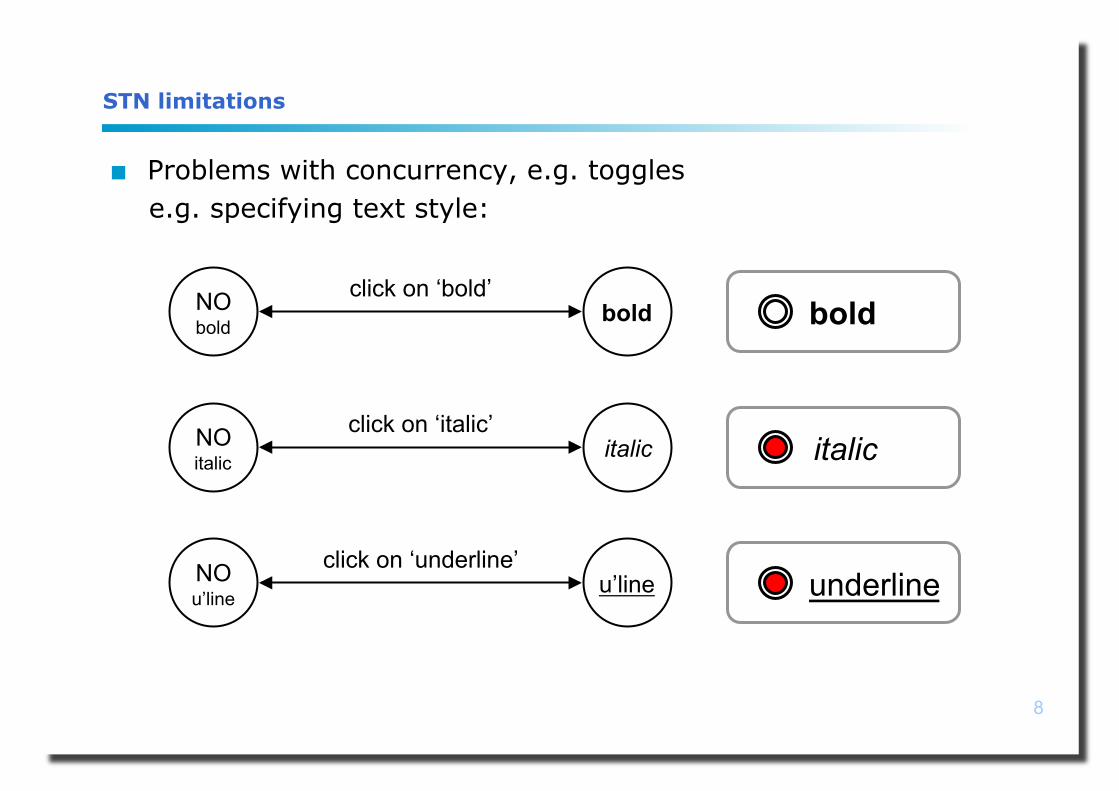
STN limitations
Problems with concurrency, e.g. toggles e.g. specifying text style:
bold
italic
underline
NO bold bold
click on ‘bold’
NO italic italic
click on ‘italic’
NO u’line u’line
click on ‘underline’
9
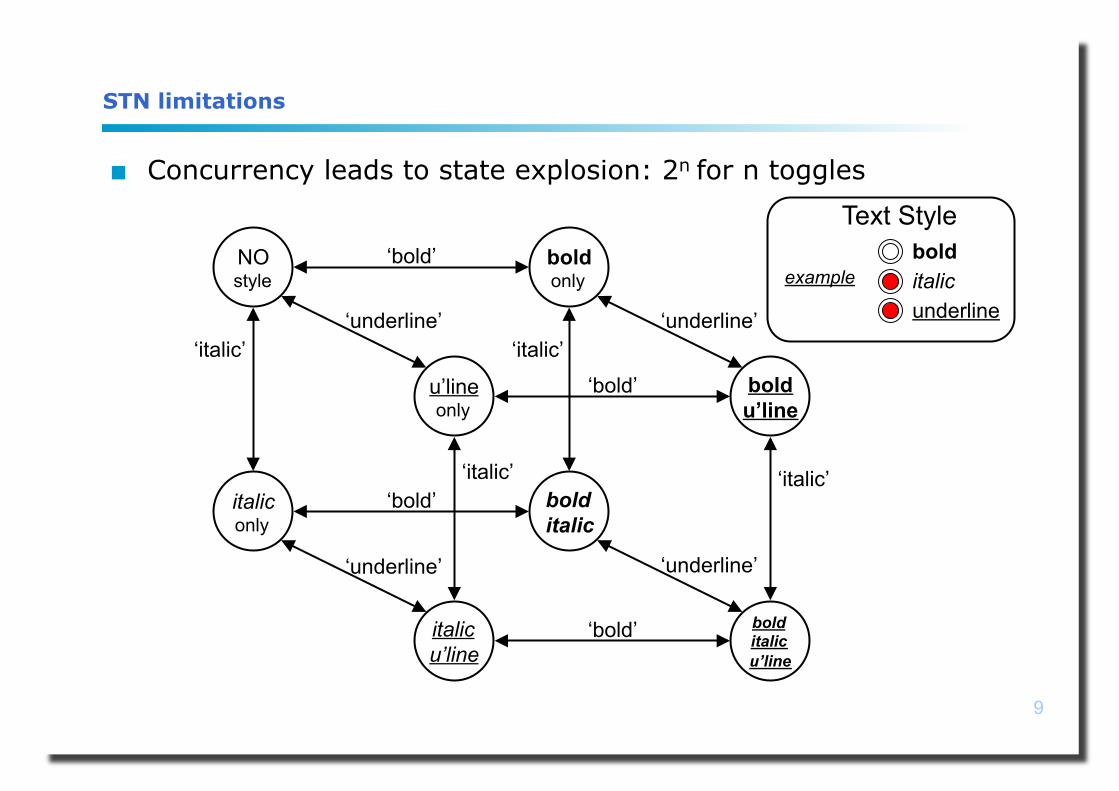
STN limitations
Concurrency leads to state explosion: 2n for n toggles
‘italic’
NO style
bold only
‘bold’
italic only
bold italic
‘bold’
‘italic’
u’line only
bold u’line
‘bold’
italic u’line
bold italic u’line
‘bold’
‘italic’ ‘italic’
‘underline’ ‘underline’
‘underline’ ‘underline’
Text Style bold italic underline
example
10
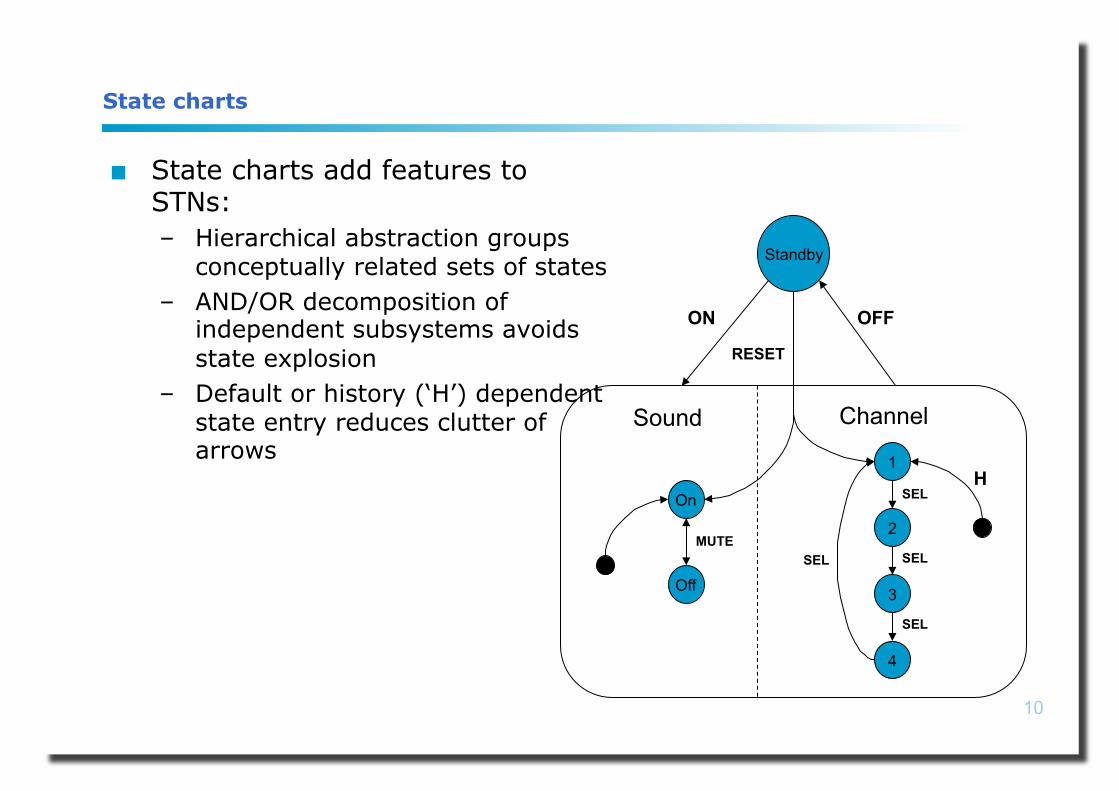
State charts
State charts add features to STNs: – Hierarchical abstraction groups
conceptually related sets of states – AND/OR decomposition of
independent subsystems avoids state explosion
– Default or history (‘H’) dependent state entry reduces clutter of arrows
On
Off
1
2
3
4
Sound Channel
H SEL
SEL
SEL
SEL MUTE
Standby
OFF ON
RESET
11
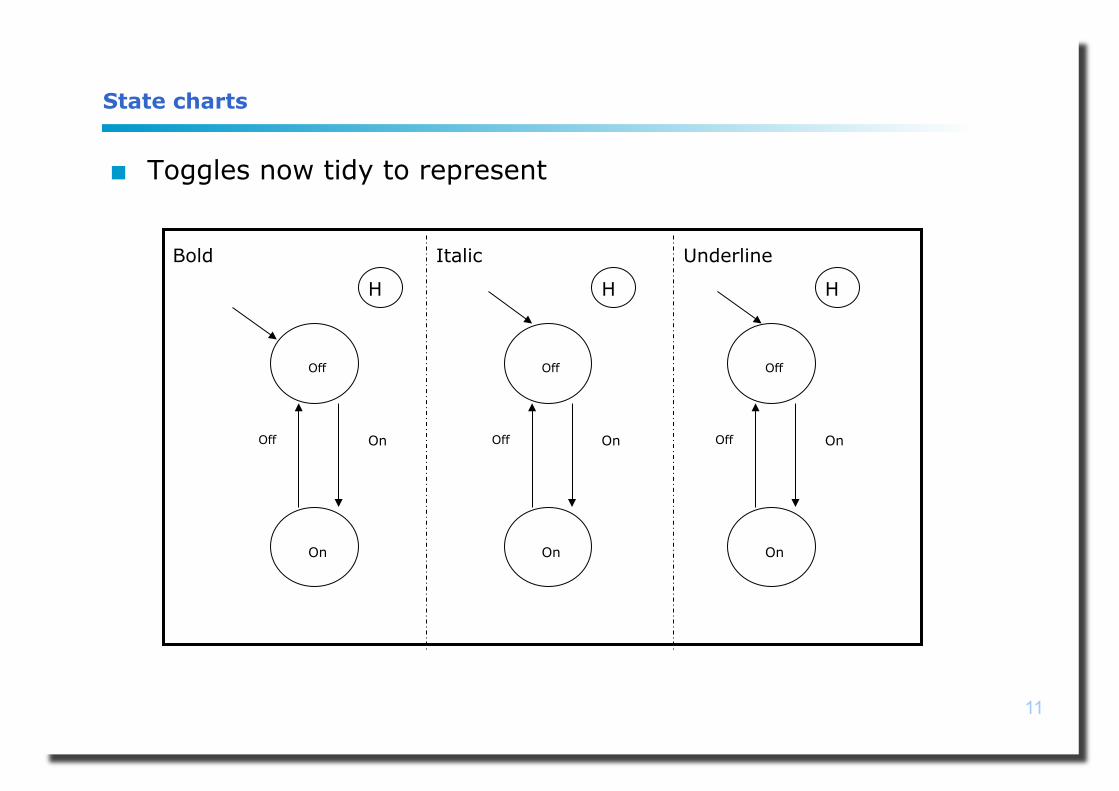
State charts
Toggles now tidy to represent
Bold Underline Italic
H
On Off
Off
On
H
On Off
Off
On
H
On Off
Off
On
12
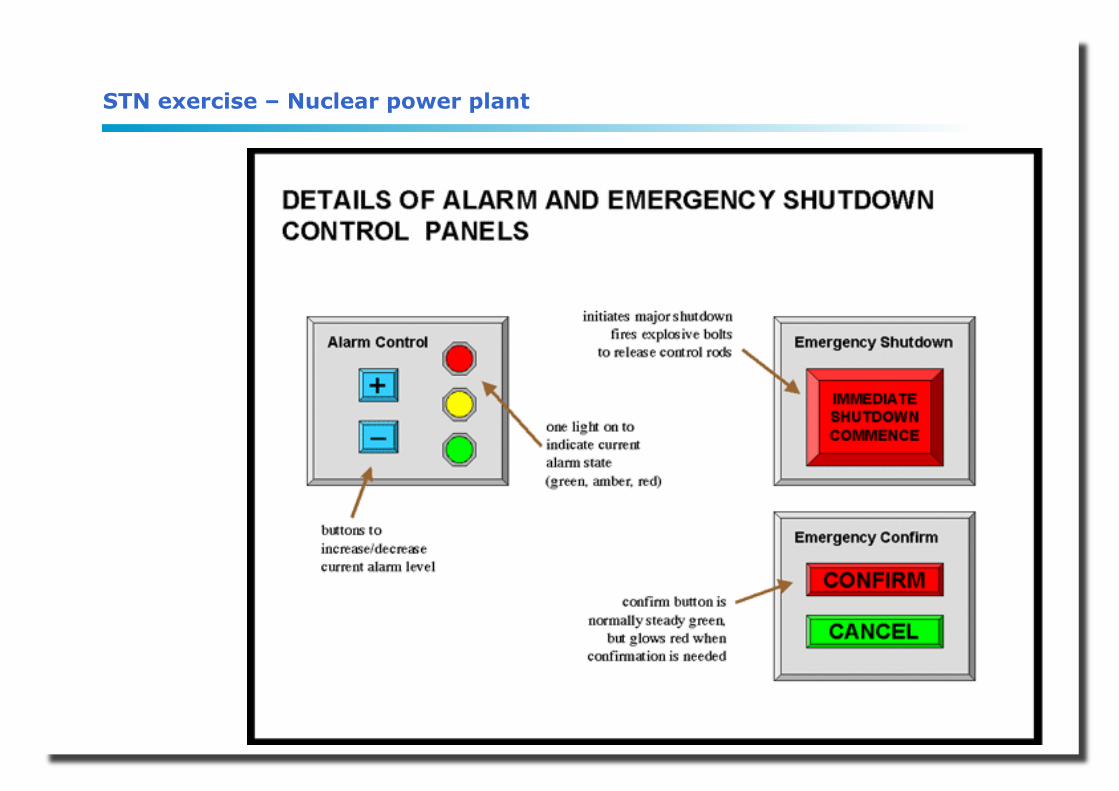
STN exercise – Nuclear power plant
13
Applying graph theory
An STN is a graph, so we can apply graph theory to analyse it “Chinese postman tour”:
– Shortest route around graph that includes every arc – Can use to efficiently check every action works as specified; and
has a corresponding description in the manual – Length of tour is a measure of how hard the device will be to test,
document, understand or explore – N.B. subsumes ‘travelling salesman’ (which is difficult to solve) as
will also visit every state (though not by shortest route)
14
Applying graph theory
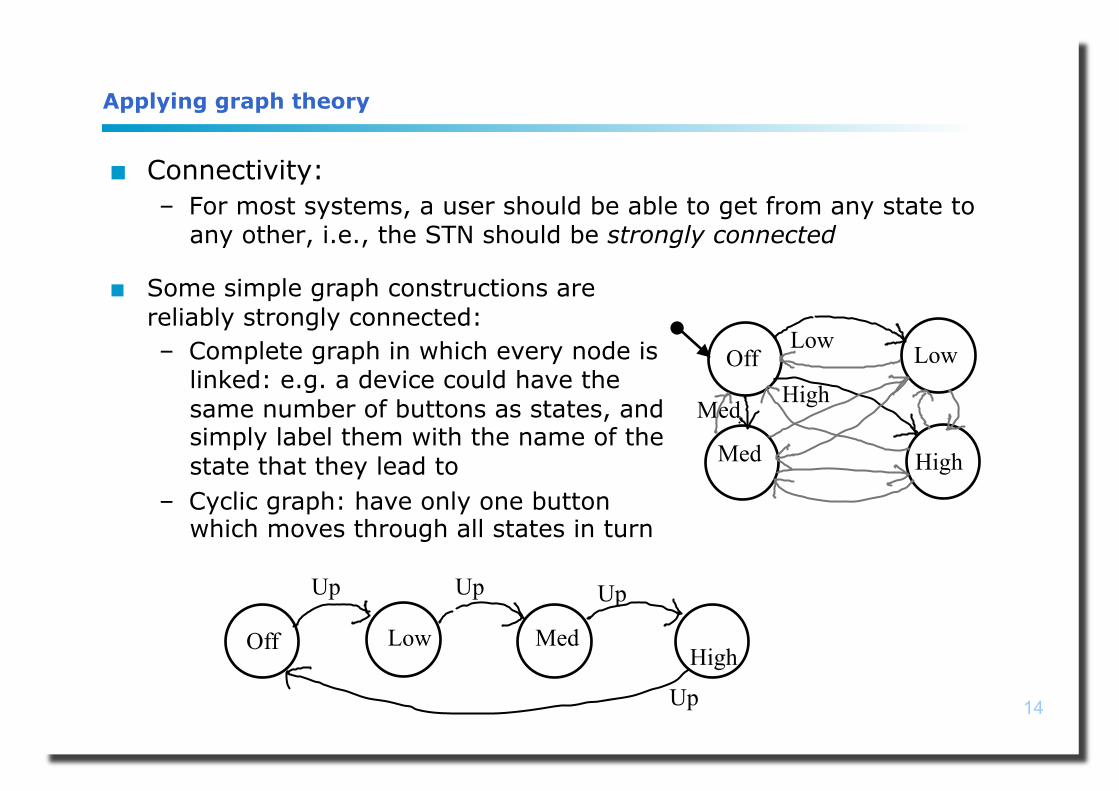
Connectivity: – For most systems, a user should be able to get from any state to
any other, i.e., the STN should be strongly connected
Off
High
Low
Med
Med
Low
High
High Med Low Off
Up
Up
Up Up
Some simple graph constructions are reliably strongly connected: – Complete graph in which every node is
linked: e.g. a device could have the same number of buttons as states, and simply label them with the name of the state that they lead to
– Cyclic graph: have only one button which moves through all states in turn
15
Reachability
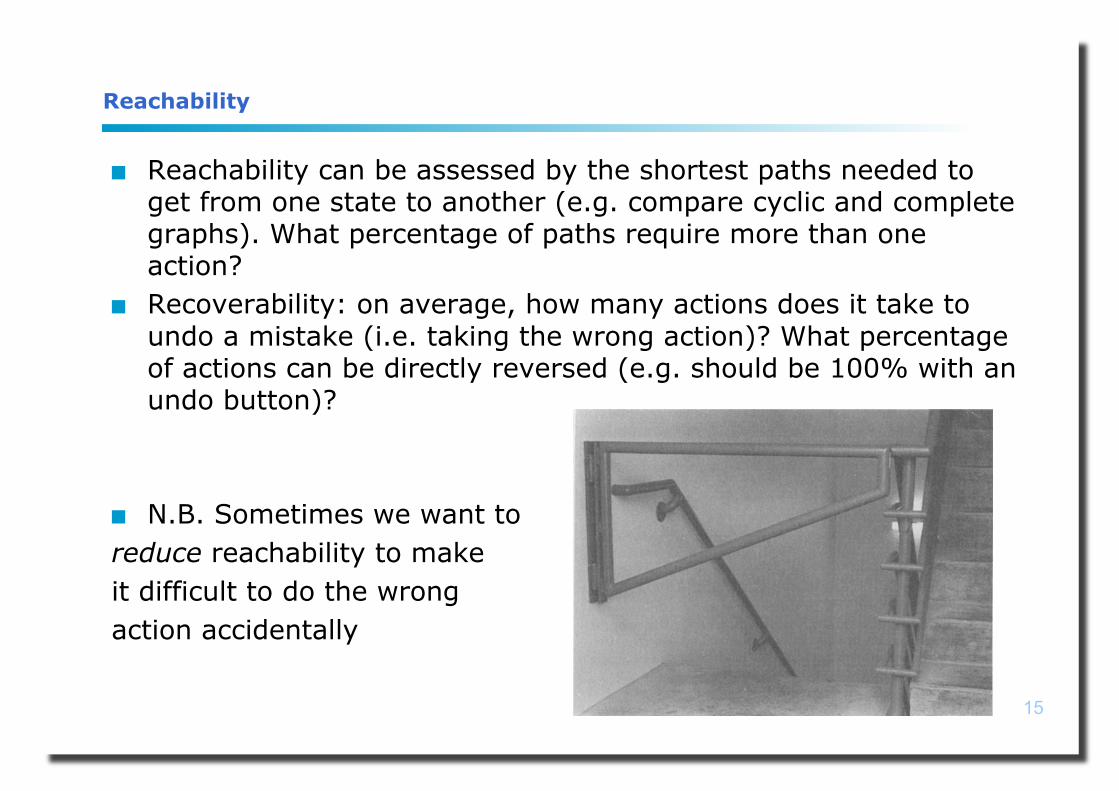
Reachability can be assessed by the shortest paths needed to get from one state to another (e.g. compare cyclic and complete graphs). What percentage of paths require more than one action?
Recoverability: on average, how many actions does it take to undo a mistake (i.e. taking the wrong action)? What percentage of actions can be directly reversed (e.g. should be 100% with an undo button)?
N.B. Sometimes we want to reduce reachability to make it difficult to do the wrong action accidentally
16
Applying graph theory
Subgraphs: – User’s mental model is (at best!) likely to be a subgraph of the
device STN, i.e., missing some (or many!) arcs or nodes
Hinges and arcs: – If deleting an node disconnects the graph, the node is a hinge – If deleting an arc disconnects the graph, the arc is a bridge – Hinges and bridges are critical knowledge: if absent from the user’s
subgraph, they cannot reach a whole set of states.
Small world networks: – STN in which most paths pass through a small number of hubs – As for hinges and bridges, knowledge of hubs can be critical – If hubs are made clear, system will be easier to learn
17
Indicators
The state of the device is not always visible to the user Indicators can be defined as variables in the state that the user
can perceive, e.g.: – Lights on or off – Text displayed – Device operation taking place
If we wanted to indicate every state with lights we would need log2n lights for n states
What if we wanted the minimum number of lights to always indicate, at least, that the state has changed after an action? – In STN terms, want to know when an arc has been traversed – This is formally equivalent to the graph colouring problem – If there are no crossing arcs, only need 4 ‘colours’, or 2 lights – For crossing arcs, can calculate the ‘chromatic number’ c
Can similarly consider the visibility of the available actions
18
Automating usability checks
A state transition network is a finite state machine We can describe the device in a computer program:
– List of states – List of actions – Matrix of actions x states describing transitions
Can automatically generate the transition diagram Can automatically find shortest paths
– Provide user instructions; generate the help manual Can check if some path lengths are unreasonably long Can make frequently used actions easier (e.g. larger buttons)
Can easily change the specification and re-run these processes May even be able to write a program to generate the device
description (e.g. if few variables combine to make many states) See Thimbleby (2007).
19
Automating usability checks
Using ‘gnomes’: test what happens if users take random actions – Can think of as ‘programmable user model’ that knows nothing
Can use to assess: – Can they easily reach unsafe or broken states? Maybe need to
improve security or robustness. – What is the minimum, average and maximum number of actions
used to reach a particular goal? Might be some simple design changes that reduce this significantly (e.g. avoid ‘lock-up’; make useless actions impossible)
Avoids any preconceptions (may find critical errors that designer and ‘typical’ user does not)
N.B. More formally, Markov models can be used to describe the probabilities of state transitions for random actions, or for correct actions, or for any level of user knowledge in between…
20
Limitations
State transition networks have limited expressive power – Some formalisms (e.g. grammars) can deal with recursive nesting
Best matched to serial dialogs – Some formalisms (e.g. production rules) handle concurrency
For even moderately complex systems, drawing the network accurately is not practical: – State charts solve some of the problems but are harder to use – Approximate drawings may still provide some insight into processes – Can program the equivalent FSM even if cannot draw the diagram
Many interactions involve continuous actions, or depend on time – Event oriented descriptions may be more appropriate than state
oriented descriptions.
21
Further Reading
Dix et al., (3rd ed) chapter 16. Harel, D. (1988) On visual formalisms Communications of the
ACM, 31:514-530 Thimbleby, H. (2007) Press On: Principles of Interaction
Programming. MIT Press, Cambridge MA