Embed Size (px)
Citation preview

HEAL THE BAY'S2016-17 ANNUAL
BEACH REPORT CARD

2HEAL THE BAY // 2016-2017 BEACH REPORT CARD 22HEAL THE BAY // 2016-2017 BEACH REPORT CARD
Heal the Bay is an environmental non-profit dedicated to making the coastal waters and watersheds of Greater Los Angeles safe, healthy and clean. To fulfill our mission, we use science, education, community action and advocacy.
The Beach Report Card program is funded by grants from
©2017 Heal the Bay. All Rights Reserved. The fishbones logo is a trademark of Heal the Bay. The Beach Report Card is a service mark of Heal the Bay.
We at Heal the Bay believe the public has the right to know the water quality at their beaches. We are proud to provide West Coast residents and visitors with this information in an easy-to-understand format. We hope beachgoers will use this information to make the decisions necessary to protect their health.
HEAL THE BAY'S2016-17 ANNUAL
BEACH REPORT CARD

| THE BEACH REPORT CARD |
2016-17
SECTION I: INTRODUCTION
EXECUTIVE SUMMARY ...................................................................................4
ABOUT THE BRC ................................................................................................5
SECTION II: WEST COAST SUMMARY
WEST COAST BEACH WATER QUALITY OVERVIEW ..............................8
CALIFORNIA HONOR ROLL ...........................................................................14
CALIFORNIA BEACH BUMMERS.................................................................16
ANALYSIS BY BEACH TYPE ......................................................................... 22
SECTION III: 2016-17 BEACH NEWS
FUNDING: FEDERAL BEACH ACT .............................................................. 26
FUNDING: CALIFORNIA BEACH PROGRAM ........................................... 27
SURFER HEALTH STUDY.............................................................................. 27
NOWCAST PROGRAM .................................................................................... 28
QUANTITATIVE MICROBIAL RISK ASSESSMENT AT INNER CABRILLO BEACH ....................................................................... 29
STATE WATER RESOURCES CONTROL BOARD’S BACTERIAL OBJECTIVES ............................................................................ 29
SECTION IV: COUNTY SUMMARIES
OVERVIEW OF COASTAL COUNTIES .........................................................31
CALIFORNIA COUNTY SUMMARIES ........................................................ 32
OREGON/WASHINGTON COUNTY SUMMARIES .................................. 48
SECTION V: APPENDICES
A // HISTORY OF BEACH BUMMERS .........................................................51
B1 // GRADES BY COUNTY - CALIFORNIA............................................... 52
B2 // GRADES BY COUNTY - WASHINGTON ........................................... 65
C // FREQUENTLY ASKED QUESTIONS .................................................... 70
D // METHODOLOGY ....................................................................................... 72
E // INDEX/BILLS ............................................................................................. 74
F // ACKNOWLEDGEMENTS ........................................................................ 75

4HEAL THE BAY // 2016-2017 BEACH REPORT CARD 44HEAL THE BAY // 2016-2017 BEACH REPORT CARD
EXECUTIVE SUMMARYCalifornia has experienced a welcome relief from its years-
long drought. However, with the much needed rainfall comes
increased amounts of urban runoff that have affected the
water quality of its beaches. Heal the Bay is among those at
the forefront in guarding this precious resource and faces the
upcoming year with both expanding scientific programs and
potentially disasterous budget cuts.
For most of the 2016-17 year, California continued the dry weather trend it had been
experiencing since 2012. However, the dry, summer period of this reporting year
was followed by a remarkably wet winter, particularly for Northern California coastal
counties. Rainfall levels over the last year far exceeded the five- and ten-year av-
erages in California (although, in Southern California, rainfall levels were similar
to historic values). Beaches throughout the state had excellent grades during the
2016 summer dry weather, but wet weather grades were worse than the five-year
average. This marks the first time in three years that Cowell Beach in Santa Cruz did
not top the “Beach Bummer” list. This year it ranked in at No. 3, with Clam Beach in
Humboldt County claiming the No. 1 spot. There were 32 locations from Central to
Southern California that earned a spot on the Honor Roll.
Heal the Bay, in partnership with Stanford University and UCLA, continues to invest
in efforts to predict beach water quality. Predictive models, or beach water quality
’NowCasting’ tools, are designed to predict daily water quality based upon historic
data and location specific, environmental information for a defined beach. Last sum-
mer Heal the Bay expanded the NowCast project from three to five beaches. The
program will add five (5) more beaches to daily predictions this coming summer.
Unfortunately, fiscal funding and regulatory policies at the federal level continue to
threaten beach water quality monitoring programs. The U.S. President’s proposed
budget for Fiscal Year 2017-18 would eliminate BEACH ACT grant funds. Though
the final budget has not yet been set, reducing funds for this important program
would compromise the ability for state agencies and municipalities to adequately
monitor beach water quality across the country, including California.
I. INTRODUCTION WELCOME
WINTER DRY GRADES in California took a hit
last year. | Page 10 |
RAINFALL LEVELS far exceeded averages from the
last decade in California. | Page 12 |
CLAM BEACH COUNTY PARK in Northern California was #1 on the Beach Bummers list.
| Page 16 |
NOWCAST PREDICTIVE MODELLING
program continues to expand. | Page 28 |
FEDERAL FUNDING for the BEACH Act is in
danger of being eliminated for 2017-18 | Page 26 |
WATER QUALITY IMPROVEMENT involving some of Southern California's dirtiest beaches.
| Page 13 |
SAN CLEMENTE PIER and LA JOLLA COVE
make their first appearance on the Beach Bummers list.
| Page 16 |
REPORT HIGHLIGHTS

5HEAL THE BAY // 2016-2017 BEACH REPORT CARD 55HEAL THE BAY // 2016-2017 BEACH REPORT CARD
THE 2016-17 BEACH REPORT CARD
I. INTRODUCTION
1 http://water.epa.gov/type/oceb/beaches/basicinfo.cfm 2 National Ocean Economics Program,
ABOUT THE BRC
Since its inception over 25 years ago, the Beach Report Card has provided
beachgoers with a reliable and easy-to-understand tool in analyzing beach
water quality. The better the grade a beach receives, the lower the risk of
illness to ocean users. The BRC is the result of an ongoing cooperation between
shoreline monitoring agencies in California, Oregon and Washington.
The Annual Beach Report Card is a summary of the past year’s water quality
at sampling locations along the West Coast for three distinct periods:
• Summer dry weather – April through October 2016
(Under Assembly Bill 411 [AB 411] in California)
• Winter dry weather – November 2016 through March 2017
• Year-round wet weather conditions –
April 2016 through March 2017.
In addition to summarizing ocean water quality, this
report includes a brief review of the sewage spills
that reached surface waters over the past year.

6HEAL THE BAY // 2016-2017 BEACH REPORT CARD 66HEAL THE BAY // 2016-2017 BEACH REPORT CARD
Beaches in the U.S. accommodate
nearly two billion visitors each year1 and
contribute to an estimated $90 billion
coastal tourism economy2. However,
recreating at polluted beaches can also
result in significant economic loss. A
study in Los Angeles and Orange Coun-
ties found that the regional public health
cost of gastrointestinal illnesses caused
by recreating in polluted ocean waters
was between $21 and $51 million each
year3.
Beach water quality monitoring helps
ensure the health protection of the mil-
lions of beachgoers in the U.S. each year
by focusing remediation efforts on areas
of greatest need and allowing the public
to make informed decisions about where
to recreate. However, water quality in-
formation must be accessible and easy
to understand for beachgoers to make
informed decisions. Heal the Bay’s An-
nual Beach Report CardSM achieves this
goal by using an intuitive A to F grading
system to provide water quality informa-
tion to the millions of people who recre-
ate along West Coast shoreline waters.
Grades are based on routine beach wa-
ter quality sampling conducted by local
health agencies and dischargers. With-
out these monitoring programs, the pub-
lic health of beachgoers would be seri-
ously jeopardized. As such, federal and
state funding are critical in supporting
local beach monitoring programs.
Water samples are analyzed for fecal
indicator bacteria (FIB) that indicate pol-
lution from numerous sources, including
human and animal waste. Sample results
are used to assign each location with an
A to F grade based upon FIB concentra-
tion, which represents the risk of adverse
health effects to beachgoers. The better
the grade, the lower the risk of illness to
ocean users.
Heal the Bay’s first Annual Beach Report
Card (BRC) was published in 1991 for Los
Angeles County. It has since grown to
provide beachgoers throughout Wash-
ington, Oregon and California with water
quality grades for their local beaches. Up-
dated weekly grades can be found each
Friday at www.beachreportcard.org.
Regardless of the BRC grades, which
represent an overall seasonal trend,
I. INTRODUCTION ABOUT THE BRC
Introduction (continued)
1 http://water.epa.gov/type/oceb/beaches/basicinfo.cfm 2 National Ocean Economics Program, 2 National Ocean Economics Program, State of the U.S. Ocean and Coastal Economies, Center for the Blue Economy at the Monterey Institute of International Studies (2014) 3 Given, S. et al, Regional Public Health Cost Estimates of Contaminated Coastal Waters: A Case Study of Gastroenteritis at Southern California Beaches, 40 Environ. Sci. Technol. 4851 (2006)
county health officials and Heal the Bay
recommend that beach users never
swim or surf within 100 yards of any flow-
ing storm drain. In addition, beachgoers
should avoid ocean water contact dur-
ing a rainstorm, and for a minimum of
the three days following the cessation
of the storm. Storm drain runoff can be
the greatest source of pollution to local
beaches, flowing untreated to the coast
and often contaminated with motor oil,
animal waste, pesticides, yard waste
and trash. After a rain, indicator bacteria
counts usually far exceed state health
criteria for recreational water use.
For more information, please visit
healthebay.org, or call 1-800-HEAL BAY.

| WEST COAST SUMMARY |
8HEAL THE BAY // 2016-2017 BEACH REPORT CARD 88HEAL THE BAY // 2016-2017 BEACH REPORT CARD
OVERVIEWII. WEST COAST SUMMARY
CHANGES IN WINTER DRY GRADES .......................................10
CALIFORNIA GRADES................................................................... 11
NORTHERN CALIFORNIA GRADES .......................................... 11
SOUTHERN CALIFORNIA GRADES .......................................... 11
COUNTY RAINFALL AND HISTORIC LEVELS ........................12
2016-17 RAINFALL BY SEASON ..................................................12
SAVING POCHE BEACH ................................................................13
WATER QUALITY IMPROVEMENT ...........................................13
2016-17 HONOR ROLL....................................................................14
CALIFORNIA'S CLEANEST BEACHES ......................................15
2016-17 BEACH BUMMERS .........................................................16
BEACH BUMMERS – FIVE YEAR HISTORY .......................... 20
CALIFORNIA’S TROUBLED BEACHES ......................................21
ALL CALIFORNIA GRADES (APPENDIX B) ............................ 52
OVERVIEW OF WEST COAST BEACH WATER QUALITY
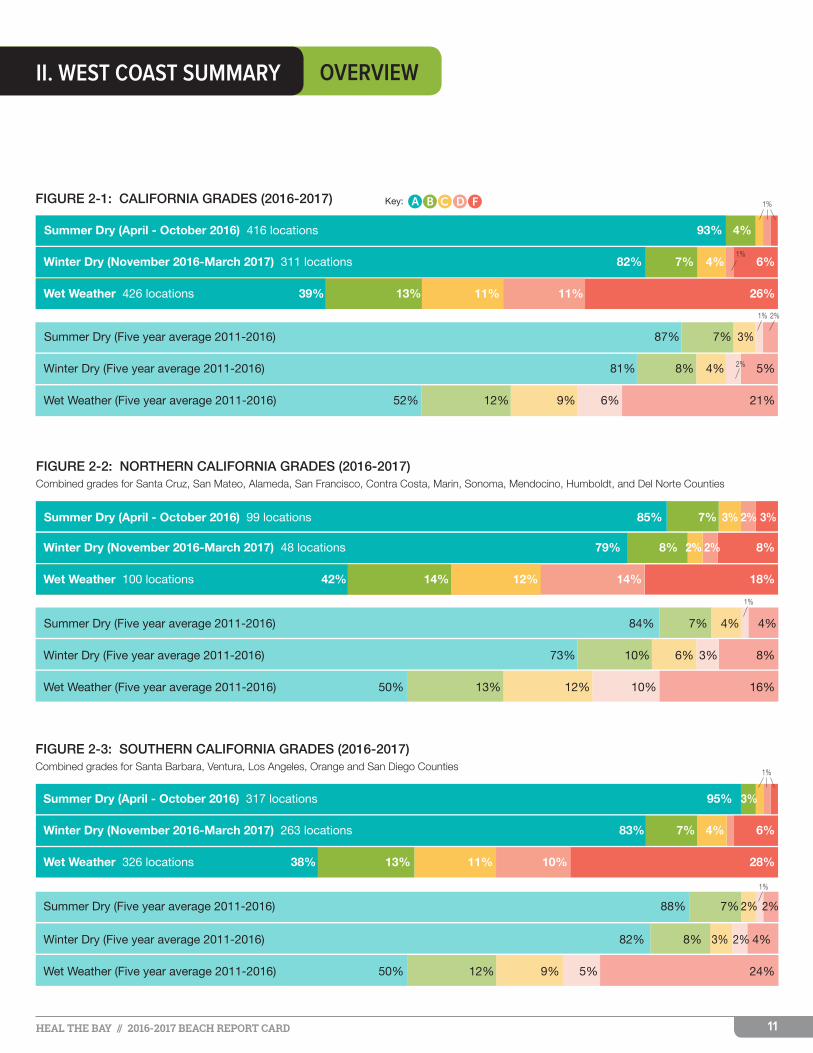
Unfortunately, grades in wet weather
plummeted statewide, with only 52% A or B
grades relative to the
2014-15 near all-time high
of 69%. (Page 11)
California had excellent overall water quality this past summer during dry weather, with 96% percent of beaches
receiving an A or B grade. Winter
dry weather grades, though
lower than summer grades,
slightly exceeded the
five-year average.
9HEAL THE BAY // 2016-2017 BEACH REPORT CARD 99HEAL THE BAY // 2016-2017 BEACH REPORT CARD
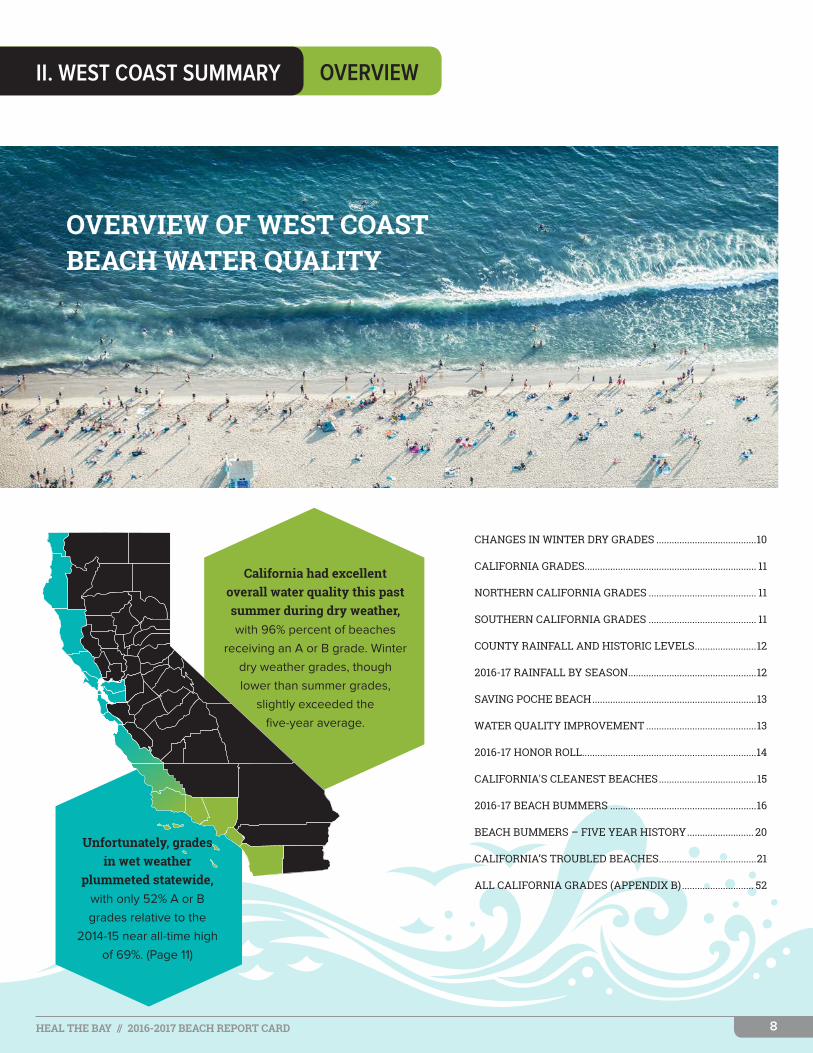
NORTHERN CALIFORNIAAt Northern California beaches, there
was another year of great summer
dry weather water quality with 92% of
monitored beaches receiving an A or B
grade. Winter dry weather was similar
to the summer grades, with 88% of the
monitored locations receiving A or B
grades. However, many county monitor-
ing programs in Northern California only
sample during summer months, making
this comparison difficult. Wet weather
grades were low with 44% of locations
receiving C to F grades. (Figure 2-2)
Given that the past rainy season was the
wettest on record for Northern Califor-
nia, rainfall levels were extremely high.
In multiple Northern California counties
rainfall levels more than doubled five
and ten-year averages. (Figure 2-2)
Rainfall levels skyrocketed last year. With all counties
exceeding their five and ten-year
precipitation averages, rainfall-
related water quality, or “wet
weather” grades, plummeted. This
encompasses any sample data
taken throughout the year during
or within 72 hours of a
rainfall event of 0.1 inches
or greater.
California’s boom and bust water cycle,
which is a series of dry years
followed by extremely wet year
in California is only projected to
intensify in the face of climate
change, with deeper droughts
and heavier rains for coastal
counties. See California county
historic averages from 1981-2010
(Figure 2-4).
The drop in California wet weather grades
demonstrates why wet weather
water quality continues to be a
public health concern even with
increased rainfall events. This
illustrates why California coastal
Health Departments and Heal the
Bay recommend swimmers stay out
of the water for a minimum of three
days following a rain event of at
least 0.1 inches.
SOUTHERN CALIFORNIASouthern California had another year
of excellent summer dry weather wa-
ter quality with 97% of monitoring loca-
tions receiving A or B grades. Summer
2016 was the sixth summer in a row
of drought years in Southern Califor-
nia. Drier conditions, with less rain and
drought-era conservation efforts, likely
result in less urban runoff, which in turn
could lead to the improvement of over-
all grades. (Figure 2-3)
Wet weather water quality was a dif-
ferent story with beach water qual-
ity plummeting during rain events (wet
weather), resulting in 49% of beaches
receiving C to F grades. This was an
11% increase in C to F grades compared
to the five-year average. This extreme
water quality difference in wet weather
compared to dry weather is why Heal
the Bay and California’s public health
agencies continue to recommend that
no one swim in recreational waters dur-
ing, and for at least three days after, a
rainstorm. (Figure 2-3)
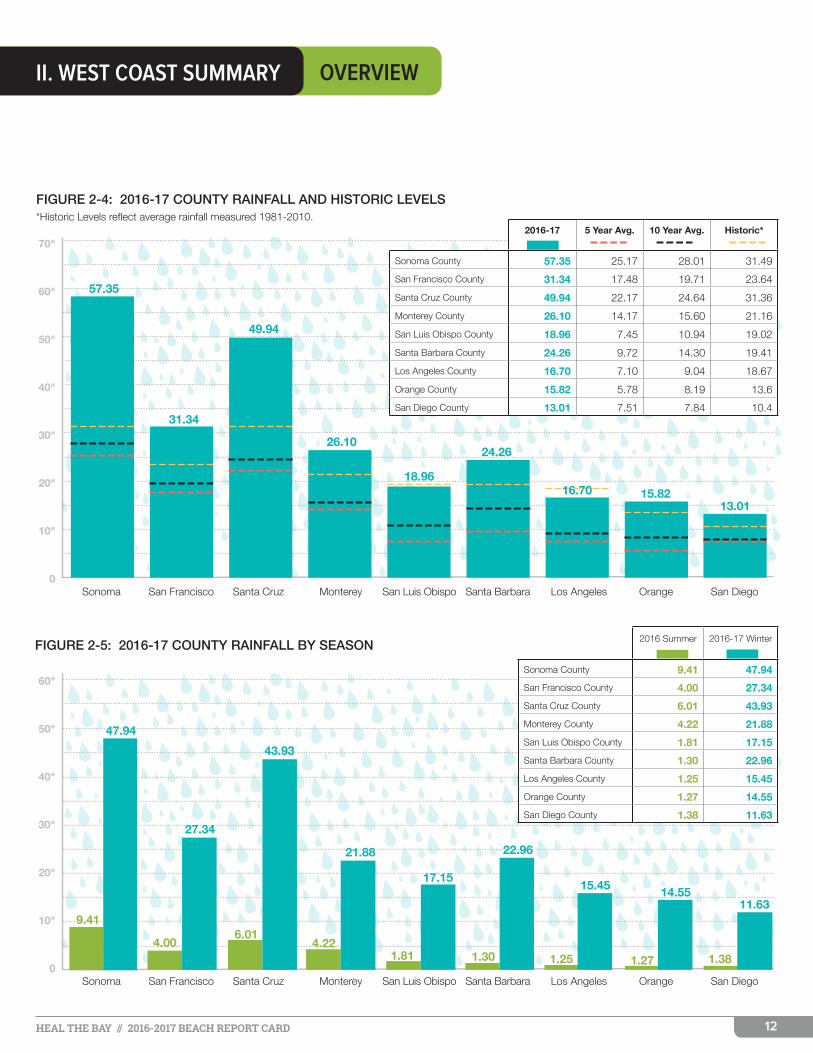
The winter 2016-17 season was peppered with rain events resulting in what is now recognized as the second wettest year on
record for the state—dating back to 1895— and the wettest year on
record for Northern California. Unsurprisingly, precipitation totals
greatly surpassed historic averages across the northern part of the
state. However, from San Luis Obispo down to San Diego County,
rainfall levels, though much greater than five and ten-year averages,
were merely closer to historic levels. (Figure 2-4).A list of all grades can be found in Appendix B.
OVERVIEWII. WEST COAST SUMMARY
10HEAL THE BAY // 2016-2017 BEACH REPORT CARD 1010HEAL THE BAY // 2016-2017 BEACH REPORT CARD
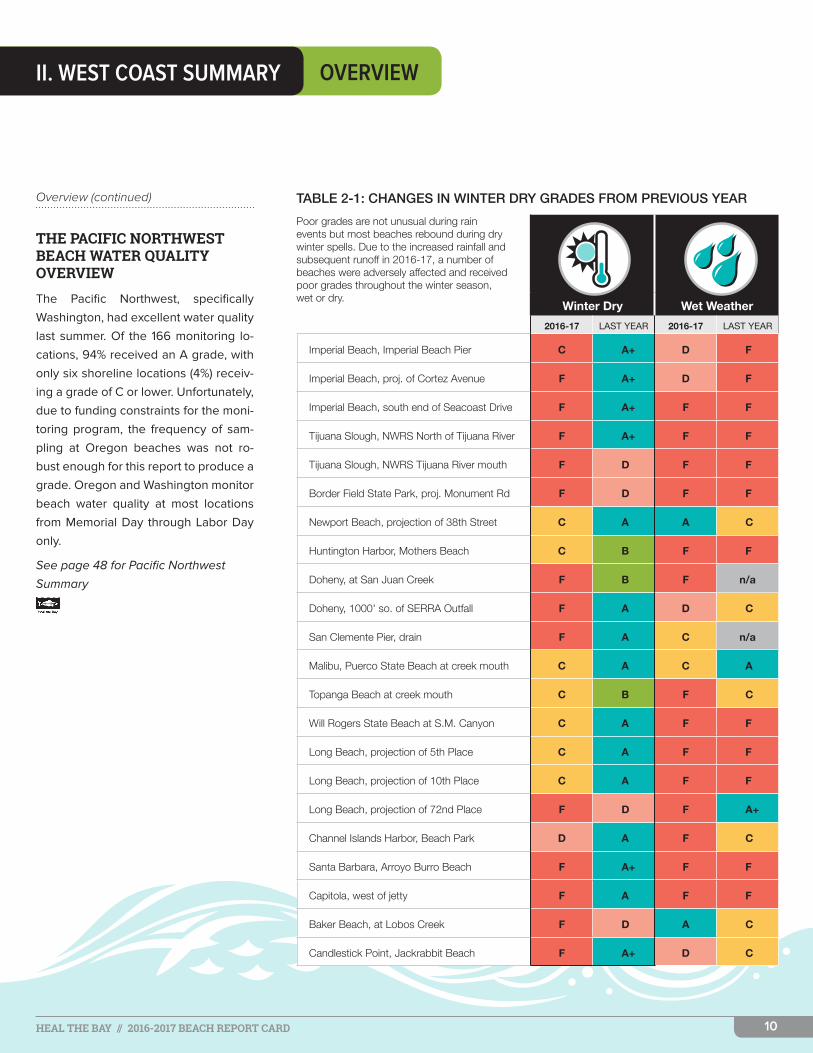
TABLE 2-1: CHANGES IN WINTER DRY GRADES FROM PREVIOUS YEAR
Winter Dry Wet Weather
2016-17 LAST YEAR 2016-17 LAST YEAR
Imperial Beach, Imperial Beach Pier C A+ D F
Imperial Beach, proj. of Cortez Avenue F A+ D F
Imperial Beach, south end of Seacoast Drive F A+ F F
Tijuana Slough, NWRS North of Tijuana River F A+ F F
Tijuana Slough, NWRS Tijuana River mouth F D F F
Border Field State Park, proj. Monument Rd F D F F
Newport Beach, projection of 38th Street C A A C
Huntington Harbor, Mothers Beach C B F F
Doheny, at San Juan Creek F B F n/a
Doheny, 1000' so. of SERRA Outfall F A D C
San Clemente Pier, drain F A C n/a
Malibu, Puerco State Beach at creek mouth C A C A
Topanga Beach at creek mouth C B F C
Will Rogers State Beach at S.M. Canyon C A F F
Long Beach, projection of 5th Place C A F F
Long Beach, projection of 10th Place C A F F
Long Beach, projection of 72nd Place F D F A+
Channel Islands Harbor, Beach Park D A F C
Santa Barbara, Arroyo Burro Beach F A+ F F
Capitola, west of jetty F A F F
Baker Beach, at Lobos Creek F D A C
Candlestick Point, Jackrabbit Beach F A+ D C
Overview (continued)
THE PACIFIC NORTHWEST BEACH WATER QUALITY OVERVIEWThe Pacific Northwest, specifically
Washington, had excellent water quality
last summer. Of the 166 monitoring lo-
cations, 94% received an A grade, with
only six shoreline locations (4%) receiv-
ing a grade of C or lower. Unfortunately,
due to funding constraints for the moni-
toring program, the frequency of sam-
pling at Oregon beaches was not ro-
bust enough for this report to produce a
grade. Oregon and Washington monitor
beach water quality at most locations
from Memorial Day through Labor Day
only.
See page 48 for Pacific Northwest
Summary
OVERVIEWII. WEST COAST SUMMARY
Poor grades are not unusual during rain events but most beaches rebound during dry winter spells. Due to the increased rainfall and subsequent runoff in 2016-17, a number of beaches were adversely affected and received poor grades throughout the winter season, wet or dry.
11HEAL THE BAY // 2016-2017 BEACH REPORT CARD
FIGURE 2-2: NORTHERN CALIFORNIA GRADES (2016-2017)Combined grades for Santa Cruz, San Mateo, Alameda, San Francisco, Contra Costa, Marin, Sonoma, Mendocino, Humboldt, and Del Norte Counties
Winter Dry (Five year average 2011-2016) 73% 10% 6% 3% 8%
Wet Weather (Five year average 2011-2016) 50% 13% 12% 10% 16%
Summer Dry (Five year average 2011-2016) 84% 7% 4% 4%
Summer Dry (April - October 2016) 99 locations 85% 7% 3% 2% 3%
Winter Dry (November 2016-March 2017) 48 locations 79% 8% 2% 2% 8%
Wet Weather 100 locations 42% 14% 12% 14% 18%
1%
Key:FIGURE 2-1: CALIFORNIA GRADES (2016-2017)
Winter Dry (Five year average 2011-2016) 81% 8% 4% 5%
Wet Weather (Five year average 2011-2016) 52% 12% 9% 6% 21%
Summer Dry (Five year average 2011-2016) 87% 7% 3%
Summer Dry (April - October 2016) 416 locations 93% 4%
Winter Dry (November 2016-March 2017) 311 locations 82% 7% 4% 6%
1%
1%
1% 2%
2%
Wet Weather 426 locations 39% 13% 11% 11% 26%
Winter Dry (Five year average 2011-2016) 82% 8% 3% 2% 4%
Wet Weather (Five year average 2011-2016) 50% 12% 9% 5% 24%
Summer Dry (Five year average 2011-2016) 88% 7% 2% 2%
1%
FIGURE 2-3: SOUTHERN CALIFORNIA GRADES (2016-2017)Combined grades for Santa Barbara, Ventura, Los Angeles, Orange and San Diego Counties
Winter Dry (November 2016-March 2017) 263 locations 83% 7% 4% 6%
1%
Summer Dry (April - October 2016) 317 locations 95% 3%
Wet Weather 326 locations 38% 13% 11% 10% 28%
OVERVIEWII. WEST COAST SUMMARY
12HEAL THE BAY // 2016-2017 BEACH REPORT CARD
47.94
9.41
4.00
27.34
6.01
43.93
4.22
21.88
1.81
17.15
1.30
22.96
1.25
15.45
1.27
14.55
1.38
11.63
Sonoma San Francisco Santa Cruz Monterey San Luis Obispo Santa Barbara Los Angeles Orange San Diego
60"
50"
40"
30"
20"
10"
0
70"
60"
50"
40"
30"
20"
10"
0 Sonoma San Francisco Santa Cruz Monterey San Luis Obispo Santa Barbara Los Angeles Orange San Diego
57.35
31.34
49.94
26.10
18.96
24.26
16.70 15.8213.01
2016-17 5 Year Avg. 10 Year Avg. Historic*
Sonoma County 57.35 25.17 28.01 31.49
San Francisco County 31.34 17.48 19.71 23.64
Santa Cruz County 49.94 22.17 24.64 31.36
Monterey County 26.10 14.17 15.60 21.16
San Luis Obispo County 18.96 7.45 10.94 19.02
Santa Barbara County 24.26 9.72 14.30 19.41
Los Angeles County 16.70 7.10 9.04 18.67
Orange County 15.82 5.78 8.19 13.6
San Diego County 13.01 7.51 7.84 10.4
FIGURE 2-5: 2016-17 COUNTY RAINFALL BY SEASON
FIGURE 2-4: 2016-17 COUNTY RAINFALL AND HISTORIC LEVELS*Historic Levels reflect average rainfall measured 1981-2010.
2016 Summer 2016-17 Winter
Sonoma County 9.41 47.94
San Francisco County 4.00 27.34
Santa Cruz County 6.01 43.93
Monterey County 4.22 21.88
San Luis Obispo County 1.81 17.15
Santa Barbara County 1.30 22.96
Los Angeles County 1.25 15.45
Orange County 1.27 14.55
San Diego County 1.38 11.63
OVERVIEWII. WEST COAST SUMMARY

13HEAL THE BAY // 2016-2017 BEACH REPORT CARD
TABLE 2-2: WATER QUALITY IMPROVEMENTOther locations besides Poche Beach have bettered their grades. These beaches below have all made frequent appearances on our Top Ten Beach Bummers list since 2004 and have shown improvement in water quality during all three monitoring periods since 2012.
Years
2016-17 2015-16 2014-15 2013-14 2012-13
Former Beach Bummer SummerDry
WinterDry
WetWeather
SummerDry
WinterDry
WetWeather
SummerDry
WinterDry
WetWeather
SummerDry
WinterDry
WetWeather
SummerDry
WinterDry
WetWeather
Cabrillo Beach, at restrooms (2004–2015) 12 B B F A A D D B F F D F F F F
Avalon, midpoint, Catalina Island (2004–2013) 10 A n/a A+ B n/a C C n/a A+ B n/a n/a F n/a n/a
Poche Beach (2008–2013) 5 A+ A+ A+ A A A A A F B A B F D D
Redondo Beach Pier (2005, 2013, 2016) 3 A B A F D A B F F A C C C F F
1) San Clemente's $3 million Poche Clean Beach Project to clean, filter (and now divert) urban runoff is paying dividends.
4) High pitched ultrasound, fake coyotes and a falconry program have been employed to keep gulls (and their feces) away from the waterhole.
2) A barrier has been installed at the channel exit, yet still harbors some bacteria-laden water. This is still cause for concern during a rain event.
3) A berm has been created to reduce the amount of ponding, which is enticing to waterfowl and induces bacteria growth through stagnation.
Before (2012)
After (2017)
FIGURE 2-6: SAVING POCHE BEACHPoche Beach in San Clemente/Dana Point has gone from being a perennial Beach Bummer to Honor Roll recipient.
OVERVIEWII. WEST COAST SUMMARY

14HEAL THE BAY // 2016-2017 BEACH REPORT CARD
HONOR ROLL BEACHESII. WEST COAST SUMMARY
SAN LUIS OBISPO COUNTY San Simeon Pico AvenueMorro Bay Morro Bay City Beach
VENTURA COUNTY
Oxnard Silver Strand @ Sawtelle Ave.
LOS ANGELES COUNTY
Malibu El Matador State BeachMalibu Malibu PointPalos Verdes Est. Bluff CoveRancho Palos Verdes Portuguese Bend Cove
ORANGE COUNTY
Newport Beach Balboa Beach @ 15th/16th St.Newport Beach Balboa Beach PierNewport Beach Crystal Cove, Pelican Point BeachNewport Beach Crystal CoveLaguna Beach Treasure Island BeachLaguna Beach North Aliso County BeachLaguna Beach Camel PointLaguna Beach West StreetLaguna Beach Table RockLaguna Beach Laguna Lido Apt.Laguna Beach Three Arch BayDana Point Projection of Camino EstrellaDana Point S. Capistrano Bay Community BeachSan Clemente Poche Beach
SAN DIEGO COUNTY Carlsbad projection of Cerezo DriveCarlsbad projection of Palomar Airport Rd.Carlsbad Encina Creek outletCarlsbad projection of Ponto DriveCarlsbad projection of Poinsettia LaneEncinitas San Elijo Park, Pipes surf breakEncinitas San Elijo Park, north end of stairsEncinitas Cardiff State Beach, Lagoon outletEncinitas Cardiff State Beach, Las OlasSolana Beach Fletcher CovePoint Loma Point Loma Lighthouse
POCHE BEACH in San Clemente has landed on the Heal the Bay’s Honor Roll after being a Top Ten Beach Bummer 2008-2013.
ABALONE COVE in Rancho Palos Verdes and Oceanside’s ST. MALO BEACH received poor wet weather grades, knocking them off the Honor Roll after many years of exceptional water quality.
The beach at LAGUNA LIDO APTS has landed on the Honor Roll every year since Heal the Bay started tracking grades in 1990.
Wet weather generally leads to lower grades in Malibu, but EL MATADOR BEACH has once again landed on the Honor Roll.
LAGUNA BEACH (between Aliso Point and Mussell Cove) and CARLSBAD (between Cerezo Drive and Pointsettia Lane) offers some of the consistently best beach water quality in California.
Lack of winter dry data has left most of VENTURA COUNTY’s normally excellent beaches off the Honor Roll.
2016-2017 HONOR ROLLTo earn a spot on the Honor Roll,
a beach must be monitored weekly
year-round, and have received only exceptional
(A+) grades during all seasons and weather
conditions.
HONOR ROLL NOTES
FIGURE 2-7:2016-17 HONOR ROLL BEACHES
15HEAL THE BAY // 2016-2017 BEACH REPORT CARD
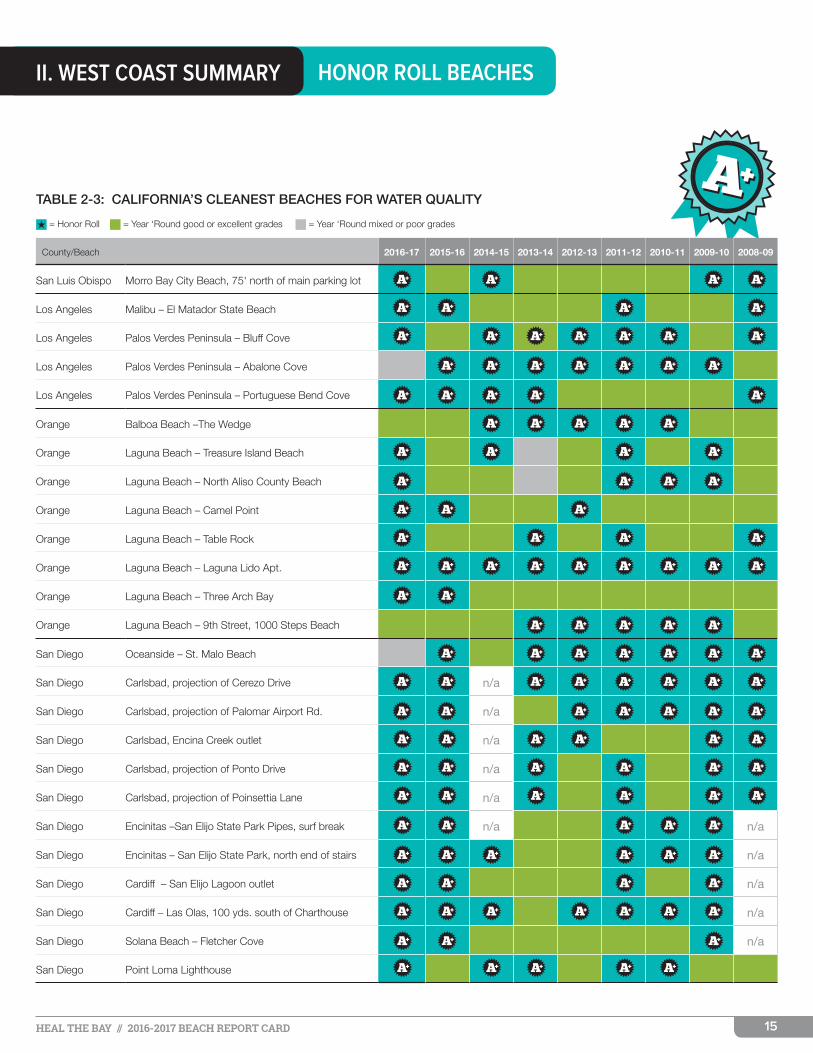
TABLE 2-3: CALIFORNIA’S CLEANEST BEACHES FOR WATER QUALITY
= Honor Roll = Year ‘Round good or excellent grades = Year ‘Round mixed or poor grades
HONOR ROLL BEACHESII. WEST COAST SUMMARY
County/Beach 2016-17 2015-16 2014-15 2013-14 2012-13 2011-12 2010-11 2009-10 2008-09
San Luis Obispo Morro Bay City Beach, 75' north of main parking lot
Los Angeles Malibu – El Matador State Beach
Los Angeles Palos Verdes Peninsula – Bluff Cove
Los Angeles Palos Verdes Peninsula – Abalone Cove
Los Angeles Palos Verdes Peninsula – Portuguese Bend Cove
Orange Balboa Beach –The Wedge
Orange Laguna Beach – Treasure Island Beach
Orange Laguna Beach – North Aliso County Beach
Orange Laguna Beach – Camel Point
Orange Laguna Beach – Table Rock
Orange Laguna Beach – Laguna Lido Apt.
Orange Laguna Beach – Three Arch Bay
Orange Laguna Beach – 9th Street, 1000 Steps Beach
San Diego Oceanside – St. Malo Beach
San Diego Carlsbad, projection of Cerezo Drive n/a
San Diego Carlsbad, projection of Palomar Airport Rd. n/a
San Diego Carlsbad, Encina Creek outlet n/a
San Diego Carlsbad, projection of Ponto Drive n/a
San Diego Carlsbad, projection of Poinsettia Lane n/a
San Diego Encinitas –San Elijo State Park Pipes, surf break n/a n/a
San Diego Encinitas – San Elijo State Park, north end of stairs n/a
San Diego Cardiff – San Elijo Lagoon outlet n/a
San Diego Cardiff – Las Olas, 100 yds. south of Charthouse n/a
San Diego Solana Beach – Fletcher Cove n/a
San Diego Point Loma Lighthouse

16HEAL THE BAY // 2016-2017 BEACH REPORT CARD
1 Clam Beach County Park, McKinleyvilleHUMBOLDT COUNTY
2 San Clemente Pier, San ClementeORANGE COUNTY
3 Cowell Beach, West of Wharf, Santa CruzSANTA CRUZ COUNTY
4 Lakeshore Park, Marina Lagoon, San MateoSAN MATEO COUNTY
5 La Jolla Cove, La JollaSAN DIEGO COUNTY
6 Santa Monica Pier, Santa MonicaLOS ANGELES COUNTY
7 Capitola Beach, CapitolaSANTA CRUZ COUNTY
8 Luffenholtz Beach, TrinidadHUMBOLDT COUNTY
9 Mother’s Beach, Marina del ReyLOS ANGELES COUNTY
10 Monarch Beach, N. of Salt Creek, Dana PointORANGE COUNTY
BEACH BUMMERSII. WEST COAST SUMMARY
After being the No. 1 or 2 ranked Beach Bummer for six consecutive years, Catalina Island’s AVALON BEACH has received excellent grades since 2013.
COWELL BEACH drops to No. 3 after having been ranked No. 1 or No. 2 since 2010.
This year’s Beach Bummers has four beaches with F summer grades. Last year, all Beach Bummers received F summer grades.
Two of HUMBOLDT COUNTY’S five monitored beaches have made the Beach Bummers list.
Two Southern California locations have made their first ever appearance on the Beach Bummers list: SAN CLEMENTE PIER and LA JOLLA COVE.
San Mateo’s Marina Lagoon has two locations that have made multiple Bummer appearances. Only LAKESHORE PARK has made the Top Ten this year.
BEACH BUMMER NOTES
CLAM BEACH COUNTY PARK, MOTHER'S BEACH, MARINA DEL REY and SANTA MONICA PIER have been Bummers for the past four years.
CABRILLO BEACH has not made the list for the second year in a row, after being a Beach Bummer every year from 2004 to 2015.
2015 was the first year that all California BEACH Program agencies were required to sample at “point-zero”, which gives the most accurate picture of coastal water quality.
FIGURE 2-8:2016-17 TOP TEN BEACH BUMMERS
2016-2017 BEACH BUMMERSHeal the Bay designates the
monitoring locations with the poorest
dry weather water quality in California
during the past summer as annual
“Beach Bummers.”
17HEAL THE BAY // 2016-2017 BEACH REPORT CARD
Humboldt County #1 CLAM BEACH COUNTY PARK
#8 LUFFENHOLTZ BEACH
This is Clam Beach County
Park’s fourth year on the
Beach Bummer list, this
year moving up to the No. 1
spot. This site is fed by two creeks, Patri-
cia Creek and Strawberry Creek. Poten-
tial upstream bacterial sources include
multiple private septic systems. The
Humboldt Public Health lab is develop-
ing Bacteroides testing to help pinpoint
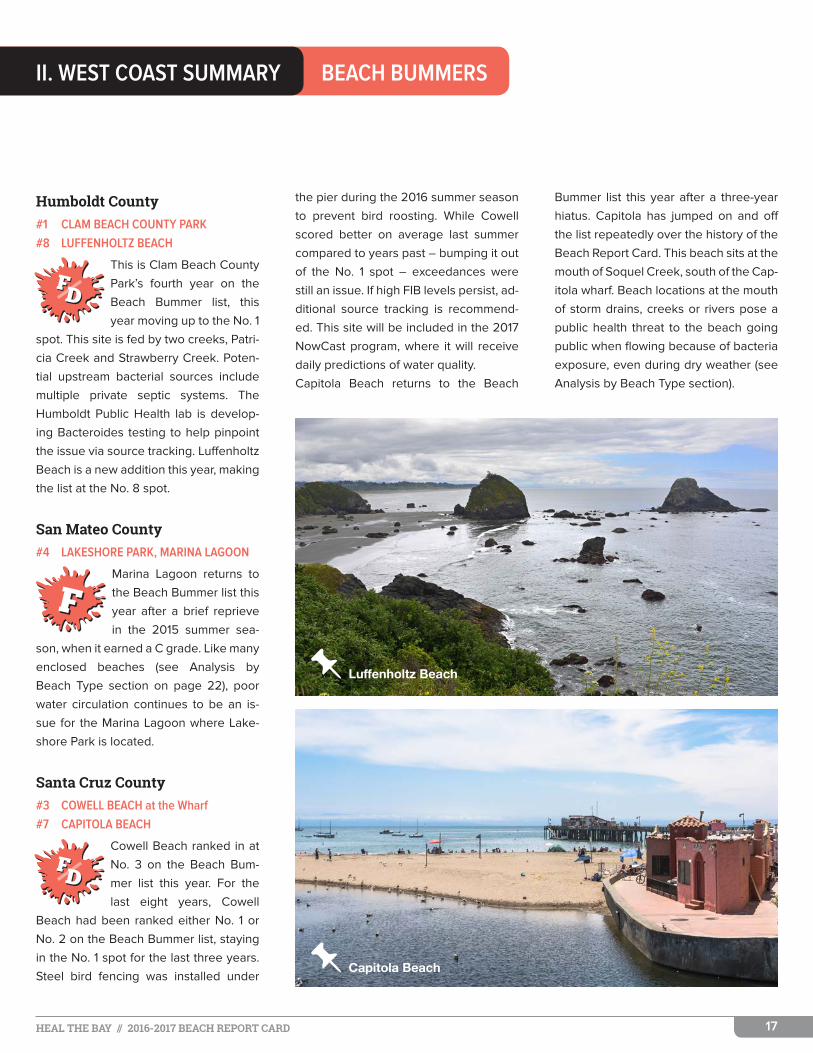
the issue via source tracking. Luffenholtz
Beach is a new addition this year, making
the list at the No. 8 spot.
San Mateo County #4 LAKESHORE PARK, MARINA LAGOON
Marina Lagoon returns to
the Beach Bummer list this
year after a brief reprieve
in the 2015 summer sea-
son, when it earned a C grade. Like many
enclosed beaches (see Analysis by
Beach Type section on page 22), poor
water circulation continues to be an is-
sue for the Marina Lagoon where Lake-
shore Park is located.
Santa Cruz County #3 COWELL BEACH at the Wharf
#7 CAPITOLA BEACH
Cowell Beach ranked in at
No. 3 on the Beach Bum-
mer list this year. For the
last eight years, Cowell
Beach had been ranked either No. 1 or
No. 2 on the Beach Bummer list, staying
in the No. 1 spot for the last three years.
Steel bird fencing was installed under
the pier during the 2016 summer season
to prevent bird roosting. While Cowell
scored better on average last summer
compared to years past – bumping it out
of the No. 1 spot – exceedances were
still an issue. If high FIB levels persist, ad-
ditional source tracking is recommend-
ed. This site will be included in the 2017
NowCast program, where it will receive
daily predictions of water quality.
Capitola Beach returns to the Beach
BEACH BUMMERSII. WEST COAST SUMMARY
Bummer list this year after a three-year hiatus. Capitola has jumped on and off
the list repeatedly over the history of the
Beach Report Card. This beach sits at the
mouth of Soquel Creek, south of the Cap-
itola wharf. Beach locations at the mouth
of storm drains, creeks or rivers pose a
public health threat to the beach going
public when flowing because of bacteria
exposure, even during dry weather (see
Analysis by Beach Type section).
Capitola Beach
Luffenholtz Beach

18HEAL THE BAY // 2016-2017 BEACH REPORT CARD
Los Angeles County #6 SANTA MONICA PIER
#9 MOTHER’S BEACH, MARINA DEL REY
Despite many projects to improve beach water qual-
ity, the Santa Monica Pier
continues to stay on the
Beach Bummer list, ranking in at No. 6
this year. A 2011 to 2012 study from Heal
the Bay, City of Santa Monica and UCLA
found that (1) conditions under the pier
(moisture and lack of sunlight) promote
bacterial persistence, (2) bird specific
bacteria were detected and (3) human
specific bacteria were undetected.
Through a Clean Beaches Initiative (CBI)
grant, the city will start construction in
2017 on a 1.6 million gallon underground
storage stormwater tank that will capture
wet weather runoff that drains to the
Santa Monica Pier storm drain. The
stored runoff will supply water to the
Santa Monica Urban Runoff Recycling
BEACH BUMMERSII. WEST COAST SUMMARY
Facility (SMURRF) during dry weather.
When completed, the project is expect-
ed to greatly reduce the amount of
stormwater that enters Santa Monica
Bay from city streets and therefore im-
prove water quality at the pier. The
SMURRF can process up to 500,000 gal-
lons a day of runoff at this time, which is
equal to five percent (5%) of the city’s
daily use.
With another year of poor water quality,
Mother’s Beach (between the tower and
dock) in Marina del Rey has once again
landed a place on the Beach Bummer
list, though the D that it earned in sum-
mer 2016 was better than the straight F’s
the site had seen for the previous three
years. As with most enclosed waterbod-
ies throughout the state (see Analysis by
Beach Type section), poor water quality
is exacerbated in areas with poor water
circulation. Unfortunately, the projects to
improve water quality at Mother’s Beach
have not fully resolved the water quality
issues. Such projects include a circula-
tion device to improve water flow, bird
deterrent wires and signage to discour-
age the public from feeding birds or
bringing their dogs to the beach.
Orange County #2 SAN CLEMENTE PIER
#10 MONARCH BEACH, DANA POINT
The two Orange County bummer sites
are combination of a new and an old
addition to this year’s list. The San Cle-
mente Pier site was a new “point zero”—
meaning the point on the
beach where the stream,
creek, river, or storm drain
discharge meets the ocean
water—addition to Orange County moni-
toring program in 2015. Because of the
numerous exceedances at the Pier, the
County implemented an adaptive sam-
pling program for this location, adding
monitoring stations 25 feet and 75 feet
both upcoast and downcoast of the pier.
Results at the point zero sample site at
the pier have generally been below stan-
dards, but the upcoast and downcoast
locations meet standards the majority
of the time. In addition, the County has
conducted genetic marker testing for ca-
nine and human sources, finding none
to date. Although additional studies are
planned to identify the source of con-
tamination, it should be noted that swim-
ming, surfing, and diving are already pro-
hibited below the pier.
As for Monarch Beach, water quality still
remains problematic at this site. There
was a slight improvement in summer wa-
ter quality compared to last year—rank-
ing No. 4 on the 2016 Beach Bummer list,
but not enough to move this site off the
list completely. The City of Dana Point
has invested in an Ozone Treatment Fa-Mother's Beach, Marina del Rey
Beach Bummers (continued)

19HEAL THE BAY // 2016-2017 BEACH REPORT CARD
BEACH BUMMERSII. WEST COAST SUMMARY
cility that treats dry weather runoff from
May through November. Local agencies
still remain concerned about the mean-
dering portion of Salt Creek. The treated
runoff is then returned to Salt Creek just
prior to reaching the ocean. Unfortu-
nately, like most natural creek systems
flowing to the ocean, creeks often mean-
der, rather than flowing in a straight path
to the sea. The local agencies have ar-
gued that the meandering portion of Salt
Creek has facilitated a greater bird popu-
lation, and in turn increased the amount
of bird feces at this location—ultimately
leading to the poor water quality.
In addition, a falconry program was imple-
mented to reduce bird-related FIB counts
at the mouth of the creek. The program
remained active until the end of the AB411
season. Due to its potential harm to fed-
erally threatened snowy plovers during
their nesting season, Heal the Bay sup-
ported the decision to end the program at
its scheduled completion date.
San Diego County #5 LA JOLLA COVE
San Diego’s La Jolla Cove was also a new addition to
the Bummer list this year.
Agency staff who monitor
water quality in the area noted anecdot-
ally an increase in seal and sea lion activ-
ity at the site. Whether or not the seals
and sea lions are a contributing factor to
these high counts—additional studies
would need to confirm, it is likely that the
cove-like conditions exacerbate poor
water quality, much like at an enclosed
waterbody site.
Other Beach Bummers/ Places Of Concern:
• Newport Bay at Abalone Avenue• Long Beach, proj. of Coronado Ave.• Arroyo Burro Beach, Santa Barbara*
• Linda Mar Beach, Pacifica• Keller Beach, Richmond* (*full year’s data incomplete)
Updates From Last Year: Last year's Beach Bummers that
have not repeated are: • Shelter Island, San Diego (#3)
• Redondo Beach Pier (#7) • Candlestick Point (#8)
• Pillar Point Harbor (#9) • Pismo Beach Pier (#10)
La Jolla Cove
Monarch Beach at Salt Creek
Beach Bummers (continued)

20HEAL THE BAY // 2016-2017 BEACH REPORT CARD
BEACH BUMMERSII. WEST COAST SUMMARY
2016-17 Beach Bummer County
2016-17 2015-16 2014-15 2013-14 2012-13
SummerDry
WinterDry
WetWeather
SummerDry
WinterDry
WetWeather
SummerDry
WinterDry
WetWeather
SummerDry
WinterDry
WetWeather
SummerDry
WinterDry
WetWeather
1 Clam Beach County Park Humboldt F n/a F F n/a F F n/a n/a D n/a n/a A n/a n/a
2 San Clemente Pier San Diego F F C B A n/a A A A A A A+ A A+ A+
3 Cowell Beach, Santa Cruz Santa Cruz F A F F A+ D F F C F n/a A+ F n/a n/a
4 Lakeshore Park, Marina Lagoon San Mateo F B F C B F F C F F F F D F F
5 La Jolla Cove San Diego D n/a D B B A+ A n/a A+ A A+ A+ n/a n/a n/a
6 Santa Monica Pier Los Angeles D F F F F F F F F D F F B F F
7 Capitola Beach (west of jetty) Santa Cruz D F F C A D C F F C A F C D F
8 Luffenholtz Beach Humboldt D n/a C C n/a D A n/a n/a A n/a n/a A n/a n/a
9 Mother’s Beach, Marina del Rey Los Angeles D F F F F F F F F F F F A F F
10 Monarch Beach, Dana Point Orange D F F F F F B A B A+ B A+ A B A+
... Newport Bay @ Abalone Ave. Orange F A C A A+ F A A+ D A A+ A+ A A A
... Long Beach @ Coronado Ave. Los Angeles C B F A A F A A F B A F C A B
... Linda Mar Beach, Pacifica San Mateo C A F A C F B C F A A+ D A A D
... Keller Beach, North Contra Costa C n/a D B n/a A A n/a A A n/a A A n/a A
PLEASE NOTE: Starting in 2015, the SWRCB required all coastal counties receiving state funds to monitor their beaches at point zero – where the discharge meets the ocean. Prior to monitoring year 2015-16, only Los Angeles County (and portions of Orange, San Diego, and Humboldt Counties) sampled directly at the outfall, which gives the most accurate picture of water quality.
TABLE 2-4: 2016-17 BEACH BUMMERS – FIVE YEAR HISTORYMost of 2016-17's Beach Bummers have a history of water quality problems.

21HEAL THE BAY // 2016-2017 BEACH REPORT CARD
TABLE 2-5: CALIFORNIA’S TROUBLED BEACHES (SUMMER GRADES, 2008-2017)These beaches that have turned up more than once on Beach Bummer lists since 2008 due to poor summer grades. Bold denotes current 2016-17 Beach Bummer.*See Table 2-2 on page 13 for "Water Quality Improvement".
Beach/County 2016-17 2015-16 2014-15 2013-14 2012-13 2011-12 2010-11 2009-10 2008-09
Clam Beach County Park Humboldt F F F D A B A A A
Candlestick Point, Windsufers Circle San Francisco B C C C C B D A A
Candlestick Point, Sunnydale Cove San Francisco A D F B A A D B A
Baker Beach @ Lobo Creek San Francisco B B C C C B F F F
Keller Beach North Contra Costa C B A A A B F D F
Pillar Point Harbor San Mateo B D B C A D D A A
Marina Lagoon, Lakeshore Park San Mateo B C F F F F D F B
Marina Lagoon, Aquatic Park San Mateo F C F F D F D D D
Cowell Beach Santa Cruz F F F F F F F F C
Capitola Beach, west of Jetty Santa Cruz D C C C C F F F C
Stillwater Cove, Monterey Bay Monterey A A D D C D C A A
Pismo Beach Pier San Luis Obispo B D A C A B F C F
Malibu Pier Los Angeles n/a n/a A C F F B B B
Santa Monica Pier Los Angeles D F F D B A A F F
Mother’s Beach, Marina del Rey Los Angeles D F F F A A A B A
Redondo Beach Pier * Los Angeles A F B A C B B B B
Cabrillo Beach, at restrooms * Los Angeles B A D F F F F F F
Avalon, midpoint, Catalina Island * Los Angeles A B C C F F F F F
Monarch Beach, Dana Point Orange D F B A+ A A A A A
Doheny State Beach, north Orange B B A A D B F B A
BEACH BUMMERSII. WEST COAST SUMMARY
PLEASE NOTE: Starting in 2015, the SWRCB required all coastal counties receiving state funds to monitor their beaches at point zero – where the discharge meets the ocean. Prior to monitoring year 2015-16, only Los Angeles County (and portions of Orange, San Diego, and Humboldt Counties) sampled directly at the outfall, which gives the most accurate picture of water quality.

22HEAL THE BAY // 2016-2017 BEACH REPORT CARD
ANALYSIS BY BEACH TYPEII. WEST COAST SUMMARY
OPEN OCEAN VS. STORM DRAIN VS. ENCLOSED BEACHES
California’s beach grades were separated
and compared by beach type to determine
if differences existed in water quality at
various beaches.
Beaches were divided into three categories:
1) Open Ocean beaches
2) Storm Drain-impacted beaches
3) Enclosed Beaches
Grades were separated for all three time periods:
1) Summer Dry season (April through October)
2) Winter Dry weather (November through March)
3) Year-round Wet Weather conditions
2016-17 Beaches
with Good (A or B) Grades Open Ocean
BeachesStorm Drain
ImpactedEnclosed
Waterbodies
Summer Dry
100% 95% 95%
Winter Dry
93% 88% 88%
Wet Weather
66% 52% 28%
23HEAL THE BAY // 2016-2017 BEACH REPORT CARD
ANALYSIS BY BEACH TYPEII. WEST COAST SUMMARY
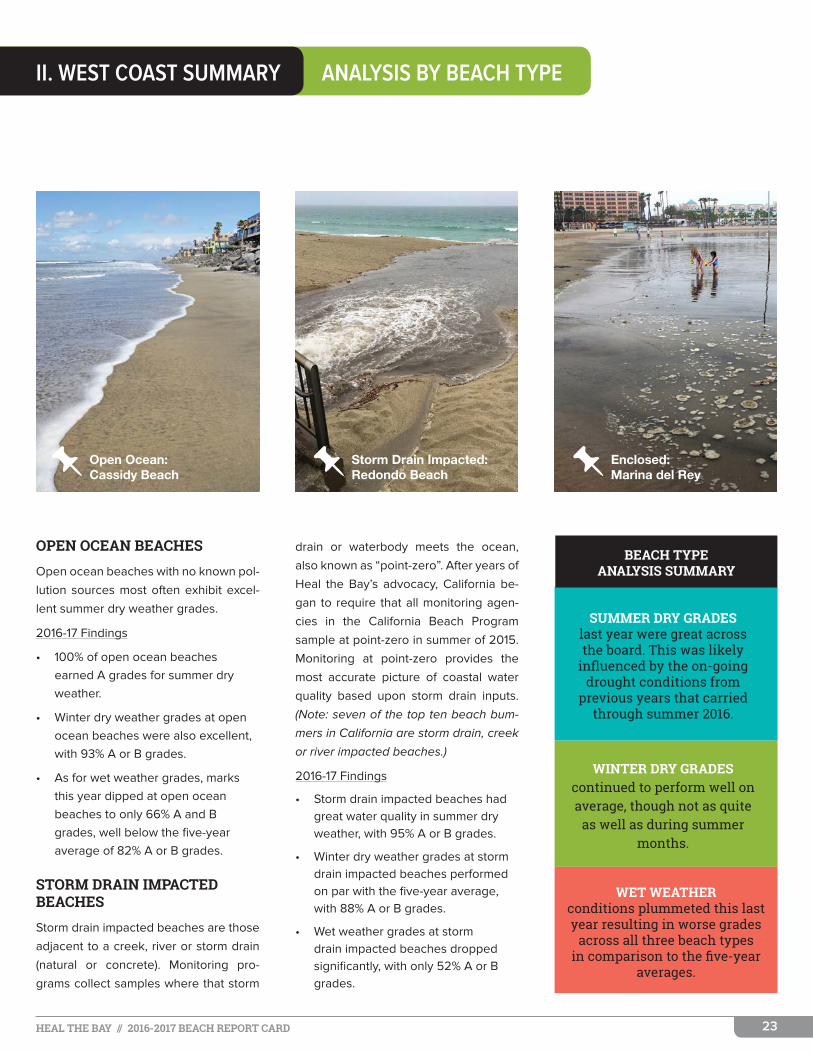
OPEN OCEAN BEACHESOpen ocean beaches with no known pol-
lution sources most often exhibit excel-
lent summer dry weather grades.
2016-17 Findings
• 100% of open ocean beaches earned A grades for summer dry weather.
• Winter dry weather grades at open ocean beaches were also excellent, with 93% A or B grades.
• As for wet weather grades, marks this year dipped at open ocean beaches to only 66% A and B grades, well below the five-year average of 82% A or B grades.
STORM DRAIN IMPACTED BEACHESStorm drain impacted beaches are those
adjacent to a creek, river or storm drain
(natural or concrete). Monitoring pro-
grams collect samples where that storm
WINTER DRY GRADES continued to perform well on average, though not as quite
as well as during summer months.
WET WEATHER conditions plummeted this last year resulting in worse grades
across all three beach types in comparison to the five-year
averages.
SUMMER DRY GRADES last year were great across the board. This was likely
influenced by the on-going drought conditions from
previous years that carried through summer 2016.
BEACH TYPE ANALYSIS SUMMARY
Open Ocean:Cassidy Beach
drain or waterbody meets the ocean,
also known as “point-zero”. After years of
Heal the Bay’s advocacy, California be-
gan to require that all monitoring agen-
cies in the California Beach Program
sample at point-zero in summer of 2015.
Monitoring at point-zero provides the
most accurate picture of coastal water
quality based upon storm drain inputs.
(Note: seven of the top ten beach bum-
mers in California are storm drain, creek
or river impacted beaches.)
2016-17 Findings
• Storm drain impacted beaches had great water quality in summer dry weather, with 95% A or B grades.
• Winter dry weather grades at storm drain impacted beaches performed on par with the five-year average, with 88% A or B grades.
• Wet weather grades at storm drain impacted beaches dropped significantly, with only 52% A or B grades.
Storm Drain Impacted:Redondo Beach
Enclosed:Marina del Rey

24HEAL THE BAY // 2016-2017 BEACH REPORT CARD
FIGURE 2-9: GRADES BY TIME PERIOD & BEACH TYPE
100% 99% 95% 88% 95% 95%
1% 5%5% 5%
2016 5-Year Avg.
12%
2016 5-Year Avg. 2016 5-Year Avg.
Open Ocean (69 locations)
Storm Drain (199 locations)
Enclosed (74 locations)
SUMMER DRY GRADES (APRIL - OCTOBER 2016)
93% 98% 88% 82% 88% 88%
3%12%12% 12%
2016-17 5-Year Avg.
18%
2016-17 5-Year Avg. 2016-17 5-Year Avg.
Open Ocean (68 locations)
Storm Drain (161 locations)
Enclosed (52 locations)
WINTER DRY GRADES (NOVEMBER 2016 - MARCH 2017)
7%
66% 82% 28% 30% 52% 66%
18%
72%
48%34%
2016-17 5-Year Avg.
70%
2016-17 5-Year Avg. 2016-17 5-Year Avg.
Open Ocean (71 locations)
Storm Drain (212 locations)
Enclosed (69 locations)
WET WEATHER GRADES (APRIL 2016 - MARCH 2017)
34%
ANALYSIS BY BEACH TYPEII. WEST COAST SUMMARY
ENCLOSED BEACHESEnclosed beaches are those waterbodies with
poor circulation and flushing mechanics- typically
lagoons, marinas, family-oriented beaches (aka
"baby beach”, mother's beach" or "kiddie beach")
and harbors. Swimming at these locations can be
a cause for concern, especially for the young chil-
dren that frequent them. Poor circulation and high
residence times means that it takes longer for pol-
luted water to mix with cleaner water, which then
allows bacteria levels to remain elevated for ex-
tended periods of time. As for wet weather, there
is no worse place to swim by beach type than at an
enclosed beach. (Note: three of the top ten beach
bummers in California are enclosed beaches.)
2016-17 Findings
• Summer dry weather at enclosed beaches reached another new high this year, with 95%
A or B grades, which bested the five-year
average of 88%.
• Enclosed beaches also scored well during winter dry weather, with 88% A or B grades.
• Wet weather grades were extremely poor this year, with only 28% of enclosed beaches
receiving A or B grades.
Beach Types (continued)
: A+B GRADES : C+D+F GRADES

| BEACH NEWS |
26HEAL THE BAY // 2016-2017 BEACH REPORT CARD
FUNDING: FEDERAL BEACH ACTThe BEACH Act is crucial to protecting the public health of beachgoers across all coast-al and Great Lakes bordering states. Many state beach programs run solely on federal funds, with states required to implement beach monitoring programs only when federal funding is provided. With more than 90 million annual beachgoers nationwide, the loss of this funding jeopardizes public health protection. Each year, the federal Beach Program provides approximately $365,000 to California to support the state’s beach water quality monitoring. Beach tourism and coastal recreation in California are valued at close to $90 billion, so it makes fiscal and public health sense to invest $10 million per year through the BEACH Act grant program for beach monitoring throughout the U.S. to ensure that coastal resources continue to produce a utility and maintain functionality.
However, moving forward, future funding re-mains a concern, particularly when President Trump proposed a 31% reduction for the USE-PA budget. This action will certainly end the BEACH Act grant program. Since 2012, the BEACH Act programmatic budget has been eliminated from Presidential budgets (approximately $10 million/annually) even when the EPA’s overall budget was fairly stable. Fortunately, in past years, the Senate Appropria-tions Committee has reinstated the program’s funds back into the budget. However, with the current make-up of Congress, the BEACH Act funding is particularly vulnerable.
This is extremely concerning for two reasons: 1) many state beach programs are run completely on federal funds (such as Oregon) and 2) states are only legally required to implement beach programs when federal funding is provided. As such, the beach-going public is likely to be uninformed about local water quality conditions due to the lack of monitoring programs.
III. BEACH NEWS
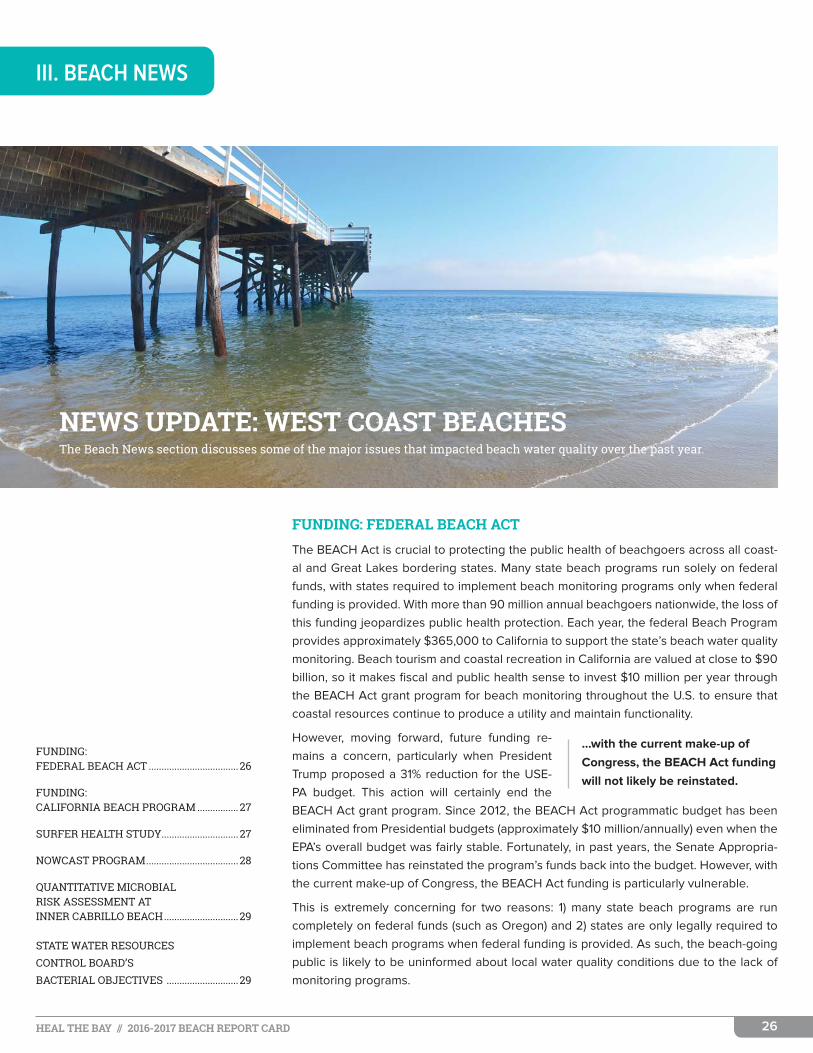
NEWS UPDATE: WEST COAST BEACHESThe Beach News section discusses some of the major issues that impacted beach water quality over the past year.
FUNDING: FEDERAL BEACH ACT ...................................26
FUNDING: CALIFORNIA BEACH PROGRAM ................ 27
SURFER HEALTH STUDY.............................. 27
NOWCAST PROGRAM ....................................28
QUANTITATIVE MICROBIAL RISK ASSESSMENT AT INNER CABRILLO BEACH .............................29
STATE WATER RESOURCES CONTROL BOARD’S BACTERIAL OBJECTIVES ............................29
...with the current make-up of Congress, the BEACH Act funding will not likely be reinstated.

27HEAL THE BAY // 2016-2017 BEACH REPORT CARD
FUNDING: CALIFORNIA’S BEACH PROGRAM The State Water Resources Control Board
(SWRCB) has administered the California
Beach Program for the past six years. The
California Beach Program is the imple-
menting tool for the state requirement that
ocean or bay water at swimming beaches
be routinely tested for Fecal Indicator Bac-
teria (FIB), so long as State Funds are avail-
able. This year, the SWRCB will provide
$1.8 million dollars to seventeen California
counties, who sampled over 420 monitor-
ing stations annually across 291 beaches,
collecting over 28,000 samples.
Heal the Bay continues to advocate to the
SWRCB for the California Beach Program
to include the following elements as part of
county monitoring plans:
• Agencies must continue to monitor at least 80% of the locations that were monitored prior to the 2008 state budget cuts.
• Sampling frequency should increase with beach use and/or public health risk. For example, high-risk beaches (high beach use and close proximity to a potential pollution source) should be sampled three to five times per week.
• Public notification of water quality should occur immediately after sampling results are available.
• Monitoring agencies and dischargers should be required to work together to streamline and enhance coastal monitoring for year-round public health protection.
• Chronically polluted or high-risk beaches with continuous bacteria exceedances should be permanently posted.
III. BEACH NEWS
THE SURFER HEALTH STUDYThe Southern California Coastal Water Research Project (SCCWRP) released a “Surfer
Health Study” in 2016. From 2013-15, during winter seasons, SCCWRP partnered with
UC Berkeley School of Public Health, Surfrider Foundation and Soller Environmental
to study whether surfing was related to a higher rate of illness and how those rates
changed in dry or wet weather. The study looked at two beaches in San Diego: Ocean
Beach at the mouth of the San Diego River and Tourmaline Surfing Park at the mouth
of Tourmaline Creek.
We do not recommend citing the study as a reason to create less health protective ob-
jectives for these two locations. For one, the population (only surfers over the age of
18 who were English speaking) examined in this study should be considered too nar-
row to influence public health standards that are in place to protect all potential beach
users. Furthermore, samples of stormwater discharged from both sites identified the
presence of human pathogens, a serious water quality concern for ocean users at
those locations, and a clear indication of upstream issues in both locations that have
not yet been resolved.
Most concerning however, were the contradictions within the report regarding rec-
ommendations on whether these results should be compared to USEPA guidelines
in order to determine potential new standards. The report states both that the study,
“provides the technical foundation for policy makers to discuss new, wet-weather-spe-
cific water quality standards,” and then later states, “Surfers also spend most of their
time offshore in large waves and spend relatively little time in shallow water near the
beach. Due to these differences, we recommend caution in the direct comparison of
risk estimates from this study with USEPA guidelines.” Heal the Bay agrees that due
to the narrow population in the study, extreme caution needs to be used with study
results and does not recommend comparison of study results with the USEPA bacterial
objectives in order to reduce objectives set to protect the public health of all types of
beach goers.
Ocean Beach

28HEAL THE BAY // 2016-2017 BEACH REPORT CARD
III. BEACH NEWS
NOWCAST PROGRAMLast summer, Heal the Bay, Stanford Uni-
versity and UCLA expanded the predic-
tive modeling program from three to five
Southern California beaches from July
through October. The five beaches mod-
eled in 2016:
• Arroyo Burro (Santa Barbara County)
• East Beach (Santa Barbara County)
• Santa Monica Pier (Los Angeles County)
• Belmont Pier (Long Beach City)
• Doheny State Beach (Orange County)
Predictive models, or beach water qual-
ity ’Nowcasting’ tools, are designed to
predict daily water quality based upon
historic data and location specific infor-
mation for a defined beach.
The models can be used to inform the
public about water quality conditions on
a given day for a particular beach. These
‘NowCasts’ can be produced much fast-
er than the current public notification
methods, which rely on analytical meth-
ods that can take 18-24 hours to produce
results. This delay in the existing system
can lead to inadvertently not posting a
beach advisory, which may put public
health at risk, or alternatively, inappro-
priate advisories that may keep people
away from enjoying a clean beach.
Being able to run the model rapidly and
daily helps close the notification gap
regarding water quality, thus helping to
protect public health every day in a more
robust manner than the current testing
methods.
After Heal the Bay’s successful pilot proj-
ect in 2015, the organization was fortu-
nate enough to receive another Clean
Beach Initiative (CBI) grant to again part-
ner with Stanford University and UCLA
through a third phase.
The NowCast program will continue to
expand, with the goal of becoming a per-
manent part of the Beach Report Card
program over the next two years. The
program will grow to 20-25 locations
in the next two years with a handful of
surf beaches modeled during the winter
season for additional public health pro-
tection.
During the summer 2017 season, ten
beaches will have predictive models run-
ning daily from April through October.
(Figure 3-1)
Cowell Beach
FIGURE 3-1:2017 SUMMER
NOWCAST LOCATIONS
• Moonlight Beach, Encinitas
SAN DIEGO COUNTY
• Doheny State Beach
ORANGE COUNTY
• Huntington State Beach
ORANGE COUNTY
• Belmont Pier, Long Beach
LOS ANGELES COUNTY
• Long Beach City Beach at 5th Pl.
LOS ANGELES COUNTY
• Redondo Pier (100 yards south)
LOS ANGELES COUNTY
• Santa Monica Pier
LOS ANGELES COUNTY
• Arroyo Burro
SANTA BARBARA COUNTY
• East Beach
SANTA BARBARA COUNTY
• Cowell Beach
SANTA CRUZ COUNTY

29HEAL THE BAY // 2016-2017 BEACH REPORT CARD
III. BEACH NEWS
QUANTITATIVE MICROBIAL RISK ASSESSMENT AT INNER CABRILLO BEACHLast summer saw the kick-off of the Inner Cabrillo Beach (ICB) Quanti-
tative Microbial Risk Assessment (QMRA) study led by Southern Cali-
fornia Coastal Water Research Project (SCCWRP). The goal of QMRA
studies in general is to assess the risk of gastrointestinal illness for
people recreating at a specific location based on measurements of
bacteria and pathogens at the site and, according to USEPA guide-
lines, is designed for use in places where bacterial contamination is
not human in origin. By comparing the risk of illness calculated for the
site to USEPA-determined acceptable risk limits, water quality stan-
dards for bacteria may be altered for that site. The ICB QMRA, if com-
pleted, would be the first QMRA study at a beach in the state. Heal
the Bay is taking part in the Technical Advisory Committee along with
other ICB stakeholders. The first phase of the study was completed
last summer and indicated high levels of fecal indicator bacteria, as
well as the presence of bacteria specifically from human sources. As
a result, focus of the study has shifted to identifying potential sources
of this bacteria and addressing them.
STATE WATER RESOURCES CONTROL BOARD’S BACTERIAL OBJECTIVES For the past three years, the State Water
Resources Control Board (SWRCB) has
indicated that they plan to amend the
state’s bacterial objectives in the Califor-
nia Ocean Plan and the Inland Surface
Water, Enclosed Bays and Estuaries Plan.
A draft of the staff report was supposed
to be released last summer for public re-
view and comment. However, the State
delayed the release and revised the
timeframe. The draft objectives were
released in June 2017, with a hearing
scheduled for July 2017, and the goal of
policy adoption by November 2017. Heal
the Bay staff have been tracking the is-
sue and are reviewing the draft objec-
tives to make recommendations to the
SWRCB to ensure the strongest public
health protection possible.
The goal of this process is to update
two statewide policies that protect rec-
reational users from the risks of swim-
ming in fecal contaminated waterbodies.
There are 11 elements to the SWRCB pro-
posed update that have major impacts to
protecting beachgoer health. Three of
the 11 elements are of serious concern
to Heal the Bay: 1) the recommendation
to use a single fecal indicator, Enterococ-
cus, to determine risk; 2) the suspension
of Recreational 1-uses (Rec-1)—swimming
or wading in the water—during high flow
suspension within rivers and creeks and
3) the allowance for a variance, seasonal
suspension or limited Rec-1 water con-
tact. Each of these three elements has
implications for reducing public health
protection for swimmers in recreational
waters. For example, California currently
uses seven FIB criteria that are associ-
ated with different health outcomes (up-
per respiratory, skin rash, flu-like symp-
toms and intestinal ailments) compared
to USEPA’s two criteria, which are associ-
ated with mostly intestinal ailments.
Cabrillo Beach

| COUNTY SUMMARIES |

31HEAL THE BAY // 2016-2017 BEACH REPORT CARD
Heal the Bay provides Beach Report Card grades for all coastal
counties in California from Del Norte down to San Diego. The following
section is a brief summary of each county’s monitoring program over
the past year, water quality grades, the number of sewage spills to
reach a receiving waterbody and the number of beach closures due to
sewage spills.
Heal the Bay provides an AB411 (summer) dry grade for a beach if the public agency
collected samples for at least 75% of the monitoring time-period. Given that there were
about 30 weeks between April 1st and October 31st, then there had to be at least 23
weekly samples collected to be provided a grade. The same threshold of 75% is used for
winter grades. Wet weather grades are based on any samples taken during either sum-
mer or winter seasons within 72 hours of a rain event of at least 0.1 inches.
For rain events across the state, the difference in frequency of events between counties
makes it impossible to determine a minimum sampling threshold for grade generation.
Thus, Heal the Bay generates a grade for wet weather regardless of the sample size. This
enables beachgoers to see differences in dry versus wet weather water quality.
IV. CALIFORNIA COUNTY SUMMARIES
OVERVIEW OF COASTAL COUNTIES
CALIFORNIA COUNTY SUMMARIES ..................................................... 32
OREGON COUNTY SUMMARIES .....................................................48
WASINGTON COUNTY SUMMARIES .....................................................48
All California Sewage Summary data came from the California State Water Resource Control Board and/or the respective Health Departments.

32HEAL THE BAY // 2016-2017 BEACH REPORT CARD
SAN DIEGO
San Diego County Grades
2016-2017 5-Year Avg. (2011-2016)
Summer Dry* Winter Dry Wet Weather Summer Dry* Winter Dry Wet Weather
# % # % # % # % # % # %
A 71 95% 33 79% 37 56% 67 93% 40 92% 38 72%
B 2 3% 2 5% 8 12% 3 4% 1 3% 5 9%
C 1 1% 1 2% 6 9% 1 1% 0 0% 2 5%
D 1 1% 0 0% 7 11% 0 0% 1 2% 2 3%
F 0 0% 6 14% 8 12% 0 0% 1 2% 6 12%
Total 75 42 66 72 44 53
*State AB411 monitoring April thru October. Percentages may not add up to 100 due to rounding.
Sewage Spills Summary
28 SEWAGE SPILLS were reported to have reached a waterbody in
San Diego County
8 Major Spills
(10,000+ gallons) 1,200,361 GALLONS OF SEWAGE
Total Volume reported to have reached
waterbody in San Diego County
5 health
warnings
10 Minor Spills
(1-10,000 gallons)
6 beach
closures10
Small Spills (<1,000 gallons)
Beach Bummers
Summer Dry
Winter Dry
Wet Weather
La Jolla Cove D n/a D
San Diego County
SUMMARY:
• Summer dry weather grades were excellent with 97% of sites receiving A and B grades.
• Beaches performed well on average during the winter dry period with 83% scoring A and B grades. However, the 83% A and B grades marked a dip in water quality to the five-year average of 95%.
• Wet weather grades took a hit and dropped from the five-year average of 81% to only 68% of locations receiving A and B grades.
• San Diego had one Beach Bummer during the summer 2016 season: – La Jolla Cove in the No. 5 spot.
For more on the 2016-17 Beach Bummers see page 16.
FURTHER INSIGHT:
• Winter dry weather grades can reflect poor water quality longer than the 72-hour period that is recommended to avoid water contact following a significant rain event.
• Heal the Bay recommends that the 72-hour rule be used by the public as a minimum timeframe to stay out of the water for health protection.
• Moonlight Beach in the City of Encinatas will be included in the 2017 NowCasting program, receiving daily water quality predictions from June through October.
• Moving off last summer’s beach bummer list, water quality improved at Shoreline Beach Park, Shelter Island this past summer season with a B grade.
RAINFALL
• This was a heavy rain year in San Diego in comparison to the 7-8” average rainfall for the county over the last 5-10 years.
• Rainfall volumes across San Diego spanned from 12.73” to 17.93” depending on the rain gauge used for analysis (DEMX, SAN and NFG). Depending on the gauge, this was either in line with or quite a few inches over the 10.4” average for the county from 1981-2010.
SEWAGE SPILL NOTES
• There were 28 reported sewage spills for the county, totaling about 1.6 million gallons. Of these spills, eight were “major,” ten were “minor” and the final ten were “small.” From these sewage spills about 1.2 million gallons reached a surface waterbody.
• This year, contaminated runoff from the Tijuana River resulted in 21 separate closure events with different distances and durations.
Honor Roll
Summer Dry
Winter Dry
Wet Weather
Carlsbad (five monitored locations) A+ A+ A+
Encinitas, San Elijo State Park (two locations) A+ A+ A+
Cardiff State Beach (two locations) A+ A+ A+
Solana Beach, Fletcher Cove, Lomas Santa Fe Dr. A+ A+ A+
Point Loma Lighthouse A+ A+ A+
IV. CALIFORNIA COUNTY SUMMARIES
REFERENCES: A complete list of grades for the county’s beach monitoring locations can be found in Appendix B1. Samples were collected throughout the year along open coastal and bay beaches.
MONITORING AGENCIES: The City of Oceanside, The City of San Diego, Encina Wastewater Authority, San Elijo Joint Powers Authority, Port of San Diego, The County of San Diego Department of Environmental Health (DEH).
FOR ADDITIONAL WATER QUALITY INFORMATION: County of San Diego Department of Environmental Health www.sdbeachinfo.com

33HEAL THE BAY // 2016-2017 BEACH REPORT CARD
Honor Roll
Summer Dry
Winter Dry
Wet Weather
Balboa Pier A+ A+ A+
The Wedge A+ A+ A+
Crystal Cove State Park (two monitored locations) A+ A+ A+
Laguna Beach (seven monitored locations) A+ A+ A+
Dana Point, projection of Camino Estrella A+ A+ A+
Dana Point, South Capistrano Bay Comm. Beach A+ A+ A+
San Clemente, Poche Beach A+ A+ A+
ORANGE
Orange County
SUMMARY
• Orange County had another great year of summer dry weather grades with 97% of sites scoring A and B grades.
• Beaches also performed well overall in the county during winter dry weather, with 93% of locations receiving A and B grades.
• Wet weather grades took a large hit in Orange County over the last year with only 44% of beaches earning A or B grades.
• Two beach bummers were on the list this year in Orange County: – San Clemente Pier in the No. 2 spot – Monarch Beach, North Salt Creek in the No. 10 spot
FURTHER INSIGHT:
• Orange County had one location that scored an F grade for the summer season: Abalone Ave. Beach on Balboa Island in Newport Bay.
• Local agency officials believe the execeedances are related to 1) an abandoned small craft just offshore last year that was a roosting spot for birds and 2) waste from pets frequenting the beach.
• Very poor wet weather grades illustrate why California coastal health departments recommend swimmers stay out of the water for a minimum of three days following a rain event of at least 0.1 inches.
RAINFALL
• Rainfall in Orange County totaled 15.82” from April 2016 – March 2017.
• Given that the average rainfall over the past 5-10 years was between 5-8”, this past rainy season felt like a deluge.
• However, total rainfall volume over the last year was not that different than the 13.6” average for the county (1981-2010).
SEWAGE SPILL NOTES:
• There were 18 reported sewage spills in Orange County last year totaling 115,723 gallons.
• From these sewage spills about 109,000 gallons reached a surface waterbody.
• Of these spills, two were “major,” four were “minor” and 12 were “small.”
• These spills resulted in three individual beach closures.
REFERENCES: A complete list of grades for the county’s beach monitoring locations can be found in Appendix B1. Samples were collected throughout the year along open coastal and bay beaches.
MONITORING AGENCIES: Orange County Environmental Health, South Orange County Wastewater Authority, Orange County Sanitation District (OCSD).
FOR ADDITIONAL WATER QUALITY INFORMATION: County of Orange Environmental Health Division www.ocbeachinfo.com
Orange County Grades
2016-2017 5-Year Avg. (2011-2016)
Summer Dry* Winter Dry Wet Weather Summer Dry* Winter Dry Wet Weather
# % # % # % # % # % # %
A 111 95% 93 85% 38 32% 95 91% 76 82% 46 49%
B 3 3% 7 7% 14 12% 6 6% 9 10% 10 11%
C 0 0% 2 2% 15 13% 2 2% 3 3% 9 10%
D 1 1% 0 0% 17 14% 1 1% 1 1% 6 6%
F 2 2% 6 6% 34 29% 1 1% 4 4% 23 24%
Total 117 109 118 104 93 94
*State AB411 monitoring April thru October. Percentages may not add up to 100 due to rounding.
Beach Bummers
Summer Dry
Winter Dry
Wet Weather
Newport Bay, Abalone Avenue Beach F A C
Dana Point, Monarch Beach North D F F
San Clemente Pier F F C
IV. CALIFORNIA COUNTY SUMMARIES
Sewage Spills Summary
18 SEWAGE SPILLS were reported to have reached a waterbody in
Orange County
2 Major Spills
(10,000+ gallons) 109,287 GALLONS OF SEWAGE
Total Volume reported to have reached
waterbody in Orange County
3 health
warnings
4 Minor Spills
(1-10,000 gallons)
3 beach
closures12
Small Spills (<1,000 gallons)
34HEAL THE BAY // 2016-2017 BEACH REPORT CARD
Los Angeles County Grades
2016-2017 5-Year Avg. (2011-2016)
Summer Dry* Winter Dry Wet Weather Summer Dry* Winter Dry Wet Weather
# % # % # % # % # % # %
A 79 93% 62 76% 20 23% 68 76% 63 74% 27 31%
B 3 4% 9 11% 14 16% 11 13% 8 10% 11 13%
C 1 1% 7 9% 9 10% 4 4% 4 5% 9 11%
D 2 2% 1 1% 4 5% 1 2% 3 4% 5 6%
F 0 0% 3 4% 40 46% 5 6% 6 7% 34 39%
Total 85 82 87 90 85 87
*State AB411 monitoring April thru October. Percentages may not add up to 100 due to rounding.
Honor Roll
Summer Dry
Winter Dry
Wet Weather
Malibu, El Matador State Beach A+ A+ A+
Malibu Point A+ A+ A+
Palos Verdes Peninsula, Bluff Cove A+ A+ A+
Palos Verdes Peninsula, Portugese Bend A+ A+ A+
LOS ANGELES
Los Angeles County
SUMMARY
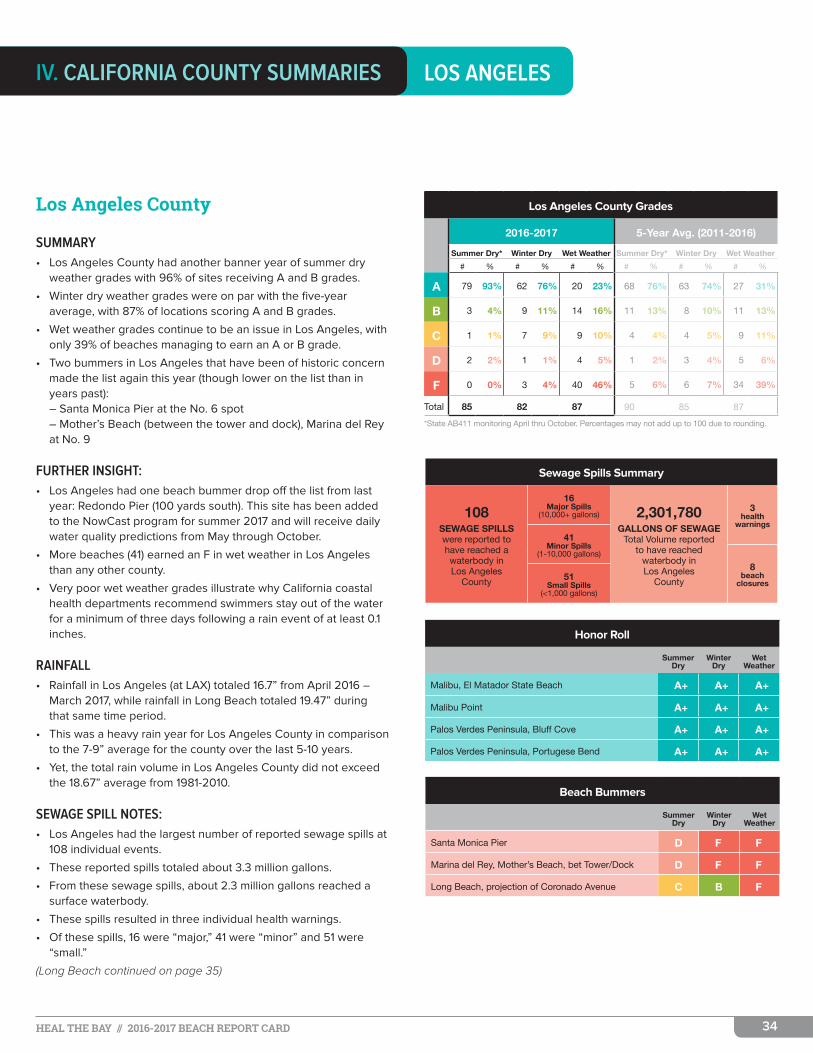
• Los Angeles County had another banner year of summer dry weather grades with 96% of sites receiving A and B grades.
• Winter dry weather grades were on par with the five-year average, with 87% of locations scoring A and B grades.
• Wet weather grades continue to be an issue in Los Angeles, with only 39% of beaches managing to earn an A or B grade.
• Two bummers in Los Angeles that have been of historic concern made the list again this year (though lower on the list than in years past): – Santa Monica Pier at the No. 6 spot – Mother’s Beach (between the tower and dock), Marina del Rey at No. 9
FURTHER INSIGHT:
• Los Angeles had one beach bummer drop off the list from last year: Redondo Pier (100 yards south). This site has been added to the NowCast program for summer 2017 and will receive daily water quality predictions from May through October.
• More beaches (41) earned an F in wet weather in Los Angeles than any other county.
• Very poor wet weather grades illustrate why California coastal health departments recommend swimmers stay out of the water for a minimum of three days following a rain event of at least 0.1 inches.
RAINFALL
• Rainfall in Los Angeles (at LAX) totaled 16.7” from April 2016 – March 2017, while rainfall in Long Beach totaled 19.47” during that same time period.
• This was a heavy rain year for Los Angeles County in comparison to the 7-9” average for the county over the last 5-10 years.
• Yet, the total rain volume in Los Angeles County did not exceed the 18.67” average from 1981-2010.
SEWAGE SPILL NOTES:
• Los Angeles had the largest number of reported sewage spills at 108 individual events.
• These reported spills totaled about 3.3 million gallons.
• From these sewage spills, about 2.3 million gallons reached a surface waterbody.
• These spills resulted in three individual health warnings.
• Of these spills, 16 were “major,” 41 were “minor” and 51 were “small.”
(Long Beach continued on page 35)
Beach Bummers
Summer Dry
Winter Dry
Wet Weather
Santa Monica Pier D F F
Marina del Rey, Mother’s Beach, bet Tower/Dock D F F
Long Beach, projection of Coronado Avenue C B F
IV. CALIFORNIA COUNTY SUMMARIES
Sewage Spills Summary
108 SEWAGE SPILLS were reported to have reached a waterbody in Los Angeles
County
16 Major Spills
(10,000+ gallons) 2,301,780 GALLONS OF SEWAGE
Total Volume reported to have reached
waterbody in Los Angeles
County
3 health
warnings
41 Minor Spills
(1-10,000 gallons)
8 beach
closures51
Small Spills (<1,000 gallons)
35HEAL THE BAY // 2016-2017 BEACH REPORT CARD
Long Beach Grades
2016-2017 5-Year Avg. (2011-2016)
Summer Dry* Winter Dry Wet Weather Summer Dry* Winter Dry Wet Weather
# % # % # % # % # % # %
A 11 85% 3 23% 0 0% 8 54% 12 86% 1 7%
B 1 8% 5 38% 0 0% 5 36% 1 7% 1 7%
C 1 8% 4 31% 0 0% 1 7% 1 7% 1 7%
D 0 0% 0 0% 0 0% 0 0% 0 0% 0 0%
F 0 0% 1 8% 13 100% 0 0% 0 0% 12 80%
Total 13 13 13 14 14 15
*State AB411 monitoring April thru October. Percentages may not add up to 100 due to rounding.
2016-17 2015-16 2014-15 2013-14 2012-13 2011-12 2010-11
SummerDry
WinterDry
WetWeather
SummerDry
WinterDry
WetWeather
SummerDry
WinterDry
WetWeather
SummerDry
WinterDry
WetWeather
SummerDry
WinterDry
WetWeather
SummerDry
WinterDry
WetWeather
SummerDry
WinterDry
WetWeather
Granada Avenue (Rosie’s Dog Beach) B C F B C F A A F C A F B A A A A F A B F
Prospect Avenue A B F A A F A A F B A F B A B B C F C A F
Belmont Pier (west side) A B F A A F A B F B A F C A B B A F C B F
Coronado Avenue C B F A A F A A F B A F C A B B B F C F F
Molino Avenue A C F A C F A A F B A F A A C B F F D A F
10th Place A C F A A F A A F B A F B A C B F F C A F
5th Place A C F A A F A B F B B F A A C B C F C A F
Rainfall 19.47" 7.31" 6.67" 4.81" 7.54" 6.74" 18.88"
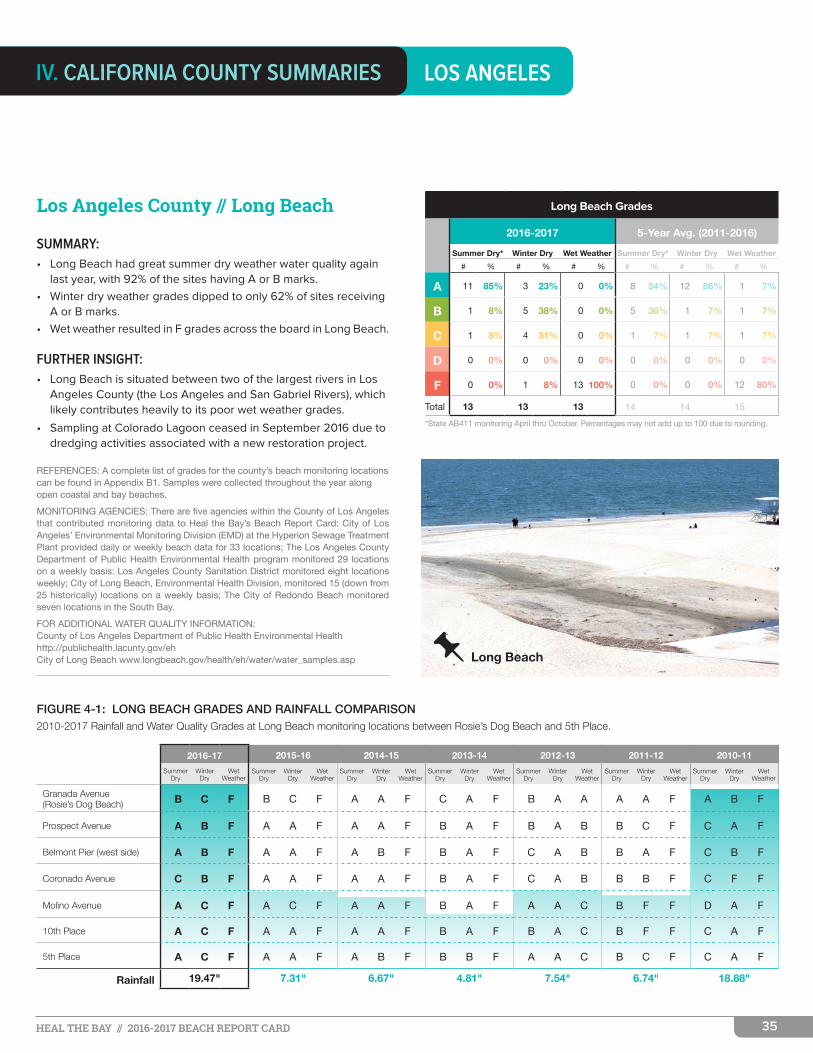
FIGURE 4-1: LONG BEACH GRADES AND RAINFALL COMPARISON2010-2017 Rainfall and Water Quality Grades at Long Beach monitoring locations between Rosie’s Dog Beach and 5th Place.
LOS ANGELESIV. CALIFORNIA COUNTY SUMMARIES
Los Angeles County // Long Beach
SUMMARY:
• Long Beach had great summer dry weather water quality again last year, with 92% of the sites having A or B marks.
• Winter dry weather grades dipped to only 62% of sites receiving A or B marks.
• Wet weather resulted in F grades across the board in Long Beach.
FURTHER INSIGHT:
• Long Beach is situated between two of the largest rivers in Los Angeles County (the Los Angeles and San Gabriel Rivers), which likely contributes heavily to its poor wet weather grades.
• Sampling at Colorado Lagoon ceased in September 2016 due to dredging activities associated with a new restoration project.
REFERENCES: A complete list of grades for the county’s beach monitoring locations can be found in Appendix B1. Samples were collected throughout the year along open coastal and bay beaches.
MONITORING AGENCIES: There are five agencies within the County of Los Angeles that contributed monitoring data to Heal the Bay’s Beach Report Card: City of Los Angeles’ Environmental Monitoring Division (EMD) at the Hyperion Sewage Treatment Plant provided daily or weekly beach data for 33 locations; The Los Angeles County Department of Public Health Environmental Health program monitored 29 locations on a weekly basis: Los Angeles County Sanitation District monitored eight locations weekly; City of Long Beach, Environmental Health Division, monitored 15 (down from 25 historically) locations on a weekly basis; The City of Redondo Beach monitored seven locations in the South Bay.
FOR ADDITIONAL WATER QUALITY INFORMATION: County of Los Angeles Department of Public Health Environmental Health http://publichealth.lacunty.gov/eh City of Long Beach www.longbeach.gov/health/eh/water/water_samples.asp Long Beach

36HEAL THE BAY // 2016-2017 BEACH REPORT CARD
VENTURA
Ventura County
SUMMARY:
• Ventura earned 100% A grades during summer dry weather for the 9th consecutive year.
• Ventura beaches also earned great grades during winter dry weather with only one beach not earning an A or B grade - Harbor Beach Park at the South end of Victoria Avenue earned a D grade.
• Wet weather water quality was again well above average, with 80% of the 40 sites earning A or B grades.
FURTHER INSIGHT
• 40 locations were monitored weekly from April - October 2016 and 19 locations year-round.
• Ventura County’s online sample data and lab reports regularly had value discrepencies. These were related to quality control issues.
RAINFALL
• Rainfall volumes in Ventura County spanned from 19.81” to 20.70” depending on the rain gauge used for analysis (OXR and VTU respectively).
• A small portion of this volume fell during summer months, but most of the rainfall (about 18”) occurred during the winter season.
SEWAGE SPILL NOTES:
• Ventura County only had one reported sewage spill according to SWRCB records, totaling about 17,000 gallons.
• About 16,000 gallons from this spill reached a surface waterbody, resulting in a health warning. This event ranked as a “major” spill.
REFERENCES: A complete list of grades for the county’s beach monitoring locations can be found in Appendix B1. Samples were collected throughout the year along open coastal and bay beaches.
FOR ADDITIONAL WATER QUALITY INFORMATION: Ventura County’s Environmental Health Division www.vcrma.org/envhealth
Honor Roll Grades
Summer Dry
Winter Dry
Wet Weather
Silverstrand, Sawtelle Avenue, south of drain A+ A+ A+
Ventura County Grades
2016-2017 5-Year Avg. (2011-2016)
Summer Dry* Winter Dry Wet Weather Summer Dry* Winter Dry Wet Weather
# % # % # % # % # % # %
A 40 100% 15 94% 28 70% 40 100% 16 100% 19 77%
B 0 0% 0 0% 4 10% 0 0% 0 0% 3 12%
C 0 0% 0 0% 5 13% 0 0% 0 0% 1 5%
D 0 0% 1 6% 1 3% 0 0% 0 0% 1 2%
F 0 0% 0 0% 2 5% 0 0% 0 0% 1 3%
Total 40 16 40 40 16 24
*State AB411 monitoring April thru October. Percentages may not add up to 100 due to rounding.
IV. CALIFORNIA COUNTY SUMMARIES
Sewage Spills Summary
1 SEWAGE SPILL was reported to have reached a waterbody in
Ventura County
1 Major Spill
(10,000+ gallons) 16,275 GALLONS OF SEWAGE
Total Volume reported to have reached
waterbody in Ventura County
1 health
warning
0 Minor Spills
(1-10,000 gallons)
0 beach
closures0
Small Spills (<1,000 gallons)
Ventura Pier

37HEAL THE BAY // 2016-2017 BEACH REPORT CARD
Beach Bummers
Summer Dry
Winter Dry
Wet Weather
Arroyo Burro Beach* n/a F F
SANTA BARBARA
Santa Barbara County
SUMMARY:
• Unfortunately, lab errors for a large portion of the summer season resulted in too few reliable samples for beaches in Santa Barbara County to receive summer dry grades.
• Winter dry weather grades were excellent with 93% of locations scoring A and B marks.
• Wet weather grades were extremely poor with 80% of locations (12 sites) receiving C – F grades.
FURTHER INSIGHT:
• Santa Barbara has two beaches that are a part of the NowCast program, which receive daily predictions from April through October:
– Arroyo Burro Beach
– East Beach
RAINFALL
• Rainfall volumes in Santa Barbara County ranged from 17.68” to 24.26” depending on the rain gauge used for analysis (SMX and SBA respectively).
• This was a heavy rain year for the county in comparison to the 10-14” average over the last 5-10 years.
• Although rainfall was higher at the SBA rain gauge this year, the total of both rain stations was within range of the 19.41” average for the county from 1981-2010.
SEWAGE SPILL NOTES:
• There were seven reported sewage spills in Santa Barbara County, totaling about 5,000 gallons.
• About half of the volume spilled reached a surface waterbody.
• These spills resulted in no individual health warnings.
• Of these spills, two were “minor” and five were “small.”
• To compare, last year there were three reported spills with approximately 85,880 gallons reaching a surface waterbody.
REFERENCES: A complete list of grades for the county’s beach monitoring locations can be found in Appendix B1. Samples were collected throughout the year along open coastal and bay beaches.
FOR ADDITIONAL WATER QUALITY INFORMATION: Santa Barbara County’s Environmental Health Agency www.sbcphd.org
Santa Barbara County Grades
2016-2017 5-Year Avg. (2011-2016)
Summer Dry* Winter Dry Wet Weather Summer Dry* Winter Dry Wet Weather
# % # % # % # % # % # %
A n/a 14 93% 1 7% 14 87% 12 77% 8 53%
B n/a 0 0% 2 13% 2 11% 2 15% 3 20%
C n/a 0 0% 1 7% 0 0% 1 5% 2 15%
D n/a 0 0% 3 20% 0 0% 0 0% 0 0%
F n/a 1 7% 8 53% 0 0% 0 0% 1 9%
Total 15 15 16 15 14
*State AB411 monitoring April thru October. Percentages may not add up to 100 due to rounding.
*Arroyo Burro Beach is not an official 2016-17 Beach Bummer because of incomplete reports during the AB411 monitoring season. However, it remains an area of concern because of its previous appearances on our Top Ten Beach Bummers list.
IV. CALIFORNIA COUNTY SUMMARIES
Sewage Spills Summary
7 SEWAGE SPILLS were reported to have reached a waterbody in
Santa Barbara County
0 Major Spills
(10,000+ gallons) 2,620 GALLONS OF SEWAGE
Total Volume reported to have reached
waterbody in Santa Barbara
County
0 health
warnings
2 Minor Spills
(1-10,000 gallons)
0 beach
closures5
Small Spills (<1,000 gallons)
Arroyo Burro Beach
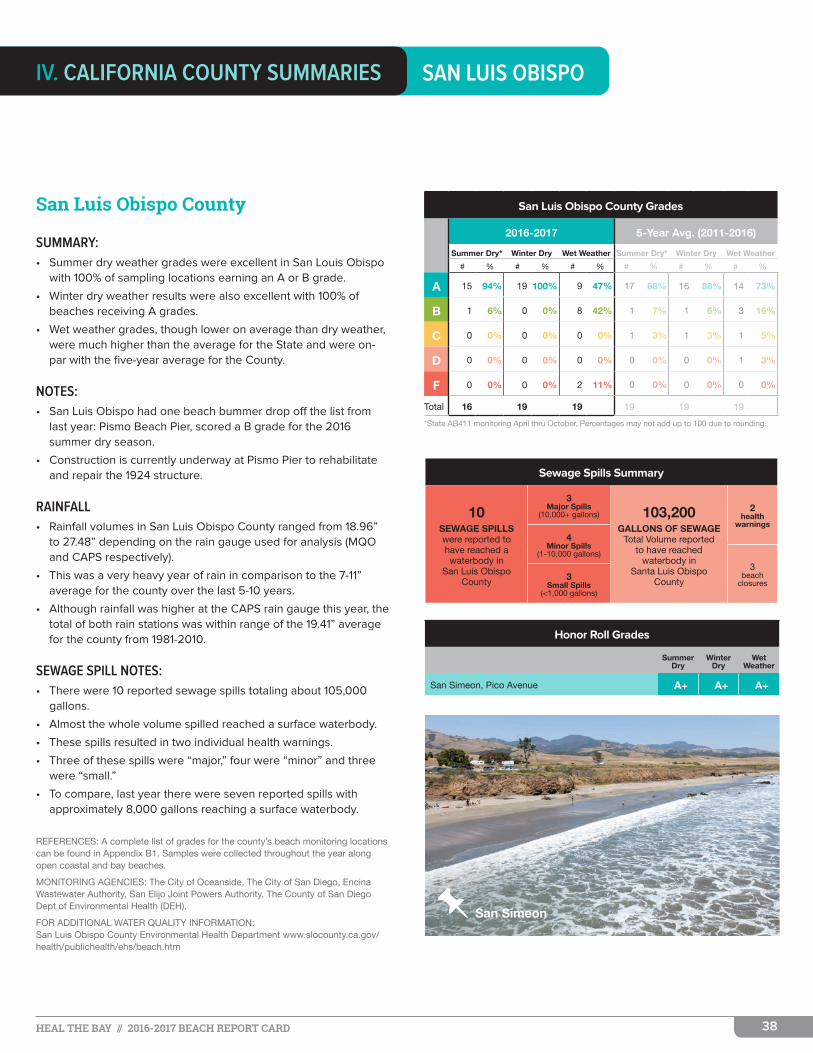
38HEAL THE BAY // 2016-2017 BEACH REPORT CARD
SAN LUIS OBISPO
San Luis Obispo County
SUMMARY:
• Summer dry weather grades were excellent in San Louis Obispo with 100% of sampling locations earning an A or B grade.
• Winter dry weather results were also excellent with 100% of beaches receiving A grades.
• Wet weather grades, though lower on average than dry weather, were much higher than the average for the State and were on-par with the five-year average for the County.
NOTES:
• San Luis Obispo had one beach bummer drop off the list from last year: Pismo Beach Pier, scored a B grade for the 2016 summer dry season.
• Construction is currently underway at Pismo Pier to rehabilitate and repair the 1924 structure.
RAINFALL
• Rainfall volumes in San Luis Obispo County ranged from 18.96” to 27.48” depending on the rain gauge used for analysis (MQO and CAPS respectively).
• This was a very heavy year of rain in comparison to the 7-11” average for the county over the last 5-10 years.
• Although rainfall was higher at the CAPS rain gauge this year, the total of both rain stations was within range of the 19.41” average for the county from 1981-2010.
SEWAGE SPILL NOTES:
• There were 10 reported sewage spills totaling about 105,000 gallons.
• Almost the whole volume spilled reached a surface waterbody.
• These spills resulted in two individual health warnings.
• Three of these spills were “major,” four were “minor” and three were “small.”
• To compare, last year there were seven reported spills with approximately 8,000 gallons reaching a surface waterbody.
REFERENCES: A complete list of grades for the county’s beach monitoring locations can be found in Appendix B1. Samples were collected throughout the year along open coastal and bay beaches.
MONITORING AGENCIES: The City of Oceanside, The City of San Diego, Encina Wastewater Authority, San Elijo Joint Powers Authority, The County of San Diego Dept of Environmental Health (DEH).
FOR ADDITIONAL WATER QUALITY INFORMATION: San Luis Obispo County Environmental Health Department www.slocounty.ca.gov/health/publichealth/ehs/beach.htm
San Luis Obispo County Grades
2016-2017 5-Year Avg. (2011-2016)
Summer Dry* Winter Dry Wet Weather Summer Dry* Winter Dry Wet Weather
# % # % # % # % # % # %
A 15 94% 19 100% 9 47% 17 88% 16 88% 14 73%
B 1 6% 0 0% 8 42% 1 7% 1 6% 3 16%
C 0 0% 0 0% 0 0% 1 3% 1 3% 1 5%
D 0 0% 0 0% 0 0% 0 0% 0 0% 1 3%
F 0 0% 0 0% 2 11% 0 0% 0 0% 0 0%
Total 16 19 19 19 19 19
*State AB411 monitoring April thru October. Percentages may not add up to 100 due to rounding.
Honor Roll Grades
Summer Dry
Winter Dry
Wet Weather
San Simeon, Pico Avenue A+ A+ A+
IV. CALIFORNIA COUNTY SUMMARIES
Sewage Spills Summary
10 SEWAGE SPILLS were reported to have reached a waterbody in
San Luis Obispo County
3 Major Spills
(10,000+ gallons) 103,200 GALLONS OF SEWAGE
Total Volume reported to have reached
waterbody in Santa Luis Obispo
County
2 health
warnings
4 Minor Spills
(1-10,000 gallons)
3 beach
closures3
Small Spills (<1,000 gallons)
San Simeon
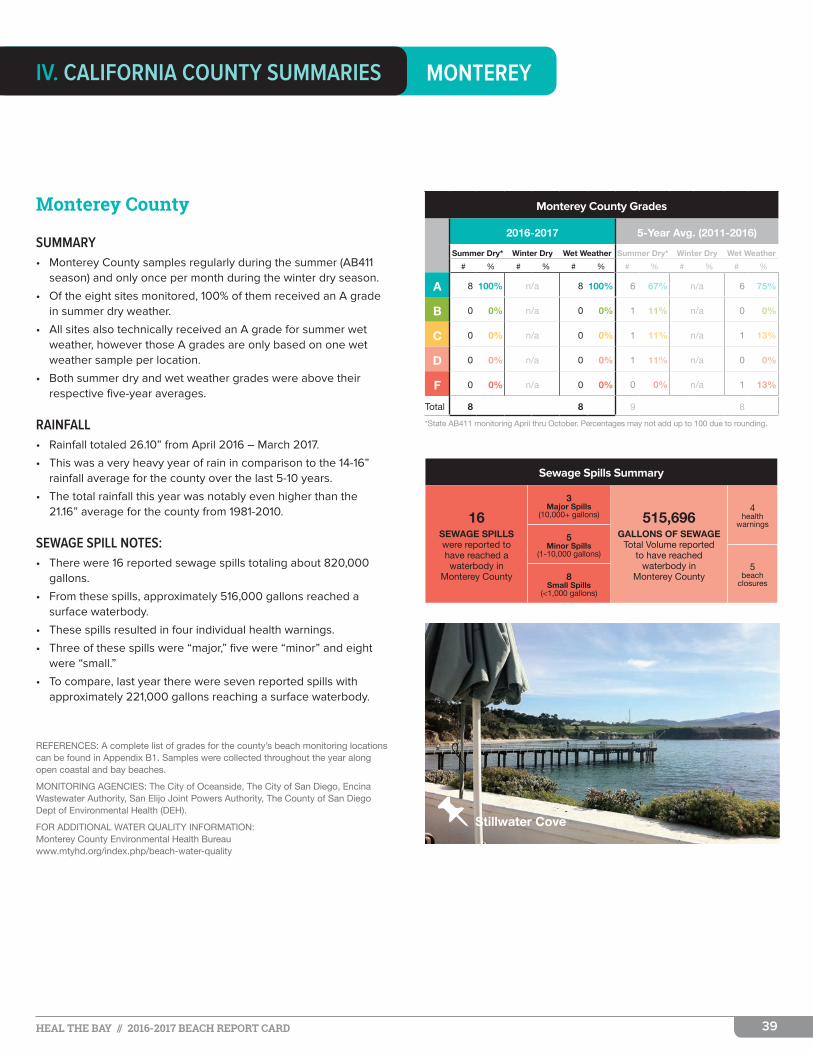
39HEAL THE BAY // 2016-2017 BEACH REPORT CARD
Monterey County
SUMMARY
• Monterey County samples regularly during the summer (AB411 season) and only once per month during the winter dry season.
• Of the eight sites monitored, 100% of them received an A grade in summer dry weather.
• All sites also technically received an A grade for summer wet weather, however those A grades are only based on one wet weather sample per location.
• Both summer dry and wet weather grades were above their respective five-year averages.
RAINFALL
• Rainfall totaled 26.10” from April 2016 – March 2017.
• This was a very heavy year of rain in comparison to the 14-16” rainfall average for the county over the last 5-10 years.
• The total rainfall this year was notably even higher than the 21.16” average for the county from 1981-2010.
SEWAGE SPILL NOTES:
• There were 16 reported sewage spills totaling about 820,000 gallons.
• From these spills, approximately 516,000 gallons reached a surface waterbody.
• These spills resulted in four individual health warnings.
• Three of these spills were “major,” five were “minor” and eight were “small.”
• To compare, last year there were seven reported spills with approximately 221,000 gallons reaching a surface waterbody.
REFERENCES: A complete list of grades for the county’s beach monitoring locations can be found in Appendix B1. Samples were collected throughout the year along open coastal and bay beaches.
MONITORING AGENCIES: The City of Oceanside, The City of San Diego, Encina Wastewater Authority, San Elijo Joint Powers Authority, The County of San Diego Dept of Environmental Health (DEH).
FOR ADDITIONAL WATER QUALITY INFORMATION: Monterey County Environmental Health Bureau www.mtyhd.org/index.php/beach-water-quality
Monterey County Grades
2016-2017 5-Year Avg. (2011-2016)
Summer Dry* Winter Dry Wet Weather Summer Dry* Winter Dry Wet Weather
# % # % # % # % # % # %
A 8 100% n/a 8 100% 6 67% n/a 6 75%
B 0 0% n/a 0 0% 1 11% n/a 0 0%
C 0 0% n/a 0 0% 1 11% n/a 1 13%
D 0 0% n/a 0 0% 1 11% n/a 0 0%
F 0 0% n/a 0 0% 0 0% n/a 1 13%
Total 8 8 9 8
*State AB411 monitoring April thru October. Percentages may not add up to 100 due to rounding.
MONTEREYIV. CALIFORNIA COUNTY SUMMARIES
Sewage Spills Summary
16 SEWAGE SPILLS were reported to have reached a waterbody in
Monterey County
3 Major Spills
(10,000+ gallons) 515,696 GALLONS OF SEWAGE
Total Volume reported to have reached
waterbody in Monterey County
4 health
warnings
5 Minor Spills
(1-10,000 gallons)
5 beach
closures8
Small Spills (<1,000 gallons)
Stillwater Cove
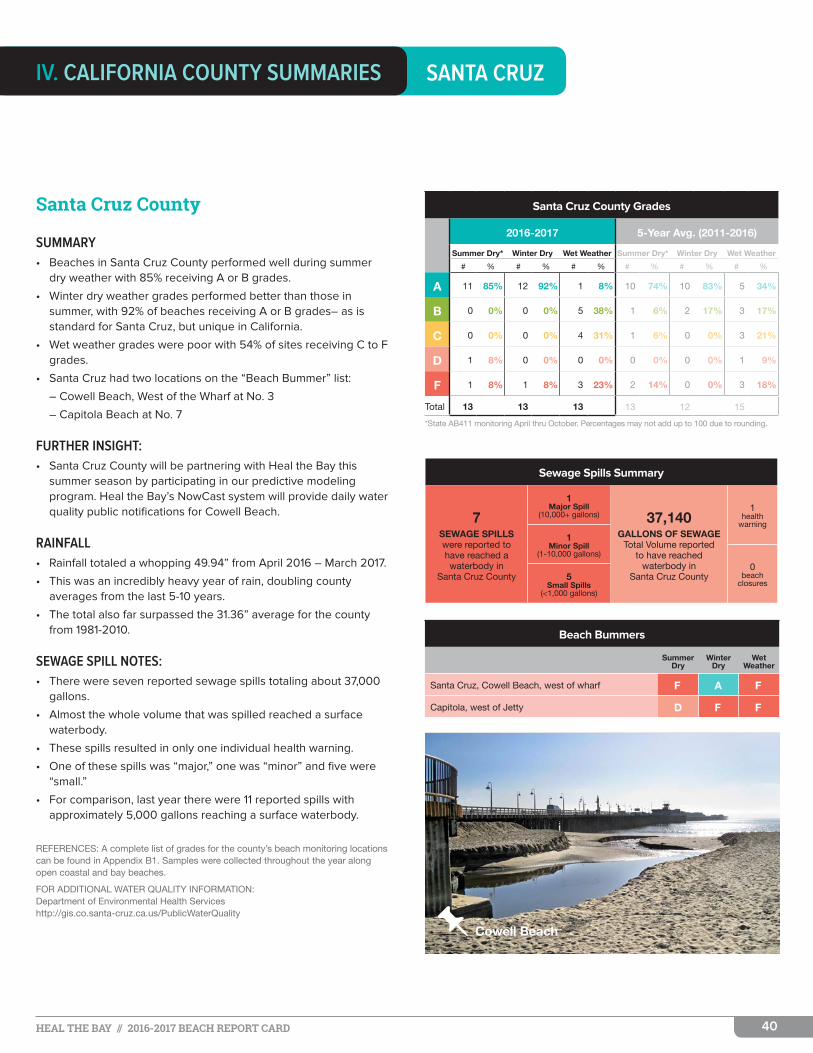
40HEAL THE BAY // 2016-2017 BEACH REPORT CARD
Santa Cruz County
SUMMARY
• Beaches in Santa Cruz County performed well during summer dry weather with 85% receiving A or B grades.
• Winter dry weather grades performed better than those in summer, with 92% of beaches receiving A or B grades– as is standard for Santa Cruz, but unique in California.
• Wet weather grades were poor with 54% of sites receiving C to F grades.
• Santa Cruz had two locations on the “Beach Bummer” list:
– Cowell Beach, West of the Wharf at No. 3
– Capitola Beach at No. 7
FURTHER INSIGHT:
• Santa Cruz County will be partnering with Heal the Bay this summer season by participating in our predictive modeling program. Heal the Bay’s NowCast system will provide daily water quality public notifications for Cowell Beach.
RAINFALL
• Rainfall totaled a whopping 49.94” from April 2016 – March 2017.
• This was an incredibly heavy year of rain, doubling county averages from the last 5-10 years.
• The total also far surpassed the 31.36” average for the county from 1981-2010.
SEWAGE SPILL NOTES:
• There were seven reported sewage spills totaling about 37,000 gallons.
• Almost the whole volume that was spilled reached a surface waterbody.
• These spills resulted in only one individual health warning.
• One of these spills was “major,” one was “minor” and five were “small.”
• For comparison, last year there were 11 reported spills with approximately 5,000 gallons reaching a surface waterbody.
REFERENCES: A complete list of grades for the county’s beach monitoring locations can be found in Appendix B1. Samples were collected throughout the year along open coastal and bay beaches.
FOR ADDITIONAL WATER QUALITY INFORMATION: Department of Environmental Health Services http://gis.co.santa-cruz.ca.us/PublicWaterQuality
Santa Cruz County Grades
2016-2017 5-Year Avg. (2011-2016)
Summer Dry* Winter Dry Wet Weather Summer Dry* Winter Dry Wet Weather
# % # % # % # % # % # %
A 11 85% 12 92% 1 8% 10 74% 10 83% 5 34%
B 0 0% 0 0% 5 38% 1 6% 2 17% 3 17%
C 0 0% 0 0% 4 31% 1 6% 0 0% 3 21%
D 1 8% 0 0% 0 0% 0 0% 0 0% 1 9%
F 1 8% 1 8% 3 23% 2 14% 0 0% 3 18%
Total 13 13 13 13 12 15
*State AB411 monitoring April thru October. Percentages may not add up to 100 due to rounding.
SANTA CRUZ
Beach Bummers
Summer Dry
Winter Dry
Wet Weather
Santa Cruz, Cowell Beach, west of wharf F A F
Capitola, west of Jetty D F F
IV. CALIFORNIA COUNTY SUMMARIES
Sewage Spills Summary
7 SEWAGE SPILLS were reported to have reached a waterbody in
Santa Cruz County
1 Major Spill
(10,000+ gallons) 37,140 GALLONS OF SEWAGE
Total Volume reported to have reached
waterbody in Santa Cruz County
1 health
warning
1 Minor Spill
(1-10,000 gallons)
0 beach
closures5
Small Spills (<1,000 gallons)
Cowell Beach

41HEAL THE BAY // 2016-2017 BEACH REPORT CARD
San Mateo County
SUMMARY
• Summer dry weather grades were great last year, with 90% of beaches earning A or B grades.
• San Mateo beaches also received high marks during winter dry weather, with 95% scoring A or B grades.
• Wet weather grades were a different story, with 73% of sampling locations earning a C to F grade.
• San Mateo earned one spot on the “Beach Bummer” list this year:
– Lakeshore Park, Marina Lagoon at No. 4
FURTHER INSIGHT:
• Wet weather grades dipped below last year’s and well below the five-year average.
• Very poor wet weather grades illustrate why California coastal health departments recommend swimmers stay out of the water for a minimum of three days following a rain event of at least 0.1 inches.
RAINFALL
• Rainfall totaled a whopping 49.94” from April 2016 – March 2017.
• This was an incredibly heavy year of rain, doubling county averages from the last 5-10 years.
• The total also far surpassed the 31.36” average for the county from 1981-2010.
SEWAGE SPILL NOTES:
• There were 52 reported sewage spills totaling about 2.3 million gallons.
• Of this, about 1.8 million gallons reached a surface waterbody.
• These spills resulted in 17 individual health warnings.
• Of these spills, 19 were “major,” 18 were “minor” and 15 were “small.”
• San Mateo had some of the highest reported sewage spills by both number and volume.
REFERENCES: A complete list of grades for the county’s beach monitoring locations can be found in Appendix B1. Samples were collected throughout the year along open coastal and bay beaches.
FOR ADDITIONAL WATER QUALITY INFORMATION: San Mateo County http://smchealth.org/environ/beaches
San Mateo County Grades
2016-2017 5-Year Avg. (2011-2016)
Summer Dry* Winter Dry Wet Weather Summer Dry* Winter Dry Wet Weather
# % # % # % # % # % # %
A 17 81% 15 75% 6 27% 18 83% 15 74% 7 35%
B 2 10% 4 20% 0 0% 1 4% 2 10% 4 18%
C 1 5% 1 5% 3 14% 1 4% 1 6% 2 8%
D 0 0% 0 0% 5 23% 1 4% 0 0% 3 15%
F 1 5% 0 0% 8 36% 1 6% 2 9% 5 25%
Total 21 20 22 22 20 20
*State AB411 monitoring April thru October. Percentages may not add up to 100 due to rounding.
SAN MATEO
Beach Bummers
Summer Dry
Winter Dry
Wet Weather
Linda Mar Beach, at San Pedro Creek C A F
Lakeshore Park, behind Rec Center F B F
IV. CALIFORNIA COUNTY SUMMARIES
Sewage Spills Summary
52 SEWAGE SPILLS were reported to have reached a waterbody in
San Mateo County
19 Major Spills
(10,000+ gallons) 1,843,900 GALLONS OF SEWAGE
Total Volume reported to have reached
waterbody in San Mateo County
17 health
warnings
18 Minor Spills
(1-10,000 gallons)
13 beach
closures15
Small Spills (<1,000 gallons)
Kiteboard Beach

42HEAL THE BAY // 2016-2017 BEACH REPORT CARD
Beach Bummers
Summer Dry
Winter Dry
Wet Weather
Richmond, Keller Beach, north C n/a D
Richmond, Keller Beach, south C n/a D
Alameda & Contra Costa Counties
SUMMARY:
• The East Bay Regional Park District monitored eight locations, two in Contra Costa County (Keller Beach) and six in Alameda County (Crown Beach).
• Samples were collected weekly during the summer and about twice a month throughout the winter – unfortunately not frequent enough to receive a winter grade.
• East Bay grades took a dip this year with 75% receiving A or B grades during summer dry weather.
• Wet weather grades took a serious hit with a 75% of locations scoring C to F grades, more than double that of the five-year average.
FURTHER INSIGHT:
• Contra Costa County (Keller Beach) earned C’s at both sampling locations during summer dry weather. These two locations dipped to D grades during wet weather.
• The six Alameda County sites were split between A and B grades during summer dry weather.
• They were also split during wet weather, with two B’s, two C’s and two F grades.
RAINFALL
• Rainfall totaled a whopping 49.94” from April 2016 – March 2017.
• This was an incredibly heavy year of rain, doubling county averages from the last 5-10 years.
• The total rainfall also far surpassed the 31.36” average for the county from 1981-2010.
SEWAGE SPILL NOTES:
• Between Alameda and Contra Costa counties, there were 110 reported sewage spills totaling about 9.6 million gallons.
• Almost the entire volume that was spilled reached a surface waterbody.
• These spills caused 56 individual health warnings, which presents a stark contrast from the previous year where there were no reported health warnings related to a sewage spill in Alameda County and 20 in Contra Costa County.
• Over the last year, both counties had an incredibly high number and volume of sewage spills, with Alameda County topping the volume spilled category statewide.
REFERENCES: A complete list of grades for the county’s beach monitoring locations can be found in Appendix B1. Samples were collected throughout the year along open coastal and bay beaches.
FOR ADDITIONAL WATER QUALITY INFORMATION: East Bay Regional Park District www.ebparks.org
EAST BAY
East Bay (Combined) Grades
2016-2017 5-Year Avg. (2011-2016)
Summer Dry* Winter Dry Wet Weather Summer Dry* Winter Dry Wet Weather
# % # % # % # % # % # %
A 3 38% n/a 0 0% 8 84% n/a 6 64%
B 3 38% n/a 2 25% 2 16% n/a 1 6%
C 2 25% n/a 2 25% 0 0% n/a 1 15%
D 0 0% n/a 2 25% 0 0% n/a 1 9%
F 0 0% n/a 2 25% 0 0% n/a 1 6%
Total 8 8 10 9
*State AB411 monitoring April thru October. Percentages may not add up to 100 due to rounding.
Contra Costa County Alameda County
2016-2017 2016-2017
Summer Dry* Winter Dry Wet Weather Summer Dry* Winter Dry Wet Weather
# % # % # % # % # % # %
A 0 0% n/a 0 0% 3 50% n/a 0 0%
B 0 0% n/a 0 0% 3 50% n/a 2 33%
C 2 100% n/a 0 0% 0 0% n/a 2 33%
D 0 0% n/a 2 100% 0 0% n/a 0 0%
F 0 0% n/a 0 0% 0 0% n/a 2 33%
Total 2 2 6 6
IV. CALIFORNIA COUNTY SUMMARIES
Sewage Spills Summary
29 SEWAGE SPILLS were reported to have reached a waterbody in
Alameda County
8 Major Spills
(10,000+ gallons) 6,892,682 GALLONS OF SEWAGE
Total Volume reported to have reached
waterbody in ALAMEDA COUNTY
13 health
warnings13
Minor Spills (1-10,000 gallons)
1 beach closure
8Small Spills
(<1,000 gallons)
81 SEWAGE SPILLS were reported to have reached a waterbody in
Contra Costa County
34 Major Spills
(10,000+ gallons) 2,673,414 GALLONS OF SEWAGE
Total Volume reported to have reached
waterbody in CONTRA COSTA CO.
43 health
warnings24
Minor Spills (1-10,000 gallons)
0 beach
closures23
Small Spills (<1,000 gallons)

43HEAL THE BAY // 2016-2017 BEACH REPORT CARD
San Francisco County
SUMMARY
• Through partnership with the San Francisco Public Utilities Commission, San Francisco maintains year-round sampling at 15 locations regularly.
• Beaches earned amazing grades during summer dry weather, with 100% earning A or B grades, a 13% increase from the five-year average.
• Winter dry weather grades were on par with the five-year average at 73% of locations scoring A or B grades.
• Wet weather grades in San Francisco could improve with 60% of beaches receiving A or B grades.
• San Francisco had one location drop off the “Beach Bummer” list from last year: Candlestick Point at Sunnydale Cove received an A summer dry grade
FURTHER INSIGHT:
• Winter dry weather grades improved from last year’s scores of 60% A or B grades to 73%.
• Wet weather grades also saw an improvemenet from last year, up from 40% A or B grades to 60% this year.
RAINFALL
• Rainfall totaled 31.34” from April 2016 – March 2017.
• This far surpassed county averages of 17-20” over the last 5-10 years.
• Rainfall this year was also notably higher than the 23.64” average for the county from 1981-2010.
COMBINED SEWER DISCHARGE NOTES:
• City and County of San Francisco have a unique stormwater infrastructure that occurs in no other California coastal county – a combined sewer and storm drain system (CSS).
• As a result, the shoreline has no flowing storm drains in dry weather, but during heavy rain events, the CSS occasionally discharges combined wastewater, which is typically comprised of 94% treated stormwater and 6% primary treated sanitary flow.
• This past year, San Francisco had 31 combined sewer discharges, which led to a total of 56 beach advisories.
REFERENCES: A complete list of grades for the county’s beach monitoring locations can be found in Appendix B1. Samples were collected throughout the year along open coastal and bay beaches.
FOR ADDITIONAL WATER QUALITY INFORMATION: San Francisco Public Utilities Commission http://beaches.sfwater.org
San Francisco County Grades
2016-2017 5-Year Avg. (2011-2016)
Summer Dry* Winter Dry Wet Weather Summer Dry* Winter Dry Wet Weather
# % # % # % # % # % # %
A 13 87% 11 73% 6 40% 11 74% 10 71% 5 35%
B 2 13% 0 0% 3 20% 1 10% 1 7% 3 18%
C 0 0% 0 0% 1 7% 1 10% 1 7% 2 16%
D 0 0% 1 7% 2 13% 0 0% 1 7% 1 9%
F 0 0% 3 20% 3 20% 0 0% 1 7% 3 22%
Total 15 15 15 14 14 15
*State AB411 monitoring April thru October. Percentages may not add up to 100 due to rounding.
SAN FRANCISCOIV. CALIFORNIA COUNTY SUMMARIES
Sewage Spills Summary
3 SEWAGE SPILLS were reported to have reached a waterbody in
San Francisco County
0 Major Spills
(10,000+ gallons) 587 GALLONS OF SEWAGE
Total Volume reported to have reached
waterbody in San Francisco
County
0 health
warnings
0 Minor Spills
(1-10,000 gallons)
1 beach closure
3Small Spills
(<1,000 gallons)
Baker Beach

44HEAL THE BAY // 2016-2017 BEACH REPORT CARD
Marin County
SUMMARY
• Marin County only samples during the summer (AB411 season).
• Summer dry weather grades were perfect with 100% of locations scoring A grades.
• Wet weather samples taken during those summer months did not fare as well, dipping to 74% of locations receiving A or B grades compared to 91% on average over the last five years.
SEWAGE SPILL NOTES:
• There were 36 reported sewage spills totaling about 175,000 gallons.
• Almost the whole volume that was spilled reached a surface waterbody.
• These spills caused 11 individual health warnings.
• Over the past year Marin had the 5th highest number of reported sewage spills among the coastal counties.
• To compare, there were 19 spills from 2015-16, with approximately 102,342 gallons reaching a surface waterbody.
REFERENCES: A complete list of grades for the county’s beach monitoring locations can be found in Appendix B1. Samples were collected throughout the year along open coastal and bay beaches.
MONITORING AGENCIES: The City of Oceanside, The City of San Diego, Encina Wastewater Authority, San Elijo Joint Powers Authority, The County of San Diego Dept of Environmental Health (DEH).
FOR ADDITIONAL WATER QUALITY INFORMATION: Marin County’s Department of Environmental Health www.marincounty.org/ehs
Marin County Grades
2016-2017 5-Year Avg. (2011-2016)
Summer Dry* Winter Dry Wet Weather Summer Dry* Winter Dry Wet Weather
# % # % # % # % # % # %
A 23 100% n/a 15 65% 22 95% n/a 21 91%
B 0 0% n/a 2 9% 1 5% n/a 0 0%
C 0 0% n/a 0 0% 0 0% n/a 0 0%
D 0 0% n/a 5 22% 0 0% n/a 1 2%
F 0 0% n/a 1 4% 0 0% n/a 2 7%
Total 23 23 23 5
*State AB411 monitoring April thru October. Percentages may not add up to 100 due to rounding.
MARINIV. CALIFORNIA COUNTY SUMMARIES
Sewage Spills Summary
36 SEWAGE SPILLS were reported to have reached a waterbody in Marin County
5 Major Spills
(10,000+ gallons) 163,279 GALLONS OF SEWAGE
Total Volume reported to have reached
waterbody in Marin County
11 health
warnings
10 Minor Spills
(1-10,000 gallons)
1 beach closure
21Small Spills
(<1,000 gallons)
Muir Beach

45HEAL THE BAY // 2016-2017 BEACH REPORT CARD
Sonoma County
SUMMARY
• Summer dry weather grades were perfect with 100% of locations receiving A grades.
• Wet weather samples taken during those summer months also earned great marks with 100% of sites scoring A or B grades.
FURTHER INSIGHT:
• Sonoma County only samples during the summer (AB411 season).
• There were seven wet weather samples collected at each site last summer, a larger summer wet weather pool of data than most other summer-only counties.
RAINFALL
• Rainfall totaled a massive 57.35” from April 2016 – March 2017.
• This doubles county averages from the last 5-10 years.
• This volume of rain was also notably higher than the 31.49” average for the county from 1961-1990.
SEWAGE SPILL NOTES:
• There were 64 reported sewage spills totaling about 2.7 million gallons.
• Almost the whole volume that was spilled reached a surface waterbody.
• These spills caused 50 individual health warnings.
• Sonoma ranks 3rd in terms of number of reported sewage spills among the coastal counties over the last year.
• For a remarkable comparison, there were only five reported spills from 2015-16 in Sonoma County, with approximately 200,000 gallons reaching a surface waterbody.
REFERENCES: A complete list of grades for the county’s beach monitoring locations can be found in Appendix B1. Samples were collected throughout the year along open coastal and bay beaches.
FOR ADDITIONAL WATER QUALITY INFORMATION: Sonoma County’s Department of Environmental Health www.sonoma-county.org/health/services/ocean.asp
Sonoma County Grades
2016-2017 5-Year Avg. (2011-2016)
Summer Dry* Winter Dry Wet Weather Summer Dry* Winter Dry Wet Weather
# % # % # % # % # % # %
A 7 100% n/a 6 86% 7 100% n/a 5 100%
B 0 0% n/a 1 14% 0 0% n/a 0 0%
C 0 0% n/a 0 0% 0 0% n/a 0 0%
D 0 0% n/a 0 0% 0 0% n/a 0 0%
F 0 0% n/a 0 0% 0 0% n/a 0 0%
Total 7 7 7 5
*State AB411 monitoring April thru October. Percentages may not add up to 100 due to rounding.
SONOMAIV. CALIFORNIA COUNTY SUMMARIES
Sewage Spills Summary
64 SEWAGE SPILLS were reported to have reached a waterbody in
Sonoma County
21 Major Spills
(10,000+ gallons) 2,657,671 GALLONS OF SEWAGE
Total Volume reported to have reached
waterbody in Sonoma County
50 health
warnings
29 Minor Spills
(1-10,000 gallons)
0 beach
closures14
Small Spills (<1,000 gallons)
Goat Rock Beach

46HEAL THE BAY // 2016-2017 BEACH REPORT CARD
Mendocino County
SUMMARY
• Summer dry weather grades were perfect with all six of the sites sampled earning A grades.
• Wet weather grades were based on about 6 wet weather samples per location, only one site earned less than an A grade which was Caspar Beach at Caspar Creek.
NOTES
• Mendocino County only samples during the summer (AB411 season).
• These summer dry and wet weather grades mark an improvement over the five-year average.
• The county received an incredibly large amount of rain from April 2016 – March 2017, totaling 60.24 inches.
SEWAGE SPILL NOTES:
• There was one reported sewage spill in Mendocino County, totaling about 258 gallons.
• Only 50 of those gallons reached a surface waterbody, resulting in no health warnings.
• Very similarly, there was also only one reported sewage spill in 2015-16, of which approximately 200 gallons reaching a surface waterbody.
REFERENCES: A complete list of grades for the county’s beach monitoring locations can be found in Appendix B1. Samples were collected throughout the year along open coastal and bay beaches.
MONITORING AGENCIES: The City of Oceanside, The City of San Diego, Encina Wastewater Authority, San Elijo Joint Powers Authority, The County of San Diego Dept of Environmental Health (DEH).
FOR ADDITIONAL WATER QUALITY INFORMATION: www.co.mendocino.ca.us/hhsa/chs/eh/index.htm
Mendochino County Grades
2016-2017 5-Year Avg. (2011-2016)
Summer Dry* Winter Dry Wet Weather Summer Dry* Winter Dry Wet Weather
# % # % # % # % # % # %
A 6 100% n/a 5 83% 5 100% n/a 5 71%
B 0 0% n/a 0 0% 0 4% n/a 0 0%
C 0 0% n/a 1 17% 0 4% n/a 2 29%
D 0 0% n/a 0 0% 0 0% n/a 0 0%
F 0 0% n/a 0 0% 0 0% n/a 0 0%
Total 6 6 5 7
*State AB411 monitoring April thru October. Percentages may not add up to 100 due to rounding.
MENDOCINOIV. CALIFORNIA COUNTY SUMMARIES
Sewage Spills Summary
1 SEWAGE SPILL were reported to have reached a waterbody in
Mendocino County
0 Major Spills
(10,000+ gallons) 50 GALLONS OF SEWAGE
Total Volume reported to have reached
waterbody in Mendocino County
0 health
warnings
0 Minor Spills
(1-10,000 gallons)
0 beach
closures1
Small Spill (<1,000 gallons)
Fort Bragg @ Pudding Creek

47HEAL THE BAY // 2016-2017 BEACH REPORT CARD
Beach Bummers
Summer Dry
Winter Dry
Wet Weather
Luffenholz Beach D n/a C
Clam Beach County Park F n/a F
Humboldt & Del Norte Counties
HUMBOLDT COUNTY SUMMARY
• Summer dry weather grades were mixed with three of five sites receiving A grades, while two sites netted D and F grades, earning them each a spot on the “Beach Bummer” list.
– Clam Beach moved up to the #1 spot on the “Beach Bummer” list this year.
– Luffenholtz Beach also earned a “bummer” title, ranking in at the #8 spot.
• Summmer wet weather grades also varied by location, with 60% of sites (three locations) earning A or B grades.
NOTES:
• Humboldt County only samples during the summer (AB411 season).
• This is Clam Beach’s fourth year on the “Beach Bummer” list.
• The county saw a large amount of rain from April 2016 – March 2017, totaling 58.46 inches.
SEWAGE SPILL NOTES:
• There were 15 reported sewage spills totaling about 110,000 gallons in Humboldt County. Almost the entire volume that was spilled reached a surface waterbody.
• These spills resulted in one health warning.
• For comparison, there were eight reported spills in 2015-16, with only approximately 3,000 gallons reaching a surface waterbody.
DEL NORTE COUNTY SUMMARY
• There is only one beach regularly monitored in Del Norte County: Battery Point Lighthouse in Crescent City.
• Consistent with years past, this site received A grades for both dry and wet weather.
• Del Norte County received the most rain from April 2016 – March 2017 of all California coastal counties, totaling 86.55 inches.
SEWAGE SPILL NOTES:
• There was only one reported sewage spill in Del Norte County, totaling 2,700 gallons. That full volume of sewage reached a surface waterbody, but resulted in no health warnings.
• Very similarly, there was also only one reported spill from 2015-16.
REFERENCES: A complete list of grades for the county’s beach monitoring locations can be found in Appendix B1. Samples were collected throughout the year along open coastal and bay beaches.
FOR ADDITIONAL WATER QUALITY INFORMATION: Humboldt County’s Department of Health & Human Services www.co.humboldt.ca.us/health/envhealth/beachinfo
County of Del Norte Environmental Health Division www.co.del-norte.ca.us/departments/community-development-department/environmental-health-division
Humboldt County Grades
2016-2017 5-Year Avg. (2011-2016)
Summer Dry* Winter Dry Wet Weather Summer Dry* Winter Dry Wet Weather
# % # % # % # % # % # %
A 3 60% n/a 2 40% 3 60% n/a 2 30%
B 0 0% n/a 1 20% 1 16% n/a 1 20%
C 0 0% n/a 1 20% 1 12% n/a 0 0%
D 1 20% n/a 0 0% 0 0% n/a 2 30%
F 1 20% n/a 1 20% 0 0% n/a 1 20%
Total 5 5 5 5
Del Norte County Grades
2016-2017 5-Year Avg. (2011-2016)
Summer Dry* Winter Dry Wet Weather Summer Dry* Winter Dry Wet Weather
# % # % # % # % # % # %
A 1 100% n/a 1 100% 1 100% 1 100% 1 100%
B 0 0% n/a 0 0% 0 0% 0 0% 0 0%
C 0 0% n/a 0 0% 0 0% 0 0% 0 0%
D 0 0% n/a 0 0% 0 0% 0 0% 0 0%
F 0 0% n/a 0 0% 0 0% 0 0% 0 0%
Total 1 1 1 1 1
*State AB411 monitoring April thru October. Percentages may not add up to 100 due to rounding.
NORTHERN CALIFORNIA IV. CALIFORNIA COUNTY SUMMARIES
Sewage Spills Summary
15 SEWAGE SPILLS were reported to have reached a waterbody in
Humboldt County
1 Major Spill
(10,000+ gallons) 106,651 GALLONS OF SEWAGE
Total Volume reported to have reached
waterbody in HUMBOLDT COUNTY
1 health
warning7
Minor Spills (1-10,000 gallons)
1 beach closure
7Small Spills
(<1,000 gallons)
1 SEWAGE SPILL were reported to have reached a waterbody in
Del Norte County
0 Major Spills
(10,000+ gallons) 2,700 GALLONS OF SEWAGE
Total Volume reported to have reached
waterbody in DEL NORTE COUNTY
0 health
warnings1
Minor Spill (1-10,000 gallons)
0 beach
closures0
Small Spills (<1,000 gallons)

48HEAL THE BAY // 2016-2017 BEACH REPORT CARD
IV. PACIFIC NORTHWEST COUNTY SUMMARIES
Oregon
Oregon’s Department of Human Services and the Department of Environ-
mental Quality collectively monitored select beach locations throughout
the state from Memorial Day through Labor Day. Unlike California, which
uses three indicator bacteria for its monitoring programs, Oregon moni-
tors water quality using only the indicator bacteria Enterococcus. Ore-
gon’s program is funded entirely from the federal Beaches Environmental
Assessment and Coastal Health Act (BEACH Act). See Funding—Federal
BEACH Act under Policy updates and recommendations on page 26.
For a second year, the Oregon Beach Monitoring Program (OBMP) was
unable to maintain a weekly sampling frequency due to resource con-
straints. Because of the minimal number of samples taken by OBMP, none
of the Oregon beach locations qualified to receive a grade in this report
(monitored beaches must be sampled at least weekly to receive a grade).
If funding constraints for the OBMP continue or worsen in 2018, we
encourage these public agencies to refine their monitoring program,
consider consolidating their culture-based sampling to the highest use
beaches and to increase the sampling frequency of those locations to
weekly testing.
FOR ADDITIONAL WATER QUALITY INFORMATION: Oregon Health Authority http://public.health.oregon.gov/HealthyEnvironments/Recreation/BeachWaterQuality/Pages/index.aspx
Washington
Washington’s BEACH program is a state-administered
and locally implemented program. Like Oregon, Wash-
ington monitors only Enterococcus bacteria, which dif-
fers from California’s three indicator bacteria monitor-
ing protocol. Approximately 80% of the program has
historically been funded under the federal BEACH Act,
with the remaining 20% funded by the United States
Environmental Protection Agency’s (USEPA) National
Estuary Program’s Pathogen Prevention, Reduction
and Control Grant. The Makah Tribe also contributes
beach monitoring to the state program through sepa-
rate BEACH Program Tribal funding. Washington State
has one of the most robust beach monitoring programs
in the country based on the number of sample sites per
mile of beach.
SUMMARY:
• There were 166 individual sample locations regularly monitored from Memorial Day 2016 through Labor Day 2016.
• Water quality during summer dry weather was excellent with 94% of sites earning A grades.
• Compared with 12 sites in 2015, only 6 sites earned C to F grades in the summer 2016 season.
• The poor grades were comprised of three C’s and three F’s split between Clallam, Island, King and Snohomish Counties.
• Water quality during wet weather improved in Washington last year with 93% of sites earning A or B grades.
• This is a large improvement from last year where 71% of locations received A and B grades during summer wet weather.
REFERENCES: Wet weather grades in Washington are based on a significant rainfall event of 0.2 inches or more and the 72 hours following the rain event. Washington’s grading methodology can be found in Appendix D on page 72. A complete list of grades for Washington State’s beach monitoring locations can be found in Appendix B2.
MONITORING AGENCIES: Information and photos generously provided by the Washington Department of Health and Department of Ecology.
FOR ADDITIONAL WATER QUALITY INFORMATION: State of Washington’s Department of Ecology www.ecy.wa.gov/programs/eap/beach/index.html
CURRENT BEACH CLOSURE AND ADVISORY INFORMATION CAN BE FOUND AT: http://ecologywa.blogspot.com/search/label/Fecal%20matters
OREGON & WASHINGTON

49HEAL THE BAY // 2016-2017 BEACH REPORT CARD
TABLE 4-2: WASHINGTON STATE GRADES BY COUNTY AND NO. OF LOCATIONS
Clallum County
Summer Dry* Winter Dry Wet Weather
# % # % # %
A 21 91% 15 100% 21 91%
B 1 4% 0 0% 1 4%
C 1 4% 0 0% 1 4%
D 0 0% 0 0% 0 0%
F 0 0% 0 0% 0 0%
Total 23 15 23
Gray’s Harbor County
Summer Dry* Winter Dry Wet Weather
# % # % # %
A 9 100% n/a 9 100%
B 0 0% n/a 0 0%
C 0 0% n/a 0 0%
D 0 0% n/a 0 0%
F 0 0% n/a 0 0%
Total 9 9
Island County
Summer Dry* Winter Dry Wet Weather
# % # % # %
A 3 50% n/a 4 67%
B 0 0% n/a 0 0%
C 1 17% n/a 0 0%
D 0 0% n/a 0 0%
F 2 33% n/a 2 33%
Total 6 6
Jefferson County
Summer Dry* Winter Dry Wet Weather
# % # % # %
A 3 100% n/a 3 100%
B 0 0% n/a 0 0%
C 0 0% n/a 0 0%
D 0 0% n/a 0 0%
F 0 0% n/a 0 0%
Total 3 3
Kitsap County
Summer Dry* Winter Dry Wet Weather
# % # % # %
A 35 97% n/a 35 97%
B 1 3% n/a 1 3%
C 0 0% n/a 0 0%
D 0 0% n/a 0 0%
F 0 0% n/a 0 0%
Total 36 36
Mason County
Summer Dry* Winter Dry Wet Weather
# % # % # %
A 9 100% n/a 4 100%
B 0 0% n/a 0 0%
C 0 0% n/a 0 0%
D 0 0% n/a 0 0%
F 0 0% n/a 0 0%
Total 9 4
Pierce County
Summer Dry* Winter Dry Wet Weather
# % # % # %
A 23 100% n/a 17 89%
B 0 0% n/a 1 5%
C 0 0% n/a 1 5%
D 0 0% n/a 0 0%
F 0 0% n/a 0 0%
Total 23 0
Snohomish County
Summer Dry* Winter Dry Wet Weather
# % # % # %
A 14 93% n/a 10 67%
B 0 0% n/a 2 13%
C 1 7% n/a 2 13%
D 0 0% n/a 0 0%
F 0 0% n/a 1 7%
Total 15 15
Thurston County
Summer Dry* Winter Dry Wet Weather
# % # % # %
A 3 100% n/a 3 100%
B 0 0% n/a 0 0%
C 0 0% n/a 0 0%
D 0 0% n/a 0 0%
F 0 0% n/a 0 0%
Total 3 3
Whatcom County
Summer Dry* Winter Dry Wet Weather
# % # % # %
A 6 100% n/a 5 83%
B 0 0% n/a 0 0%
C 0 0% n/a 0 0%
D 0 0% n/a 0 0%
F 0 0% n/a 1 17%
Total 6 6
King County
Summer Dry* Winter Dry Wet Weather
# % # % # %
A 26 90% n/a 23 79%
B 2 7% n/a 4 14%
C 0 0% n/a 1 3%
D 0 0% n/a 1 3%
F 1 3% n/a 0 0%
Total 29 29
Skagit County
Summer Dry* Winter Dry Wet Weather
# % # % # %
A 4 100% n/a 3 75%
B 0 0% n/a 0 0%
C 0 0% n/a 0 0%
D 0 0% n/a 1 25%
F 0 0% n/a 0 0%
Total 4 0
WASHINGTON GRADESIV. PACIFIC NORTHWEST COUNTY SUMMARIES

| APPENDICES |
Beach BummersGrades by County - California
Grades by County - Pacific NorthwestFrequently Asked Questions
MethodologyIndex/Bills
Acknowledgements
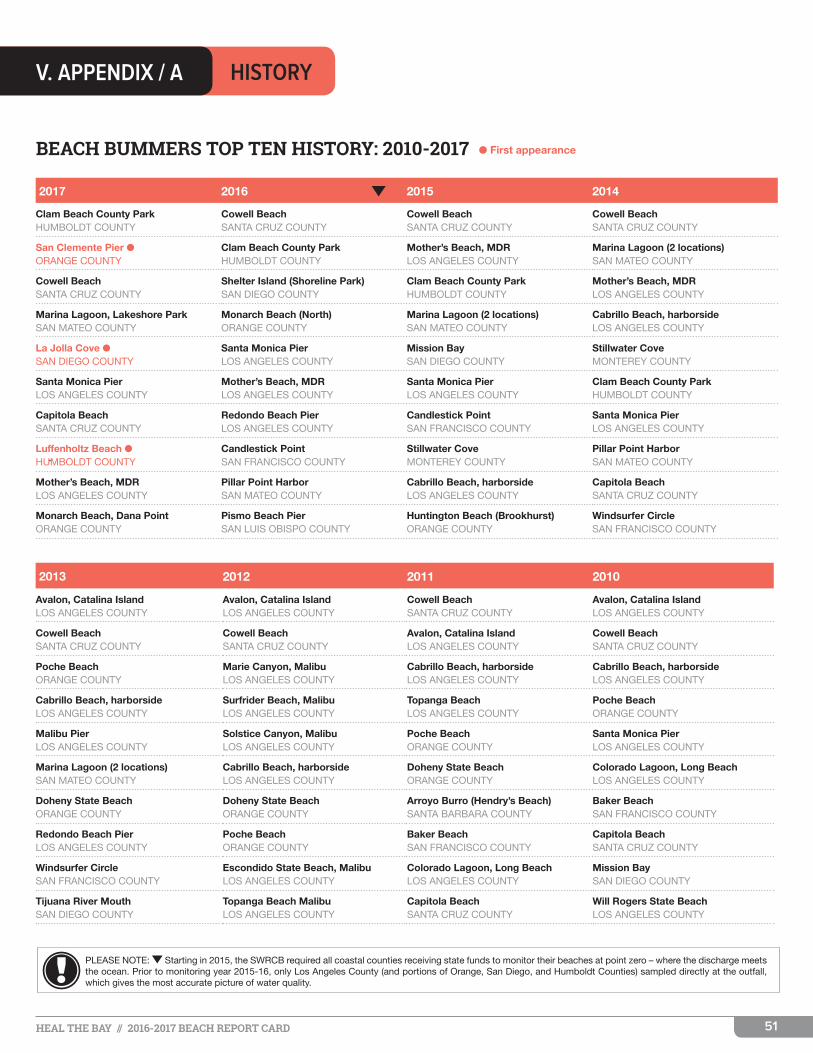
51HEAL THE BAY // 2016-2017 BEACH REPORT CARD
2017 2016 2015 2014
Clam Beach County Park HUMBOLDT COUNTY
Cowell BeachSANTA CRUZ COUNTY
Cowell BeachSANTA CRUZ COUNTY
Cowell BeachSANTA CRUZ COUNTY
San Clemente Pier lORANGE COUNTY
Clam Beach County Park HUMBOLDT COUNTY
Mother’s Beach, MDRLOS ANGELES COUNTY
Marina Lagoon (2 locations)SAN MATEO COUNTY
Cowell BeachSANTA CRUZ COUNTY
Shelter Island (Shoreline Park)SAN DIEGO COUNTY
Clam Beach County Park HUMBOLDT COUNTY
Mother’s Beach, MDRLOS ANGELES COUNTY
Marina Lagoon, Lakeshore ParkSAN MATEO COUNTY
Monarch Beach (North) ORANGE COUNTY
Marina Lagoon (2 locations)SAN MATEO COUNTY
Cabrillo Beach, harborsideLOS ANGELES COUNTY
La Jolla Cove lSAN DIEGO COUNTY
Santa Monica PierLOS ANGELES COUNTY
Mission BaySAN DIEGO COUNTY
Stillwater Cove MONTEREY COUNTY
Santa Monica PierLOS ANGELES COUNTY
Mother’s Beach, MDRLOS ANGELES COUNTY
Santa Monica PierLOS ANGELES COUNTY
Clam Beach County Park HUMBOLDT COUNTY
Capitola BeachSANTA CRUZ COUNTY
Redondo Beach PierLOS ANGELES COUNTY
Candlestick PointSAN FRANCISCO COUNTY
Santa Monica PierLOS ANGELES COUNTY
Luffenholtz Beach lHUMBOLDT COUNTY
Candlestick PointSAN FRANCISCO COUNTY
Stillwater Cove MONTEREY COUNTY
Pillar Point Harbor SAN MATEO COUNTY
Mother’s Beach, MDRLOS ANGELES COUNTY
Pillar Point Harbor SAN MATEO COUNTY
Cabrillo Beach, harborsideLOS ANGELES COUNTY
Capitola BeachSANTA CRUZ COUNTY
Monarch Beach, Dana PointORANGE COUNTY
Pismo Beach PierSAN LUIS OBISPO COUNTY
Huntington Beach (Brookhurst)ORANGE COUNTY
Windsurfer CircleSAN FRANCISCO COUNTY
BEACH BUMMERS TOP TEN HISTORY: 2010-2017
2013 2012 2011 2010
Avalon, Catalina IslandLOS ANGELES COUNTY
Avalon, Catalina IslandLOS ANGELES COUNTY
Cowell BeachSANTA CRUZ COUNTY
Avalon, Catalina IslandLOS ANGELES COUNTY
Cowell BeachSANTA CRUZ COUNTY
Cowell BeachSANTA CRUZ COUNTY
Avalon, Catalina IslandLOS ANGELES COUNTY
Cowell BeachSANTA CRUZ COUNTY
Poche BeachORANGE COUNTY
Marie Canyon, MalibuLOS ANGELES COUNTY
Cabrillo Beach, harborsideLOS ANGELES COUNTY
Cabrillo Beach, harborsideLOS ANGELES COUNTY
Cabrillo Beach, harborsideLOS ANGELES COUNTY
Surfrider Beach, MalibuLOS ANGELES COUNTY
Topanga BeachLOS ANGELES COUNTY
Poche BeachORANGE COUNTY
Malibu PierLOS ANGELES COUNTY
Solstice Canyon, MalibuLOS ANGELES COUNTY
Poche BeachORANGE COUNTY
Santa Monica PierLOS ANGELES COUNTY
Marina Lagoon (2 locations)SAN MATEO COUNTY
Cabrillo Beach, harborsideLOS ANGELES COUNTY
Doheny State Beach ORANGE COUNTY
Colorado Lagoon, Long BeachLOS ANGELES COUNTY
Doheny State BeachORANGE COUNTY
Doheny State Beach ORANGE COUNTY
Arroyo Burro (Hendry’s Beach)SANTA BARBARA COUNTY
Baker BeachSAN FRANCISCO COUNTY
Redondo Beach PierLOS ANGELES COUNTY
Poche BeachORANGE COUNTY
Baker BeachSAN FRANCISCO COUNTY
Capitola BeachSANTA CRUZ COUNTY
Windsurfer CircleSAN FRANCISCO COUNTY
Escondido State Beach, MalibuLOS ANGELES COUNTY
Colorado Lagoon, Long BeachLOS ANGELES COUNTY
Mission BaySAN DIEGO COUNTY
Tijuana River MouthSAN DIEGO COUNTY
Topanga Beach MalibuLOS ANGELES COUNTY
Capitola BeachSANTA CRUZ COUNTY
Will Rogers State BeachLOS ANGELES COUNTY
HISTORYV. APPENDIX / A
l First appearance
PLEASE NOTE: Starting in 2015, the SWRCB required all coastal counties receiving state funds to monitor their beaches at point zero – where the discharge meets the ocean. Prior to monitoring year 2015-16, only Los Angeles County (and portions of Orange, San Diego, and Humboldt Counties) sampled directly at the outfall, which gives the most accurate picture of water quality.

52HEAL THE BAY // 2016-2017 BEACH REPORT CARD
SummerDry WinterDry WetWeather (Apr-Oct) (Nov-Mar) Year-Round
// Beach Bummer and Honor Roll names appear in color/bold.
V. APPENDIX / B-1 CALIFORNIA GRADES BY COUNTY
San Diego County
Oceanside San Luis Rey River outlet A A D
projection of Tyson Street A+ A+ B
projection of Forster Street A+ A+ B
500' north of Loma Alta Creek outlet A+ A+ B
projection of Cassidy Street A+ A+ C
St. Malo Beach (downcoast from St. Malo Road) A+ A+ C
Carlsbad projection of Tamarack Avenue A+ A+
warm water jetty A A+
projection of Cerezo Drive A+ A+ A+
projection of Palomar Airport Road A+ A+ A+
Encina Creek outlet A+ A+ A+
projection of Ponto Drive A+ A+ A+
projection of Poinsettia Lane A+ A+ A+
Batiquitos Lagoon outlet A+ A+
Encinitas Moonlight Beach (Cottonwood Creek outlet) A A D
Swami’s Beach (Seacliff Park) A A+
San Elijo State Park, Pipes surf break A+ A+ A+
San Elijo State Park, north end of State Park stairs A+ A+ A+
San Elijo State Park, projection of Liverpool Drive A+ A+ B
Cardiff State Beach San Elijo Lagoon outlet A+ A+ A+
Charthouse parking, slightly south of Kilkeny A+ A+ A
Las Olas, 100 yds. south of Charthouse A+ A+ A+
Seaside State Park A+ A A+
Solana Beach Tide Beach Park, projection of Solana Vista Drive A+ A A+
Fletcher Cove, projection of Lomas Santa Fe Drive A+ A+ A+
Seascape Surf Beach Park A+
Del Mar San Dieguito River Beach A A A+
projection of 15th Street A+ A+
Torrey Pines Los Penasquitos Lagoon outlet A A+ A+
La Jolla Shores El Paseo Grande, near Scripps A
projection of Ave De La Playa A A+
La Jolla La Jolla Cove D D
South Casa Beach A A+
Ravina, south of Nicholson Point A+ A+
Windansea Beach projection of Playa Del Norte A A+
Pacific Beach Pacific Beach Point, downcoast of Linda Way A A+
Tourmaline Surf Park, projection of Tourmaline Street A A+
projection of Grand Avenue A+
Mission Beach Belmont Park A+ A+ A

53HEAL THE BAY // 2016-2017 BEACH REPORT CARD
SummerDry WinterDry WetWeather (Apr-Oct) (Nov-Mar) Year-Round
// Beach Bummer and Honor Roll names appear in color/bold.
V. APPENDIX / B-1 CALIFORNIA GRADES BY COUNTY
SAN DIEGO COUNTY (CONTINUED)
Mission Bay Bonita Cove, east cove A
Bahia Point-northside, apex of Gleason Road A
Fanuel Park, projection of Fanuel Street A
Crown Point Shores A+
Wildlife Refuge near fence, projection of Lamont Street A+
Campland, west of Rose Creek A A+
DeAnza Cove, mid-cove A A+
Visitor’s Center, projection of Clairemont Drive C F
Comfort Station north of Leisure Lagoon A F
Leisure Lagoon, swim area A A
Tecolote Playground, watercraft area A A+
Tecolote Shores, swim area A C
Vacation Isle Ski Beach A+
Vacation Isle North Cove Beach A
Ocean Beach San Diego River outlet (Dog Beach) A A B
Stub Jetty A A+ D
Ocean Beach Pier, northside at Newport Avenue A A C
Ocean Pier, projection of Narragansett Avenue A+ A+ B
projection of Bermuda Avenue A A+ B
Sunset Cliffs projection of Ladera Street A+ B
Point Loma Point Loma Treatment Plant A+ A+ A
Point Loma Lighthouse A+ A+ A+
San Diego Bay Shelter Island (Shoreline Beach Park) B F A
Spanish Landing Park beach A A+
Bayside Park, projection of J Street A A+
Glorietta Bay Park at boat launch A A+
Tidelands Park, projection of Mullinix Drive A F
Coronado projection of Ave del Sol A+ A C
Silver Strand A+ A+ D
Imperial Beach projection of Carnation Ave. A+ B C
Imperial Beach Pier A C D
projection of Cortez Avenue F D
south end of Seacoast Drive A F F
Tijuana Slough NWRS 3/4 mi. N of TJ River A F F
Tijuana Rivermouth B F F
Border Field State Park proj. of Monument Rd. A+ F F
Border Fence, north side A+ B F
La Jolla projection of Vista De La Playa A+
Windansea Beach, projection of Bonair Street A+

54HEAL THE BAY // 2016-2017 BEACH REPORT CARD
SummerDry WinterDry WetWeather (Apr-Oct) (Nov-Mar) Year-Round
// Beach Bummer and Honor Roll names appear in color/bold.
V. APPENDIX / B-1 CALIFORNIA GRADES BY COUNTY
Orange County
Seal Beach projection of 1st Street A B F
projection of 8th Street A A F
Seal Beach Pier, 100 yards south A A F
projection of 14th Street A+ A F
Surfside Beach projection of Sea Way A+ A C
Sunset Beach projection of Broadway A+ A+ B
Bolsa Chica Beach across from the Reserve Flood Gates A A+ C
Reserve at the downcoast end of the State Beach A+ A D
Huntington Beach Bluffs A A+ B
projection of 17th Street A+ A C
Jack’s Snack Bar at Huntington Street A+ A C
projection of Beach Boulevard A A+ D
projection of Newland Street (SCE Plant) A A+ B
projection of Magnolia Street A A A
projection of Brookhurst Street A B B
Santa Ana River Mouth A A C
Newport Beach projection of Orange Street A+ A+ D
projection of 52nd/53rd Street A+ A+ A
projection of 38th Street A+ C A
Balboa Beach, projection of 15th/16th Street A+ A+ A+
Balboa Pier A+ A+ A+
The Wedge A+ A+ B
Huntington Harbor Mothers Beach - Orange County A C F
Trinidad Lane Beach A+ A+ C
Seagate Lagoon A+ A+ D
Humboldt Beach A+ A D
Davenport Beach A+ A F
Coral Cay Beach A B F
11th Street Beach A+ A+ F
Newport Bay Newport Dunes - North A+ A+ F
Newport Dunes - East A A+ F
Newport Dunes - Middle A+ A+ F
Newport Dunes - West A+ A+ F
Bayshore Beach A+ A F
Via Genoa Beach A+ A D
Lido Yacht Club Beach A F
Garnet Avenue Beach A A+ D
Sapphire Avenue Beach A+ C D
Abalone Avenue Beach F A C
Park Avenue Beach A+ A+ B
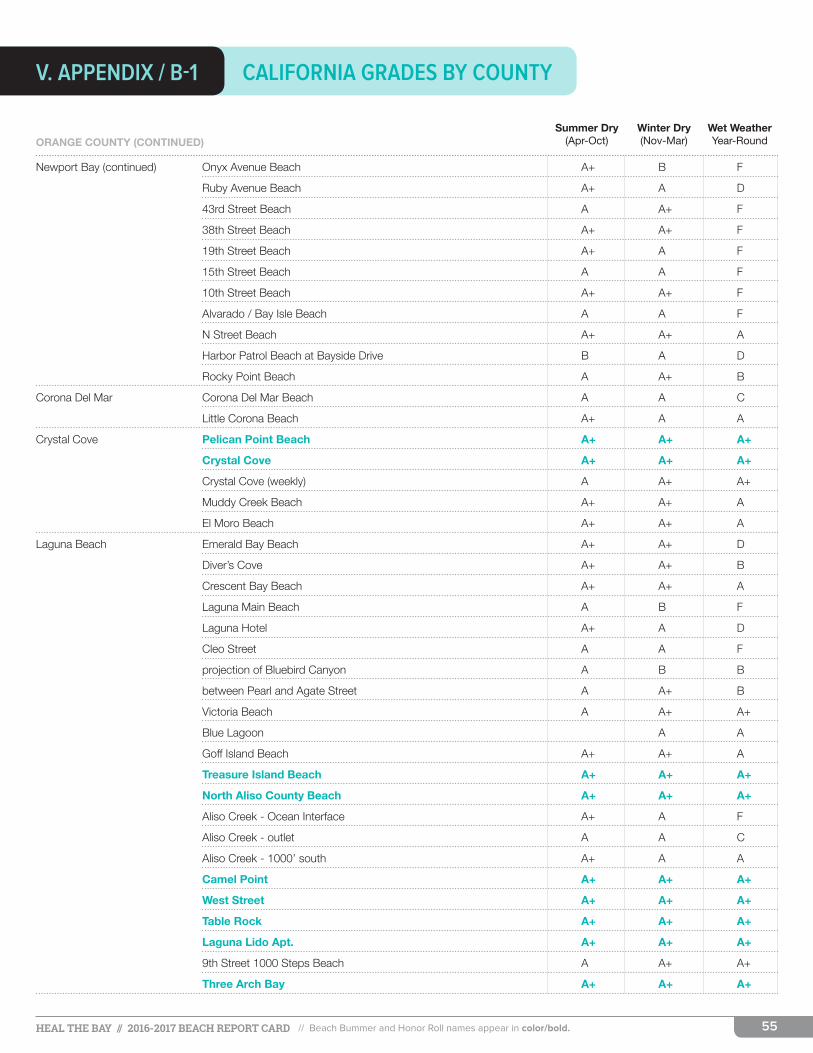
55HEAL THE BAY // 2016-2017 BEACH REPORT CARD
SummerDry WinterDry WetWeather (Apr-Oct) (Nov-Mar) Year-Round
// Beach Bummer and Honor Roll names appear in color/bold.
V. APPENDIX / B-1 CALIFORNIA GRADES BY COUNTY
ORANGE COUNTY (CONTINUED)
Newport Bay (continued) Onyx Avenue Beach A+ B F
Ruby Avenue Beach A+ A D
43rd Street Beach A A+ F
38th Street Beach A+ A+ F
19th Street Beach A+ A F
15th Street Beach A A F
10th Street Beach A+ A+ F
Alvarado / Bay Isle Beach A A F
N Street Beach A+ A+ A
Harbor Patrol Beach at Bayside Drive B A D
Rocky Point Beach A A+ B
Corona Del Mar Corona Del Mar Beach A A C
Little Corona Beach A+ A A
Crystal Cove Pelican Point Beach A+ A+ A+
Crystal Cove A+ A+ A+
Crystal Cove (weekly) A A+ A+
Muddy Creek Beach A+ A+ A
El Moro Beach A+ A+ A
Laguna Beach Emerald Bay Beach A+ A+ D
Diver’s Cove A+ A+ B
Crescent Bay Beach A+ A+ A
Laguna Main Beach A B F
Laguna Hotel A+ A D
Cleo Street A A F
projection of Bluebird Canyon A B B
between Pearl and Agate Street A A+ B
Victoria Beach A A+ A+
Blue Lagoon A A
Goff Island Beach A+ A+ A
Treasure Island Beach A+ A+ A+
North Aliso County Beach A+ A+ A+
Aliso Creek - Ocean Interface A+ A F
Aliso Creek - outlet A A C
Aliso Creek - 1000’ south A+ A A
Camel Point A+ A+ A+
West Street A+ A+ A+
Table Rock A+ A+ A+
Laguna Lido Apt. A+ A+ A+
9th Street 1000 Steps Beach A A+ A+
Three Arch Bay A+ A+ A+

56HEAL THE BAY // 2016-2017 BEACH REPORT CARD
SummerDry WinterDry WetWeather (Apr-Oct) (Nov-Mar) Year-Round
// Beach Bummer and Honor Roll names appear in color/bold.
V. APPENDIX / B-1 CALIFORNIA GRADES BY COUNTY
ORANGE COUNTY (CONTINUED)
Dana Point Monarch Beach North D F F
Salt Creek Beach A+ A+ A
Dana Strands Beach (AWMA) A A+ A+
Marine Science Institute Beach (SERRA) A+ A+ A
Doheny State Beach, North Beach B F F
Doheny State Beach, Mid-Beach, north of San Juan Creek A B F
Doheny State Beach, San Juan Creek Ocean Interface A F F
Doheny State Beach, San Juan Creek Interface A+ F F
Doheny State Beach, 1000' so. of SERRA Outfall (last campground) A F D
Doheny State Beach, 2000' so. of SERRA Outfall A A D
Doheny State Beach, South Day Use Area drain A+ A F
Doheny State Beach, 3000' so. of SERRA Outfall (pedestrian bridge) A+ A D
Doheny State Beach, End of the park A+ A D
Capistrano County Beach, 5000' so. of SERRA Outfall A A+ A+
Capistrano County Beach, drain A+ A C
Capistrano Bay Community Beach A A+ A+
Capistrano, proj. of Camino Estrella, 7500' so. of SERRA Outfall A+ A+ A+
So. Capistrano Bay Comm. Beach, 10000' so. of SERRA Outfall A+ A+ A+
San Clemente Poche Beach A+ A+ A+
Poche Creek ocean interface A A F
Capistrano Shores north A+ F
Pico drain at North Beach A D
North beach at Avenida Pico (20000’ south of Outfall) A+ B
Mariposa Beach A+ F
Linda Lane Beach A+ C
San Clemente Pier, Lifeguard Building north A+ A+ B
San Clemente Pier, drain F F C
Trafalgar Canyon A A F
Boca del Canon Beach A+ A
Riviera Beach A+ A+
at Avenida Calafia A+ A A
at Avenida Las Palmeras A+ A
Dana Point Harbor Baby Beach - West End A A B
Baby Beach - Buoy Line A A+ C
Baby Beach - Swim Area B A C
Baby Beach - East End A+ A+ C
Guest Dock A+ A+ B
Youth Dock A+ A+ A

57HEAL THE BAY // 2016-2017 BEACH REPORT CARD
SummerDry WinterDry WetWeather (Apr-Oct) (Nov-Mar) Year-Round
// Beach Bummer and Honor Roll names appear in color/bold.
V. APPENDIX / B-1 CALIFORNIA GRADES BY COUNTY
Los Angeles County
Malibu Leo Carrillo Beach at Arroyo Sequit Creek mouth A+ A+ B
Nicholas Beach at San Nicholas Canyon Creek mouth A+ A+ A
El Matador State Beach at Encinal Canyon A+ A+ A+
Broad Beach at Trancas Creek mouth A+ A C
Zuma Beach at Zuma Creek mouth A+ A+ B
Walnut Creek, outlet projection of Wildlife Road A+ A C
Unnamed Creek, projection of Zumirez Drive (Little Dume) A A+ A+
Paradise Cove Pier at Ramirez Canyon Creek mouth A A C
Escondido Creek, just east of Escondido State Beach A+ A+ B
Latigo Canyon Creek mouth A+ A B
Solstice Canyon at Dan Blocker County Beach A+ A A
Unnamed Creek, adjacent to public stairway at 24822 Malibu Road A+ A A
Puerco State Beach at creek mouth A+ C C
Marie Canyon storm drain at Puerco Beach at 24572 Malibu Road A+ A F
Malibu Point A+ A+ A+
Surfrider Beach (breach point) A D F
Carbon Beach at Sweetwater Canyon A+ A+ D
Las Flores State Beach at Las Flores Creek A+ A A+
Big Rock Beach at 19948 Pacific Coast Highway stairs A+ A B
Pena Creek at Las Tunas County Beach A+ A
Topanga Beach at creek mouth B C F
Castle Rock Beach Castlerock storm drain A+ A F
Will Rogers State Beach Santa Ynez drain at Sunset Boulevard A A+ F
17200 Pacific Coast Highway (1/4 mile east of Sunset drain) A+ C
at Bel Air Bay Club drain, near fence A A+ F
at Pulga Canyon storm drain A+ A+ F
at Temescal Canyon drain A+ A+ F
at Santa Monica Canyon drain A C F
Santa Monica at Montana Avenue drain A B F
Santa Monica Beach at Wilshire Boulevard drain A A F
Santa Monica Municipal Pier D F F
Santa Monica Beach at Pico/Kenter storm drain A A F
at Strand Street, in front of the restrooms A+ A F
Ocean Park Beach at Ashland Avenue drain A A F
Venice Beach at the Rose Avenue storm drain A+ A+ F
at Brooks Avenue drain A+ A D
at Windward Avenue drain A+ A+ A
Pier, 50 yards south A A D
at Topsail Street A A+ F

58HEAL THE BAY // 2016-2017 BEACH REPORT CARD
SummerDry WinterDry WetWeather (Apr-Oct) (Nov-Mar) Year-Round
// Beach Bummer and Honor Roll names appear in color/bold.
V. APPENDIX / B-1 CALIFORNIA GRADES BY COUNTY
LOS ANGELES COUNTY (CONTINUED)
Marina del Rey Mothers’ Beach, playground area A A F
Mothers’ Beach, lifeguard tower A B F
Mothers’ Beach, between Tower and Boat dock D F F
Playa del Rey Dockweiler Beach at Culver Boulevard drain A A F
Dockweiler Beach at North Westchester storm drain A A A
Dockweiler Beach at World Way (south of D&W jetty) A A F
Dockweiler Beach at Imperial Highway drain A+ A+ C
Hyperion Treatment Plant, one mile outfall A+ A B
El Segundo El Segundo Beach at Grand Avenue drain A A+ F
Manhattan Beach El Porto Beach at 40th Street A A+ A
at 28th Street drain A A F
Manhattan Beach Pier drain A A+ B
Hermosa Beach at 26th Street A+ A B
Hermosa Beach Pier- 50 yards south A A+ B
Herondo Street storm drain- (in front of the drain) A A F
Redondo Beach Redondo Pier, 100 yards south A B B
at Sapphire Street A A C
at Topaz Street - north of jetty A A B
Torrance at Avenue I drain A A C
Palos Verdes Peninsula Malaga Cove at trail outlet A A+ A
Malaga Cove at rocks A A+ D
Bluff Cove A+ A+ A+
Long Point A+ A+ B
Abalone Cove Shoreline Park A+ A+ C
Portuguese Bend Cove A+ A+ A+
San Pedro Royal Palms State Beach A+ A B
Wilder Annex A+ A B
Cabrillo Beach, oceanside A A+ A+
Cabrillo Beach, harborside at restrooms B B F
Cabrillo Beach, harborside at boat launch A A F
Long Beach projection of 5th Place A C F
projection of 10th Place A C F
projection of Molino Avenue A C F
projection of Coronado Avenue C B F
Belmont Pier, west side A B F
projection of Prospect Avenue A B F
projection of Granada Avenue (Rosie’s Dog Beach) B C F
Alamitos Bay, 2nd Street Bridge & Bayshore A B F
Alamitos Bay, shore float A+ A+ F

59HEAL THE BAY // 2016-2017 BEACH REPORT CARD
SummerDry WinterDry WetWeather (Apr-Oct) (Nov-Mar) Year-Round
// Beach Bummer and Honor Roll names appear in color/bold.
V. APPENDIX / B-1 CALIFORNIA GRADES BY COUNTY
LOS ANGELES COUNTY (CONTINUED)
Long Beach (continued) Mother’s Beach, north end A B F
Alamitos Bay, 56th Place on bayside A+ A F
projection of 55th Place A A F
projection of 72nd Place A+ F F
Catalina Island Avalon Beach, east of the Casino Arch, at the steps A A
Avalon Beach, 100 feet west of the Green Pleasure Pier A A+
Avalon Beach, 50 feet west of the Green Pleasure Pier A A+
Avalon Beach, 50 feet east of the Green Pleasure Pier A A+
Avalon Beach, 100 feet east of the Green Pleasure Pier A A+
Ventura County
Ventura Rincon Beach, 25 yards south of the creek mouth A+ A B
Rincon Beach, at end of the footpath A+ A+
La Conchita La Conchita Beach, Ocean View Road A+ A+
Ventura Oil Piers Beach, south of drain A A+
Hobson County Park, base of stairs to the beach A+ A+
Faria County Park, stairs A+ A C
Mandos Cove, point zero A+ A+
Solimar Beach south, end of east gate access road A A B
Emma Wood State Beach, 50 yards south of first drain A+ A B
Surfer’s Point at Seaside, end of access path via wooden gate A A+ C
Promenade Park, Figueroa Street A+ A+ C
Promenade Park, Redwood Apts. A+ A+
Promenade Park, Holiday Inn south of drain at California Street A A+
San Buenaventura Beach, south of drain at Kalorama Street A A+
San Buenaventura Beach, south of drain at San Jon Road A A+ D
San Buenaventura Beach, south of drain at Dover Lane A+ A+
San Buenaventura Beach, south of drain at Weymouth Lane A+ A+
Ventura Harbour area Marina Park, beach at north end of playground A+ A+
Peninsula Beach, beach area north of South Jetty A A+
Surfer’s Knoll, beach adjacent to parking lot A A+ A
Channel Islands Harbor Hollywood Beach, Los Robles Street, south of drain A A+ A
Hobie Beach Lakshore Drive A+ C
Beach Park at south end of Victoria Avenue A D F
Silverstrand Beach, San Nicholas Avenue, south of jetty A A A
Silverstrand Beach, Santa Paula Drive, south of drain A+ A+ A
Silverstrand Beach, Sawtelle Avenue, south of drain A+ A+ A+
Port Hueneme Beach Park, 50 yards north of the Pier A A C

60HEAL THE BAY // 2016-2017 BEACH REPORT CARD
SummerDry WinterDry WetWeather (Apr-Oct) (Nov-Mar) Year-Round
// Beach Bummer and Honor Roll names appear in color/bold.
V. APPENDIX / B-1 CALIFORNIA GRADES BY COUNTY
VENTURA COUNTY (CONTINUED)
Oxnard Ormond Beach, J Street drain A+ A+ F
Ormond Beach, Oxnard Industrial drain 50 yards north of the drain A+ A+
Ormond Beach, Arnold Road A+ A+ B
County Line Beach point zero A+ A+
Santa Barbara County
Lompoc Jalama Beach A B
Goleta Gaviota State Beach A A
Refugio State Beach A F
El Capitan State Beach A F
Isla Vista Sands at Coal Oil Point A+ B
Goleta Goleta Beach A F
Hope Ranch Hope Ranch Beach A+ F
Santa Barbara Arroyo Burro Beach F F
Leadbetter Beach A F
Santa Barbara (continued) East Beach at Mission Creek A F
East Beach at Sycamore Creek A+ F
Montecito Butterfly Beach A C
Hammond’s Beach A D
Summerland Summerland Beach A+ D
Carpinteria Carpinteria State Beach A+ D
San Luis Obispo County
San Simeon Hearst Memorial State Beach, 100 yards west of pier at creek outfall A+ A
Pico Avenue A+ A+ A+
Cayucos State Beach North of pier at outfall A+ A
downcoast of the pier A A B
Studio Drive, parking lot near Old Creek A+ A+ B
Morro Strand State Beach projection of Beachcomber Drive A+ A+ B
Morro Bay City Beach projection of Atascadero A A+ B
Morro Creek, south side A A+ B
75 feet north of main parking lot A+ A+ A+
Avila Beach Olde Port Beach, Harford Beach, north A A F
350 yards west of pier at creek outfall A+ F
projection of San Luis Street A A+ B
Pismo Beach Sewers at Silver Shoals Drive A A A
projection of Wadsworth Street A+ A+ B
Pismo Beach Pier, 40 feet south of the pier B A B
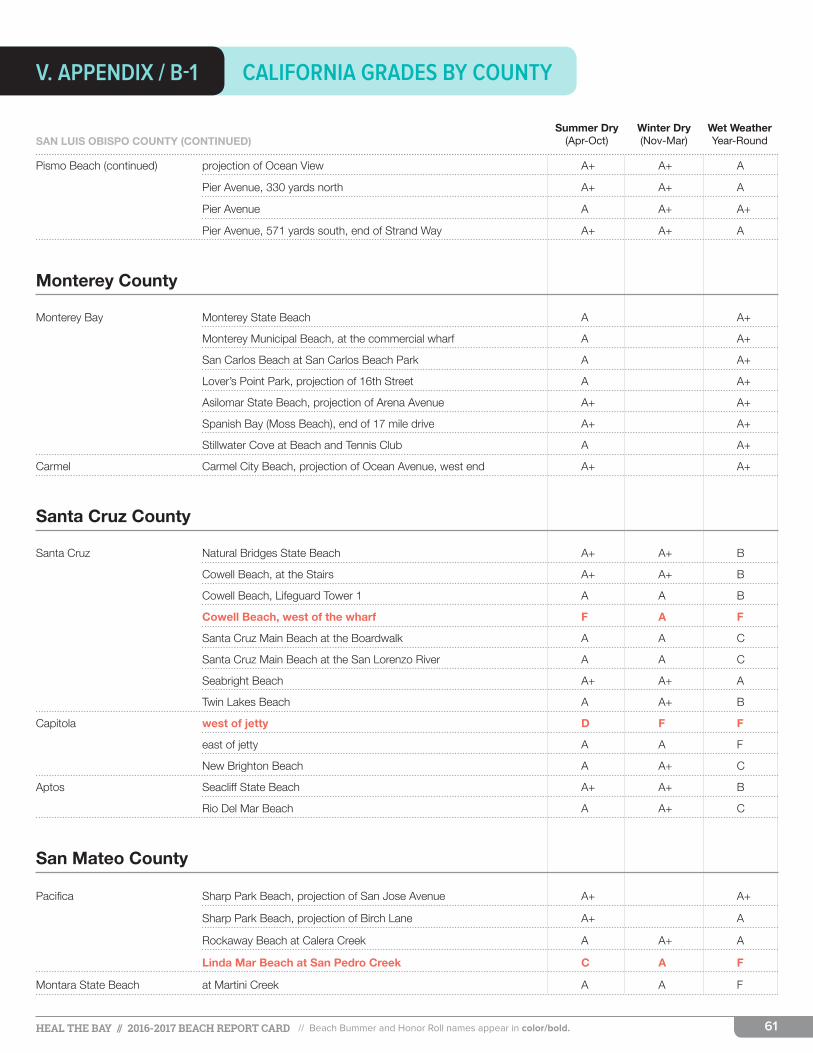
61HEAL THE BAY // 2016-2017 BEACH REPORT CARD
SummerDry WinterDry WetWeather (Apr-Oct) (Nov-Mar) Year-Round
// Beach Bummer and Honor Roll names appear in color/bold.
V. APPENDIX / B-1 CALIFORNIA GRADES BY COUNTY
SAN LUIS OBISPO COUNTY (CONTINUED)
Pismo Beach (continued) projection of Ocean View A+ A+ A
Pier Avenue, 330 yards north A+ A+ A
Pier Avenue A A+ A+
Pier Avenue, 571 yards south, end of Strand Way A+ A+ A
Monterey County
Monterey Bay Monterey State Beach A A+
Monterey Municipal Beach, at the commercial wharf A A+
San Carlos Beach at San Carlos Beach Park A A+
Lover’s Point Park, projection of 16th Street A A+
Asilomar State Beach, projection of Arena Avenue A+ A+
Spanish Bay (Moss Beach), end of 17 mile drive A+ A+
Stillwater Cove at Beach and Tennis Club A A+
Carmel Carmel City Beach, projection of Ocean Avenue, west end A+ A+
Santa Cruz County
Santa Cruz Natural Bridges State Beach A+ A+ B
Cowell Beach, at the Stairs A+ A+ B
Cowell Beach, Lifeguard Tower 1 A A B
Cowell Beach, west of the wharf F A F
Santa Cruz Main Beach at the Boardwalk A A C
Santa Cruz Main Beach at the San Lorenzo River A A C
Seabright Beach A+ A+ A
Twin Lakes Beach A A+ B
Capitola west of jetty D F F
east of jetty A A F
New Brighton Beach A A+ C
Aptos Seacliff State Beach A+ A+ B
Rio Del Mar Beach A A+ C
San Mateo County
Pacifica Sharp Park Beach, projection of San Jose Avenue A+ A+
Sharp Park Beach, projection of Birch Lane A+ A
Rockaway Beach at Calera Creek A A+ A
Linda Mar Beach at San Pedro Creek C A F
Montara State Beach at Martini Creek A A F
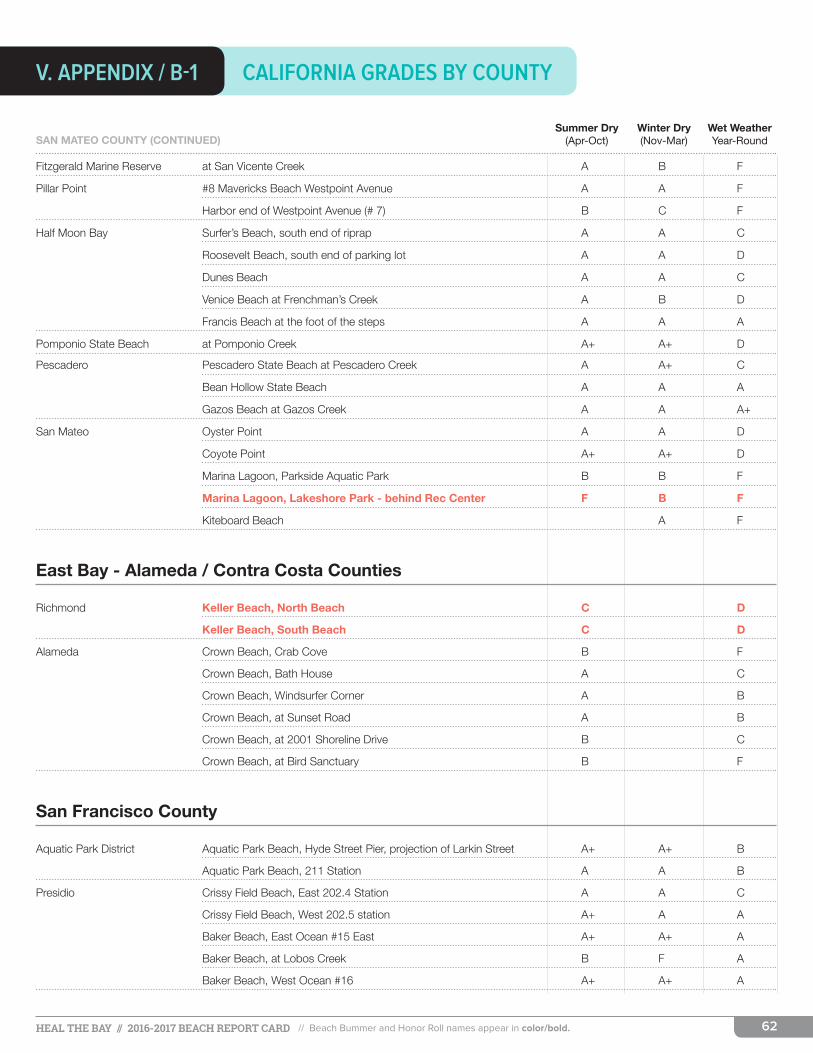
62HEAL THE BAY // 2016-2017 BEACH REPORT CARD
SummerDry WinterDry WetWeather (Apr-Oct) (Nov-Mar) Year-Round
// Beach Bummer and Honor Roll names appear in color/bold.
V. APPENDIX / B-1 CALIFORNIA GRADES BY COUNTY
SAN MATEO COUNTY (CONTINUED)
Fitzgerald Marine Reserve at San Vicente Creek A B F
Pillar Point #8 Mavericks Beach Westpoint Avenue A A F
Harbor end of Westpoint Avenue (# 7) B C F
Half Moon Bay Surfer’s Beach, south end of riprap A A C
Roosevelt Beach, south end of parking lot A A D
Dunes Beach A A C
Venice Beach at Frenchman’s Creek A B D
Francis Beach at the foot of the steps A A A
Pomponio State Beach at Pomponio Creek A+ A+ D
Pescadero Pescadero State Beach at Pescadero Creek A A+ C
Bean Hollow State Beach A A A
Gazos Beach at Gazos Creek A A A+
San Mateo Oyster Point A A D
Coyote Point A+ A+ D
Marina Lagoon, Parkside Aquatic Park B B F
Marina Lagoon, Lakeshore Park - behind Rec Center F B F
Kiteboard Beach A F
East Bay - Alameda / Contra Costa Counties
Richmond Keller Beach, North Beach C D
Keller Beach, South Beach C D
Alameda Crown Beach, Crab Cove B F
Crown Beach, Bath House A C
Crown Beach, Windsurfer Corner A B
Crown Beach, at Sunset Road A B
Crown Beach, at 2001 Shoreline Drive B C
Crown Beach, at Bird Sanctuary B F
San Francisco County
Aquatic Park District Aquatic Park Beach, Hyde Street Pier, projection of Larkin Street A+ A+ B
Aquatic Park Beach, 211 Station A A B
Presidio Crissy Field Beach, East 202.4 Station A A C
Crissy Field Beach, West 202.5 station A+ A A
Baker Beach, East Ocean #15 East A+ A+ A
Baker Beach, at Lobos Creek B F A
Baker Beach, West Ocean #16 A+ A+ A

63HEAL THE BAY // 2016-2017 BEACH REPORT CARD
SummerDry WinterDry WetWeather (Apr-Oct) (Nov-Mar) Year-Round
// Beach Bummer and Honor Roll names appear in color/bold.
V. APPENDIX / B-1 CALIFORNIA GRADES BY COUNTY
SAN FRANCISCO COUNTY (CONTINUED)
Seacliff China Beach, end of Sea Cliff Avenue A A+ A
Sunset District Ocean Beach, projection of Balboa Avenue A+ A+ B
Ocean Beach, projection of Lincoln Way A+ A+ D
Ocean Beach, projection of Sloat Boulevard A A+ A
Islais Channel Islais Landing A A+ F
Candlestick Point Jackrabbit Beach A F D
Windsurfer Circle B F F
Sunnydale Cove A D F
Marin County
Tomales Bay Dillon Beach A+ A+
Lawson’s Landing A A+
Miller Park A A+
Heart’s Desire A+ A+
Shell Beach A A+
Chicken Ranch Beach at Creek A+ A
Millerton Point A A+
Bolinas Bay Bolinas Beach, Wharf Road A A+
Stinson Beach, North A D
Stinson Beach, Central A D
Stinson Beach, South A+ D
Muir Beach North A D
Central A+ F
South A D
Rodeo Cove Rodeo Beach. North A+ A+
Rodeo Beach. Central A+ A+
Rodeo Beach. South A+ A+
Fort Baker Horseshoe Bay SW A A
Horseshoe Bay NW A A+
Horseshoe Bay NE A B
Sausalito Schoonmaker Beach A B
San Rafael China Camp A A+
McNears Beach A A+

64HEAL THE BAY // 2016-2017 BEACH REPORT CARD
SummerDry WinterDry WetWeather (Apr-Oct) (Nov-Mar) Year-Round
// Beach Bummer and Honor Roll names appear in color/bold.
V. APPENDIX / B-1 CALIFORNIA GRADES BY COUNTY
Sonoma County
Gualala Gualala Regional Park Beach A+ A+
Sea Ranch Black Point Beach A+ A+
Jenner Stillwater Cove Regional Park Beach A+ A+
Goat Rock State Park Beach A+ A+
Bodega Bay Salmon Creek State Park Beach A A+
Campbell Cove State Park Beach A B
Doran Regional Park Beach A A
Mendocino County
Fort Bragg MacKerricher State Park at Virgin Creek A+ A+
Pudding Creek Ocean Outlet A A
Hare Creek A A+
Mendocino Caspar Beach at Caspar Creek A+ C
Big River near PCH A A+
Little River Van Damme State Park at the Little River A A+
Humboldt / Del Norte Counties
Crescent City Battery Point Lighthouse A+ A+
Trinidad Trinidad State Beach near Mill Creek A A
Luffenholtz Beach near Luffenholtz Creek D C
Moonstone County Park, ittle River State Beach A B
McKinleyville Clam Beach County Park near Strawberry Creek F F
Mad River Mouth, north A A
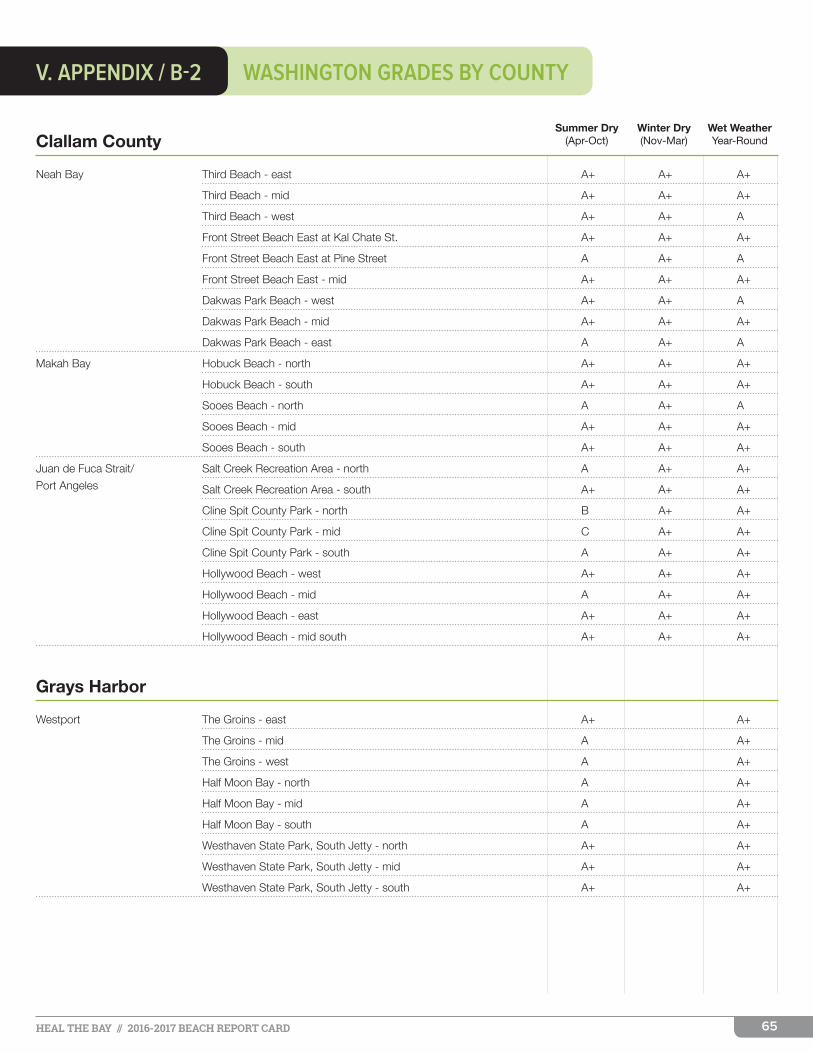
65HEAL THE BAY // 2016-2017 BEACH REPORT CARD
WASHINGTON GRADES BY COUNTY
SummerDry WinterDry WetWeather (Apr-Oct) (Nov-Mar) Year-Round
V. APPENDIX / B-2
Clallam County
Neah Bay Third Beach - east A+ A+ A+
Third Beach - mid A+ A+ A+
Third Beach - west A+ A+ A
Front Street Beach East at Kal Chate St. A+ A+ A+
Front Street Beach East at Pine Street A A+ A
Front Street Beach East - mid A+ A+ A+
Dakwas Park Beach - west A+ A+ A
Dakwas Park Beach - mid A+ A+ A+
Dakwas Park Beach - east A A+ A
Makah Bay Hobuck Beach - north A+ A+ A+
Hobuck Beach - south A+ A+ A+
Sooes Beach - north A A+ A
Sooes Beach - mid A+ A+ A+
Sooes Beach - south A+ A+ A+
Juan de Fuca Strait/ Salt Creek Recreation Area - north A A+ A+
Port Angeles Salt Creek Recreation Area - south A+ A+ A+
Cline Spit County Park - north B A+ A+
Cline Spit County Park - mid C A+ A+
Cline Spit County Park - south A A+ A+
Hollywood Beach - west A+ A+ A+
Hollywood Beach - mid A A+ A+
Hollywood Beach - east A+ A+ A+
Hollywood Beach - mid south A+ A+ A+
Grays Harbor
Westport The Groins - east A+ A+
The Groins - mid A A+
The Groins - west A A+
Half Moon Bay - north A A+
Half Moon Bay - mid A A+
Half Moon Bay - south A A+
Westhaven State Park, South Jetty - north A+ A+
Westhaven State Park, South Jetty - mid A+ A+
Westhaven State Park, South Jetty - south A+ A+

66HEAL THE BAY // 2016-2017 BEACH REPORT CARD
WASHINGTON GRADES BY COUNTY
SummerDry WinterDry WetWeather (Apr-Oct) (Nov-Mar) Year-Round
V. APPENDIX / B-2
Island County
Whidbey Island Oak Harbor Lagoon - mid A A+
Oak Harbor Lagoon - north west A A+
Oak Harbor Lagoon - south east A A+
Freeland County Park, Holmes Harbor - west C A+
Freeland County Park, Holmes Harbor - mid F F
Freeland County Park, Holmes Harbor - east F F
Jefferson County
Port Townsend Fort Worden State Park - north A A+
Fort Worden State Park - mid A+ A+
Fort Worden State Park - south A+ A+
King County
Shoreline Richmond Beach, Saltwater Park - north A+ A+
Richmond Beach, Saltwater Park - mid A+ A+
Richmond Beach, Saltwater Park - south A A+
Seattle Carkeek Park - north A+ A+
Carkeek Park - mid A+ A+
Carkeek Park - south A+ A+
Golden Gardens - north A A+
Golden Gardens - mid A B
Golden Gardens - south F B
Alki Beach Park - north A+ A+
Alki Beach Park - mid A+ A+
Alki Beach Park - south A+ B
Richey Viewpoint - north A+ A+
Richey Viewpoint - mid A A
Richey Viewpoint - south B A+
Lincoln Park - north A+ B
Lincoln Park - mid A+ A+
Lincoln Park - south A C
Burien Seahurst (Ed Munro) Park - north A A+
Seahurst (Ed Munro) Park - mid A+ A+
Seahurst (Ed Munro) Park - south A+ A+
Des Moines Saltwater State Park - north A A+
Saltwater State Park - mid B D
Saltwater State Park - south A A+
Redondo County Park - north A A+
Redondo County Park - mid A A+
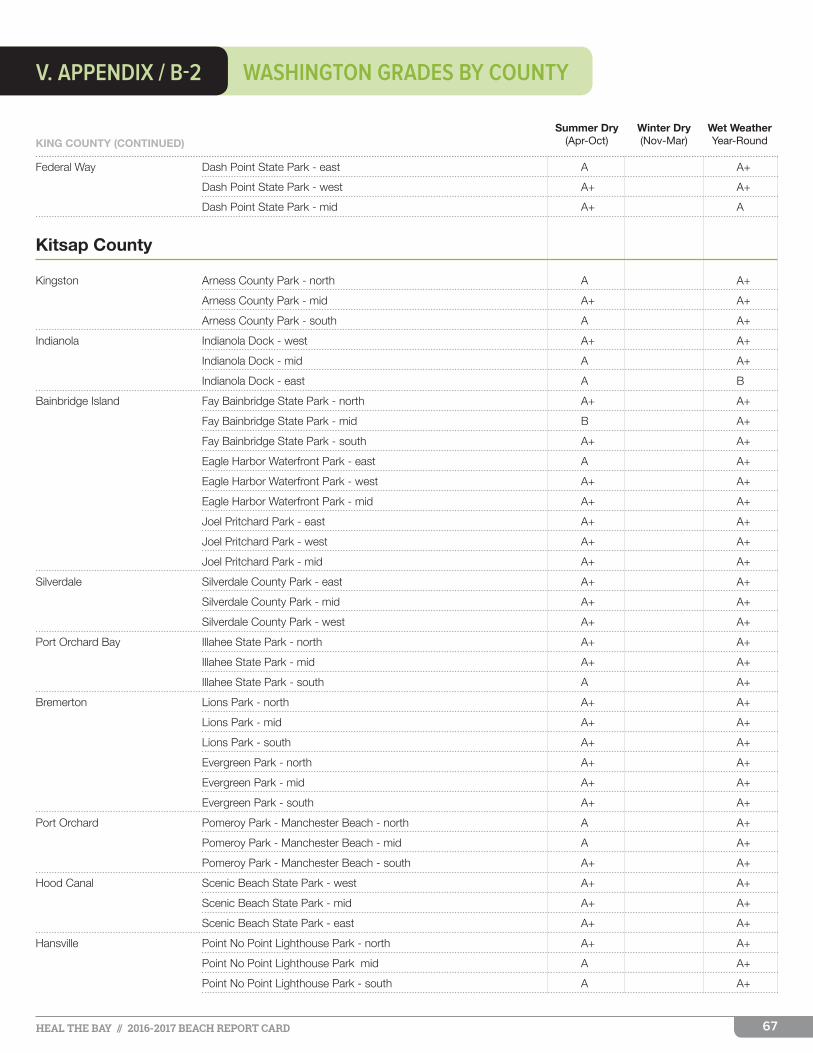
67HEAL THE BAY // 2016-2017 BEACH REPORT CARD
WASHINGTON GRADES BY COUNTY
SummerDry WinterDry WetWeather (Apr-Oct) (Nov-Mar) Year-Round
V. APPENDIX / B-2
KING COUNTY (CONTINUED)
Federal Way Dash Point State Park - east A A+
Dash Point State Park - west A+ A+
Dash Point State Park - mid A+ A
Kitsap County
Kingston Arness County Park - north A A+
Arness County Park - mid A+ A+
Arness County Park - south A A+
Indianola Indianola Dock - west A+ A+
Indianola Dock - mid A A+
Indianola Dock - east A B
Bainbridge Island Fay Bainbridge State Park - north A+ A+
Fay Bainbridge State Park - mid B A+
Fay Bainbridge State Park - south A+ A+
Eagle Harbor Waterfront Park - east A A+
Eagle Harbor Waterfront Park - west A+ A+
Eagle Harbor Waterfront Park - mid A+ A+
Joel Pritchard Park - east A+ A+
Joel Pritchard Park - west A+ A+
Joel Pritchard Park - mid A+ A+
Silverdale Silverdale County Park - east A+ A+
Silverdale County Park - mid A+ A+
Silverdale County Park - west A+ A+
Port Orchard Bay Illahee State Park - north A+ A+
Illahee State Park - mid A+ A+
Illahee State Park - south A A+
Bremerton Lions Park - north A+ A+
Lions Park - mid A+ A+
Lions Park - south A+ A+
Evergreen Park - north A+ A+
Evergreen Park - mid A+ A+
Evergreen Park - south A+ A+
Port Orchard Pomeroy Park - Manchester Beach - north A A+
Pomeroy Park - Manchester Beach - mid A A+
Pomeroy Park - Manchester Beach - south A+ A+
Hood Canal Scenic Beach State Park - west A+ A+
Scenic Beach State Park - mid A+ A+
Scenic Beach State Park - east A+ A+
Hansville Point No Point Lighthouse Park - north A+ A+
Point No Point Lighthouse Park mid A A+
Point No Point Lighthouse Park - south A A+
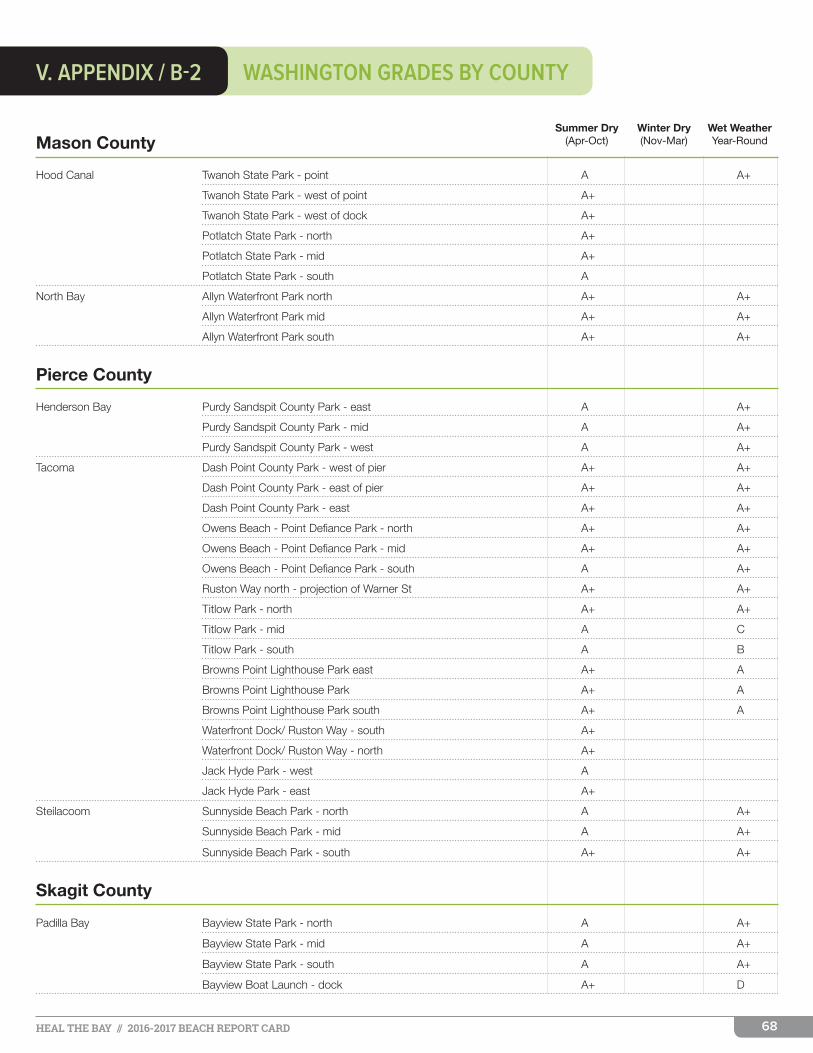
68HEAL THE BAY // 2016-2017 BEACH REPORT CARD
WASHINGTON GRADES BY COUNTY
SummerDry WinterDry WetWeather (Apr-Oct) (Nov-Mar) Year-Round
V. APPENDIX / B-2
Mason County
Hood Canal Twanoh State Park - point A A+
Twanoh State Park - west of point A+
Twanoh State Park - west of dock A+
Potlatch State Park - north A+
Potlatch State Park - mid A+
Potlatch State Park - south A
North Bay Allyn Waterfront Park north A+ A+
Allyn Waterfront Park mid A+ A+
Allyn Waterfront Park south A+ A+
Pierce County
Henderson Bay Purdy Sandspit County Park - east A A+
Purdy Sandspit County Park - mid A A+
Purdy Sandspit County Park - west A A+
Tacoma Dash Point County Park - west of pier A+ A+
Dash Point County Park - east of pier A+ A+
Dash Point County Park - east A+ A+
Owens Beach - Point Defiance Park - north A+ A+
Owens Beach - Point Defiance Park - mid A+ A+
Owens Beach - Point Defiance Park - south A A+
Ruston Way north - projection of Warner St A+ A+
Titlow Park - north A+ A+
Titlow Park - mid A C
Titlow Park - south A B
Browns Point Lighthouse Park east A+ A
Browns Point Lighthouse Park A+ A
Browns Point Lighthouse Park south A+ A
Waterfront Dock/ Ruston Way - south A+
Waterfront Dock/ Ruston Way - north A+
Jack Hyde Park - west A
Jack Hyde Park - east A+
Steilacoom Sunnyside Beach Park - north A A+
Sunnyside Beach Park - mid A A+
Sunnyside Beach Park - south A+ A+
Skagit County
Padilla Bay Bayview State Park - north A A+
Bayview State Park - mid A A+
Bayview State Park - south A A+
Bayview Boat Launch - dock A+ D

69HEAL THE BAY // 2016-2017 BEACH REPORT CARD
WASHINGTON GRADES BY COUNTY
SummerDry WinterDry WetWeather (Apr-Oct) (Nov-Mar) Year-Round
V. APPENDIX / B-2
Snohomish County
Stanwood Kayak Point County Park - north A+ A+
Kayak Point County Park - mid A+ A+
Kayak Point County Park - south A+ A+
Edmonds Picnic Point County Park - north A+ C
Picnic Point County Park - mid A+ C
Picnic Point County Park - south A+ A+
Edmonds Underwater Park - north A B
Edmonds Underwater Park - mid C F
Edmonds Underwater Park - south A+ A+
Marina Beach (No Dogs) - north A+ A+
Marina Beach (No Dogs) - mid A+ A
Marina Beach (No Dogs) - south A+ B
Mukilteo Mukilteo Lighthouse Park south A+ A+
Mukilteo Lighthouse Park mid A+ A+
Mukilteo Lighthouse Park north A+ A+
Thurston County
Olympia Burfoot County Park - north A A+
Burfoot County Park - mid A+ A+
Burfoot County Park - south A+ A+
Whatcom County
Bellingham Larrabee State Park Wildcat Cove - mid A+ A+
Larrabee State Park Wildcat Cove - west A A+
Larrabee State Park Wildcat Cove - south A+ A+
Little Squalicum Park east A F
Little Squalicum Park at creek outlet A+ A+
Little Squalicum Park far west of pier A A+
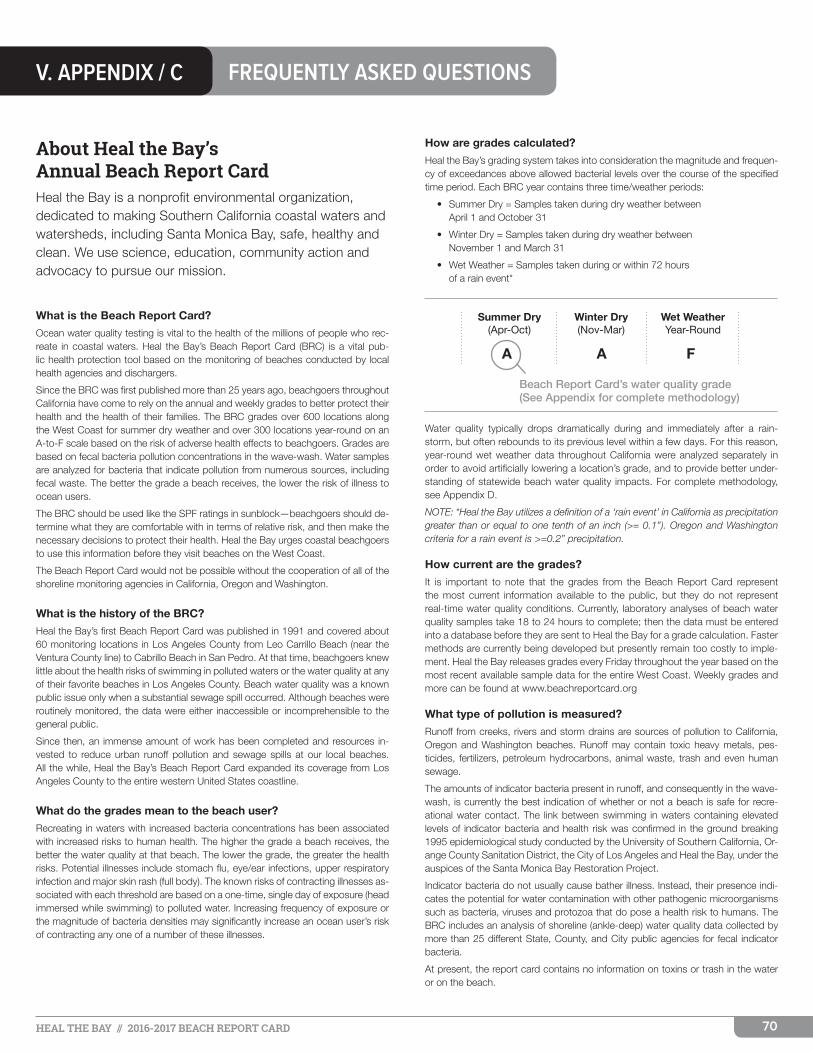
70HEAL THE BAY // 2016-2017 BEACH REPORT CARD
How are grades calculated?
Heal the Bay’s grading system takes into consideration the magnitude and frequen-cy of exceedances above allowed bacterial levels over the course of the specified time period. Each BRC year contains three time/weather periods:
• Summer Dry = Samples taken during dry weather between April 1 and October 31
• Winter Dry = Samples taken during dry weather between November 1 and March 31
• Wet Weather = Samples taken during or within 72 hours of a rain event*
Water quality typically drops dramatically during and immediately after a rain-storm, but often rebounds to its previous level within a few days. For this reason, year-round wet weather data throughout California were analyzed separately in order to avoid artificially lowering a location’s grade, and to provide better under-standing of statewide beach water quality impacts. For complete methodology, see Appendix D.
NOTE: *Heal the Bay utilizes a definition of a ‘rain event’ in California as precipitation greater than or equal to one tenth of an inch (>= 0.1”). Oregon and Washington criteria for a rain event is >=0.2” precipitation.
How current are the grades?
It is important to note that the grades from the Beach Report Card represent the most current information available to the public, but they do not represent real-time water quality conditions. Currently, laboratory analyses of beach water quality samples take 18 to 24 hours to complete; then the data must be entered into a database before they are sent to Heal the Bay for a grade calculation. Faster methods are currently being developed but presently remain too costly to imple-ment. Heal the Bay releases grades every Friday throughout the year based on the most recent available sample data for the entire West Coast. Weekly grades and more can be found at www.beachreportcard.org
What type of pollution is measured?
Runoff from creeks, rivers and storm drains are sources of pollution to California, Oregon and Washington beaches. Runoff may contain toxic heavy metals, pes-ticides, fertilizers, petroleum hydrocarbons, animal waste, trash and even human sewage.
The amounts of indicator bacteria present in runoff, and consequently in the wave-wash, is currently the best indication of whether or not a beach is safe for recre-ational water contact. The link between swimming in waters containing elevated levels of indicator bacteria and health risk was confirmed in the ground breaking 1995 epidemiological study conducted by the University of Southern California, Or-ange County Sanitation District, the City of Los Angeles and Heal the Bay, under the auspices of the Santa Monica Bay Restoration Project.
Indicator bacteria do not usually cause bather illness. Instead, their presence indi-cates the potential for water contamination with other pathogenic microorganisms such as bacteria, viruses and protozoa that do pose a health risk to humans. The BRC includes an analysis of shoreline (ankle-deep) water quality data collected by more than 25 different State, County, and City public agencies for fecal indicator bacteria.
At present, the report card contains no information on toxins or trash in the water or on the beach.
About Heal the Bay’s Annual Beach Report CardHeal the Bay is a nonprofit environmental organization, dedicated to making Southern California coastal waters and watersheds, including Santa Monica Bay, safe, healthy and clean. We use science, education, community action and advocacy to pursue our mission.
What is the Beach Report Card?
Ocean water quality testing is vital to the health of the millions of people who rec-reate in coastal waters. Heal the Bay’s Beach Report Card (BRC) is a vital pub-lic health protection tool based on the monitoring of beaches conducted by local health agencies and dischargers.
Since the BRC was first published more than 25 years ago, beachgoers throughout California have come to rely on the annual and weekly grades to better protect their health and the health of their families. The BRC grades over 600 locations along the West Coast for summer dry weather and over 300 locations year-round on an A-to-F scale based on the risk of adverse health effects to beachgoers. Grades are based on fecal bacteria pollution concentrations in the wave-wash. Water samples are analyzed for bacteria that indicate pollution from numerous sources, including fecal waste. The better the grade a beach receives, the lower the risk of illness to ocean users.
The BRC should be used like the SPF ratings in sunblock—beachgoers should de-termine what they are comfortable with in terms of relative risk, and then make the necessary decisions to protect their health. Heal the Bay urges coastal beachgoers to use this information before they visit beaches on the West Coast.
The Beach Report Card would not be possible without the cooperation of all of the shoreline monitoring agencies in California, Oregon and Washington.
What is the history of the BRC?
Heal the Bay’s first Beach Report Card was published in 1991 and covered about 60 monitoring locations in Los Angeles County from Leo Carrillo Beach (near the Ventura County line) to Cabrillo Beach in San Pedro. At that time, beachgoers knew little about the health risks of swimming in polluted waters or the water quality at any of their favorite beaches in Los Angeles County. Beach water quality was a known public issue only when a substantial sewage spill occurred. Although beaches were routinely monitored, the data were either inaccessible or incomprehensible to the general public.
Since then, an immense amount of work has been completed and resources in-vested to reduce urban runoff pollution and sewage spills at our local beaches. All the while, Heal the Bay’s Beach Report Card expanded its coverage from Los Angeles County to the entire western United States coastline.
What do the grades mean to the beach user?
Recreating in waters with increased bacteria concentrations has been associated with increased risks to human health. The higher the grade a beach receives, the better the water quality at that beach. The lower the grade, the greater the health risks. Potential illnesses include stomach flu, eye/ear infections, upper respiratory infection and major skin rash (full body). The known risks of contracting illnesses as-sociated with each threshold are based on a one-time, single day of exposure (head immersed while swimming) to polluted water. Increasing frequency of exposure or the magnitude of bacteria densities may significantly increase an ocean user’s risk of contracting any one of a number of these illnesses.
V. APPENDIX / C FREQUENTLY ASKED QUESTIONS
Summer Dry Winter Dry Wet Weather (Apr-Oct) (Nov-Mar) Year-Round
A A F
Beach Report Card’s water quality grade (See Appendix for complete methodology)

71HEAL THE BAY // 2016-2017 BEACH REPORT CARD
ABOUT INDICATOR BACTERIA
The most common types of indicator bacteria include:
• Total coliform• Fecal coliform (or E. coli)• Enterococcus
Total coliform, which contains coliform of all types, originates from many sources including soil, plants, animals and humans. Fecal coliform and En-terococcus bacteria are found in the fecal matter of mammals and birds. This fecal bacteria does not necessarily come from humans, although numerous prior studies have demonstrated that there is a significant possibility of hu-man sewage contamination in storm drain runoff at any given time.
Why is storm drain pollution so significant?
Health officials and Heal the Bay recommend that beach users never swim within 100 yards on either side of a flowing storm drain, creek, or river in any coastal waters during a rainstorm, and to stay out of the water for at least three days after a storm has ended. Storm drain runoff is the greatest source of pollution to local beaches, flowing untreated to the coast and often contaminated with motor oil, ani-mal waste, pesticides, yard waste and trash. After a rain, indicator bacteria densities often far exceed state health criteria for recreational water use.
Children often play directly in front of storm drains and in runoff-filled ponds and lagoons. Monitoring at “point zero” (the mouth of storm drains or creeks) is the best way to ensure that the health risks to all swimmers are minimized. This Heal the Bay recommendation was finally adopted by the State Water Resources Control Board (SWRCB) for the 2015 swimming season. In fact, the SWRCB made point zero monitoring a criterion for receiving beach water quality monitoring funds. This was great news for beachgoers and families going to the beach last summer.
For more on storm drain beaches, see “Analysis of Beach Types” on page 22.
Are beaches monitored year-round?
This is the Beach Report Card’s fifth year of grading water quality along the entire U.S. Pacific Coastline. A total of 580 shoreline monitoring locations were analyzed from Whatcom County in Washington to San Diego County at the Mexican border. Most sample locations are selected by monitoring, health, and regulatory agencies to specifically target popular beaches or those beaches frequently affected by a pollution source like runoff. In the case of the Pacific Northwest, some locations are selected for being popular shell fishing beaches.
According to the EPA BEACH Act of 2000, each state having coastal recreation waters has to adopt water quality standards for bacteria in order to qualify for fed-eral beach monitoring funding. Therefore, each state has the ability to adopt its own standards. President Trump’s proposed budget for FY 2017 ’red-lined’ the entire BEACH Act monitoring program (approximately $10 million). States are only required to monitor recreational waters when federal funding is available, meaning the proposed budget cuts could ultimately relinquish states of their monitoring re-sponsibilities. Without such funds, water quality monitoring programs like Oregon’s would vanish.
In California, water quality samples are collected by the appropriate health agency at a minimum of once a week from April through October as required under the California Beach Bathing Water Quality Standards (AB 411) and recommended by EPA’s National Beach Guidance and Performance Criteria for Recreational Waters (EPA’s BEACH program). Some agencies conduct year-round sampling, while oth-ers scale back their monitoring programs dramatically from November through March, despite the fact that many surfers and ocean swimmers are in the water year-round. Starting April 2015, all monitoring agencies participating in the Cali-fornia Beach Program were required to sample at point-zero—where flows from rivers, creeks, or storm drains meet the ocean. This was a major step in achieving monitoring consistency from county to county, and meeting the intent of AB411.
The majority of Oregon and Washington water quality monitoring occurs during the summer swimming season (Memorial Day through Labor Day).
Why not test for viruses?
A common question asked by beachgoers is: “Because viruses are thought to cause many of the swimming-associated illnesses, why don’t health agencies monitor directly for viruses instead of indicator bacteria?” Although virus monitoring is incredibly useful in identifying sources of fecal pollution, there are a number of drawbacks to the currently available virus measurement methods. There have been tremendous breakthroughs in the use of gene probes to analyze water samples for virus or human pathogenic bacteria but currently these techniques are still relatively expensive, highly technical and not very quantitative. In addition, since human vi-ruses are not found in high densities in ocean water and their densities are highly variable, setting standards for viruses is not currently feasible. Interference from other pollutants in runoff can make virus quantification very difficult. Also, interpreta-tion of virus monitoring data is difficult because, unlike bacterial indicators, there are currently no data available that link health risks associated with swimming in beach water to virus densities.
Local epidemiology studies, which include a component to identify and quantify viral pathogens, began five and a half years ago. These large scale epidemiology stud-ies (using over 30 microbial indicators) were led by SCCWRP, UC Berkeley, Orange County Sanitation Districts, the USEPA, and Heal the Bay. The studies took place at Doheny State Beach, Avalon Beach and Surfrider Beach in Malibu.
In January 2012, the article “Using Rapid Indicators for Enterococcus to Assess the Risk of Illness after Exposure to Urban Runoff Contaminated Marine Water” (www.ncbi.nlm.nih.gov/pmc/articles/PMC3354759) to assess the risk of illness af-ter exposure to urban runoff contaminated marine water was published in Water Research, based on the epidemiology study performed at Doheny State Beach between 2007-2008. In March 2014, an article summarizing Avalon’s epidemiologi-cal was published in Water Research.
V. APPENDIX / C FREQUENTLY ASKED QUESTIONS
72HEAL THE BAY // 2016-2017 BEACH REPORT CARD
Beach Report Card Grading and MethodologyThe Beach Report Card Grading Methodology translates complex shoreline bacteria data into a grade format that is meaningful and useable by all California beachgoers.
METHODOLOGY: CALIFORNIAHeal the Bay’s Beach Report Card grading system is endorsed by the SWRCB and the Beach Water Quality Workgroup as an effective way to communicate beach water quality to the public
Past amendments to the grading methodology have included:
• The inclusion of the geometric mean into the calculation
• A firm zero-to-100 point scale
• Greater weight for Enterococcus and the total to fecal ratio relative to total coliform and fecal coliform
The methodology retains past modifications to the report card, such as the inclusion of new indicator bacteria thresholds (namely the total-to-fecal ratio), developed by the Santa Monica Bay Restoration Commission in the 1996 health effects studies of Santa Monica Bay beachgoers. It also retains the implementation of standard devia-tions for each indicator bacteria threshold, which was developed by the Southern California Coastal Water Research Project and Orange County Sanitation Districts during the 1998 Southern California Bight Study. Each threshold is based on the prescribed standards set in the California Department Health Service’s Beach Bath-ing Water Standards.
As seen in Table 5-1 the methodology uses a standard A through F grading system, and grades are based on the following formula:
% Grade = ‘TOTAL POINTS AVAILABLE’ — ‘TOTAL POINTS LOST’
‘TOTAL POINTS AVAILABLE’
[Note: The Annual and End-of-Summer Beach Report Card methodology is modi-fied slightly to accommodate the longer time period. For example: no greater signifi-cance is given to the most recent samples.]
Total Points Available
‘Total Points Available’ is derived from adding together two point components (if applicable): the Geometric Mean and the Single Sample Standard. The points for each component are listed in Table 5-2.
In order for the points in each component to become available, certain criteria must be met. (For example, the geometric mean points will be added to the ‘Total Points Available’ only if there are a minimum of four dry weather samples collected within the allotted time frame). Wet weather data is graded separately from dry weather data, and does not currently include a geometric mean component. Therefore, it is possible for ‘Total Points Available’ to be less than 100. The new grading method-ology allows for a relative grade to be determined based on the actual monitoring completed.
Once the ‘Total Available Points’ has been determined for a specific location, then the ‘Total Points Lost’ can be calculated for the applicable grade components.
Total Points Lost
Separate calculations are used to quantify ‘Total Points Lost’ for each applicable component from the ‘Total Available Points’. The following describes the two cal-culations.
Geometric Mean
Calculating the ‘Total Points Lost’ for the geometric mean component involves us-
ing the rolling 30-day geometric mean values calculated for each sample day (see Table 5-3).
Each geometric mean criterion exceeded is assigned a specific percentage of points lost. Non-exceedances are given 0%. The percentage of points lost from each of the three criteria divided by the number of sample days are multiplied by the ‘Total Available Points’ (any sum of percentages exceeding 100% automatically loses all 50 points available in the geometric mean component).
Single Sample Standard
Calculating the ‘Total Points Lost’ for the Single Sample Standard component is similar to the calculation used for deriving the points lost for the Geometric Mean. However, the Single Sample Standard component uses a gradient to calculate the ‘Total Points Lost’. The gradient of percentage points lost used in calculating the number of points lost is derived from work completed by the Southern California Coastal Water Research Project and Orange County Sanitation District as part of the 1998 Southern California Coastal Bight Study (see Table 5-4).
‘Percentage of points lost’ is allocated depending upon the threshold exceeded by each of the four criteria. Each single sample criterion exceeded is given a ‘percent-age of points lost’. These amounts are presented in Table 5-4.
The ‘percentage of points lost’ from each of the four criteria for each sample during the time period are added together and divided by the total number of samples. Once this number is calculated (total ‘percentage of points lost’ divided by total number of samples), it is multiplied by the ‘Total Available Points’. In the Single Sample Standard component, more points are lost as the magnitude or frequency of exceedances increases.
Points lost from the Single Sample Standard component are added to the points lost in the Geometric Mean component (if applicable) and this sum becomes ‘Total Points Lost’. Once the ‘Total Points Available’ and the ‘Total Points Lost’ are calcu-lated, a grade for a particular sample site can be determined.
Determining a Grade
% Grade = ‘TOTAL POINTS AVAILABLE’ — ‘TOTAL POINTS LOST’
‘TOTAL POINTS AVAILABLE’
Most dry and wet weather annual grades are calculated with 100 ‘Total Available Points’, although there is no Geometric Mean component for wet weather grading. Wet weather grades are calculated by the total ‘percentage of points lost’ divided by the total number of samples and then multiplied by 100. This gives the location’s score for wet weather ‘Total Points Lost’. This number is then subtracted from 100 to give the percentage grade.
METHODOLOGY: OREGON AND WASHINGTONThe Oregon and Washington state grade methodology (using Enterococcus stan-dards) was adapted from the seven standard California methodology (see Ap-pendix A1).
Total Points AvailableAs seen in Table 5-2, the methodology uses a standard A through F grading system, and grades are based on the following formula:
% Grade = ‘TOTAL POINTS AVAILABLE’ — ‘TOTAL POINTS LOST’
‘TOTAL POINTS AVAILABLE’
Note: The Annual and End-of-Summer Beach Report Card methodology is modi-fied slightly to accommodate the longer time period. (For example: no greater sig-nificance is given to the most recent samples.)
Wet weather data (>=0.2 inches of rain in previous 72 hours) is graded sepa-rately from dry weather data and does not currently include a geometric mean component.
‘Total Points Available’ is derived from adding together two point components (if
METHODOLOGYV. APPENDIX / D

73HEAL THE BAY // 2016-2017 BEACH REPORT CARD
TABLE 5-3: CALCULATING THE TOTAL POINTS LOST FOR THE GEOMETRIC MEAN COMPONENT
Indicator Exceeded
Calif. Beach Bathing Water Standard
% of Total Available Points Lost** Due to Exceedance
Total Avail. Points
Enterococcus 35 80%
50Fecal Coliform 200 40%
Total Coliform 1000 20%
* Colony forming units per 100 milliliters of ocean water
TABLE 5-5: CALCULATING THE TOTAL POINTS LOST FOR THE SINGLE SAMPLE STANDARD COMPONENT
Indicator Exceeded
SLIGHT % Points
Lost
MODERATE % Points
Lost
HIGH % Points
Lost
EXTREME% Points
Lost
Total Available
Points
Total Coliform 10% 30% 40% N/A
50Fecal Coliform 10% 30% 40% N/A
Enterococcus 20% 40% 60% N/A
Ratio (when total > 1,000)
25% 50% 75% 100%
TABLE 5-4: SINGLE SAMPLE GRADIENT THRESHOLDS IN CFU/100ML*
Indicator BacteriaSLIGHT
T – 1 SDMODERATE
T + 1 SDHIGH
> T + 1 SDEXTREME
Very High Risk
Total Coliform 6,711-9,999 10,000-14,900 > 14,900 N/A
Fecal Coliform 268-399 400-596 > 596 N/A
Enterococcus 70-103 104-155 > 155 N/A
Total: Fecal Ratio (when total > 1,000) 10.1-13 7.1-10 2.1-7 < 2.1
* Colony forming units per 100 milliliters of ocean water. N/A = Not applicableSD = Standard Deviation. Bold = California State Health Department standards for a single sample
TABLE 5-7: CALCULATING THE TOTAL POINTS LOST FOR THE SINGLE SAMPLE STANDARD COMPONENT
Indicator Exceeded
SLIGHT % Points Lost
MODERATE % Points Lost
HIGH % Points Lost
Total Available Points
Enterococcus 25% 75% 100% 50
TABLE 5-6: SINGLE SAMPLE GRADIENT THRESHOLDS IN CFU/100ML*
Indicator BacteriaSLIGHT T – 1 SD
MODERATE T + 1 SD
HIGH > T + 1 S
Enterococcus 70-103 104-155 >155
* Colony forming units per 100 milliliters of ocean waterSD = Standard Deviation. Bold = California State Health Department standards for a single sample
TABLE 5-2: TOTAL POINTS AVAILABLE BY COMPONENT
Geometric Mean 50 points
Single Sample Standard 50 points
Total 100 points
TABLE 5-1: GRADING SYSTEM
A B C D F
100%-90% 89%-80% 79%-70% 69%-60% <60%
applicable): the Geometric Mean and the Single Sample Standard. The points for each component are listed in Table 5-2. In order for the points in each component to become available certain criteria must be met. Oregon and Washington Summer Beach Report Card methodology calculations only include Geometric Mean scores when four or more dry weather samples are available in determining a location’s 30-day geometric mean. Therefore, it is possible for ‘Total Points Available’ to be less than 100. The grading methodology allows for a relative grade to be determined based on the actual monitoring completed.
Once the ‘Total Available Points’ has been determined for a specific location, then the ‘Total Points Lost’ is calculated for the applicable grade components.
Total Points Lost
Separate calculations are used to quantify ‘Total Points Lost’ for each applicable component from the ‘Total Available Points’. The following describes the two cal-culations:
Geometric Mean
Calculating the ‘Total Points Lost’ for the Geometric Mean component involves us-ing EPA’s beach bathing indicator density of 35 for the geometric mean. If there are four or more samples included in the 30-day geometric mean calculation then the 50 points for the Geometric Mean component become available. Oregon and Washington Beach Report Card methodology calculates the percentage of geo-metric mean exceedance days based on the number of valid (four or more) geomet-ric means scored during the extended time period. The percentage of geometric exceedance sample days out of valid geometric mean sample days is multiplied by the 50 available points to determine the ‘Total Points Lost’ for the Geometric Mean component.
Single Sample Standard
The Single Sample Standard component uses a gradient to calculate the ‘Total Points Lost’. The gradient of percentage of points lost used in calculating the num-ber of points lost is derived from the EPA’s Ambient Water Quality Criteria for Bac-teria and is found in Table 5-6.
‘Percentage of points lost’ is allocated depending upon the threshold exceeded. The penalties for threshold exceedances are presented in Table 5-7. Non-exceed-ances lose zero points. The ‘percentage of points lost’ for each sample during the time period are added together and divided by the total number of samples and multiplied by the ‘Total Available Points’. More points are lost as the magnitude or frequency of exceedances increases.
Points lost from the Single Sample Standard component are added to the points lost in the Geometric Mean component (if applicable) and this sum becomes ‘Total Points Lost’. Once the ‘Total Points Available’ and the ‘Total Points Lost’ are calcu-lated a grade for a particular sample site can be determined.
Determining a Grade
% Grade = ‘TOTAL POINTS AVAILABLE’ — ‘TOTAL POINTS LOST’
‘TOTAL POINTS AVAILABLE’
Most dry and wet weather annual grades are calculated with 100 ‘Total Available Points’, although there is no Geometric Mean component for wet weather grading. Wet weather grades are calculated by the total ‘percentage of points lost’ divided by the total number of samples and then multiplied by 100. This gives the location’s score for wet weather ‘Total Points Lost’. This number is then subtracted from 100 to give the percentage grade.
METHODOLOGYV. APPENDIX / D

74HEAL THE BAY // 2016-2017 BEACH REPORT CARD
GlossaryARRA ............................. American Recovery and Reinvestment Act
BAV ................................ Beach Action Value
BEACH Act ................... National Beach Guidance and Performance Criteria for Recreational Waters
BMP ............................... best management practices
BRC ............................... Beach Report Card
CDPH ............................. California Department of Public Health
CBI ................................. Clean Beach Initiative
CDO ............................... Cease and Desist Order
CSS ............................... combined sewer and storm drain system
CSD .............................. combined sewer discharges
CSO .............................. combined sewer overflows
CWA ............................... Clean Water Act
DEH ............................... Division of Environmental Health
DPH ............................... Department of Public Health
dPCR ............................. Digital Polymerase Chain Reaction E. coli Escherichia coli
EMD ............................... Environmental Monitoring Division (L.A.)
EPA ................................ Environmental Protection Agency
FIB ................................. fecal indicator bacteria
GI illness ......................... Gastrointestinal Illness
LFD ................................ Low Flow Diversion
LID ................................. Low Impact Development
MLR ............................... Multiple Linear Regression
MOU .............................. Memorandum of Understanding
MS4 ............................... Municipal Separate Storm Sewer System
Nowcast ......................... same day predictive modeling tool
NOV ............................... Notice of Violation
NGO ............................... Non-Government Agency
NSE ................................ Natural Source Exclusion
OWTS ........................... Onsite Wastewater Treatment System
point zero ...................... location where outfall meets the ocean
QMRA ............................ Quantitative Microbial Risk Assessment
qPCR ............................. Quantitative Polymerase Chain Reaction
Regional Board .............. Regional Water Quality Control Board
SEP ................................ Supplemental Environmental Projects (L.A.)
SIPP ............................... Source Identification Protocol Project
SCCWRP ....................... Southern California Coastal Water Resources Project
SMURRF ........................ Santa Monica Urban Runoff Recycling Facility
SPF ................................ Sun Protection Factor
State Board .................... State Water Resources Control Board
SSO ............................... Sanitary Sewer Overflows
TMDL ............................. Total Maximum Daily Load
UCLA ............................ University of California, Los Angeles
UCB ............................... University of California, Berkeley
USEPA ........................... United States Environmental Protection Agency
VB .................................. Virtual Beach—USEPA predictive model
wave wash ..................... monitored location where runoff meets surf
Significant Bills and Acts
Clean Water Act- Federal (1972)
Establishes the basic structure for regulating discharges of pollutants into the waters of the United States.
Ambient Water Quality Criteria for Bacteria – Federal (1986)
USEPA develops water quality criteria/standards to protect people swimming in recreational waters (e.g., lakes, rivers, beaches) from microbial organisms such as bacteria and viruses.
AB 411 - California (1997)
Beach Bathing Water Quality Standards. Requires all waters along California’s coast to meet certain minimum standards. Coastal waters will be tested weekly during the period of April through October.
AB 538 - California (1999)
Requires the state board to develop source investigation protocols for use in conducting source investigations of storm drains that produce exceedances of specified bacteriological standards.
BEACH Act - Federal (2000)
Beaches Environmental Assessment and Coastal Health Act. Amends the Clean Water Act and authorizes the EPA to award grants to reduce the risk of illness to users of the nation’s recreational waters.
CBI - California (2001)
California’s Clean Beach Initiative. Grant program provides funding for projects that will improve California’s coastal water quality and swimmers’ safety. Funding priority is given to projects that reduce bacterial contamination on busy California beaches.
Proposition O (Prop O) - Los Angeles (2004)
Authorized the City of Los Angeles to issue a series of general obligation bonds for up to $500 million for projects to protect public health by cleaning up pollution, including bacteria and trash, in the city’s watercourses, beaches and the ocean, in order to meet Federal Clean Water Act requirement
ARRA - Federal (2009)
American Recovery and Reinvestment Act. Stimulus package, from which $18 billion is allocated for relief and investment in environment, public health and ‘green’ alternatives.
SB 482 - California (2011)
Public Beach Contamination, Standards, Testing, Closing. Allows the State Board to direct permit fees up to $1.8 million towards California’s Beach Program and requires the drafting of regulations relating to testing of waters adjacent to public beaches.
Recreational Water Quality Critera – Federal (2012)
After 25 years, USEPA updates water quality standards/criteria to protect people swimming in recreational waters (e.g., lakes, rivers, beaches) from microbial organisms such as bacteria and viruses. Introduces Statistical Thresold Values (STV) and Beach Action Values (BAV) into the beach water quality lexicon.
INDICESV. APPENDIX / E

75HEAL THE BAY // 2016-2017 BEACH REPORT CARD 7575HEAL THE BAY // 2016-2017 BEACH REPORT CARD
AcknowledgementsHeal the Bay would like to give special thanks to Washington’s Department of Health and Department of Ecology, who jointly manage Washington’s beach program, for generously providing local, current information on Washington’s beach water quality. We would also like to thank Oregon’s Department of Human Services and Oregon’s Department of Environmental Quality for providing water quality data. All agencies provided valuable advice and information, making the Beach Report Card possible in Oregon and Washington.
Additionally, this report and the entire Beach Report Card program would not be possible without the cooperation of the many monitoring and public agencies throughout California. These agencies include:
former President, Dr. Mark Gold. This report would not be possible without his vision and unwavered dedication to improving beach water quality and strengthening public health protection.
A special thank you to our funders for their continued support of the Beach Report Card program and the publication of this report:
Humboldt County Environmental Health Division
Mendocino County Environmental Health Department
Sonoma County Environmental Health Division
Marin County Environmental Health Services
San Francisco Public Utilities Commission
East Bay Regional Park District
San Mateo County Environmental Health Division
Santa Cruz County Environmental Health Services
Monterey County Environmental Health Bureau
San Luis Obispo County Environmental Health
2016-17 Annual Beach Report CardReport Research and Copy: Leslie Griffin, James Alamillo and Karen Vu
Data Compilation and Analysis: Leslie Griffin and Karen Vu
Copy Editors: Sarah Abramson Sikich, Rita Kampalath Karen Vu, and Nick Payne
Printed on recycled paper.
Services
Santa Barbara County Environmental Health Services
Ventura County Environmental Health Division
City of Los Angeles Environmental Monitoring Division
Los Angeles County Sanitation Districts
County of Los Angeles Department of Public Health Environmental Health
City of Redondo Beach
City of Long Beach Department of Health and Human Services Environmental Health Division
South Orange County Wastewater Authority
County of Orange Environmental Health
Orange County Sanitation District
San Diego County Department of Environmental Health
San Elijo Joint Powers Authority
City of San Diego
City of Oceanside
Encina Wastewater Authority
State Water Resources Control Board
The Beach Report Card’s original concept and methodology were created in-part by Heal the Bay’s
ACKNOWLEDGEMENT & CREDITSV. APPENDIX / F
1444 9th Street, Santa Monica, CA 90401 | 800.HEAL.BAY | 310.451.1500 | healthebay.org