Embed Size (px)
Citation preview
Federal Democratic Republic of Ethiopia
Ministry of Health
Health and Health Related Indicators
2003 /2011G.C
Health and Health Related Indicators
2003 E.C (2010/11G.C.)
Federal Ministry of Health Policy Planning Directorate
Federal Ministry of Health wishes to acknowledge all Regional Health Bureaus, Central and Specialized Hospitals, Ethiopian Health and Nutrition Research Institute, Pharmaceutical Fund and Supply Agency, Federal HIV /AIDS Prevention and Control Office, Food Medicine, and Health Care Administration, Central Statistics Agency, Ministry of Finance and Economic Development, Ministry of Water and Energy, Integrated Family Health Program, Family Guidance association and DKT Ethiopia for their valuable contribution in providing information and those whose constructive comments and suggestions have made it possible the completion of this publication .
Health and Health related indicators bulletin is annually published by Policy Planning Directorate. If you have any comments and suggestions you are welcome and should be addressed to:
Policy planning directorate Phone (+251)115535160
Po.box 1234 Ministry of Health
Table of Contents
ACRONYMS............................................................................................................................ i EXPLANATORY NOTES………………………………………………………………….ii PREAMBLE………………………………………………………………………………….iii INTRODUCTION.................................................................................................................... 1 OVERVIEW………………………………………...………………………………………....2 2. SUMMARY…………………………………………………………………………. …......3 2.1 Summary Of Basic Health Indicators ................................................................................................. 4 2.2. selected HSDPIV Baseline Targets and Achievements.............................................................. 6 2.3.Health related MDG indicators ……………………………………………………………………...…..…...8 3. DEMOGRAPHY & VITAL STATISTICS....................................................................... 9 3.1 Some Demographic Indicators, 2003 ................................................................................................10 3.2 Vital Statistics .............................................................................................................................................11 3.3 Population and Health Data Estimates for Countries of the world.....................................12 4. MATERNAL HEALTH................................................................................................................ 14 4.1 Contraceptive Acceptance Rate,2003………………………………………………………….....……..16 4.2 Amount of Family planning commodities distributed by FMOH & NGO,2003 ............. 17 4.3 Distribution of Family planning commodities by FMOH to Regions & NGO’s................18 4.4 ANC, skilled Delivery, clean and safe delivery and PNC coverage 2003…………………..19 4.5 Abortion care and caesarian section rate by Region 2003…………………………………......20 4.6 Maternal and Neonatal Institutional Death by Region,2003………………………………….21 5. CHILD HEALTH….……..…………………………………………………………………..……….…….…...22 5.1 Proportion of low birth weight by region,2003 ………………………………………...…………...23 5.2 distribution of health centers providing, IMNCI,2003……………………………………..…..….23 5.3 Under 5 children Receiving Vitamin A Supplementation,2003…………………………..…...24 5.4 Under 5 children De‐wormed by region,2003 ………………………………………………………24 5.5 Immunization Coverage By Antigen, 2003 .................................................................................... 25 5.6 Infants Protected from Neonatal Tetanus at Birth By Region, 2003 ...............................26 5.7 Proportion of Moderate /Sever Malnutrition Among Under 3 Children,2003............. 27 6 . DISEASE AND CONTROL………..............................................................................................28 6.1 Top 10 Causes of Morbidity, 2003………………………………………………………………….……..29 6.1.1 Ten Top causes of admission…………………………………………………...………...30 6.1.2 Ten Top causes of Mortality ……………………………………………………………....31 6.2 Malaria ………………………………………………………………………………………………………………..31 6.2.1 Malaria Cases by Parasitic Species ,2003………………………………………….....32 6.2.2 ITN Distribution and IRS Spray by Region ,2003………………………………...32 6.3 Tuberculosis and Leprosy……………………………………………………………………………………..34 6.3.1 Tuberculosis Case finding ………………………………………………………………...35 6.3.2 Tuberculosis Result of Treatment ……………………………………………………...36 6.3.3 Case Detection Rate of PTB+ by Region ………………………………………………37 6.3.4 Leprosy case Finding ,2003………………………………………………………………...38 6.3.5 Leprosy in Children and Disability Rate by Region ……………………………...39 6.3.6 Leprosy (MDT) Results of Treatment by regions, 2003 ……………………….40 6.4 HIV/AIDS……………………………………………………………………………………………………………..41 6.4.1 HIV Prevalence Rate EFY, 2003…………………………………………………………..42 6.4.2 Distribution of HIV/AIDS Counseling and Testing EFY, 2003………………..43 6.4.3 AIDS Patients Ever Enrolled, Ever Started and Currently on ART EFY 2003………………………………………………………………………..…….43 6.4.4 Number of health Facilities Providing HCT, ART and PMTCT Services EFY, 2003………………………………………………………………………...…..44 6.4.5 PMTCT Service by Region EFY, 2003…………………………………………………..45
7. INTEGRATED DISEASE SURVEILLANCE………………………………………...…………………46 7.1 Annual Report of Epidemic Diseases EFY 2003…………………………………….………………47 7.2 Annual Report From Weekly IDSR Summary Report EFY 2003…………………….……….47 7.3 Annual Outpatient Cases Completed From Weekly IDSR Summary Report, 2003…………………………………………………………………………..……………………..……..48 7.4 Annual Inpatient Cases Completed From Weekly IDSR Summary Report , 2003……………………………………………………………………….…………………………..…..49 8. HYGIENE & ENVIRONMENTAL HEALTH PROFILE ... ......................................................50 8.1 Hygiene and Environmental Health Profile ,2003……………………….……..……….………....51 9. ASSET…………………………………………………………..…………………………….…………….……...52 9.1 Health Facility Construction, Rehabilitation & Expansion , 2003………………..…………..53 9.2 Health Facility to population Ratio , 2003 ......................................................................................54 9.3 Distribution Of Health Infrastructure, by type and ownership,2003..................................55 9.4 Distribution Of Pharmaceutical Outlets By Region & Ownership, 2003……….………......56 10. FINANCE .....................................................................................................................................57 10.1 share of Health Budget as Proportion of total budget , 2003 .............................................57 10.2 Percentage of Health Budget Utilization to Allocation In millions , 2003......................59 10.3 Per capita Public Expenditure on Health , 2003 ........................................................................60 11. HUMAN RESOURSE ................................................................................................................ 61 11.1 Health Human Resource Distribution By Region & Sex .........................................................62 11.2 Health Professionals to Population Ratio By Region ..............................................................63 11.2 Health Extension Workers Training and Deployment ,2003 ...............................................64 11.3 Distribution of Graduating Health Professionals in Public Universities …………….....64 12. HEALTH SERVICE COVERAGE &UTILIZATION................................................. 66 12.1 Total length of stay,2003…………………………………………………………..…………………….……. 67 12.2 OPD Attendance Per‐capita and Admission Rate ,2003……………………………...………….67 12.3 Distribution of Health Centers providing B‐EMONC ………………….…………...…………. 68 12.4Distribution of Public Hospitals providing C‐EMONC …………………………………………...68 GLOSSARY.............................................................................................................................69
List of Figures Figure 1. Trend in Contraceptive Acceptance Rate (EFY 19952003)………………………………………………………..16 Figure 2. Trend in ANC Deliveries attended by Skilled Attendants and PNC coverage (EFY 19932003)…………………………….20 Figure 3 . Trend in Immunization coverage by region (EFY, 1997 2003 )…………………………………………………26 Figure 4. Trend In TB Case Detection, Treatment Success and Cure Rates ( EFY,1995-2003)……………………………….…37 Figure 5. Trend in Number of People Living with AIDS who Accessed Chronic HIV Care and ART (EFY, 1998 2003 )………………………………………………44
ACRONYMS ADD Acute Diarrheal Disease AIDS Acquired Immunodeficiency Syndrome AFP Acute Flaccid Paralysis ARM Annual Review meeting ARI Acute Respiratory Infection ART Anti Retroviral Therapy AWD Acute Watery Diarrhea BCG Bacilli Calmette Guerin BEmOC Basic Emergency Obstetric Care BS Both Sex CAR Contraceptive Acceptance Rate CEmOC Comprehensive Emergency Obstetric Care CSA Central Statistics Agency CBR Crude Birth Rate CDR Crude Death Rate CMR Child Mortality Rate CPR Contraceptive Prevalence Rate CYP Couple Year Protection DOTS Directly Observed Therapy Short Course DPT Diphtheria, Pertusis and Tetanus EDHS Ethiopian Demographic and Health Survey EPI Expanded Program on Immunization FGAE Family Guidance Association of Ethiopia FMOH Federal Ministry of health GNIPPP Gross National Income in Purchasing power parity GP General Practitioner HC Health Center HCT HIV Counseling and Testing HEP Health Extension Program HEW Health Extension worker HH Household HIV Human Immunodeficiency Virus HIS Health Information System HP Health Post HSDP Health Sector Development Program HMIS Health Management Information System HSEP Health Service Extension Program i
ACRONYMS IDSR Integrated Disease Surveillance & Response IMR Infant Mortality Rate IMNCI Integrated Management of Neonatal and Child Illness IRS Indoor Residual Spray ITN Insecticide Treated Nets IUCD/IUD Intra Uterine Contraceptive Device LB Live birth LWB Low Birth Weight MB Multibacillary MCH Maternal and Child Health MDG Millennium Development Goal MDT Multi Drug Therapy MOFED Ministry of Finance and Economic Development NGO Non Governmental Organization NNT Neonatal Tetanus NVP Nevirapin Oby.Gyn Obstetric &Gynecology OGA Other Governmental Agencies OPD Out-Patient Department PAB Protected at Birth PB Paucibacillary PLWHA People Living with HIV/AIDS PMTCT Prevent Mothers to Child Transmission PNC Postnatal Care Coverage PF Plasmodium Falciprum PFI Pathfinder International PHC Primary Health Care Coverage PTB Pulmonary Tuberculosis PV Plasmodium Vivax RNI Rate of National Increase SNNPR Southern Nation & Nationalities Peoples Region TFR Total Fertility Rate TB Tuberculosis TB-CDR TB Case Detection Rate TSR TB Success Rate TTBA Trained Traditional Birth Attendants VCT Voluntary Counseling & Testing
ii
Explanatory Notes The following symbols have been used in the tables throughout the report • NA in a table indicates data is not available • Any difference between the region disaggregated figure with
the total is the activity undertaken by federal hospitals
Copyright © Policy Planning Directorate, MOH April, 2012
Phone:251‐11‐5530514, 251‐11‐533160 E‐mail: [email protected]
Website: http//www.moh.gov.et
iii
Preamble
One of the notable quality of the Health Sector Development Program (HSDP) is its effectiveness in the planning, implementation, monitoring and evaluation of the health sector development activities. The growing need for careful planning, strong implementation and systematic monitoring and evaluation has given more significance to the availability of adequate and timely information. Much effort have been put to improve the quality and scope of the data. As part of improving the quality of information HMIS has been implemented with selected core indicators that adequately address the monitoring requirements of various key health programs. The health and health related indicator has been published annually since 1992EFY. 2003EFY bulletin shows the first year achievements of HSDP IV. Data used in this publication is mainly depend on routine and administrative data that comes through HMIS. Current and previous years coverage indicators that needed population data have been adjusted based on Central Statistic Agency 2007 census result. The federal Ministry of Health wish to acknowledge all regions, stakeholders and specially M&E staff who provide assistance and aspiration at any point along the way on publication of this bulletin. Dereje Mamo (BSC,MSC in M&E) FMOH April,2012
iv
Health and Health Related Indicators EFY,2003 1
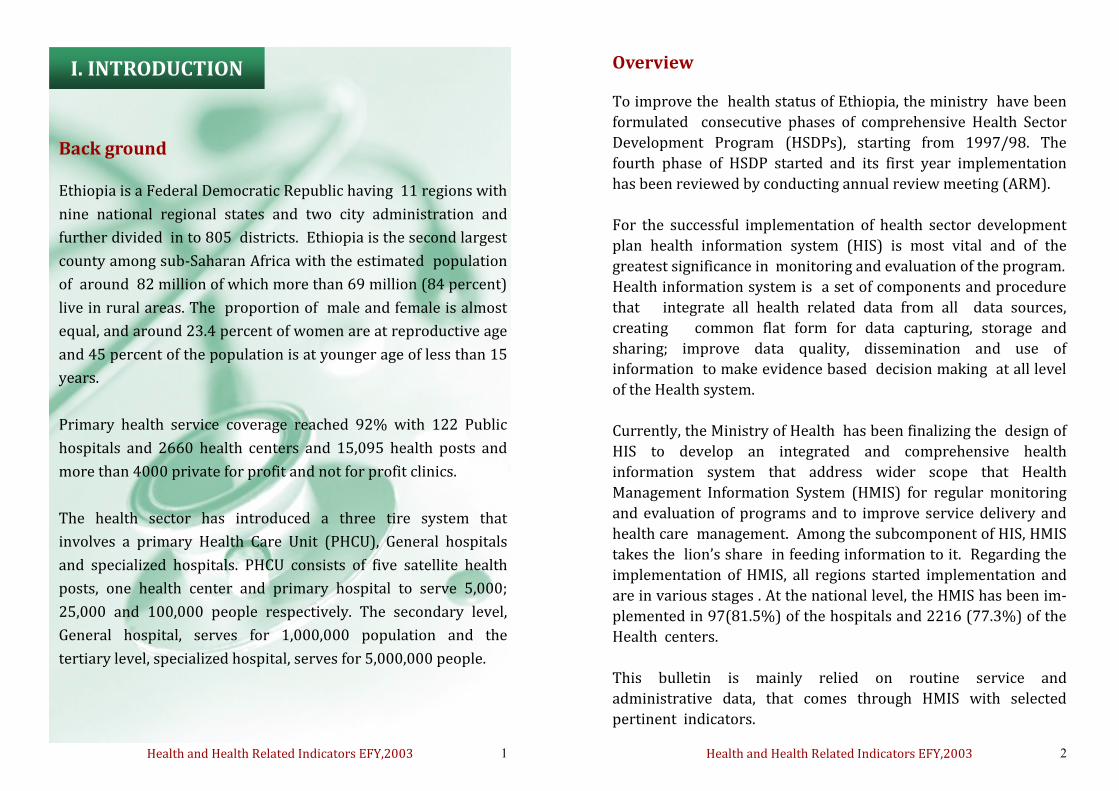
Back ground Ethiopia is a Federal Democratic Republic having 11 regions with
nine national regional states and two city administration and
further divided in to 805 districts. Ethiopia is the second largest
county among sub-Saharan Africa with the estimated population
of around 82 million of which more than 69 million (84 percent)
live in rural areas. The proportion of male and female is almost
equal, and around 23.4 percent of women are at reproductive age
and 45 percent of the population is at younger age of less than 15
years.
Primary health service coverage reached 92% with 122 Public
hospitals and 2660 health centers and 15,095 health posts and
more than 4000 private for profit and not for profit clinics.
The health sector has introduced a three tire system that
involves a primary Health Care Unit (PHCU), General hospitals
and specialized hospitals. PHCU consists of five satellite health
posts, one health center and primary hospital to serve 5,000;
25,000 and 100,000 people respectively. The secondary level,
General hospital, serves for 1,000,000 population and the
tertiary level, specialized hospital, serves for 5,000,000 people.
I. INTRODUCTION
Health and Health Related Indicators EFY,2003 2
Overview To improve the health status of Ethiopia, the ministry have been
formulated consecutive phases of comprehensive Health Sector
Development Program (HSDPs), starting from 1997/98. The
fourth phase of HSDP started and its first year implementation
has been reviewed by conducting annual review meeting (ARM).
For the successful implementation of health sector development
plan health information system (HIS) is most vital and of the
greatest significance in monitoring and evaluation of the program.
Health information system is a set of components and procedure
that integrate all health related data from all data sources,
creating common flat form for data capturing, storage and
sharing; improve data quality, dissemination and use of
information to make evidence based decision making at all level
of the Health system.
Currently, the Ministry of Health has been finalizing the design of
HIS to develop an integrated and comprehensive health
information system that address wider scope that Health
Management Information System (HMIS) for regular monitoring
and evaluation of programs and to improve service delivery and
health care management. Among the subcomponent of HIS, HMIS
takes the lion’s share in feeding information to it. Regarding the
implementation of HMIS, all regions started implementation and
are in various stages . At the national level, the HMIS has been im-
plemented in 97(81.5%) of the hospitals and 2216 (77.3%) of the
Health centers.
This bulletin is mainly relied on routine service and
administrative data, that comes through HMIS with selected
pertinent indicators.
Health and Health Related Indicators EFY,2003 3
II Summary
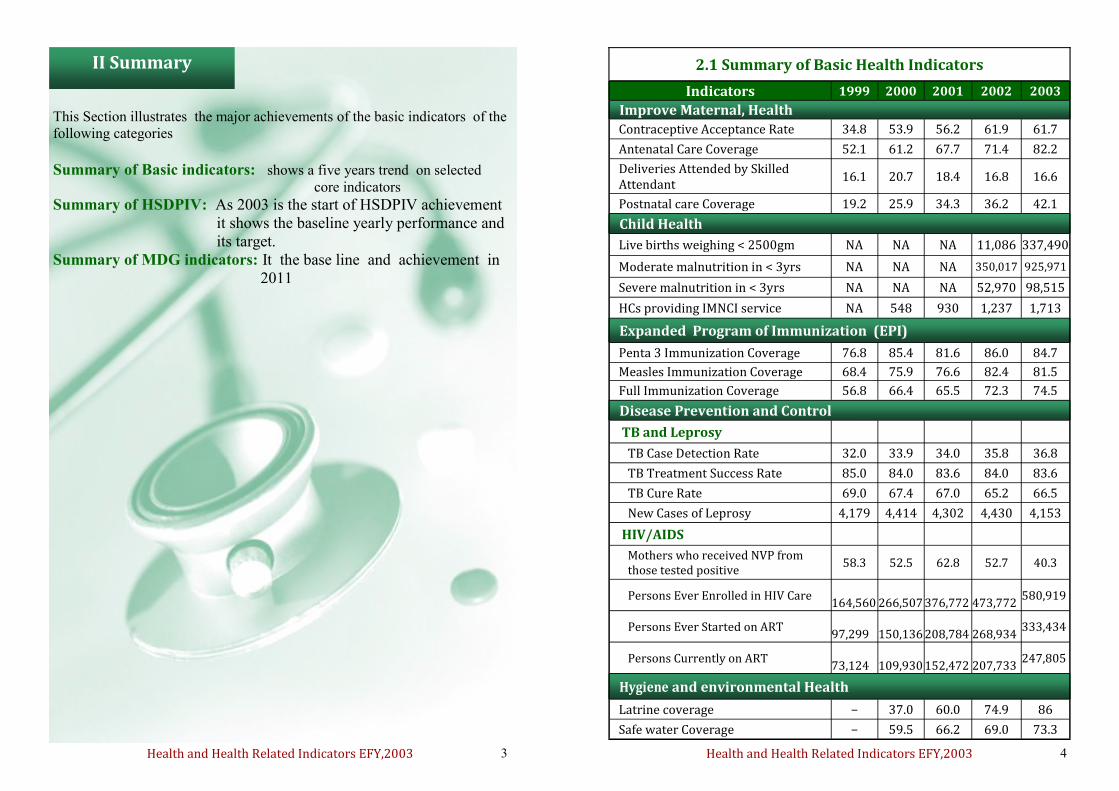
This Section illustrates the major achievements of the basic indicators of the
following categories
Summary of Basic indicators: shows a five years trend on selected
core indicators
Summary of HSDPIV: As 2003 is the start of HSDPIV achievement
it shows the baseline yearly performance and
its target.
Summary of MDG indicators: It the base line and achievement in
2011
Health and Health Related Indicators EFY,2003 4
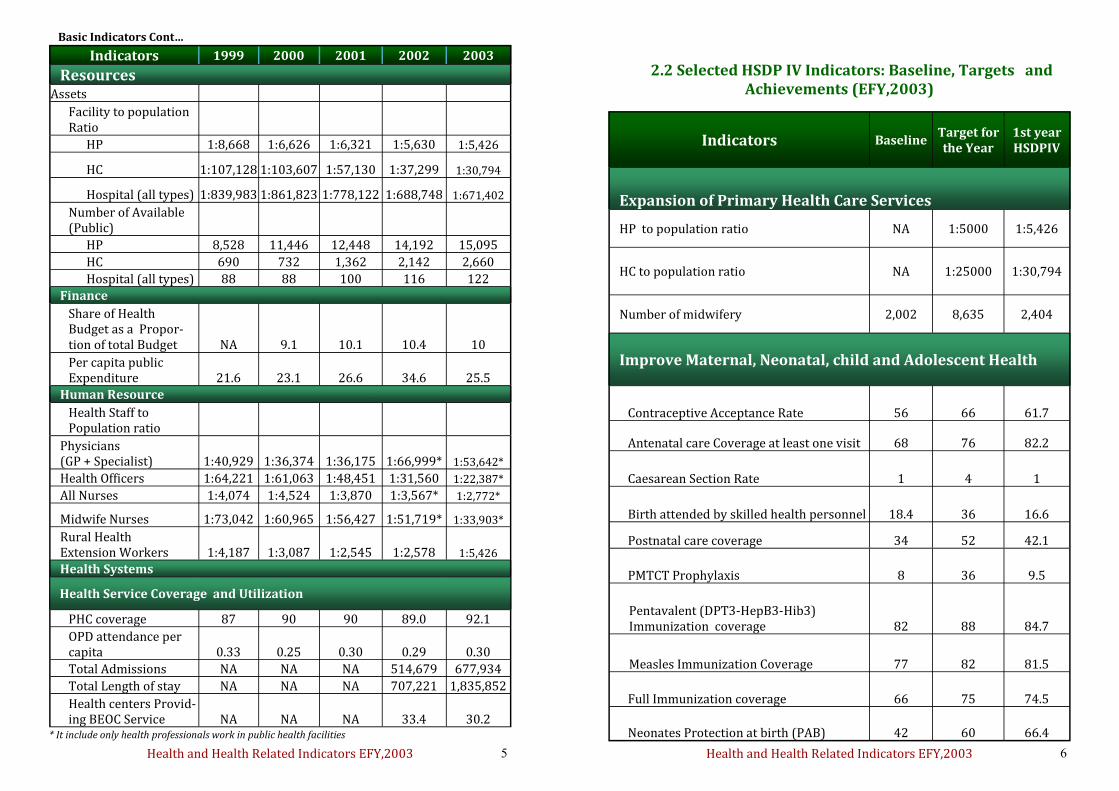
2.1 Summary of Basic Health Indicators
Indicators 1999 2000 2001 2002 2003
Improve Maternal, Health
Contraceptive Acceptance Rate 34.8 53.9 56.2 61.9 61.7
Antenatal Care Coverage 52.1 61.2 67.7 71.4 82.2
Deliveries Attended by Skilled Attendant
16.1 20.7 18.4 16.8 16.6
Postnatal care Coverage 19.2 25.9 34.3 36.2 42.1
Child Health
Live births weighing < 2500gm NA NA NA 11,086 337,490
Moderate malnutrition in < 3yrs NA NA NA 350,017 925,971
Severe malnutrition in < 3yrs NA NA NA 52,970 98,515
HCs providing IMNCI service NA 548 930 1,237 1,713
Expanded Program of Immunization (EPI)
Penta 3 Immunization Coverage 76.8 85.4 81.6 86.0 84.7
Measles Immunization Coverage 68.4 75.9 76.6 82.4 81.5
Full Immunization Coverage 56.8 66.4 65.5 72.3 74.5
Disease Prevention and Control
TB and Leprosy
TB Case Detection Rate 32.0 33.9 34.0 35.8 36.8
TB Treatment Success Rate 85.0 84.0 83.6 84.0 83.6
TB Cure Rate 69.0 67.4 67.0 65.2 66.5
New Cases of Leprosy 4,179 4,414 4,302 4,430 4,153
HIV/AIDS
Mothers who received NVP from those tested positive
58.3 52.5 62.8 52.7 40.3
Persons Ever Enrolled in HIV Care 164,560
266,507
376,772
473,772
580,919
Persons Ever Started on ART 97,299
150,136
208,784
268,934
333,434
Persons Currently on ART 73,124
109,930
152,472
207,733
247,805
Hygiene and environmental Health
Latrine coverage − 37.0 60.0 74.9 86
Safe water Coverage − 59.5 66.2 69.0 73.3
Health and Health Related Indicators EFY,2003 5
Basic Indicators Cont…
Indicators 1999 2000 2001 2002 2003
Resources Assets
Facility to population Ratio
HP 1:8,668 1:6,626 1:6,321 1:5,630 1:5,426
HC 1:107,128 1:103,607 1:57,130 1:37,299 1:30,794
Hospital (all types) 1:839,983 1:861,823 1:778,122 1:688,748 1:671,402
Number of Available (Public)
HP 8,528 11,446 12,448 14,192 15,095
HC 690 732 1,362 2,142 2,660
Hospital (all types) 88 88 100 116 122
Finance
Share of Health Budget as a Propor-tion of total Budget NA 9.1 10.1 10.4 10
Per capita public Expenditure 21.6 23.1 26.6 34.6 25.5
Human Resource
Health Staff to Population ratio
Physicians (GP + Specialist) 1:40,929 1:36,374 1:36,175 1:66,999* 1:53,642*
Health Officers 1:64,221 1:61,063 1:48,451 1:31,560 1:22,387*
All Nurses 1:4,074 1:4,524 1:3,870 1:3,567* 1:2,772*
Midwife Nurses 1:73,042 1:60,965 1:56,427 1:51,719* 1:33,903*
Rural Health Extension Workers 1:4,187 1:3,087 1:2,545 1:2,578 1:5,426
Health Systems
Health Service Coverage and Utilization
PHC coverage 87 90 90 89.0 92.1
OPD attendance per capita 0.33 0.25 0.30 0.29 0.30
Total Admissions NA NA NA 514,679 677,934
Total Length of stay NA NA NA 707,221 1,835,852
Health centers Provid-ing BEOC Service NA NA NA 33.4 30.2
* It include only health professionals work in public health facilities
Health and Health Related Indicators EFY,2003 6
2.2 Selected HSDP IV Indicators: Baseline, Targets and Achievements (EFY,2003)
Indicators Baseline Target for the Year
1st year HSDPIV
Expansion of Primary Health Care Services
HP to population ratio NA 1:5000 1:5,426
HC to population ratio NA 1:25000 1:30,794
Number of midwifery 2,002 8,635 2,404
Improve Maternal, Neonatal, child and Adolescent Health
Contraceptive Acceptance Rate 56 66 61.7
Antenatal care Coverage at least one visit 68 76 82.2
Caesarean Section Rate 1 4 1
Birth attended by skilled health personnel 18.4 36 16.6
Postnatal care coverage 34 52 42.1
PMTCT Prophylaxis 8 36 9.5
Pentavalent (DPT3-HepB3-Hib3) Immunization coverage 82 88 84.7
Measles Immunization Coverage 77 82 81.5
Full Immunization coverage 66 75 74.5
Neonates Protection at birth (PAB) 42 60 66.4
Health and Health Related Indicators EFY,2003 7
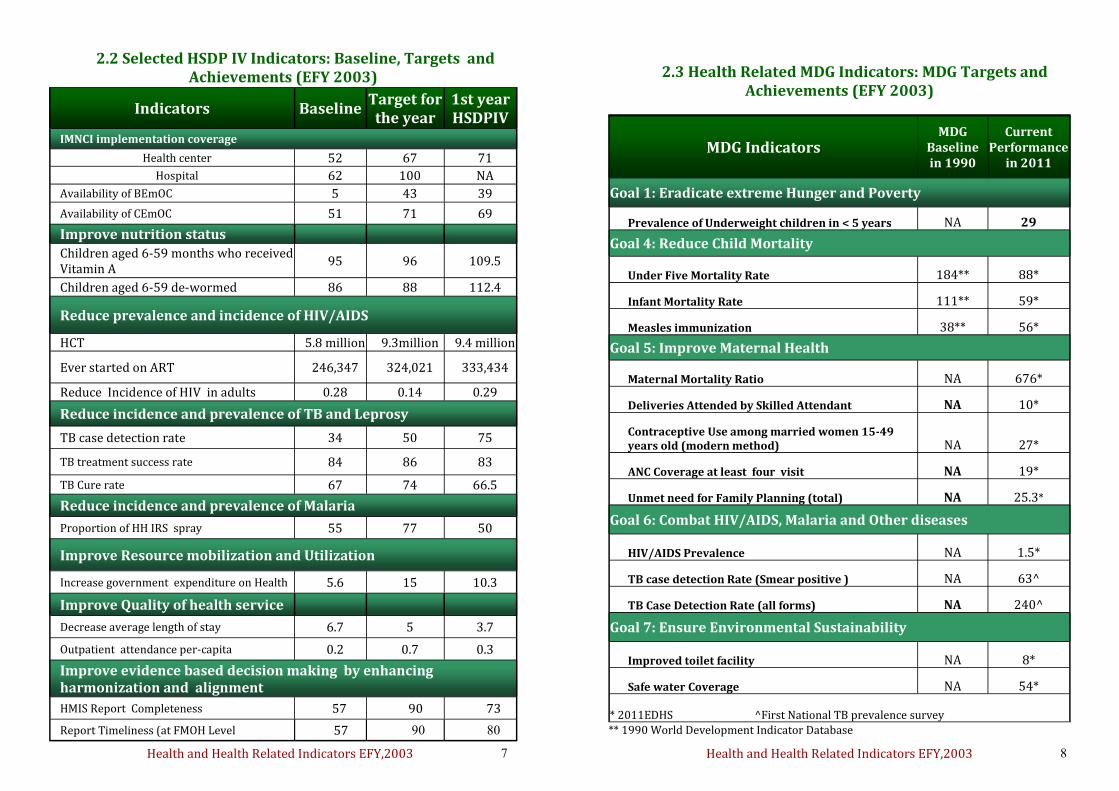
2.2 Selected HSDP IV Indicators: Baseline, Targets and Achievements (EFY 2003)
Indicators Baseline Target for the year
1st year HSDPIV
IMNCI implementation coverage
Health center 52 67 71
Hospital 62 100 NA
Availability of BEmOC 5 43 39
Availability of CEmOC 51 71 69
Improve nutrition status
Children aged 6-59 months who received Vitamin A
95 96 109.5
Children aged 6-59 de-wormed 86 88 112.4
Reduce prevalence and incidence of HIV/AIDS
HCT 5.8 million 9.3million 9.4 million
Ever started on ART 246,347 324,021 333,434
Reduce Incidence of HIV in adults 0.28 0.14 0.29
Reduce incidence and prevalence of TB and Leprosy
TB case detection rate 34 50 75
TB treatment success rate 84 86 83
TB Cure rate 67 74 66.5
Reduce incidence and prevalence of Malaria
Proportion of HH IRS spray 55 77 50
Improve Resource mobilization and Utilization
Increase government expenditure on Health 5.6 15 10.3
Improve Quality of health service
Decrease average length of stay 6.7 5 3.7
Outpatient attendance per-capita 0.2 0.7 0.3
Improve evidence based decision making by enhancing harmonization and alignment
HMIS Report Completeness 57 90 73
Report Timeliness (at FMOH Level 57 90 80
Health and Health Related Indicators EFY,2003 8
2.3 Health Related MDG Indicators: MDG Targets and Achievements (EFY 2003)
MDG Indicators MDG
Baseline in 1990
Current Performance
in 2011
Goal 1: Eradicate extreme Hunger and Poverty
Prevalence of Underweight children in < 5 years NA 29
Goal 4: Reduce Child Mortality
Under Five Mortality Rate 184** 88*
Infant Mortality Rate 111** 59*
Measles immunization 38** 56*
Goal 5: Improve Maternal Health
Maternal Mortality Ratio NA 676*
Deliveries Attended by Skilled Attendant NA 10*
Contraceptive Use among married women 15-49 years old (modern method) NA 27*
ANC Coverage at least four visit NA 19*
Unmet need for Family Planning (total) NA 25.3*
Goal 6: Combat HIV/AIDS, Malaria and Other diseases
HIV/AIDS Prevalence NA 1.5*
TB case detection Rate (Smear positive ) NA 63^
TB Case Detection Rate (all forms) NA 240^
Goal 7: Ensure Environmental Sustainability
Improved toilet facility NA 8*
Safe water Coverage NA 54*
* 2011EDHS ^First National TB prevalence survey
** 1990 World Development Indicator Database
Health and Health Related Indicators EFY,2003 9
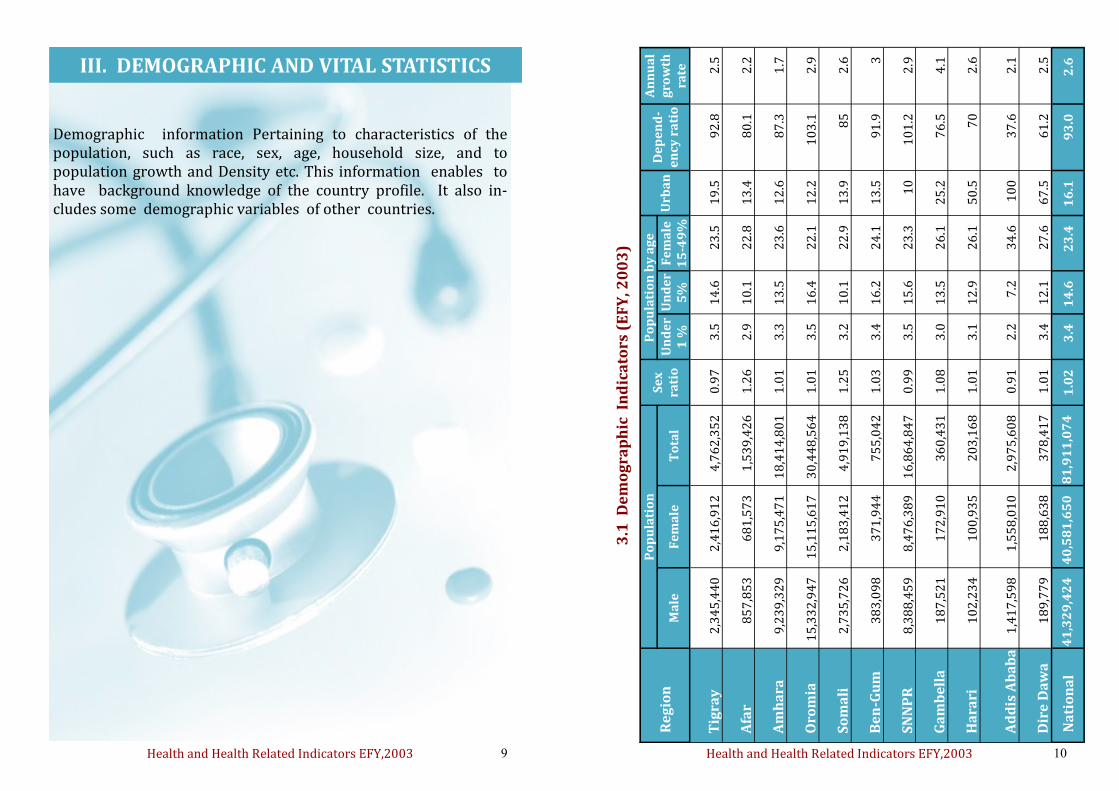
III. DEMOGRAPHIC AND VITAL STATISTICS
Demographic information Pertaining to characteristics of the population, such as race, sex, age, household size, and to population growth and Density etc. This information enables to have background knowledge of the country profile. It also in-cludes some demographic variables of other countries.
Health and Health Related Indicators EFY,2003 10
3.1
De
mo
gra
ph
ic I
nd
ica
tors
(E
FY
, 20
03
)
Re
gio
n
Po
pu
lati
on
S
ex
ra
tio
Po
pu
lati
on
by
ag
e
Urb
an
D
ep
en
d-
en
cy r
ati
o
An
nu
al
gro
wth
ra
te
Ma
le
Fe
ma
le
To
tal
U
nd
er
1 %
U
nd
er
5%
F
em
ale
15
-49
%
Tig
ray
2
,34
5,4
40
2,4
16
,91
2
4
,76
2,3
52
0
.97
3
.5
14
.6
23
.5
19
.5
92
.8
2.5
Afa
r
85
7,8
53
68
1,5
73
1,5
39
,42
6
1.2
6
2.9
1
0.1
2
2.8
1
3.4
8
0.1
2
.2
Am
ha
ra
9,2
39
,32
9
9
,17
5,4
71
18
,41
4,8
01
1
.01
3
.3
13
.5
23
.6
12
.6
87
.3
1.7
Oro
mia
15
,33
2,9
47
1
5,1
15
,61
7
3
0,4
48
,56
4
1.0
1
3.5
1
6.4
2
2.1
1
2.2
1
03
.1
2.9
So
ma
li
2,7
35
,72
6
2
,18
3,4
12
4,9
19
,13
8
1.2
5
3.2
1
0.1
2
2.9
1
3.9
8
5
2.6
Be
n-G
um
38
3,0
98
37
1,9
44
75
5,0
42
1
.03
3
.4
16
.2
24
.1
13
.5
91
.9
3
SN
NP
R
8,3
88
,45
9
8
,47
6,3
89
16
,86
4,8
47
0
.99
3
.5
15
.6
23
.3
10
1
01
.2
2.9
Ga
mb
ell
a
1
87
,52
1
1
72
,91
0
3
60
,43
1
1.0
8
3.0
1
3.5
2
6.1
2
5.2
7
6.5
4
.1
Ha
rari
10
2,2
34
10
0,9
35
20
3,1
68
1
.01
3
.1
12
.9
26
.1
50
.5
70
2
.6
Ad
dis
Ab
ab
a
1,4
17
,59
8
1
,55
8,0
10
2,9
75
,60
8
0.9
1
2.2
7
.2
34
.6
10
0
37
.6
2.1
Dir
e D
aw
a
1
89
,77
9
1
88
,63
8
3
78
,41
7
1.0
1
3.4
1
2.1
2
7.6
6
7.5
6
1.2
2
.5
N
ati
on
al
41
,32
9,4
24
40
,58
1,6
50
81
,91
1,0
74
1
.02
3
.4
14
.6
23
.4
16
.1
93
.0
2.6
Health and Health Related Indicators EFY,2003 11
3.2
Vit
al
Sta
tist
ics
(EF
Y,2
00
3)
Re
gio
n
Po
pu
lati
on
T
FR
C
BR
C
DR
Mo
rta
lity
ra
te p
er
10
00
po
pu
lati
on
L
ife
ex
pe
cta
ncy
R
NI
IMR
u
nd
er
5 M
R
Ma
le
Fe
ma
le
Tig
ray
4,7
62
,35
2
5.4
3
4.4
1
0.1
7
7
10
9.0
5
7.0
5
9.5
2
.4
Afa
r
1,5
39
,42
6
4.7
2
8.7
9
.2
75
1
06
.0
61
.9
55
.8
2.0
Am
ha
ra
18
,41
4,8
01
4
.8
33
.7
9.4
7
2
10
0.0
5
8.4
6
1.0
2
.4
Oro
mia
3
0,4
48
,56
4
5.0
3
4.7
9
.2
74
1
03
.0
58
.0
60
.5
2.6
So
ma
li
4
,91
9,1
38
4
.8
31
.6
7.6
6
1
83
.0
63
.5
60
.4
2.4
Be
n-G
um
7
55
,04
4
4.7
3
4.1
1
1
91
1
31
.0
55
.1
56
.1
2.3
SN
NP
R
16
,86
4,8
47
4
.9
34
.6
9.8
8
2
11
7.0
5
6.4
5
8.5
2
.5
Ga
mb
ell
a
36
0,4
31
4
.1
30
.0
7.2
5
7
77
.0
62
.6
63
.3
2.3
Ha
rari
2
03
,16
8
4.1
3
0.9
8
.9
69
9
6.0
6
0.6
5
9.7
2
.2
Ad
dis
Ab
ab
a
2
,97
5,6
08
2
.4
23
.3
6.3
3
9
50
.0
65
.3
69
.1
1.7
Dir
e D
aw
a
37
8,4
17
4
.1
32
.2
8.8
7
0
98
.0
59
.1
60
.8
2.3
Na
tio
na
l
81
,91
1,0
74
4
.8
3,3
.62
9
.22
7
3
1,0
1.6
5
8.4
6
0.4
2
.4
Health and Health Related Indicators EFY,2003 12
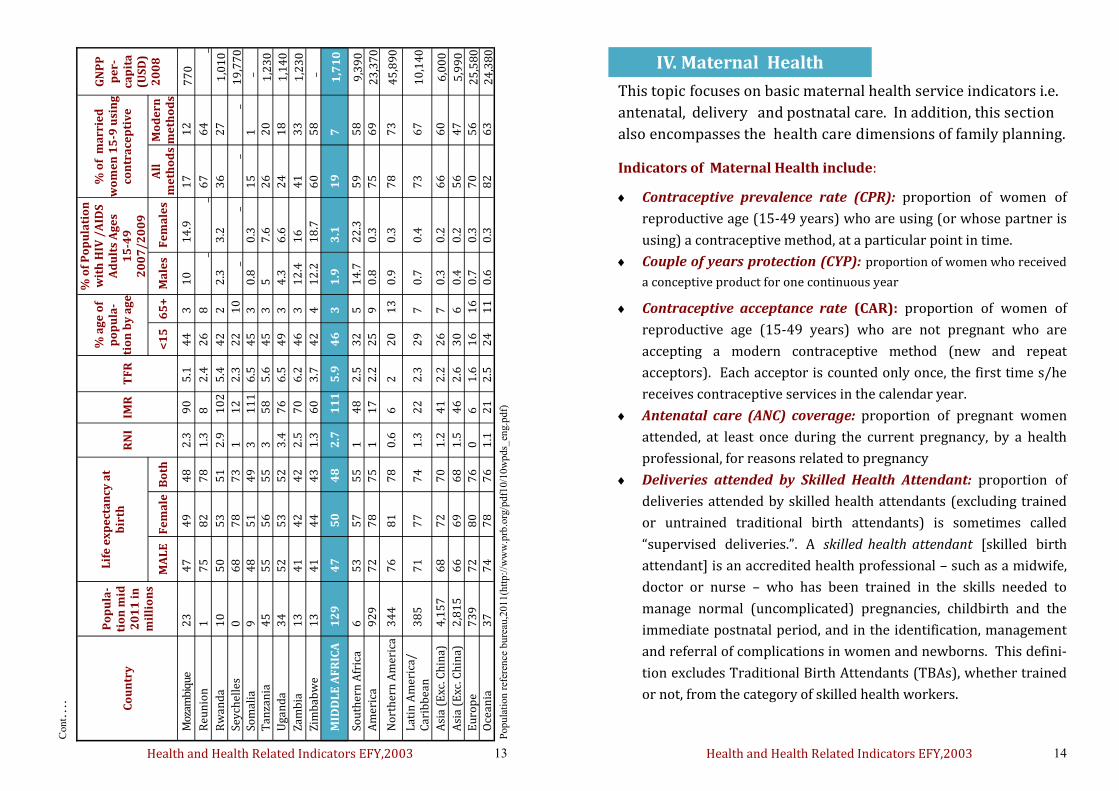
3.3
Po
pu
lati
on
an
d H
ea
lth
Da
ta E
stim
ate
s fo
r C
ou
ntr
ies
of
the
Wo
rld
(E
FY
,20
03
)
Co
un
try
Po
pu
la-
tio
n m
id
20
11
in
m
illi
on
s
Lif
e e
xp
ect
an
cy a
t b
irth
R
NI
IMR
T
FR
% a
ge
of
po
pu
lati
on
b
y a
ge
% o
f P
op
ula
tio
n
wit
h H
IV /
AID
S
Ad
ult
s A
ge
s15
-49
2
00
7/
20
09
% o
f m
arr
ied
w
om
en
15
-9 u
sin
g
con
tra
cep
tiv
e
GN
PP
p
erc
ap
ita
(U
SD
) 2
00
8
Ma
le
Fe
ma
le
Bo
th
<1
5
65
+
Ma
les
F
em
ale
s A
ll
me
tho
ds
M
od
ern
m
eth
od
s W
orl
d
68
92
6
7
71
6
9
1.2
4
6
2.5
2
7
8
0.8
0
.9
62
5
5
1
0,0
30
M
ore
de
velo
ped
12
37
74
81
77
0.2
6 1.
7 17
16
0.
7 0.
3 71
60
32,
370
Less
dev
elop
ed
5656
66
69
67
1.
4 50
2.
7 30
6
0.9
1.1
60
54
5,1
50
Less
dev
elop
ed
Exc
Chi
na
4318
63
67
65
1.
7 54
3.
1 33
5
1.1
1.4
52
44
4,8
80
Leas
t
d
evel
op
ed
85
7
54
5
7
56
2
.3
81
4
.5
41
3
1
.9
2.7
2
9
23
1
,24
0
Afr
ica
10
30
5
4
57
5
5
2.4
7
6
4.7
4
1
3
3.2
4
.8
29
2
3
2,6
30
Su
b-Sa
hara
n
Afr
ica
865
51
53
52
2.5
81
5.2
43
3 3.
7 5.
6 23
17
1
,930
Nor
ther
n A
fric
a 20
9 67
71
69
1.
9 42
3
33
4 0.
3 0.
4 49
44
5
,370
Wes
tern
Afr
ica
309
50
52
51
2.6
81
5.5
43
3 2.
1 3
14
10
1,6
00
Eas
tern
Afr
ica
326
52
54
53
2.7
72
5.3
44
3 4.
5 6.
7 28
23
1
,030
B
urun
di
9 49
52
50
2.
1 98
5.
4 41
3
1.6
2.4
9 8
38
0
Com
oros
1
62
66
64
2.6
53
4.1
38
3 <0
.1
<0.1
26
19
1
,170
D
jibou
ti
1 54
57
55
1.
8 67
4
37
3 2.
4 3.
7 18
17
2
,330
E
retr
ia
5 57
62
59
2.
9 54
4.
7 42
2
1 1.
5 8
5
630
E
thio
pia
8
5
54
5
7
55
2
.7
77
5
.4
44
3
1
.6
2.4
1
5
14
87
0
Ken
ya
40
56
57
57
2.7
52
4.6
42
3 4.
3 8
46
39
1,5
80
Mad
agas
car
20
59
62
60
2.7
48
4.8
43
3 0.
2 <0
.2
40
29
1,0
40
Mal
awi
15
48
50
49
2.9
80
6 46
3
10.2
13
.5
41
38
83
0
Mau
ritiu
s 1
69
76
73
0.5
13
1.5
22
7 2.
4 1
76
42
1
2,48
0
May
ott
e 0
7
2
76
7
4
3.6
_
4.5
4
4
2
_ _
_ _
_
Health and Health Related Indicators EFY,2003 13
C
on
t….
Co
un
try
Po
pu
la-
tio
n m
id
20
11
in
m
illi
on
s
Lif
e e
xp
ect
an
cy a
t b
irth
R
NI
IMR
T
FR
% a
ge
of
po
pu
la-
tio
n b
y a
ge
% o
f P
op
ula
tio
n
wit
h H
IV /
AID
S
Ad
ult
s A
ge
s
15
-49
2
00
7/
20
09
% o
f m
arr
ied
w
om
en
15
-9 u
sin
g
con
tra
cep
tiv
e
GN
PP
p
er-
cap
ita
(U
SD
) 2
00
8
MA
LE
F
em
ale
B
oth
<
15
6
5+
M
ale
s
Fe
ma
les
All
me
tho
ds
Mo
de
rn
me
tho
ds
Moz
ambi
que
23
4
7
49
4
8
2.3
9
0
5.1
4
4
3
10
1
4.9
1
7
12
7
70
Reu
nio
n
1
75
8
2
78
1
.3
8
2.4
2
6
8
_ _
67
6
4
_
Rw
and
a 1
0
50
5
3
51
2
.9
10
2
5.4
4
2
2
2.3
3
.2
36
2
7
1
,01
0
Sey
chel
les
0
68
7
8
73
1
1
2
2.3
2
2
10
_
_ _
_
19
,77
0
Som
alia
9
4
8
51
4
9
3
11
1
6.5
4
5
3
0.8
0
.3
15
1
_
Tan
zan
ia
45
5
5
56
5
5
3
58
5
.6
45
3
5
7
.6
26
2
0
1
,23
0
Uga
nd
a 3
4
52
5
3
52
3
.4
76
6
.5
49
3
4
.3
6.6
2
4
18
1,1
40
Zam
bia
1
3
41
4
2
42
2
.5
70
6
.2
46
3
1
2.4
1
6
41
3
3
1
,23
0
Zim
bab
we
13
4
1
44
4
3
1.3
6
0
3.7
4
2
4
12
.2
18
.7
60
5
8
_
MID
DL
E A
FR
ICA
1
29
4
7
50
4
8
2.7
1
11
5
.9
46
3
1
.9
3.1
1
9
7
1
,71
0
Sou
ther
n A
fric
a 6
5
3
57
5
5
1
48
2
.5
32
5
1
4.7
2
2.3
5
9
58
9,3
90
A
mer
ica
92
9
72
7
8
75
1
1
7
2.2
2
5
9
0.8
0
.3
75
6
9
2
3,3
70
No
rth
ern
Am
eric
a 3
44
7
6
81
7
8
0.6
6
2
2
0
13
0
.9
0.3
7
8
73
45
,89
0
Lat
in A
mer
ica/
Car
ibb
ean
3
85
7
1
77
7
4
1.3
2
2
2.3
2
9
7
0.7
0
.4
73
6
7
1
0,1
40
Asi
a (E
xc. C
hin
a)
4,1
57
6
8
72
7
0
1.2
4
1
2.2
2
6
7
0.3
0
.2
66
6
0
6
,00
0
Asi
a (E
xc. C
hin
a)
2,8
15
6
6
69
6
8
1.5
4
6
2.6
3
0
6
0.4
0
.2
56
4
7
5
,99
0
Eu
rop
e 7
39
7
2
80
7
6
0
6
1.6
1
6
16
0
.7
0.3
7
0
56
25
,58
0
Oce
ania
3
7
74
7
8
76
1
.1
21
2
.5
24
1
1
0.6
0
.3
82
6
3
2
4,3
80
P
op
ula
tion
ref
eren
ce b
ure
au,2
01
1(h
ttp
://w
ww
.prb
.org
/pd
f10/1
0w
pds_
eng.p
df)
Health and Health Related Indicators EFY,2003 14
IV. Maternal Health
This topic focuses on basic maternal health service indicators i.e.
antenatal, delivery and postnatal care. In addition, this section
also encompasses the health care dimensions of family planning.
Indicators of Maternal Health include:
Contraceptive prevalence rate (CPR): proportion of women of
reproductive age (15-49 years) who are using (or whose partner is
using) a contraceptive method, at a particular point in time.
Couple of years protection (CYP): proportion of women who received
a conceptive product for one continuous year
Contraceptive acceptance rate (CAR): proportion of women of
reproductive age (15-49 years) who are not pregnant who are
accepting a modern contraceptive method (new and repeat
acceptors). Each acceptor is counted only once, the first time s/he
receives contraceptive services in the calendar year.
Antenatal care (ANC) coverage: proportion of pregnant women
attended, at least once during the current pregnancy, by a health
professional, for reasons related to pregnancy
Deliveries attended by Skilled Health Attendant: proportion of
deliveries attended by skilled health attendants (excluding trained
or untrained traditional birth attendants) is sometimes called
“supervised deliveries.”. A skilled health attendant [skilled birth
attendant] is an accredited health professional – such as a midwife,
doctor or nurse – who has been trained in the skills needed to
manage normal (uncomplicated) pregnancies, childbirth and the
immediate postnatal period, and in the identification, management
and referral of complications in women and newborns. This defini-
tion excludes Traditional Birth Attendants (TBAs), whether trained
or not, from the category of skilled health workers.
Health and Health Related Indicators EFY,2003 15
Clean and safe Delivery: proportion of deliveries attended by an
HEW. This singles out the activities of the national HEP program, in
which clean and safe delivery services by HEWs is included as one of
the activities. It is included in a separate category because it has not
yet been well evaluated whether the skills they have and the extent
of delivery care they could provide is up to the WHO definitions.
Caesarean Section Rate: proportion of Caesarean sections among
the total no of expected deliveries.
Abortion care: number of safe abortion services provided as far as
the law permits as a proportion of expected pregnancies.
Institutional Maternal Death: proportion of maternal deaths from
all deliveries attended in the given institution. It is death of a woman
from conditions caused by pregnancy, which occurs from time of
conception to six weeks postpartum, but not from incidental or
accidental causes. The cause of death could be direct abortion,
hemorrhage, hypertension, obstructed labor or sepsis; or could be
indirect like heart disease aggravated by pregnancy, or malaria in
pregnancy.
Postnatal care (PNC) coverage: proportion of women who seek
care, at least once during postpartum (42 days after delivery), from a
skilled health attendant, including HEWs, for reasons relating to
post-partum.
Stillbirth Rate: proportion of stillbirths from total births attended
by skilled health attendants.
Institutional Early Neonatal Death Rate: proportion of deaths
within the first week of life from total births attended by skilled
health attendants in the facility.
Health and Health Related Indicators EFY,2003 16
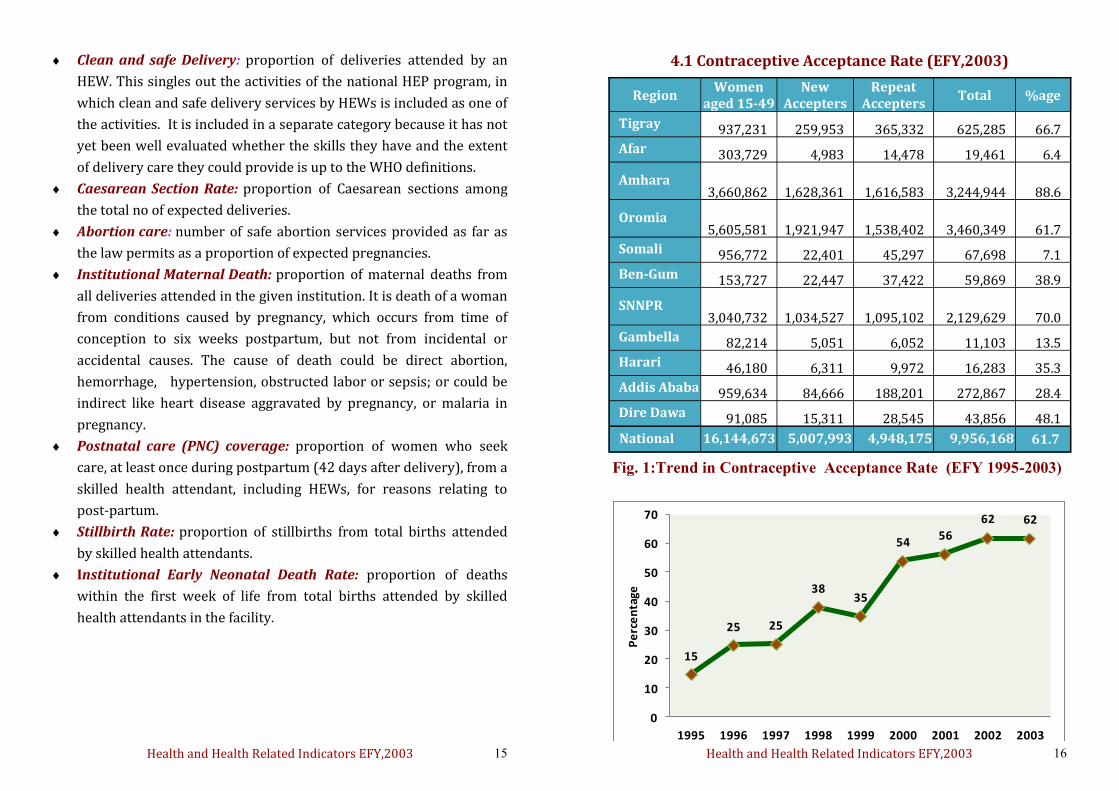
4.1 Contraceptive Acceptance Rate (EFY,2003)
Region Women
aged 15-49 New
Accepters Repeat
Accepters Total %age
Tigray 937,231
259,953
365,332
625,285
66.7
Afar 303,729
4,983
14,478
19,461
6.4
Amhara 3,660,862
1,628,361
1,616,583
3,244,944
88.6
Oromia 5,605,581
1,921,947
1,538,402
3,460,349
61.7
Somali 956,772
22,401
45,297
67,698
7.1
Ben-Gum 153,727
22,447
37,422
59,869
38.9
SNNPR 3,040,732
1,034,527
1,095,102
2,129,629
70.0
Gambella 82,214
5,051
6,052
11,103
13.5
Harari 46,180
6,311
9,972
16,283
35.3
Addis Ababa 959,634
84,666
188,201
272,867
28.4
Dire Dawa 91,085
15,311
28,545
43,856
48.1
National 16,144,673 5,007,993 4,948,175 9,956,168 61.7
15
25 25
3835
5456
62 62
0
10
20
30
40
50
60
70
1995 1996 1997 1998 1999 2000 2001 2002 2003
Pe
rce
nta
ge
Year
Fig. 1:Trend in Contraceptive Acceptance Rate (EFY 1995-2003)
Health and Health Related Indicators EFY,2003 17
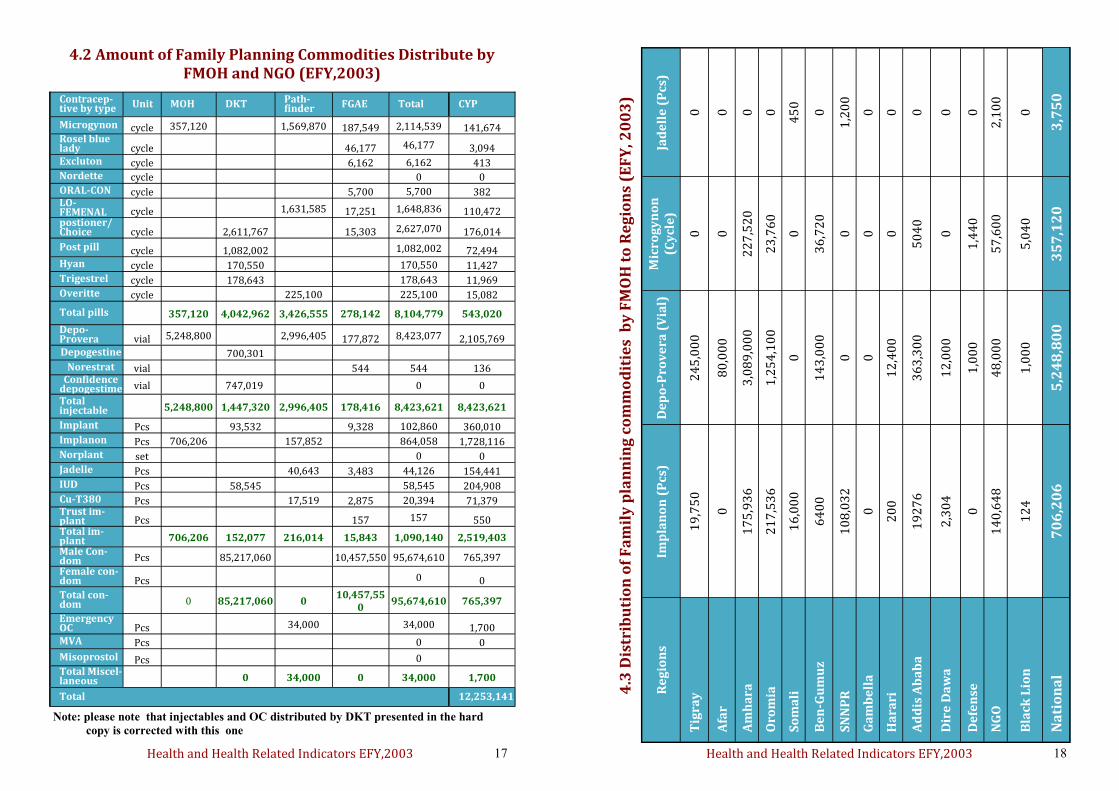
4.2 Amount of Family Planning Commodities Distribute by FMOH and NGO (EFY,2003)
Contracep-tive by type Unit MOH DKT Path-
finder FGAE Total CYP
Microgynon cycle 357,120 1,569,870 187,549 2,114,539 141,674 Rosel blue lady cycle 46,177 46,177 3,094 Excluton cycle 6,162 6,162 413 Nordette cycle 0 0 ORAL-CON cycle 5,700 5,700 382 LO-FEMENAL cycle 1,631,585 17,251 1,648,836 110,472 postioner/Choice cycle 2,611,767 15,303 2,627,070 176,014
Post pill cycle 1,082,002 1,082,002 72,494 Hyan cycle 170,550 170,550 11,427 Trigestrel cycle 178,643 178,643 11,969 Overitte cycle 225,100 225,100 15,082
Total pills 357,120 4,042,962 3,426,555 278,142 8,104,779 543,020
Depo-Provera vial 5,248,800 2,996,405 177,872 8,423,077 2,105,769 Depogestine 700,301
Norestrat vial 544 544 136 Confidence
depogestime vial 747,019 0 0
Total injectable 5,248,800 1,447,320 2,996,405 178,416 8,423,621 8,423,621
Implant Pcs 93,532 9,328 102,860 360,010 Implanon Pcs 706,206 157,852 864,058 1,728,116 Norplant set 0 0 Jadelle Pcs 40,643 3,483 44,126 154,441 IUD Pcs 58,545 58,545 204,908 Cu-T380 Pcs 17,519 2,875 20,394 71,379 Trust im-plant Pcs 157 157 550 Total im-plant 706,206 152,077 216,014 15,843 1,090,140 2,519,403
Male Con-dom Pcs 85,217,060 10,457,550 95,674,610 765,397
Female con-dom Pcs 0 0
Total con-dom 0 85,217,060 0
10,457,550
95,674,610 765,397
Emergency OC Pcs 34,000 34,000 1,700 MVA Pcs 0 0
Misoprostol Pcs 0 Total Miscel-laneous 0 34,000 0 34,000 1,700
Total 12,253,141
Note: please note that injectables and OC distributed by DKT presented in the hard
copy is corrected with this one
Health and Health Related Indicators EFY,2003 18
4.3
Dis
trib
uti
on
of
Fa
mil
y p
lan
nin
g c
om
mo
dit
ies
by
FM
OH
to
Re
gio
ns
(EF
Y, 2
00
3)
Re
gio
ns
Imp
lan
on
(P
cs)
De
po
-Pro
ve
ra (
Via
l)
Mic
rog
yn
on
(C
ycl
e)
Jad
ell
e (
Pcs
)
Tig
ray
1
9,7
50
2
45
,00
0
0
0
Afa
r 0
8
0,0
00
0
0
Am
ha
ra
17
5,9
36
3
,08
9,0
00
2
27
,52
0
0
Oro
mia
2
17
,53
6
1,2
54
,10
0
23
,76
0
0
So
ma
li
16
,00
0
0
0
45
0
Be
n-G
um
uz
64
00
1
43
,00
0
36
,72
0
0
SN
NP
R
10
8,0
32
0
0
1
,20
0
Ga
mb
ell
a
0
0
0
0
Ha
rari
2
00
1
2,4
00
0
0
Ad
dis
Ab
ab
a
19
27
6
36
3,3
00
5
04
0
0
Dir
e D
aw
a
2,3
04
1
2,0
00
0
0
De
fen
se
0
1,0
00
1
,44
0
0
NG
O
14
0,6
48
4
8,0
00
5
7,6
00
2
,10
0
Bla
ck L
ion
1
24
1
,00
0
5,0
40
0
Na
tio
na
l 7
06
,20
6
5,2
48
,80
0
35
7,1
20
3
,75
0
Health and Health Related Indicators EFY,2003 19
Re
gio
n
To
tal
Nu
mb
er
of
ex
pe
cte
d
Pre
gn
an
cy
An
ten
ata
l ca
re
cov
era
ge
D
eli
ve
rie
s b
y
skil
led
att
en
da
nt
D
eli
ve
rie
s b
y H
EW
s P
ost
na
tal
Ca
re
co
ve
rag
e
Nu
mb
er
Co
ve
rag
e
Nu
mb
er
Co
ve
rag
e
Nu
mb
er
Co
ve
rag
e
Nu
mb
er
Co
ve
rag
e
Tig
ray
17
8,5
88
1
56
,36
7
87
.6
3
2,8
81
1
8.4
1
8,6
38
1
0.4
84
,20
6
47
.2
Afa
r
4
8,3
38
12
,78
5
26
.4
3,5
86
7
.4
12
1
0.3
1
,48
9
3.1
Am
ha
ra
6
73
,98
2
58
1,2
42
8
6.2
87
,31
9
13
.0
68
,79
4
10
.2
30
9,1
32
4
5.9
Oro
mia
1
,16
6,1
80
9
25
,35
8
79
.3
2
06
,74
2
17
.7
1
26
,71
2
10
.9
48
5,6
23
4
1.6
So
ma
li
1
68
,72
6
5
2,0
66
3
0.9
12
,72
3
7.5
7,1
01
4
.2
6,8
44
4
.1
Be
n-G
um
2
8,0
88
14
,76
9
52
.6
2,1
08
7
.5
2
,10
2
7.5
5
,17
0
18
.4
SN
NP
R
6
50
,98
3
55
1,6
10
8
4.7
76
,20
0
11
.7
2
06
,58
9
31
.7
29
7,5
64
4
5.7
Ga
mb
ell
a
11
,78
6
4,6
08
3
9.1
1
,60
3
13
.6
20
2
1.7
54
0
4.6
Ha
rari
6,8
26
5
,75
6
84
.3
3,5
13
5
1.5
48
0
.7
2,3
85
3
4.9
Ad
dis
Ab
ab
a
70
,81
9
8
2,7
56
1
16
.9
4
7,7
62
6
7.4
0
0.0
26
,37
3
37
.2
Dir
e D
aw
a
13
,28
2
1
2,3
59
9
3.0
5
,17
6
39
.0
77
8
5.9
8
,57
0
64
.5
Na
tio
na
l
2,9
24
,22
5
24
03
08
8
82
.2
48
5,8
09
1
6.6
4
31
,08
5
14
.7
1,2
30
,43
3
42
.1
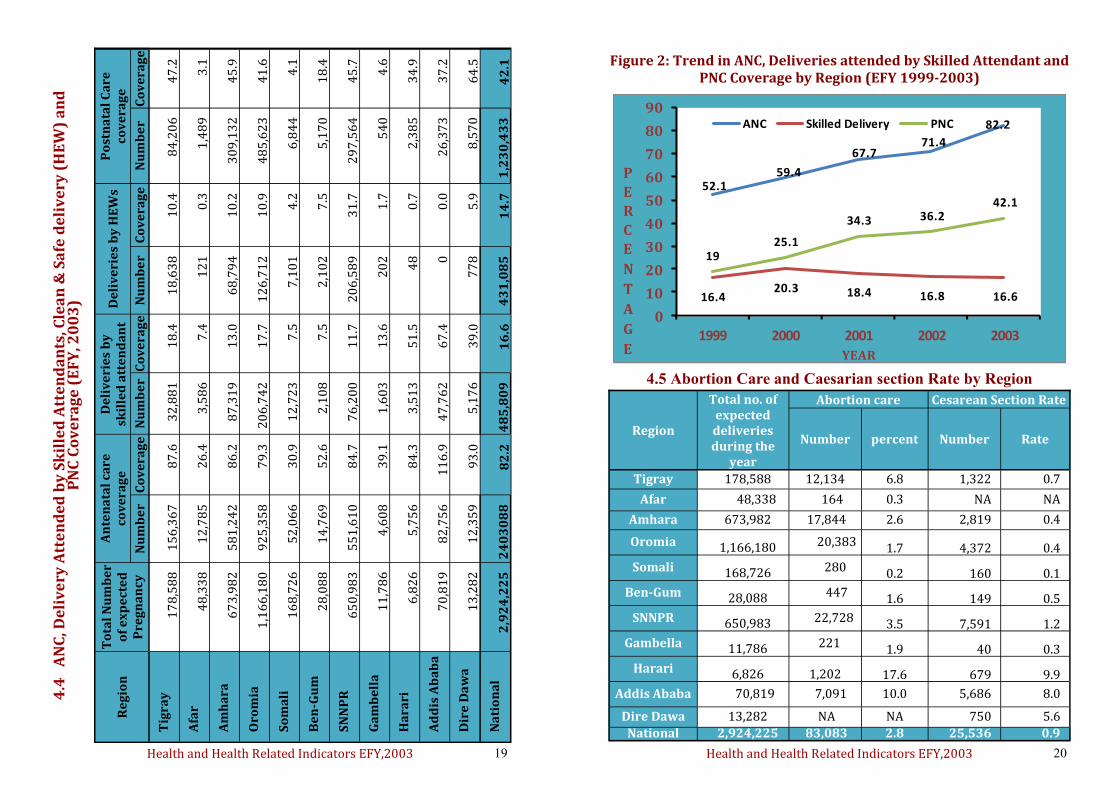
4.4
A
NC
, De
liv
ery
Att
en
de
d b
y S
kil
led
Att
en
da
nts
, Cle
an
& S
afe
de
liv
ery
(H
EW
) a
nd
P
NC
Co
ve
rag
e (
EF
Y, 2
00
3)
Health and Health Related Indicators EFY,2003 20
4.5 Abortion Care and Caesarian section Rate by Region
Figure 2: Trend in ANC, Deliveries attended by Skilled Attendant and PNC Coverage by Region (EFY 1999-2003)
Region
Total no. of expected deliveries during the
year
Abortion care Cesarean Section Rate
Number percent Number Rate
Tigray 178,588 12,134 6.8 1,322 0.7
Afar 48,338 164 0.3 NA NA
Amhara 673,982 17,844 2.6 2,819 0.4
Oromia 1,166,180 20,383 1.7
4,372 0.4
Somali 168,726 280 0.2
160 0.1
Ben-Gum 28,088 447 1.6
149 0.5
SNNPR 650,983 22,728 3.5
7,591 1.2
Gambella 11,786 221 1.9
40 0.3
Harari 6,826
1,202 17.6
679 9.9
Addis Ababa 70,819 7,091 10.0 5,686 8.0
Dire Dawa 13,282 NA NA 750 5.6
National 2,924,225 83,083 2.8 25,536 0.9
52.159.4
67.771.4
82.2
16.420.3 18.4 16.8 16.6
1925.1
34.3 36.242.1
0
10
20
30
40
50
60
70
80
90
1999 2000 2001 2002 2003
P
E
R
C
E
N
T
A
G
E YEAR
ANC Skilled Delivery PNC
Health and Health Related Indicators EFY,2003 21
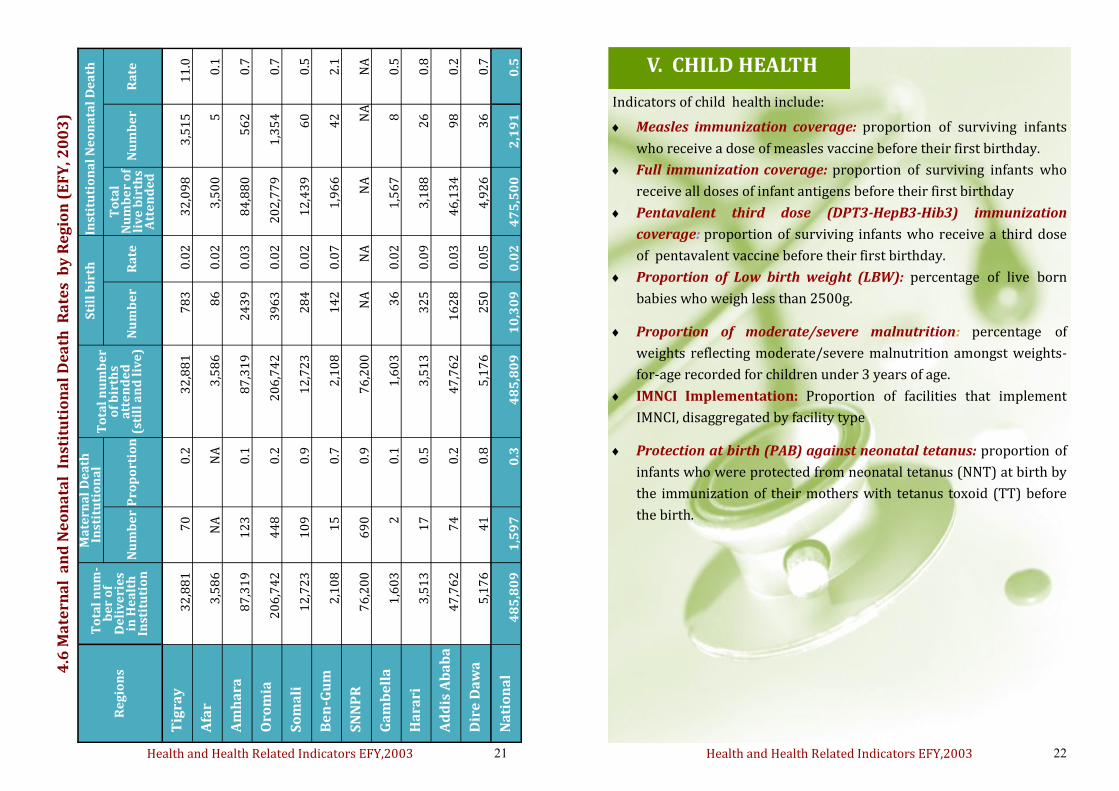
4.6
Ma
tern
al
an
d N
eo
na
tal
In
stit
uti
on
al
De
ath
Ra
tes
by
Re
gio
n (
EF
Y, 2
00
3)
Re
gio
ns
Ma
tern
al
De
ath
In
stit
uti
on
al
T
ota
l n
um
be
r o
f b
irth
s
a
tte
nd
ed
(s
till
an
d l
ive
)
Sti
ll b
irth
In
stit
uti
on
al
Ne
on
ata
l D
ea
th
To
tal
nu
m-
be
r o
f
De
liv
eri
es
in
He
alt
h
Inst
itu
tio
n
Nu
mb
er
Pro
po
rtio
n
Nu
mb
er
R
ate
To
tal
Nu
mb
er
of
liv
e b
irth
s A
tte
nd
ed
Nu
mb
er
Ra
te
Tig
ray
32
,88
1
70
0
.2
32
,88
1
78
3
0.0
2
3
2,0
98
3
,51
5
11
.0
Afa
r
3
,58
6
NA
N
A
3
,58
6
86
0
.02
3
,50
0
5
0.1
Am
ha
ra
8
7,3
19
1
23
0
.1
87
,31
9
24
39
0
.03
84
,88
0
5
62
0
.7
Oro
mia
2
06
,74
2
44
8
0.2
20
6,7
42
3
96
3
0.0
2
20
2,7
79
1
,35
4
0.7
So
ma
li
1
2,7
23
1
09
0
.9
12
,72
3
28
4
0.0
2
1
2,4
39
6
0
0.5
Be
n-G
um
2
,10
8
15
0
.7
2
,10
8
14
2
0.0
7
1,9
66
4
2
2.1
SN
NP
R
7
6,2
00
6
90
0
.9
76
,20
0
NA
N
A
NA
N
A
NA
Ga
mb
ell
a
1,6
03
2
0
.1
1
,60
3
36
0
.02
1
,56
7
8
0.5
Ha
rari
3
,51
3
17
0
.5
3
,51
3
32
5
0.0
9
3,1
88
2
6
0.8
Ad
dis
Ab
ab
a
4
7,7
62
7
4
0.2
4
7,7
62
1
62
8
0.0
3
4
6,1
34
9
8
0.2
Dir
e D
aw
a
5,1
76
4
1
0.8
5,1
76
2
50
0
.05
4
,92
6
36
0
.7
Na
tio
na
l
48
5,8
09
1
,59
7
0.3
48
5,8
09
1
0,3
09
0
.02
4
75
,50
0
2
,19
1
0.5
Health and Health Related Indicators EFY,2003 22
V. CHILD HEALTH
Indicators of child health include:
Measles immunization coverage: proportion of surviving infants
who receive a dose of measles vaccine before their first birthday.
Full immunization coverage: proportion of surviving infants who
receive all doses of infant antigens before their first birthday
Pentavalent third dose (DPT3-HepB3-Hib3) immunization
coverage: proportion of surviving infants who receive a third dose
of pentavalent vaccine before their first birthday.
Proportion of Low birth weight (LBW): percentage of live born
babies who weigh less than 2500g.
Proportion of moderate/severe malnutrition: percentage of
weights reflecting moderate/severe malnutrition amongst weights-
for-age recorded for children under 3 years of age.
IMNCI Implementation: Proportion of facilities that implement
IMNCI, disaggregated by facility type
Protection at birth (PAB) against neonatal tetanus: proportion of
infants who were protected from neonatal tetanus (NNT) at birth by
the immunization of their mothers with tetanus toxoid (TT) before
the birth.
Health and Health Related Indicators EFY,2003 23
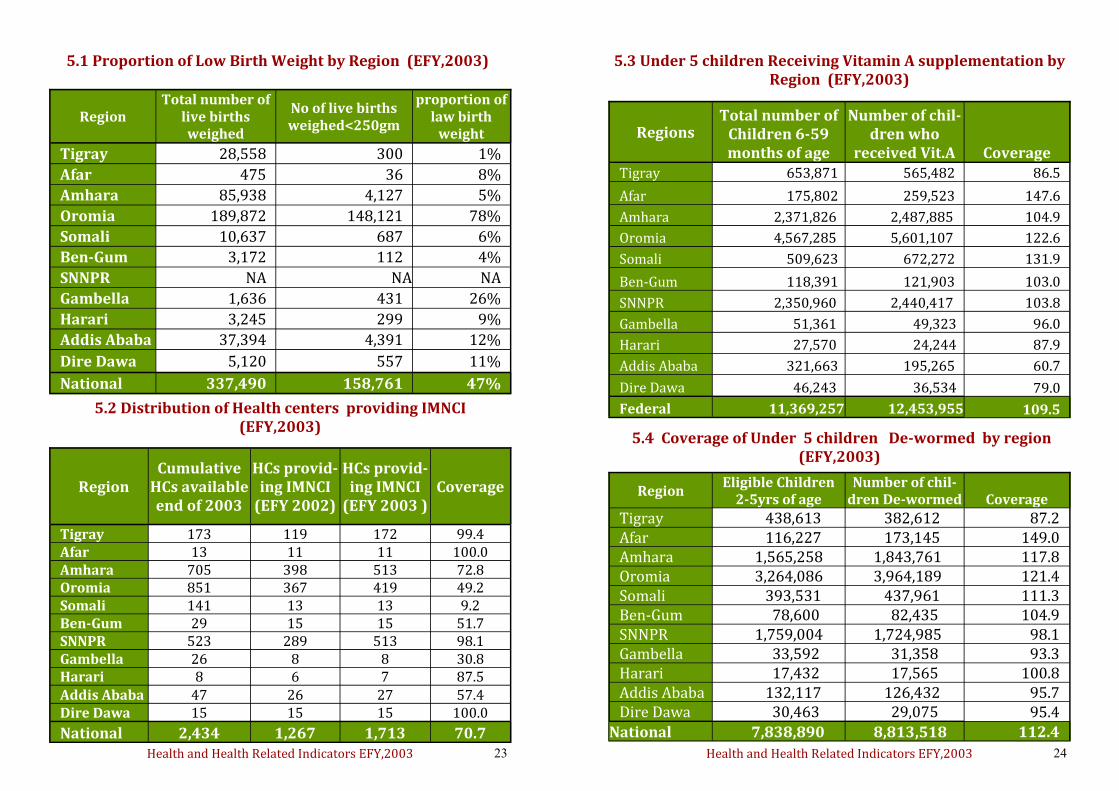
5.1 Proportion of Low Birth Weight by Region (EFY,2003)
Region Total number of
live births weighed
No of live births weighed<250gm
proportion of law birth
weight
Tigray 28,558 300 1%
Afar 475 36 8%
Amhara 85,938 4,127 5%
Oromia 189,872 148,121 78%
Somali 10,637 687 6%
Ben-Gum 3,172 112 4%
SNNPR NA NA NA
Gambella 1,636 431 26%
Harari 3,245 299 9%
Addis Ababa 37,394 4,391 12%
Dire Dawa 5,120 557 11%
National 337,490 158,761 47%
5.2 Distribution of Health centers providing IMNCI (EFY,2003)
Region Cumulative
HCs available end of 2003
HCs provid-ing IMNCI
(EFY 2002)
HCs provid-ing IMNCI
(EFY 2003 ) Coverage
Tigray 173 119 172 99.4 Afar 13 11 11 100.0 Amhara 705 398 513 72.8 Oromia 851 367 419 49.2 Somali 141 13 13 9.2 Ben-Gum 29 15 15 51.7 SNNPR 523 289 513 98.1 Gambella 26 8 8 30.8 Harari 8 6 7 87.5 Addis Ababa 47 26 27 57.4 Dire Dawa 15 15 15 100.0
National 2,434 1,267 1,713 70.7 Health and Health Related Indicators EFY,2003 24
5.3 Under 5 children Receiving Vitamin A supplementation by Region (EFY,2003)
Regions Total number of
Children 6-59 months of age
Number of chil-dren who
received Vit.A Coverage Tigray 653,871 565,482 86.5
Afar 175,802 259,523 147.6
Amhara 2,371,826 2,487,885 104.9
Oromia 4,567,285 5,601,107 122.6
Somali 509,623 672,272 131.9
Ben-Gum 118,391 121,903 103.0
SNNPR 2,350,960 2,440,417 103.8
Gambella 51,361 49,323 96.0
Harari 27,570 24,244 87.9
Addis Ababa 321,663 195,265 60.7
Dire Dawa 46,243 36,534 79.0
Federal 11,369,257 12,453,955 109.5
5.4 Coverage of Under 5 children De-wormed by region (EFY,2003)
Region Eligible Children
2-5yrs of age Number of chil-
dren De-wormed Coverage
Tigray 438,613 382,612 87.2 Afar 116,227 173,145 149.0 Amhara 1,565,258 1,843,761 117.8 Oromia 3,264,086 3,964,189 121.4 Somali 393,531 437,961 111.3 Ben-Gum 78,600 82,435 104.9 SNNPR 1,759,004 1,724,985 98.1 Gambella 33,592 31,358 93.3 Harari 17,432 17,565 100.8 Addis Ababa 132,117 126,432 95.7 Dire Dawa 30,463 29,075 95.4
National 7,838,890 8,813,518 112.4
Health and Health Related Indicators EFY,2003 25
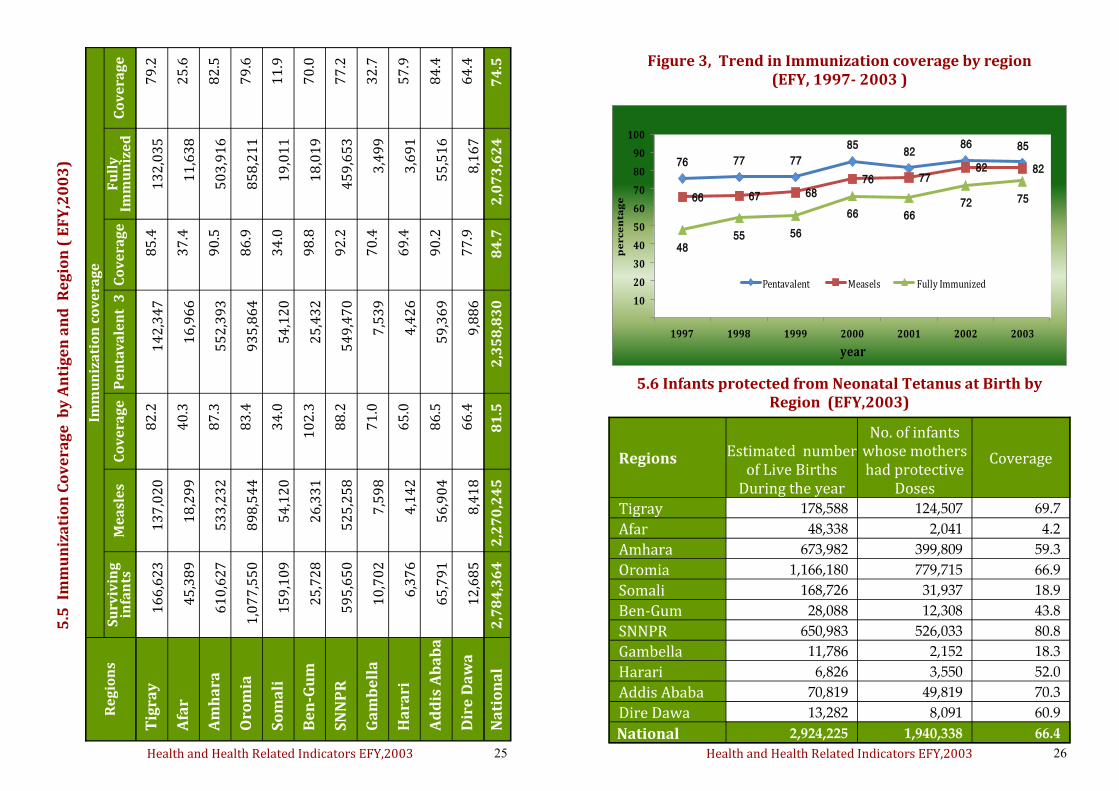
5.5
Im
mu
niz
ati
on
Co
ve
rag
e b
y A
nti
ge
n a
nd
Re
gio
n (
EF
Y,2
00
3)
Re
gio
ns
Im
mu
niz
ati
on
co
ve
rag
e
Su
rviv
ing
in
fan
ts
Me
asl
es
Co
ve
rag
e
Pe
nta
va
len
t 3
C
ov
era
ge
F
ull
y
Im
mu
niz
ed
C
ov
era
ge
Tig
ray
1
66
,62
3
13
7,0
20
8
2.2
1
42
,34
7
85
.4
13
2,0
35
7
9.2
Afa
r
45
,38
9
1
8,2
99
4
0.3
1
6,9
66
3
7.4
1
1,6
38
2
5.6
Am
ha
ra
61
0,6
27
5
33
,23
2
87
.3
55
2,3
93
9
0.5
5
03
,91
6
82
.5
Oro
mia
1,0
77
,55
0
89
8,5
44
8
3.4
9
35
,86
4
86
.9
85
8,2
11
7
9.6
So
ma
li
15
9,1
09
54
,12
0
34
.0
54
,12
0
34
.0
19
,01
1
11
.9
Be
n-G
um
25
,72
8
2
6,3
31
1
02
.3
25
,43
2
98
.8
18
,01
9
70
.0
SN
NP
R
59
5,6
50
5
25
,25
8
88
.2
54
9,4
70
9
2.2
4
59
,65
3
77
.2
Ga
mb
ell
a
1
0,7
02
7
,59
8
71
.0
7
,53
9
70
.4
3
,49
9
32
.7
Ha
rari
6
,37
6
4,1
42
6
5.0
4,4
26
6
9.4
3,6
91
5
7.9
Ad
dis
Ab
ab
a
6
5,7
91
56
,90
4
86
.5
59
,36
9
90
.2
55
,51
6
84
.4
Dir
e D
aw
a
1
2,6
85
8
,41
8
66
.4
9
,88
6
77
.9
8
,16
7
64
.4
Na
tio
na
l 2
,78
4,3
64
2
,27
0,2
45
8
1.5
2
,35
8,8
30
8
4.7
2,0
73
,62
4
74
.5
Health and Health Related Indicators EFY,2003 26
5.6 Infants protected from Neonatal Tetanus at Birth by Region (EFY,2003)
Regions Estimated number of Live Births
During the year
No. of infants whose mothers had protective
Doses
Coverage
Tigray 178,588 124,507 69.7
Afar 48,338 2,041 4.2
Amhara 673,982 399,809 59.3
Oromia 1,166,180 779,715 66.9
Somali 168,726 31,937 18.9
Ben-Gum 28,088 12,308 43.8
SNNPR 650,983 526,033 80.8
Gambella 11,786 2,152 18.3
Harari 6,826 3,550 52.0
Addis Ababa 70,819 49,819 70.3
Dire Dawa 13,282 8,091 60.9
National 2,924,225 1,940,338 66.4
Figure 3, Trend in Immunization coverage by region (EFY, 1997- 2003 )
76 77 7785
8286 85
66 67 6876 77
82 82
4855 56
66 6672 75
10
20
30
40
50
60
70
80
90
100
1997 1998 1999 2000 2001 2002 2003
pe
rc
en
tag
e
year
Pentavalent Measels Fully Immunized
Health and Health Related Indicators EFY,2003 27
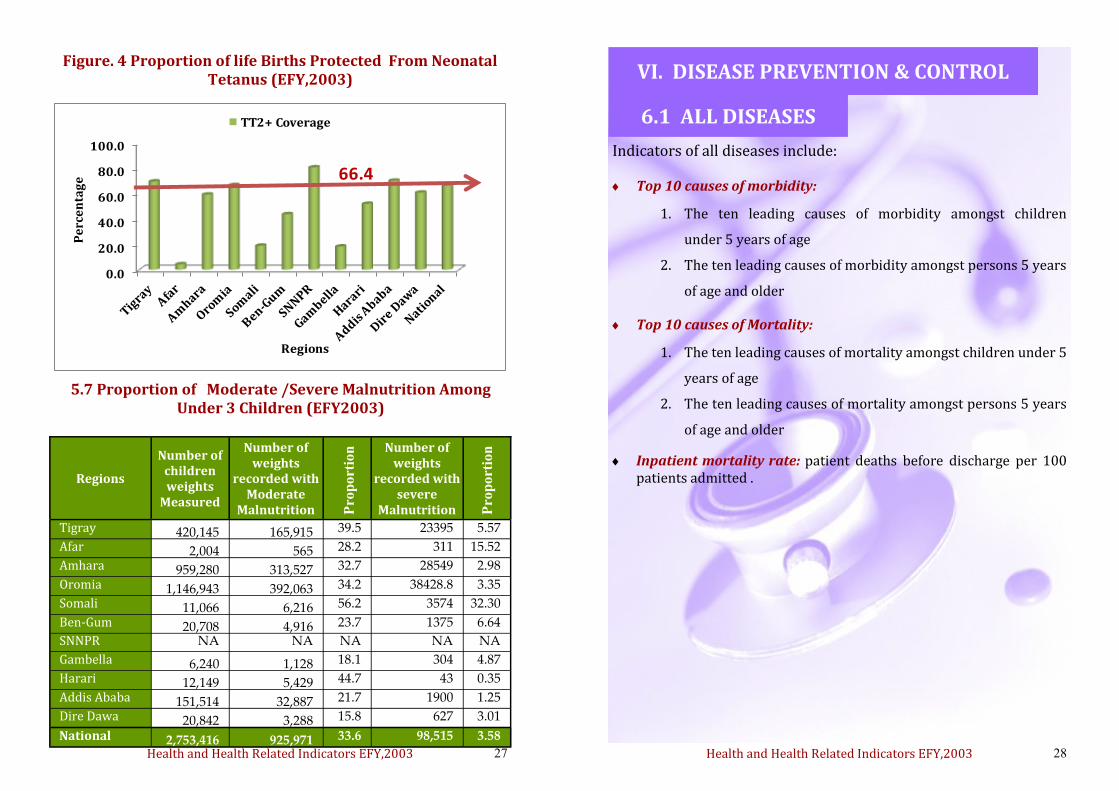
5.7 Proportion of Moderate /Severe Malnutrition Among Under 3 Children (EFY2003)
Regions
Number of children weights
Measured
Number of weights
recorded with Moderate
Malnutrition
Number of weights
recorded with severe
Malnutrition
Tigray 420,145
165,915 39.5 23395 5.57
Afar 2,004
565 28.2 311 15.52
Amhara 959,280
313,527 32.7 28549 2.98
Oromia 1,146,943
392,063 34.2 38428.8 3.35
Somali 11,066
6,216 56.2 3574 32.30
Ben-Gum 20,708
4,916 23.7 1375 6.64
SNNPR NA NA NA NA NA
Gambella 6,240
1,128 18.1 304 4.87
Harari 12,149
5,429 44.7 43 0.35
Addis Ababa 151,514
32,887 21.7 1900 1.25
Dire Dawa 20,842
3,288 15.8 627 3.01
National 2,753,416
925,971 33.6 98,515 3.58
0.0
20.0
40.0
60.0
80.0
100.0
Pe
rce
nta
ge
Regions
TT2+ Coverage
66.4
Figure. 4 Proportion of life Births Protected From Neonatal Tetanus (EFY,2003)
Pro
po
rtio
n
Pro
po
rtio
n
Health and Health Related Indicators EFY,2003 28
Indicators of all diseases include:
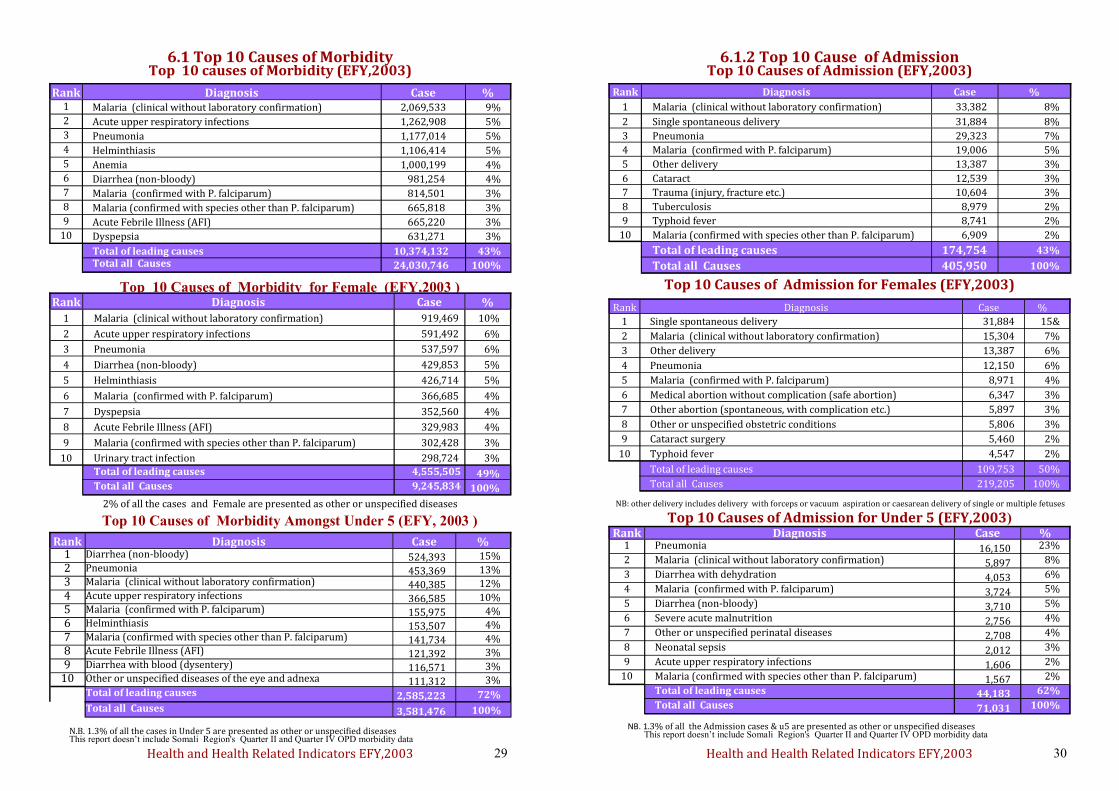
Top 10 causes of morbidity:
1. The ten leading causes of morbidity amongst children
under 5 years of age
2. The ten leading causes of morbidity amongst persons 5 years
of age and older
Top 10 causes of Mortality:
1. The ten leading causes of mortality amongst children under 5
years of age
2. The ten leading causes of mortality amongst persons 5 years
of age and older
Inpatient mortality rate: patient deaths before discharge per 100 patients admitted .
6.1 ALL DISEASES
VI. DISEASE PREVENTION & CONTROL
Health and Health Related Indicators EFY,2003 29
Rank Diagnosis Case % 1 Diarrhea (non-bloody)
524,393 15% 2 Pneumonia
453,369 13% 3 Malaria (clinical without laboratory confirmation)
440,385 12% 4 Acute upper respiratory infections
366,585 10% 5 Malaria (confirmed with P. falciparum)
155,975 4% 6 Helminthiasis
153,507 4% 7 Malaria (confirmed with species other than P. falciparum)
141,734 4% 8 Acute Febrile Illness (AFI)
121,392 3% 9 Diarrhea with blood (dysentery)
116,571 3% 10 Other or unspecified diseases of the eye and adnexa
111,312 3%
Total of leading causes
2,585,223 72%
Total all Causes 3,581,476 100%
6.1 Top 10 Causes of Morbidity Top 10 causes of Morbidity (EFY,2003)
2% of all the cases and Female are presented as other or unspecified diseases
Top 10 Causes of Morbidity for Female (EFY,2003 )
Top 10 Causes of Morbidity Amongst Under 5 (EFY, 2003 )
Rank Diagnosis Case % 1 Malaria (clinical without laboratory confirmation) 2,069,533 9%
2 Acute upper respiratory infections 1,262,908 5%
3 Pneumonia 1,177,014 5%
4 Helminthiasis 1,106,414 5%
5 Anemia 1,000,199 4% 6 Diarrhea (non-bloody) 981,254 4%
7 Malaria (confirmed with P. falciparum) 814,501 3%
8 Malaria (confirmed with species other than P. falciparum) 665,818 3%
9 Acute Febrile Illness (AFI) 665,220 3% 10 Dyspepsia 631,271 3%
Total of leading causes 10,374,132 43% Total all Causes 24,030,746 100%
Rank Diagnosis Case %
1 Malaria (clinical without laboratory confirmation) 919,469 10%
2 Acute upper respiratory infections 591,492 6%
3 Pneumonia 537,597 6%
4 Diarrhea (non-bloody) 429,853 5%
5 Helminthiasis 426,714 5%
6 Malaria (confirmed with P. falciparum) 366,685 4%
7 Dyspepsia 352,560 4%
8 Acute Febrile Illness (AFI) 329,983 4%
9 Malaria (confirmed with species other than P. falciparum) 302,428 3%
10 Urinary tract infection 298,724 3%
Total of leading causes 4,555,505 49% Total all Causes 9,245,834 100%
N.B. 1.3% of all the cases in Under 5 are presented as other or unspecified diseases This report doesn’t include Somali Region's Quarter II and Quarter IV OPD morbidity data
Health and Health Related Indicators EFY,2003 30
Rank Diagnosis Case % 1 Pneumonia
16,150 23%
2 Malaria (clinical without laboratory confirmation) 5,897 8%
3 Diarrhea with dehydration 4,053 6%
4 Malaria (confirmed with P. falciparum) 3,724 5%
5 Diarrhea (non-bloody) 3,710 5%
6 Severe acute malnutrition 2,756 4%
7 Other or unspecified perinatal diseases 2,708 4%
8 Neonatal sepsis 2,012 3%
9 Acute upper respiratory infections 1,606 2%
10 Malaria (confirmed with species other than P. falciparum) 1,567 2%
Total of leading causes 44,183 62%
Total all Causes 71,031 100%
NB: other delivery includes delivery with forceps or vacuum aspiration or caesarean delivery of single or multiple fetuses
6.1.2 Top 10 Cause of Admission Top 10 Causes of Admission (EFY,2003)
Rank Diagnosis Case %
1 Malaria (clinical without laboratory confirmation) 33,382 8%
2 Single spontaneous delivery 31,884 8%
3 Pneumonia 29,323 7%
4 Malaria (confirmed with P. falciparum) 19,006 5%
5 Other delivery 13,387 3%
6 Cataract 12,539 3%
7 Trauma (injury, fracture etc.) 10,604 3%
8 Tuberculosis 8,979 2%
9 Typhoid fever 8,741 2%
10 Malaria (confirmed with species other than P. falciparum) 6,909 2%
Total of leading causes 174,754 43%
Total all Causes 405,950 100%
NB. 1.3% of all the Admission cases & u5 are presented as other or unspecified diseases This report doesn’t include Somali Region's Quarter II and Quarter IV OPD morbidity data
Rank Diagnosis Case %
1 Single spontaneous delivery 31,884 15&
2 Malaria (clinical without laboratory confirmation) 15,304 7%
3 Other delivery 13,387 6%
4 Pneumonia 12,150 6%
5 Malaria (confirmed with P. falciparum) 8,971 4%
6 Medical abortion without complication (safe abortion) 6,347 3%
7 Other abortion (spontaneous, with complication etc.) 5,897 3%
8 Other or unspecified obstetric conditions 5,806 3%
9 Cataract surgery 5,460 2%
10 Typhoid fever 4,547 2%
Total of leading causes 109,753 50%
Total all Causes 219,205 100%
Top 10 Causes of Admission for Females (EFY,2003)
Top 10 Causes of Admission for Under 5 (EFY,2003)
Health and Health Related Indicators EFY,2003 31
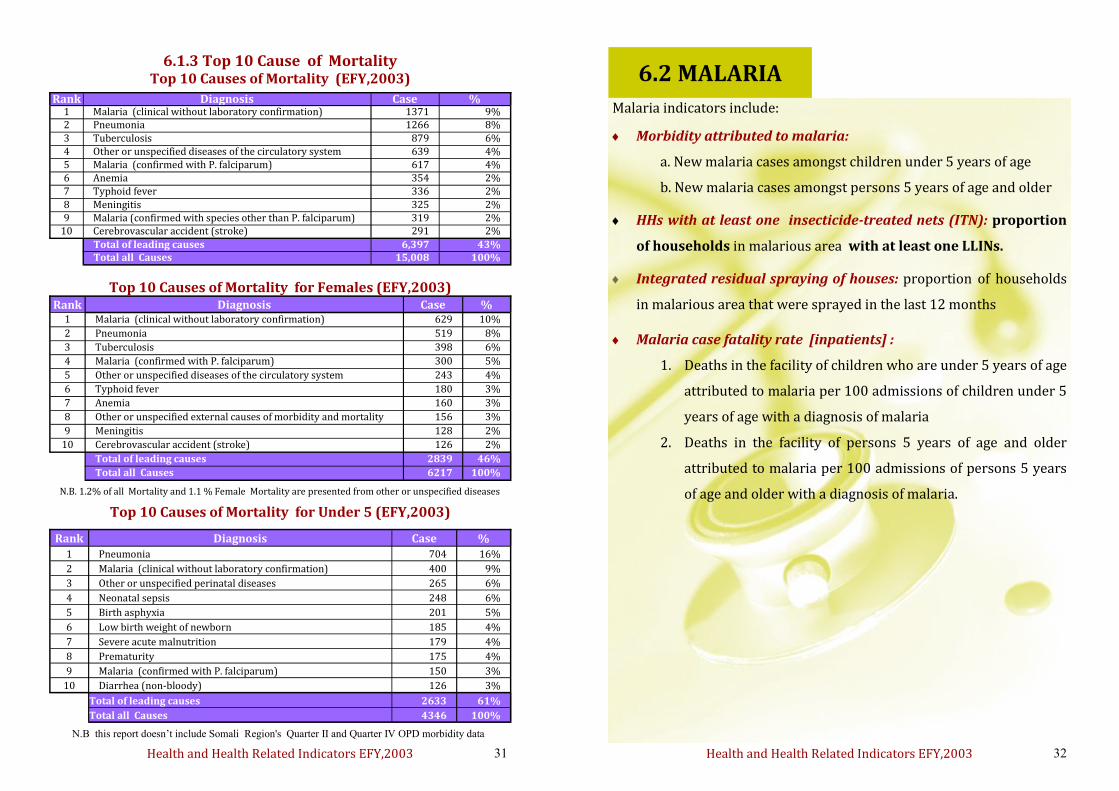
Rank Diagnosis Case % 1 Malaria (clinical without laboratory confirmation) 1371 9% 2 Pneumonia 1266 8%
3 Tuberculosis 879 6% 4 Other or unspecified diseases of the circulatory system 639 4% 5 Malaria (confirmed with P. falciparum) 617 4% 6 Anemia 354 2% 7 Typhoid fever 336 2%
8 Meningitis 325 2% 9 Malaria (confirmed with species other than P. falciparum) 319 2%
10 Cerebrovascular accident (stroke) 291 2%
Total of leading causes 6,397 43%
Total all Causes 15,008 100%
Rank Diagnosis Case %
1 Pneumonia 704 16%
2 Malaria (clinical without laboratory confirmation) 400 9%
3 Other or unspecified perinatal diseases 265 6%
4 Neonatal sepsis 248 6%
5 Birth asphyxia 201 5%
6 Low birth weight of newborn 185 4%
7 Severe acute malnutrition 179 4%
8 Prematurity 175 4%
9 Malaria (confirmed with P. falciparum) 150 3%
10 Diarrhea (non-bloody) 126 3%
Total of leading causes 2633 61%
Total all Causes 4346 100%
6.1.3 Top 10 Cause of Mortality Top 10 Causes of Mortality (EFY,2003)
N.B. 1.2% of all Mortality and 1.1 % Female Mortality are presented from other or unspecified diseases
Top 10 Causes of Mortality for Females (EFY,2003) Rank Diagnosis Case %
1 Malaria (clinical without laboratory confirmation) 629 10%
2 Pneumonia 519 8%
3 Tuberculosis 398 6%
4 Malaria (confirmed with P. falciparum) 300 5%
5 Other or unspecified diseases of the circulatory system 243 4%
6 Typhoid fever 180 3%
7 Anemia 160 3%
8 Other or unspecified external causes of morbidity and mortality 156 3%
9 Meningitis 128 2%
10 Cerebrovascular accident (stroke) 126 2%
Total of leading causes 2839 46%
Total all Causes 6217 100%
Top 10 Causes of Mortality for Under 5 (EFY,2003)
N.B this report doesn’t include Somali Region's Quarter II and Quarter IV OPD morbidity data
Health and Health Related Indicators EFY,2003 32
Malaria indicators include:
Morbidity attributed to malaria:
a. New malaria cases amongst children under 5 years of age
b. New malaria cases amongst persons 5 years of age and older
HHs with at least one insecticide-treated nets (ITN): proportion
of households in malarious area with at least one LLINs.
Integrated residual spraying of houses: proportion of households
in malarious area that were sprayed in the last 12 months
Malaria case fatality rate [inpatients] :
1. Deaths in the facility of children who are under 5 years of age
attributed to malaria per 100 admissions of children under 5
years of age with a diagnosis of malaria
2. Deaths in the facility of persons 5 years of age and older
attributed to malaria per 100 admissions of persons 5 years
of age and older with a diagnosis of malaria.
6.2 MALARIA
Health and Health Related Indicators EFY,2003 33
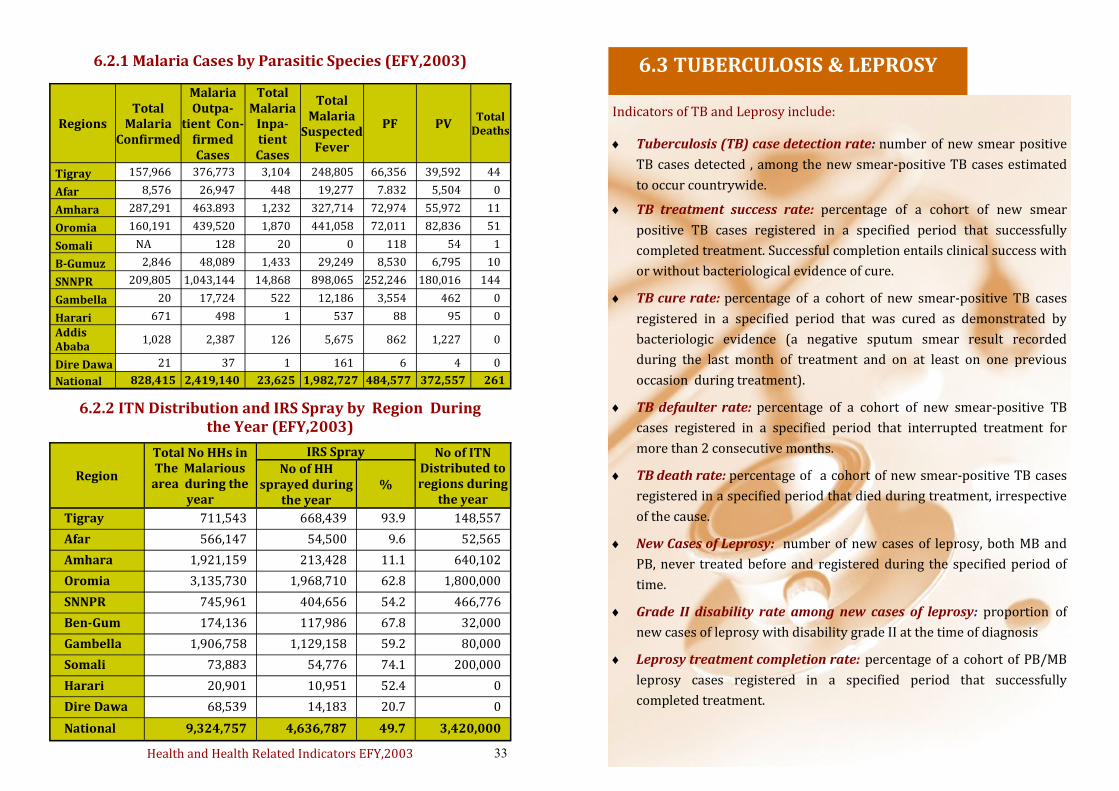
6.2.1 Malaria Cases by Parasitic Species (EFY,2003)
Regions Total
Malaria Confirmed
Malaria Outpa-
tient Con-firmed Cases
Total Malaria
Inpa-tient Cases
Total Malaria
Suspected Fever
PF PV Total
Deaths
Tigray 157,966 376,773 3,104 248,805 66,356 39,592 44
Afar 8,576 26,947 448 19,277 7.832 5,504 0
Amhara 287,291 463.893 1,232 327,714 72,974 55,972 11
Oromia 160,191 439,520 1,870 441,058 72,011 82,836 51
Somali NA 128 20 0 118 54 1
B-Gumuz 2,846 48,089 1,433 29,249 8,530 6,795 10
SNNPR 209,805 1,043,144 14,868 898,065 252,246 180,016 144
Gambella 20 17,724 522 12,186 3,554 462 0
Harari 671 498 1 537 88 95 0
Addis Ababa
1,028 2,387 126 5,675 862 1,227 0
Dire Dawa 21 37 1 161 6 4 0
National 828,415 2,419,140 23,625 1,982,727 484,577 372,557 261
Region
Total No HHs in The Malarious
area during the year
IRS Spray No of ITN Distributed to regions during
the year
No of HH sprayed during
the year %
Tigray 711,543 668,439 93.9 148,557
Afar 566,147 54,500 9.6 52,565
Amhara 1,921,159 213,428 11.1 640,102
Oromia 3,135,730 1,968,710 62.8 1,800,000
SNNPR 745,961 404,656 54.2 466,776
Ben-Gum 174,136 117,986 67.8 32,000
Gambella 1,906,758 1,129,158 59.2 80,000
Somali 73,883 54,776 74.1 200,000
Harari 20,901 10,951 52.4 0
Dire Dawa 68,539 14,183 20.7 0
National 9,324,757 4,636,787 49.7 3,420,000
6.2.2 ITN Distribution and IRS Spray by Region During the Year (EFY,2003)
Health and Health Related Indicators EFY,2003 34
6.3 TUBERCULOSIS & LEPROSY
Indicators of TB and Leprosy include:
Tuberculosis (TB) case detection rate: number of new smear positive
TB cases detected , among the new smear-positive TB cases estimated
to occur countrywide.
TB treatment success rate: percentage of a cohort of new smear
positive TB cases registered in a specified period that successfully
completed treatment. Successful completion entails clinical success with
or without bacteriological evidence of cure.
TB cure rate: percentage of a cohort of new smear-positive TB cases
registered in a specified period that was cured as demonstrated by
bacteriologic evidence (a negative sputum smear result recorded
during the last month of treatment and on at least on one previous
occasion during treatment).
TB defaulter rate: percentage of a cohort of new smear-positive TB
cases registered in a specified period that interrupted treatment for
more than 2 consecutive months.
TB death rate: percentage of a cohort of new smear-positive TB cases
registered in a specified period that died during treatment, irrespective
of the cause.
New Cases of Leprosy: number of new cases of leprosy, both MB and
PB, never treated before and registered during the specified period of
time.
Grade II disability rate among new cases of leprosy: proportion of
new cases of leprosy with disability grade II at the time of diagnosis
Leprosy treatment completion rate: percentage of a cohort of PB/MB
leprosy cases registered in a specified period that successfully
completed treatment.
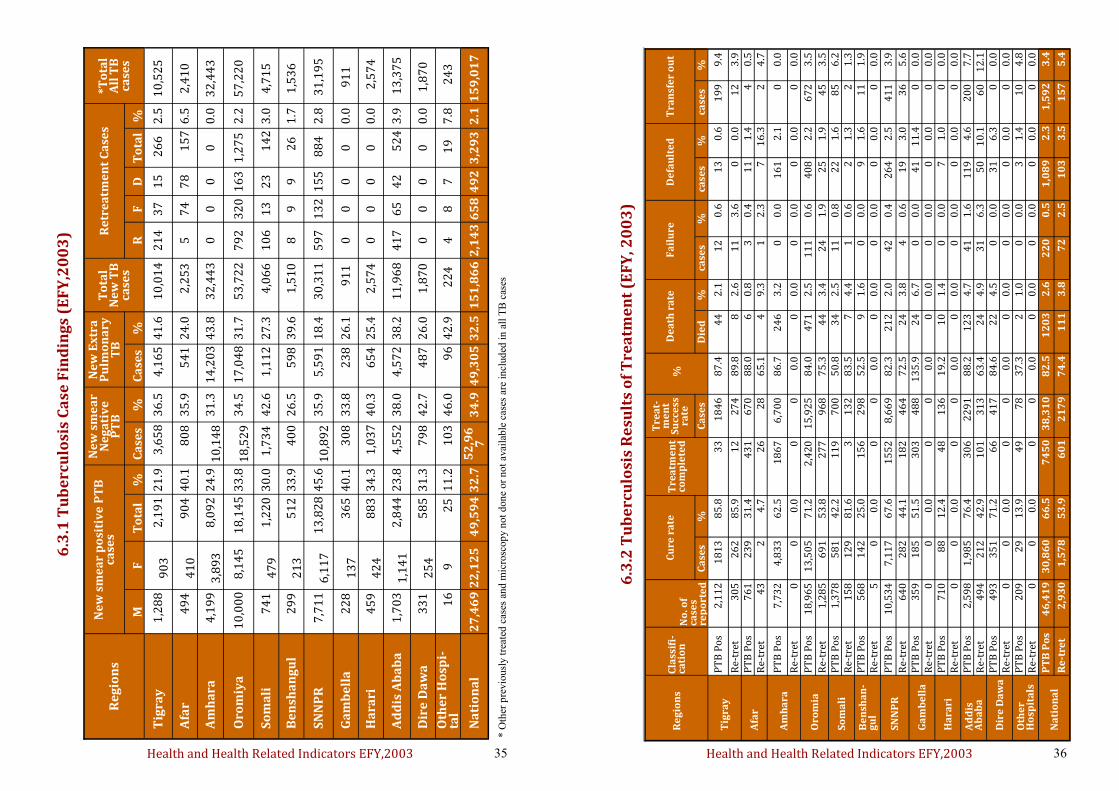
Health and Health Related Indicators EFY,2003 35
Re
gio
ns
Ne
w s
me
ar
po
siti
ve
PT
B
case
s
Ne
w s
me
ar
Ne
ga
tiv
e
PT
B
Ne
w E
xtr
a
Pu
lmo
na
ry
TB
T
ota
l N
ew
TB
ca
ses
Re
tre
atm
en
t C
ase
s *T
ota
l A
ll T
B
case
s M
F
T
ota
l %
C
ase
s %
C
ase
s %
R
F
D
T
ota
l %
Tig
ray
1,2
88
90
3
2
,19
1 2
1.9
3
,65
8
36
.5
4
,16
5
41
.6
1
0,0
14
2
14
3
7
15
2
66
2
.5
10
,52
5
Afa
r
4
94
41
0
90
4 4
0.1
80
8
35
.9
54
1
24
.0
2
,25
3
5
74
7
8
1
57
6.5
2
,41
0
Am
ha
ra
4
,19
9
3,8
93
8,0
92
24
.9
1
0,1
48
3
1.3
1
4,2
03
43
.8
3
2,4
43
0
0
0
0
0
.0
32
,44
3
Oro
miy
a
10
,00
0
8,1
45
1
8,1
45
33
.8
1
8,5
29
3
4.5
1
7,0
48
31
.7
5
3,7
22
7
92
3
20
1
63
1
,27
5
2.2
5
7,2
20
So
ma
li
74
1
4
79
1,2
20
30
.0
1,7
34
4
2.6
1,1
12
2
7.3
4,0
66
1
06
1
3
23
14
2 3
.0
4,7
15
Be
nsh
an
gu
l
2
99
21
3
51
2 3
3.9
40
0
26
.5
59
8
39
.6
1
,51
0
8
9
9
2
6
1.7
1
,53
6
SN
NP
R
7
,71
1
6,1
17
1
3,8
28
45
.6
1
0,8
92
3
5.9
5,5
91
18
.4
3
0,3
11
5
97
1
32
1
55
8
84
2
.8
31
,19
5
Ga
mb
ell
a
22
8
1
37
3
65
40
.1
3
08
3
3.8
2
38
2
6.1
9
11
0
0
0
0
0
.0
91
1
Ha
rari
4
59
42
4
88
3 3
4.3
1
,03
7
40
.3
65
4
25
.4
2
,57
4
0
0
0
0
0.0
2,5
74
Ad
dis
Ab
ab
a
1
,70
3
1,1
41
2,8
44
23
.8
4,5
52
3
8.0
4,5
72
3
8.2
11
,96
8
41
7
65
4
2
5
24
3.9
1
3,3
75
Dir
e D
aw
a
33
1
2
54
5
85
31
.3
7
98
4
2.7
4
87
2
6.0
1,8
70
0
0
0
0
0
.0
1,8
70
Oth
er
Ho
spi-
tal
1
6
9
2
5
11
.2
1
03
4
6.0
96
4
2.9
2
24
4
8
7
1
9
7.8
24
3
Na
tio
na
l 2
7,4
69
22
,12
5
49
,59
4 3
2.7
5
2,9
67
3
4.9
49
,30
5 3
2.5
15
1,8
66
2,1
43
65
8 4
92
3,2
93
2
.1 1
59
,01
7
6.3
.1 T
ub
erc
ulo
sis
Ca
se F
ind
ing
s (E
FY
,20
03
)
* O
ther
pre
vio
usl
y t
reat
ed c
ases
and
mic
rosc
op
y n
ot
don
e or
not
avai
lab
le c
ases
are
in
clud
ed i
n a
ll T
B c
ases
Health and Health Related Indicators EFY,2003 36
Re
gio
ns
Cla
ssif
i-ca
tio
n
No
. of
case
s re
po
rte
d
Cu
re r
ate
T
rea
tme
nt
co
mp
lete
d
Tre
at-
me
nt
Su
cce
ss
rate
De
ath
ra
te
Fa
ilu
re
De
fau
lte
d
Tra
nsf
er
ou
t %
Ca
ses
%
Ca
ses
Die
d
%
case
s %
ca
ses
%
case
s %
Tig
ray
P
TB
Po
s
2,1
12
1
81
3
85
.8
33
1
84
6
87
.4
44
2
.1
12
0
.6
13
0
.6
19
9
9.4
Re-
tret
3
05
2
62
8
5.9
1
2
27
4
89
.8
8
2.6
1
1
3.6
0
0
.0
12
3
.9
Afa
r P
TB
Po
s 7
61
2
39
3
1.4
4
31
6
70
8
8.0
6
0
.8
3
0.4
1
1
1.4
4
0
.5
Re-
tret
4
3
2
4.7
2
6
28
6
5.1
4
9
.3
1
2.3
7
1
6.3
2
4
.7
Am
ha
ra
PT
B P
os
7
,73
2
4
,83
3
62
.5
18
67
6,7
00
8
6.7
2
46
3
.2
0
0.0
1
61
2
.1
0
0.0
Re-
tret
0
0
0
.0
0
0
0.0
0
0
.0
0
0.0
0
0
.0
0
0.0
Oro
mia
P
TB
Po
s 1
8,9
65
1
3,5
05
7
1.2
2
,42
0
15
,92
5
84
.0
47
1
2.5
1
11
0
.6
40
8
2.2
6
72
3
.5
Re-
tret
1
,28
5
69
1
53
.8
27
7
96
8
75
.3
44
3
.4
24
1
.9
25
1
.9
45
3
.5
So
ma
li
PT
B P
os
1,3
78
5
81
4
2.2
1
19
7
00
5
0.8
3
4
2.5
1
1
0.8
2
2
1.6
8
5
6.2
R
e-tr
et
15
8
12
9
81
.6
3
13
2
83
.5
7
4.4
1
0
.6
2
1.3
2
1
.3
Be
nsh
an
-g
ul
PT
B P
os
56
8
14
2
25
.0
15
6
29
8
52
.5
9
1.6
0
0
.0
9
1.6
1
1
1.9
R
e-tr
et
5
0
0.0
0
0
0
.0
0
0.0
0
0
.0
0
0.0
0
0
.0
SN
NP
R
PT
B P
os
10
,53
4
7,1
17
6
7.6
1
55
2
8
,66
9
82
.3
21
2
2.0
4
2
0.4
2
64
2
.5
41
1
3.9
Re-
tret
6
40
2
82
4
4.1
1
82
4
64
7
2.5
2
4
3.8
4
0
.6
19
3
.0
36
5
.6
Ga
mb
ell
a
PT
B P
os
35
9
18
5
51
.5
30
3
48
8
13
5.9
2
4
6.7
0
0
.0
41
1
1.4
0
0
.0
Re-
tret
0
0
0
.0
0
0
0.0
0
0
.0
0
0.0
0
0
.0
0
0.0
Ha
rari
P
TB
Po
s 7
10
8
8
12
.4
48
1
36
1
9.2
1
0
1.4
0
0
.0
7
1.0
0
0
.0
Re-
tret
0
0
0
.0
0
0
0.0
0
0
.0
0
0.0
0
0
.0
0
0.0
Ad
dis
A
ba
ba
P
TB
Po
s 2
,59
8
1,9
85
7
6.4
3
06
2
29
1
88
.2
12
3
4.7
4
1
1.6
1
19
4
.6
20
0
7.7
R
e-tr
et
49
4
21
2
42
.9
10
1
31
3
63
.4
24
4
.9
31
6
.3
50
1
0.1
6
0
12
.1
Dir
e D
aw
a
PT
B P
os
49
3
35
1
71
.2
66
4
17
8
4.6
2
2
4.5
0
0
.0
31
6
.3
0
0.0
R
e-tr
et
0
0
0.0
0
0
0
.0
0
0.0
0
0
.0
0
0.0
0
0
.0
Oth
er
Ho
spit
als
P
TB
Po
s 2
09
2
9
13
.9
49
7
8
37
.3
2
1.0
0
0
.0
3
1.4
1
0
4.8
R
e-tr
et
0
0
0.0
0
0
0
.0
0
0.0
0
0
.0
0
0.0
0
0
.0
Na
tio
na
l P
TB
Po
s 4
6,4
19
3
0,8
60
6
6.5
7
45
0
38
,31
0
82
.5
12
03
2
.6
22
0
0.5
1
,08
9
2.3
1
,59
2
3.4
Re
-tre
t
2,9
30
1,5
78
5
3.9
6
01
2
17
9
74
.4
11
1
3.8
7
2
2.5
1
03
3
.5
15
7
5.4
6.3
.2 T
ub
erc
ulo
sis
Re
sult
s o
f T
rea
tme
nt
(EF
Y, 2
00
3)
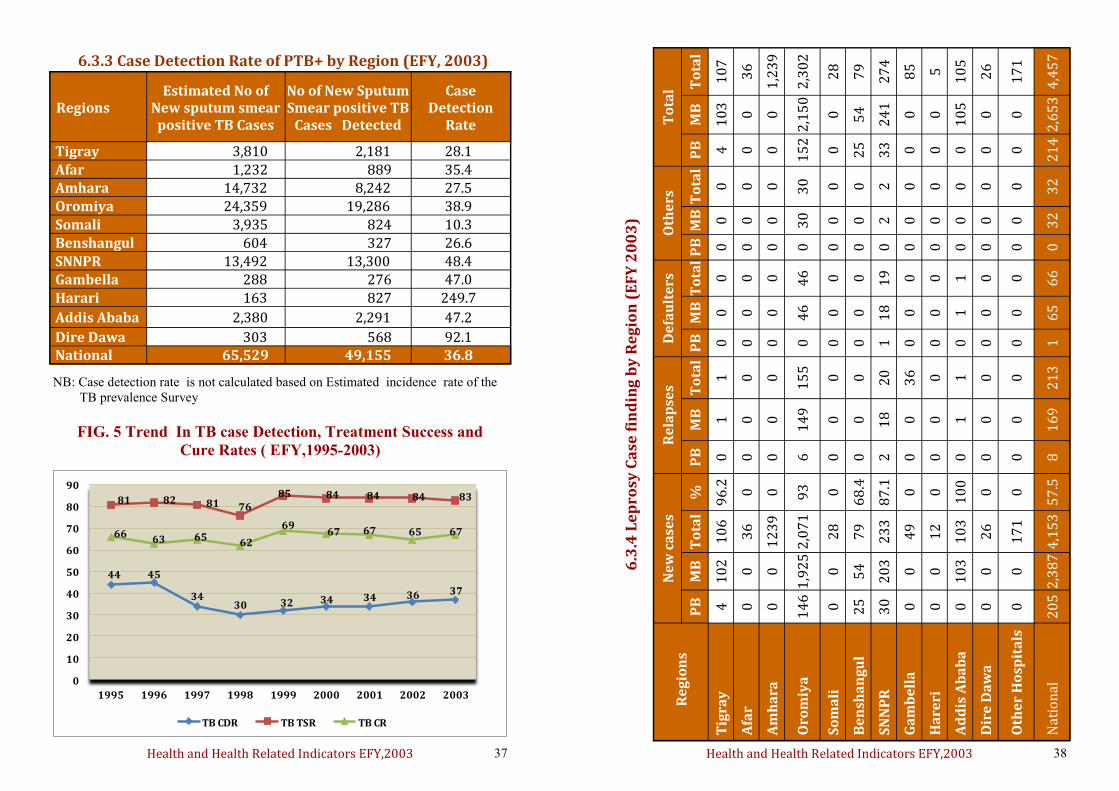
Health and Health Related Indicators EFY,2003 37
Regions Estimated No of
New sputum smear positive TB Cases
No of New Sputum Smear positive TB
Cases Detected
Case Detection
Rate
Tigray 3,810 2,181 28.1 Afar 1,232 889 35.4 Amhara 14,732 8,242 27.5 Oromiya 24,359 19,286 38.9 Somali 3,935 824 10.3
Benshangul 604 327 26.6 SNNPR 13,492 13,300 48.4 Gambella 288 276 47.0
Harari 163 827 249.7
Addis Ababa 2,380 2,291 47.2
Dire Dawa 303 568 92.1 National 65,529 49,155 36.8
6.3.3 Case Detection Rate of PTB+ by Region (EFY, 2003)
NB: Case detection rate is not calculated based on Estimated incidence rate of the
TB prevalence Survey
FIG. 5 Trend In TB case Detection, Treatment Success and
Cure Rates ( EFY,1995-2003)
44 45
3430 32 34 34 36 37
81 82 81 7685 84 84 84 83
6663 65
62
6967 67 65 67
0
10
20
30
40
50
60
70
80
90
1995 1996 1997 1998 1999 2000 2001 2002 2003
TB CDR TB TSR TB CR
Health and Health Related Indicators EFY,2003 38
6.3
.4 L
ep
rosy
Ca
se f
ind
ing
by
Re
gio
n (
EF
Y 2
00
3)
Re
gio
ns
Ne
w c
ase
s R
ela
pse
s D
efa
ult
ers
O
the
rs
To
tal
PB
M
B
To
tal
%
PB
M
B
To
tal
PB
M
B T
ota
l P
B M
B T
ota
l P
B
MB
T
ota
l
Tig
ray
4
1
02
1
06
9
6.2
0
1
1
0
0
0
0
0
0
4
1
03
1
07
Afa
r 0
0
3
6
0
0
0
0
0
0
0
0
0
0
0
0
36
Am
ha
ra
0
0
12
39
0
0
0
0
0
0
0
0
0
0
0
0
1
,23
9
Oro
miy
a
14
6 1
,92
5 2
,07
1
93
6
1
49
1
55
0
4
6
46
0
3
0
30
1
52
2,1
50
2
,30
2
So
ma
li
0
0
28
0
0
0
0
0
0
0
0
0
0
0
0
2
8
Be
nsh
an
gu
l 2
5
54
7
9
68
.4
0
0
0
0
0
0
0
0
0
25
5
4
79
SN
NP
R
30
2
03
2
33
8
7.1
2
1
8
20
1
1
8
19
0
2
2
3
3
24
1
27
4
Ga
mb
ell
a
0
0
49
0
0
0
3
6
0
0
0
0
0
0
0
0
85
Ha
reri
0
0
1
2
0
0
0
0
0
0
0
0
0
0
0
0
5
Ad
dis
Ab
ab
a
0
10
3
10
3
10
0
0
1
1
0
1
1
0
0
0
0
10
5
10
5
Dir
e D
aw
a
0
0
26
0
0
0
0
0
0
0
0
0
0
0
0
2
6
Oth
er
Ho
spit
als
0
0
1
71
0
0
0
0
0
0
0
0
0
0
0
0
1
71
Nat
ion
al
20
5 2
,38
7 4
,15
3
57
.5
8
16
9
21
3
1
65
6
6
0
32
3
2
21
4 2
,65
3
4,4
57
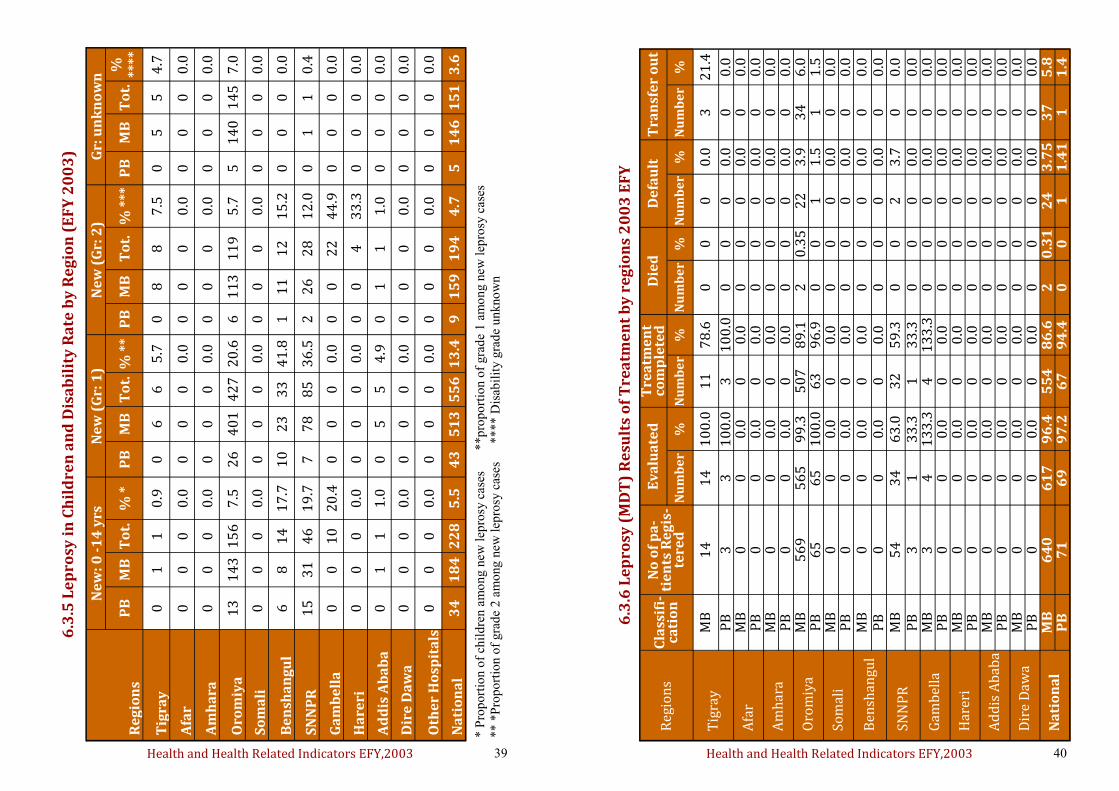
Health and Health Related Indicators EFY,2003 39
6.3
.5 L
ep
rosy
in
Ch
ild
ren
an
d D
isa
bil
ity
Ra
te b
y R
eg
ion
(E
FY
20
03
)
Re
gio
ns
Ne
w: 0
-1
4 y
rs
Ne
w (
Gr:
1)
Ne
w (
Gr:
2)
Gr:
un
kn
ow
n
PB
M
B
To
t.
% *
P
B
MB
T
ot.
% *
* P
B
MB
T
ot.
%
***
P
B
MB
T
ot.
%
**
**
Tig
ray
0
1
1
0
.9
0
6
6
5.7
0
8
8
7
.5
0
5
5
4.7
Afa
r 0
0
0
0
.0
0
0
0
0.0
0
0
0
0
.0
0
0
0
0.0
Am
ha
ra
0
0
0
0.0
0
0
0
0
.0
0
0
0
0.0
0
0
0
0
.0
Oro
miy
a
13
1
43
1
56
7
.5
26
4
01
4
27
2
0.6
6
1
13
1
19
5
.7
5
14
0
14
5
7.0
So
ma
li
0
0
0
0.0
0
0
0
0
.0
0
0
0
0.0
0
0
0
0
.0
Be
nsh
an
gu
l 6
8
1
4
17
.7
10
2
3
33
4
1.8
1
1
1
12
1
5.2
0
0
0
0
.0
SN
NP
R
15
3
1
46
1
9.7
7
7
8
85
3
6.5
2
2
6
28
1
2.0
0
1
1
0
.4
Ga
mb
ell
a
0
0
10
2
0.4
0
0
0
0
.0
0
0
22
4
4.9
0
0
0
0
.0
Ha
reri
0
0
0
0
.0
0
0
0
0.0
0
0
4
3
3.3
0
0
0
0
.0
Ad
dis
Ab
ab
a
0
1
1
1.0
0
5
5
4
.9
0
1
1
1.0
0
0
0
0
.0
Dir
e D
aw
a
0
0
0
0.0
0
0
0
0
.0
0
0
0
0.0
0
0
0
0
.0
Oth
er
Ho
spit
als
0
0
0
0
.0
0
0
0
0.0
0
0
0
0
.0
0
0
0
0.0
Na
tio
na
l 3
4
18
4
22
8
5.5
4
3
51
3
55
6
13
.4
9
15
9
19
4
4.7
5
1
46
1
51
3
.6
* P
rop
ort
ion o
f ch
ild
ren a
mo
ng n
ew
lep
rosy
case
s
**p
rop
ort
ion o
f gra
de
1 a
mo
ng n
ew
lep
rosy
case
s
** *
Pro
po
rtio
n o
f gra
de
2 a
mo
ng n
ew
lep
rosy
cas
es
**
** D
isab
ilit
y g
rad
e u
nkno
wn
Health and Health Related Indicators EFY,2003 40
6.3
.6 L
ep
rosy
(M
DT
) R
esu
lts
of
Tre
atm
en
t b
y r
eg
ion
s 2
00
3 E
FY
Reg
ion
s C
lass
ifi-
cati
on
No
of
pa
-ti
en
ts R
eg
is-
tere
d
Ev
alu
ate
d
Tre
atm
en
t co
mp
lete
d
Die
d
De
fau
lt
Tra
nsf
er
ou
t
Nu
mb
er
%
Nu
mb
er
%
Nu
mb
er
%
Nu
mb
er
%
Nu
mb
er
%
Tig
ray
M
B
14
1
4
10
0.0
1
1
78
.6
0
0
0
0.0
3
2
1.4
PB
3
3
1
00
.0
3
10
0.0
0
0
0
0
.0
0
0.0
Afa
r M
B
0
0
0.0
0
0
.0
0
0
0
0.0
0
0
.0
PB
0
0
0
.0
0
0.0
0
0
0
0
.0
0
0.0
Am
har
a M
B
0
0
0.0
0
0
.0
0
0
0
0.0
0
0
.0
PB
0
0
0
.0
0
0.0
0
0
0
0
.0
0
0.0
Oro
miy
a M
B
56
9
56
5
99
.3
50
7
89
.1
2
0.3
5
22
3
.9
34
6
.0
PB
6
5
65
1
00
.0
63
9
6.9
0
0
1
1
.5
1
1.5
Som
ali
MB
0
0
0
.0
0
0.0
0
0
0
0
.0
0
0.0
P
B
0
0
0.0
0
0
.0
0
0
0
0.0
0
0
.0
Ben
shan
gul
MB
0
0
0
.0
0
0.0
0
0
0
0
.0
0
0.0
P
B
0
0
0.0
0
0
.0
0
0
0
0.0
0
0
.0
SNN
PR
M
B
54
3
4
63
.0
32
5
9.3
0
0
2
3
.7
0
0.0
P
B
3
1
33
.3
1
33
.3
0
0
0
0.0
0
0
.0
Gam
bel
la
MB
3
4
1
33
.3
4
13
3.3
0
0
0
0
.0
0
0.0
P
B
0
0
0.0
0
0
.0
0
0
0
0.0
0
0
.0
Har
eri
MB
0
0
0
.0
0
0.0
0
0
0
0
.0
0
0.0
P
B
0
0
0.0
0
0
.0
0
0
0
0.0
0
0
.0
Ad
dis
Ab
aba
MB
0
0
0
.0
0
0.0
0
0
0
0
.0
0
0.0
P
B
0
0
0.0
0
0
.0
0
0
0
0.0
0
0
.0
Dir
e D
awa
M
B
0
0
0.0
0
0
.0
0
0
0
0.0
0
0
.0
PB
0
0
0
.0
0
0.0
0
0
0
0
.0
0
0.0
Na
tio
na
l M
B
64
0
61
7
96
.4
55
4
86
.6
2
0.3
1
24
3
.75
3
7
5.8
P
B
71
6
9
97
.2
67
9
4.4
0
0
1
1
.41
1
1
.4
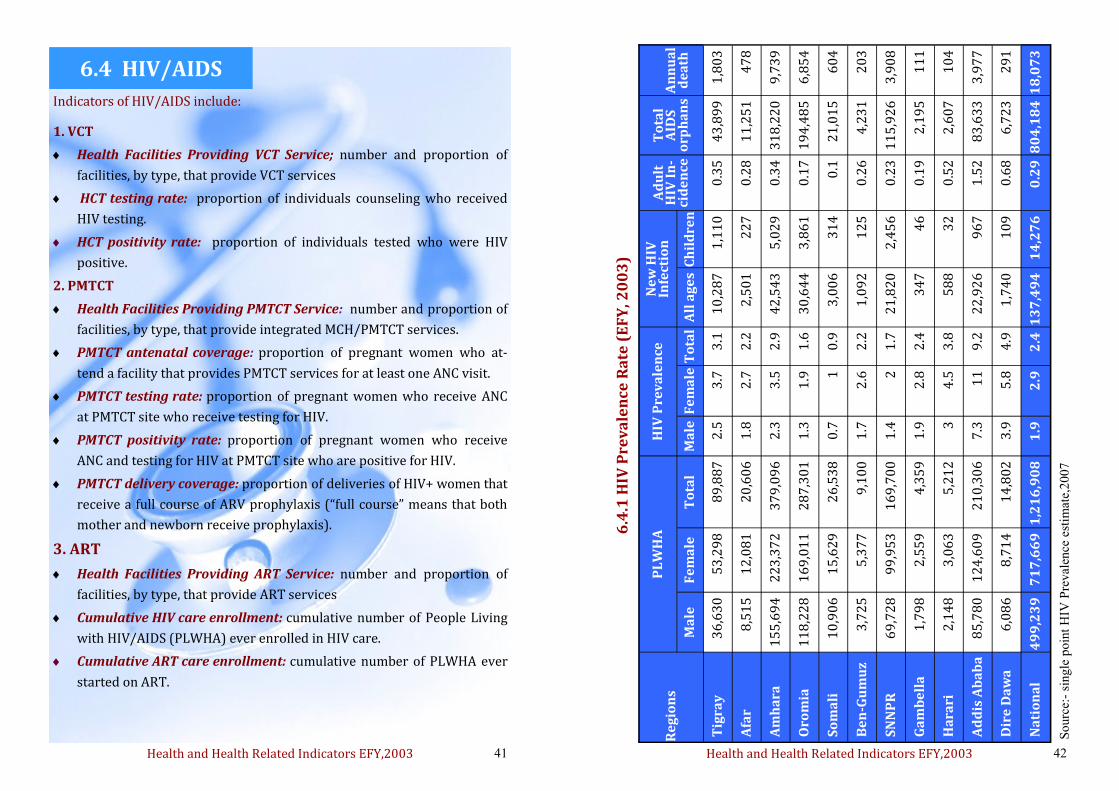
Health and Health Related Indicators EFY,2003 41
6.4 HIV/AIDS
Indicators of HIV/AIDS include:
1. VCT
Health Facilities Providing VCT Service; number and proportion of
facilities, by type, that provide VCT services
HCT testing rate: proportion of individuals counseling who received
HIV testing.
HCT positivity rate: proportion of individuals tested who were HIV
positive.
2. PMTCT
Health Facilities Providing PMTCT Service: number and proportion of
facilities, by type, that provide integrated MCH/PMTCT services.
PMTCT antenatal coverage: proportion of pregnant women who at-
tend a facility that provides PMTCT services for at least one ANC visit.
PMTCT testing rate: proportion of pregnant women who receive ANC
at PMTCT site who receive testing for HIV.
PMTCT positivity rate: proportion of pregnant women who receive
ANC and testing for HIV at PMTCT site who are positive for HIV.
PMTCT delivery coverage: proportion of deliveries of HIV+ women that
receive a full course of ARV prophylaxis (“full course” means that both
mother and newborn receive prophylaxis).
3. ART
Health Facilities Providing ART Service: number and proportion of
facilities, by type, that provide ART services
Cumulative HIV care enrollment: cumulative number of People Living
with HIV/AIDS (PLWHA) ever enrolled in HIV care.
Cumulative ART care enrollment: cumulative number of PLWHA ever
started on ART.
6.4 HIV/AIDS
Health and Health Related Indicators EFY,2003 42
6.4
.1 H
IV P
rev
ale
nce
Ra
te (
EF
Y, 2
00
3)
Re
gio
ns
PL
WH
A
HIV
Pre
va
len
ce
Ne
w H
IV
Infe
ctio
n
Ad
ult
H
IV I
n-
cid
en
ce
To
tal
AID
S
orp
ha
ns
A
nn
ua
l d
ea
th
Ma
le
Fe
ma
le
To
tal
Ma
le F
em
ale
To
tal
All
ag
es
Ch
ild
ren
Tig
ray
3
6,6
30
5
3,2
98
8
9,8
87
2
.5
3.7
3
.1
10
,28
7
1,1
10
0
.35
4
3,8
99
1
,80
3
Afa
r 8
,51
5
12
,08
1
20
,60
6
1.8
2
.7
2.2
2
,50
1
22
7
0.2
8
11
,25
1
47
8
Am
ha
ra
15
5,6
94
2
23
,37
2
37
9,0
96
2
.3
3.5
2
.9
42
,54
3
5,0
29
0
.34
3
18
,22
0
9,7
39
Oro
mia
1
18
,22
8
16
9,0
11
2
87
,30
1
1.3
1
.9
1.6
3
0,6
44
3
,86
1
0.1
7
19
4,4
85
6
,85
4
So
ma
li
10
,90
6
15
,62
9
26
,53
8
0.7
1
0
.9
3,0
06
3
14
0
.1
21
,01
5
60
4
Be
n-G
um
uz
3,7
25
5
,37
7
9,1
00
1
.7
2.6
2
.2
1,0
92
1
25
0
.26
4
,23
1
20
3
SN
NP
R
69
,72
8
99
,95
3
16
9,7
00
1
.4
2
1.7
2
1,8
20
2
,45
6
0.2
3
11
5,9
26
3
,90
8
Ga
mb
ell
a
1,7
98
2
,55
9
4,3
59
1
.9
2.8
2
.4
34
7
46
0
.19
2
,19
5
11
1
Ha
rari
2
,14
8
3,0
63
5
,21
2
3
4.5
3
.8
58
8
32
0
.52
2
,60
7
10
4
Ad
dis
Ab
ab
a
85
,78
0
12
4,6
09
2
10
,30
6
7.3
1
1
9.2
2
2,9
26
9
67
1
.52
8
3,6
33
3
,97
7
Dir
e D
aw
a
6,0
86
8
,71
4
14
,80
2
3.9
5
.8
4.9
1
,74
0
10
9
0.6
8
6,7
23
2
91
Na
tio
na
l 4
99
,23
9
71
7,6
69
1
,21
6,9
08
1
.9
2.9
2
.4 1
37
,49
4
14
,27
6
0.2
9 8
04
,18
4 1
8,0
73
So
urc
e:-
sin
gle
po
int
HIV
Pre
val
ence
est
imat
e,2
00
7
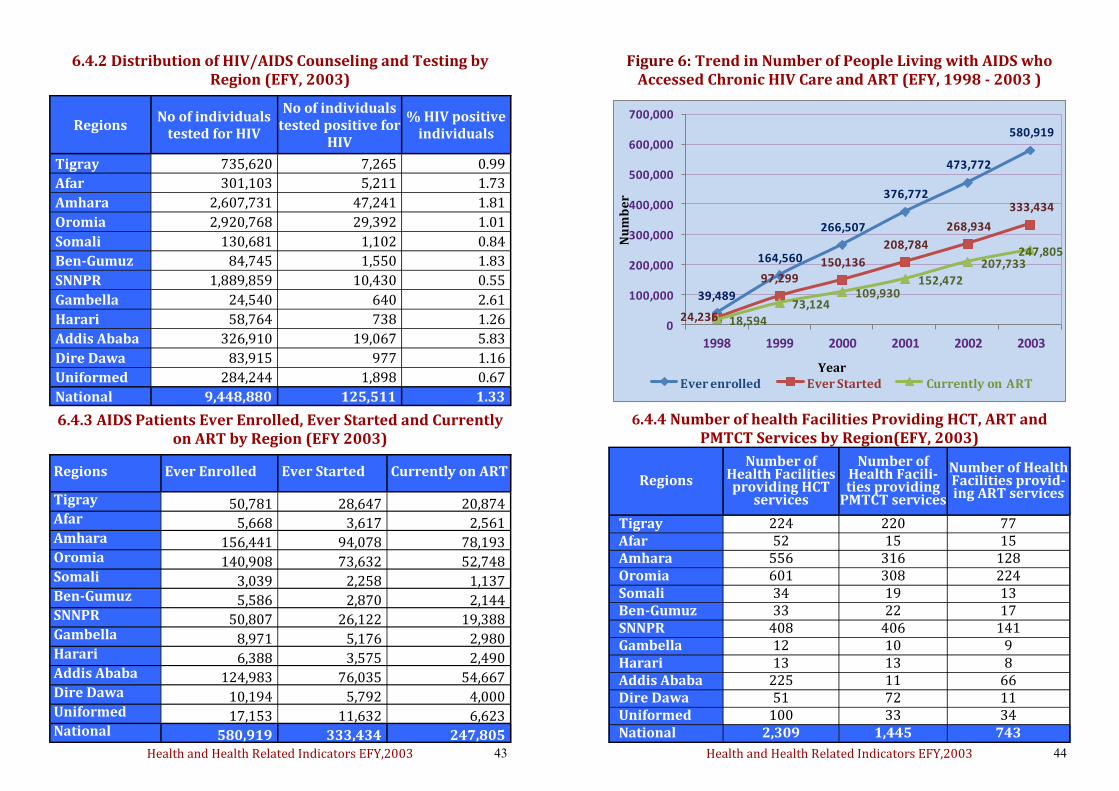
Health and Health Related Indicators EFY,2003 43
Regions No of individuals
tested for HIV
No of individuals tested positive for
HIV
% HIV positive individuals
Tigray 735,620 7,265 0.99
Afar 301,103 5,211 1.73
Amhara 2,607,731 47,241 1.81
Oromia 2,920,768 29,392 1.01
Somali 130,681 1,102 0.84
Ben-Gumuz 84,745 1,550 1.83
SNNPR 1,889,859 10,430 0.55
Gambella 24,540 640 2.61
Harari 58,764 738 1.26
Addis Ababa 326,910 19,067 5.83
Dire Dawa 83,915 977 1.16
Uniformed 284,244 1,898 0.67
National 9,448,880 125,511 1.33
6.4.2 Distribution of HIV/AIDS Counseling and Testing by Region (EFY, 2003)
6.4.3 AIDS Patients Ever Enrolled, Ever Started and Currently on ART by Region (EFY 2003)
Regions Ever Enrolled Ever Started Currently on ART
Tigray 50,781
28,647
20,874
Afar 5,668
3,617
2,561
Amhara 156,441
94,078
78,193
Oromia 140,908
73,632
52,748
Somali 3,039
2,258
1,137
Ben-Gumuz 5,586
2,870
2,144
SNNPR 50,807
26,122
19,388
Gambella 8,971
5,176
2,980
Harari 6,388
3,575
2,490
Addis Ababa 124,983
76,035
54,667
Dire Dawa 10,194
5,792
4,000
Uniformed 17,153
11,632
6,623
National 580,919
333,434
247,805
Health and Health Related Indicators EFY,2003 44
Figure 6: Trend in Number of People Living with AIDS who Accessed Chronic HIV Care and ART (EFY, 1998 - 2003 )
39,489
164,560
266,507
376,772
473,772
580,919
24,236
97,299150,136
208,784
268,934
333,434
18,594
73,124109,930
152,472
207,733247,805
0
100,000
200,000
300,000
400,000
500,000
600,000
700,000
1998 1999 2000 2001 2002 2003
Nu
mb
er
YearEver enrolled Ever Started Currently on ART
6.4.4 Number of health Facilities Providing HCT, ART and PMTCT Services by Region(EFY, 2003)
Regions
Number of Health Facilities providing HCT
services
Number of Health Facili-ties providing
PMTCT services
Number of Health Facilities provid-ing ART services
Tigray 224 220 77 Afar 52 15 15 Amhara 556 316 128 Oromia 601 308 224 Somali 34 19 13 Ben-Gumuz 33 22 17 SNNPR 408 406 141 Gambella 12 10 9 Harari 13 13 8 Addis Ababa 225 11 66 Dire Dawa 51 72 11 Uniformed 100 33 34 National 2,309 1,445 743
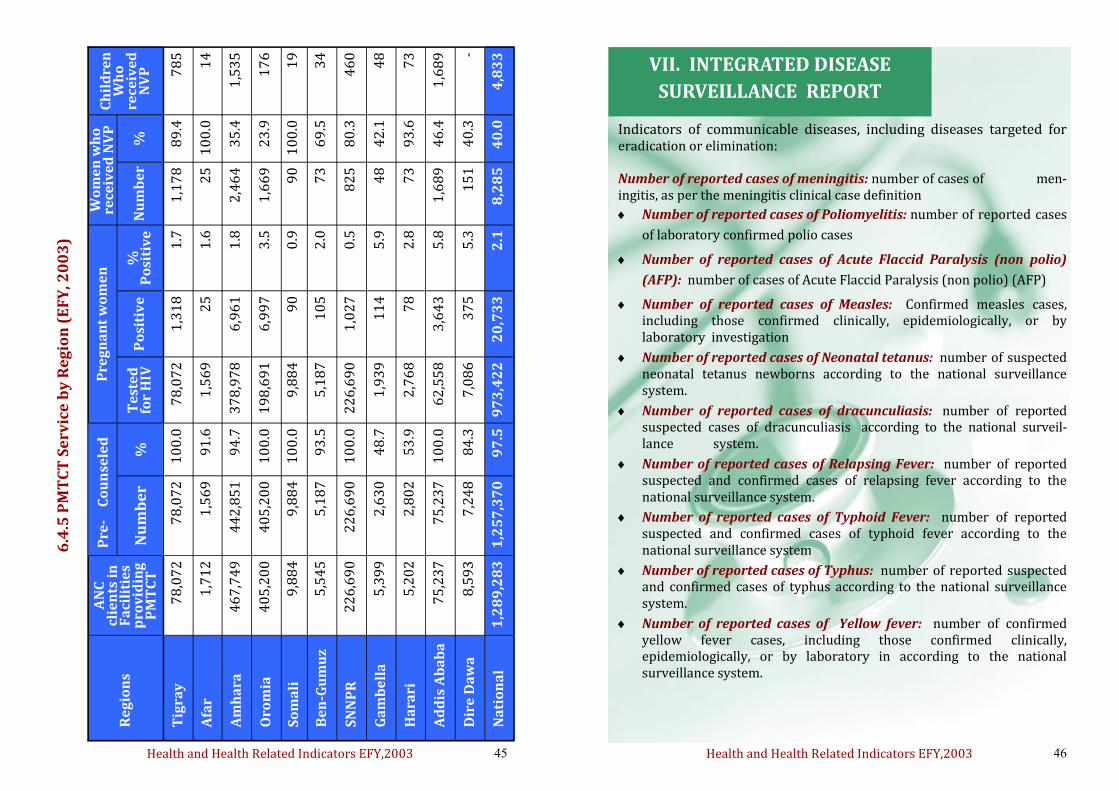
Health and Health Related Indicators EFY,2003 45
Re
gio
ns
AN
C
clie
nts
in
F
aci
liti
es
pro
vid
ing
P
MT
CT
Pre
gn
an
t w
om
en
W
om
en
wh
o
rece
ive
d N
VP
C
hil
dre
n
Wh
o
re
ceiv
ed
N
VP
Pre
-
Co
un
sele
d
Nu
mb
er
%
Te
ste
d
for
HIV
P
osi
tiv
e
%
P
osi
tiv
e
Nu
mb
er
%
Tig
ray
78
,07
2
78
,07
2
1
00
.0
7
8,0
72
1,3
18
1
.7
1
,17
8
8
9.4
78
5
Afa
r
1
,71
2
1
,56
9
9
1.6
1
,56
9
2
5
1.6
2
5
10
0.0
1
4
Am
ha
ra
46
7,7
49
4
42
,85
1
9
4.7
3
78
,97
8
6
,96
1
1.8
2,4
64
35
.4
1,5
35
Oro
mia
4
05
,20
0
40
5,2
00
10
0.0
1
98
,69
1
6
,99
7
3.5
1,6
69
23
.9
1
76
So
ma
li
9
,88
4
9
,88
4
1
00
.0
9,8
84
90
0
.9
90
1
00
.0
19
Be
n-G
um
uz
5,5
45
5,1
87
93
.5
5,1
87
1
05
2
.0
73
69
.5
34
SN
NP
R
22
6,6
90
2
26
,69
0
1
00
.0
22
6,6
90
1,0
27
0
.5
82
5
8
0.3
46
0
Ga
mb
ell
a
5
,39
9
2
,63
0
4
8.7
1
,93
9
11
4
5.9
4
8
4
2.1
4
8
Ha
rari
5,2
02
2,8
02
53
.9
2,7
68
78
2
.8
73
93
.6
73
Ad
dis
Ab
ab
a
7
5,2
37
7
5,2
37
10
0.0
62
,55
8
3
,64
3
5.8
1,6
89
46
.4
1,6
89
Dir
e D
aw
a
8
,59
3
7
,24
8
8
4.3
7
,08
6
37
5
5.3
1
51
40
.3
-
Na
tio
na
l
1,2
89
,28
3
1,2
57
,37
0
9
7.5
9
73
,42
2
20
,73
3
2
.1
8,2
85
4
0.0
4
,83
3
6.4
.5 P
MT
CT
Se
rvic
e b
y R
eg
ion
(E
FY
, 20
03
)
Health and Health Related Indicators EFY,2003 46
VII. INTEGRATED DISEASE
SURVEILLANCE REPORT
Indicators of communicable diseases, including diseases targeted for eradication or elimination: Number of reported cases of meningitis: number of cases of men-ingitis, as per the meningitis clinical case definition
Number of reported cases of Poliomyelitis: number of reported cases
of laboratory confirmed polio cases
Number of reported cases of Acute Flaccid Paralysis (non polio)
(AFP): number of cases of Acute Flaccid Paralysis (non polio) (AFP)
Number of reported cases of Measles: Confirmed measles cases, including those confirmed clinically, epidemiologically, or by laboratory investigation
Number of reported cases of Neonatal tetanus: number of suspected neonatal tetanus newborns according to the national surveillance system.
Number of reported cases of dracunculiasis: number of reported suspected cases of dracunculiasis according to the national surveil-lance system.
Number of reported cases of Relapsing Fever: number of reported suspected and confirmed cases of relapsing fever according to the national surveillance system.
Number of reported cases of Typhoid Fever: number of reported suspected and confirmed cases of typhoid fever according to the national surveillance system
Number of reported cases of Typhus: number of reported suspected and confirmed cases of typhus according to the national surveillance system.
Number of reported cases of Yellow fever: number of confirmed yellow fever cases, including those confirmed clinically, epidemiologically, or by laboratory in according to the national surveillance system.
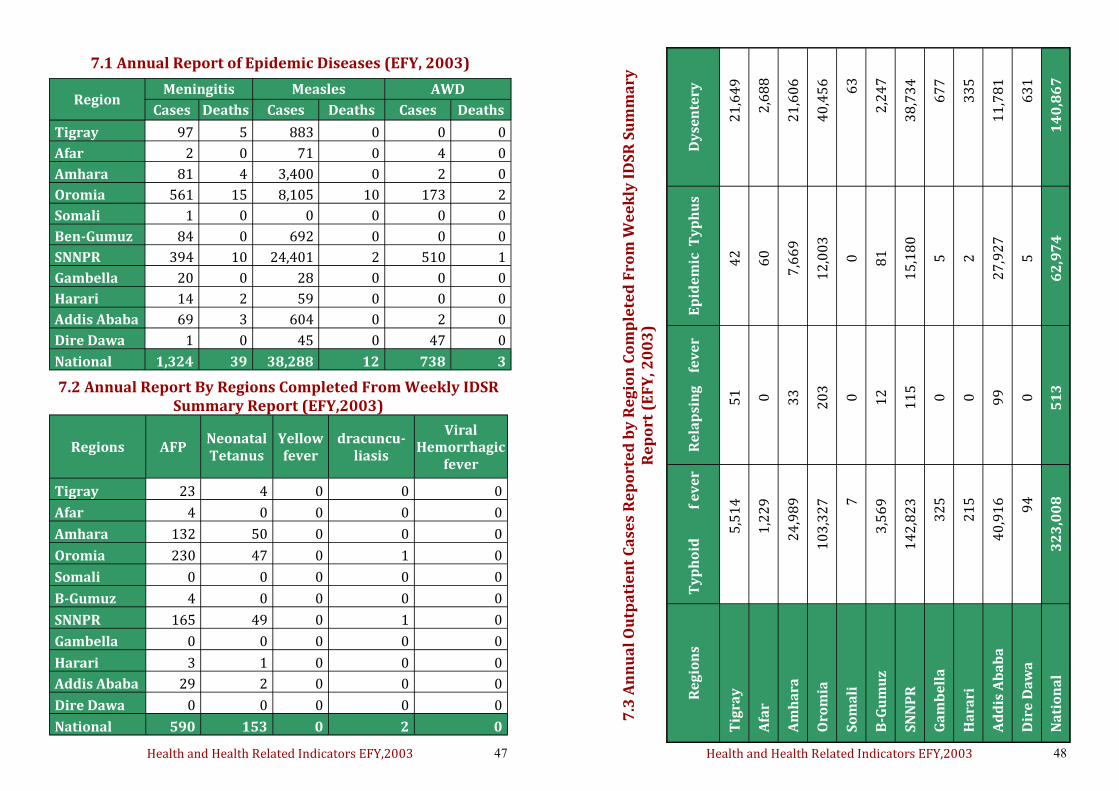
Health and Health Related Indicators EFY,2003 47
7.2 Annual Report By Regions Completed From Weekly IDSR Summary Report (EFY,2003)
Regions AFP Neonatal Tetanus
Yellow fever
dracuncu-liasis
Viral Hemorrhagic
fever
Tigray 23 4 0 0 0
Afar 4 0 0 0 0
Amhara 132 50 0 0 0
Oromia 230 47 0 1 0
Somali 0 0 0 0 0
B-Gumuz 4 0 0 0 0
SNNPR 165 49 0 1 0
Gambella 0 0 0 0 0
Harari 3 1 0 0 0
Addis Ababa 29 2 0 0 0
Dire Dawa 0 0 0 0 0
National 590 153 0 2 0
7.1 Annual Report of Epidemic Diseases (EFY, 2003)
Region Meningitis Measles AWD
Cases Deaths Cases Deaths Cases Deaths
Tigray 97 5 883 0 0 0
Afar 2 0 71 0 4 0
Amhara 81 4 3,400 0 2 0
Oromia 561 15 8,105 10 173 2
Somali 1 0 0 0 0 0
Ben-Gumuz 84 0 692 0 0 0
SNNPR 394 10 24,401 2 510 1
Gambella 20 0 28 0 0 0
Harari 14 2 59 0 0 0
Addis Ababa 69 3 604 0 2 0
Dire Dawa 1 0 45 0 47 0
National 1,324 39 38,288 12 738 3
Health and Health Related Indicators EFY,2003 48
7.3
An
nu
al
Ou
tpa
tie
nt
Ca
ses
Re
po
rte
d b
y R
eg
ion
Co
mp
lete
d F
rom
We
ek
ly I
DS
R S
um
ma
ry
R
ep
ort
(E
FY
, 20
03
)
Re
gio
ns
Ty
ph
oid
f
ev
er
Re
lap
sin
g
fe
ve
r E
pid
em
ic T
yp
hu
s
Dy
sen
tery
Tig
ray
5
,51
4
51
4
2
21
,64
9
Afa
r
1
,22
9
0
60
2,6
88
Am
ha
ra
2
4,9
89
3
3
7,6
69
2
1,6
06
Oro
mia
1
03
,32
7
20
3
12
,00
3
40
,45
6
So
ma
li
7
0
0
63
B-G
um
uz
3,5
69
1
2
81
2,2
47
SN
NP
R
14
2,8
23
1
15
1
5,1
80
3
8,7
34
Ga
mb
ell
a
3
25
0
5
6
77
Ha
rari
21
5
0
2
33
5
Ad
dis
Ab
ab
a
4
0,9
16
9
9
27
,92
7
11
,78
1
Dir
e D
aw
a
94
0
5
6
31
Na
tio
na
l
32
3,0
08
5
13
6
2,9
74
14
0,8
67
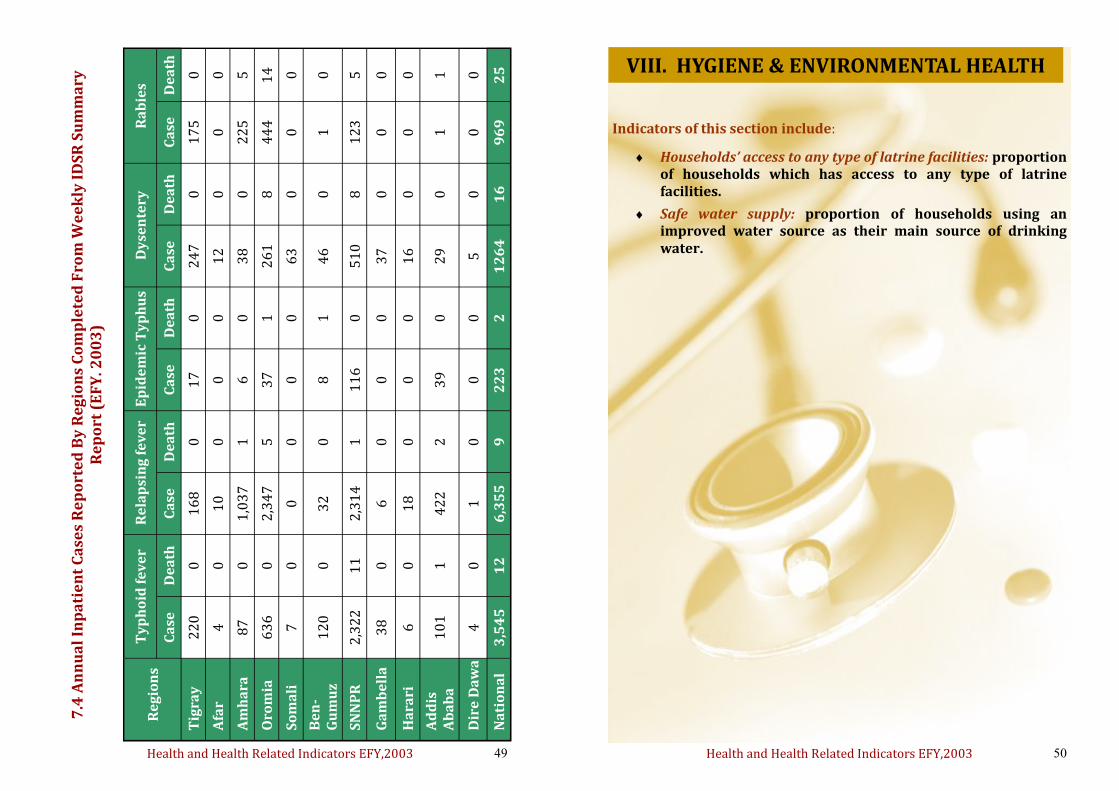
Health and Health Related Indicators EFY,2003 49
7.4
An
nu
al
Inp
ati
en
t C
ase
s R
ep
ort
ed
By
Re
gio
ns
Co
mp
lete
d F
rom
We
ek
ly I
DS
R S
um
ma
ry
Re
po
rt (
EF
Y. 2
00
3)
Re
gio
ns
Ty
ph
oid
fe
ve
r R
ela
psi
ng
fe
ve
r E
pid
em
ic T
yp
hu
s D
yse
nte
ry
Ra
bie
s
Ca
se
De
ath
C
ase
D
ea
th
Ca
se
De
ath
C
ase
D
ea
th
Ca
se
De
ath
Tig
ray
2
20
0
1
68
0
1
7
0
24
7
0
17
5
0
Afa
r 4
0
1
0
0
0
0
12
0
0
0
Am
ha
ra
87
0
1
,03
7
1
6
0
38
0
2
25
5
Oro
mia
6
36
0
2
,34
7
5
37
1
2
61
8
4
44
1
4
So
ma
li
7
0
0
0
0
0
63
0
0
0
Be
n-
Gu
mu
z 1
20
0
3
2
0
8
1
46
0
1
0
SN
NP
R
2,3
22
1
1
2,3
14
1
1
16
0
5
10
8
1
23
5
Ga
mb
ell
a
38
0
6
0
0
0
3
7
0
0
0
Ha
rari
6
0
1
8
0
0
0
16
0
0
0
Ad
dis
A
ba
ba
1
01
1
4
22
2
3
9
0
29
0
1
1
Dir
e D
aw
a
4
0
1
0
0
0
5
0
0
0
Na
tio
na
l 3
,54
5
12
6
,35
5
9
22
3
2
12
64
1
6
96
9
25
Health and Health Related Indicators EFY,2003 50
VIII. HYGIENE & ENVIRONMENTAL HEALTH
Indicators of this section include:
Households’ access to any type of latrine facilities: proportion of households which has access to any type of latrine facilities.
Safe water supply: proportion of households using an improved water source as their main source of drinking water.
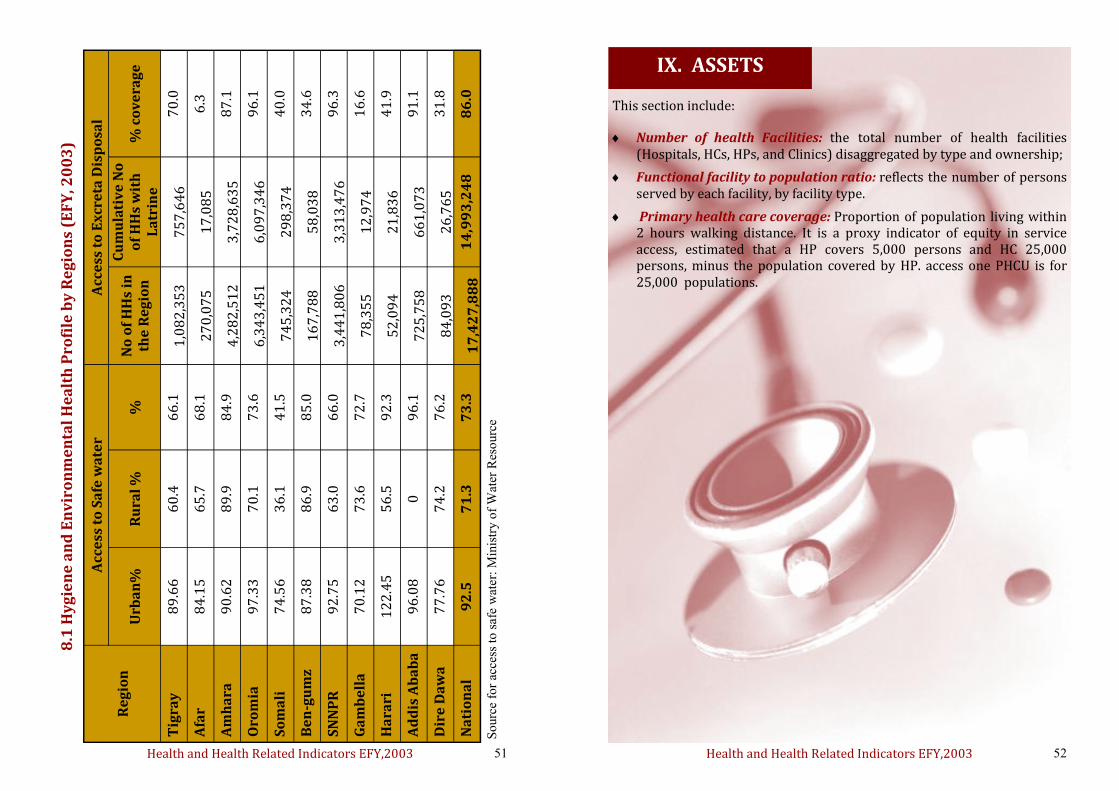
Health and Health Related Indicators EFY,2003 51
8.1
Hy
gie
ne
an
d E
nv
iro
nm
en
tal
He
alt
h P
rofi
le b
y R
eg
ion
s (E
FY
, 20
03
)
Re
gio
n
Acc
ess
to
Sa
fe w
ate
r A
cce
ss t
o E
xcr
eta
Dis
po
sal
Urb
an
%
Ru
ral
%
%
No
of
HH
s in
th
e R
eg
ion
Cu
mu
lati
ve
No
o
f H
Hs
wit
h
La
trin
e
% c
ov
era
ge
Tig
ray
8
9.6
6
60
.4
66
.1
1,0
82
,35
3
75
7,6
46
7
0.0
Afa
r 8
4.1
5
65
.7
68
.1
2
70
,07
5
17
,08
5
6.3
Am
ha
ra
90
.62
8
9.9
8
4.9
4
,28
2,5
12
3
,72
8,6
35
8
7.1
Oro
mia
9
7.3
3
70
.1
73
.6
6,3
43
,45
1
6,0
97
,34
6
96
.1
So
ma
li
74
.56
3
6.1
4
1.5
74
5,3
24
2
98
,37
4
40
.0
Be
n-g
um
z 8
7.3
8
86
.9
85
.0
1
67
,78
8
58
,03
8
34
.6
SN
NP
R
92
.75
6
3.0
6
6.0
3
,44
1,8
06
3
,31
3,4
76
9
6.3
Ga
mb
ell
a
70
.12
7
3.6
7
2.7
7
8,3
55
1
2,9
74
1
6.6
Ha
rari
1
22
.45
5
6.5
9
2.3
5
2,0
94
2
1,8
36
4
1.9
Ad
dis
Ab
ab
a
96
.08
0
9
6.1
72
5,7
58
6
61
,07
3
91
.1
Dir
e D
aw
a
77
.76
7
4.2
7
6.2
8
4,0
93
2
6,7
65
3
1.8
Na
tio
na
l 9
2.5
7
1.3
7
3.3
17
,42
7,8
88
1
4,9
93
,24
8
86
.0
So
urc
e fo
r ac
cess
to
safe
wat
er:
Min
istr
y o
f W
ater
Res
ourc
e
Health and Health Related Indicators EFY,2003 52
IX. ASSETS
This section include:
Number of health Facilities: the total number of health facilities (Hospitals, HCs, HPs, and Clinics) disaggregated by type and ownership;
Functional facility to population ratio: reflects the number of persons served by each facility, by facility type.
Primary health care coverage: Proportion of population living within 2 hours walking distance. It is a proxy indicator of equity in service access, estimated that a HP covers 5,000 persons and HC 25,000 persons, minus the population covered by HP. access one PHCU is for 25,000 populations.
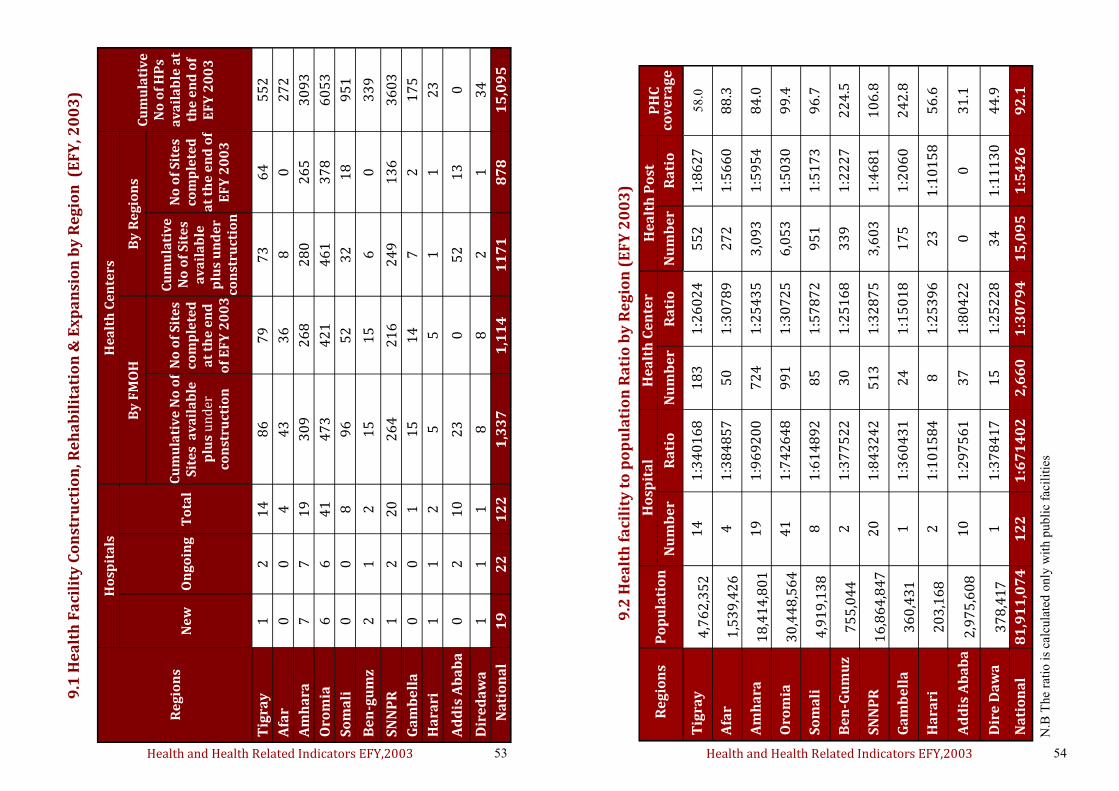
Health and Health Related Indicators EFY,2003 53
9.1
He
alt
h F
aci
lity
Co
nst
ruct
ion
, Re
ha
bil
ita
tio
n &
Ex
pa
nsi
on
by
Re
gio
n (
EF
Y, 2
00
3)
Re
gio
ns
Ho
spit
als
H
ea
lth
Ce
nte
rs
Cu
mu
lati
ve
N
o o
f H
Ps
av
ail
ab
le a
t th
e e
nd
of
E
FY
20
03
Ne
w
On
go
ing
T
ota
l
By
FM
OH
B
y R
eg
ion
s
Cu
mu
lati
ve
No
of
Sit
es
av
ail
ab
le
plu
s u
nd
er
con
stru
ctio
n
No
of
Sit
es
com
ple
ted
a
t th
e e
nd
o
f E
FY
20
03
Cu
mu
lati
ve
N
o o
f S
ite
s a
va
ila
ble
p
lus
un
de
r co
nst
ruct
ion
No
of
Sit
es
com
ple
ted
a
t th
e e
nd
of
EF
Y 2
00
3
Tig
ray
1
2
1
4
86
7
9
73
6
4
55
2
Afa
r 0
0
4
4
3
36
8
0
2
72
Am
ha
ra
7
7
19
3
09
2
68
2
80
2
65
3
09
3
Oro
mia
6
6
4
1
47
3
42
1
46
1
37
8
60
53
So
ma
li
0
0
8
96
5
2
32
1
8
95
1
Be
n-g
um
z 2
1
2
1
5
15
6
0
3
39
SN
NP
R
1
2
20
2
64
2
16
2
49
1
36
3
60
3
Ga
mb
ell
a
0
0
1
15
1
4
7
2
17
5
Ha
rari
1
1
2
5
5
1
1
2
3
Ad
dis
Ab
ab
a
0
2
10
2
3
0
52
1
3
0
Dir
ed
aw
a
1
1
1
8
8
2
1
34
Na
tio
na
l 1
9
22
1
22
1
,33
7
1,1
14
1
17
1
87
8
15
,09
5
Health and Health Related Indicators EFY,2003 54
9.2
He
alt
h f
aci
lity
to
po
pu
lati
on
Ra
tio
by
Re
gio
n (
EF
Y 2
00
3)
Re
gio
ns
Po
pu
lati
on
H
osp
ita
l H
ea
lth
Ce
nte
r H
ea
lth
Po
st
PH
C
co
ve
rag
e
Nu
mb
er
Ra
tio
N
um
be
r R
ati
o
Nu
mb
er
Ra
tio
Tig
ray
4,7
62
,35
2
14
1
:34
01
68
1
83
1
:26
02
4
55
2
1:8
62
7
58
.0
Afa
r
1,5
39
,42
6
4
1:3
84
85
7
50
1
:30
78
9
27
2
1:5
66
0
88
.3
Am
ha
ra
1
8,4
14
,80
1
19
1
:96
92
00
7
24
1
:25
43
5
3,0
93
1
:59
54
8
4.0
Oro
mia
30
,44
8,5
64
4
1
1:7
42
64
8
99
1
1:3
07
25
6
,05
3
1:5
03
0
99
.4
So
ma
li
4
,91
9,1
38
8
1
:61
48
92
8
5
1:5
78
72
9
51
1
:51
73
9
6.7
Be
n-G
um
uz
7
55
,04
4
2
1:3
77
52
2
30
1
:25
16
8
33
9
1:2
22
7
22
4.5
SN
NP
R
1
6,8
64
,84
7
20
1
:84
32
42
5
13
1
:32
87
5
3,6
03
1
:46
81
1
06
.8
Ga
mb
ell
a
3
60
,43
1
1
1:3
60
43
1
24
1
:15
01
8
17
5
1:2
06
0
24
2.8
Ha
rari
20
3,1
68
2
1
:10
15
84
8
1
:25
39
6
23
1
:10
15
8
56
.6
Ad
dis
Ab
ab
a
2
,97
5,6
08
1
0
1:2
97
56
1
37
1
:80
42
2
0
0
31
.1
Dir
e D
aw
a
3
78
,41
7
1
1:3
78
41
7
15
1
:25
22
8
34
1
:11
13
0
44
.9
Na
tio
na
l 8
1,9
11
,07
4
12
2
1:6
71
40
2
2,6
60
1
:30
79
4
15
,09
5
1:5
42
6
92
.1
N.B
The
rati
o i
s ca
lcula
ted
only
wit
h p
ub
lic
facil
itie
s
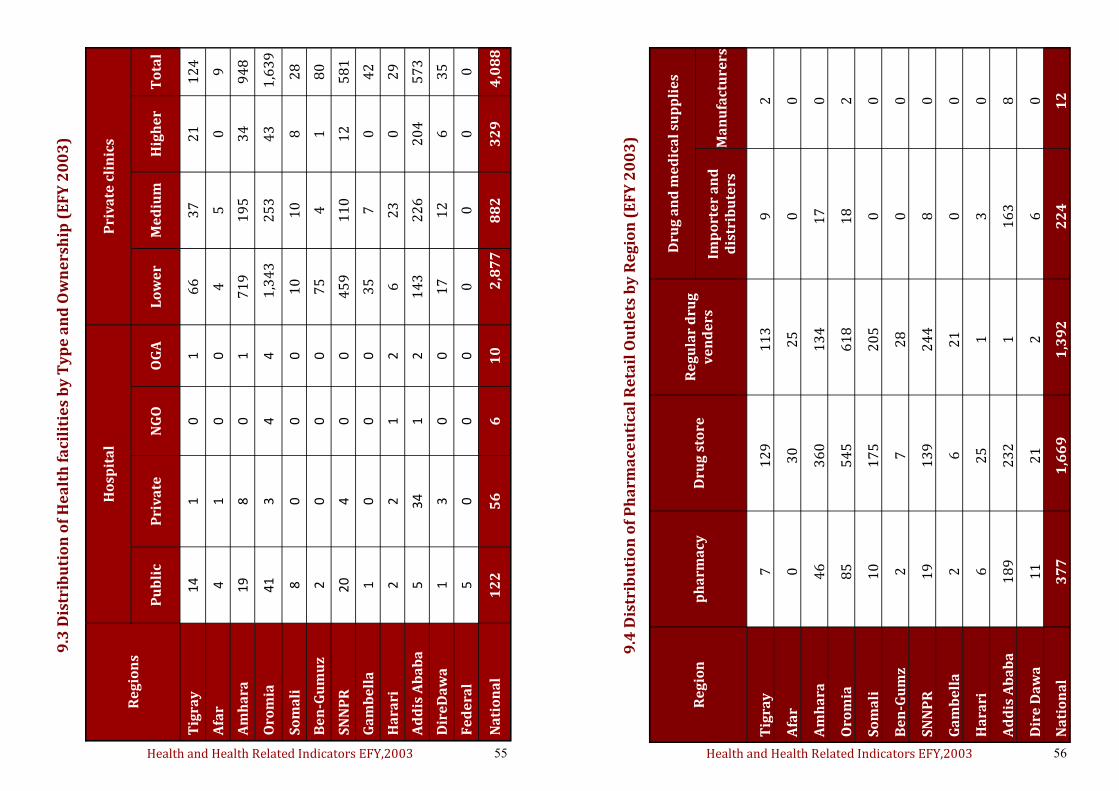
Health and Health Related Indicators EFY,2003 55
9.3
Dis
trib
uti
on
of
He
alt
h f
aci
liti
es
by
Ty
pe
an
d O
wn
ers
hip
(E
FY
20
03
)
Re
gio
ns
Ho
spit
al
Pri
va
te c
lin
ics
Pu
bli
c P
riv
ate
N
GO
O
GA
L
ow
er
Me
diu
m
Hig
he
r T
ota
l
Tig
ray
1
4
1
0
1 6
6
37
2
1
12
4
Afa
r 4
1
0
0
4
5
0
9
Am
ha
ra
19
8
0
1
71
9
19
5
34
9
48
Oro
mia
4
1
3
4
4
1,3
43
2
53
4
3
1,6
39
So
ma
li
8
0
0
0 1
0
10
8
2
8
Be
n-G
um
uz
2
0
0
0 7
5
4
1
80
SN
NP
R
20
4
0
0
45
9
11
0
12
5
81
Ga
mb
ell
a
1
0
0
0 3
5
7
0
42
Ha
rari
2
2
1
2
6
23
0
2
9
Ad
dis
Ab
ab
a
5
34
1
2
14
3
22
6
20
4
57
3
Dir
eD
aw
a
1
3
0
0 1
7
12
6
3
5
Fe
de
ral
5
0
0
0 0
0
0
0
Na
tio
na
l
12
2
56
6
1
0
2
,87
7
88
2
32
9
4,0
88
Health and Health Related Indicators EFY,2003 56
9.4
Dis
trib
uti
on
of
Ph
arm
ace
uti
cal
Re
tail
Ou
tle
ts b
y R
eg
ion
(E
FY
20
03
)
Re
gio
n
ph
arm
acy
D
rug
sto
re
Re
gu
lar
dru
g
v
en
de
rs
Dru
g a
nd
me
dic
al
sup
pli
es
Imp
ort
er
an
d
d
istr
ibu
ters
M
an
ufa
ctu
rers
Tig
ray
7
1
29
1
13
9
2
Afa
r 0
3
0
25
0
0
Am
ha
ra
46
3
60
1
34
1
7
0
Oro
mia
8
5
54
5
61
8
18
2
So
ma
li
10
1
75
2
05
0
0
Be
n-G
um
z 2
7
2
8
0
0
SN
NP
R
19
1
39
2
44
8
0
Ga
mb
ell
a
2
6
21
0
0
Ha
rari
6
2
5
1
3
0
Ad
dis
Ab
ab
a
18
9
23
2
1
16
3
8
Dir
e D
aw
a
11
2
1
2
6
0
Na
tio
na
l 3
77
1
,66
9
1,3
92
2
24
1
2
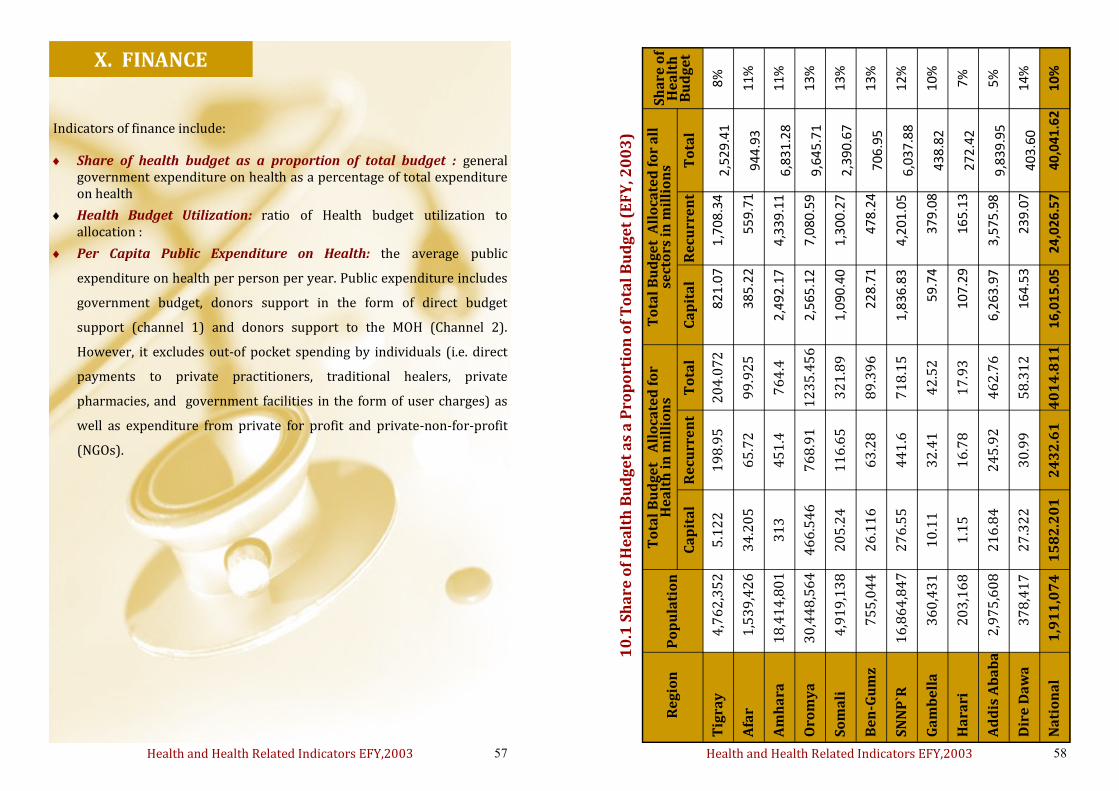
Health and Health Related Indicators EFY,2003 57
X. FINANCE
Indicators of finance include:
Share of health budget as a proportion of total budget : general government expenditure on health as a percentage of total expenditure on health
Health Budget Utilization: ratio of Health budget utilization to allocation :
Per Capita Public Expenditure on Health: the average public
expenditure on health per person per year. Public expenditure includes
government budget, donors support in the form of direct budget
support (channel 1) and donors support to the MOH (Channel 2).
However, it excludes out-of pocket spending by individuals (i.e. direct
payments to private practitioners, traditional healers, private
pharmacies, and government facilities in the form of user charges) as
well as expenditure from private for profit and private-non-for-profit
(NGOs).
Health and Health Related Indicators EFY,2003 58
10
.1 S
ha
re o
f H
ea
lth
Bu
dg
et
as
a P
rop
ort
ion
of
To
tal
Bu
dg
et
(EF
Y, 2
00
3)
Re
gio
n
Po
pu
lati
on
To
tal
Bu
dg
et
All
oca
ted
fo
r H
ea
lth
in
mil
lio
ns
T
ota
l B
ud
ge
t A
llo
cate
d f
or
all
sect
ors
in
mil
lio
ns
S
ha
re o
f H
ea
lth
B
ud
ge
t
Ca
pit
al
Re
curr
en
t
To
tal
C
ap
ita
l R
ecu
rre
nt
To
tal
Tig
ray
4,7
62
,35
2
5.1
22
1
98
.95
2
04
.07
2
8
21
.07
1,7
08
.34
2
,52
9.4
1
8%
Afa
r
1,5
39
,42
6
34
.20
5
65
.72
9
9.9
25
38
5.2
2
55
9.7
1
9
44
.93
1
1%
Am
ha
ra
18
,41
4,8
01
3
13
4
51
.4
76
4.4
2
,49
2.1
7
4
,33
9.1
1
6,8
31
.28
1
1%
Oro
my
a
30
,44
8,5
64
4
66
.54
6
76
8.9
1
12
35
.45
6
2
,56
5.1
2
7
,08
0.5
9
9,6
45
.71
1
3%
So
ma
li
4
,91
9,1
38
2
05
.24
1
16
.65
3
21
.89
1
,09
0.4
0
1
,30
0.2
7
2,3
90
.67
1
3%
Be
n-G
um
z
7
55
,04
4
26
.11
6
63
.28
8
9.3
96
22
8.7
1
47
8.2
4
7
06
.95
1
3%
SN
NP
`R
16
,86
4,8
47
2
76
.55
4
41
.6
71
8.1
5
1,8
36
.83
4,2
01
.05
6
,03
7.8
8
12
%
Ga
mb
ell
a
36
0,4
31
1
0.1
1
32
.41
4
2.5
2
59
.74
3
79
.08
43
8.8
2
10
%
Ha
rari
2
03
,16
8
1.1
5
16
.78
1
7.9
3
1
07
.29
1
65
.13
27
2.4
2
7%
Ad
dis
Ab
ab
a
2,9
75
,60
8
21
6.8
4
24
5.9
2
46
2.7
6
6,2
63
.97
3,5
75
.98
9
,83
9.9
5
5%
Dir
e D
aw
a
37
8,4
17
2
7.3
22
3
0.9
9
58
.31
2
1
64
.53
2
39
.07
40
3.6
0
14
%
Na
tio
na
l 1
,91
1,0
74
1
58
2.2
01
2
43
2.6
1
40
14
.81
1
1
6,0
15
.05
2
4,0
26
.57
40
,04
1.6
2
10
%
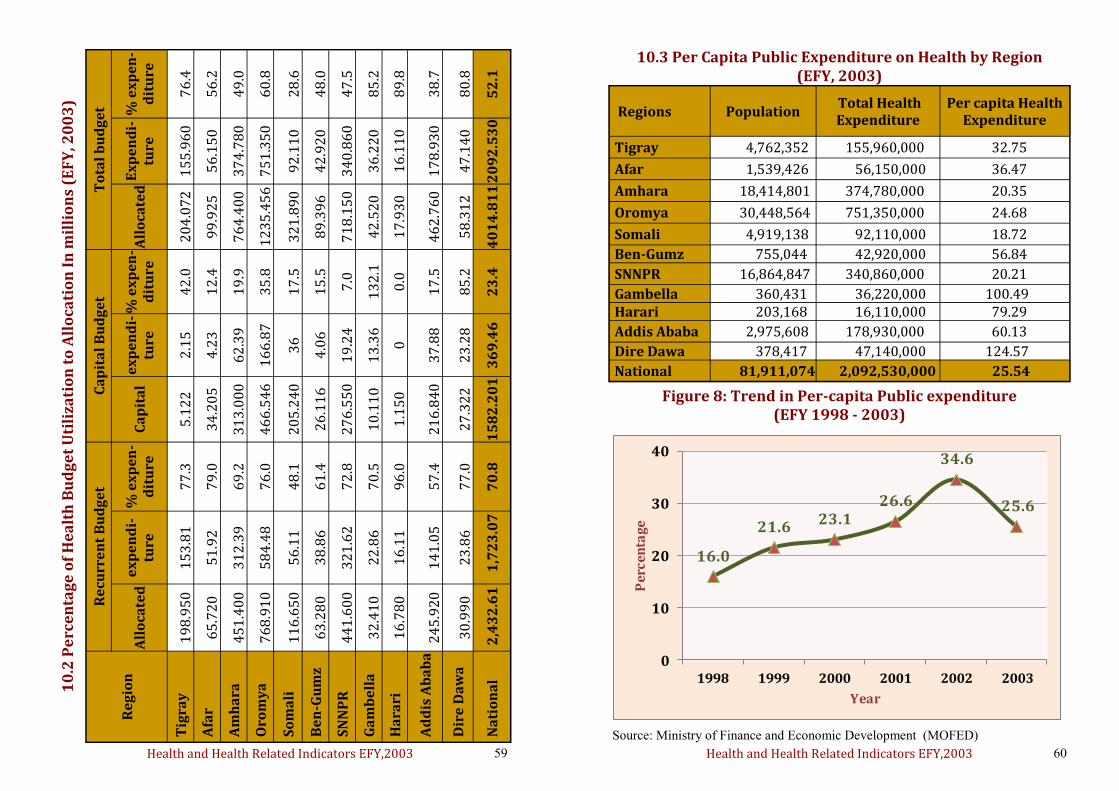
Health and Health Related Indicators EFY,2003 59
10
.2 P
erc
en
tag
e o
f H
ea
lth
Bu
dg
et
Uti
liza
tio
n t
o A
llo
cati
on
In
mil
lio
ns
(EF
Y, 2
00
3)
Re
gio
n
Re
curr
en
t B
ud
ge
t C
ap
ita
l B
ud
ge
t
To
tal
bu
dg
et
All
oca
ted
e
xp
en
di-
ture
%
ex
pe
n-
dit
ure
C
ap
ita
l e
xp
en
di-
ture
%
ex
pe
n-
dit
ure
A
llo
cate
d E
xp
en
di-
ture
%
ex
pe
n-
dit
ure
Tig
ray
1
98
.95
0
15
3.8
1
77
.3
5.1
22
2
.15
4
2.0
2
04
.07
2
15
5.9
60
7
6.4
Afa
r 6
5.7
20
5
1.9
2
79
.0
34
.20
5
4.2
3
12
.4
99
.92
5
56
.15
0
56
.2
Am
ha
ra
45
1.4
00
3
12
.39
6
9.2
3
13
.00
0
62
.39
1
9.9
7
64
.40
0
37
4.7
80
4
9.0
Oro
my
a
76
8.9
10
5
84
.48
7
6.0
4
66
.54
6
16
6.8
7
35
.8
12
35
.45
6
75
1.3
50
6
0.8
So
ma
li
11
6.6
50
5
6.1
1
48
.1
20
5.2
40
3
6
17
.5
32
1.8
90
9
2.1
10
2
8.6
Be
n-G
um
z 6
3.2
80
3
8.8
6
61
.4
26
.11
6
4.0
6
15
.5
89
.39
6
42
.92
0
48
.0
SN
NP
R
44
1.6
00
3
21
.62
7
2.8
2
76
.55
0
19
.24
7
.0
71
8.1
50
3
40
.86
0
47
.5
Ga
mb
ell
a
32
.41
0
22
.86
7
0.5
1
0.1
10
1
3.3
6
13
2.1
4
2.5
20
3
6.2
20
8
5.2
Ha
rari
1
6.7
80
1
6.1
1
96
.0
1.1
50
0
0
.0
17
.93
0
16
.11
0
89
.8
Ad
dis
Ab
ab
a
24
5.9
20
1
41
.05
5
7.4
2
16
.84
0
37
.88
1
7.5
4
62
.76
0
17
8.9
30
3
8.7
Dir
e D
aw
a
30
.99
0
23
.86
7
7.0
2
7.3
22
2
3.2
8
85
.2
58
.31
2
47
.14
0
80
.8
Na
tio
na
l 2
,43
2.6
1
1,7
23
.07
7
0.8
1
58
2.2
01
3
69
.46
2
3.4
4
01
4.8
11
20
92
.53
0
52
.1
Health and Health Related Indicators EFY,2003 60
Figure 8: Trend in Per-capita Public expenditure (EFY 1998 - 2003)
10.3 Per Capita Public Expenditure on Health by Region (EFY, 2003)
Regions Population Total Health Expenditure
Per capita Health Expenditure
Tigray 4,762,352 155,960,000 32.75
Afar 1,539,426 56,150,000 36.47
Amhara 18,414,801 374,780,000 20.35
Oromya 30,448,564 751,350,000 24.68
Somali 4,919,138 92,110,000 18.72
Ben-Gumz 755,044 42,920,000 56.84
SNNPR 16,864,847 340,860,000 20.21
Gambella 360,431 36,220,000 100.49 Harari 203,168 16,110,000 79.29
Addis Ababa 2,975,608 178,930,000 60.13
Dire Dawa 378,417 47,140,000 124.57
National 81,911,074 2,092,530,000 25.54
16.0
21.6 23.126.6
34.6
25.6
0
10
20
30
40
1998 1999 2000 2001 2002 2003
Pe
rce
nta
ge
Year
Source: Ministry of Finance and Economic Development (MOFED)
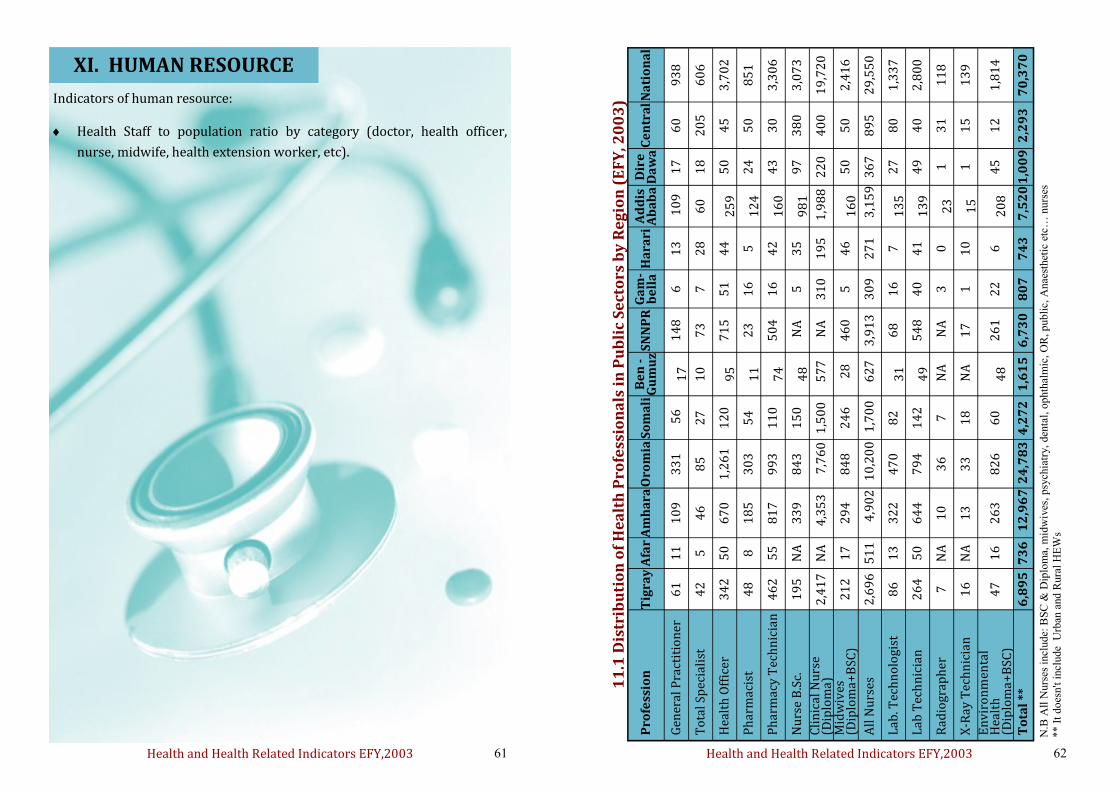
Health and Health Related Indicators EFY,2003 61
XI. HUMAN RESOURCE
Indicators of human resource:
Health Staff to population ratio by category (doctor, health officer,
nurse, midwife, health extension worker, etc).
Health and Health Related Indicators EFY,2003 62
11
.1 D
istr
ibu
tio
n o
f H
ea
lth
Pro
fess
ion
als
in
Pu
bli
c S
ect
ors
by
Re
gio
n (
EF
Y, 2
00
3)
Pro
fess
ion
T
igra
y A
far
Am
ha
ra O
rom
ia S
om
ali
B
en
-G
um
uz
SN
NP
R G
am
-b
ell
a H
ara
ri A
dd
is
Ab
ab
a D
ire
D
aw
a C
en
tra
l Na
tio
na
l
Gen
eral
Pra
ctit
ion
er
61
1
1
10
9
33
1
56
17
1
48
6
1
3
10
9
17
6
0
93
8
To
tal S
pec
iali
st
42
5
4
6
85
2
7
10
7
3
7
28
6
0
18
2
05
6
06
Hea
lth
Off
icer
3
42
5
0
67
0
1,2
61
1
20
9
5
71
5
51
4
4
25
9
50
4
5
3,7
02
Ph
arm
acis
t 4
8
8
18
5
30
3
54
1
1
23
1
6
5
12
4
24
5
0
85
1
Ph
arm
acy
Tec
hn
icia
n
46
2
55
8
17
9
93
1
10
7
4
50
4
16
4
2
16
0
43
3
0
3,3
06
Nu
rse
B.S
c.
19
5
NA
3
39
8
43
1
50
4
8
NA
5
3
5
98
1
97
3
80
3
,07
3
Cli
nic
al N
urs
e (D
iplo
ma)
2
,41
7
NA
4
,35
3
7
,76
0
1,5
00
5
77
N
A
31
0
19
5
1,9
88
2
20
4
00
1
9,7
20
Mid
wiv
es
(Dip
lom
a+B
SC)
21
2
17
2
94
8
48
2
46
2
8
46
0
5
46
1
60
5
0
50
2
,41
6
All
Nu
rses
2
,69
6
51
1
4
,90
2
10
,20
0
1,7
00
62
7
3,9
13
3
09
2
71
3,1
59
3
67
8
95
2
9,5
50
Lab
. Tec
hn
olo
gist
8
6
13
3
22
4
70
8
2
31
6
8
16
7
1
35
2
7
80
1
,33
7
Lab
Tec
hn
icia
n
26
4
50
6
44
7
94
1
42
4
9
54
8
40
4
1
13
9
49
4
0
2,8
00
Rad
iogr
aph
er
7
NA
1
0
36
7
N
A
NA
3
0
23
1
3
1
11
8
X-R
ay T
ech
nic
ian
1
6
NA
1
3
33
1
8
NA
1
7
1
10
15
1
1
5
13
9
En
vir
on
men
tal
Hea
lth
(D
iplo
ma+
BSC
) 4
7
16
2
63
8
26
6
0
48
2
61
22
6
2
08
4
5
12
1
,81
4
To
tal
**
6,8
95
7
36
1
2,9
67
24
,78
3 4
,27
2
1,6
15
6
,73
0
80
7
74
3
7,5
20
1,0
09
2
,29
3
70
,37
0
N.B
All
Nurs
es i
ncl
ude:
BS
C &
Dip
lom
a, m
idw
ives
, p
sych
iatr
y,
den
tal,
op
hth
alm
ic, O
R, p
ub
lic,
Anae
sthet
ic e
tc…
nurs
es
** I
t do
esn't i
ncl
ude
Urb
an a
nd R
ura
l H
EW
s
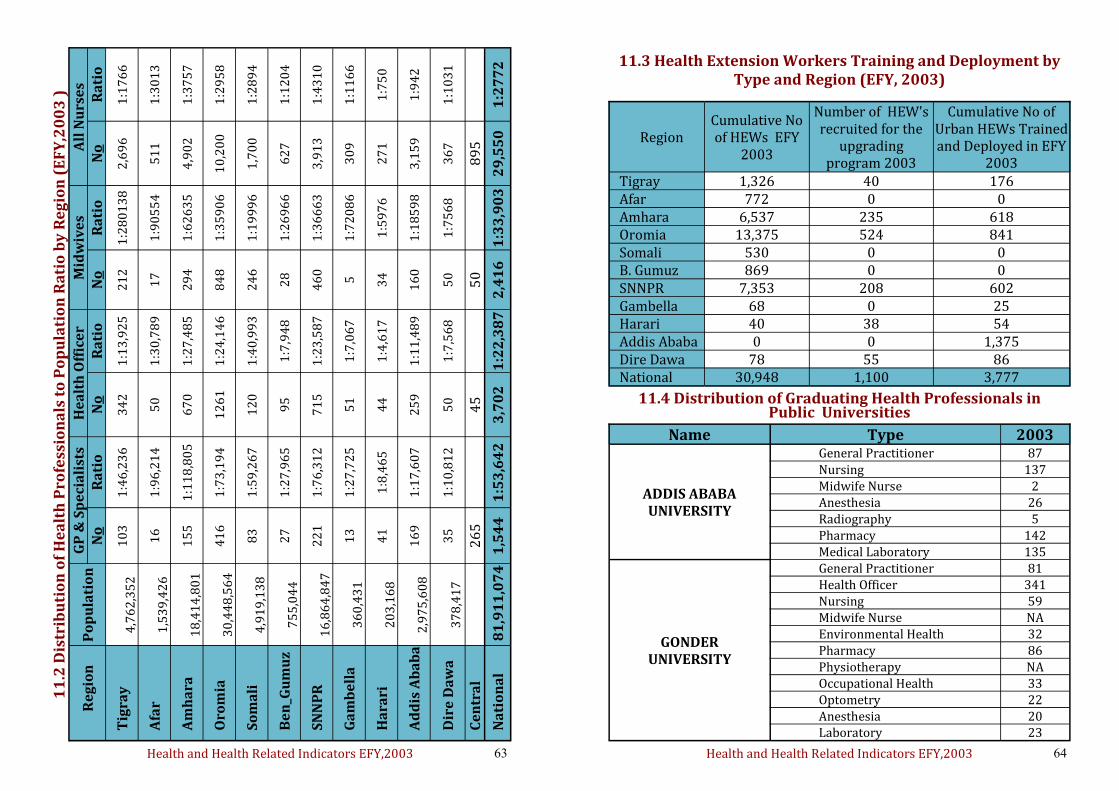
Health and Health Related Indicators EFY,2003 63
11
.2 D
istr
ibu
tio
n o
f H
ea
lth
Pro
fess
ion
als
to
Po
pu
lati
on
Ra
tio
by
Re
gio
n (
EF
Y,2
00
3 )
Re
gio
n
Po
pu
lati
on
G
P &
Sp
eci
ali
sts
He
alt
h O
ffic
er
Mid
wiv
es
A
ll N
urs
es
No
R
ati
o
No
R
ati
o
No
R
ati
o
No
R
ati
o
Tig
ray
4,7
62
,35
2
10
3
1:4
6,2
36
3
42
1
:13
,92
5
21
2
1:2
80
13
8
2,6
96
1
:17
66
Afa
r
1,5
39
,42
6
16
1
:96
,21
4
50
1
:30
,78
9
17
1
:90
55
4
51
1
1:3
01
3
Am
ha
ra
18
,41
4,8
01
1
55
1
:11
8,8
05
6
70
1
:27
,48
5
29
4
1:6
26
35
4
,90
2
1:3
75
7
Oro
mia
3
0,4
48
,56
4
41
6
1:7
3,1
94
1
26
1
1:2
4,1
46
8
48
1
:35
90
6
10
,20
0
1:2
95
8
So
ma
li
4
,91
9,1
38
8
3
1:5
9,2
67
1
20
1
:40
,99
3
24
6
1:1
99
96
1
,70
0
1:2
89
4
Be
n_G
um
uz
75
5,0
44
2
7
1:2
7,9
65
9
5
1:7
,94
8
28
1
:26
96
6
62
7
1:1
20
4
SN
NP
R
16
,86
4,8
47
2
21
1
:76
,31
2
71
5
1:2
3,5
87
4
60
1
:36
66
3
3,9
13
1
:43
10
Ga
mb
ell
a
36
0,4
31
1
3
1:2
7,7
25
5
1
1:7
,06
7
5
1:7
20
86
3
09
1
:11
66
Ha
rari
2
03
,16
8
41
1
:8,4
65
4
4
1:4
,61
7
34
1
:59
76
2
71
1
:75
0
Ad
dis
Ab
ab
a
2
,97
5,6
08
1
69
1
:17
,60
7
25
9
1:1
1,4
89
1
60
1
:18
59
8
3,1
59
1
:94
2
Dir
e D
aw
a
37
8,4
17
3
5
1:1
0,8
12
5
0
1:7
,56
8
50
1
:75
68
3
67
1
:10
31
Ce
ntr
al
2
65
45
50
89
5
Na
tio
na
l 8
1,9
11
,07
4
1,5
44
1
:53
,64
2
3,7
02
1
:22
,38
7
2,4
16
1
:33
,90
3
29
,55
0
1:2
77
2
Health and Health Related Indicators EFY,2003 64
11.3 Health Extension Workers Training and Deployment by Type and Region (EFY, 2003)
Region Cumulative No of HEWs EFY
2003
Number of HEW's recruited for the
upgrading program 2003
Cumulative No of Urban HEWs Trained and Deployed in EFY
2003 Tigray 1,326 40 176 Afar 772 0 0 Amhara 6,537 235 618 Oromia 13,375 524 841 Somali 530 0 0 B. Gumuz 869 0 0 SNNPR 7,353 208 602 Gambella 68 0 25 Harari 40 38 54 Addis Ababa 0 0 1,375 Dire Dawa 78 55 86 National 30,948 1,100 3,777
11.4 Distribution of Graduating Health Professionals in Public Universities
Name Type 2003
ADDIS ABABA UNIVERSITY
General Practitioner 87
Nursing 137 Midwife Nurse 2 Anesthesia 26 Radiography 5 Pharmacy 142 Medical Laboratory 135
GONDER UNIVERSITY
General Practitioner 81 Health Officer 341 Nursing 59 Midwife Nurse NA Environmental Health 32 Pharmacy 86 Physiotherapy NA Occupational Health 33 Optometry 22 Anesthesia 20 Laboratory 23
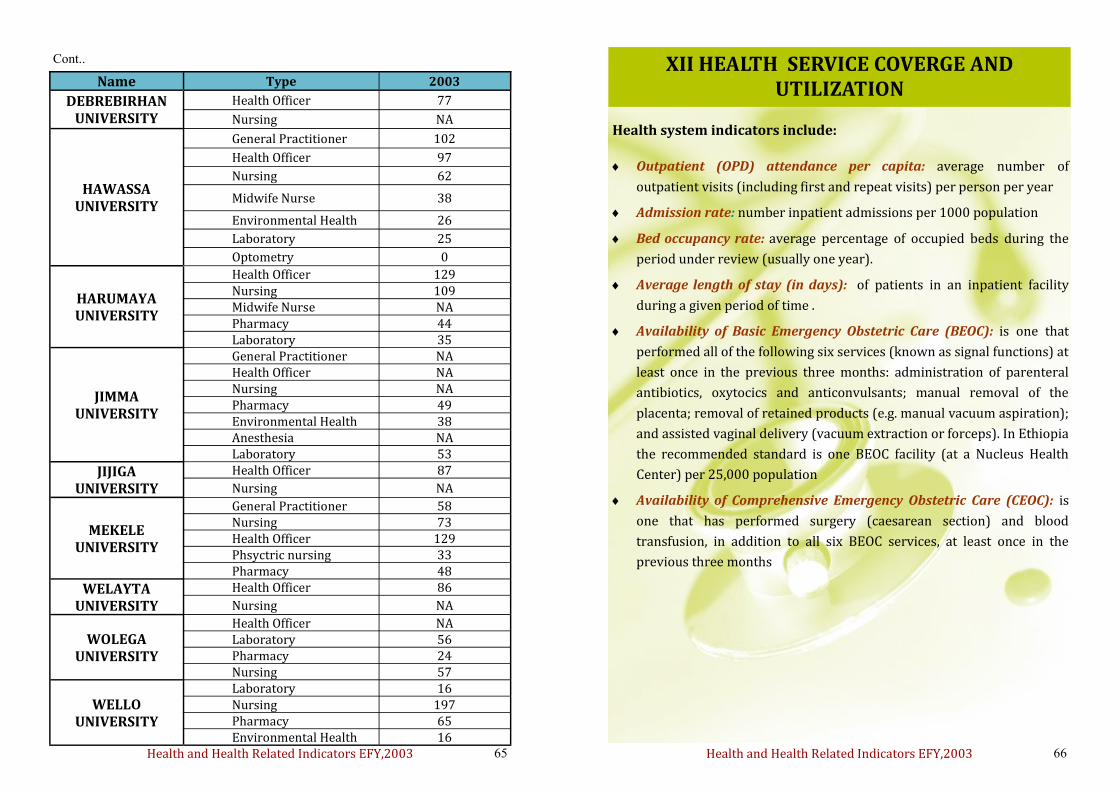
Health and Health Related Indicators EFY,2003 65
Name Type 2003
DEBREBIRHAN UNIVERSITY
Health Officer 77
Nursing NA
HAWASSA UNIVERSITY
General Practitioner 102
Health Officer 97
Nursing 62
Midwife Nurse 38
Environmental Health 26
Laboratory 25
Optometry 0
HARUMAYA UNIVERSITY
Health Officer 129 Nursing 109 Midwife Nurse NA Pharmacy 44 Laboratory 35
JIMMA UNIVERSITY
General Practitioner NA Health Officer NA Nursing NA Pharmacy 49 Environmental Health 38 Anesthesia NA Laboratory 53
JIJIGA UNIVERSITY
Health Officer 87
Nursing NA
MEKELE UNIVERSITY
General Practitioner 58 Nursing 73 Health Officer 129 Phsyctric nursing 33 Pharmacy 48
WELAYTA UNIVERSITY
Health Officer 86
Nursing NA
WOLEGA UNIVERSITY
Health Officer NA Laboratory 56 Pharmacy 24 Nursing 57
WELLO UNIVERSITY
Laboratory 16 Nursing 197 Pharmacy 65 Environmental Health 16
Cont..
Health and Health Related Indicators EFY,2003 66
Health system indicators include:
Outpatient (OPD) attendance per capita: average number of
outpatient visits (including first and repeat visits) per person per year
Admission rate: number inpatient admissions per 1000 population
Bed occupancy rate: average percentage of occupied beds during the
period under review (usually one year).
Average length of stay (in days): of patients in an inpatient facility
during a given period of time .
Availability of Basic Emergency Obstetric Care (BEOC): is one that
performed all of the following six services (known as signal functions) at
least once in the previous three months: administration of parenteral
antibiotics, oxytocics and anticonvulsants; manual removal of the
placenta; removal of retained products (e.g. manual vacuum aspiration);
and assisted vaginal delivery (vacuum extraction or forceps). In Ethiopia
the recommended standard is one BEOC facility (at a Nucleus Health
Center) per 25,000 population
Availability of Comprehensive Emergency Obstetric Care (CEOC): is
one that has performed surgery (caesarean section) and blood
transfusion, in addition to all six BEOC services, at least once in the
previous three months
XII HEALTH SERVICE COVERGE AND UTILIZATION
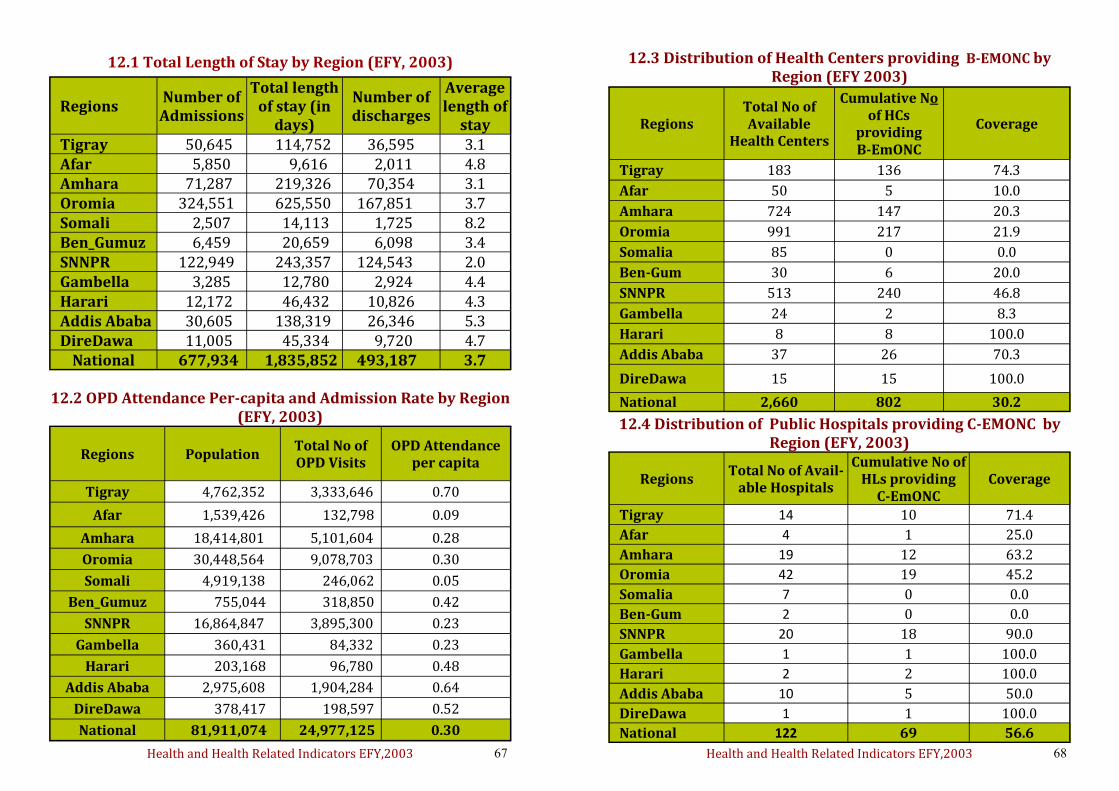
Health and Health Related Indicators EFY,2003 67
12.1 Total Length of Stay by Region (EFY, 2003)
Regions Number of Admissions
Total length of stay (in
days)
Number of discharges
Average length of
stay Tigray 50,645 114,752 36,595 3.1 Afar 5,850 9,616 2,011 4.8 Amhara 71,287 219,326 70,354 3.1 Oromia 324,551 625,550 167,851 3.7 Somali 2,507 14,113 1,725 8.2 Ben_Gumuz 6,459 20,659 6,098 3.4 SNNPR 122,949 243,357 124,543 2.0 Gambella 3,285 12,780 2,924 4.4 Harari 12,172 46,432 10,826 4.3 Addis Ababa 30,605 138,319 26,346 5.3 DireDawa 11,005 45,334 9,720 4.7
National 677,934 1,835,852 493,187 3.7
12.2 OPD Attendance Per-capita and Admission Rate by Region (EFY, 2003)
Regions Population Total No of OPD Visits
OPD Attendance per capita
Tigray 4,762,352 3,333,646 0.70
Afar 1,539,426 132,798 0.09
Amhara 18,414,801 5,101,604 0.28
Oromia 30,448,564 9,078,703 0.30
Somali 4,919,138 246,062 0.05
Ben_Gumuz 755,044 318,850 0.42
SNNPR 16,864,847 3,895,300 0.23
Gambella 360,431 84,332 0.23
Harari 203,168 96,780 0.48
Addis Ababa 2,975,608 1,904,284 0.64
DireDawa 378,417 198,597 0.52
National 81,911,074 24,977,125 0.30
Health and Health Related Indicators EFY,2003 68
12.3 Distribution of Health Centers providing B-EMONC by Region (EFY 2003)
Regions Total No of Available
Health Centers
Cumulative No of HCs
providing B-EmONC
Coverage
Tigray 183 136 74.3
Afar 50 5 10.0
Amhara 724 147 20.3
Oromia 991 217 21.9
Somalia 85 0 0.0
Ben-Gum 30 6 20.0
SNNPR 513 240 46.8
Gambella 24 2 8.3
Harari 8 8 100.0
Addis Ababa 37 26 70.3
DireDawa 15 15 100.0
National 2,660 802 30.2
12.4 Distribution of Public Hospitals providing C-EMONC by Region (EFY, 2003)
Regions Total No of Avail-
able Hospitals
Cumulative No of HLs providing
C-EmONC Coverage
Tigray 14 10 71.4
Afar 4 1 25.0
Amhara 19 12 63.2
Oromia 42 19 45.2
Somalia 7 0 0.0
Ben-Gum 2 0 0.0
SNNPR 20 18 90.0
Gambella 1 1 100.0
Harari 2 2 100.0
Addis Ababa 10 5 50.0
DireDawa 1 1 100.0
National 122 69 56.6
Health and Health Related Indicators EFY,2003 69
Admission
Formal acceptance, by a health facility, of a patient who is to receive
medical or paramedical care while occupying a health facility bed.
Healthy babies born in hospital should not be counted if they do not re-
quire special care.
Age dependency ratio
The ratio of persons in the “dependent” ages (under 15 and older than 64
years) to those in the “economically productive” ages (15-64 years) in a
population.
Antenatal Care coverage
Percentage of women who utilized antenatal care provided by skilled
birth attendance for reasons related to pregnancy at least once during
pregnancy as a percentage of live births in a given time period.
Average household size
The mean number of members per household
Child mortality
The probability of dying between exact age one and the fifth birth day
per 1000 children surviving to the first birth day.
Contraceptive Accepters rate
The proportion of women of reproductive age (15-49 years) who are not
pregnant and who are accepting a modern contraceptive method
(new and repeat acceptors).
Crude birth rate
The registered number of live births for every 1000 population in a given
year or period of time. Disaggregated by gender.
Crude death rate
The registered number of deaths for every 1000 population in a given
year or period of time. Disaggregated by gender.
Glossary
Health and Health Related Indicators EFY,2003 70
Dependency ratio
The ratio of persons in the ‘dependent’ age groups (under 15 years plus
65 years and above) to those in the ‘economically productive’ age group
(15-64 years), expressed as a percentage.
Demography
The study of population and its characteristics, with reference to such
factors as size, age structure, density, fertility, mortality, growth and
social and economic variables.
Drug store
It is an establishment which offers medical preparations, cosmetics
nursing and sanitary articles, dietetic products and other articles as
approved for the purpose by the Ministry for sale to the public. but does
not engage in the compounding preparation or manufacture of any
medical preparation.
Fully immunized
Surviving infants who receive all doses of infant antigens. The Infant An-
tigens are: BCG, Pentavalent (DPT-HepB, Hib), doses 1 -3; OPV, doses
1—3; and Measles.
General fertility rate
The number of births occurring in a given year per 1000 women in the
reproductive ages (i.e. women aged 15-49).
Health center
It is an establishment which provides both preventive and curative
services. It comprises five satellite health posts and is expected to serve
for 25,000 people.
Health post
One of the satellite facility in the Primary health care unit which serves
for 5,000 people (1 per Kebele).
Health and Health Related Indicators EFY,2003 71
Higher clinic
Staffed at least by a general medical practitioner, a specialist and assisted
by various specialists serve for general outpatient clinics. For emergency
and delivery this clinic has up to 5 beds.
Hospital
An establishment that provides general medical care round the clock. It
is at least equipped with basic laboratory, X-ray and basic treatment fa-
cilities.
District /first level referral Hospital: serves for 250,000 people Regional Hospital: serves for 1 million people Specialized Hospital: serves for 5 million people
Household
A single person living alone or a group voluntarily living together, having
common house keeping arrangements for supplying basic living needs,
such as principal meals. The group may consist of related or unrelated
persons.
Infant mortality rate
The number of registered deaths among infants (below one year of age)
per 1000 live births in a given year or period of time.
In-patient
A person admitted to a health care facility and who usually occupies a
bed in that health care facility.
Leading causes of morbidity The most frequently occurring causes of morbidity (usually 10) among
inpatients for which the greatest number of cases have been reported
during a given year.
Leading causes of mortality
The most frequently occurring causes of mortality (usually 10) under
which the greatest number of deaths have been reported during a given
year. Causes of mortality are all those diseases, morbid conditions, or
injuries which either resulted in or contributed to death, and the circum-
stances of the accident or violence that produced any such injuries.
Health and Health Related Indicators EFY,2003 72
Life Expectancy at Birth
The average number of years a newborn baby is expected to live if mor-
tality patterns at the time of its birth were to prevail throughout the
child’s life.
Live birth
The complete expulsion or extraction from its mother of conception, irre-
spective of the duration of pregnancy, which after such separation shows
any evidence of life.
Lower clinic
Staffed at least by a health assistant or a nurse and serve for general out-
patient clinic.
Maternal mortality rate
The number of registered deaths among women, from any cause related
to or aggravated by pregnancy or its management (excluding accidental
or incidental causes) during pregnancy, childbirth or within 42 days of
termination of pregnancy, irrespective of the duration or site of the preg-
nancy, for every 100 000 live births in a given year or period of time.
Medium Clinic
Staffed at least by health officer or general medical practitioner & serve
for general medical services.
Morbidity
The extent of illness, injury or disability in a population.
Out-patient
A person who goes to a health care facility for consultation, is not admit-
ted to the facility and does not occupy a hospital bed for any length of
time.
Paramedical staff
Health care assistants, laboratory technicians, technologists, therapists,
nutritionists, sanitarians, among others, who are actually working in the
country and are graduates of 2- to 5-year health courses in recognized
health training institutions.
Health and Health Related Indicators EFY,2003 73
Pharmacy
Any store, shop or other place in which medicinal preparation are
compounded or prepared and dispensed or sold to the public.
Population
All the inhabitants of a given country or area considered together.
Estimates are based on a recent census, official national data or United
Nations projections. Presented in thousands or actual value.
Postnatal visits
Women attended, at least once during postpartum (42 days after
delivery), by health professional including HEW’s for reasons relating to
post partum.
Potential health service coverage
The population covered in percentage based on the existing health
centres and health posts in catchments' area.
Rate of National Increase
A measure of population growth (in the absence of migration)
comprising addition of newborn infants to the population and subtrac-
tion of deaths. Expressed as a percentage per annum. This rate, which
specifically excludes changes resulting from migration, is equal to the
difference between the crude birth rate and the crude death rate.
Rural.
Those working rural areas or in areas outside cities and metropolitan
areas generally regarded as underdeveloped in terms of infrastructure
and specialized services
Rural drug vendor
The lowest level of medicinal retail outlet that dispenses medical
preparations as approved for this level by the Ministry, but does not en-
gage in compounding preparation or manufacturing of any medical
preparation.
Sex ratio
The number of males in a population or specific sub-population, divided
by corresponding number of females, conventionally multiplied by 100.
Health and Health Related Indicators EFY,2003 74
Skilled Birth Attendant
An accredited health professional such as midwife, doctor or nurse who
has been trained in the skills needed to manage normal (uncomplicated)
pregnancies, child birth and the immediate postnatal period and in the
identification, management and referral of complications in women and
newborn. (exclude TTBA and HEWs)
Surviving infants
Infants who survive to their first birth day
Special clinic
Provides specific medical interventions such as medical, surgical,
obstetric gynaecology , ophthalmology, etc. and is assisted by specialists
in various disciplines.
Total fertility rate
The average number of children that would be born per woman of all
women lived to end of their childbearing years and born children ac-
cording to a given set of age specific fertility rates.
Urban
Those working in urban areas or in planned metropolitan communities
in developed areas designed to be self-sufficient, with their own housing,
education, commerce and recreation.
Under-five mortality rate
The probability (expressed as a rate per 1000 live births) of a child born
in a specified year dying before reaching the age of five if subject to
current age-specific mortality rates.
Vital events Births, deaths, marriages and divorces