Embed Size (px)
Citation preview
Supervisor: Kristian Bolin Master Degree Project No. 2014:67 Graduate School
Master Degree Project in Economics
Health Care Systems in Sweden, France and Italy A comparison of three European countries
Katarina Gerefalk
2
Abstract
This thesis describes three European countries with different types of health care
systems, one Beveridge type system, Sweden, one Bismarck type system, France and one
system that changed from being a Bismarck system to a Beveridge system in the end of
the 1970’s, Italy. The purpose is to, though the comparison of statistics and literature see
how the government decisions about the health care system and the state of the health
care system is affecting the health outcomes in each country. There are characteristics
that are specific to either the Beveridge or Bismarck systems and France and Sweden
display the characteristics of their respective system as a general rule. Italy cannot be
clearly placed in one category only through the comparison of statistics, the
characteristics are mixed and display both good and bad parts typical for both Beveridge
and Bismarck.

3
Table of Contents
Health care systems in Sweden, France and Italy ................................................... 1
Abstract ................................................................................................................................. 2
1. Introduction .................................................................................................................... 6
2. Method .............................................................................................................................. 7
3. Literature review .......................................................................................................... 8
3.1 Bismarck and Beveridge type health care systems ................................................. 8 3.2 Public provision of a private good .............................................................................. 11 3.3 Political economy and health care provision .......................................................... 13 3.4 Health care expenditure ................................................................................................ 15 3.5 Decentralisation of the heath care system ............................................................... 17
4. Comparison of the health systems ....................................................................... 19 4.1 Health care expenditures .............................................................................................. 22 4.2 Hospitals and patients .................................................................................................... 23 4.3 Physicians ........................................................................................................................... 24 4.4 Population composition ................................................................................................. 24 4.5 Life expectancy .................................................................................................................. 24 4.6 Healthy life years .............................................................................................................. 25 4.7 Self-‐perceived health ....................................................................................................... 26 4.8 Morbidity ............................................................................................................................. 27 4.9 Infant and maternal health ........................................................................................... 28 4.10 Patient satisfaction ........................................................................................................ 29
5 Discussion ...................................................................................................................... 30
5.1 Health care expenditures .............................................................................................. 30 5.2 Satisfaction, waiting lists and patient choice .......................................................... 32 5.3 Health status ...................................................................................................................... 33
6. Conclusion .................................................................................................................... 36
References ......................................................................................................................... 38
Appendix 1. Sweden ....................................................................................................... 46
A.1.1 The health care system ............................................................................................... 46 A.1.1.1 Regional structure ................................................................................................................. 48 A.1.1.2 Primary care ............................................................................................................................. 49

4
A.1.1.3 Hospital care ............................................................................................................................ 50 A.1.1.4 Patients ....................................................................................................................................... 51
A.1.2 Health care system in numbers ............................................................................... 53 A.1.2.1 Health care expenditure ...................................................................................................... 53 A.1.2.2 Hospitals and patients ......................................................................................................... 54 A.1.2.3 Physicians .................................................................................................................................. 55 A.1.2.4 Population composition ...................................................................................................... 56 A.1.2.5 Life expectancy ....................................................................................................................... 57 A.1.2.6 Healthy life years ................................................................................................................... 58 A.1.2.7 Self-‐perceived health ............................................................................................................ 59 A.1.2.8 Morbidity ................................................................................................................................... 59 A.1.2.9 Infant and maternal health ................................................................................................ 61 A.1.2.10 Patient satisfaction ............................................................................................................. 62
Appendix 2. France ......................................................................................................... 64
A.2.1 The system ...................................................................................................................... 64 A.2.1.1 Regional structure ................................................................................................................. 65 A.2.1.2 The Social Health Insurance .............................................................................................. 65 A.2.1.3 Primary care ............................................................................................................................. 67 A.2.1.4 Hospital care ............................................................................................................................ 68 A.2.1.5 HAD .............................................................................................................................................. 69 A.2.1.6 Evaluation of quality ............................................................................................................. 70 A.2.1.7 Patients ....................................................................................................................................... 71
A.2.2 Health care system in numbers ............................................................................... 71 A.2.2.1 Health care expenditure ...................................................................................................... 71 A.2.2.2 Hospitals and patients ......................................................................................................... 73 A.2.2.3 Physicians .................................................................................................................................. 74 A.2.2.4 Population composition ...................................................................................................... 75 A.2.2.5 Life expectancy ....................................................................................................................... 76 A.2.2.6 Healthy life years ................................................................................................................... 77 A.2.2.7 Self-‐perceived health ............................................................................................................ 78 A.2.2.8 Morbidity ................................................................................................................................... 78 A.2.2.9 Infant and maternal health ................................................................................................ 81 A.2.2.10 Patient satisfaction ............................................................................................................. 81
Appendix 3. Italy ............................................................................................................. 83
A.3.1 The health care system ............................................................................................... 83

5
A.3.1.1 Regional structure ................................................................................................................. 85 A.3.1.2 Primary care ............................................................................................................................. 86 A.3.1.3 Hospital care ............................................................................................................................ 87 A.3.1.4 Decentralisation ..................................................................................................................... 88 A.3.1.5 North -‐ South ............................................................................................................................ 89 A.3.1.6 Patients ....................................................................................................................................... 90
A.3.2 Health care system in numbers ............................................................................... 91 A.3.2.1 Health care expenditure ...................................................................................................... 91 A.3.2.2 Hospitals and patients ......................................................................................................... 92 A.3.2.3 Physicians .................................................................................................................................. 93 A.3.2.4 Population composition ...................................................................................................... 94 A.3.2.5 Life expectancy ....................................................................................................................... 95 A.3.2.6 Healthy life years ................................................................................................................... 96 A.3.2.7 Self-‐perceived health ............................................................................................................ 97 A.3.2.8 Morbidity ................................................................................................................................... 98 A.3.2.9 Infant and maternal health ............................................................................................. 100 A.3.2.10 Patient satisfaction .......................................................................................................... 101
Appendix 4 -‐ Tables ...................................................................................................... 102
Table A.1. Health care expenditures .......................................................................................... 102 Table A.2 Hospitals and patients ................................................................................................. 104 Table A.3 Physicians ......................................................................................................................... 105 Table A.4 Population composition .............................................................................................. 107 Table A.5 Life expectancy ............................................................................................................... 108 Table A.6 Healthy life years ........................................................................................................... 110 Table A.7 Self-‐perceived health ................................................................................................... 111 Table A.8 Morbidity ........................................................................................................................... 113 Table A.9 Infant and maternal health ........................................................................................ 117 Table A.10 Patient satisfaction ..................................................................................................... 119
6
1. Introduction
There are two main types of health care system, either Beveridge or Bismarck type
system. The Beveridge system and is based on a National Health Service, NHS, that
provides health care at no, or very small costs to the population. Financing generally
comes from the general taxation. The Bismarck system however, is based on a Social
Health Insurance, SHI. This system entails compulsory participation in the social health
insurance, which is then used to finance the health care system. Contributions to the
insurance are levied on labour income, and since participation is mandatory it appears to
be a tax (Zweifel et al., 2009). In both systems health care expenditures correspond to a
large share of the government expenditures (HFA-DB, 2013), and it has increased
substantially as a share of GDP since the 1960’s and the technological developments are
only adding to the costs (Cutler, 2002).
Sweden, Italy and France all have as a goal to have equal access and quality of care and
the populations (Anell et al., 2012, Lo Scalo et al., 2009 and Chevreul et al. 2010,
respectively) in the entirety of the populations are covered by health insurance (OECD,
2011). There are differences as to the structure of the health care systems that are mainly
falling into the category of Bismarck or Beveridge type systems, but also differences
within Beveridge and Bismarck type systems, that may require adaption of the policies to
counteract the main problems associated with each type of system (Or et al., 2010).
The purpose of the thesis is to see how government decisions regarding spending on
health care and the state of the health care system affect the health outcomes of the
population in three European countries, namely Italy, France and Sweden. In order to do
this statistics are examined and compared on expenditures, the state of the health care
system and on health outcomes. The statistics pertaining to the health care expenditures
will be related to GDP or per capita, and in some cases absolute numbers will be
presented for illustrative purposes. For the state of the health care system statistics will
be presented on e.g. physician density, hospitals and hospital beds per 100 000
population. As for the health status, statistics will be presented on e.g. life expectancy,
healthy life expectancy, self perceived health, morbidity etc.
After a description of the health care system in each country the statistics will be
compared to the other countries, within the countries and to the literature presented in
7
the literature review. This will illustrate that Sweden and France will appear to largely fall
into the expected behaviour of their respective type of system, while Italy will have
mixed results, which may be caused by a change of system in the late 1970’s, and some
characteristics, similar to France, the Bismarck system, appear to have survived the
change, such as the structure of the primary care, where there in Italy as in France is a
tradition of having single practices among general practitioners, GPs. There are also
typical Bismarck problems that Italy is facing such as cost containment. Further there are
similarities as well, e.g. the regional differences in quality and accessibility to health care.
The structure of the rest of the thesis will be as follows: the method used will be
presented in section 2, a general literature review will be presented in section 3, a
presentation and comparison of the health care systems will be done in section 4
discussion will be done in section 5 and section 6 concludes. In appendices 1 – 3 there
are more detailed descriptions of the health care systems as well as a more thorough
presentation of the statistics, and in appendix 4 the additional statistics are presented in
tables.
2. Method
This will be a descriptive study, using a quantitative method and statistics mainly from
the European Health For All Database, which is managed by the World Health
Organisation Regional Office For Europe, Eurostat and OECD. The statistics presented
speaks to the health care expenditures, the state of the health care system or the health
status of the respective populations. Statistics on population composition are also
included. Sweden, France and Italy were selected among the European countries,
because France is generally considered to be a Bismarck type system, Sweden is
considered to be a Beveridge type system and Italy has gone from being a Bismarck type
system to being a Beveridge type system. Further they are geographically distributed
from north to south, and France and Italy are large economies in the European union,
while Sweden in contrast is a relatively small one.
There is one source for each country that has been used extensively in the description of
the health care system, and those are the Health Care Systems in Transition Reports.
8
These reports are done for the European Observatory on Health Systems and Policies,
which is a partnership between the World Health Organisation Regional Office for
Europe, the European Commission, the European Investment Bank, the World Bank,
the French National Union of Health Insurance Funds, UNCAM, the London School of
Economics and Political Science, the London School of Hygiene and Tropical Medicine,
and the governments of (in alphabetical order) Belgium, Finland, Ireland, the
Netherlands, Norway, Slovenia, Spain, Sweden and the Veneto Region in Italy. These
three reports have been used considerably, since they provide detailed and plentiful
information on the health care systems.
In the production of health outcomes medical care is, albeit only one, input (see e.g.
Grossman, 1982). Following economic production theory, it is then expected that an
increase in the input will lead to an increase of output, i.e. that an increase in physician
density, hospital density and/or health care expenditures etc. in this case should lead to
better health outcomes in the populations. This thesis investigates if this relationship is
present in health care in Sweden, France and Italy.
In the discussion the statistics for each country will be compared to the statistics of other
countries, as well as within the countries, and connected to the literature presented in the
literature review. In the appendices there are parts of the literature that does not directly
compare to the statistics, but provide background information to make the
interpretation, understanding and the putting into context of the statistics easier.
3. Literature review
3.1 Bismarck and Beveridge type health care systems
The Bismarck system is based on a Social Health Insurance, SHI, and was founded in
Germany by the politician Otto von Bismarck. This system entails compulsory
participation in the social health insurance, which is then used to finance the health care
system. Contributions to the insurance are levied on labour income, and since
participation is mandatory it appears to be a tax. These contributions are, unlike private
insurance, not based on risk level or current health, but rather on income level or a

9
simple flat rate (Zweifel et al., 2009). The defining strength of the Bismarck system is the
level of patient choice, which is now being restricted by public intervention designed to
constrain choice among and/or access to health care providers. An example is the
introduction of optional gate keeping, as has been done in France and Germany. These
interventions are done primarily to deal with one of the largest problems of the Bismarck
system, namely cost containment (Or, et al., 2010).
The Beveridge system was founded in the UK by the politician William Beveridge, and is
based on a National Health Service, NHS, that provides health care at no, or very small
costs to the population. Financing generally comes from the general taxation (Zweifel et
al., 2009). In general, the main problems in this system are limited choice and long
waiting lists before receiving treatment and policy interventions are mainly directed to
deal with these problems. Strengths on the other hand are that costs are being contained,
while providing universal coverage and in general manage to avoid having providers and
insurers engage in risk selection and cost shifting (Or, et al., 2010).
Ebola (1996) observed using data from 1992 that patient satisfaction was higher in
Bismarck systems compared to in Beveridge systems. Further he noted that, as also
noted above, that Beveridge systems are better at cost containment and are overall
cheaper than Bismarck systems. Upon these observations Ebola (1996) stated that there
is a trade off between the Bismarckian patient satisfaction and the Beveridgian efficiency.
The policy trends described above for the systems could, according to Or et al. (2010),
on one hand suggest that Bismarck and Beveridge systems are converging, their
differences becoming less and less significant, as they are trying to correct their
respective weaknesses (see also Ebola, 1996). On the other hand it could simply describe
peripheral changes to the systems, leaving the core differences between them unchanged.
When comparing data from five countries, (England, Denmark and Sweden, Beveridge,
France and Germany, Bismarck) they find that there are systematic differences in
performance regarding certain areas. Beveridge systems are better at cost containment, as
stated above, where Bismarck systems have trouble. When it comes to the accessibility,
as assessed by patients, the Beveridge systems are performing poorly, and the Bismarck
systems are performing well. However, closer examination of why these differences
appear demands that structural features are taken into account and here there are
10
differences also within the respective systems. These differences in the structure of the
system, e.g. how many insurance funds there are and who are managing them in
Bismarck system, or how physicians are paid, by salary or per consultation, for a
Beveridge system, will have a large effect on if and to what extent implemented reforms
will succeed. For example, the efforts made to reduce waiting times in the Beveridge
systems have had different effect in the three countries examined. In both Denmark and
England the waiting times have been reduced, whereas in Sweden, it remains a major
problem. The reasons for this, as pointed out by the authors, could be that physicians are
not paid per appointment, but on a salary basis, as well as limited supply capacities. This
leads Or et al. (2010) to conclude that in doing health reforms, there needs to be
adaption to the specific features of the structure of the health care system in the country,
not only to copy a general Beveridge or Bismarck system solution.
Figueras et al. (2004) found when examining a large range of indicators that no clear
difference could be seen in the performance of a Bismarck and Beveridge system, but
that results depend on what indicators are examined. Regarding patent satisfaction, they
found a higher satisfaction among patients in the Bismarck systems, as did Ebola (1996)
and van der Zee and Kroneman (2007). In the light of this Figueras et al. (2004, p.133)
ask the question, regarding the Bismarck systems: “whether the apparent additional
satisfaction is justified by the additional money and resources spent, despite the fact that
not much more health is obtained”. However, van der Zee and Kroneman (2007)
criticises the study for including too many indicators and argue that this causes the lack
of results.
Van der Zee and Kroneman (2007) found small differences in health outcome
performance, when examining data on 17 western European countries from the 1980’s
to the beginning of the 2000’s. They found that mortality rates, life expectancy at birth
and infant mortality were all better under a Bismarck system, even though the differences
were small and the outcome for infant mortality were converging, which was the only
sign of convergence fund. Further, that costs were consistently lower in Beveridge
systems, and patients in Bismarck systems were more satisfied, as noted above.
Regarding the reasons for patients in a Bismarck system to be more satisfied than those
in a Beveridge system has been argued to be caused by higher accessibility to secondary

11
care in Bismarck systems, which in Beveridge systems are hampered by e.g. the existence
of gatekeeping (Kroneman et al., 2006, Chu-Weininger & Balkrishnan, 2006) and
problems with waiting lists (Kroneman et al., 2006, Figueras et al, 2004).
A trade off will arise when looking at purely market based systems and fully socially
funded systems, where the market based systems suffer from risk selection and the
socially funded systems will have difficulties regarding cost control. Therefore mixed
reimbursement systems have been introduced, where e.g. prospective financing, or
elements of it, has been introduced in the socially funded system (Schokkaert, Dhaene, &
Van De Voorde, 1998).
If providers are given prospective payments for services provided, this will result in
efficient production of health services, since any part of that remaining will go to the
provider, and this will e.g. keep administration at an optimal level as well as avoiding
induced demand. However, if providers are given a constant payment for a homogenous
population, or part of a population, this will result in the providers having incentives for
risk selection. There is thus a trade off between risk selection and efficiently providing
health care (Newhouse, 1996).
3.2 Public provision of a private good
When it comes to literature on the public provision of private goods, such as health care,
there are two approaches in literature, according to Blomquist and Christiansen (1999).
On the one hand there are normative theories showing public provision of private goods
to be beneficial to efficiency through welfare analysis. On the other hand there are voting
models where certain groups in society have the possibility to vote in a manner as to
redistribute resources to themselves and thus causing inefficiencies (see Epple and
Romano, 1996). There should not necessarily be a conflict between wanting efficiency as
well as pleasing the voters, in order to be re-elected. Because having private goods
publically provided will make it easier to achieve Pareto optimality, thus making such
provision desirable for everyone, including policy makers (Blomquist & Christiansen,
1999).
Having private goods, health care, publically provided has been argued to correct market
failures, such as information asymmetry. In providing public health care it is possible to
12
relax the selection constraint, in a setting where the policymakers have imperfect
information. It has also been shown that, if lower income is associated with higher health
risks, redistribution can be enhanced by the existence of a social insurance. In the case of
health care being solely publicly provided there will be redistribution from those who are
relatively healthy to those who are relatively unhealthy, regardless of the medical
treatments either group receive. Aggregated health in this case can either be higher or
lower than in the setting compared to having a purely private provision of health care
(Leach, 2010).
In theory, giving the population the possibility of buying private health insurance, in
addition to the public care provided, must be welfare increasing for society. Basically, the
ones opting for having an additional, private health insurance must be better off, without
this option affecting the welfare of the ones not having an additional insurance, whose
welfare should be unchanged (Leach, 2010). However, according to Leach (2010), the
existence of opting for additional insurance will affect the redistribution, which will be
brought closer to that of a system with a pure private provision of health care. In this
case, ex post social welfare will not be maximised. Thus there are only two outcomes of
having additional private insurance are that either nobody will opt for additional
insurance, or the social ex post welfare will decrease.
Theoretically, public provision of health care should be provided in the case of market
failures and when those market failures are less costly to correct using public intervention
compared to implementing a market based solution (Arentz et al. 2012). If this is not the
case, the market should provide health care. Then insurance premiums would be based
on risk, in lack of other regulation. This in turn raises the question of equality in the
health care system, and what kind of system the society will accept. If there is a risk
based insurance premium, the unhealthy part of the population will have to pay more,
and might not be socially acceptable, especially if high risk is associated with low income
(Zweifel & Breuer, 2006). Having other market solutions than risk based would lead to
risk selection, or cream skimming, thus calling for public intervention (Eekhoff et al.,
2006, Schokkaert et al., 1998). Public intervention, however, would lead to insurance
markets working inefficiently. For example, having uniform contributions to the health
insurance would result in efficiency loss and also possibly hamper redistribution. Having
open enrolment would force additional regulation since with it enables self-selection of
13
risk. It is the additional regulation in case that is causing the main part of the inefficiency.
The solution offered is to combine premiums based on individual risk and a tax aimed at
redistribution, making the government responsible for the redistribution, instead if the
insurers. This would then limit the amount the individual can be charged for insurance,
without extensive effect to health care budget (Zweifel & Breuer, 2006).
Generally, in developed countries the health care systems have a basic nation of
providing equal access to all its citizens, and have in the past focused more on equality
than on efficiency. Equity was placed over effectiveness, in the classical trade off. This
became a problem when the costs for the government started to rise, as a matter of
illustration: the share of the GDP spent on health care has generally doubled since the
1960’s. The first step taken as to slow the increase in health care expenditures down was
to regulate and set a limit to the costs of medical care, policies which were having their
main effect during the 1970’s and 1980’s. However, not actively tightening of these
regulations, in combination with technological developments increasing costs has lead to
a discontent with these restrictive regulations, and shifted focus to incentive based
regulation, market solutions and competition (Cutler, 2002).
Reforms of the health care systems are slow, which is the case in most countries. The
avoidance of making changes to rapidly to the system is one of the main reasons. Also,
concerns about loosing equity is one of the obstacles, in many countries equal access
have been an important goal for a long time, and changing that mind frame is difficult.
Meanwhile, the costs of health care is becoming more expensive as technological
progress is made, making the decision in the equity – efficiency trade off even more
difficult (Cutler, 2002).
3.3 Political economy and health care provision
The health care provided by the government must be restricted, since without
restrictions what so ever, the national product in its entirety could be spent on health
care expenses in the near future, according to Breyer (1995). He goes on to specify that
the solution to this restriction will, in a democracy, be explicit rather than implicit and
done by institutional arrangements, which will cover care at all levels, even that affecting
fundamental survival chances. Further, in the more plausible case examined, there will be
the possibility of obtaining additional private insurance, which will result in a higher level

14
of total health care consumption, as well as a lower level of provision of public health
care covered by the social insurance. Since the wealthier part of the population will
consume the larger portion of private health care, this system will be less attractive to the
part of the population who are not able to afford the private health insurance. Which
system that will be implemented in a democracy will thus depend on the composition of
the population (Breyer, 1995). Gouveia (1997) finds that the income of the median voter
generally will be lower than the median income of the population, and therefore the
middle-income groups will benefit from having the public health care expanded, which
will not be beneficial to neither the rich not the poor.
When having proportional taxes, the households having an income below the median
income will prefer, and thus vote for, a positive tax, whereas households with an income
exceeding the mean will opt for a zero tax. Therefore, in a voting setting, a positive
proportional tax will be levied on the citizens only if the median voter has an income
below the mean (Epple & Romano, 1996) and again the outcome will depend on the
composition of the population, as in Breyer (1995).
Epple and Romano (1996) found that, disregarding market imperfections and instead
focusing on the role of the government in providing private goods, dual market
provision, i.e. that it is possible to consume both publically provided health care as well
as privately provided, is associated with higher expenditures than a pure market provision
of health care, thus implying that the combination of provision inefficient. However,
they find that, in spite of this, the combination government and private provision of
health care will be the preferred alternative of the population.
A tax based financing system will provide different incentives than an insurance
financing scheme with voluntary contributions. The taxes will in the minds of the
population not be specific contributions to the health care system, but only a tax going
into the general government budget, while the voluntary insurance contributions will be
connected also in the minds of the population to the health care system and thus the
contribution is welfare improving. Also, when voting, dead weight loss should be taken
into account by the voters (Gouveia, 1997).
15
When the health care system is financed based on income, there are two redistribution
effect, redistribution from the wealthy to the poor as well as redistribution from the
healthy to the sick. By applying a flat fee contribution for health care, the redistribution
from the wealthy to the poor would be eliminated and only the redistribution from the
healthy too the sick would remain. However, if there are higher health risks associated
with having a lower income, having the double distribution may lead to a higher total
welfare, compared to having the redistributions separated, in a purely theoretical sense
(see e.g. Blomqvist & Horn, 1984, Rochet, 1991, Cremer & Pestieau, 1996 and Petretto,
1999, Kifman, 2005). When also taking into account the democratic decision process,
under the assumption that information is incomplete, i.e. that the insurance markets are
incomplete and insurance can be bought to cover changes in health risk status due to
changes in one’s health, risk premiums. Further an assumption is made that in the
democracy with a public health insurance policy, the level of the public health insurance
is set by a majority vote (Usher, 1977, Breyer, 1995, Epple Romano, 1996 and Gouveia,
1997, Kifman, 2005). In this case, both the wealthy and the less wealthy citizens will opt
for an income based contribution to health insurance since it provides them with a cover
for changes in their health status risk classification, and the less wealthy are given access
to subsidised health care. There is thus no political support for the complete separation
of the two redistributions (Kifman, 2005).
3.4 Health care expenditure
Several indicators have been used to explain what are driving the health care
expenditures, such as, but not exclusively, income, demographical indicators, institutions
and technological developments (Martín et al., 2011). The characteristics of income is
one of the main reason for differences in health care expenditures across countries, more
specifically if health care is a necessity good or a luxury good in Europe, i.e. has an
income elasticity below or above one, respectively (Pammolli et al., 2012). It has also
been suggested by Hall and Jones (2007) that health care is a superior good, and that
health care expenditures will prolong life and thus there will be additional periods that
the individual will have utility from. In this case, diverting funds towards health care
expenditures is worthwhile, since additional years of life also entails additional years of
consumption, causing health care expenditures to grow along income (Pammolli et al.,
2012).
16
That health care takes the form of a luxury good was found to be the consensus during
the 1980’s and 1990’s, when looking at OECD countries (See e.g. Leu, 1986, Parkin et
al., 1987, Brown, 1987, Gerdtham et al., 1992). In the 1990’s the introduction of time
series and pane data analysis started to find results where the income elasticity was closer
to one, i.e. a normal good (See e.g. Cuyler, 1990, Hitiris & Posnett, 1992, Hitiris, 1997).
In the 2000’s negative income elasticity was found as well as results well over one (See
e.g. Crivelli et al., 2006, and Roberts, 2000, respectively). Income as a main driver behind
the health care expenditures is only identified in four of the articles reviewed, and in two
of them health care is a luxury good. One reason for negative income elasticity and
income elasticity close to zero can be that the analysis were carried out using data from
countries with a strong regionalisation and decentralisation to the regions, as is the case
of Crivelli et al. (2006) who found a negative income elasticity from looking at the Swiss
health care, and Di Matteo and Gianoni and Hitiris (2002) who found income elasticity
close to zero when looking at Canada and Italy, respectively (Martín et al., 2011).
In the model for unbalanced growth the notion is established that if health care services
are part of the non-progressive sectors, i.e. have lower productivity gains than other
sectors, which are progressive, then the health care sector will have rising relative prices
over time, and thus following increasing health care expenditures (Baumol, 1967,
Baumol, 1993). This would then cause health expenditures to increase faster than GDP,
which seems to be the case in Europe, although to varying degree between countries
(Pammolli et al., 2012).
Accounting for the price effect Pammolli et al. (2012) finds that health care is a luxury
good, which was first found by Newhouse (1977), and that apart from GDP, which was
the main explaining factor behind expenditures in Newhouse (1977), the level of health
care expenditure is affected by ageing of the population as well as the level of female
labour participation. These socio-demographic trends, together with improving quality of
care and technology will lead to increased problems to contain costs of the health care
system in its current form (Pammolli et al., 2012).
Regarding the effects of the population ageing, there have been differing results through
out the 1990’s. Examples given by Martín et al. (2011) are Blomquist and Carter (1997)
that found a positive impact from population ageing on the health expenditures, while
17
Getzen (1992) did not find such an effect, both comparing OECD countries. A more
specific result was given by Gerdtham (1993), who found that 13% of the increase in
Swedish health care expenditure was due to the increasing age of the population.
To instead focus on proximity to death was done by e.g. Zweifel et al. (1999), Seshamani
and Gray (2004a and 2004b) finding that proximity to death has an impact on health care
expenditure that is larger than that of actual ageing, using Swiss and English data,
respectively. Breyer and Felder (2006) and Werblow et al. (2007) also find that including
proximity to death in their regressions decreases the effect of ageing. Gornemann and
Zunzunegui (2002) state that, regardless of age, the increase to health care expenditures is
caused in the last four months to a year before death.
3.5 Decentralisation of the heath care system
There is not one prominent pattern when it comes to decentralisation, since
decentralisation can be done to different degrees, and control over different functions
can be handed to local governments rather than the national one. The economic reason
for decentralisation is to improve the efficiency of the delivering of health care services,
be it only a small bundle of services or the bulk of the services offered within the
countries health care system. It is also aimed at minimising waste of resources and to
better meet the demand of a more limited population (Mosca, 2007). Further
decentralisation is done in order to improve accessibility for the patients, as well as a
more evenly distribution of the services provided. It is also the intention that decision-
making will be improved, since local information can be taken into account (Giannoni &
Hitiris, 2002). However, in the case of a Bismarck system that already often has a
complex structure, due to several insurance funds that the government have limited
control over as well as the number of physicians practices, adding decentralisation to the
equation will not make the structure simpler (Mosca, 2007).
The decentralised system can also have negative effects on the distributions of services
and increase regional differences, since when responsibility is given to e.g. the regions,
and within those responsibilities decision making power is given, then, as is the goal,
strategy and redistribution of resources as to fit the needs of the population. However,
the decisions made in the regions may differ in e.g. the level to which they comply with
national policies, there may also be considerable differences in the resource allocation
18
and also the size of the budget. This effect stands in opposite to the goal of a Beveridge
system, where the National Health Service is tasked to provide care for all citizens,
regardless of where in the country they live. Decentralisation in this case can be counter
productive with respect to this goal, leaving the countries with significant differences
between regions as an additional problem to the cost containment issue, which is a
problem in most developed countries (Giannoni & Hitiris, 2002).
Regarding the effect of regional decentralisation on health care expenditures, Martín et al.
(2011) does not find a consensus in literature that decentralisation should have an
increasing effect on health care expenditures. E.g. Mosca (2007) finds that increased
decentralisation does affect the health care expenditures positively, i.e. that decentralised
systems spends more than centralised ones, and within these two categories Bismarck
systems still spends more than Beveridge systems. This study is done on data from a
sample of OECD countries. Looking at country specific studies, Costa-Font and Pons-
Novell (2007) finds a positive relationship between decentralisation and health care
expenditures in Spain, while Giannoni and Hitiris (2002) and Crivelli et al. (2006) does
not find this effect, when examining data from Italy and Canada, respectively.

19
4. Comparison of the health systems
The French health care system has, historically, been marked by having many actors both
in providing and the funding of health care. Today however, it is defined by Chevreul et
al. (2010) as a mix, a Bismarck system with Beveridge goals. It is also described as a
system where patient choice is extensive and the coverage of the benefit system is
generous.
In Italy, an employment based insurance system worked well during the period of rapid
economic growth after the Second World War, 1958-1963, when Italy was experiencing
full employment. However, in the mid 1970’s unemployment started to rise, this
prompted the giving of responsibility of the health care provision to the regions in 1974-
75 (Lo Scalo et al., 2009) and creation of the National Health Service, Serivizio Sanitario
Nazionale, SSN, in 1978, the latter bringing universal insurance coverage to the Italian
citizens (Lo Scalo et al., 2009 and Giannoni & Hitiris, 2002).
In Sweden, the health care system is socially responsible for providing the citizens with
access to good health care, and it has a public commitment to guarantee the health of the
population. The entire health care system is based on three basic principles, namely the
principles; of human dignity, of need and solidarity, and of cost effectiveness. These
principals entail that everyone have the same rights and deserves to be treated with
dignity, that the most needy have priority, and that costs in relation to effectiveness
should be considered when facing treatment options and this should be measured by
improvements to health and life quality (Anell et al., 2012).
Below the statistics of the individual countries will be compared to each other. There will
also be observations made on the within country characteristics. Further country specific
information can be found in appendices 1-3 and tables in appendix 4 are recognised by
an A in the denotation of the table.
20
Table 1. Inputs in the heal th care sys tem Total health expenditure as % of gross domestic product (GDP), WHO estimates 2000 2001 2002 2003 2004 2005 2006 2007 2008 2009 2010 2011 2012
France 10.08 10.22 10.56 10.94 11.04 11.16 11.1 11.08 11.02 11.74 11.68 11.64 ...
Italy 8.02 8.18 8.3 8.32 8.62 8.9 8.98 8.64 9 9.48 9.56 9.5 ...
Sweden 8.18 8.88 9.22 9.32 9.1 9.06 8.96 8.92 9.24 9.94 9.56 9.36 ...
Total health expenditure, PPP$ per capita 2000 2001 2002 2003 2004 2005 2006 2007 2008 2009 2010 2011 2012
France 2544.4 2716.6 2920.8 2954 3089.6 3253.9 3434.8 3600.1 3763.6 3961.7 4016.1 4117.9 ...
Italy 2028 2199.8 2206.8 2227.8 2340.3 2472.7 2683.8 2723.8 2967.3 3029.5 3018.5 3012 3071.1
Sweden 2286.4 2501.6 2701.8 2833.1 2953.2 2963.4 3190.6 3429.3 3655.8 3703 3716.6 3924.8 ...
Public sector health expenditure as % of total health expenditure 2000 2001 2002 2003 2004 2005 2006 2007 2008 2009 2010 2011 2012
France 79.4 79.4 79.7 77.8 77.7 77.7 77.2 77.3 76.8 77 76.9 76.8 ...
Italy 74.2 75.9 75.9 76.2 77.4 77.9 78.2 78.3 78.9 78.9 78.5 77.8 78.2
Sweden 84.9 81.1 81.4 82 81.4 81.2 81.1 81.4 81.5 81.5 81.5 81.6 ...
Hospitals per 100 000 2000 2001 2002 2003 2004 2005 2006 2007 2008 2009 2010 2011 2012
France 5.3 5.22 5.12 4.99 4.88 4.79 4.68 4.59 4.49 4.4 4.18 4.14 ...
Italy 2.32 2.29 2.25 2.22 2.23 2.21 2.18 2.14 2.1 2.06 2.03 1.95 ...
Sweden 1 0.87 0.9 0.9 ... ... ... ... ... ... ... ... ...
Acute (short-stay) hospitals per 100 000 2000 2001 2002 2003 2004 2005 2006 2007 2008 2009 2010 2011 2012
France 3.69 3.65 3.6 3.5 3.42 3.37 3.28 3.22 3.14 3.07 2.92 2.88 ...
Italy 2.02 2.01 1.99 1.92 1.9 1.92 1.9 1.91 1.83 1.8 1.78 1.69 ...
Sweden 0.9 0.85 0.86 0.87 ... ... ... ... ... ... ... ... ...
Hospital beds per 100000 2000 2001 2002 2003 2004 2005 2006 2007 2008 2009 2010 2011 2012
France 5.3 5.22 5.12 4.99 4.88 4.79 4.68 4.59 4.49 4.4 4.18 4.14 ...
Italy 2.32 2.29 2.25 2.22 2.23 2.21 2.18 2.14 2.1 2.06 2.03 1.95 ... Sweden 1 0.87 0.9 0.9 ... ... ... ... ... ... ... ... ...
Acute care hospital beds per 100000 2000 2001 2002 2003 2004 2005 2006 2007 2008 2009 2010 2011 2012
France 419.07 408.71 403.25 393 385.59 380.62 373.2 369.03 363.23 359.76 346.38 342.92 ...
Italy 407.01 396.37 376.77 351.16 333.1 330.86 323.29 312.7 302.09 292.23 287.16 275.14 ...
Sweden 247.58 234.45 228.33 223.09 222.63 218.33 212.01 211.14 207.01 203.73 202.03 201.16 ...
Physicians per 100000 2000 2001 2002 2003 2004 2005 2006 2007 2008 2009 2010 2011 2012
France ... ... ... ... ... ... ... ... ... ... ... 307.03 318.23
Italy ... ... ... ... ... ... ... ... ... 367.54 ... 409.85 ...
Sweden ... ... ... ... ... 351* 360* 368* 374* 380* 386* ... ...
General practitioners physical persons per 100000 2000 2001 2002 2003 2004 2005 2006 2007 2008 2009 2010 2011 2012
France 166.71 168.02 168.71 169.48 169.88 169.96 168.85 167.7 167.75 164.99 159.4 156.49 160.53
Italy 82.83 82.56 82.07 81.78 80.9 80.23 78.85 79.09 77.73 76.77 75.85 75.9 ...
Sweden 52.91 54.78 56.16 57.24 57.8 59.09 60.57 61.87 62.22 63.25 62.86 ... ...
Source: European Health For All Database, HFA-DB, (2013), *OECD, 29 (2013)
21
Table 2. Health outcomes in the populat ions Life expectancy at birth, in years* 2000 2001 2002 2003 2004 2005 2006 2007 2008 2009 2010 2011 2012 France 79.35 79.43 79.55 79.44 80.5 80.49 81.16 81.47 81.43 81.76 ... ... ...
Italy 79.75 80.09 80.38 80.17 ... ... 81.58 81.7 81.91 82.07 82.5 ... ...
Sweden 79.92 80.01 80.09 80.37 80.55 80.82 81.05 81.19 81.35 81.61 81.77 ... ...
Life expectancy at birth, in years, male* 2000 2001 2002 2003 2004 2005 2006 2007 2008 2009 2010 2011 2012
France 75.49 75.64 75.88 75.93 76.89 76.93 77.51 77.78 77.85 78.19 ... ... ...
Italy 76.65 76.96 77.27 77.24 ... ... 78.62 78.84 79.09 79.32 79,75 ... ...
Sweden 77.51 77.67 77.85 78.06 78.33 78.57 78.88 79.12 79.29 79.53 79,73 ... ...
Life expectancy at birth, in years, female* 2000 2001 2002 2003 2004 2005 2006 2007 2008 2009 2010 2011 2012
France 83.15 83.17 83.14 82.88 83.99 83.94 84.65 85.01 84.84 85.19 ... ... ...
Italy 82.68 83.05 83.3 82.92 ... ... 84.33 84.35 84.52 84.62 85,04 ... ...
Sweden 82.26 82.27 82.26 82.62 82.67 82.99 83.15 83.19 83.36 83.61 83,74 ... ...
Healthy life years in absolute value at birth - females 2004 2005 2006 2007 2008 2009 2010 2011 2012 France 64,3 64,6 64,4 64,4 64,6 63,5 63,4 63,6 63,9 Italy 71 67,8 64,7 62,5 61,9 62,6 67,6 62,7 61,5 Sweden 60,8 63,2 67,5 66,8 69 69,6 71,1 70,2 70,7
Healthy life years in absolute value at birth - males 2004 2005 2006 2007 2008 2009 2010 2011 2012 France 61,5 62,3 62,8 62,8 62,7 62,8 61,8 62,7 62,6 Italy 68,7 66,6 65,2 63,3 63 63,4 67,6 63,4 62,1 Sweden 62 64,5 67,3 67,7 69,4 70,7 71,7 71,1 70,9
People having a long-standing illness or health problem, (%), all ages 2004 2005 2006 2007 2008 2009 2010 2011 2012 France 36,1 34,6 34,5 31,9 36,7 37,1 36,9 36,2 36,3 Italy 21,1 21,7 21,4 20,6 21,9 21,4 22,0 25,3 23,4 Sweden 49,7 41,4 33,7 33,4 32,8 32,5 30,6 32,2 33,8
Self-perceived health (%), very good 2004 2005 2006 2007 2008 2009 2010 2011 2012 France 25,2 24,4 25,1 27,2 24,6 25,1 23,2 22,6 25,2 Italy 13,9 13,9 13,4 12,3 12,9 13,3 14,9 13,1 13,7 Sweden 36,4 37,1 34,0 37,8 37,2 39,1 36,7 38,5 35,8
Self-perceived health (%), good 2004 2005 2006 2007 2008 2009 2010 2011 2012 France 42,4 44,3 44,1 43,9 44,5 43,5 44,1 45,0 42,9 Italy 43,5 44,2 43,5 51,1 50,6 50,5 51,9 51,6 54,7 Sweden 35,3 38,5 41,9 39,8 41,3 40,6 43,3 41,4 45,3
Infant deaths per 1000 live births* 2000 2001 2002 2003 2004 2005 2006 2007 2008 2009 2010 2011 2012
France 4.39 4.46 4.1 4.02 3.89 3.58 3.57 3.53 3.52 3.49 ... ... ...
Italy 4.47 4.64 4.36 3.95 ... ... 3.65 3.47 3.51 3.62 3.35 ... ...
Sweden 3.42 3.66 3.28 3.12 3.16 2.45 2.81 2.51 2.49 2.49 2.54 ... ...
Maternal deaths per 100000 live births* 2000 2001 2002 2003 2004 2005 2006 2007 2008 2009 2010 2011 2012
France 6.47 7.93 10.66 8.55 7.81 6.08 8.53 8.9 8.04 9.42 ... ... ...
Italy 2.97 2.07 3.17 5.18 ... ... 1.97 2.3 2.28 3.37 2.87 ... ...
Sweden 4.42 3.28 4.17 2.02 1.98 5.92 4.72 1.86 5.49 5.37 2.59 0.89 ...
Source: Eurostat (2013a) *European Health For All Database, HFA-DB, (2013)
22
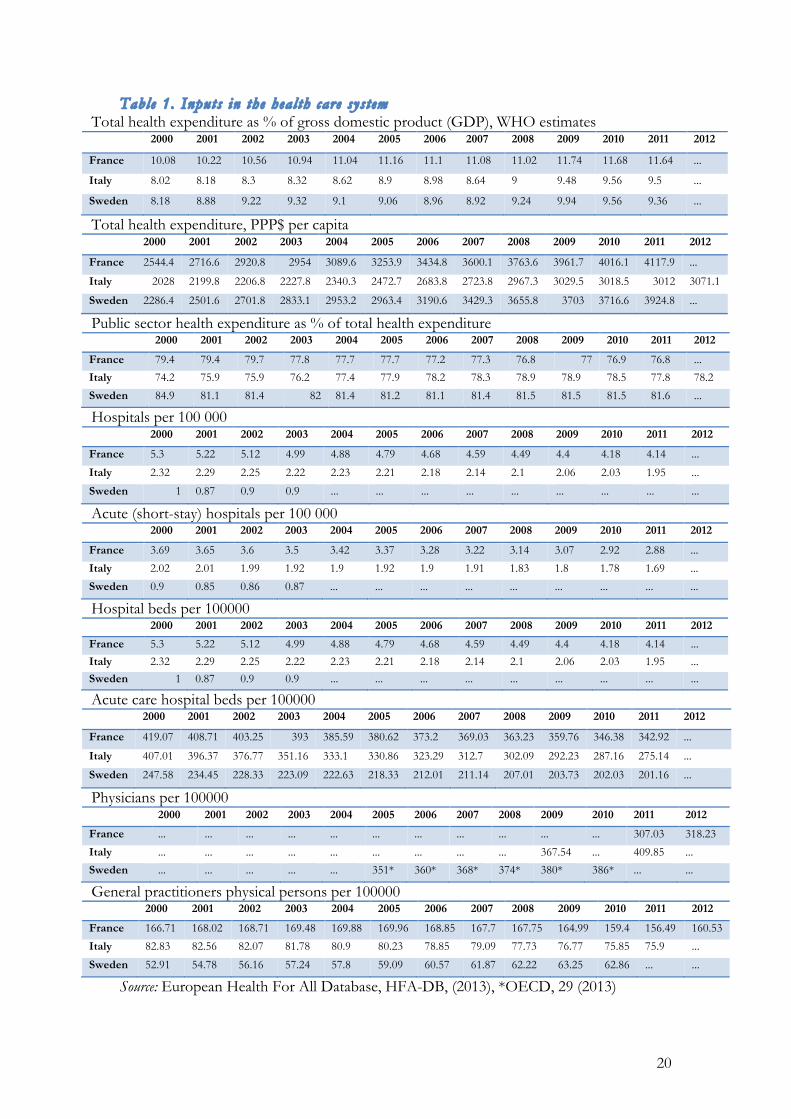
4.1 Health care expenditures
Both in Italy and in Sweden health care expenditures as a percentage of GDP, around 9
or 9,5%, with a starting point in 2000 of close to 8% of the GDP. Comparing this to
France, the French health care expenditures accounts for a larger share of GDP, staring
in 2000 at slightly more than 10% to exceed 11,5% in the later part of the time period
examined. France is also the country that spent the most, 4117,9 PPP adjusted dollars,
compared to 3071,1 and 3924,8 for Italy and Sweden, respectively. Since 2000, all the
countries have seen an increase in their health expenditures, see Table 1. However the
share of the expenditures that are directed to inpatient care differ, where Sweden has the
lowest share 28,4%, France the middle at 37,1%, and Italy the highest 46,7%. A
difference is that the French number has been varying with a difference of 2% and the
Swedish and Italian shares are increasing, see Table A.1.
The public share of the health care expenditures have seen different trends in the
countries, in France the share of public health has decreased, with a corresponding
increase in private health care. There was also a decrease in pubic health in Sweden,
between 2000 and 2001, but after that the share has been quite steady. It has also been
relatively steady in Italy, but since 2005 and prior to that there was an increase in the
share of public care, with a corresponding decrease in the private share, see Tables 1 and
A.1. The share of the total government expenditures that was designated to private care
was quite close in Italy and Sweden, who were both close to 15%, and France had almost
16% of their total government spending on public health care. When it comes to the
public in-patient care, in France and Italy the level is lower, but close to each other 93
and 93,7% respectively, than in Sweden, 98,3%. The trends have however been
decreasing for all, see Table A.1.
France has the lowest out of pocket payments for households, by more than 10
percentage points, almost 7,5% of the total health care expenditures. In Italy and
Sweden, the same numbers were almost 20% and almost 17%, respectively. As for the
trends they have been different, in France there is no clear trend neither increasing nor
decreasing, but in Italy the out of pocket payments has decreased and in Sweden they
have increased, see Table A.1.

23
When it comes to the governments’ pharmaceutical expenditures, it represented an
almost equal part of the total health care budget for France and Italy, 15,6 and 15,7%,
respectively. Sweden had a smaller share devoted to this purpose, 12,1%, all in 2011.
However, when looking at the amount spent per capita, France is the country spending
the most, 641,1 dollars, and with an increasing trend. There was also an increasing trend
in Sweden, which was the country spending the least per capita in 2011, 474 dollars per
capita. The Italian spending per capita was close to the Swedish, 482 dollars per capita,
but there have been fluctuations, as mentioned above, see Table A.1.
4.2 Hospitals and patients
The over all number of hospitals is, logically, quite different, since the three countries
differ in size and population. Something that is common to the three is that the number
of hospitals in absolute terms has decreased over all, since the year 2000, see Table A.2.
The hospital density, for which there was no information available for Sweden, has also
decreased for both France and Italy, however, the density has consistently been higher in
France, through the time period examined. The number of hospital beds per 100 000
inhabitants are decreasing for all three countries, see Table 1. Looking at the absolute
number of hospital beds it is clear that there is a ranking, where France has the most
beds and Sweden the least, for the entire time period. Further, the percentage of hospital
beds that are private the Italian share has been quite constant and was 31,53% in 2011,
the same number for France was 37,75%, and their share has been increasing, see Table
A.2. For Sweden there were, as mentioned above no data from the database on this, but
Anell et al. (2012) stated that in 2012 there were a total of 1100 private hospital beds in
Sweden. Assuming this was true also in 2011 and using the total number of hospital beds
as given by the European Health For All Database, this would account for 4,3% of the
total hospital beds, which is considerably lower than both Italy and France.
When looking at discharges, the number per 100 inhabitants have been steady in both
Sweden and France, at 16 and 19 discharges per 100 population, respectively. In Italy, the
number has decreased to be 11,77 discharges per 100 inhabitants. For acute care
hospitals there has been the same trends and the level is a bit lower that of total
hospitals, see Table A.2.
24
As for the number of out patient visits to primary or ambulatory care the average
number of visits per person and year have been quite stable in France and Sweden, 6,8
and 3,05 visits in 2011, respectively. In Italy the only observations were 6,1 visits on
average in 2000 and 7 visits in 2005. The Italian and French levels are thus quite close
together, while the Swedish is significantly lower, see Table A.2.
4.3 Physicians
From the most recent number for each country, France has the lowest physician density,
318,23 physicians per 100 000 inhabitants, and Italy the highest, 409,85 physicians per
100 000 inhabitants. In Sweden there were 390 physicians per 100 000 inhabitants. The
Italian, French and Swedish physician density has been increasing judging from the
available data. In France and Italy there have been increasing trends in almost all
specialities, but the general practitioners have decreased. In Sweden there has been an
increase in all specialities, see Tables 1 and A.3.
4.4 Population composition
There are no large differences in crude death rate per 1000 population, in the most
recent numbers between Italy and Sweden, and France is slightly lower. The differences
when it comes to the most recent numbers for the fertility rate, which is the highest in
France, at 2,03 children per woman on average, Sweden is close to that, at 1,9, and in
Italy it is the lowest at 1,41. Italy has the lowest share of the population between 0 and 14
years old, and then in the ranking comes Sweden and then France. In contrast, Italy also
has the largest share of the population above 65 years old, Sweden the second most, and
France the smallest share. Comparing the size of the two age groups, in France there is a
larger share of the population in the 0-14 years old than in the older than 65, in both
Sweden and Italy it is the other way around, see Table A.4.
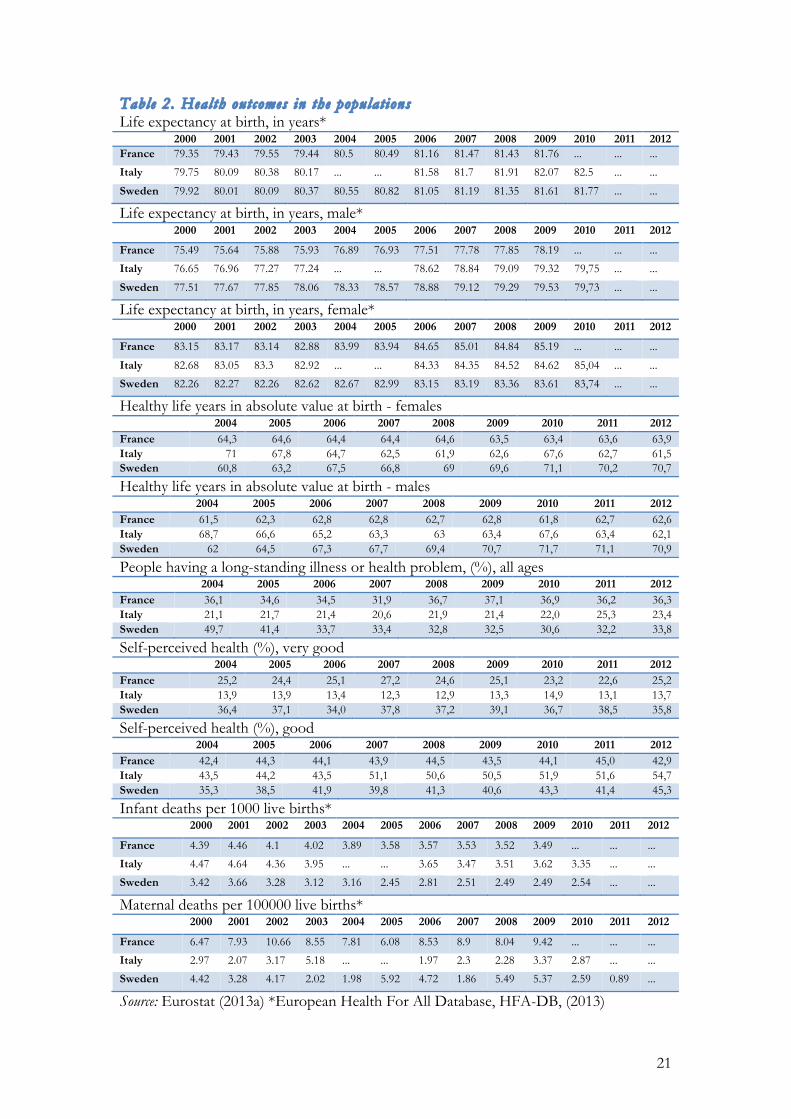
4.5 Life expectancy
The over all life expectancy at birth is similar, especially in Sweden and France, for the
latest numbers available for each country. Italy has a somewhat higher life expectancy.
This is also the case for the life expectancy at 1 and 15 years of age. Counting from the
age of 45 there is a bit more difference, and Italy has the highest and Sweden the lowest
life expectancy. For the life expectancy at 65 years old, France has the longest and

25
Sweden the shortest. Looking at the increase in life expectancy as a total number of life
years, as the age increases, the Swedish life years increases from 81,77 at birth to 84,95,
which is an increase of 3,18 years. In Italy the same number is an increase form 82,5 life
years at birth to 85,76 life years based on the life expectancy at 65 years old. This
corresponds to an increase of 3,26 life years associated with reaching the age of 65. In
France, the life expectancy at birth was 81,76 and if reaching 65 years of age the total
number of life years have increased to 86,3, which is an increase of 4,54 years. The
increase in total life years associated with attaining a higher age is the largest in France,
then there is a small difference between Italy and Sweden, with the latter having the
lower increase, see Tables 2 and A.5.
Comparing the life expectancy differentiating by gender, at birth there are no big
differences, however, French men live shorter than Italian and Swedish men, but
Swedish women live shorter than both Italian and French women, this is also the case
when the life expectancy at the age of 1 and 15, and regarding the males also for the life
expectancy at 45, however, for the women there are a bit more difference, with the
French women living the longest, then Italian and then Swedish. By the age of 65 this
same pattern hold for the women and for the men, but for them the differences are
smaller, see Tables 2 and A.5.
Women are expected to live longer than men, consistently through the statistics
presented by the European Health For All Database, and the largest differences are
found between French men and women, where it can differ as much as 6,94 years, when
the French are 15 years old. The next largest differences are in Italy and the lowest
differences are in Sweden, see Tables 2 and A.5.
4.6 Healthy life years
At birth, the average woman and man with the most healthy life years to look forward to
would be the Swedish, then the French and then the Italian, the last two having quite
similar numbers for females and almost the same for males, see Table 2. The over all
ranking is the same when the populations reach the age of 50, as well as for the ages of
65 years old and older. Further, women have a longer healthy life expectancy than men
do, consistently over the time period examined. When basing the calculation of expected
26
healthy life years on reported self perceived health the main pattern holds, even though
the numbers differ, and tend to be lower, see Table A.6.
When comparing the male and female healthy life expectancy based on self perceived
health within the country the largest difference is found in France, for all age categories,
the next largest differences in Sweden and the lowest differences in Italy. If instead
comparing the statistics on healthy life years, all differences are smaller, and in several
cases the men are expected to have more health life years than women, more specifically
in Italy for all age groups and in Sweden at birth. In France women are always expected
to have more heath life years than men, see Table A.6.
4.7 Self-perceived health
In the case of self perceived health there is a pattern among all the countries that the
largest category of the population states that their health is good, also when
differentiating between men and women. In Sweden and France the percentage is in the
lower and middle 40’s, and in Italy there is consistently more than 50% that states that
their health is good, for the total population as well as the male and female populations
separately. For the category very good, Sweden has the largest share of the population in
this category, then France and then Italy. The differences in magnitudes are quite
different, where Sweden has in the total population 35,8%, France 25,2% and Italy
13,7%, for the men an women separately, the men are stating higher that they are in very
good health to a higher degree than the females for all three countries. When it comes to
the category for fair health the differences are smaller, but France has the largest share of
the population in this category and Sweden the smallest, also when separating men and
women. However, the women state to have fair health to a larger extent than men. For
the share of the respective populations in bad health, the highest statements were
consistently in Italy, then France, then Sweden, and women stated to a higher degree
than men to be in bad health. Finally the very bad health category is the smallest category
in all the three countries, and Italy had a larger share of their population stating that they
were in this category compared to France and Sweden, who were close together. Also for
this category the share of women is larger than the share of men perceiving that they are
in very bad health, see Table 2 and A.7.
27
4.8 Morbidity
France has the largest share of the population suffering from a long standing illness or
health problem, second is Sweden, third is Italy. Sweden and France are closer together
compared to Italy, where the total morbidity is more than 10 percentage point lower than
in France, see Table 2. The considerably lower share of long term illness in Italy
continues, when looking at the age groups, until the age group 65-74 years old, where it
is close with the others. France and Sweden continue to be reasonably close, when
looking at these age groups. Looking at the share of the population that are 75 years of
age or older, the largest share with a long standing health problem is found in France, the
next largest in Italy and the smallest in Sweden. For the individual countries the share of
the population suffering from a long term health problem or illness is increasing with the
age groups, see Table A.8.
There are no large differences between males and females until the age group of the 45-
54 year olds, where the Swedish women are having a larger share with a long standing
health issue than the Swedish men, a difference which continues for the two following
age groups, until it is again fairly even for the 75 years old and above. For the other two
countries men and women continue to be fairly close together, see Table A.8.
As for the share of the population that suffers severe limitations due to a long term
illness or health problem, the shares are the same in Sweden and France at 8,6% of the
population that suffers from a long standing health issue. In Italy there are 6% reporting
the same thing. When looking at the males and females separately, women report severe
limitations to a higher degree than men do. Something that is also true for the share
reporting some limitations caused by their health issue. Considering the total population
in this category the largest share reporting some limitation in usual activities are from
Italy, with 19,6%, second, France with 16,1% and the lowest share is in Sweden, with
9,4%, which is less than half in Italy, see Table A.8.
Further, the vast majority of the populations report having no limitations in their usual
activities caused by their disease or health problem, in Sweden 84,6%, in France 75,3%
and in Italy 71,8%. The men are reporting to a higher extent than women that they suffer
no limitations in usual activities, which corresponds to the higher share of women
reporting that they have limitations to some extent, see Table A.8.

28
In all three countries there has been an increase in the share of the population reporting
a body mass index, BMI, of 25 or higher, indicating that they are overweight or obese.
For the male part of the populations, close to, or above, half reported that they were
obese or overweight compared to the women, where between roughly 35 and 40%
reported the same thing. Among men, who are in general reporting to be overweight or
obese to a higher extent than women, the highest share reported was in Italy and the
lowest was in France. For the women, the highest share reported was in Sweden, and the
lowest in France, the Italian share is close to the French, see Table A.8.
4.9 Infant and maternal health
Infant mortality in Italy and France are close together, and in Sweden it is consistently
lower, a pattern that holds regardless of if one is looking at the total infant deaths per
1000 live births, or if differentiating depending in the sex of the infant. Maternal deaths
have large differences where the number of deaths per 100 000 live births in France is
more than 10 times as high than it is in Sweden. The most recent numbers are for each
country, as mentioned above, 0,89, 2,87 and 9,42 deaths per 100 000 live births, for
Sweden Italy and France, respectively, see Table 2. There is also a large difference in the
number of abortions per 1000 live births, where there are 100 more in Sweden than in
Italy, which have the highest and lowest number, see Table A.9.
When it comes to the vaccination of infants the percentage that are vaccinated, for the
following diseases almost all, or a vast majority of all infants are vaccinated in all
countries: diphtheria, tetanus, pertussis, measles, poliomyelitis, haemophilius influenzae
type b, and rubella, the last one being the one with most variation of the list. Regarding
tuberculosis, the vaccination of this is widespread in France, but not in Italy and Sweden,
and considering hepatitis b, in Italy almost all infants are vaccinated against this, in
France just over half and in Sweden less than a third, see Table A.9, however, none of
the countries studied are on the list of countries where risk of tuberculosis or hepatitis b,
according to the Public Health Agency of Sweden (2013).
29
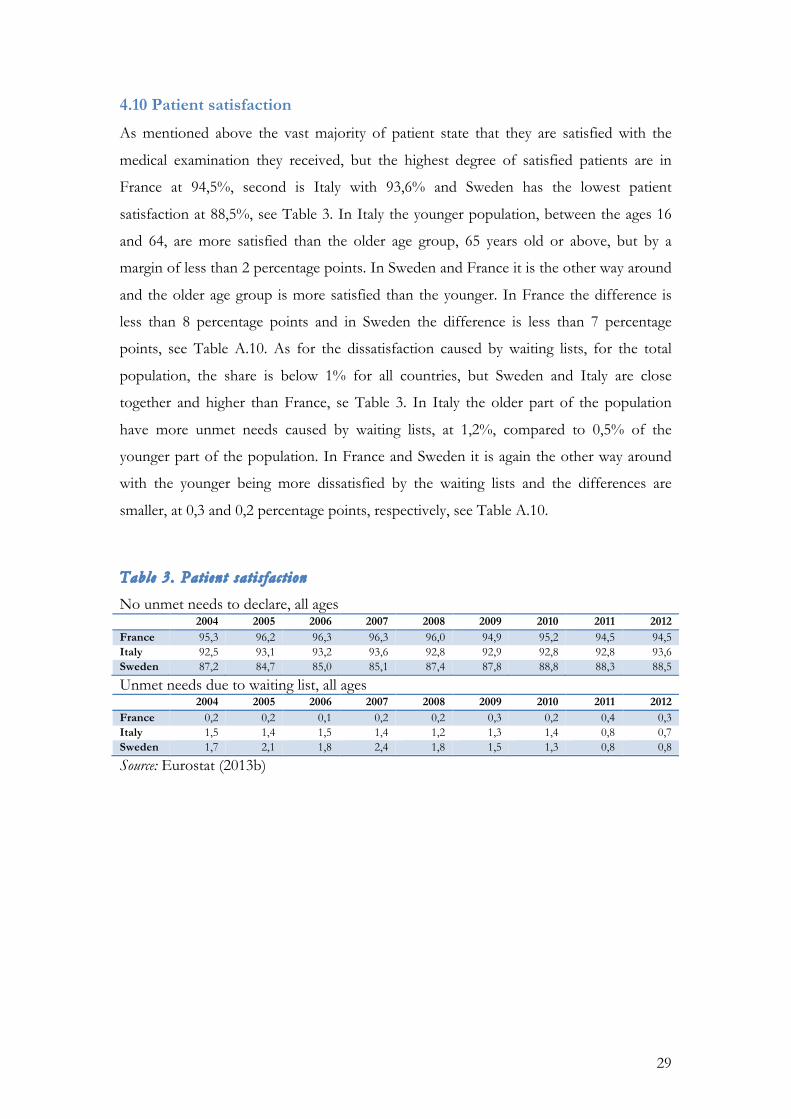
4.10 Patient satisfaction
As mentioned above the vast majority of patient state that they are satisfied with the
medical examination they received, but the highest degree of satisfied patients are in
France at 94,5%, second is Italy with 93,6% and Sweden has the lowest patient
satisfaction at 88,5%, see Table 3. In Italy the younger population, between the ages 16
and 64, are more satisfied than the older age group, 65 years old or above, but by a
margin of less than 2 percentage points. In Sweden and France it is the other way around
and the older age group is more satisfied than the younger. In France the difference is
less than 8 percentage points and in Sweden the difference is less than 7 percentage
points, see Table A.10. As for the dissatisfaction caused by waiting lists, for the total
population, the share is below 1% for all countries, but Sweden and Italy are close
together and higher than France, se Table 3. In Italy the older part of the population
have more unmet needs caused by waiting lists, at 1,2%, compared to 0,5% of the
younger part of the population. In France and Sweden it is again the other way around
with the younger being more dissatisfied by the waiting lists and the differences are
smaller, at 0,3 and 0,2 percentage points, respectively, see Table A.10.
Table 3. Patient sat is fac t ion
No unmet needs to declare, all ages 2004 2005 2006 2007 2008 2009 2010 2011 2012
France 95,3 96,2 96,3 96,3 96,0 94,9 95,2 94,5 94,5 Italy 92,5 93,1 93,2 93,6 92,8 92,9 92,8 92,8 93,6 Sweden 87,2 84,7 85,0 85,1 87,4 87,8 88,8 88,3 88,5
Unmet needs due to waiting list, all ages 2004 2005 2006 2007 2008 2009 2010 2011 2012
France 0,2 0,2 0,1 0,2 0,2 0,3 0,2 0,4 0,3 Italy 1,5 1,4 1,5 1,4 1,2 1,3 1,4 0,8 0,7 Sweden 1,7 2,1 1,8 2,4 1,8 1,5 1,3 0,8 0,8
Source: Eurostat (2013b)
30
5 Discussion
The purpose of this thesis was to investigate if the government decisions with regards to
the health care system, i.e. how the health care system is structured and health care
expenditures, and the state of the health care system affect the health outcomes in the
population, using Sweden, France and Italy as examples.
In all the systems there is a public provision of health care, even though health care is a
private good. The reasons for this are stated above, and can be related to the political
system where politicians have to please the voters in order to be re-elected. As a result of
this all the health care systems aim to provide equal and universal access to the systems,
regardless of the type of system, but all of the systems here are also dealing with regional
differences in the provision of care. The health care system in all three countries have
been decentralised, but in France and Sweden, there has been recent steps towards a
larger regional control, in Sweden with the creation of two larger regions, those of Västra
Götaland and Skåne, and in France the creation of the ARS, that not only covers several
departments, but also combined several regional agencies into one, making it easier to
coordinate within the regions. This can, in the case of France, put into context by Mosca
(2007), who states that decentralisation in a Bismarck system can make an already
complicated structure in the health care system become more complicated. Further
Mosca (2007) states that dectralisation is done with the intention to increase efficiency
and Giannoni and Hitiris (2002) also points out that decentralisation, while providing the
opportunity to adapt to local needs, can increase regional differences. Regional
differences in Italy have been pronounced since the unification of the country, in 1861,
with the large difference between the northern and southern regions. The Italian regions
have great autonomy regarding the health care, and they have, according to Lo Scalo et
al., (2009), even room for interpreting the government directives. Government directives,
or guide lines have been implemented in Sweden to decrease the regional differences and
to increase communication between municipalities and counties or regions.
5.1 Health care expenditures
Bismarck systems are expected to spend more, compared to Beveridge systems, as
mentioned above in the literature review, see e.g. Or, et al., (2010), Figueras et al. (2004)
and Ebola (1996). France has, however, implemented cost containment schemes, which
31
according to Or, et al., (2010) is one of the expected policy trends of a Bismarck system.
The French are still spending a larger share of their GDP than Sweden and Italy does.
France is also the country spending the most per capita, however, the Swedish spending
per capita is closer to the French than the Italian level. France is also spending the most
on both in-patient care and pharmaceuticals. In Italy, as mentioned pointed out by
(Giannoni & Hitiris, 2002), cost containment has been an issue since the change into a
Beveridge system in 1978 with the implementation of the SSN. Cost containment
measures have been implemented and in comparison with Sweden, the other Beveridge
system, the percentage of GDP spent on health care is just below the Swedish level for
the larger share of the time period examined.
The unbalanced growth model, is explaining the increasing health expenditures as the
result of the health care sector being non-progressive, causing relative prices to increase
over time (Baumol, 1967, Baumol, 1993). This can be illustrated by the health
expenditures growing faster than the GDP, which according to Pammolli et al., (2012) is
the case in Europe, to differing degrees. This also appears to be the case for France, Italy
and Sweden, seeing as the percentage of the GDP spent on health care is increasing over
the time period examined, thus indicating that the health care expenditures are growing
faster than the GDP as a reflection of the increasing relative prices of the health care
sector. This could also indicate that increasing income, GDP, will increase the
consumption of health care, thus raising the costs as stated by e.g. Pammolli et al., (2012)
and Hall and Jones (2007). In Pammolli et al., (2012), among others, this is attributed to
health care being a luxury good, with an income elasticity larger than one and in Hall and
Jones (2007) health care is explored as a superior good, with the argument that in
prolonging life, investments in health care are increasing utility not only by giving better
health, but by adding additional periods to the life time.
Regarding the effects of ageing the opinions in literature differ, where some found
effects of population ageing on the health care expenditures e.g. are Blomquist and
Carter (1997), mainly in the 1990’s, but some, more recent, studies favour the measure of
proximity to death rather than the actual ageing, e.g. Breyer and Felder (2006) and
Werblow et al. (2007). Looking at the composition of the populations, in the lack of a
proximity to death statistic, there is a consistent pattern where France has the smallest
share of the population being of the age 65 or older, next Sweden then Italy and in
32
general the share of the population above 65 years of age is increasing. If this has a direct
effect on the health care expenditures cannot be said with any certainty here, but there it
can have other consequences if the trend continues, such as changes in the demand for
health care.
5.2 Satisfaction, waiting lists and patient choice
When looking at the trade off formulated by Ebola (1996) between the bismarckian
satisfaction and beveridgian efficiency, so far the Beveridge systems have lower spending
on health care. As for the satisfaction, the share of the population reporting that they
have no unmet needs, which are then assumed to be satisfied, the highest satisfaction is
over all in France. This is consistent with the notion that patients are more satisfied in a
Bismarck health care system. However, Italian patients are over all close to the
satisfaction of French patients, while the share of Swedish patients who are satisfied is,
while a large majority of all patients, considerably smaller than in Italy and France.
France and Sweden are thus displaying the predicted relation with regards to patient
satisfaction, while Italy is displaying a bismarckian satisfaction. This can possibly be
caused by the changing of the system, from a Bismarck to a Beveridge type system in
1978. While long ago, the structure of e.g. many small single GP practises, as in France,
and the freedom of choosing specialists, even if a referral is given from the GP, also as in
France, where there is a longer tradition of patient choice, compared to Sweden where
patient choice was starting to gradually introduced in the 1990’s.
How the systems are structures may also affect how physician density is developing. In
France and Italy the physician density has been increasing, while has been decreasing in
Sweden. However, the physician density over all is the smallest in France, and the highest
in Italy. But when looking specifically on the GP’s, France has more than the double of
the Italian GP’s per 100 000 inhabitants and Italy has more than ten additional GP’s for
the same population compared to Sweden. The trends have both been over all decreasing
for Italy and France, where single GP practices common, but more steadily so in Italy. In
Sweden where the norm is larger GP practices there has been an increase in the GP
density since the year 2000. In Sweden the amount of the health care expenditures that
are spent on private care has also been increasing and according to Anell et al., (2011) the
Swedish primary care system adapted to a mix of public and private provision of health
care, where the private share of the primary care has been increasing, as has the total
33
share of the expenditures spent on the private share of the health care system, as
presented in the statistics from Eurostat. In France and Italy no such recent shifts have
been made, but there has been cost containment issues that have been addressed
(Chevreul et al., 2010 and Lo Scalo et al., 2009, respectively), which logically also should
affect the physician density.
The limited patient choice and long waiting lists are problems that are attributed to
Beveridge type health care systems (Or, et al., 2010). Dealing with waiting lists has been
done differently, when looking at the two Beveridge systems. Sweden have implemented
a care guarantee, where the time period before seeing a doctor and receiving treatment is
regulated, whereas in Italy there are large regional differences both with regards to length
and management of waiting lists, which in some regions in the south still are managed
manually. Implementation of measures to shorten waiting times over the next three years
was implemented in 2006, but there were still large differences between regions in 2009.
Looking at the statistics for Italy, however, there is a decrease in the share of population
who report that they have unmet needs caused by the waiting lists, since 2006 when the
measures to shorten the lists were implemented. The same thing can be seen in the
statistics for the Swedish population, where the share reporting unmet needs caused by
waiting lists has decreased since 2005, when the care guarantee was implemented. As
stated above, comparing to France, both Italy and Sweden have a higher share of their
population not being satisfied because of waiting lists, which falls into the pattern of the
Beveridge Bismarck system, where waiting lists are not as great a problem in a Bismarck
system (see Kroneman et al., 2006, Figueras et al, 2004).
The reasons for the Bismarck systems’ higher patient satisfaction has been stated to be,
apart from waiting times, accessibility to secondary care (Kroneman et al., 2006, Chu-
Weininger & Balkrishnan, 2006). Both of these explanatory characteristics of satisfaction
are fitting in on France and Sweden for their respective system, while Italy is harder to
place in the typical Beveridge or Bismarck category, probably because of the switch from
Bismarck to Beveridge not eliminated all traces of the Bismarck system.
5.3 Health status
According to Van der Zee and Kroneman (2007), as mentioned above, mortality rates,
life expectancy at birth, and infant mortality had better outcomes under a Bismarck
system. Looking at the three countries examined the mortality rates does not display any

34
large difference between Italy and Sweden. France however, has a lower mortality rate,
consistent with the findings of Van der Zee and Kroneman (2007). Life expectancy at
birth is not the highest in France, but in Italy. France and Sweden have as good as the
same life expectancy at birth for the most recent numbers. The highest infant mortality
rate is in France, which is close to the Italian one and the Swedish is the lowest. These
observations are not consistent with the findings of Van der Zee and Kroneman (2007)
where France would be expected to have lower infant mortality rates and longer life
expectancy. However, if looking at life expectancy in more detail, French women
consistently has a longer life expectancy for all age categories examined, and as
mentioned above France has the largest differences between men and women. Looking
at all age groups however, in most age groups France is slightly better, and when
comparing for males and females separately, the life expectancy for females is mostly
better in France and for males it is mostly better in Sweden.
Looking at the expected healthy life years this difference is also pertinent in France to a
larger extent than in Sweden and Italy, and even more so when basing the calculation on
self perceived health. Further, the Swedish population have over all the most healthy life
years, and Italy the fewest. Sweden has better health outcomes compared to France when
looking at other health outcome indicators as well, namely, lower maternal mortality,
higher shares stating that their self perceived health is good or very good, lower over all
morbidity, more healthy life years, also when based on self perceived health. France also
has a lower obesity for women than Sweden, but higher for men.
When putting Italy into the comparison there is no constant pattern emerging, for life
expectancy Italy is the best for the total population until life expectancy at 65 years old,
where France surpasses, which is also true for the male part of the population. For
females France surpasses Italy at life expectancy at 45 years old. The life expectancy
compared to Sweden is consistently higher. Regarding healthy life years, the Italian
numbers are the lowest, also when based on self perceived health. Self perceived health,
however, Italy has the lowest share reporting very good health and the highest share
reporting good health. For infant and maternal mortality Italy is in the middle, after
Sweden who has the lowest. Morbidity is the lowest until the last two age groups, 65-74
and 75 and older, where Sweden has a lower morbidity. The Italian share is however
either close to the Swedish number or in a middle position in the ranking. As for obesity,
35
Italy has the largest share of men reporting overweight or obesity, while for women the
share is in the middle, but close to France, which has the lowest share for females. The
crude death rates are the highest in Italy, but there is no large difference from Sweden, as
mentioned above.
From the comparison of the statistics and literature, there appears to be clear
characteristics connected to the type of health care system in two of the cases examined,
France and Sweden, while Italy is showing characteristics from both sides, they have
managed to combine the high patient satisfaction, comparable to that of France, while
having health care expenditures comparable to Sweden. Has the changing of system in
Italy become a combination of the two systems that could be applied, and be beneficial
to other countries as well or is it simply a result of having inflated costs for health care in
France, due to having the lowest out of pocket expenses for the health care, causing the
French to seek medical care to a higher degree than in other countries and thus increase
the health care expenditures for the government. In that case, the differences is caused
by the pricing of the health care in France, not strictly because it is a Bismarck type
system. With the statistics available from Italy there does not seem to be any larger
difference, but the most recent number is from 2005, whereas the most recent number
from France is 2011.
When comparing the inputs into the health production in each country France’s higher
spending and lower health outcomes does not seem to be in line with the expectation
founded on economic theory described in the method section. Further, the over all
physician density is lower, which is in line with the initial expectation, but when looking
at only GPs there are more than twice the amount of GPs per 1000 inhabitants in France
compared to Italy and Sweden. France also has the highest hospital and hospital bed
density than both Sweden and Italy, but still not notably higher health outcomes and thus
also this appears contradictory to the initial expectation.
Sweden is the country with the lowest inputs into the health care system in term of
physician, hospital and hospital bed density. The expenditures are as just stated, close to
the Italian ones. In contrast to the initial expectation, although Sweden have consistently
lower inputs into health production than France, but have in many cases better health
outcomes.

36
As for the inputs and outcomes in Italy the health care expenditures, as stated before, are
close to the ones in Sweden, they have the second highest hospital and hospital bed
density, and the most recent number of physician density is the highest of the three
countries. The expectation would then be that the health outcomes are higher than in
Sweden, which they are in some cases, but as stated above there is no clear ranking
pattern comparing to the other countries.
6. Conclusion
France has the highest inputs into the health care system and Sweden has the lowest,
which is consistent with having a Bismarck and Beveridge system. However, also
consistent with the literature, the Beveridge system appears to be more efficient in
producing health outcomes than the Bismarck system, since Sweden has, for the largest
part of the health status indicators included, a better result than France. Further, still
consistent with literature, France has a better patient satisfaction than Sweden. Waiting
lists appear to be cause for more dissatisfaction in Sweden than in France, although some
effect has been seen since the implementation of the care guarantee, that limits the time
the patient have to wait before seeing specialists or receiving treatment. Italy however, is
not falling into either the Beveridge or the Bismarck pattern, but has e.g. high patient
satisfaction, cost containment problems, typically found in a Bismarck system, and
varying health status outcomes. As for dissatisfaction caused by waiting lists Italy, like
Sweden has managed to reduce it by policy implementation, which is generally a
Beveridge problem. It thus appear that Italy, in having changed from one type of system
to the other is facing some of the problems and some of the benefits of each type of
system.
That there are similarities among the countries speaks to the notion that not only the
type of system matters for the development of the health care system, but also the
political process, since e.g. all the three countries are providing equal and universal access
to the health care system, but also that all the countries struggles with the controversy of
having health care run at a decentralised level, but still wants to have equal levels quality
and access to care in the country. In spite of their many differences Sweden and France

37
have implemented similar policies where the administration of the health care system is
moved to a regional level rather than at a county, department level, respectively.
It thus appears that which type of system and what health policies the government
choose to implement may affect health in the population, and there are also cases where
government policies appear to have an effect, e.g. waiting list reforms in Sweden and
Italy. Still, each country is different and tendencies that appear to be caused by being one
type of system may also be caused by country specific policy implementations.
Regardless, there are differences in what is invested in the health care system and what
health for the population is produced. The production of health does however not seem
to be consistent with expectation, based on economic theory, that more inputs in the
health care system will result in higher health outcomes in the population. It is probable
that the system specific characteristics affect e.g. efficiency of the health care system and
thus the health outcomes that the system is able to produce. In the interest of improving
health production for the population international cooperation between politicians,
economists and health care professionals, might be beneficial in order to develop health
care systems. Each system could in this case benefit from the strengths of others and
thus work towards an optimisation both with regards to meeting the needs of the
population and efficiency.
However, more research is needed in order to determine exactly to what extent the
government can affect the health outcomes in Sweden, Italy and France, especially since
the political climate may affect what is feasible in each country and to what degree
economic incentives, specific to the country, affect the decisions. Further research could
also be done with regards to the extent the life style of the population affects the health
status, e.g. if or to what degree the differences in obesity can be explained by food habits,
and how the governments’ taxations affect the food consumption. Some large
differences between men and women have also been found, e.g. the difference in life
expectancy in France, and further research could also be directed to finding out what
causes such differences. Large differences between countries e.g. in infant mortality, that
might be ethically sensitive, could also be investigated further, in cooperation with other
faculties, to discern whether there under-investment in these categories of care in some
countries and how one should value investments in one type of care against another.
38
References
1177 Vårdguiden. (2013, 09 20). Remiss. (I. K. Gadea, Editor, & 1177 Vårdguiden)
Retrieved 04 14, 2014 from 1177.se: http://www.1177.se/Vastra-Gotaland/Regler-och-
rattigheter/Remiss/
Afrite, A., Chaleix, M., Com-Ruelle, L., & Valdelièvre, H. (2009). Hospital at home (HAH),
a structured, individual care plan for all patients . Institut de recherche et documentation en
économie de la santé pour Eco-Santé . Paris: Questions d’Economie de la Santé, 140 .
Afrite, A., Com-Ruelle, L., Or, Z., & Renaud, T. (2007). Hospital at home, an economical
alternative for rehabilitative care. Institut de recherche et documentation en économie de la
santé pour Eco-Santé . Paris: Questions d’economie de la santé, 119 .
Anell, A. (2011). Choice and privatisation in Swedish primary care. Health Economics, Policy
and Law , 6 (4), 549-569.
Anell, A., Glenngård, A. H., & Merkur, S. (2012). Sweden: Healthsystem review. Health
Systems in Transition , 14 (5), 1-159.
Arentz, C., Eekhoff, J., & Kochskämper, S. (2012). Private health insurance: a role model
for European health systems. European Journal of Health Economics , 13, 615-621.
Bac, C., & Cornilleau, G. (2002). Comparaison internationale des dépenses de santé : une analyse
des évolutions dans sept pays depuis 1970. Direction de la recherche, des études, de l’évaluation
et des statistiques. DREES.
Baumol, W. J. (1993). Health care, education and the cost disease: A looming crisis for
public choice. Public Choice , 77, 17-28.
Baumol, W. J. (1967). Macroeconomics of Unbalanced Growth:The Anatomy of Urban
Crisis. The American Economic Review , 57 (3), 415-426.
Beckman, A., & Anell, A. (2013). Changes in health care utilisation following a reform
involving choice and privatisation in Swedish primary care: a five-year follow-up of GP-
visits . BMC Health Services Research , 13, 452.
39
Blomquist, A., & Carter, R. (1997). Is health-care really a luxury? Journal of Health
Economics , 16, 207-229.
Blomquist, S., & Christiansen, V. (1999). The political economy of publicly provided
private goods. Journal of Public Economics , 73, 31-54.
Breyer, F. (1995). The political economy of rationong in social health insurance. Journal of
Population Econmics , 8, 137-148.
Breyer, F., & Felder, S. (2006). Life expectancy and health care expenditures: a new
calculation for Germany using the costs of dying. Health Policy , 75, 178-186.
Brown, M. C. (1987). Caring for Profit: Economic Dimension of Canada's Health
Industry. Frazer Institute .
Chevreul, K., Com-Ruelle, L., Midy, F., & Paris, V. (2005). Le développement des services de
soins hospitaliers à domicile. Experiences australienne, canadienne et britannique. Institut de
recherce et documentation en économie de la santé. Paris: IRDES rapport 1610.
Chevreul, K., Durand-Zaleski, I., Bahrami, S., Hernández-Quevedo, C., & Mladovsky, P.
(2010). France: Health system review. Health Systems in Transitions , 12 (6), 1-291.
Chu-Weininger, M. L., & Balkrishnan, R. (2006). Consumer satisfaction with primary
care provider choice and trust. BMC Health Services Research , 6.
Com-Ruelle, L., & Afrite, A. (2008). L'HAD, une prise en charge hospitalière moderne. Paris:
Editions Elsevier-Mansson.
Costa-Font, J., & Pons-Novell, J. (2007). Public health expenditure and spatial
interactions in a decentralized national health system. Health Economics , 16, 291-306.
Crivelli, L., Filippini, M., & Mosca, L. (2006). Federalism and regional health care
expemditures: an empirical analysis for the Swiss cantons. Health Economics , 15, 535-541.
Culyer, A. J. (1990). Cost containment in Europe. Health Care Systems in Transition , 29-40.
Cutler, D. M. (2002). Equality, Efficiancy, and Market Fundamentals: The Dynamics of
International Medical Care. Journal of economic Literature , 40 (3), 881-906.
40
Di Matteo, L. (2005). the macro determinants of health care expenditure in the United
States and Canada: assessing the impact of income, age redistribution and time. Health
Policy , 71, 211-228.
Dormont, B., Grignon, M., & Huber, H. (2006). Health expenditure growth: reassessing
the threat of ageing. Health Economics , 15, 947–963.
Ebola, J. (1996). Health care systems reforms in western European coutries: the
relevance of health care organization. International Journal of Health Services , 26, 239-251.
Eekhoff, J., Jankowski, M., & Zimmerman, A. (2006). Risk-Adjustment in Long-Term
Health Insurance Contracts in Germany. The Geneva Papers , 31, 692-704.
Epple, D., & Romano, R. E. (1996). Public Provision of Private Goods. Journal of Polotocal
Economy , 104, 57-84.
Eurostat. (2013b, 12 18). Heath Care database. Retrieved 03 05, 2014 from
epp.eurostat.ec.europa.eu:
http://epp.eurostat.ec.europa.eu/portal/page/portal/health/health_care/data/database
Eurostat. (2013a, 12 18). Heath status and determinants database. Retrieved 03 01, 2014 from
epp.eurostat.ec.europa.eu:
http://epp.eurostat.ec.europa.eu/portal/page/portal/health/health_status_determinants
/data/database
Figueras, J., Saltman, R. B., & Dubois, H. F. (2004). Patterns and performance in social
health insurance systems. In R. B. Saltman, R. Busse, & J. Figueras, Social health insurance
systems in western Europe (pp. 81-140). Maidenhead, Berkshire, England: Open University
Press.
France, G., Taroni, F., & Donatini, A. (2005). The Italian health-care system. Health
economics , 14, S187-S202.
Gerdtham, U. G. (1993). The impact of ageing on health care expenditure in Sweden.
Health Policy , 24, 1-8.
41
Gerdtham, U. G., Sogaard, J., Andersson, F., & Jonsson, B. (1992). An econometric
analysis of health care expenditure: a cross-sectio study of the OECD countries. Journal of
Health Economics , 11, 63-84.
Getzen, T. E. (1992). Population ageing and the growth of health expenditures. The
Journals of Gerontology , 19, 259-270.
Giannoni, M., & Hitiris, T. (2002). The regional impact of health care expenditure: the
case of Italy. Applied Economics , 14, 1829-1836.
Glenngård, A. H. (2013). Is patient satisfaction in primary care dependent on structural
and organizational characteristics among providers? Findings based on data from the
national patient survey in Sweden. Health Economics, Policy and Law , 8 (3), 317 - 333 .
Glenngård, A. H., Anell, A., & Beckman, A. (2011). Choice of primary care provider:
Results from a population survey in three Swedish counties . Health Policy , 103 (1), 31-37.
Gorneman, I., & Zunzunegui, M. (2002). Incremento de servicios hospitalarios por las
personas mayores de 55 an ̃ os: envejecimiento poblacional y respuesta del sistema de
servicios de salud . Gaceta Sanitaria , 16, 156-159.
Gouveia, M. (1997). Majority rule and the public provision of a private good. Public Choice
, 93, 221-244.
Grignon, M., Perronnin, M., & Lavis, J. N. (2008). Does free complementary health
insurance help the poor to access health care? evidence from France. Health Economics ,
17, 203-219.
Grossman, M. (1982). Government and Health Outcomes. The American Economic Review ,
72 (2), 191-195.
Hall, R. E., & Jones, C. I. (2007). The Value of Life and the Rise in Health Spending. The
Quarterly journal of Economics , 122 (1), 39-72.
HCAAM. (2006). Rapport annuel du Haut conseil pour l’avenir de l’assurance maladie . Paris:
Haut conseil pour l’avenir de l’assurance maladie .
HFA-DB. (2013, 07). Retrieved 03 14, 2014 from data.euro.who.int:
data.euro.who.int/hfadb/
42
HFA-DB. (2013, 07). European Health For All Database. Retrieved 03 14, 2014 from
data.euro.who.int: data.euro.who.int/hfadb/
Hitiris, T. (1997). Health care expenditure and integration in the countries of the
European Union. Applied Economics , 29, 1-6.
Hitiris, T., & Posnett, J. (1992). The determinants and effects of health care expenditures
in developed countries. Journal of Health Economics , 11, 173-181.
Hjelmgren, J., & Anell, A. (2007). Population preferences and choice of primary care
models: A discrete choice experiment in Sweden . Health Policy , 83, 314-322.
Hoffmeyer, U. K., & McCarthy, T. (1994). Financing Health Care. Dordrecht: Kluwer
Academic Publishers .
Kifman, M. (2005). Health insurance in a democracy: Why is it public and why are prices
income related? 124, 283-308.
Kroneman, M. W., Maarse, H., & van de Zee, J. (2006). Direct access in primary care and
patient satisfaction: a European study. Health Policy , 76, 166-169.
Leach, J. (2010). Ex Post Welfare under Alternative Health Care. Journal of Public Economic
Theory , 12, 1027-1057.
Leu, R. E. (1986). The public-private mix and international health care cost. In A. J.
Culyer, & B. Johnsson, Public and Private Health Services (pp. 41-63). Basil Blackwell.
Lo Scalo, A., Donatini, A., Orzella, L., Cicchetti, A., Profili, S., & Maresso, A. (2009).
Italy: Health System Review. Health Systems in Transition , 11 (6), 1-216.
Mapelli, V. (1993). Health needs, demand for health services and expenditure across
social groups in Italy: an empirical investigation. Social Science and Medicine , 36 (8), 999-
1009.
Martín, J. J., Puerto López del Amo Gonzales, M., & Dolores Cano García, M. (2011).
Reviw of the literature on the determinants of healthcare expenditure. Applied Econometrics
, 43, 19-46.

43
Ministero della Salute, Servizio Studi e Documentazione. (2008). Relazione sullo stato
sanitario della Paese. Retrieved 04 10, 2014 from www.salute.gov.it:
http://www.salute.gov.it/imgs/C_17_pubblicazioni_789_allegato.pdf
Mosca, I. (2007). Decentralisation as a determinant of health care expenditure: empirical
analysis for OECD countries. Applied Economics Letters , 14, 511-515.
National Board of Health and Welfare. (2011). Lägesrapport 2011. Stockholm:
Socialstyrelsen.
Newhouse, J. P. (1977). Medical-Care Expenditure: A Cross-National Survey. The Journal
of Human Resources , 12 (1), 115-125.
Newhouse, J. P. (1996). Reimbursing Health Plans and Health Providers: Efficiency in
Production versus Selection. Journal of Economic Literature , 34 (3), 1236-1263.
OECD. (2011, 10 28). OECD statistics - key indicators. Retrieved 02 13, 2014 from
oecd.org: http://www.oecd.org/statistics/
OECD, 25. (2013, 10 11). Health: Key Tables From OECD. Retrieved 02 16, 2014 from
oecd-ilibrary.org: http://www.oecd-ilibrary.org/social-issues-migration-
health/overweight-or-obese-females_20758480-table15
OECD, 26. (2013, 10 11). Health Key Tables from OECD table 26. Retrieved 02 14, 2014
from oecd-ilibrary.org: http://www.oecd-ilibrary.org/social-issues-migration-
health/overweight-or-obese-males_20758480-table16
OECD, 29. (2013, 10 11). Health Key Tables From OECD table 29. Retrieved 02 10, 2014
from oecd-ilibrary.org: oecd-ilibrary.org/social-issues-migration-health/practising-
physicians-doctors_20758480-table4
Or, Z., Cases, C., Lisac, M., Vrangbaek, K., Winblad, U., & Bevan, G. (2010). Are health
problems systematic? Politics of access and choice under Beveridge and Bismarck
systems. Health Economincs, Policy and Law , 5, 269-293.
Pammolli, F., Riccaboni, M., & Magazzini, L. (2012). The sustainability of European
health care systems: beyond income and ageing. European Journal of Health Economics , 13,
623-634.

44
Parkin, D., Mcguire, A., & Yule, B. (1987). Aggregate health care expenditure and
national income: is health care a luxury good. Journal of Health Economics , 6, 109-127.
Piperno, A., & Di Orio, F. (1990). Social differences in health and utilization of health
services in Italy. Social Sccience and Medicin , 305-312.
Public Health Agency of Sweden. (2013, 11 08). Riskländer avseende tuberkulos och hepatit B.
(Folkhälsomyndigheten, Producer) Retrieved 04 25, 2014 from olkhalsomyndigheten.se:
http://www.folkhalsomyndigheten.se/amnesomraden/smittskydd-och-
sjukdomar/vaccinationer/vacciner-a-o/hepatit-b/risklander-tuberkulos-och-hepatit-b/
Roberts, J. (2000). Spurious regression problems i the determinants of the health care
expenditure: a comment on Hitiris. Applied Econometrics Letters , 7, 279-283.
SALAR. (2010). Från sjukhussäng till e-hälsa. Utvecklingstendenser inom hälso- och sjukvården .
Stockholm: Sveriges Kommuner och Landsting.
Saltman, R., & Figueras, J. (1996, 04 23). European health care reforms: analysis of current
strategies . Retrieved 04 13, 2014 from World Health Organization Regional Office For
Europe:
http://www.euro.who.int/__data/assets/pdf_file/0005/111011/sumhecareform.pdf
Schokkaert, E., Dhaene, G., & Van De Voorde, C. (1998). Risk adjustment and the
trade-off between efficiency and risk selection: an application of the theory of fair
compensation. Health Economics , 7, 465-480.
Seshamani, M., & Gray, A. (2004b). A longitudinal study of the effects of age and time to
death on hospital costs. Journal of Health Economics , 23, 217-235.
Seshamani, M., & Gray, A. (2004a). Ageing and Health-care expenditure: the red herring
argument revisited. Health Economics , 13, 303-314.
SOU. (2007). Hållbar samhällsorganisation med utvecklingskraft, Ansvarskommitténs
slutbetänkande . Stockholm: Fritzes.
Swedish Competition Authority. (2010). Uppföljning av vårdval i primärvården – Valfrihet,
mångfald och etableringsförutsättningar. Stockholm: Konkurrensverket.
Swedish Insurance Federation. (2011). Stockholm: Swedish Insurance Federation.
45
Thomson, S., & Mossialos, E. (2004). Private health insurance and access to health care
in the European union . Observer: Newsletter of the European Observatory on Health Systems and
Policies , 6, 1-4.
van der Zee, J., & Kroneman, M. W. (2007). Bismarck or Beveridge: a beauty contest
between dinosaurs. BMC Health Services Research , 7 (94).
Wagstaff, A., van Doorsaler, E., & Paci, P. (1991). On the measurement of horizontal
inequity in the delivery of helth care. Jornal of Health Economics , 10, 169-205.
Werblow, A., Felder, S., & Zweifel, P. (2007). Population ageing and health care
expenditure: a school of "red herrings". Health Economics , 16, 1109-1126.
Zweifel, P., & Breuer, M. (2006). The case for risk based premiums in public health
insurance. Health Economics Policy and Law , 1, 171-188.
Zweifel, P., Breyer, F., & Kifmann, M. (2009). Health Econmics (Second Edition ed.).
Berlin Heidelberg: Springer.
Zweifel, P., Felder, S., & Meiers, M. (1999). Ageing of population and health care
expenditure: a red herring? Health Economics , 8, 485-496.
46
Appendix 1. Sweden
A.1.1 The health care system
In Sweden, the health care system is socially responsible for providing the citizens with
access to good health care, and it has a public commitment to guarantee the health of the
population. Since 1982 and the implementation of the Health and Medical Services Act,
specifying equal access to the health care system, based on need, and stressing the
concept of having equal health for all. The entire health care system is based on three
basic principles, namely the principles of human dignity, of need and solidarity, and of
cost effectiveness. These principals entail that everyone have the same rights and
deserves to be treated with dignity, that the most needy have priority, and that costs in
relation to effectiveness should be considered when facing treatment options and this
should be measured by improvements to health and life quality (Anell et al., 2012).
The foundation of the Swedish health care system as it is today can be traced back to the
formation of the county councils in 1862, when responsibility for national hospitals were
given to the county councils. At this point, the national government still kept control
over mental health institutions and the provision of ambulatory health care outside of the
cities. The responsibility of the psychiatric institutions was given to the counties in the
1960’s. The structure that the Swedish health care system has today is affected by this
early giving of control to the counties, as well as by having a history of public funding.
However, the decentralisation of the health care system does not end with the counties,
since the 1970’s the financial responsibility have been shifted to even more local levels,
to providers within each county. However, the degree of decentralisation within each
county differs. While differences in the solutions of managing and providing health care
between counties are not a problem in and of itself, the self governance have some
negative consequences, such as difference in treatment praxis and results, as well as
coordination between the municipalities and the county. These problems have been
debated during the 2000’s (National Board of Health and Welfare, 2011, and SOU,
2007).
These differences are part of the reason for forces to have an increase national influence
over the health care system, starting in the end of the 1990’s, when there was a regional
centralisation where some counties were merged to larger regions. The regions of Västra
Götaland and the region of Skåne were formed in 1999, in order to increase cooperation
47
between different health care units. Thus the trend of decentralisation was broken and a
period of regional, as well as national, centralisation started. Some of the practical
demonstrations of these efforts are that government agencies are playing a larger role,
e.g. the National Board of Health and Welfare, Socialstyrelsen, provides guidelines for
treatment of chronic illnesses, decision priorities, as well as providing support in the
formation of the regional and local health care programmes. Further, national action
plans have been implemented, with funding from government grants, which are designed
to support and fortify the local resources as well as creating incentives for more
coordination between health care institutions at the local level, e.g. between primary care
units and geriatric and psychiatric care (Anell et al., 2012).
In order to deal with having long waiting list there was a care guarantee implemented in
2005. The basis for the guarantee is a “0-7-90-90” rule, which means that contact with
the health care system should be instant and that the patient is entitled to meet a general
practitioner within 7 days of the first contact, after that a waiting time of maximum 90
days before seeing a specialist and a maximum of 90 days after that to receive treatment.
This applies to all counties and was included in the Health and Medical services Act
when it was changed in 2010. Further it also applies to elective procedures that are
performed within the county council (Anell et al., 2012).
The social insurance in Sweden includes insurance for illness, parental insurance, a basic
retirement pension, supplementary pension, child allowance, housing allowance and
income support. And they are all managed by the Swedish Social Insurance Agency,
which is also engaged in preventative health care measures, such as proactive measures
taken to reduce bad health in order for the individual to return to working (Anell et al.,
2012).
The large extent to which the social insurance covers the Swedish citizens creates a
relatively small market for voluntary health insurance, which mainly is giving the insured
faster access to specialists as well as avoiding waiting times for elective treatments. Even
though the market is small it has been increasing from 103 000 private insurance holders
in 2000 to 382 000 in 2010. However, 80% of these private insurance policies were not
paid by the insured individual, but by the employer (Swedish Insurance Federation,
48
2011), implying that there is an extensive connection to work-related health services
(Anell et al., 2012).
At the national level there are eight government agencies that have responsibilities
directly relating to public health, health care and medical care. They have responsibilities
ranging from insurance, Swedish Social Insurance Agency, Försäkringskassan, to
complaints and disciplinary measures, HSAN, Hälso- och Sjukvårdens Ansvarsnämnd, to
creating standards and norms, as well as supervising that these are followed, offering
support, and data collection, National Board of Health and Welfare, Socialstyrelsen.
Further, the benefit scheme is managed at the national level, as is the evaluation of
implemented health care measures (Anell et al., 2012).
At the national level the regions and local authorities are represented, by SALAR,
Swedish Association of Local Authorities and Regions, Sveriges Kommunler och Landsting,
who is promoting the self government of the regional bodies, as well as giving assistance
to the local authorities (Anell et al., 2012).
A.1.1.1 Regional structure
The regional structure of the health care system is divided into primary care, district
county council care, and regional care. There are six regions created with the purpose of
increasing and facilitating cooperation in tertiary medical care between the counties,
which are the ones providing the health care. It is also the county councils who are
responsible to plan and develop their health care organisation as to meet the changing
needs of the population, e.g. with respect to resource allocation. However, regarding
regional tertiary care, there is a tradition of collaboration with the national level, e.g.
investment in highly specialised care or technology intense services. There is further
support from the national level in the information from the National Board of Health
and Welfare, which is providing the county councils with statistics on demand of health
care of the population, both current and future, in order for the counties to be able to
adapt their supply and resource allocation (Anell et al., 2012).
The health care responsibilities of the municipalities are to provide care for the elderly,
disabled and long term mentally ill, as well as providing care for patients who have been
fully treated at e.g. a hospital, but still needs to receive care in order to recover, either in
49
the form of a rehabilitation- or geriatric care facility or additional care at their home
(Anell et al., 2012).
A.1.1.2 Primary care
Patients register with an accredited primary care provider, either private or public, that is
accredited by the county or region. The primary care has no formal gatekeeping role, but
patients are free to contact a specialist directly, however it is one of the stated
responsibilities of the primary care to guide the patients to the right level and instance
within the health care system and is usually the first health service to contact (Anell et al.,
2012).
Out of 1100 primary care units about one third are privately owned, however, there are
large differences depending on which county or region, ranging from half to almost none
of the primary care units being privately owned (Swedish Competition Authority, 2010).
The main form of primary care unit is a practice with between four and six general
practitioner, GPs, and supporting staff. Having single GP practices are rare (Anell et al.,
2012). However, Glenngård (2012) found that smaller practices, in the sense that there
were less patients registered, were linked to higher patient satisfaction.
According to (Anell et al., 2011) the primary care system in Sweden has adapted to
having a mix of public and private provision and the number of private primary care
facilities have been increasing over the ten years prior to the report. The privately owned
facilities are often publically funded, but this shift can also result in a shift of the
objectives of the primary care, as the investors in the private section will put more focus
on returns to their investments. In order to keep competition in a situation where this
happens it may be necessary for the county councils to support patient choice.
The primary care accounts for more than half of outpatient visits to a doctor (National
Board of Health and Welfare, 2011). There has also, since the 1990’s, been a changing
from inpatient care to more outpatient care, both at hospitals and the primary care units.
The number of outpatient visits in 2009 per person and year was 2,8. Regarding the
primary care visits these were 40 million in total in 2009, but only 14 million of these
were to GPs. This corresponds to 1,5 visits per year and person to a GP, and 2,67 visits
to other staff, mainly nurses. Home visits accounts for 0,14 visits (Anell et al., 2012). The
50
number of GP visits in Sweden is, according to Beckman and Anell (2013), low
compared to other countries. Further, they state that the accessibility to GP visits has,
since reforms to the primary care system regarding patient choice and privatisation,
increased, and more so for members of households that has an income over the median.
A.1.1.3 Hospital care
Health care provided out of hospitals is a large part of health care provision, shown by
e.g. more than half of the counties and regions health care budget in 2009 being for
hospital based care. Further, only 6% of this type of care is privately provided, however
they covered one fifth of all outpatient visits (Anell et al., 2012).
There are two kinds of public hospital groups, firstly, the county council hospitals, which
are about 70 including both local and acute hospitals, accounting for one third and two
thirds, respectively. Secondly there are 7 university hospitals, which are connected to the
six regions mentioned above. Further there are six private hospitals, whereof three are
not-for-profit and three are profit making. The three not-for-profit hospitals have
contracts with the county councils who provide the payment for the patients (Anell et al.,
2012).
The regional or university hospitals are providing a tertiary medical care and are
connected to the six medical regions, as mentioned. Having these regions to concentrate
the university hospitals is beneficial for coordination of tertiary care as well as for
keeping the advanced medical care at a high level and maintaining clinical competence.
This gives the possibility to treat rare illnesses and conditions at only seven locations,
rather than at hospitals all over the country (Anell et al., 2012).
There are about 70 regional hospitals, of which six are privately owned and the rest are
public hospitals. When it comes to the primary care facilities, which count over 1100,
there is considerable differences as to the ratio of public and privately ownership, and it
ranges from a fifty per cent split, in e.g. Stockholm and Halland, to very few privately
owned primary care units in e.g. the north of the country. Accreditation by the county
council is however needed in order to have a private medical practice (Anell et al., 2012).
51
When it comes to emergency care it has become affected by this centralisation of
specialised care, and additionally the acute hospitals needs to cover a large enough
population as to be able to maintain the suitable amount of medical equipment as well as
medical staff. There has thus been a decrease in acute hospitals that are always open
during the last 30 years, however, during the last ten years there has been an increase of
competence in the paramedic staff, having at least one nurse with specialist training (i.e.
one additional year to nursing degree) in each ambulance in most counties, in 2011.
Further the medical equipment in ambulances has been updated, resulting in diagnosing
starting already before arrival at the hospital (SALAR, 2010).
There are problems with long waiting times when seeking acute medical care, however,
interventions to inform when to seek acute care and when not to, are being put in place
rather than having the network of acute hospitals extended, in an effort to avoid having
people seek acute care unnecessarily, and when possible redirect to the primary care
network (Anell et al., 2012). From the patients point of view the waiting times, while an
important factor when choosing care provider, can be outweighed by other factors, more
specifically the possibility to influence the care process, according to Hjelmgren & Anell,
(2007), who also suggest that improvement is needed in this area as well.
The patient pathway in Sweden is quite illustrated by the care guarantee above, first
consulting a GP at the primary care unit where registered, the being referred to a
specialist and receiving treatment (Anell et al., 2012). However, the patient can contact
the specialist directly to make an appointment, but depending on the county or region a
so called self-referral, egenremiss, can be required where the patient describes the condition
and the specialist physician decides if they are best served by them (1177 Vårdguiden,
2013).
A.1.1.4 Patients
Patients are provided information on where to seek medical attention and how on the
websites of the county council or region. There is also the service of 1177.se and the
phone line 1177, which is a collaboration between all the regions and counties, where
patients can look for information on conditions, and where, how and if, they should seek
care. On the website there is a chat service, which, as the phone line, is open at all times,
52
and manned by medical staff. There are also other national and private initiatives aiming
to provide this type of information (Anell et al., 2012).
A national survey on the attitudes of the population towards the health care system’s
performance was introduced in the 1990’s. This survey, Vårdbarometern, is designed in
such a way as to make comparisons between different counties or regions possible.
There are also national quality registers and annual regional and transparent comparisons,
to the end of comparing regional results in health care (Anell et al., 2012).
Since the privatisation and patient choice have increased, having information on
performance, patient satisfaction etc. is becoming increasingly important and more
channels for this information are available (Anell et al., 2012). However, in spite of a
shown interest from the individuals to have the ability to choose their care provider and
to be able to participate in the care process in general (Hjelmgren & Anell, 2007), Swedes
have been found to not actively compare information when selecting their health care
provider (Glenngård et al. 2011).
Patient choice of their health care provider has been gradually introduced since the
1990’s. Historically, there has been no legislation to enforce patient choice, but counties
have had different degrees of it, and in 1991 the Federation of County Councils gave a
recommendation to let the patients choose which primary care provider and which
hospital they preferred within the county. Many counties extended this to include
neighbouring counties as well (Anell et al., 2012). The patient choice was limited before
the privatisation and freedom to establish a medical practice. The law was formally
passed in 2010, when it became mandatory for the counties and regions to have freedom
of establishment of accredited providers of primary care and also making the choice of
primary care provider compulsory. There were countries where this was already standard
practice, the county of Halland implemented this in 2007, Västmanland and Stockholm
counties in 2008, and seven others in 2009 (Glenngård et al., 2011). Thus, today
registration at a primary care unit, public or private, is required, although all counties and
regions, except Stockholm, are practising passive registration of no active choice is made.
The passive registration is based on e.g. the last primary care unit visited or geographical
proximity (Anell et al., 2012).
53
A.1.2 Health care system in numbers
In this section will present the statistics for the indicators of the Swedish health care
expenditures, the state of the health care system and the health status of the population.
Tables are found in the appendix.
A.1.2.1 Health care expenditure
In Sweden the health care expenditures accounts for 9,36% of the gross domestic
product, GDP, in 2011. A percentage that since 2000 has ranged of 8,18 and 9,94%, but
that in general has been close to 9% of the GDP. This corresponds to a per capita
expense in 2011 of 3924,8 PPP adjusted dollars, and when looking at the time trend, the
per capita expenditures has been increasing every year since the year 2000 when it was
2286,4 PPP dollars, see Table 1. The per capita expenditures on in-patient care in 2011
was 1114,5 PPP dollars, which is 28,4% of the total expenditure. The trend since 2000 of
the in-patient care expenditures is also increasing, but as a percentage of total
expenditure it fluctuates between 28,4% in 2010 as well as in 2011 and 31,6% in 2003. In
2000 it was 4,6%, which does not close to any of the percentages for the following years,
which are in the range presented, see Table A.1 (HFA-DB, 2013).
As a percentage of GDP the spending for health care provided by the public sector
amounted to 7,58% in 2011, see Table A.1. This corresponds to 81,6% of the total health
care expenditures. This ratio has been quite steady around 81-82%, apart from in 2000
when it was almost 85% of the spending that went to the public care, see Table 1. When
looking at inpatient care, this ratio is higher, going from being 100% in 2000 to lying
around 98% in the following years. Out of the entire government spending the health
care expenditures on public health is 14,78%, which since 2000 has been increasing, see
Table A.1 (HFA-DB, 2013).
The private sector health care expenditures corresponded to 1,78% of GDP in 2011,
lying between 1,5% and almost 2% since 2001. The private sector accounts for 19,06%
of total health care expenditures in 2011, with a range from 17,96-19,06% from 2001,
and in 2000 it was even lower, 15,12%, see Table A.1 (HFA-DB, 2013).
The amount of out of pocket payments from private households was equal to 16,92% in
2011 of the total health care expenditure and ranges from 13,78% in 2000 to 16,92% in
54
2011. When looking at the households’ out of pocket payments as a percentage of the
private sector expenditures, however, the number was 88,78% in 2011, with some
fluctuation since 2000, when it was 91,14. The lowest point was in 2002, with 86,6%, see
Table A.1 (HFA-DB, 2013).
Looking at pharmaceutical expenditures, this made up 12,1% of total health care
expenditure in 2011 and there has been a decreasing development since the beginning of
the 2000’s. Out of total pharmaceutical expenditure the public spending accounts for
58%, a ratio that has been decreasing from 70% in 2000. However, in absolute terms the
per capita spending on pharmaceuticals has been increasing from 315,9 PPP adjusted
dollars in 2000 to 474 PPP dollars in 2011, see Table A.1 (HFA-DB, 2013).
A.1.2.2 Hospitals and patients
Acute care hospitals refer to short stay hospitals, which are providing diagnostics and
treatment on an in-patient basis. Treatments can be either surgical or non surgical, and
the hospitals are providing care for a wide range of medical conditions. Speciality
hospitals are not included in this category (HFA-DB, 2013).
WHO Regional Office for Europe defines discharges as the conclusion of treatment, and
upon that conclusion the patient is sent home, transferred to another facility or has died.
Cases where the hospital stays were shorter than 24 hours are registered separately
(HFA-DB, 2013).
In Sweden there were 77 hospitals in 2012, according to Anell et al. (2012). This is a
decrease from the 89 hospitals in 2000, however, there was a strong decrease in the
following three years, see Table A.2. This decrease lead to the number of hospitals per
100 000 inhabitants decreasing as well. The trend was the same for acute care hospitals.
The number of hospital beds have also been decreasing and was 270,56 beds per 100 000
inhabitants in 2011, compared to 358,02 beds per 100 000 in 2000. Of those beds, acute
hospital beds accounted for 201,16 beds per 100 000 in 2011. They have also been
decreasing since 2000, when there were 247,58 acute hospital beds per 100 000 people,
see Table 1 (HFA-DB, 2013). For Sweden there were no data on the share of hospital
beds that were private from the European Health For All Database, but according to
Anell et al. (2012) there are six private hospitals in Sweden, providing 1100 hospital beds.
55
To put this into some context, there were a total of 25 566 hospital beds in 2011, see
Table A.2 (HFA-DB, 2013).
The number of in-patient discharges in 2011 was 16,45 out of a 100 population for all
hospitals and since 2000 it has been close to 16%. The average length of stay, for all
hospitals was 5,53 days in 2011 and it has been decreasing from an average stay of 6,66
days in 2000, see Table A.2 (HFA-DB, 2013).
Looking more specifically on acute care, or short stay, hospitals the number of
discharges per 100 inhabitants was 15,51 in 2011. There has not been large fluctuation,
but it has been close to 15 discharges per 100 inhabitants since 2000. The average length
of stay at the acute care hospitals was 5,13 days in 2011. The development of the average
length of stay has also been decreasing from 5,89 days in 2000, see Table A.2 (HFA-DB,
2013).
The average number of visits to primary or ambulatory care per person, as an outpatient,
was 3,05 visits in 2011. The number of visits has been around or slightly below 3 per year
since 2000, when the average number of visits was 2,8, which is also the lowest notation,
see Table A.2 (HFA-DB, 2013).
A.1.2.3 Physicians
Breaking down the physicians into groups of specialties, five groups are considered,
namely: general practitioners, paediatric specialities, obstetric and gynaecological
specialties, surgical specialties and medical specialties. The last refers to a broad group of
specialities that focus on diagnosing a non-surgical treatment of medical conditions1.
Further, the numbers are reported as physical persons, rather than in the full time
equivalent form (HFA-DB, 2013).
1 Including: Internal medicine, cardiology, endocrinology, gastroenterology, pulmonology, respiratory
medicine, oncology, gynaecologic oncology, immunology, rheumatology, neurology, oto-rhino-laryngology,
radiology, infectious diseases, microbiology-bacteriology, haematology, dermatology, pathology,
occupational medicine and medical interns or residents training in these specialties. The following are not
included: Surgery, obstetrics and gynaecology, paediatrics, psychiatry and general practitioners.
56
The physician density in Sweden has been increasing from being 3,5 physicians per 1000
inhabitants in 2005 to being 3,9 physicians per 1000 inhabitants in 2010, see Table 1
(OECD, 29, 2013). The density of physicians in the medical specialities has been
increasing since 2000, from 69,88 to 87,61 medical specialised physicians per 100 000
inhabitants in 2010. When looking at the surgical specialties, the increase for the same
period of time has been from 49,59 to 62,52 physicians with a surgical specialty per 100
000 inhabitants. There has been an increase of obstetric and gynaecological specialised
physicians from 12,47 to 14,22 per 100 000 inhabitants, still during the same time frame.
For the paediatric specialties the same increase was from 9,06 to 10,36 paediatric
specialised physicians per 100 000 inhabitants. Finally the general practitioners increased
from 52,91 to 62,86 GPs per 100 000 inhabitants. The development in total terms, from
2000 and 2010, respectively, for the different groups were: for medical specialities 6 200
– 8 216, for surgical specialities 4 400 – 5 863, for obstetric and gynaecological
specialities 1 106 – 1 334, for paediatric specialities 804 – 972 and for GPs 4 694 – 5 895,
see Table A.3 (HFA-DB, 2013).
A.1.2.4 Population composition
The crude death rate per a 1000 population was 9,65 deaths in 2010, and this number has
been decreasing over all since 2000, when there were 10,54 deaths per 1000 people. The
total fertility rate has increased a bit, from 1,55 in 2000 to 1,9 in 2011. The part of the
population participating in the labour force, was 51,88% in 2007, the most recent
observation from WHO Regional Office For Europe, but the participation rate has been
quite constant at slightly above or slightly below 52%, see Table A.4 (HFA-DB, 2013).
The part of the population that was between 0 and 14 years old was represented by
16,6% in 2010, and there has been a decrease of this age group since the year 2000, when
it was 18,43% of the population. The part of the population aged above 65 has increased,
from 17,26% in 2000 to 18,28% in 2010. Further, when looking at the male and female
population separately, 17,13% of all males were between the ages zero and 14, in 2010,
and 16,09% of the female population for the same age group. Compared to in 2000 this
share has decreased for both male and females, which then constituted 19,13 and 17,75%
of their respective populations. Further the part of the male population over 65 years old
was 16,42% in 2010 and the share of the female population for the same age group was
20,12%. Comparing this with the constitutions of the male and female populations,
57
respectively, in 2000 there were 14,8% of the males aged over 65 years old, and 19,68%
for the females, thus showing an increase in this age category for both genders, see Table
A.4 (HFA-DB, 2013).
A.1.2.5 Life expectancy
Life expectancy at birth was 81,77 years in 2010, which is an increase from 79,92 years
ten years earlier, see Table 2. Having reached the age of 1 the life expectancy was 80,89
years in 2010, compared to 79,19 in 2000. The predicted total number of life years is thus
81,89 for the 2010 life expectancy predictions and 80,19 for the 2000 life expectancy.
Life expectancy at age 15, in 2010, was 67,08 years, giving a predicting 82,08 life years.
For 2000 the same numbers were a life expectancy of 65,31, thus predicting 80,31 life
years. When the individual has reached 45 years of age the life expectancy was 37,88
years in 2010, summing to 82,88 life years. In the year 2000 the life expectancy at age 45
was 36,25 years, giving a total predicted number of life years of 81,25. At 65 years old the
life expectancy was 19,95 years in 2010, thus predicting a total number of life years of
84,95 years, compared to the same numbers from 2000, where life expectancy was 18,68
years at 65 years old, and a total number of 83,68 years of life. The World Health
Report’s estimation of total life expectancy for the year 2000 and the year 2011 was, 80
and 82 years, respectively, see Table A.5 (HFA-DB, 2013).
The male life expectancy at birth was 79,73 years in 2010, compared to 77,92 years in
2000, see Table 2. At the age of 1, the life expectancy in 2010 was 78,95 years and in
2000 it was 76,81 years, corresponding to 79,95 and 77,81 life years, respectively. When
the average man is 15 years old the life expectancy in 2010 was 65,05 and in 2000 62,93,
giving him a total number of 80,05 and 77,93 life years, respectively. At 45 years of age
the life expectancy was 36,07 years in 2010 and in 2000 it was 34,14, summing up to
81,07 life years in 2010 and 79,14 life years in 2000. At 65 years old, the life expectancy
of the average man was 18,43 years in 2010 and 16,81 in 2000, which amounts to 83,43
and 81,81 years of life, for the 2010 and 2000 numbers, respectively. The World Health
Report estimated the life expectancy for males in 2000 to be 78 years and in 2011 to be
80 years, see Table A.5 (HFA-DB, 2013).
The female life expectancy at birth was 83,74 years in 2010 and in 2000 it was 82,26
years, see Table 2. At the age of 1 the life expectancy was 82,94 years in 2010 and in 2000
58
it was 81,49 years, in total life years the females thus have 83,94 years and 82,49 years,
based on the 2010 and 2000 life expectancy, respectively. By the age of 15 the life
expectancy in 2010 was 69,05 years and 67,6 in 2000, amounting to 84,05 and 82,6 years
of life, respectively. When the average woman is 45 years old, the life expectancy in 2010
was 39,59 years and in 2000 it was 38,24 years, which sums the total life years to 84,59
and 83,24 years, respectively. At the age of 65 the life expectancy was 21,3 years in 2010
and 20,32 years in 2000, totalling the years of life at 86,3 and 85,32 years, respectively.
The World Health Report estimated female life expectancy in 2000 and 2011 at 82 and
84 years, respectively, see Table A.5 (HFA-DB, 2013).
A.1.2.6 Healthy life years
In absolute terms, the healthy life years a woman was expected to have at birth was 70,7
years, which is an increase from 60,8 healthy life years in 2004, see Table 2. By the age of
50, the average woman could expect to have 26 additional healthy years, compared to
19,4 in 2004. When the average woman reaches 65 years old she would be expected to
live healthily for an additional 15,4 years, which is an increase from the 2004 value of
11,1 healthy years, see Table A.6 (Eurostat, 2013a).
At birth the average man was expected to have 70,9 healthy life years in 2012 and in 2004
the same number was 62 healthy life years, see Table 2. At the age of 50, the healthy life
years were expected to be 25,2 in 2012, compared to 19,1 healthy years in 2004. By the
age of 65 the average man would be expected to be healthy for another 14 years, which is
an increase from the same number in 2004, which was 10,1 years, see Table A.6
(Eurostat, 2013a).
When basing healthy life expectancy on the self perceived health, it is found that the
average Swedish woman will have 80,2 healthy years at birth, in 2012, which is an
increase from 2004, when it was 76,7 healthy years. At age 50 the expected healthy life
years were 32,2 in 2012, and the number has been increasing compared to 2004 when it
was 29,8 healthy years. By the age of 65 the average woman could expect 19,6 healthy life
years, compared to 17,8 in 2004, see Table A.6 (Eurostat, 2013a).
For males, the healthy life expectancy based on self-perceived health was 77,1 healthy
years at birth in 2012, compared to 74,2 healthy years expected in 2004. By the age if 50,
59
the self perceived health data estimates that there will be 29,5 additional healthy years in
2012, which has been increasing from 27,6 healthy years in 2004. When 65 years old, the
average man could expect 16,9 healthy life years in 2012, compared to 17,8 healthy years
in 2004, see Table A.6 (Eurostat, 2013a).
A.1.2.7 Self-perceived health
In 2012, the part of the Swedish population that perceived their health to be very good
were 35,8% of the population, a number that has been varying between 34 and 39,1%
since 2004. 45% of the population perceived their health to be good, and this share has
been increasing since 2004, when it was 35,3%, see Table 2. The share of the population
perceiving their health to be fair has decreased from 21,0% in 2004 to 14,7% in 2012.
The decreasing trend continues for the part of the population perceiving themselves to
be in bad health, from 5,6% in 2004 to 3,1% in 2012. The part who thinks they are in
very bad health corresponds to 1,2% in 2012, and this share was larger in 2004 and 2005,
1,7 and 1,6%, respectively, but was then lying steady at 1% for the remaining years, see
Table A.7 (Eurostat, 2013a).
The trends of the male and female parts of the populations follow the same over all time
trends as the total population, with a relatively large increase in the good health category,
and different levels of decreasing for the other categories, see Table A.7 (Eurostat,
2013a).
Among the males 38,2% perceived themselves to be in good health in 2012, 44,8% in
good health, 13,2% in fair health, 2,9% in bad health and 0,9% in very bad health. For
the women the corresponding perceptions about the own health are 33,4% in very good
health, 45,7% in good health, 16,2% in fair health, 3,2% in very bad health and 1,4% in
very bad health, see Table A.7 (Eurostat, 2013a).
A.1.2.8 Morbidity
In Sweden the share of the population that has a long-standing illness or health problem
has decreased since 2004, from being 49% to being 33,8% in 2012, see Table 2. Looking
closer at some age groups, there were 17,9% of the population between 16 and 24 years
old suffering from a long-term illness or health problem in 2012. Among the 24-34 year
60
olds, 21,6% had a long-term health problem, and the same number for the 35-44 years
olds was 28,3%, both in 2012. Further for the 45-54 year olds 33,7% had a long-term
health issue. Among the 55-64 and 65-74 there were 44 and 42,9%, respectively with a
long-term illness or health problem. Finally, for the persons aged 75 or older, 53%
suffered from a long-term illness or health problem, see Table A.8 (Eurostat, 2013a).
For all age groups there has been a marked decrease since 2004, and the 2004
percentages are, 27,5% for 16-24 years old, 33,4% for the 25-34 year olds, 39% for the
35-44 year olds, 48% of the 45-54 year olds, 62% for the 55-64 years olds, 71% of the
65-74 years olds and 80,4% for 75 years and older, see Table A.8 (Eurostat, 2013a).
Looking at the male population separately, a total of 30,4% had a long standing illness or
health problem in 2012, a decrease from 2004, when there were 47,4%. The
corresponding numbers for the age groups are presented for 2004 and 2012, respectively:
for 16-24 year olds there has been a decrease from 27,8 to 15,1%, for 25-34 year olds a
decrease from 33 to 20,8%, for 35-44 year olds a decrease from 36,3 to 27,2%, for 45-54
year olds a decrease from 48,7 to 33,7%, for 55-65 year olds a decrease from 60,1 to
40,3%, for 65-74 year olds a decrease from 68,9 to 38,3%, and for 75 years and older a
decrease from 77,9 to 53,1%, see Table A.8 (Eurostat, 2013a).
For the females the percentages with a long standing illness or health problem, for the
years 2004 and 2012, respectively were: for all age groups a decrease from 52 to 37,2%,
for the ages 16-24 a decrease from 27 to 20,8%, for the ages 25-34 a decrease from 33,9
to 22,4%, for the ages 35-44 a decrease from 41,19 to 29,4%, for the ages 45-54 a
decrease from 49,4 to 40,3%, for the ages 55-64 a decrease from 64,1 to 47,7%, for the
ages 65-74 a decrease from 73,1 to 47,4%, and for the age 75 or older a decrease from
81,9 to 54% of the population, see Table A.8 (Eurostat, 2013a).
Of the people suffering from a health problem, 9,4% stated in 2012 that they have some
long standing limitations in their usual activities due to their illness or health problem.
This is a decrease from 2004 when there were 13% of the population stating the same
thing. There were fewer people stating in2012 that they had severe problems, 6%, but
more when looking at the 2004 share, which was 13,9%. Since both the share stating that
they have severe and some problems have increased, the share stating that they have no
61
problems have increased, from 73,1% in 2004 to 84,6% in 2012, see Table A.8 (Eurostat,
2013a).
As for the male half of the population, 7,9% stated that they experience long term
limitations in their usual activities, caused by an illness or health problem. This has
decreased since 2004, when 11,7% stated the same thing. The part stating that they have
severe limitations accounted for 5% of the males having a long-term health problem,
which is also a decrease from the 2004 share of 11,9%. Thus, the share having no
limitations has been increasing since 2004, when there was 76,3% having no limitations,
to 87,1% in 2012, see Table A.8 (Eurostat, 2013a).
Among the females, the same numbers are, for some limitation 11% in 2012, a decrease
form 14,2% in 2004. For severe limitations, there were 6,9%, also this is a decrease from
2004, when there were 15,8% stating the same thing. As for the share stating that they
experience no limitation in their usual activities due to a long-standing health issue there
were 82,1% in 2012, an increase from 69,9% in 2004, see Table A.8 (Eurostat, 2013a).
In 2011, 53,6% of the male Swedish population reported that they were overweight or
obese, i.e. had a body mass index, BMI, of 25 or higher. There has been an increase since
2004, when the same self-reports stated that 50, 3% were overweight of obese, see table
A.8.34 (OECD, 26, 2013). For women, the same self reported numbers amounted to
39,0% of the women reporting a BMI of 25 or higher. Comparing this to the 2004, when
35,4% of the women reported that they were overweight or obese, there has been an
increase in obesity, see Table A.8 (OECD, 25, 2013).
A.1.2.9 Infant and maternal health
Infant mortality in Sweden has been decreasing since the year 2000, when it was 3,42
infants per 1000 live births that died, to a corresponding number of 2,54 in 2010, see
Table 2. Breaking it down and looking at males and females separately, the development
has been that in 2000 there were 3,99 deaths per 1000 live births for males, compared to
2,69 in 2010. Among females there were 2,81 deaths per 1000 live births in 2000 and
2,38 deaths in 2010, see Table A.9 (HFA-DB, 2013).
62
The maternal death rate has also been decreasing since 2000, from 4,42 deaths per 100
000 live births, to 0,89 deaths per 100 000 live births in 2011. However, it is of note that
the maternal death has fluctuated some, and was in 2010, 2,59 deaths per 100 000 live
births, and the maximum value during the time period included here was 5,92 in 2005,
see Table 2 (HFA-DB, 2013).
The number of abortions per 1000 live births was 342,54 in 2000. During the following
eight years it stayed in the low and mid- 340’s and then it has been below, and was
337,75 in 1000 live births in 2011. However, the years before there were 325,95 abortions
per 1000 live births, see Table A.9 (HFA-DB, 2013).
In 2011, 98% of Swedish infants were vaccinated against diphtheria, tetanus, pertussis
and poliomyelitis, 96% against measles, 23% against tuberculosis, 98% against invasive
disease due to haemophilius influenzae type b, and 29% against hepatitis b. Vaccination
against rubella was 97% of all infants in 2010, see Table A.9 (HFA-DB, 2013).
A.1.2.10 Patient satisfaction
Here the percentage of the respective populations that stated that they had no unmet
needs, with regards to the medical examination they received, will be presented and this
measure will be considered as satisfaction, i.e. the assumption is that if there are no
unmet needs to declare, the patient is satisfied with the examination and care received.
This is in all cases the vast majority of the population, and the remaining categories for
dissatisfaction are several, and thus the percentage for each category will be rather small,
however, the numbers for waiting lists will be presented, since this is one of the noted
differences between the structure of the different health care systems. The remaining
categories will be treated as having unmet needs in general.
Among the total population there were 88,5% of the population that stated that they had
no unmet needs in terms of the medical examination they received in 2012, which means
that there were a total of 11,5% that reported that they had unmet needs. In 2004 there
were 87,2% with no unmet needs, a number that decreased to 84,7% in the following
year, since then it has been increasing. There were 0,8% in 2012 that were unhappy with
the service they received due to long waiting lists. In 2004 there were 1,7% of the
63
population stating the same, and there was an increase in 2005 to 2,1%, and after that it
has been decreasing, see Table 3 (Eurostat, 2013b).
Looking at two broad age groups, 16-64 years old and 65 and older, the number of
satisfied patients was 86,8% in 2012, for the ages 16-64. The development since 2004 has
been varied, with maximum and minimum values of 87,4% in 2010 and 83,5% in 2006.
For this age group a total of 16,5% stated that they had unmet needs in 2012, and of
those, there were 0,9% that stated that the cause of their unmet need was the waiting list.
For the older age group, 65 years and older, 93,6% had no unmet needs to declare in
2012, a number that has been increasing over all since 2004, when it was 90%. This
entails 12,4% of this age group who were not satisfied with their health care experience
in 2012, and 0,7% of the age group stated that their unmet need was due to the waiting
lists. This last number has been decreasing over all since 2004, when it was 1,6%, see
Table A.10 (Eurostat, 2013b).
64
Appendix 2. France
A.2.1 The system
Historically the French health care system has been marked by having many actors both
in providing and the funding of health care. Today however, it is defined by Chevreul et
al. (2010) as a mix, a Bismarck system with Beveridge goals. It is also described as a
system where patient choice is extensive and the coverage of the benefit system is
generous.
Over the last 20 years the French health care system has undergone several reforms as to
the institutional organisation, most significant of those were the 1996 ”Juppé reform”
and the 2004 Health Insurance Reform act. The former of the reforms gave the
parliament control of the health care system as well as the resources. It also aims to
define the roles of the state and the SHI, the statutory health insurance, of which the
means of funding were changed, as the part of the funding that was based on income
now was levied like a tax on the total income. Further, this reform added to the role of
the regions, partly by the creation of several new regional institutions, while at the same
time, decisions about the policy directions and targets for expenditures were now being
made by the parliament. With the latter of the reforms, the parliament was given
increased control in the settings of health priorities, the SHI was given national
management and an “alert committee” was established, which if the SHI’s, parliamentary
approved, maximum expenditure exceeded by more than 1%, can request a financial
rescue plan from the Directorate of Social Security (Chevreul et al., 2010).
In France, as in many other countries the costs of the health care system is increasing,
and since 2000, at a higher rate than the national wealth. Therefore, the French
government have been arguing for implementing cost containment objectives into future
health care reforms (Chevreul et al., 2010).
According to Dormont et al. (2006) the ageing population does not affect the health care
expenditures at a macro level, except for when proximity to death is taken into account,
but that GDP has a large impact. The effect of the GDP on health care expenditures,
and the lack of effect of the age structure of the population were also found in e.g. Bac
and Cornilleau (2002).

65
A.2.1.1 Regional structure
Historically, the French health care system has been rather centralised, especially with
regards to policy and financing, there has been an unwillingness to reduce central control
and delegate these responsibilities to the regions. However, the process of regionalisation
started in the 1990’s and until 2010, there were many regional institutions with a
specialised area of health care to manage in each of the regions. In 2010, the Regional
Health Agency, Agence Régional de Santé, ARS, was created, it had been conceptualised
earlier, in the 2004 Health Insurance Reform Act, but had not been implemented then.
ARS merged several of the regional and departmental institutions charged with providing
and funding the public health care, in order to achieve higher efficiency and improving
the response to the needs of each region. More specifically the ARS is charged with
monitoring the health status of the population in the region, and carrying out the health
policies for the services regarding occupational health, maternal and child care, and for
the health services at schools and universities. Further, they are charged with evaluating
the education of the employees in the health care sector and approving new treatments
for elderly and disabled, as well as charges regarding health and environment, such as
monitoring water and air quality (Chevreul et al., 2010).
In each of the departments there is a local delegation, délégation territorial de l’agence regionale
de santé, representing the ARS, since each ARS covers several departments. This
delegation is charged with supporting the departments and implementation of regional
policies set by the ARS. The departments itself has certain responsibilities with regards to
health care that are not under the responsibility of the ARS. These are care of the elderly
and disabled, and preventative measures for certain diseases, such as sexually transmitted
diseases, cancer and tuberculosis (Chevreul et al., 2010).
A.2.1.2 The Social Health Insurance
The foundation of the statutory health insurance, SHI, is laid after the Second World
War, and is developed from being a system of several individual insurance funds
connected to employment to being a system that covers as good as the entire population.
The procedures and technologies that are listed by the SHI also serves as an implicit
basic care package (Chevreul et al., 2010).
66
The system of universal coverage were established in 1999 CMU Act, Couverture Maladie
Universelle, or Universal Health Coverage Act, which was implemented January 1st 2000.
The coverage of the SHI is, while universal, not covering 100% of all expenses. A part of
the cost is left to the patient and how large a part the patent has to pay depends on the
type of care. There are exemptions from this, where costs are covered completely, and
there are three categories of exemptions. Full cost coverage is provided firstly when there
is an issue with health status, most commonly when suffering from one of 30 defined
long-term illnesses, ALD, affection de longue durée, secondly when there is a exemption due
to the nature of the treatment, which covers certain in-hospital treatments and thirdly,
when there is ground for exemption due to several categories linked to the person, such
as work related incidents, disabled children, pensioners and women pregnant more then
five months. However, on average the SHI covers 75% of the costs of the procedure
they have approved, but there are no exemptions on economic grounds. There is
voluntary health insurance, VHI, which increases the coverage to 100% (Chevreul et al.,
2010, and Thomson & Mossialos, 2004).
Since no exemptions are made on economical ground from the normal SHI coverage the
Couverture Maladie Universelle Complémentaire was introduced in 2000 as a free insurance
plan. It offers a higher level of insurance coverage, with no out of pocket payments, to
the poor, and is designed to increase access to health care for individuals with an income
below a certain level (Grignon et al., 2008).
The services that are covered by the SHI have previously been steadily increasing as the
general practice has been to add procedures, devices and pharmaceuticals have been
added to the benefit package, but the old items have not been taken off, even if new
more effective solutions have been found. However, more recently debate has lead to an
acceptance of reducing the included medical services and goods covered, and a reduction
of what is included (Chevreul et al., 2010).
There are separate lists for what is included in the SHI coverage, depending on if it is
regarding in- or out-patient care, specifying what medical procedures, devices and
materials, as well as which pharmaceuticals and drugs are included in the benefit scheme,
and thus refunded by the SHI. New and innovative procedures are usually first used in
67
hospital, given that they have been approved for market use, authorisation de mise sur
marché, AMM. After introduction in hospitals the procedure may be included for general
practice on one of the SHI lists (Chevreul et al., 2010).
A.2.1.3 Primary care
Reforms have been made to bring more structure to the primary care, which have
historically had a large number of provider and financers, like the entire system. In 2004
the current framework for the primary care was established, according to which public
health is a responsibility of the state, and also that the regions would manage the
organisation of the provision of public health care, since 2009 through the ARSs
(Chevreul et al., 2010).
The provision of primary care is given by either self employed medical professionals or
in an ambulatory care facility by salaried professionals, the latter being less common.
However, incentives for people to consult their GP as a first step were put into place in
the end of the 1990’s, when the GPs were given a partial gatekeeping role. The health
care professionals that are self employed work under a set of agreements between the
SHI and representatives for the medical professionals, concerning the conditions for
practice, charging rates etc. (Chevreul et al., 2010).
The better part of all out-patient care, including rehabilitating care after e.g. surgery, is
also provided by the physicians that are self employed with their own practice, both
when it comes to GPs and specialists, and in 2009 these self employed physicians
numbered 122 500. Circa 40% of all self employed physicians are part of a group
practice, which usually refers to having common capital investments, not the sharing of
patient lists (Chevreul et al., 2010).
Further, French GPs are seeing on average 1400 different patients in a year, and about
15% of those are home visits. The number of patients seen by specialist depends largely
on the specific specialisation, but generally the specialist spends 55% of his or her time
on doing consultations and 45% on diagnostics and treatments. When it comes to nurses
there were 70 000 self employed in 2008, who were spending two thirds of their time on
home care and one third on e.g. injections, and other care that the patients cannot
perform themselves (Chevreul et al., 2010).
68
Having this large amount of single, or small, practices creates a coordination problem as
well as a continuity problem of the services provided by the physicians, which in turn
results in, not only, over prescription and subsequent waste, but also a lack of clear
pathways and insufficiencies as well as inconsistencies in quality of the services provided.
To counteract this the GPs were given gatekeeping properties, as mentioned above, and
provider networks were established as a way of creating forums for coordination
between self employed health professionals, as well as between the health professionals
and hospitals. Both of these reforms were implemented in the later half of the 1990’s
(Chevreul et al., 2010). However, the gatekeeping role of the GPs mainly entails directing
patients to their GPs as a first step, which have not had any effect on the contracts for
GPs. Additional education and training should be, but have not yet been implemented
(Or et al., 2010).
However, the two main problems the ambulatory care sector faces are those of efficiency
and the decreasing work force of the health care sector. The ARS is in charge of both of
these issues, but since it is still a new institution, impemented in 2010, there are concerns
about the control it can exercise over the ambulatory care sector, and impose stricter
regulation on it, specifically since many of the professionals in this sector oppose this
kind of changes (Chevreul et al., 2010).
A.2.1.4 Hospital care
The share of acute hospital care that are provided in public hospitals is 75%, while profit
making private hospitals mainly specialises in a narrower range of technical procedures
where they can make profits. This entails e.g. invasive diagnostic procedures. The not-
for-profit private hospitals are providing the better part of cancer treatment.
The share of acute hospital care that are provided in public hospitals is 75% and the
public sector performs a third of all surgical procedures. The surgical services offered are
wide ranging, and include the complex procedures. Profit making private hospitals
mainly specialises in a narrower range of technical procedures where they can make
profits, entailing e.g. invasive diagnostic procedures. When it comes to surgery, the profit
making hospitals also have a narrow range of provision, mainly focusing on procedures
that are routinely performed and where the length of stay is predictable as well as short.
69
Examples are surgeries for cataract, varicose vein and carpel tunnel, which are areas
where the private profit making sector are performing a majority of surgeries. The not-
for-profit private hospitals are providing the better part of cancer treatment, and their
surgical activities are also mainly related to cancer (Chevreul et al., 2010).
The French health care regulations regarding emergency care focuses on the following
areas, emergency care before arrival at hospital, the organisation of emergency units at
the hospitals, and the availability of hospital beds after admission by the emergency units.
The pre-hospital emergency services consist of the SAMU, Services d’Aide Médical Urgente,
which is the emergency call centre and the continuity of care system, PDS, Permanance des
Soins. The SAMU provides the immediate emergency care, and the call centre is shared
by the police and fire department. The PDS are providing timely care to patients after the
closing of ambulatory care centres, and is largely based on the voluntary participation of
doctors, who are given financial incentives to provide their services (Chevreul et al.,
2010).
In the hospitals there are 630 emergency units, and operating such a unit requires
certification, which is done in three steps, general, local and specialised emergency units.
The category general refers to the ability to provide care for every kind of emergency and
the public sector provides almost all of the units with this classification (97%). The local
classification has a more limited range of capacity both with regards to physical and
human resources, but can refer the cases they are unable to provide the proper care for.
The specialised category has a specialisation either with a type of pathology or group of
patient, e.g. paediatric emergencies, or heart attacks (Chevreul et al., 2010).
A.2.1.5 HAD
During the last 30 years there has been a development towards, and promotion of,
alternatives to full time hospitals stays (Chevreul et al., 2010). This has lead to the
development of so-called hospitals at home, Hôpitaux à Domicile, HAD, which has
become a network for care within the scope of the larger health care system (Com-Ruelle
& Afrite, 2008). This entails sending the medical staff to the home of the patient instead
of having the patient stay at the hospital, mainly in cases of rehabilitation and follow up
situation or regarding diseases where the patient is in need of technical assistance
(Chevreul et al., 2010), mainly for the areas of palliative care, cancer and perinatal care.
70
This service is provided either as a unit of the hospital or as an independent not-for-
profit organisation, the majority being the not for profit organisations (Afrite et al.,
2009). The three main notions of the HADs are that, firstly, it is a substitute for cases
where in-patient hospitalisation would otherwise be needed, resulting in complete
avoidance, shortening or delay of the stay in the hospital. Secondly, it plays into the
global plan of the health care, being a part of the system and a viable option to in
hospital stays, and thirdly, that there is coordination, both between the HAD and the
hospitals, but also between the personnel providing the care within the HAD (Chevreul
et al., 2005). HADs have also been proven to be a less costly alternative to acute care
(Afrite et al., 2007).
There were 233 HAD units in 2008, with a maximum of 8400 patients at once, and the
number of units are increasing, largely due to increased demand from the ageing
population (Chevreul et al., 2010).
A.2.1.6 Evaluation of quality
Evaluation of the health care quality and medical practice began in the 1990’s, a practice
that has, like in many other countries, become increasingly important (Saltman &
Figueras, 1996). Specific evaluation of the quality of hospital care has been done since
the 1990’s, when it became a matter of public interest and debate after the press made
comparisons pointing out that there were differences in the quality of care provided by
different hospitals. Since 1996 a periodic auditing, called certifications, has been in place
covering all hospitals and clinics, where an external assessment is made of quality and
safety on areas such as the infrastructure of care, but the quality of care outcomes are not
included to any extent. There have been two waves of evaluation, the first started in 1996
and the second in 2005, however, there are optional audits covering some high risk
procedures, that were put into place in 2004 (Chevreul et al., 2010).
The physicians are, and have been, entirely free to choose where they want to practice,
causing long-term geographical differences in the access to health care. There are also
differences in the availability of personnel for acute care, but notably not in the physical
capacities where regional differences are lower (Chevreul et al., 2010).
71
A.2.1.7 Patients
The general patient pathway is for the patient as a first step to contact their GP, or
alternatively to contact the specialist at one, but at an additional fee that is not charged if
they receive a referral from the GP. The patient is free to visit any specialist, but an
additional fee may be charged in certain cases if the patient chooses to visit another
specialist than the one he or she is being referred to. After receiving treatment, in
hospital if necessary, either if it is in- or out-patient treatment, when it is appropriate the
patient can receive treatment in the home, HAD (Chevreul et al., 2010).
By law, the French patients are to receive information about the procedures and care
they are receiving, which is to be provided “faithfully and understandably” and according
to court ruling these criteria are not met by the simple signing of a document. Even
though this is commonly done, the way of relaying the information given to the patient
prior to any medical procedure is instead noted in the patient’s chart, which the patient
has access to (Chevreul et al., 2010).
Patient choice is one of the defining characters in the French health care system, but in
areas that are sparsely populated, the annual report of 2006 from the high council for the
future of the health insurance, rapport annuel du Haut Conseil pour l’Avenir de l’Assurance
Maladie, HCAAM, stated that there is difficulty finding a medical professional that does
not charge an extra fee for his or her services, a practice known as “extra billing”, and
that when extra billing was not possible, private physicians would refuse 40% of patients,
if the physician usually billed extra.
A.2.2 Health care system in numbers
In this section will present the statistics for the indicators of the French health care
expenditures, the state of the health care system and the health status of the population.
Tables are found in the appendix.
A.2.2.1 Health care expenditure
The French health care expenditures in 2011 amounted to 11,64% of the GDP and over
all since 2000 it has been increasing, from being 10,08%. The highest notation was in
2009, at 11,74% of the GDP. This corresponds to a per capita expenditure of 4117,9
72
PPP adjusted dollars in 2011, and the development of this has been increasing every year
since 2000, when the per capita expense was 2544,4 PPP dollars, see Table 1. The per
capita expenditure on in-patient care in 2011 was 1528,8 PPP dollars and it has been
increasing since 2000 when it was 975,7 PPP adjusted dollars per capita. As a percentage
of total health care expenditure the in-patient care represents 37,1% in 2011, and the
share has been between 38,3% in 2000 and 36,5% in 2004, see Table A.1 (HFA-DB,
2013).
The public sector health expenditures amounted to 8,92% of GDP in 2011. The share of
GDP has been lying between 8 and 9% since 2000, see Table A.1. As a share of total
health care expenditure the public spending accounts for 76,8% in 2011, but the share
has been decreasing since 2000 when it was 79,4% of total expenditures, see Table 1.
Regarding the share of in-patient care tat is public the percentage has also been
decreasing somewhat since 2000, when it was 94,4% and in 2011 it was 93%. When
looking at the public sector expenditures on health care as part of the government
budget, this sector represents 15,94% of the total government expenditures. The share
designated to the public sector health care has been between 15,5 and 16,5% of the
government expenditure since the year 2000, see Table A.1 (HFA-DB, 2013).
The private sector expenditures on health corresponded to 2,7% of GDP and there has
been a slight increase since 2000, going from being 2,08% to being 2,7% of GDP three
years in a row, 2009-2011. As a percentage of total health care expenditures the private
sector represented 23,26% in 2011 and the private share has been increasing since 2000
when it was 20,62%, see Table A.1 (HFA-DB, 2013).
Households have paid out of pocket amounts corresponding to 7,46% in 2011 of total
health care expenditures and these expenses has been ranging between 6,5 and 7,5% of
total expenses. As a share of privately provided care the households out of pocket
payments accounts for 32,08% in 2011. In the beginning of the 2000’s it was higher,
around 34-35% of private sector expenditures, and since 2003 it has been around 31 and
32,5%, see Table A.1 (HFA-DB, 2013).
The pharmaceutical expenditures represents 15,6% of total health care expenditures in
2011 and ranges between 15,6 and 16,8% since 2000. His corresponds to a per capita
73
spending of 641,1 PPP adjusted dollars in 2011 and this expenditure has been increasing
since 2000, when it was 419,7 PPP dollars. The share of pharmaceutical spending that is
public is 68% in 2011. There is some fluctuation to this share, but the range is 66,9% in
2000 to 70% in 2005, see Table A.1 (HFA-DB, 2013).
A.2.2.2 Hospitals and patients
Acute care hospitals refer to short stay hospitals, which are providing diagnostics and
treatment on an in-patient basis. Treatments can be either surgical or non surgical, and
the hospitals are providing care for a wide range of medical conditions. Speciality
hospitals are not included in this category (HFA-DB, 2013).
WHO Regional Office for Europe defines discharges as the conclusion of treatment, and
upon that conclusion the patient is sent home, transferred to another facility or has died.
Cases where the hospital stays were shorter than 24 hours are registered separately
(HFA-DB, 2013).
In France in 2011 there were a total of 2 698 hospitals, and 1876 of those were acute care
hospitals. In the number of hospitals over all, there has been a steady decrease since
2000, when there was a total of 3 120 hospitals, where of 2 172 were acute care hospitals,
which also have bee declining in numbers every year, see Table A.2. As for hospital
density there were 4,14 hospitals per 100 000 inhabitants, and 2,88 acute care hospitals.
There has also been a decrease with regards to this, from 5,3 hospitals, in total, in 2000
and 3,69 acute care hospitals per 100 000 inhabitants. As for the number of hospital beds
provided there has also been a decrease since 2000, when there were 822,27 hospital
beds per 100 000 inhabitants, to there being 637,66 beds per 100 000 inhabitants in 2011.
The same trend can be seen for acute hospital beds, where there has been a decrease
from 419,07 to 342,92 beds per 100 000 inhabitants between 2000 and 2011, see Table 1.
Of the hospital beds 37,75% were privately owned in 2011, which is an increase from
34,38% in 2000. Looking at the actual number of private hospitals beds, however, reveals
a decrease from 166 497 to 156 744 in 2011, see Table A.2 (HFA-DB, 2013). Implying
that the public sector is diminishing the hospital stock at a faster rate than the private
sector.
74
There were 19,01 discharges per a 100 population in 2009 in France and, for the
observations available i.e. 2006-2009, the number was close to 19. The average length of
stay was 12,6 days, for all hospitals in 2011 and the trend has been decreasing since 2001-
2005, when the average was 13,3. In 2000 the average was slightly below that number,
see Table A.2 (HFA-DB, 2013).
In acute care hospitals there was 16,45 discharges per 100 inhabitants in 2009, and for
the other observations available, 2006-2009, the number was varying close to 16,5
discharges per 100. The average length of stay was 5,1 days in 2011, and there has been
no large change from the previous years, since the 5,6 days of 2000, see Table A.2 (HFA-
DB, 2013).
The average number of primary or ambulatory care visits per person was 6,8 visits in
2011, which is close to the 2000 average of 6,9 visits. However, the peak was in 2001 at
7,4 visits and after that it has been decreasing, see Table A.2 (HFA-DB, 2013).
A.2.2.3 Physicians
Breaking down the physicians into groups of specialties, five groups are considered,
namely: general practitioners, paediatric specialities, obstetric and gynaecological
specialties, surgical specialties and medical specialties. The last refers to a broad group of
specialities that focus on diagnosing a non-surgical treatment of medical conditions2.
Further, the numbers are reported as physical persons, rather than in the full time
equivalent form (HFA-DB, 2013).
In 2012 there were a total of 318,23 physicians per 100 000 inhabitants in France, which
was an increase from the year before when there were 307,03 physicians for the same
amount of people, see Table 1. In absolute numbers this corresponds to a total of 199
920 in 2011 and 201 811 in 2012. Looking at the development in physicians per 100 000
inhabitants for the different specialities between the years 2000 and 2012, the medical
2 Including: Internal medicine, cardiology, endocrinology, gastroenterology, pulmonology, respiratory
medicine, oncology, gynaecologic oncology, immunology, rheumatology, neurology, oto-rhino-laryngology,
radiology, infectious diseases, microbiology-bacteriology, haematology, dermatology, pathology,
occupational medicine and medical interns or residents training in these specialties. The following are not
included: Surgery, obstetrics and gynaecology, paediatrics, psychiatry and general practitioners.
75
group of specialities has increased from 77,59 physicians per 100 000 inhabitants to 84,36
in 2012. The surgical specialities has gone from 42,93 physicians per 100 000 inhabitants
to 46,51, for the same time period. For the obstetric and gynaecological specialties the
2000 density per 100 000 inhabitants was 12,02 physicians and 12,73 in 2012. Paediatric
specialties increased from 10,87 physicians per 100 000 inhabitants to 12,01 physicians in
2012. Finally the general practitioner density decreased during the same period from
166,71 GPs per 100 000 inhabitants to 160,53 physicians. In absolute number of
physicians these densities corresponds to, for each group of specialities and for 2000 and
2012, respectively: for medical specialities 45 696 – 53 496, for surgical specialities 25 282
– 29 498, for obstetric and gynaecological specialities 7 080 – 8 076, for paediatric
specialities 6 404 – 7 615 and for GPs 98 183 – 101 803, see Table A.3 (HFA-DB, 2013).
A.2.2.4 Population composition
The crude death rate per a population of 1000 has varied between approximately 8,5 and
slightly above 9 and in 2009, which is the most recent observation it was 8,58 deaths per
1000 people. The total fertility rate has been slightly increasing from 1,89 to 2,03. The
part of the population that is participating in the labour force has been varying around
44,5%, but in the most recent observation in 2007 it was 44,24% of the total population,
see Table A.4 (HFA-DB, 2013).
The share of the French population between the ages 0 and 14 was 18,37% in 2009,
compared to 18,83 in 2000 the decrease of the population share in this category has not
been large. As for the share of the population aged over 65 years old, this category
represented 16,74% of the population in 2009, compared to 16,08% in 2000, from which
it has been increasing steadily. Looking closer at the age category between 0 and 14, if
separating the population by gender, of the male population 19,42% belonged in this
category in 2009. The same share for the female population was 17,39% for the same
year. The development since 2000 has been similar for both groups, where there has
been a small decrease from 19,84 and 17,87%, respectively for males and females. As for
he share of the population over 65, the male population has seen an increase from 13,42
to 14,26% between the years 2000 and 2009. For the female population the same
development over the same period has been an increase from 18,58 to 19,07% of the
female part of the population, see Table A.4 (HFA-DB, 2013).
76
A.2.2.5 Life expectancy
The life expectancy in France was 81,76 years in 2009, compared to 79,35 years in 2000,
see Table 2. The life expectancy at the age of 1 was 81,05 in 2009 and 78,96 in 2000,
giving a total of 82,05 and 79,96 life years, respectively. By the age of 15 the life
expectancy was 67,18 in 2009 and in 2000 it was 64,87 and this corresponds to a total of
82,18 and 79,87 life years, respectively. The life expectancy at 45 years old was 38,35 in
2009 and 36,35 in 2000, with a total of 83,35 and 81,35 life yeas, respectively. At the age
of 65 the life expectancy was 21,3 years in 2009 and in 2000 it was 19,48, which
corresponds to a total number of life years of 86,3 and 84,48 years, respectively. The life
expectancy estimations by the World Health Report were 79 years in 2000 and 82 years
in 2011, see Table A.5 (HFA-DB, 2013).
For the average French man the life expectancy at birth was calculated to be 78,19 years
in 2009 and 75,49 years in 2000, see Table 2. When 1 year old the life expectancy was
77,49 years in 2009 and 74,87 years in 2000, with a corresponding total of 78,49 and
75,87 life years, respectively. By the age of 15 the life expectancy was 63,63 years in 2009,
compared to 64,87 years in 2000, resulting in a total of 78,63 and 79,87 life years,
respectively for 2010 and 2000. When the average French man is 45 years old he is
expected to live for an additional 35,16 years in 2009 and 32,99 years in 2000, thus
predicting 80,16 and 77,99 life years, respectively. At age 65 the life expectancy was 18,86
years in 2009 and 16,94 years in 2000, summing up to 83,86 and 81,94 life years in total,
respectively. The estimated life expectancy, by the World Health Report, was 76 years in
2000 and 78 years in 2011, see Table A.5 (HFA-DB, 2013).
The French women have a life expectancy at birth of 85,19 years in 2009 and 83,15 years
in 2000, see Table 2. By the age of 1 the life expectancy was 84,45 in 2009 and 82,46 in
2000, thus giving a total number of 85,45 and 83,46 life years, respectively. The average
15 years old woman in 2009 had a life expectancy of 70,57 and in 2000 it was 68,62,
predicting a total number of 85,57 and 83,62 life years, respectively. At the age of 45 a
woman was expected to live for an additional 41,32 years in 2009 and 39,56 years in
2000, thus living until 86,32 and 84,56 years old, respectively. Then, by the age of 65, the
life expectancy was 23,33 in 2009 and in 2000 it was 21,59 years, thus giving the average
woman a total of 88,33 and 86,59 life years. Finally, the World Health Report’s estimated
77
life expectancy was 83 years for women in 2000 and 85 years in 2011, see Table A.5
(HFA-DB, 2013).
A.2.2.6 Healthy life years
In absolute terms the average French woman is expected at birth to live healthily for 63,9
years in 2012. Since 2004 the expected healthy life years have varied between 63,4 and
64,6 healthy life years at birth, see Table 2. Healthy life years at age 50 were 20,1 in 2012,
and it has been quite steady since 2004, when it was 20 years, apart from a dip in 2009 –
2011. By the age of 65, the additional healthy life years were 10,4 in 2012, which is a
slight increase from 10 healthy years in 2004, but during the years in between there was a
decrease, with the lowest number 9,6 in 2006, see Table A.6 (Eurostat, 2013a).
The healthy life expectancy for the average man was 62,6 years in 2012, compared to
61,5 healthy life years in 2004. However, between 2005 and 2012 the variation has been
between 62,3 and 62,8 healthy life years, see Table 2. The number of healthy life years
from age 50 has increased over all for males since 2004, when it was 17,6 years,
compared to 19 healthy years in 2012. The healthy life years has increased also from the
age of 65, from 8,5 healthy years in 2004 to 9,5 healthy years in 2012, see Table A.6
(Eurostat, 2013a).
The healthy life years, when calculated using self-perceived health, predicts 77,6 healthy
years for females at birth in 2011. The over all trend has been increasing since 2004,
when 74,8 healthy years were expected. By the age of 50, 30,4 healthy additional years
were expected in 2011, and this has also had an increasing trend since 2004, when the
healthy years were expected to be 27,6. When 65, the women could expect 18,3 healthy
years in 2011, an increase from 2004 and 15,9 additional healthy years, see Table A.6
(Eurostat, 2013a).
When calculating the healthy life expectancy for men, using self-perceived health, the
expectation is 73,2 healthy years in 2011, with an increase from 2004 when it was 69,7
healthy years that were expected. When reaching the age of 50, 26,5 additional healthy
years were expected, also this category increasing since 2004, when it was 23,6 healthy
years. By the age of 65, the additional healthy life years were expected to be 15,4, when
78
calculated using self-perceived health, which also has been increasing since 2004, when
13,1 healthy years could be expected, see Table A.6 (Eurostat, 2013a).
A.2.2.7 Self-perceived health
In France, 25,2% of the population perceived themselves to be in very good health in
2012, a share that has been fluctuating since 2004, with a top notation of 25,2% in both
2012 and 2004, and a bottom notation of 22,6 in 2011. As for the category good health,
42,9% of the population puts themselves there. Since 2004 there was an increase until
2011, from 42,4 to 45,0, and after that a drop to the 2012 level, see Table 2. Further,
23,4% of the population found that they were in fair health in 2012, and since 2004,
there has been an over all increase, from 21,6% in this category. 7,4% of the population
found that they were in bad health in 2012, a decrease from 2004, when there was 8,6%
in this category. Finally, 1,1% found that they were in very bad health in 2012, which is
an over all decrease, but with some fluctuations, since 2004, when there was 2,1% in this
category, see Table A.7 (Eurostat, 2013a).
The time trends, when looking at the male and female part of the population separately,
are over all the same as for the entire population, where the very good health category
fluctuates around a level, for the good health category there is an increase until 2011, and
then a drop in 2012, for the fair health an increase and decreases for the bad and very
bad health categories, see Table A.7 (Eurostat, 2013a).
The share of males in 2012 that perceived themselves to be in very good health were
27,1%, 43,3% in good health, 22,1% in fair health, 6,8% in bad health and 1,1% in very
bad health. The same perceived health for females were in 2012, 23,4% in very good
health, 42,5% in good health, 24,6% in fair health, 8,2% in bad health and 1,2% in very
bad health, see Table A.7 (Eurostat, 2013a).
A.2.2.8 Morbidity
In 2012 there were 36,3% of the population that were suffering from a long-term illness
or health problem. Since 2004 there has been levels mostly between 34,5% and around
37%, although there is one observation of 31,9% in 2008, see Table 2. For the ages 16-24
there has been variations, since 2004, between 12,5% in 2007 and 14,7% in 2009. The
79
share having a long-term illness in 2012 was 14%. For the ages 25-34 the 2004 and 2012
levels are close, 19,1 and 19,3%, respectively. In between there has been fluctuation
between 18,3 and 20,2%. The same pattern observed for the ages 35-44, where the 2012
share of the population suffering long-term health problems was 25,5%. For the 45-54
year olds there were 34,5% with a long term health issue in 2012, which is lower than in
2004 when it was 35,3%, during the years in between there were fluctuations between
31,4 and 36,4%. Among the 55-65 year olds there has also been fluctuations since 2004,
and the 2012 share of the population with a long-term illness was 46,9%. The top
notation during this period was in 48,8% in 2004 and the bottom notation was in 44,9%
in 2005. For the ages 65-74 there has been an over all decrease since 2004 from 61,6% to
56% in 2012. For the long term illness in the age group of 75 years or older, the share
has varied between 68,3% in 2005 and 71,1% in 2009, as for the 2012 level it is the same
as in 2004, namely 69,5%, see Table A.8 (Eurostat, 2013a).
Looking at males and females separately the same trends as for the total population can
be found, where the share of the population suffering from a long term illness or health
problem fluctuates around a certain level, except for the category of 65-74 years old
where there is an decrease. In most cases the 2012 level is within the extreme values and
thus the 2012 numbers will be presented. For more information on the fluctuations, see
Table A.8 (Eurostat, 2013a).
Among the French males 34,7% were suffering from a long-term illness or health
problem in 2012. The same number for the different age categories were 12,4% for the
16-24 year olds, 18,3%for the 25-34 year olds, 24,1% for the 35-44 year olds, 33,7% for
the 45-54 year olds, 46,3% for the 55-64 year olds, 57,4% for the 65-74 year olds, and
70,8% of the 75 years or older, see Table A.8 (Eurostat, 2013a).
For the women, a total of 37,7% stated that they were suffering from a long-term illness
or health problem in 2012. The same number for the different age groups were, 15,7%
of the 16-24 year olds, 20,2% of the 25-34 year olds, 27% of the 35-44 year olds, 35,2%
of the 45-54 year olds, 47,5% of the 55-64 year olds, 54,7% of the 65-74 year olds, and
68,7% of the 75 years and older, see Table A.8 (Eurostat, 2013a).
80
Out of the people suffering from a long-standing illness or health problem there were
16,1% stating that they have some limitations in their usual activities due to their health
status, in both 2004 and 2012. In between those years the number varied between 14,7
and 16,3%, in 2008 and 2006, respectively. The share experiencing severe limitations
accounted for 8,6% in 2012, a number that was increasing until 2010, when it was 9,6%,
from the 2004 level of 7,3%. As for the share stating no limitations there were 76,6% in
2004 and 75,3% in 2012. Between these years there was a peak in 2007 of 79,8%, see
Table A.8 (Eurostat, 2013a).
Looking at the males, there were 15% stating that they have some limitation in their
usual activities caused by their health problem. The same number in 2004 was 14,8% and
in between those years there was a decrease until 2009, with a bottom notation of 13,1%.
There were 7,6% stating that they had severe limitations in 2012, and the same number
in 2004 was 7,1%. Between those years there was a top of 8,5% in 2010 and 2011, and a
bottom notation of 4,6% in 2007. The share stating that their health does not cause any
limitation in their usual activities was 77,4% in 2012, compared to 78% in 2004. The
maximum and minimum values in between those years were 81,8% in 2007 and 76,9% in
2010, respectively, see Table A.8 (Eurostat, 2013a).
Among the females with a health problem, 17,1% stated some limitations in 2012, and
the same number in 2004 was 17,2%. The variation over the time period examined
ranged between 15,9% in 2008 and 18,2% in 2006. As for the severe limitation this
category represented 9,5% in 2012,and there was an increase between 2004 and 2010,
from 7,5 to 10,6%. The share stating no limitations was 73,4% in 2012 and 75,3% in
2004. The numbers in between ranged from 72,8% in 2010 and 78% in 2007, see Table
A.8 (Eurostat, 2013a).
Out of the male population 49,9% reported a body mass index, BMI, of 25 or higher in
2010. This can be compared to the 2004 self-reported number that was 39,6%, see table
A.8.34 (OECD, 26, 2013). For the female population the same number was 36,7 in 2010,
and in 2004, 29,3% of women reported that they were overweight or obese, see Table
A.8 (OECD, 25, 2013).
81
A.2.2.9 Infant and maternal health
In France the over all infant mortality rate has decreased from 4,39 deaths per 1000 live
births to 3,49 deaths in 2009, see Table 2. For male infants the trend is the same, and the
decrease has been from 5 deaths per 1000 live births to 3,87 deaths in 2009. For female
the decrease since the year 2000, from 3,74 to 3,1 deaths per 1000 live births in 2009, see
Table A.9 (HFA-DB, 2013).
Regarding maternal mortality the number of deaths per 100 000 live births have
fluctuated over the chosen time period, with a top notation of 10,66 in 2002 and a lowest
notation of 6,08 in 2005. The most recent number is from 2009, when the maternal
deaths per 100 000 live births were 9,42, see Table 2 (HFA-DB, 2013).
The number of abortions per 1000 live births had an increasing trend since 2000, when it
was 248,53, until 2007, when it was 271,4. The two following years, for which data are
available, there was a decrease and in 2009 there were 263,76 abortions per 1000 live
births, see Table A.9 (HFA-DB, 2013).
In 2011, 98% of French infants were vaccinated against diphtheria, tetanus pertussis and
poliomyelitis, 89% against measles, 97% against invasive disease due to haemophilius
influenzae type b, and 51% against hepatitis b. vaccination against rubella has its most
recent observation in 2009, when it was 89,5% of all infants, and 78,2% were vaccinated
against tuberculosis in 2010, see Table A.9 (HFA-DB, 2013).
A.2.2.10 Patient satisfaction
Here the percentage of the respective populations that stated that they had no unmet
needs, with regards to the medical examination they received, will be presented and this
measure will be considered as satisfaction, i.e. the assumption is that if there are no
unmet needs to declare, the patient is satisfied with the examination and care received.
This is in all cases the vast majority of the population, and the remaining categories for
dissatisfaction are several, and thus the percentage for each category will be rather small,
however, the numbers for waiting lists will be presented, since this is one of the noted
differences between the structure of the different health care systems. The remaining
categories will be treated as having unmet needs in general.
82
Among the French patients 94,5% stated that they had no unmet needs from their
medical examinations, which is the lowest notation for the time period examined. The
highest notation in France during the time period examined was 96,3% in 2006 and in
2007. In 2012 there were 5,5% that reported that they had unmet needs, and 0,3% in
2012 stated that their unmet needs were caused by long waiting times. Since 2004, when
there were 0,2% with unmet needs due to waiting lists, and the maximum and minimum
values were 0,4 and 0,1% in 2011 and 2006, see Table 3 (Eurostat, 2013b).
When considering the age groups of 16-64 and 65 and older, there was 93,6% of the 16-
64 years olds that were satisfied with the service they received in 2012. Since 2004 there
has been fluctuations between 95,9 and 93,6%. This results in there being 6,7% in 2012
that were experiencing that they had unmet needs. The unmet needs caused by waiting
lists were corresponding to 0,4% in 2012 as well as in 2011. The variation has been
between 0,1 in 2006 and the 2012 level. For the age group of 65 and older there were
97,4% who had no unmet needs, which is also the case for 2007, and this is the lowest
notation of satisfied patients in this age group. The highest level of satisfaction was in
2007 when 99% of the age group stated that they had no unmet needs. In 2012, this
corresponds to 2,6% having unmet needs, and as for the unmet needs caused by waiting
lists, it has been 0,1% for this age group for all years since 2004 except for 2005 and
2007, when it was 0%, see Table A.10 (Eurostat, 2013b).
83
Appendix 3. Italy
A.3.1 The health care system
The health care system in Italy has, like Italy itself, a fragmented history with
considerable differences between the northern and southern regions. These are
differences that already from the unification of Italy in 1861 created a divide, where the
northern regions were considerably more industrialised and had agriculture run by
efficient and modern technologies, while the southern part was underdeveloped. The
health care systems at his time was in general either run by the Catholic Church or
charitable organisations, which were nationalised in the unification. Additionally there
was a public provision of health care and preventative medicine, support for needy and
disabled at the municipality level, as well as independent not for profit associations and
common aid associations for workers and artisans. From this, a system with employment
based insurance was implemented in the in the 20th century. Contributions were made to
insurance funds that were connected to the work on a voluntary basis, in the form of a
percentage of the monthly wage (Lo Scalo et al., 2009).
The employment based insurance system worked well during the period of rapid
economic growth after the Second World War, 1958-1963, when Italy was experiencing
full employment. However, in the mid 1970’s unemployment had started to rise, and
combining that with Italy largely affected by the oil shocks in the beginning of the 70’s,
the system of employment related insurance resulted in 7% of the population only
having access to hospital services, since they were either unemployed or self employed
and thus not covered by the employment based health insurance. This prompted the
giving of responsibility of the health care provision to the regions in 1974-75 (Lo Scalo et
al., 2009) and creation of the National Health Service, Serivizio Sanitario Nazionale, SSN, in
1978, the latter bringing universal insurance coverage to the Italian citizens. The main
objective of the SSN is to ensure equal access to health care, regardless of income,
geographical location, to develop structures for preventative care, to decrease
geographical inequalities in provision of health care services, to have control over health
care expenditures and guarantee democratic control, through the political parties, over
the management of the health care system (Lo Scalo et al., 2009 and Giannoni & Hitiris,
2002). The creation of the SSN marks the step from being a Bismarck system to a
84
Beveridge system (van der Zee & Kroneman, 2007) and was modelled on the British
National Health Service (France et al., 2005).
The health care system is managed at both a national as well as a regional level. The
government determines how much public resources are going to be devoted to the
health care system, with additional funding from statutory health insurance (Lo Scalo et
al., 2009). An essential level of care, Livelli Essenziale di Assistanza, LEA, is set at the
national level and the funding distributed to the regions is aimed to supply the means of
providing this basic package of care and reduce differences in quality of health care and
what services are provided across the country. It is then the responsibility of the regions
to organise and administer funding and the services they provide (Lo Scalo et al., 2009
and France et al., 2005). The LEAs were first created in 2001 and consists of a positive
list and a negative list, on which treatments are being considered on the basis of
“effectiveness, appropriateness and efficiency in delivery”. While the positive list states
what has to be provided, the negative list has three categories of procedures that not are
included in the SSN coverage, to procedures to be considered on a case to case basis and
a list of procedures where inpatient treatment is not necessary, but outpatient treatment
suffices, e.g. after carpel tunnel and cataract surgery. Thus, the LEAs are what specify
what treatments, services and procedures are covered by the SSN (France et al., 2005).
The financing of the health care expenditures was, according to Giannoni and Hitiris
(2002), mainly by regional, employer and general health taxes, which covers 67% of the
costs. The remaining 33% were from co-payments and private insurance, and a private
insurance policy was held by 16% of the population.
When implementing the SSN system one part of the reform was to centralise the
administration of the health care system, leaving little administrative responsibilities to
the region and local levels, in order to have a more cohesive system. However, since this
change created a power shift from the regional governments to the national government,
there were disagreements about e.g. financing jurisdiction. This caused an informal
increase of the regional autonomy with regards to the health care sector (Lo Scalo et al.,
2009), until the formal process started in 1992, giving more political power and fiscal
authority. More practically this entailed e.g. increased responsibilities in policy making,
85
administration and management, and resource allocation (Lo Scalo et al., 2009 and
Giannoni & Hitiris, 2002).
Since the creation of the SSN several reforms has followed, on the same trend,
strengthening the regional autonomy. Among other things creating a federal fiscal
system, which has put the funding of the SSN at a regional level rather than at a national.
This has been part of the over all trend of working towards a federal reform (Lo Scalo et
al., 2009). It can also be seen, as the majority of the regions were created in 1970 the
regional power over the health care system has increased as the regions have gained more
political power as well as technical and administrative capacities (France et al., 2005).
However, this results in further differences between northern and southern regions, since
the northern, richer, regions are looking to have their independence while the southern
regions have trouble finding the resources to fund the new responsibilities, only having
the resources in the own region to fall back on (Lo Scalo et al., 2009 and France et al.,
2005).
The Italian health care systems has strengths, such as supplying universal health care
coverage, but at the cost of funding system unable to keep up with the expenditures
(Giannoni & Hitiris, 2002), a problem which has been present from the establishment of
the SSN (Hoffmeyer & McCarthy, 1994).
The amount of health care expenditure, as percentage of the GDP was at the time of the
creation of the SSN in 1978, 6.6%. Since then it has been rising steadily and during the
1990’s the health care expenditures were growing twice as fast as the GDP (Giannoni &
Hitiris, 2002).
A.3.1.1 Regional structure
The regional level is responsible for the delivery of the heath care services, specified by
the benefit package set at the national level, LEAs, as stated above. Health care provision
is done through accredited private and public hospitals as well as local health enterprises,
aziende sanitare locali, ASL, which are provided on a population basis. Other than provision
the regions are also charged with planning and administration of the provided health
care, as well as for the adaption of the health care provision to match the needs of the
population, e.g. assessing the need to build new hospitals. There are also legislative and
86
executive functions, as well as technical support and evaluation. These include for
example, presenting financing criteria for the public funding of both public and private
health care providers, determine strategic goals and regional initiatives (Lo Scalo et al.,
2009).
The ASLs have a defined population, based on geographic location, to which it provides
care to the local population. The average population base is 250 000 per ASL. They are
supervised by the regions, which are also managing the size and organisation of each
ASL. The ASLs charged with informing their population about disease prevention. The
types of care provided by the ASL are acute care, rehabilitation, primary care, specialist
medicine that are not bound to hospitals, as well as residential and semi residential care.
These services are provided in hospitals, for the first two, or by medical professionals
who are working as independent contractors under the ASL (Lo Scalo et al., 2009).
Regarding the technical support and evaluation of the health care system ten of the
regions have established a regional agency for health to provide evaluation of the health
care quality of different providers, and scientific as well as technical support. In the other
regions, the regional health department provides these services. Further, the regional
agencies also assist the health departments in matters of anticipating population need and
demand for health care. These regional agencies were created during the mid 1990’s to
the beginning of the 2000’s, although in some cases actual implementation was
somewhat delayed3 (Lo Scalo et al., 2009).
A.3.1.2 Primary care
The physicians providing primary care services have generally been working in single
practices, partly because they are being paid by the amount of people registered on their
list. However, shared clinics are becoming more common, due to e.g. financial incentives
provided to promote group practices, which have been in place since 1999 and attitudes
are changing. The population can register with any physician given that the list of that
physician is not full and the maximum allowed patients for general practitioners, GPs,
are 1500 and 800 for paediatricians (Lo Scalo et al., 2009). The average number of 3 More specifically the regional agencies for health were created in 1994 – Emilia Romagna, in 1995 –
Friuli-Venezia-Giulia, in 1996 – Campania and Marche, in 1998 – Piedmont, in 1999 – Lazio and Abruzzo
(but not active until 2006), in 2000 – Tuscany, in 2001 – Veneto and Puglia.
87
patients in 2004 for GPs were, according to the Italian Ministry for Health, Ministerio
della Salute Servizio Studi e Documentazione (2008), 1107 and for paediatricians 805.
Insufficient supply of paediatricians, and also due to custom, children in some regions
are to a larger extent listed with GPs.
A.3.1.3 Hospital care
Ambulatory care is provided by the ASLs or by other public facilities, both public and
private, that has been accredited and which have an agreement with the ASL. The
services provided at this level of care differ among regions. Patients can access the
ambulatory care services either by referral from their GP and after having referral from
their GP, patients can choose their specialist. Having a referral is not always necessary,
since people can make an appointment by themselves, although with restrictions to
certain areas of treatment4. However, in case of an emergency direct access to all service
areas are given through the assessment of a doctor (Lo Scalo et al., 2009).
The service of a central booking point, CUP, is provided in some regions to give patients
information on hospitals and their waiting lists, for when they are making an
appointment. This information is given for public and private accredited hospitals, but
when it comes to private hospitals that are not accredited there are other information
channels. Turning to a private hospital that is not accredited usually entails not having to
wait as long to receive treatment, however, the cost of the care received at these hospitals
are not covered by the SSN, but have to be paid by the patient (Lo Scalo et al., 2009).
There are 669 public hospitals, which are providing both in- and out-patient care, 553
private hospitals, that are providing care under contract from the ASLs, generally these
are not-for-profit organisations (Lo Scalo et al., 2009). Public hospitals are mainly
managed by the ASLs, but the facilities that are not have been broken off to form aziende
ospidaliere, AOs (France et al., 2005), which are providing tertiary care. These are highly
specialised hospitals that are covering, if not a national patient group, at least an
interregional one (Lo Scalo et al., 2009).
4 gynaecology, dental care, paediatrics (for those who have decided not to register their children with a
designated paediatrician), optometric services and psychiatric services for children
88
A.3.1.4 Decentralisation
According to Giannoni and Hitiris (2002) Italy is one of the countries that have extensive
decentralisation of their health care system, while struggling with containing the costs of
their health care system. The increasing decentralisation however, allows regions to
allocate the resources to adapt to the local needs, but regions are also allowed to interpret
the government directives on cost containment, which leads profoundly different ways
of dealing with health care expenditures, as well as over all increasing differences
between the regions. One further reason for the increasing inequalities are the deviations
from the formula for the regional allocation national funds, since the regions have the
decision power over the expenditures. On the back of this, and to enable cost
containment there has been a new formula implemented in some if the regions, that will
improve cost containment through the guidelines for a balanced use of the resources (Lo
Scalo et al., 2009).
Further, in implementing the SSN in a country where there already were large regional
differences and a large concentration of the poor in the southern part of the country,
aggravated the differences, both regarding the quality and efficiency of the care provided
(Giannoni & Hitiris, 2002 and Piperno & Di Orio, 1990). When funding from the
government decreased after the reforms in the 1990’s, this again caused regional
differences to increase, since, as stated above, the source of tax revenue is largely
different among regions, thus affecting the size of the health care budget and causing
large variations in the expenditures among regions (Giannoni & Hitiris, 2002).
In their conclusion Giannoni and Hitiris (2002) state that the decentralisation of the
Italian health care system, although there have been effective cost containment at the
national level, has lead to the continuous high spending of the rich regions, and the low
spending of the poor regions. This in turn causes the differences between the regions not
only to remain, but also for some cases increase.
Piperno & Di Orio (1990) states that lower social status is associated with a less efficient
use of medical services and that there are considerable differences also in health
outcomes between social groups in the same region and that these differences are largest
in the southern regions.
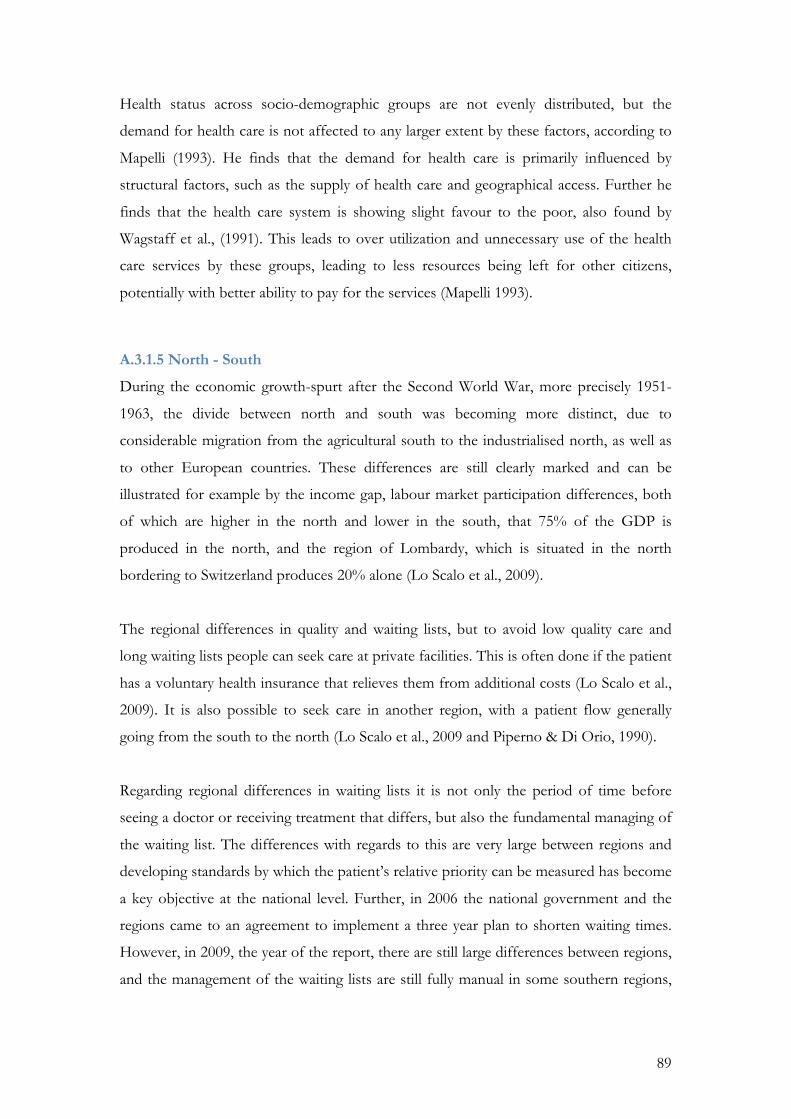
89
Health status across socio-demographic groups are not evenly distributed, but the
demand for health care is not affected to any larger extent by these factors, according to
Mapelli (1993). He finds that the demand for health care is primarily influenced by
structural factors, such as the supply of health care and geographical access. Further he
finds that the health care system is showing slight favour to the poor, also found by
Wagstaff et al., (1991). This leads to over utilization and unnecessary use of the health
care services by these groups, leading to less resources being left for other citizens,
potentially with better ability to pay for the services (Mapelli 1993).
A.3.1.5 North - South
During the economic growth-spurt after the Second World War, more precisely 1951-
1963, the divide between north and south was becoming more distinct, due to
considerable migration from the agricultural south to the industrialised north, as well as
to other European countries. These differences are still clearly marked and can be
illustrated for example by the income gap, labour market participation differences, both
of which are higher in the north and lower in the south, that 75% of the GDP is
produced in the north, and the region of Lombardy, which is situated in the north
bordering to Switzerland produces 20% alone (Lo Scalo et al., 2009).
The regional differences in quality and waiting lists, but to avoid low quality care and
long waiting lists people can seek care at private facilities. This is often done if the patient
has a voluntary health insurance that relieves them from additional costs (Lo Scalo et al.,
2009). It is also possible to seek care in another region, with a patient flow generally
going from the south to the north (Lo Scalo et al., 2009 and Piperno & Di Orio, 1990).
Regarding regional differences in waiting lists it is not only the period of time before
seeing a doctor or receiving treatment that differs, but also the fundamental managing of
the waiting list. The differences with regards to this are very large between regions and
developing standards by which the patient’s relative priority can be measured has become
a key objective at the national level. Further, in 2006 the national government and the
regions came to an agreement to implement a three year plan to shorten waiting times.
However, in 2009, the year of the report, there are still large differences between regions,
and the management of the waiting lists are still fully manual in some southern regions,
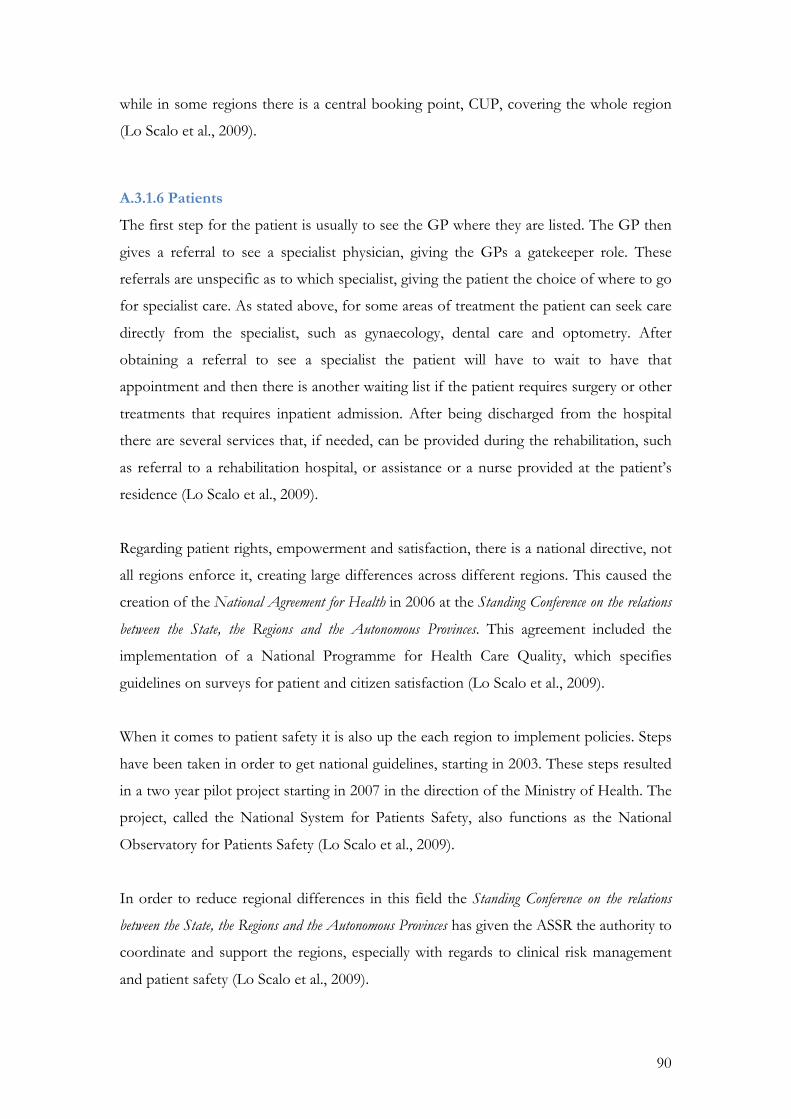
90
while in some regions there is a central booking point, CUP, covering the whole region
(Lo Scalo et al., 2009).
A.3.1.6 Patients
The first step for the patient is usually to see the GP where they are listed. The GP then
gives a referral to see a specialist physician, giving the GPs a gatekeeper role. These
referrals are unspecific as to which specialist, giving the patient the choice of where to go
for specialist care. As stated above, for some areas of treatment the patient can seek care
directly from the specialist, such as gynaecology, dental care and optometry. After
obtaining a referral to see a specialist the patient will have to wait to have that
appointment and then there is another waiting list if the patient requires surgery or other
treatments that requires inpatient admission. After being discharged from the hospital
there are several services that, if needed, can be provided during the rehabilitation, such
as referral to a rehabilitation hospital, or assistance or a nurse provided at the patient’s
residence (Lo Scalo et al., 2009).
Regarding patient rights, empowerment and satisfaction, there is a national directive, not
all regions enforce it, creating large differences across different regions. This caused the
creation of the National Agreement for Health in 2006 at the Standing Conference on the relations
between the State, the Regions and the Autonomous Provinces. This agreement included the
implementation of a National Programme for Health Care Quality, which specifies
guidelines on surveys for patient and citizen satisfaction (Lo Scalo et al., 2009).
When it comes to patient safety it is also up the each region to implement policies. Steps
have been taken in order to get national guidelines, starting in 2003. These steps resulted
in a two year pilot project starting in 2007 in the direction of the Ministry of Health. The
project, called the National System for Patients Safety, also functions as the National
Observatory for Patients Safety (Lo Scalo et al., 2009).
In order to reduce regional differences in this field the Standing Conference on the relations
between the State, the Regions and the Autonomous Provinces has given the ASSR the authority to
coordinate and support the regions, especially with regards to clinical risk management
and patient safety (Lo Scalo et al., 2009).
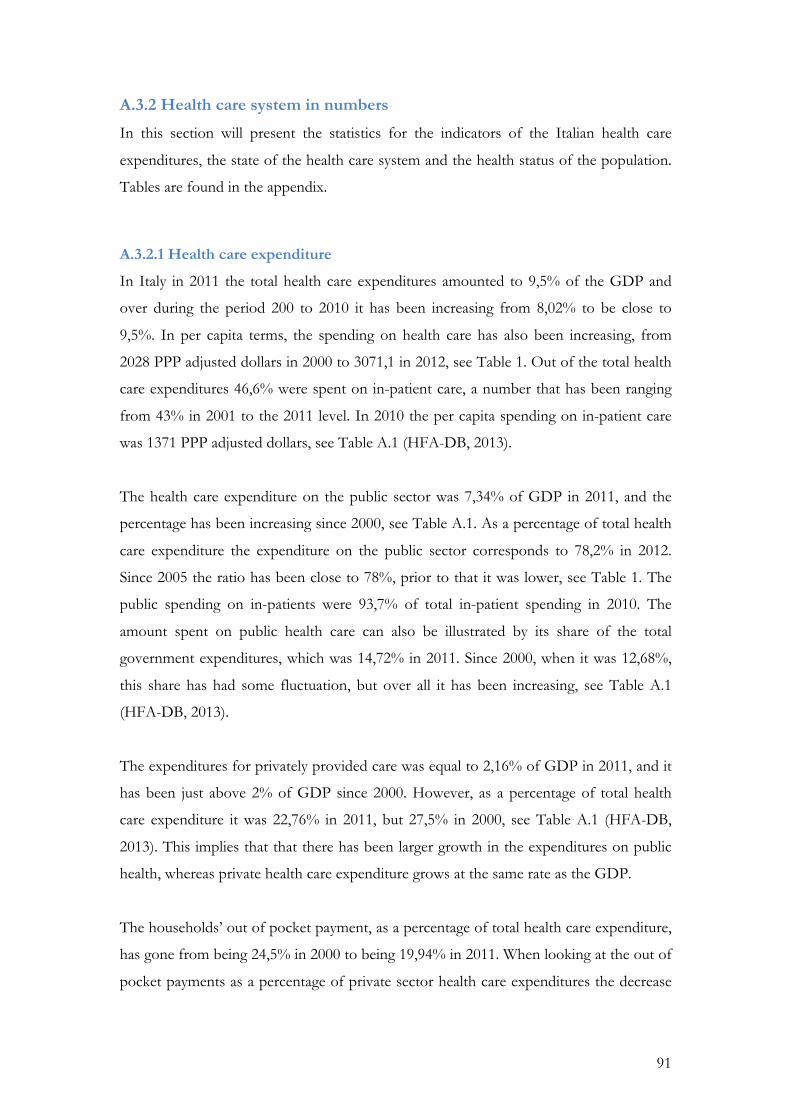
91
A.3.2 Health care system in numbers
In this section will present the statistics for the indicators of the Italian health care
expenditures, the state of the health care system and the health status of the population.
Tables are found in the appendix.
A.3.2.1 Health care expenditure
In Italy in 2011 the total health care expenditures amounted to 9,5% of the GDP and
over during the period 200 to 2010 it has been increasing from 8,02% to be close to
9,5%. In per capita terms, the spending on health care has also been increasing, from
2028 PPP adjusted dollars in 2000 to 3071,1 in 2012, see Table 1. Out of the total health
care expenditures 46,6% were spent on in-patient care, a number that has been ranging
from 43% in 2001 to the 2011 level. In 2010 the per capita spending on in-patient care
was 1371 PPP adjusted dollars, see Table A.1 (HFA-DB, 2013).
The health care expenditure on the public sector was 7,34% of GDP in 2011, and the
percentage has been increasing since 2000, see Table A.1. As a percentage of total health
care expenditure the expenditure on the public sector corresponds to 78,2% in 2012.
Since 2005 the ratio has been close to 78%, prior to that it was lower, see Table 1. The
public spending on in-patients were 93,7% of total in-patient spending in 2010. The
amount spent on public health care can also be illustrated by its share of the total
government expenditures, which was 14,72% in 2011. Since 2000, when it was 12,68%,
this share has had some fluctuation, but over all it has been increasing, see Table A.1
(HFA-DB, 2013).
The expenditures for privately provided care was equal to 2,16% of GDP in 2011, and it
has been just above 2% of GDP since 2000. However, as a percentage of total health
care expenditure it was 22,76% in 2011, but 27,5% in 2000, see Table A.1 (HFA-DB,
2013). This implies that that there has been larger growth in the expenditures on public
health, whereas private health care expenditure grows at the same rate as the GDP.
The households’ out of pocket payment, as a percentage of total health care expenditure,
has gone from being 24,5% in 2000 to being 19,94% in 2011. When looking at the out of
pocket payments as a percentage of private sector health care expenditures the decrease
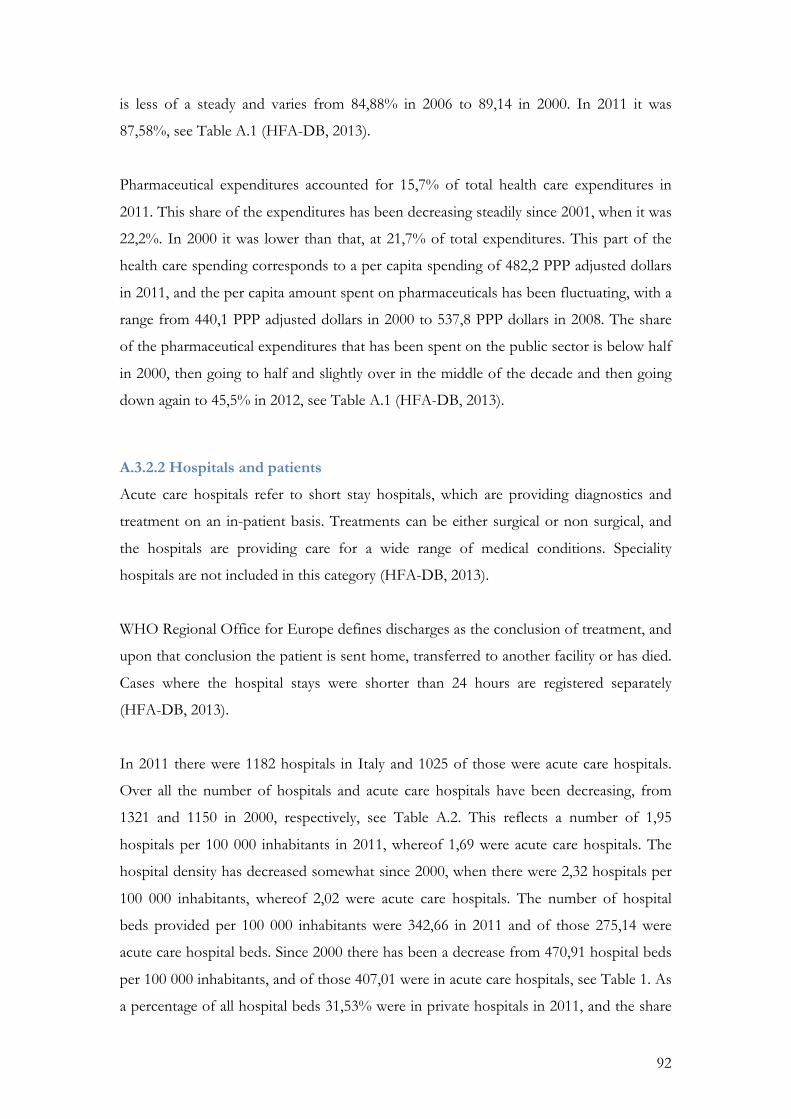
92
is less of a steady and varies from 84,88% in 2006 to 89,14 in 2000. In 2011 it was
87,58%, see Table A.1 (HFA-DB, 2013).
Pharmaceutical expenditures accounted for 15,7% of total health care expenditures in
2011. This share of the expenditures has been decreasing steadily since 2001, when it was
22,2%. In 2000 it was lower than that, at 21,7% of total expenditures. This part of the
health care spending corresponds to a per capita spending of 482,2 PPP adjusted dollars
in 2011, and the per capita amount spent on pharmaceuticals has been fluctuating, with a
range from 440,1 PPP adjusted dollars in 2000 to 537,8 PPP dollars in 2008. The share
of the pharmaceutical expenditures that has been spent on the public sector is below half
in 2000, then going to half and slightly over in the middle of the decade and then going
down again to 45,5% in 2012, see Table A.1 (HFA-DB, 2013).
A.3.2.2 Hospitals and patients
Acute care hospitals refer to short stay hospitals, which are providing diagnostics and
treatment on an in-patient basis. Treatments can be either surgical or non surgical, and
the hospitals are providing care for a wide range of medical conditions. Speciality
hospitals are not included in this category (HFA-DB, 2013).
WHO Regional Office for Europe defines discharges as the conclusion of treatment, and
upon that conclusion the patient is sent home, transferred to another facility or has died.
Cases where the hospital stays were shorter than 24 hours are registered separately
(HFA-DB, 2013).
In 2011 there were 1182 hospitals in Italy and 1025 of those were acute care hospitals.
Over all the number of hospitals and acute care hospitals have been decreasing, from
1321 and 1150 in 2000, respectively, see Table A.2. This reflects a number of 1,95
hospitals per 100 000 inhabitants in 2011, whereof 1,69 were acute care hospitals. The
hospital density has decreased somewhat since 2000, when there were 2,32 hospitals per
100 000 inhabitants, whereof 2,02 were acute care hospitals. The number of hospital
beds provided per 100 000 inhabitants were 342,66 in 2011 and of those 275,14 were
acute care hospital beds. Since 2000 there has been a decrease from 470,91 hospital beds
per 100 000 inhabitants, and of those 407,01 were in acute care hospitals, see Table 1. As
a percentage of all hospital beds 31,53% were in private hospitals in 2011, and the share
93
has not seen any radical fluctuations since the beginning of the 2000’s. This translates to
a total number of 65 557 private hospitals beds in 2011, and he absolute number has
been decreasing since 2003, when there were 71 972 private hospital beds, see Table A.2
(HFA-DB, 2013).
The number of in-patient discharges per a 100 population was 11,77 in 2011, a number
that has been decreasing since 2000, when it was 16,18. The average length of stay, for all
hospitals, was 8 days in 2012 and there has been an increasing trend since 2000 when it
was 7,7 days, see Table A.2 (HFA-DB, 2013).
In acute care hospitals the number of discharges per 100 citizens was 11,08 in 2012 and
there has been an over all decrease from 15,83 in 2000. The average length of stay in
acute care hospitals was 6,8 days in 2012, and it has been 7 or almost 7 days for the entire
period examined, see Table A.2 (HFA-DB, 2013).
The average number of outpatient visits to primary or ambulatory care per person was 7
in 2005 and 6,1 in 2000, other than those observation there was no data available, see
Table A.2 (HFA-DB, 2013).
A.3.2.3 Physicians
Breaking down the physicians into groups of specialties, five groups are considered,
namely: general practitioners, paediatric specialities, obstetric and gynaecological
specialties, surgical specialties and medical specialties. The last refers to a broad group of
specialities that focus on diagnosing a non-surgical treatment of medical conditions5.
Further, the numbers are reported as physical persons, rather than in the full time
equivalent form (HFA-DB, 2013).
The total number of physicians per 100 000 inhabitants in 2011 were 409,85, which was
an increase from 2009, when the number was 367,54, see Table 1. This corresponds to a
5 Including: Internal medicine, cardiology, endocrinology, gastroenterology, pulmonology, respiratory
medicine, oncology, gynaecologic oncology, immunology, rheumatology, neurology, oto-rhino-laryngology,
radiology, infectious diseases, microbiology-bacteriology, haematology, dermatology, pathology,
occupational medicine and medical interns or residents training in these specialties. The following are not
included: Surgery, obstetrics and gynaecology, paediatrics, psychiatry and general practitioners.
94
total number of physicians of 221 235 and 248 723, for 2009 and 2011, respectively.
When looking closer at the compositions of the groups of specialities, the medical
specialities had a density of 126,47 and 134,52 per 100 000 inhabitants for 2009 and 2011
respectively. The surgical specialities per 100 000 inhabitants were 83,17 in 2009 and
102,17 in 2011. Obstetric and gynaecological specialties had a density of 20,52 and 21,57
physicians per 100 000 inhabitants for the same years. The paediatric specialities have
had a stable amount of a little more than 12,5 physicians per 100 000 inhabitants since
2000. The number of general practitioners has however decreased since 2000, when it
was 82,83 GPs per 100 000 inhabitants to 75,9 GPs per 100 000 inhabitants in 2011. In
absolute numbers the densities correspond to, for medical specialties 76 124 in 2009 and
81 634 in 2011, for surgical specialties 50 060 in 2009 and 62 005 in 2011, for obstetric
and gynaecological specialities 12 349 in 2009 and 13 090 in 2011, for paediatric
specialties 7 155 in 2000 and 7 716 in 2011, and for GPs 47 148 in 2000 and 46 016 in
2011, see Table A.3 (HFA-DB, 2013).
A.3.2.4 Population composition
The crude death rate in Italy was 9,67 in 2010 per a 1000 people population, compared
to 2000, when it was 9,01, also in the following years it was close to 9 per a 1000 people
population. Total fertility rates were 1,26 in 2000, and after that it has been increasing to
1,41 in 2008, which is the most recent observation. The share of the Italian population
participating in the labour force has been increasing slightly between the years 2000 and
2007, from 41,3 to 41,78%, see Table A.4 (HFA-DB, 2013).
There were 14,05% of the population between the ages 0 and 14 years old in 2010, a
number that has decreased slightly, without large fluctuations since the years 2000, when
it was 14,31%. The portion of the population older than 65 years old has increased, from
being 18,11 to 20,26% of the population in 2010. Looking at the male population there
are 14,88% aged between 0 and 14 years old, and 17,6% of the male population aged
above 65 years old. The share of the males between 0 and 14 years old has decreased,
from being 15,17% of the population in 2000, and the share over 65 has increased
compared to in 2000, when this age category represented 15,36% of the male population.
Regarding the female population, the share between 0 and14 years old has gone from
being 13,5% in 2000, to being 13,26% in 2010, showing the same small decrease as the
male population. The share belonging to the over 65 years olds, again shows s similar
95
trend to the male population, as it has increased from 20,69 to 22,77% of the female
population between the years 2000 and 2010, see Table A.4 (HFA-DB, 2013).
A.3.2.5 Life expectancy
Life expectancy at birth was 82,5 years in 2010, compared to 79,92 years in 2000, see
Table 2. At the age of 1 the life expectancy was 81,77 in 2010 and in 2000 it was 79,11
years, then adding up to a total of 82,77 and 80,11 life years respectively. When the
average individual is 15 the life expectancy was 67,89 years in 2010 and 65,26 in 2000,
estimating 82,89 and 80,26 life years, respectively. Being 45 years old in 2010 gives a life
expectancy of 38,69 years and the same for 2000 was 36,39 years. Then the predicted
total amount of life years is 83,69 and 81,39 years, respectively. The life expectancy at the
age of 65 in 2010 was 20,76 and 18,83 in 2000, totalling in 85,76 and 83,83 life years,
respectively. In the World Health Report the estimated life expectancy in 2000 and 2011
was 79 and 82 years, respectively, see Table A.5 (HFA-DB, 2013).
At birth the male life expectancy was 79,75 years in 2010 and 76,65 years in 2000, see
Table 2. When the average male reached 1 year old the life expectancy was 79,03 years in
2010 and in 2000 it was 76,01 years. In total life years it corresponds to 80,03 and 77,01,
for the respective observations. At the age of 15 the average male is expected to live an
additional 65,15 years in 2010 and 62,17 years in 2000, giving a total of 80,15 and 77,17
life years. When reaching the age of 45 the life expectancy was 36,2 years in 2010 and
33,66 in 2000, which corresponds to 81,2 and 78,66 life years in total. By the age of 65
the average Italian male is expected to live for an additional 18,67 years in 2010 and 16,63
years in 2000, adding up to 83,67 and 81,63 total life years, for 2010 and 2000,
respectively. Finally, according to the World Health Report the expected male life
expectancy was 80 years in 2011 and 77 years in 2000, see Table A.5 (HFA-DB, 2013).
The life expectancy for Italian females at birth was 85,04 years in 2010 and 82,68 years in
2000, see Table 2. At age 1 the average Italian female was expected to life for an
additional 84,3 years in 2010 an 82,02 years in 2000, corresponding to a total of 85,3 and
83,02 life years, respectively. At the age of 15 life expectancy was 70,41 years in 2010 and
in 2000 it was 68,17 years, thus with a total number of life years of 85,41 and 83,17 years,
respectively. By the age of 45 the life expectancy was 40,93 in 2010 and 38,87 in 2000,
with a total of 85,93 and 83,87 life years, respectively. For the 65 years olds the life
96
expectancy was 22,51 years in 2010 and 20,65 in 2000, thus with a total number of life
years of 87,51 and 85,65 years, respectively. According to the estimation of the World
Health Report, the female life expectancy was 85 years in 2011 and 82 year in 2000, see
Table A.5 (HFA-DB, 2013).
A.3.2.6 Healthy life years
The average Italian woman would be expected to have 61,5 healthy life years, in absolute
terms in 2012, which is a decrease compared to 2004, when the average woman had 71
healthy life years at birth, as well as the following years, see Table 2. If 50 years old, the
healthy life expectancy for an average Italian woman would be 16,9 years in 2012, which
is a decrease from 2004 when it was 24,1 healthy life years when 50 years old. This
decrease has been gradual since 2004. Again, by the age of 65, there has been a gradual
decrease of expected healthy life years, from 12,5 years in 2004 to 7,2 healthy remaining
life years in 2012, see Table A.6 (Eurostat, 2013a).
In absolute terms, the average Italian male would be expected to have 62,1 healthy life
years in 2012, which, like for the Italian women, has been decreasing since 2004, when
for the men the healthy life expectancy was 68,7 years, see Table 2. By the age of 50, the
average Italian man could expect to have 17,5 healthy life years, which is, as for the
women a decrease from the 2004 level of 22,6 years, but this decrease has been more
fluctuating than that of the women. Counting the healthy remaining life years from the
age of 65, there has been a fluctuating decrease since 2004, when the average man could
expect to live healthily for an additional 11,4 years, but in 2012 this has decreased to 7,8
years, see Table A.6 (Eurostat, 2013a).
When the healthy life expectancy is calculated with the self-perceived health, the average
female will have 74,1 healthy years of life at birth, in 2011. The development from 2004,
when it was 74,5 healthy years, has been fluctuating between 74,1 and 76,5 healthy years.
When reaching the age of 50, the average woman can expect 26,1 healthy life years in
2011, when this is calculated using perceived health. The development since 2004 has
been fluctuating, with a top notation of 28,3 healthy years in 2010 and a bottom notation
of 26,1 in 2011. Other than those, they vary between 26,6 and 27,3 healthy years. By the
age of 65 the expected healthy life years were 13,9 in 2011, and since 2004, when it was
14,4, there has been a lot of fluctuations, as for the calculations of the healthy life
97
expectancy from age 50. The highest notation was in 2010, with 15,7 healthy years and
the lowest in 2011, see Table A.6 (Eurostat, 2013a).
When the healthy life expectancy is calculated with the self-perceived health, the average
male will have 72,4 healthy years at birth, in 2011. The number has been increasing from
2004, when it was 71,9 until 2010, when it was 74,3 healthy years. When 50 years old, the
healthy life expectancy was 25,1healthy years in 2011, and the trend was increasing from
2004 until 2010, 24,8 to 26,6 healthy years. At age 65, the healthy years expected, based
on self-perceived health, were 13,3 healthy years in 2011, with a similar development
over time as the healthy life expectancy from 50 years of age, see Table A.6 (Eurostat,
2013a).
A.3.2.7 Self-perceived health
There were 13,7% of the Italian population that perceived their health to be very good in
2012, and the number has been fluctuating between 12,3 and 14,9% since 2004. The
majority of the population, 54,7%, perceived that they were in good health in 2012, and
this category has represented a majority if the population since 2007, the three years
before it was below 45% of the population, see Table 2. Further, 19,2% perceived that
they were in fair health, and this share has been decreasing since 2004, when it was 21%.
For the category bad health there were 9,5% of the population, with an over all increase
since 2004, when this category represented 8,5% of the population. Finally, 2,9%
considered themselves being in very bad health in 2012, with a fluctuating increase since
2004, see Table A.7 (Eurostat, 2013a).
The over all time trends when looking at the male and female part of the population
separately, are over all the same as for the entire population together, where there is a
fluctuating trend for the very good health, the good health is increasing and ending up in
majority, or close to majority, the fair health category is decreasing and the categories for
bad and very bad health are increasing, see Table A.7 (Eurostat, 2013a).
Of the male population 15,5% perceived themselves to be in very good health in 2012,
56,7% in good health, 17,4% in fair health, 7,8% in bad health and 2,7% in very bad
health. For the females the same perceptions are, 12,1% in very good health, 52,9% in
98
good health, 20,8% in fair health, 11% in bad health and 3,2% in very bad health, see
Table A.7 (Eurostat, 2013a).
A.3.2.8 Morbidity
Among the Italian population in 2012, there were a total of 23% with a long-term illness
or health problem. The same number for 2004 was 21,1%, and the share was varying
between this and 22% until 2011 when it increased to 25,3%, see Table 2. Looking at the
different age groups, there were 5% of all 16-24 year olds suffering from a long term
health problem, and since 2004 there has been fluctuations, with top notations of 6,4 and
6,3% in 2006 and 2010, respectively and a bottom notation in 2004, of 3,9%. The same
numbers for the age group of 25-34 year olds there were a bit above 7% of the
population for most of the time period examined, apart from peaks, of 9,4, 8,8 and 9,2%
in 2006, 2008 and 2010, respectively. Also there was a decrease in 2012 to 5,8% of the
population, which is a bottom notation of the time period examined. The next age
category, 35-44, there were also fluctuations, between 13,4% in 2006 and 10,7% in 2012.
Fluctuations were also found in the share of the long term ill in the age group 45-54,
where the share was varying between 20,8 and 16,4% in 2011 and 2007, respectively. The
2012 level was 17,1% of the population suffering from a long-term health problem. Of
the 55-64 years olds 27,8% were having long-term health problems, and the share has
been varying since 2004, between 31,1 and 23,4%. Among the 65-74 year olds there were
41,8% suffering long-term problems, and also here it has been varying since 2004, with a
top notation of 45,1% in 2011 and 36,3% in 2006. For the persons with an age of 75
years or older, there has been an over all increase of the long term ill, from 53,5% in
2004 to 61,8% in 2012, see Table A.8 (Eurostat, 2013a).
For the males and females separately there is the same trends of fluctuations around a
certain level, except for the category of 75 years or older where there is an increase, and
in most cases the 2012 level is within the extreme values and thus the 2012 numbers will
be presented, except for the category of 75 years or older where the 2004 level will be
presented also, see Table A.8 (Eurostat, 2013a).
Among the Italian males there were 21,2% suffering from a long-standing illness or
health problem in 2012. Looking closer at the age groups, the same number for the 16-
24 year olds was 5,2%, for the 25-34 year olds 6,1%, for the 35-44 year olds 10,1%, for
99
the 45-54 year olds 16,5%, for the 55-64 year olds 26,8%, for the 65-74 year olds 40%
and for the 75 years or older, 57,1% suffered a long standing illness or health problem.
This final category had an increase from 2004, when 50,3% suffering from a long-
standing illness or health problem, see Table A.8 (Eurostat, 2013a).
For the women, there was a total of 37,2% suffering from a long-term illness or health
problem in 2012. For the age groups, there were 4,8% of the 16-24 year olds with a long
standing health problem, 5,6% of the 25-34 year olds, 11,3% of the 35-44 year olds,
17,6% of the 45-54 year olds, 28,9% of the 55-65 year olds, 42,7% of the 65-74 year olds,
and 64,8% of the 75 years or older, which had an increase from 55,4% in 2004, see Table
A.8 (Eurostat, 2013a).
Of the share of the population suffering from a long-standing illness or health problem,
19,6% stated that they have some limitation in their usual activities due to their sickness
or health problem in 2012. There has been an increase from 2004 when there were 9,3%
stating the same thing, however, the major part of this increase occurred between 2004
and 2007, where it went from 9,3 to 18,3%. The share stating that they have severe
problems has also increased, but not as dramatically, from 5,4% in 2004 to 8,6% in 2012.
As for the part stating that they experience no limitation in usual activities there were
85,3% stating this in 2004, and 71,8% in 2012, see Table A.8 (Eurostat, 2013a).
The males of this category there were 17,8% stating that they had some limitation in
usual activities caused by their long-term illness or health problem in 2012. This share
has increased since 2004 when it was 8%, and like for the total of this population the
largest increase was between 2004 and 2007, when it went from 8 to 15,6%. For that part
stating that they experience severe limitation, this share accounted for 7,3% in 2012,
which is an increase from 4,8% in 2004. As for the share stating no limitations there were
75% in 2012, compared to 87,2% in 2004, see Table A.8 (Eurostat, 2013a).
Among the women suffering from a long-term illness or health problem, 21,3% stated
that they experienced some limitation due to their health status. As for the total and male
population, there was a significant increase of this share between 2004 and 2007, which
for the women was from 10,5 to 20,9. After that, it has stayed above 21%, except for in
2010, when there were 16% stating some limitations. There was also an increase among
100
the ones stating severe limitations, from 6% in 2004 to 9,9% in 2012. The share stating
no limitations decreased fro 83,5% in 2004 to being 68,8% in 2012, see Table A.8
(Eurostat, 2013a).
The share of the male population reporting that they had a body mass index, BMI, of 25
or higher, i.e. were overweight or obese, was 56,2% in 2011. This can be compared to the
same number for 2005, when 54,0% reported the same thing, see table A.8.34 (OECD,
26, 2013). For women, the same numbers were 36,1 and 35,9, for 2011 and 2005,
respectively. The female self reported overweight and obesity has declined from 2010,
when it was 37,2%, which is the top notation for the time frame examined, see Table A.8
(OECD, 25, 2013).
A.3.2.9 Infant and maternal health
For the infant, as well as the maternal, mortality data there is a gap in 2004 and 2005
where there are no observations in these categories. The infant mortality has decreased in
Italy since the year 2000, when 3,42 infants per 1000 live births died, compared to 3,35
deaths in 2010, see Table 2. Among male infants the mortality was 3,63 per 1000 live
births in 2010, compared to 4,73 in 2000. The female infant mortality has also been
decreasing and was 3,05 deaths per 1000 live births in 2010, compared to 4,2 in 2000, see
Table A.9 (HFA-DB, 2013).
Maternal death rates have fluctuated a lot over the chosen period, with a maximum
notation in 2003 with 5,18 deaths per 100 000 live births, and with a lowest notation 1,97
in 2006. The most recent notation, in 2010, was 2,87 deaths per 100 000 live births, see
Table 2. The number of abortions per 1000 live births has been decreasing from 342,54
abortions per 1000 live births in 2000 to 203,33 abortions in 2009, which is the most
recent observation, see Table A.9 (HFA-DB, 2013).
In 2011, 96% of Italian infants were vaccinated against diphtheria, tetanus, pertussis,
poliomyelitis and hepatitis b, 90% against measles, and 96% against invasive disease due
to haemophilius influenzae type b. concerning vaccination against rubella, the most
recent number is from 2006, when it was 87,3% of the infants that were vaccinated.
There is no real data for this period on vaccination against tuberculosis, other than two
notations of 1% in 2000 and 2001, see Table A.9 (HFA-DB, 2013).
101
A.3.2.10 Patient satisfaction
Here the percentage of the respective populations that stated that they had no unmet
needs, with regards to the medical examination they received, will be presented and this
measure will be considered as satisfaction, i.e. the assumption is that if there are no
unmet needs to declare, the patient is satisfied with the examination and care received.
This is in all cases the vast majority of the population, and the remaining categories for
dissatisfaction are several, and thus the percentage for each category will be rather small,
however, the numbers for waiting lists will be presented, since this is one of the noted
differences between the structure of the different health care systems. The remaining
categories will be treated as having unmet needs in general.
The share of the population stating that they have no unmet needs in their contact with
the health care system were 93,6% in 2012, and 2006, and this has been varying between
92,5% in 2004 and the 2012 level. This corresponds to 6,4% stating that there were
unmet needs of some kind. The share stating that their dissatisfaction was caused by long
waiting lists were 0,7% of the population. This number has been decreasing since 2004,
when it was 1,5%, see Table 3 (Eurostat, 2013b).
Among the part of the population aged between 16 and 64 years old, 94% were not
having unmet needs in 2012. This share has been varying between 93 and 94% since
2004. This results in a share between 6 and 7% of this age group stating that they have
unmet needs. The share of the age group having their unmet needs caused by long
waiting lists were 0,5%, which is a decrease from 1,3% in 2004. For the older age group,
of 65 years of age or older, there was 92,2% that had no unmet needs. There have been
variations since 2004, when it was 90,9%, which is also the lowest notation, but the
variations have been close to 92%. This entails a total of 7,8% in 2012 who had unmet
needs in 2012. The percentage stating that their unmet needs were caused by waiting lists
were 1,2% in 2012, which is a decrease from 2,4% in 2004, see Table A.10 (Eurostat,
2013b)
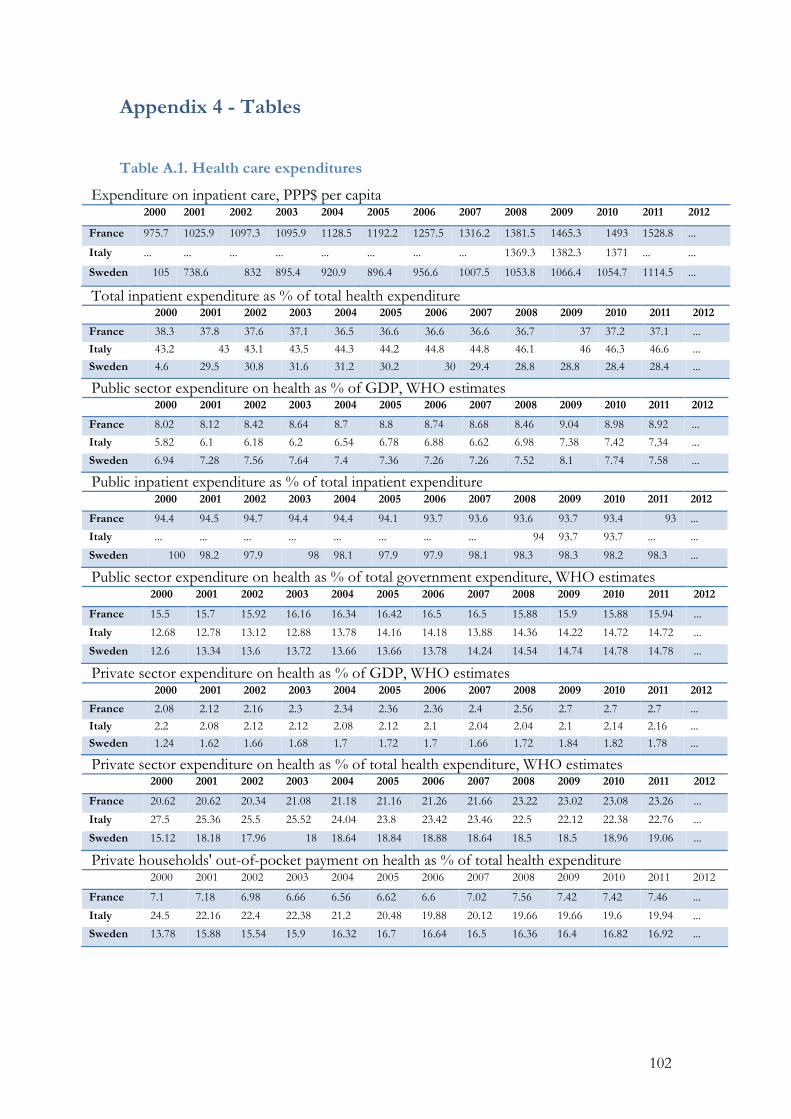
102
Appendix 4 - Tables
Table A.1. Health care expenditures
Expenditure on inpatient care, PPP$ per capita 2000 2001 2002 2003 2004 2005 2006 2007 2008 2009 2010 2011 2012
France 975.7 1025.9 1097.3 1095.9 1128.5 1192.2 1257.5 1316.2 1381.5 1465.3 1493 1528.8 ...
Italy ... ... ... ... ... ... ... ... 1369.3 1382.3 1371 ... ...
Sweden 105 738.6 832 895.4 920.9 896.4 956.6 1007.5 1053.8 1066.4 1054.7 1114.5 ...
Total inpatient expenditure as % of total health expenditure 2000 2001 2002 2003 2004 2005 2006 2007 2008 2009 2010 2011 2012
France 38.3 37.8 37.6 37.1 36.5 36.6 36.6 36.6 36.7 37 37.2 37.1 ...
Italy 43.2 43 43.1 43.5 44.3 44.2 44.8 44.8 46.1 46 46.3 46.6 ...
Sweden 4.6 29.5 30.8 31.6 31.2 30.2 30 29.4 28.8 28.8 28.4 28.4 ...
Public sector expenditure on health as % of GDP, WHO estimates 2000 2001 2002 2003 2004 2005 2006 2007 2008 2009 2010 2011 2012
France 8.02 8.12 8.42 8.64 8.7 8.8 8.74 8.68 8.46 9.04 8.98 8.92 ...
Italy 5.82 6.1 6.18 6.2 6.54 6.78 6.88 6.62 6.98 7.38 7.42 7.34 ...
Sweden 6.94 7.28 7.56 7.64 7.4 7.36 7.26 7.26 7.52 8.1 7.74 7.58 ...
Public inpatient expenditure as % of total inpatient expenditure 2000 2001 2002 2003 2004 2005 2006 2007 2008 2009 2010 2011 2012
France 94.4 94.5 94.7 94.4 94.4 94.1 93.7 93.6 93.6 93.7 93.4 93 ...
Italy ... ... ... ... ... ... ... ... 94 93.7 93.7 ... ...
Sweden 100 98.2 97.9 98 98.1 97.9 97.9 98.1 98.3 98.3 98.2 98.3 ...
Public sector expenditure on health as % of total government expenditure, WHO estimates 2000 2001 2002 2003 2004 2005 2006 2007 2008 2009 2010 2011 2012
France 15.5 15.7 15.92 16.16 16.34 16.42 16.5 16.5 15.88 15.9 15.88 15.94 ...
Italy 12.68 12.78 13.12 12.88 13.78 14.16 14.18 13.88 14.36 14.22 14.72 14.72 ...
Sweden 12.6 13.34 13.6 13.72 13.66 13.66 13.78 14.24 14.54 14.74 14.78 14.78 ...
Private sector expenditure on health as % of GDP, WHO estimates 2000 2001 2002 2003 2004 2005 2006 2007 2008 2009 2010 2011 2012
France 2.08 2.12 2.16 2.3 2.34 2.36 2.36 2.4 2.56 2.7 2.7 2.7 ... Italy 2.2 2.08 2.12 2.12 2.08 2.12 2.1 2.04 2.04 2.1 2.14 2.16 ... Sweden 1.24 1.62 1.66 1.68 1.7 1.72 1.7 1.66 1.72 1.84 1.82 1.78 ...
Private sector expenditure on health as % of total health expenditure, WHO estimates 2000 2001 2002 2003 2004 2005 2006 2007 2008 2009 2010 2011 2012
France 20.62 20.62 20.34 21.08 21.18 21.16 21.26 21.66 23.22 23.02 23.08 23.26 ...
Italy 27.5 25.36 25.5 25.52 24.04 23.8 23.42 23.46 22.5 22.12 22.38 22.76 ...
Sweden 15.12 18.18 17.96 18 18.64 18.84 18.88 18.64 18.5 18.5 18.96 19.06 ...
Private households' out-of-pocket payment on health as % of total health expenditure 2000 2001 2002 2003 2004 2005 2006 2007 2008 2009 2010 2011 2012
France 7.1 7.18 6.98 6.66 6.56 6.62 6.6 7.02 7.56 7.42 7.42 7.46 ...
Italy 24.5 22.16 22.4 22.38 21.2 20.48 19.88 20.12 19.66 19.66 19.6 19.94 ...
Sweden 13.78 15.88 15.54 15.9 16.32 16.7 16.64 16.5 16.36 16.4 16.82 16.92 ...
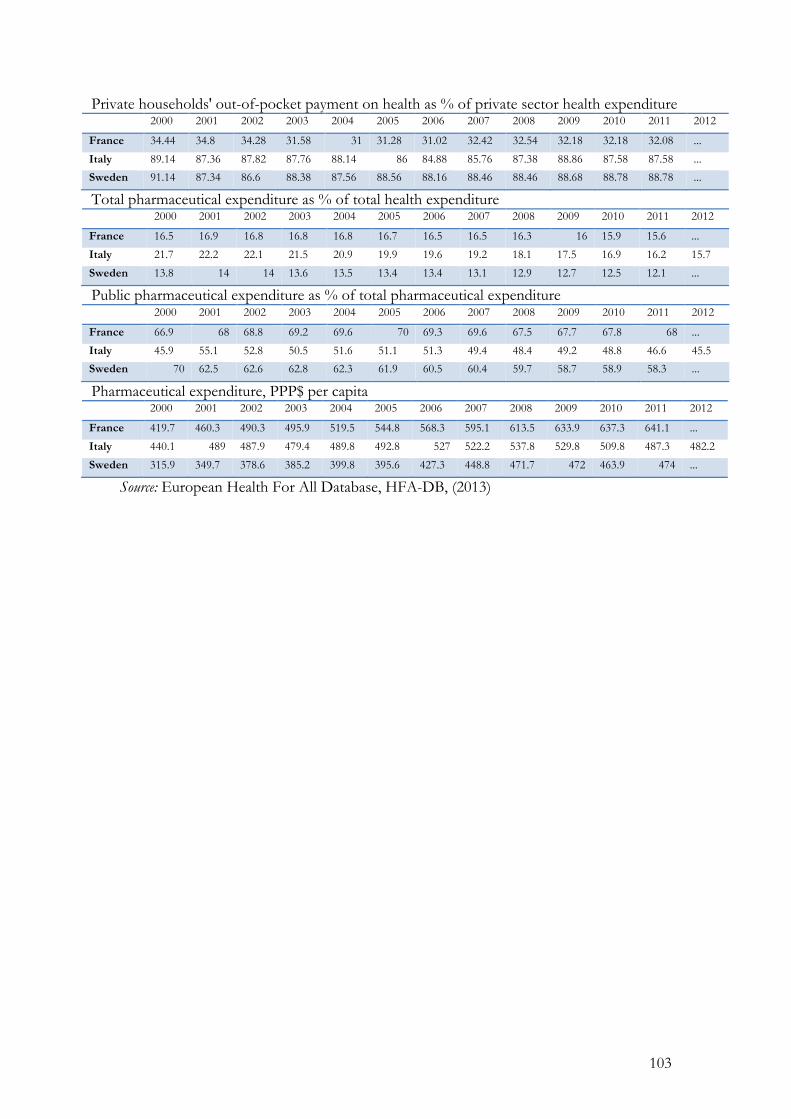
103
Private households' out-of-pocket payment on health as % of private sector health expenditure 2000 2001 2002 2003 2004 2005 2006 2007 2008 2009 2010 2011 2012
France 34.44 34.8 34.28 31.58 31 31.28 31.02 32.42 32.54 32.18 32.18 32.08 ...
Italy 89.14 87.36 87.82 87.76 88.14 86 84.88 85.76 87.38 88.86 87.58 87.58 ...
Sweden 91.14 87.34 86.6 88.38 87.56 88.56 88.16 88.46 88.46 88.68 88.78 88.78 ...
Total pharmaceutical expenditure as % of total health expenditure 2000 2001 2002 2003 2004 2005 2006 2007 2008 2009 2010 2011 2012
France 16.5 16.9 16.8 16.8 16.8 16.7 16.5 16.5 16.3 16 15.9 15.6 ...
Italy 21.7 22.2 22.1 21.5 20.9 19.9 19.6 19.2 18.1 17.5 16.9 16.2 15.7
Sweden 13.8 14 14 13.6 13.5 13.4 13.4 13.1 12.9 12.7 12.5 12.1 ...
Public pharmaceutical expenditure as % of total pharmaceutical expenditure 2000 2001 2002 2003 2004 2005 2006 2007 2008 2009 2010 2011 2012
France 66.9 68 68.8 69.2 69.6 70 69.3 69.6 67.5 67.7 67.8 68 ...
Italy 45.9 55.1 52.8 50.5 51.6 51.1 51.3 49.4 48.4 49.2 48.8 46.6 45.5
Sweden 70 62.5 62.6 62.8 62.3 61.9 60.5 60.4 59.7 58.7 58.9 58.3 ...
Pharmaceutical expenditure, PPP$ per capita 2000 2001 2002 2003 2004 2005 2006 2007 2008 2009 2010 2011 2012
France 419.7 460.3 490.3 495.9 519.5 544.8 568.3 595.1 613.5 633.9 637.3 641.1 ...
Italy 440.1 489 487.9 479.4 489.8 492.8 527 522.2 537.8 529.8 509.8 487.3 482.2
Sweden 315.9 349.7 378.6 385.2 399.8 395.6 427.3 448.8 471.7 472 463.9 474 ...
Source: European Health For All Database, HFA-DB, (2013)
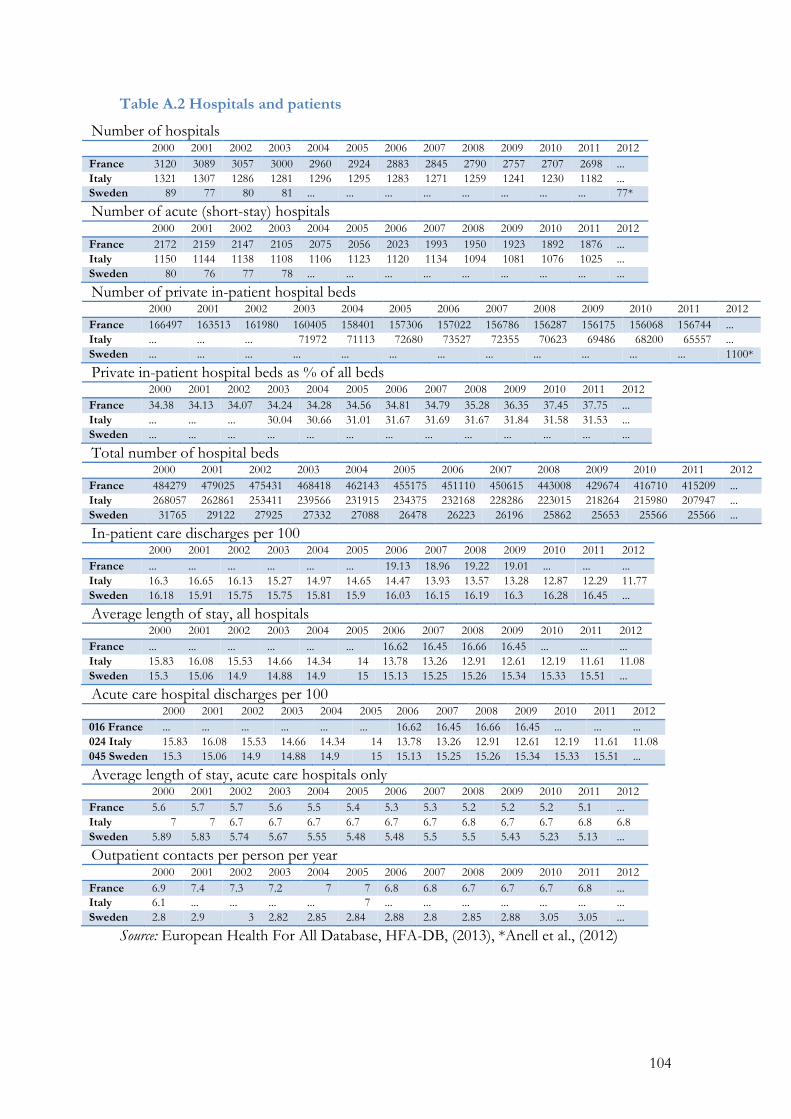
104
Table A.2 Hospitals and patients
Number of hospitals 2000 2001 2002 2003 2004 2005 2006 2007 2008 2009 2010 2011 2012 France 3120 3089 3057 3000 2960 2924 2883 2845 2790 2757 2707 2698 ... Italy 1321 1307 1286 1281 1296 1295 1283 1271 1259 1241 1230 1182 ... Sweden 89 77 80 81 ... ... ... ... ... ... ... ... 77*
Number of acute (short-stay) hospitals 2000 2001 2002 2003 2004 2005 2006 2007 2008 2009 2010 2011 2012 France 2172 2159 2147 2105 2075 2056 2023 1993 1950 1923 1892 1876 ... Italy 1150 1144 1138 1108 1106 1123 1120 1134 1094 1081 1076 1025 ... Sweden 80 76 77 78 ... ... ... ... ... ... ... ... ...
Number of private in-patient hospital beds 2000 2001 2002 2003 2004 2005 2006 2007 2008 2009 2010 2011 2012 France 166497 163513 161980 160405 158401 157306 157022 156786 156287 156175 156068 156744 ... Italy ... ... ... 71972 71113 72680 73527 72355 70623 69486 68200 65557 ... Sweden ... ... ... ... ... ... ... ... ... ... ... ... 1100*
Private in-patient hospital beds as % of all beds 2000 2001 2002 2003 2004 2005 2006 2007 2008 2009 2010 2011 2012 France 34.38 34.13 34.07 34.24 34.28 34.56 34.81 34.79 35.28 36.35 37.45 37.75 ... Italy ... ... ... 30.04 30.66 31.01 31.67 31.69 31.67 31.84 31.58 31.53 ... Sweden ... ... ... ... ... ... ... ... ... ... ... ... ...
Total number of hospital beds 2000 2001 2002 2003 2004 2005 2006 2007 2008 2009 2010 2011 2012 France 484279 479025 475431 468418 462143 455175 451110 450615 443008 429674 416710 415209 ... Italy 268057 262861 253411 239566 231915 234375 232168 228286 223015 218264 215980 207947 ... Sweden 31765 29122 27925 27332 27088 26478 26223 26196 25862 25653 25566 25566 ...
In-patient care discharges per 100 2000 2001 2002 2003 2004 2005 2006 2007 2008 2009 2010 2011 2012 France ... ... ... ... ... ... 19.13 18.96 19.22 19.01 ... ... ... Italy 16.3 16.65 16.13 15.27 14.97 14.65 14.47 13.93 13.57 13.28 12.87 12.29 11.77 Sweden 16.18 15.91 15.75 15.75 15.81 15.9 16.03 16.15 16.19 16.3 16.28 16.45 ...
Average length of stay, all hospitals 2000 2001 2002 2003 2004 2005 2006 2007 2008 2009 2010 2011 2012 France ... ... ... ... ... ... 16.62 16.45 16.66 16.45 ... ... ... Italy 15.83 16.08 15.53 14.66 14.34 14 13.78 13.26 12.91 12.61 12.19 11.61 11.08 Sweden 15.3 15.06 14.9 14.88 14.9 15 15.13 15.25 15.26 15.34 15.33 15.51 ...
Acute care hospital discharges per 100 2000 2001 2002 2003 2004 2005 2006 2007 2008 2009 2010 2011 2012 016 France ... ... ... ... ... ... 16.62 16.45 16.66 16.45 ... ... ... 024 Italy 15.83 16.08 15.53 14.66 14.34 14 13.78 13.26 12.91 12.61 12.19 11.61 11.08 045 Sweden 15.3 15.06 14.9 14.88 14.9 15 15.13 15.25 15.26 15.34 15.33 15.51 ...
Average length of stay, acute care hospitals only 2000 2001 2002 2003 2004 2005 2006 2007 2008 2009 2010 2011 2012 France 5.6 5.7 5.7 5.6 5.5 5.4 5.3 5.3 5.2 5.2 5.2 5.1 ... Italy 7 7 6.7 6.7 6.7 6.7 6.7 6.7 6.8 6.7 6.7 6.8 6.8 Sweden 5.89 5.83 5.74 5.67 5.55 5.48 5.48 5.5 5.5 5.43 5.23 5.13 ...
Outpatient contacts per person per year 2000 2001 2002 2003 2004 2005 2006 2007 2008 2009 2010 2011 2012 France 6.9 7.4 7.3 7.2 7 7 6.8 6.8 6.7 6.7 6.7 6.8 ... Italy 6.1 ... ... ... ... 7 ... ... ... ... ... ... ... Sweden 2.8 2.9 3 2.82 2.85 2.84 2.88 2.8 2.85 2.88 3.05 3.05 ...
Source: European Health For All Database, HFA-DB, (2013), *Anell et al., (2012)
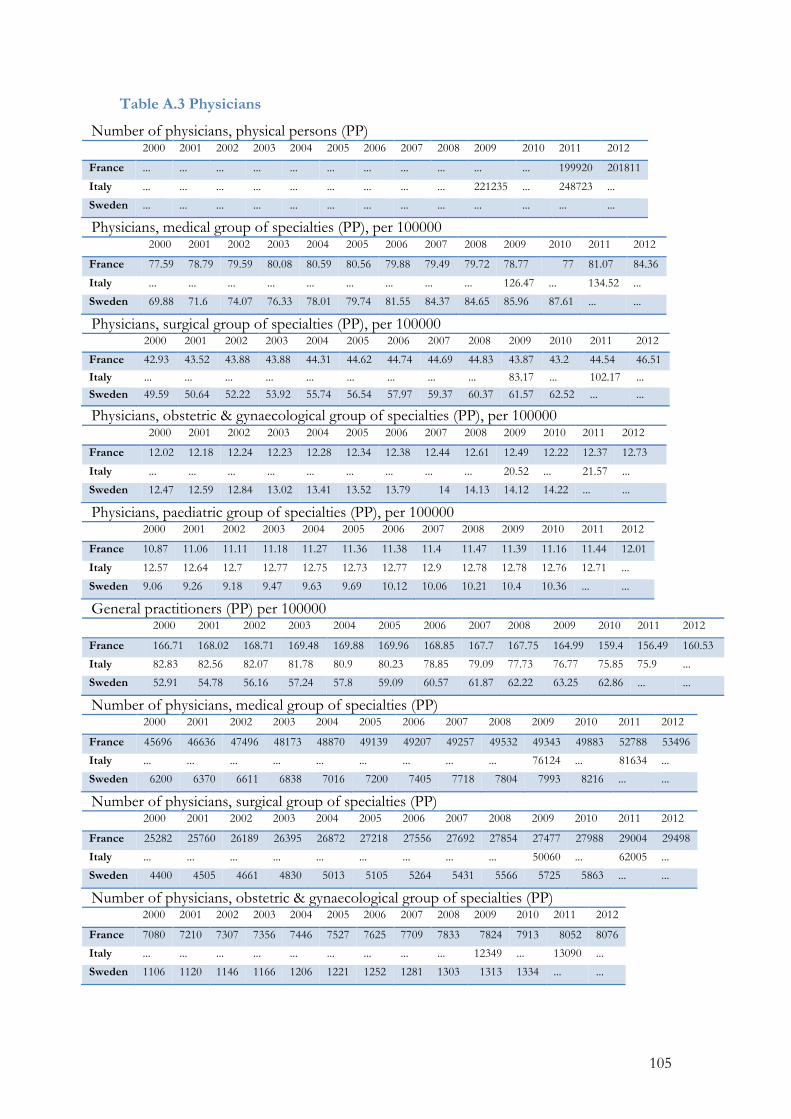
105
Table A.3 Physicians
Number of physicians, physical persons (PP) 2000 2001 2002 2003 2004 2005 2006 2007 2008 2009 2010 2011 2012
France ... ... ... ... ... ... ... ... ... ... ... 199920 201811
Italy ... ... ... ... ... ... ... ... ... 221235 ... 248723 ...
Sweden ... ... ... ... ... ... ... ... ... ... ... ... ...
Physicians, medical group of specialties (PP), per 100000 2000 2001 2002 2003 2004 2005 2006 2007 2008 2009 2010 2011 2012
France 77.59 78.79 79.59 80.08 80.59 80.56 79.88 79.49 79.72 78.77 77 81.07 84.36
Italy ... ... ... ... ... ... ... ... ... 126.47 ... 134.52 ...
Sweden 69.88 71.6 74.07 76.33 78.01 79.74 81.55 84.37 84.65 85.96 87.61 ... ...
Physicians, surgical group of specialties (PP), per 100000 2000 2001 2002 2003 2004 2005 2006 2007 2008 2009 2010 2011 2012
France 42.93 43.52 43.88 43.88 44.31 44.62 44.74 44.69 44.83 43.87 43.2 44.54 46.51
Italy ... ... ... ... ... ... ... ... ... 83.17 ... 102.17 ... Sweden 49.59 50.64 52.22 53.92 55.74 56.54 57.97 59.37 60.37 61.57 62.52 ... ...
Physicians, obstetric & gynaecological group of specialties (PP), per 100000 2000 2001 2002 2003 2004 2005 2006 2007 2008 2009 2010 2011 2012
France 12.02 12.18 12.24 12.23 12.28 12.34 12.38 12.44 12.61 12.49 12.22 12.37 12.73
Italy ... ... ... ... ... ... ... ... ... 20.52 ... 21.57 ...
Sweden 12.47 12.59 12.84 13.02 13.41 13.52 13.79 14 14.13 14.12 14.22 ... ...
Physicians, paediatric group of specialties (PP), per 100000 2000 2001 2002 2003 2004 2005 2006 2007 2008 2009 2010 2011 2012
France 10.87 11.06 11.11 11.18 11.27 11.36 11.38 11.4 11.47 11.39 11.16 11.44 12.01
Italy 12.57 12.64 12.7 12.77 12.75 12.73 12.77 12.9 12.78 12.78 12.76 12.71 ...
Sweden 9.06 9.26 9.18 9.47 9.63 9.69 10.12 10.06 10.21 10.4 10.36 ... ...
General practitioners (PP) per 100000 2000 2001 2002 2003 2004 2005 2006 2007 2008 2009 2010 2011 2012
France 166.71 168.02 168.71 169.48 169.88 169.96 168.85 167.7 167.75 164.99 159.4 156.49 160.53
Italy 82.83 82.56 82.07 81.78 80.9 80.23 78.85 79.09 77.73 76.77 75.85 75.9 ...
Sweden 52.91 54.78 56.16 57.24 57.8 59.09 60.57 61.87 62.22 63.25 62.86 ... ...
Number of physicians, medical group of specialties (PP) 2000 2001 2002 2003 2004 2005 2006 2007 2008 2009 2010 2011 2012
France 45696 46636 47496 48173 48870 49139 49207 49257 49532 49343 49883 52788 53496
Italy ... ... ... ... ... ... ... ... ... 76124 ... 81634 ...
Sweden 6200 6370 6611 6838 7016 7200 7405 7718 7804 7993 8216 ... ...
Number of physicians, surgical group of specialties (PP) 2000 2001 2002 2003 2004 2005 2006 2007 2008 2009 2010 2011 2012
France 25282 25760 26189 26395 26872 27218 27556 27692 27854 27477 27988 29004 29498
Italy ... ... ... ... ... ... ... ... ... 50060 ... 62005 ...
Sweden 4400 4505 4661 4830 5013 5105 5264 5431 5566 5725 5863 ... ...
Number of physicians, obstetric & gynaecological group of specialties (PP) 2000 2001 2002 2003 2004 2005 2006 2007 2008 2009 2010 2011 2012
France 7080 7210 7307 7356 7446 7527 7625 7709 7833 7824 7913 8052 8076
Italy ... ... ... ... ... ... ... ... ... 12349 ... 13090 ...
Sweden 1106 1120 1146 1166 1206 1221 1252 1281 1303 1313 1334 ... ...
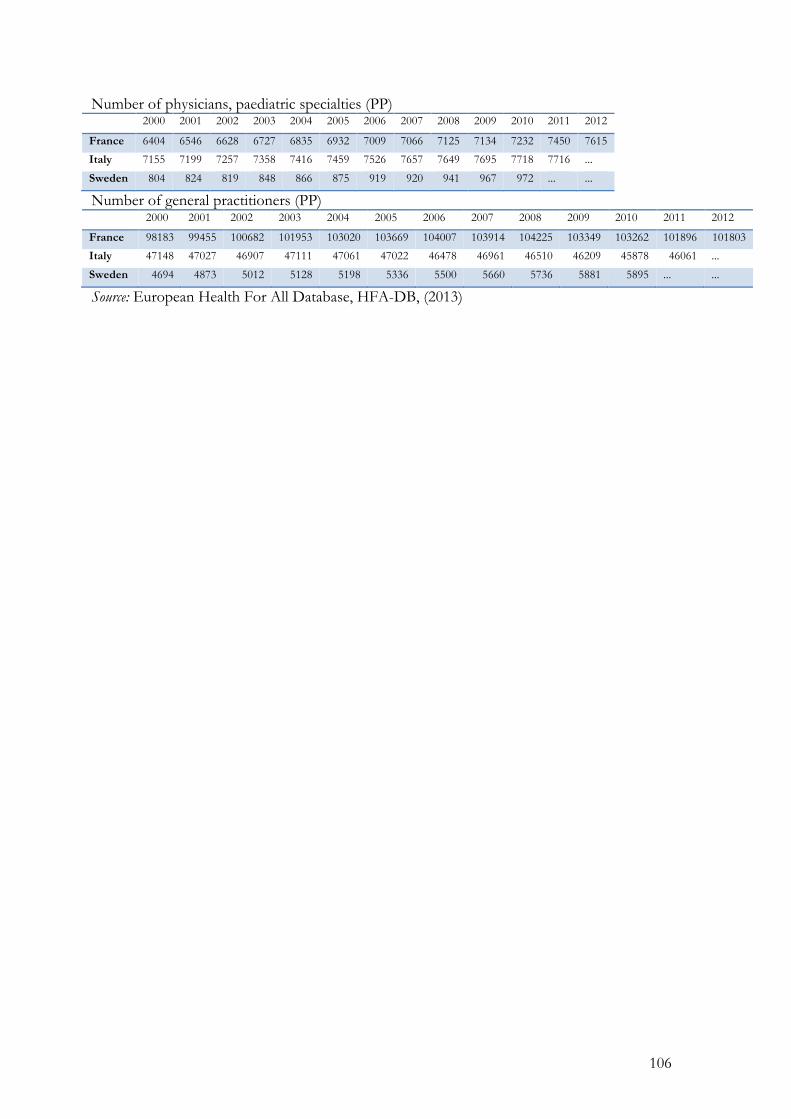
106
Number of physicians, paediatric specialties (PP) 2000 2001 2002 2003 2004 2005 2006 2007 2008 2009 2010 2011 2012
France 6404 6546 6628 6727 6835 6932 7009 7066 7125 7134 7232 7450 7615
Italy 7155 7199 7257 7358 7416 7459 7526 7657 7649 7695 7718 7716 ...
Sweden 804 824 819 848 866 875 919 920 941 967 972 ... ...
Number of general practitioners (PP) 2000 2001 2002 2003 2004 2005 2006 2007 2008 2009 2010 2011 2012
France 98183 99455 100682 101953 103020 103669 104007 103914 104225 103349 103262 101896 101803
Italy 47148 47027 46907 47111 47061 47022 46478 46961 46510 46209 45878 46061 ...
Sweden 4694 4873 5012 5128 5198 5336 5500 5660 5736 5881 5895 ... ...
Source: European Health For All Database, HFA-DB, (2013)
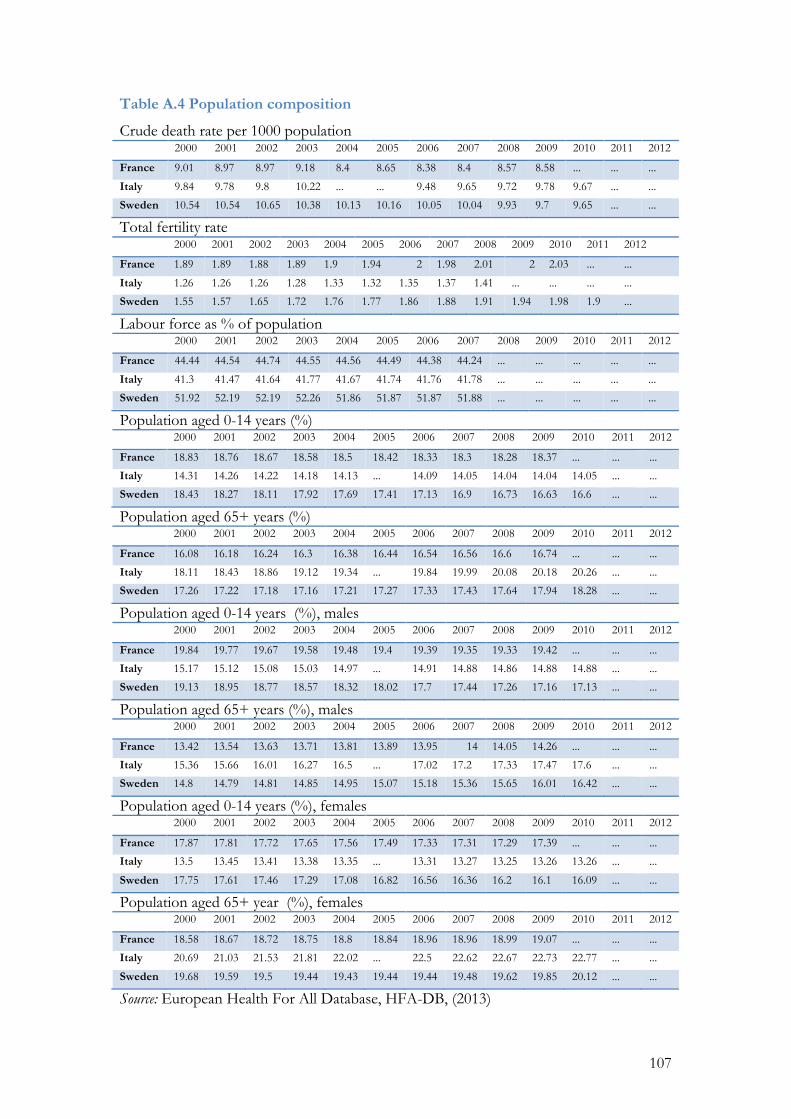
107
Table A.4 Population composition
Crude death rate per 1000 population 2000 2001 2002 2003 2004 2005 2006 2007 2008 2009 2010 2011 2012
France 9.01 8.97 8.97 9.18 8.4 8.65 8.38 8.4 8.57 8.58 ... ... ...
Italy 9.84 9.78 9.8 10.22 ... ... 9.48 9.65 9.72 9.78 9.67 ... ...
Sweden 10.54 10.54 10.65 10.38 10.13 10.16 10.05 10.04 9.93 9.7 9.65 ... ...
Total fertility rate 2000 2001 2002 2003 2004 2005 2006 2007 2008 2009 2010 2011 2012
France 1.89 1.89 1.88 1.89 1.9 1.94 2 1.98 2.01 2 2.03 ... ...
Italy 1.26 1.26 1.26 1.28 1.33 1.32 1.35 1.37 1.41 ... ... ... ...
Sweden 1.55 1.57 1.65 1.72 1.76 1.77 1.86 1.88 1.91 1.94 1.98 1.9 ...
Labour force as % of population 2000 2001 2002 2003 2004 2005 2006 2007 2008 2009 2010 2011 2012
France 44.44 44.54 44.74 44.55 44.56 44.49 44.38 44.24 ... ... ... ... ...
Italy 41.3 41.47 41.64 41.77 41.67 41.74 41.76 41.78 ... ... ... ... ...
Sweden 51.92 52.19 52.19 52.26 51.86 51.87 51.87 51.88 ... ... ... ... ...
Population aged 0-14 years (%) 2000 2001 2002 2003 2004 2005 2006 2007 2008 2009 2010 2011 2012
France 18.83 18.76 18.67 18.58 18.5 18.42 18.33 18.3 18.28 18.37 ... ... ...
Italy 14.31 14.26 14.22 14.18 14.13 ... 14.09 14.05 14.04 14.04 14.05 ... ...
Sweden 18.43 18.27 18.11 17.92 17.69 17.41 17.13 16.9 16.73 16.63 16.6 ... ...
Population aged 65+ years (%) 2000 2001 2002 2003 2004 2005 2006 2007 2008 2009 2010 2011 2012
France 16.08 16.18 16.24 16.3 16.38 16.44 16.54 16.56 16.6 16.74 ... ... ...
Italy 18.11 18.43 18.86 19.12 19.34 ... 19.84 19.99 20.08 20.18 20.26 ... ...
Sweden 17.26 17.22 17.18 17.16 17.21 17.27 17.33 17.43 17.64 17.94 18.28 ... ...
Population aged 0-14 years (%), males 2000 2001 2002 2003 2004 2005 2006 2007 2008 2009 2010 2011 2012
France 19.84 19.77 19.67 19.58 19.48 19.4 19.39 19.35 19.33 19.42 ... ... ...
Italy 15.17 15.12 15.08 15.03 14.97 ... 14.91 14.88 14.86 14.88 14.88 ... ...
Sweden 19.13 18.95 18.77 18.57 18.32 18.02 17.7 17.44 17.26 17.16 17.13 ... ...
Population aged 65+ years (%), males 2000 2001 2002 2003 2004 2005 2006 2007 2008 2009 2010 2011 2012
France 13.42 13.54 13.63 13.71 13.81 13.89 13.95 14 14.05 14.26 ... ... ...
Italy 15.36 15.66 16.01 16.27 16.5 ... 17.02 17.2 17.33 17.47 17.6 ... ...
Sweden 14.8 14.79 14.81 14.85 14.95 15.07 15.18 15.36 15.65 16.01 16.42 ... ...
Population aged 0-14 years (%), females 2000 2001 2002 2003 2004 2005 2006 2007 2008 2009 2010 2011 2012
France 17.87 17.81 17.72 17.65 17.56 17.49 17.33 17.31 17.29 17.39 ... ... ...
Italy 13.5 13.45 13.41 13.38 13.35 ... 13.31 13.27 13.25 13.26 13.26 ... ...
Sweden 17.75 17.61 17.46 17.29 17.08 16.82 16.56 16.36 16.2 16.1 16.09 ... ...
Population aged 65+ year (%), females 2000 2001 2002 2003 2004 2005 2006 2007 2008 2009 2010 2011 2012
France 18.58 18.67 18.72 18.75 18.8 18.84 18.96 18.96 18.99 19.07 ... ... ...
Italy 20.69 21.03 21.53 21.81 22.02 ... 22.5 22.62 22.67 22.73 22.77 ... ...
Sweden 19.68 19.59 19.5 19.44 19.43 19.44 19.44 19.48 19.62 19.85 20.12 ... ...
Source: European Health For All Database, HFA-DB, (2013)
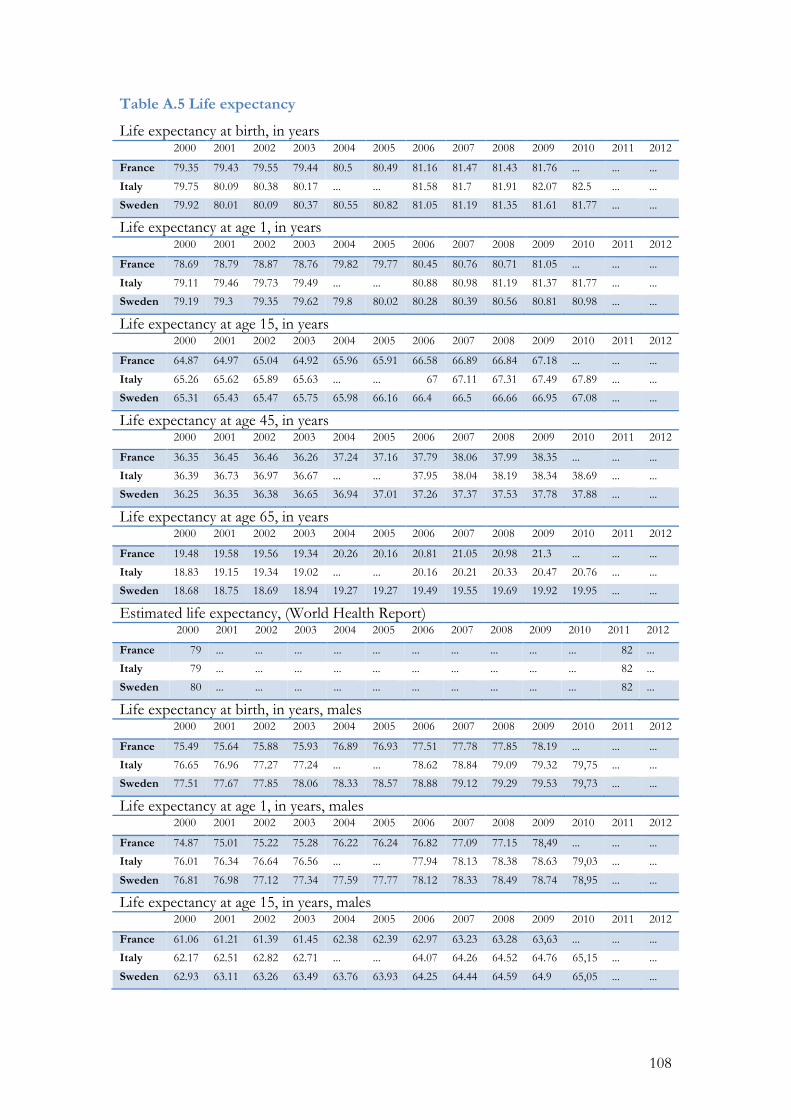
108
Table A.5 Life expectancy
Life expectancy at birth, in years 2000 2001 2002 2003 2004 2005 2006 2007 2008 2009 2010 2011 2012
France 79.35 79.43 79.55 79.44 80.5 80.49 81.16 81.47 81.43 81.76 ... ... ...
Italy 79.75 80.09 80.38 80.17 ... ... 81.58 81.7 81.91 82.07 82.5 ... ...
Sweden 79.92 80.01 80.09 80.37 80.55 80.82 81.05 81.19 81.35 81.61 81.77 ... ...
Life expectancy at age 1, in years 2000 2001 2002 2003 2004 2005 2006 2007 2008 2009 2010 2011 2012
France 78.69 78.79 78.87 78.76 79.82 79.77 80.45 80.76 80.71 81.05 ... ... ...
Italy 79.11 79.46 79.73 79.49 ... ... 80.88 80.98 81.19 81.37 81.77 ... ...
Sweden 79.19 79.3 79.35 79.62 79.8 80.02 80.28 80.39 80.56 80.81 80.98 ... ...
Life expectancy at age 15, in years 2000 2001 2002 2003 2004 2005 2006 2007 2008 2009 2010 2011 2012
France 64.87 64.97 65.04 64.92 65.96 65.91 66.58 66.89 66.84 67.18 ... ... ...
Italy 65.26 65.62 65.89 65.63 ... ... 67 67.11 67.31 67.49 67.89 ... ...
Sweden 65.31 65.43 65.47 65.75 65.98 66.16 66.4 66.5 66.66 66.95 67.08 ... ...
Life expectancy at age 45, in years 2000 2001 2002 2003 2004 2005 2006 2007 2008 2009 2010 2011 2012
France 36.35 36.45 36.46 36.26 37.24 37.16 37.79 38.06 37.99 38.35 ... ... ...
Italy 36.39 36.73 36.97 36.67 ... ... 37.95 38.04 38.19 38.34 38.69 ... ...
Sweden 36.25 36.35 36.38 36.65 36.94 37.01 37.26 37.37 37.53 37.78 37.88 ... ...
Life expectancy at age 65, in years 2000 2001 2002 2003 2004 2005 2006 2007 2008 2009 2010 2011 2012
France 19.48 19.58 19.56 19.34 20.26 20.16 20.81 21.05 20.98 21.3 ... ... ...
Italy 18.83 19.15 19.34 19.02 ... ... 20.16 20.21 20.33 20.47 20.76 ... ...
Sweden 18.68 18.75 18.69 18.94 19.27 19.27 19.49 19.55 19.69 19.92 19.95 ... ...
Estimated life expectancy, (World Health Report) 2000 2001 2002 2003 2004 2005 2006 2007 2008 2009 2010 2011 2012
France 79 ... ... ... ... ... ... ... ... ... ... 82 ...
Italy 79 ... ... ... ... ... ... ... ... ... ... 82 ...
Sweden 80 ... ... ... ... ... ... ... ... ... ... 82 ...
Life expectancy at birth, in years, males 2000 2001 2002 2003 2004 2005 2006 2007 2008 2009 2010 2011 2012
France 75.49 75.64 75.88 75.93 76.89 76.93 77.51 77.78 77.85 78.19 ... ... ...
Italy 76.65 76.96 77.27 77.24 ... ... 78.62 78.84 79.09 79.32 79,75 ... ...
Sweden 77.51 77.67 77.85 78.06 78.33 78.57 78.88 79.12 79.29 79.53 79,73 ... ...
Life expectancy at age 1, in years, males 2000 2001 2002 2003 2004 2005 2006 2007 2008 2009 2010 2011 2012
France 74.87 75.01 75.22 75.28 76.22 76.24 76.82 77.09 77.15 78,49 ... ... ...
Italy 76.01 76.34 76.64 76.56 ... ... 77.94 78.13 78.38 78.63 79,03 ... ...
Sweden 76.81 76.98 77.12 77.34 77.59 77.77 78.12 78.33 78.49 78.74 78,95 ... ...
Life expectancy at age 15, in years, males 2000 2001 2002 2003 2004 2005 2006 2007 2008 2009 2010 2011 2012
France 61.06 61.21 61.39 61.45 62.38 62.39 62.97 63.23 63.28 63,63 ... ... ...
Italy 62.17 62.51 62.82 62.71 ... ... 64.07 64.26 64.52 64.76 65,15 ... ...
Sweden 62.93 63.11 63.26 63.49 63.76 63.93 64.25 64.44 64.59 64.9 65,05 ... ...
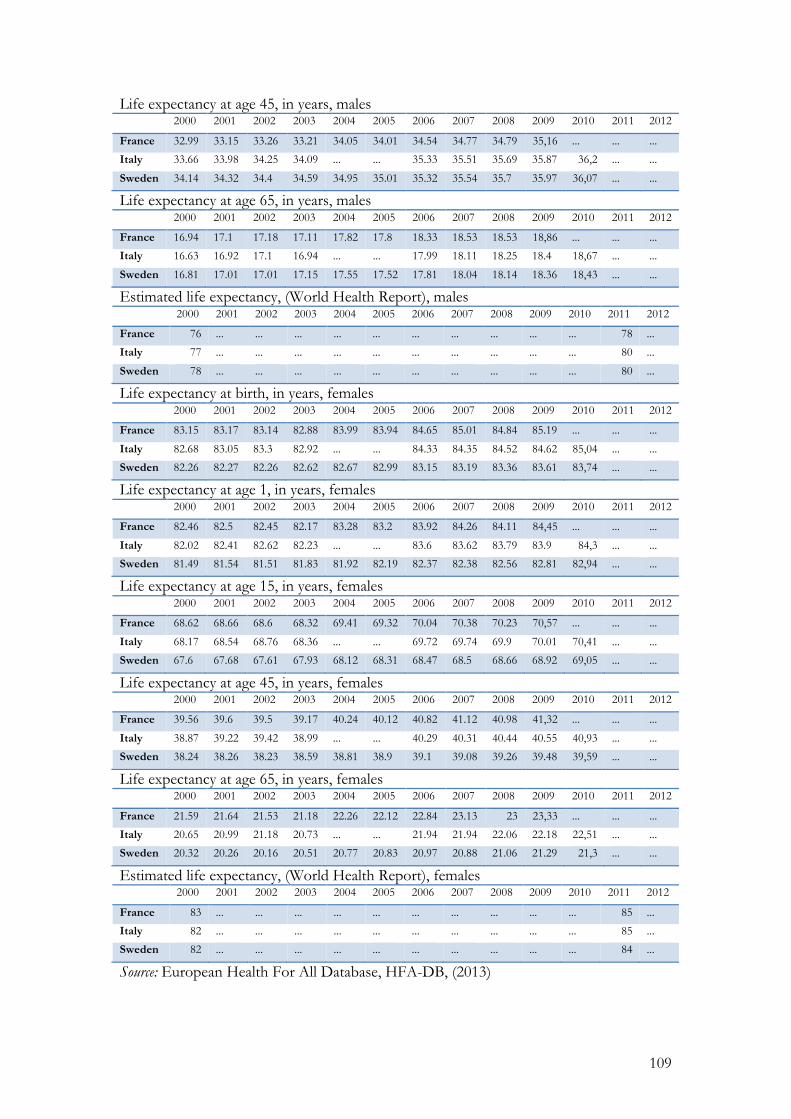
109
Life expectancy at age 45, in years, males 2000 2001 2002 2003 2004 2005 2006 2007 2008 2009 2010 2011 2012
France 32.99 33.15 33.26 33.21 34.05 34.01 34.54 34.77 34.79 35,16 ... ... ...
Italy 33.66 33.98 34.25 34.09 ... ... 35.33 35.51 35.69 35.87 36,2 ... ...
Sweden 34.14 34.32 34.4 34.59 34.95 35.01 35.32 35.54 35.7 35.97 36,07 ... ...
Life expectancy at age 65, in years, males 2000 2001 2002 2003 2004 2005 2006 2007 2008 2009 2010 2011 2012
France 16.94 17.1 17.18 17.11 17.82 17.8 18.33 18.53 18.53 18,86 ... ... ...
Italy 16.63 16.92 17.1 16.94 ... ... 17.99 18.11 18.25 18.4 18,67 ... ...
Sweden 16.81 17.01 17.01 17.15 17.55 17.52 17.81 18.04 18.14 18.36 18,43 ... ...
Estimated life expectancy, (World Health Report), males 2000 2001 2002 2003 2004 2005 2006 2007 2008 2009 2010 2011 2012
France 76 ... ... ... ... ... ... ... ... ... ... 78 ...
Italy 77 ... ... ... ... ... ... ... ... ... ... 80 ...
Sweden 78 ... ... ... ... ... ... ... ... ... ... 80 ...
Life expectancy at birth, in years, females 2000 2001 2002 2003 2004 2005 2006 2007 2008 2009 2010 2011 2012
France 83.15 83.17 83.14 82.88 83.99 83.94 84.65 85.01 84.84 85.19 ... ... ...
Italy 82.68 83.05 83.3 82.92 ... ... 84.33 84.35 84.52 84.62 85,04 ... ...
Sweden 82.26 82.27 82.26 82.62 82.67 82.99 83.15 83.19 83.36 83.61 83,74 ... ...
Life expectancy at age 1, in years, females 2000 2001 2002 2003 2004 2005 2006 2007 2008 2009 2010 2011 2012
France 82.46 82.5 82.45 82.17 83.28 83.2 83.92 84.26 84.11 84,45 ... ... ...
Italy 82.02 82.41 82.62 82.23 ... ... 83.6 83.62 83.79 83.9 84,3 ... ...
Sweden 81.49 81.54 81.51 81.83 81.92 82.19 82.37 82.38 82.56 82.81 82,94 ... ...
Life expectancy at age 15, in years, females 2000 2001 2002 2003 2004 2005 2006 2007 2008 2009 2010 2011 2012
France 68.62 68.66 68.6 68.32 69.41 69.32 70.04 70.38 70.23 70,57 ... ... ...
Italy 68.17 68.54 68.76 68.36 ... ... 69.72 69.74 69.9 70.01 70,41 ... ...
Sweden 67.6 67.68 67.61 67.93 68.12 68.31 68.47 68.5 68.66 68.92 69,05 ... ...
Life expectancy at age 45, in years, females 2000 2001 2002 2003 2004 2005 2006 2007 2008 2009 2010 2011 2012
France 39.56 39.6 39.5 39.17 40.24 40.12 40.82 41.12 40.98 41,32 ... ... ...
Italy 38.87 39.22 39.42 38.99 ... ... 40.29 40.31 40.44 40.55 40,93 ... ...
Sweden 38.24 38.26 38.23 38.59 38.81 38.9 39.1 39.08 39.26 39.48 39,59 ... ...
Life expectancy at age 65, in years, females 2000 2001 2002 2003 2004 2005 2006 2007 2008 2009 2010 2011 2012
France 21.59 21.64 21.53 21.18 22.26 22.12 22.84 23.13 23 23,33 ... ... ...
Italy 20.65 20.99 21.18 20.73 ... ... 21.94 21.94 22.06 22.18 22,51 ... ...
Sweden 20.32 20.26 20.16 20.51 20.77 20.83 20.97 20.88 21.06 21.29 21,3 ... ...
Estimated life expectancy, (World Health Report), females 2000 2001 2002 2003 2004 2005 2006 2007 2008 2009 2010 2011 2012
France 83 ... ... ... ... ... ... ... ... ... ... 85 ...
Italy 82 ... ... ... ... ... ... ... ... ... ... 85 ...
Sweden 82 ... ... ... ... ... ... ... ... ... ... 84 ...
Source: European Health For All Database, HFA-DB, (2013)
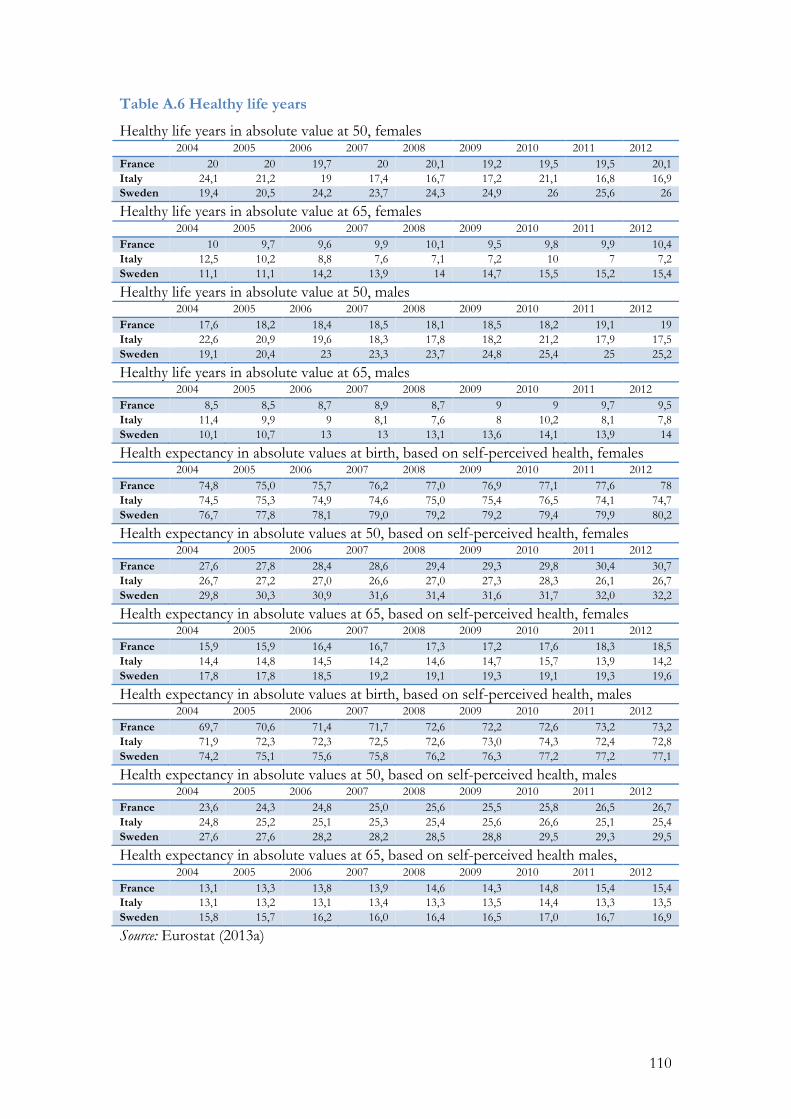
110
Table A.6 Healthy life years
Healthy life years in absolute value at 50, females 2004 2005 2006 2007 2008 2009 2010 2011 2012 France 20 20 19,7 20 20,1 19,2 19,5 19,5 20,1 Italy 24,1 21,2 19 17,4 16,7 17,2 21,1 16,8 16,9 Sweden 19,4 20,5 24,2 23,7 24,3 24,9 26 25,6 26
Healthy life years in absolute value at 65, females 2004 2005 2006 2007 2008 2009 2010 2011 2012 France 10 9,7 9,6 9,9 10,1 9,5 9,8 9,9 10,4 Italy 12,5 10,2 8,8 7,6 7,1 7,2 10 7 7,2 Sweden 11,1 11,1 14,2 13,9 14 14,7 15,5 15,2 15,4
Healthy life years in absolute value at 50, males 2004 2005 2006 2007 2008 2009 2010 2011 2012 France 17,6 18,2 18,4 18,5 18,1 18,5 18,2 19,1 19 Italy 22,6 20,9 19,6 18,3 17,8 18,2 21,2 17,9 17,5 Sweden 19,1 20,4 23 23,3 23,7 24,8 25,4 25 25,2
Healthy life years in absolute value at 65, males 2004 2005 2006 2007 2008 2009 2010 2011 2012 France 8,5 8,5 8,7 8,9 8,7 9 9 9,7 9,5 Italy 11,4 9,9 9 8,1 7,6 8 10,2 8,1 7,8 Sweden 10,1 10,7 13 13 13,1 13,6 14,1 13,9 14
Health expectancy in absolute values at birth, based on self-perceived health, females 2004 2005 2006 2007 2008 2009 2010 2011 2012 France 74,8 75,0 75,7 76,2 77,0 76,9 77,1 77,6 78 Italy 74,5 75,3 74,9 74,6 75,0 75,4 76,5 74,1 74,7 Sweden 76,7 77,8 78,1 79,0 79,2 79,2 79,4 79,9 80,2
Health expectancy in absolute values at 50, based on self-perceived health, females 2004 2005 2006 2007 2008 2009 2010 2011 2012 France 27,6 27,8 28,4 28,6 29,4 29,3 29,8 30,4 30,7 Italy 26,7 27,2 27,0 26,6 27,0 27,3 28,3 26,1 26,7 Sweden 29,8 30,3 30,9 31,6 31,4 31,6 31,7 32,0 32,2
Health expectancy in absolute values at 65, based on self-perceived health, females 2004 2005 2006 2007 2008 2009 2010 2011 2012 France 15,9 15,9 16,4 16,7 17,3 17,2 17,6 18,3 18,5 Italy 14,4 14,8 14,5 14,2 14,6 14,7 15,7 13,9 14,2 Sweden 17,8 17,8 18,5 19,2 19,1 19,3 19,1 19,3 19,6
Health expectancy in absolute values at birth, based on self-perceived health, males 2004 2005 2006 2007 2008 2009 2010 2011 2012 France 69,7 70,6 71,4 71,7 72,6 72,2 72,6 73,2 73,2 Italy 71,9 72,3 72,3 72,5 72,6 73,0 74,3 72,4 72,8 Sweden 74,2 75,1 75,6 75,8 76,2 76,3 77,2 77,2 77,1
Health expectancy in absolute values at 50, based on self-perceived health, males 2004 2005 2006 2007 2008 2009 2010 2011 2012 France 23,6 24,3 24,8 25,0 25,6 25,5 25,8 26,5 26,7 Italy 24,8 25,2 25,1 25,3 25,4 25,6 26,6 25,1 25,4 Sweden 27,6 27,6 28,2 28,2 28,5 28,8 29,5 29,3 29,5
Health expectancy in absolute values at 65, based on self-perceived health males, 2004 2005 2006 2007 2008 2009 2010 2011 2012 France 13,1 13,3 13,8 13,9 14,6 14,3 14,8 15,4 15,4 Italy 13,1 13,2 13,1 13,4 13,3 13,5 14,4 13,3 13,5 Sweden 15,8 15,7 16,2 16,0 16,4 16,5 17,0 16,7 16,9
Source: Eurostat (2013a)
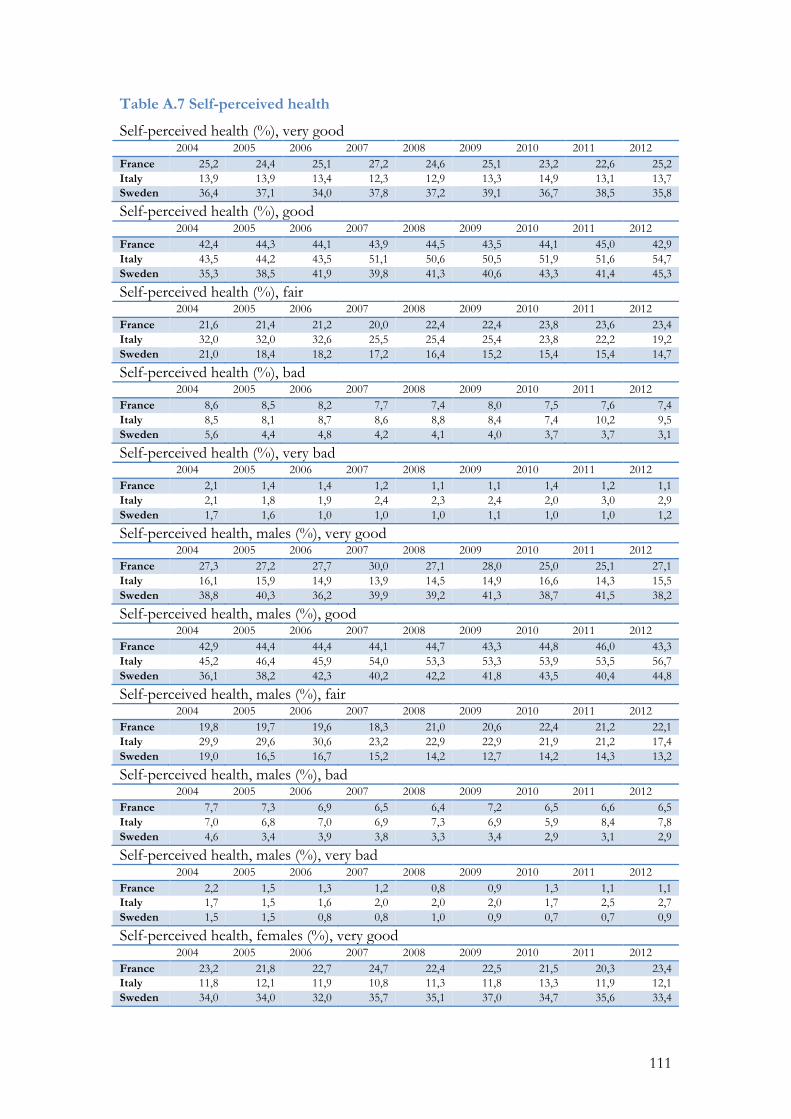
111
Table A.7 Self-perceived health
Self-perceived health (%), very good 2004 2005 2006 2007 2008 2009 2010 2011 2012 France 25,2 24,4 25,1 27,2 24,6 25,1 23,2 22,6 25,2 Italy 13,9 13,9 13,4 12,3 12,9 13,3 14,9 13,1 13,7 Sweden 36,4 37,1 34,0 37,8 37,2 39,1 36,7 38,5 35,8
Self-perceived health (%), good 2004 2005 2006 2007 2008 2009 2010 2011 2012 France 42,4 44,3 44,1 43,9 44,5 43,5 44,1 45,0 42,9 Italy 43,5 44,2 43,5 51,1 50,6 50,5 51,9 51,6 54,7 Sweden 35,3 38,5 41,9 39,8 41,3 40,6 43,3 41,4 45,3
Self-perceived health (%), fair 2004 2005 2006 2007 2008 2009 2010 2011 2012 France 21,6 21,4 21,2 20,0 22,4 22,4 23,8 23,6 23,4 Italy 32,0 32,0 32,6 25,5 25,4 25,4 23,8 22,2 19,2 Sweden 21,0 18,4 18,2 17,2 16,4 15,2 15,4 15,4 14,7
Self-perceived health (%), bad 2004 2005 2006 2007 2008 2009 2010 2011 2012 France 8,6 8,5 8,2 7,7 7,4 8,0 7,5 7,6 7,4 Italy 8,5 8,1 8,7 8,6 8,8 8,4 7,4 10,2 9,5 Sweden 5,6 4,4 4,8 4,2 4,1 4,0 3,7 3,7 3,1
Self-perceived health (%), very bad 2004 2005 2006 2007 2008 2009 2010 2011 2012 France 2,1 1,4 1,4 1,2 1,1 1,1 1,4 1,2 1,1 Italy 2,1 1,8 1,9 2,4 2,3 2,4 2,0 3,0 2,9 Sweden 1,7 1,6 1,0 1,0 1,0 1,1 1,0 1,0 1,2
Self-perceived health, males (%), very good 2004 2005 2006 2007 2008 2009 2010 2011 2012 France 27,3 27,2 27,7 30,0 27,1 28,0 25,0 25,1 27,1 Italy 16,1 15,9 14,9 13,9 14,5 14,9 16,6 14,3 15,5 Sweden 38,8 40,3 36,2 39,9 39,2 41,3 38,7 41,5 38,2
Self-perceived health, males (%), good 2004 2005 2006 2007 2008 2009 2010 2011 2012 France 42,9 44,4 44,4 44,1 44,7 43,3 44,8 46,0 43,3 Italy 45,2 46,4 45,9 54,0 53,3 53,3 53,9 53,5 56,7 Sweden 36,1 38,2 42,3 40,2 42,2 41,8 43,5 40,4 44,8
Self-perceived health, males (%), fair 2004 2005 2006 2007 2008 2009 2010 2011 2012 France 19,8 19,7 19,6 18,3 21,0 20,6 22,4 21,2 22,1 Italy 29,9 29,6 30,6 23,2 22,9 22,9 21,9 21,2 17,4 Sweden 19,0 16,5 16,7 15,2 14,2 12,7 14,2 14,3 13,2
Self-perceived health, males (%), bad 2004 2005 2006 2007 2008 2009 2010 2011 2012 France 7,7 7,3 6,9 6,5 6,4 7,2 6,5 6,6 6,5 Italy 7,0 6,8 7,0 6,9 7,3 6,9 5,9 8,4 7,8 Sweden 4,6 3,4 3,9 3,8 3,3 3,4 2,9 3,1 2,9
Self-perceived health, males (%), very bad 2004 2005 2006 2007 2008 2009 2010 2011 2012 France 2,2 1,5 1,3 1,2 0,8 0,9 1,3 1,1 1,1 Italy 1,7 1,5 1,6 2,0 2,0 2,0 1,7 2,5 2,7 Sweden 1,5 1,5 0,8 0,8 1,0 0,9 0,7 0,7 0,9
Self-perceived health, females (%), very good 2004 2005 2006 2007 2008 2009 2010 2011 2012 France 23,2 21,8 22,7 24,7 22,4 22,5 21,5 20,3 23,4 Italy 11,8 12,1 11,9 10,8 11,3 11,8 13,3 11,9 12,1 Sweden 34,0 34,0 32,0 35,7 35,1 37,0 34,7 35,6 33,4
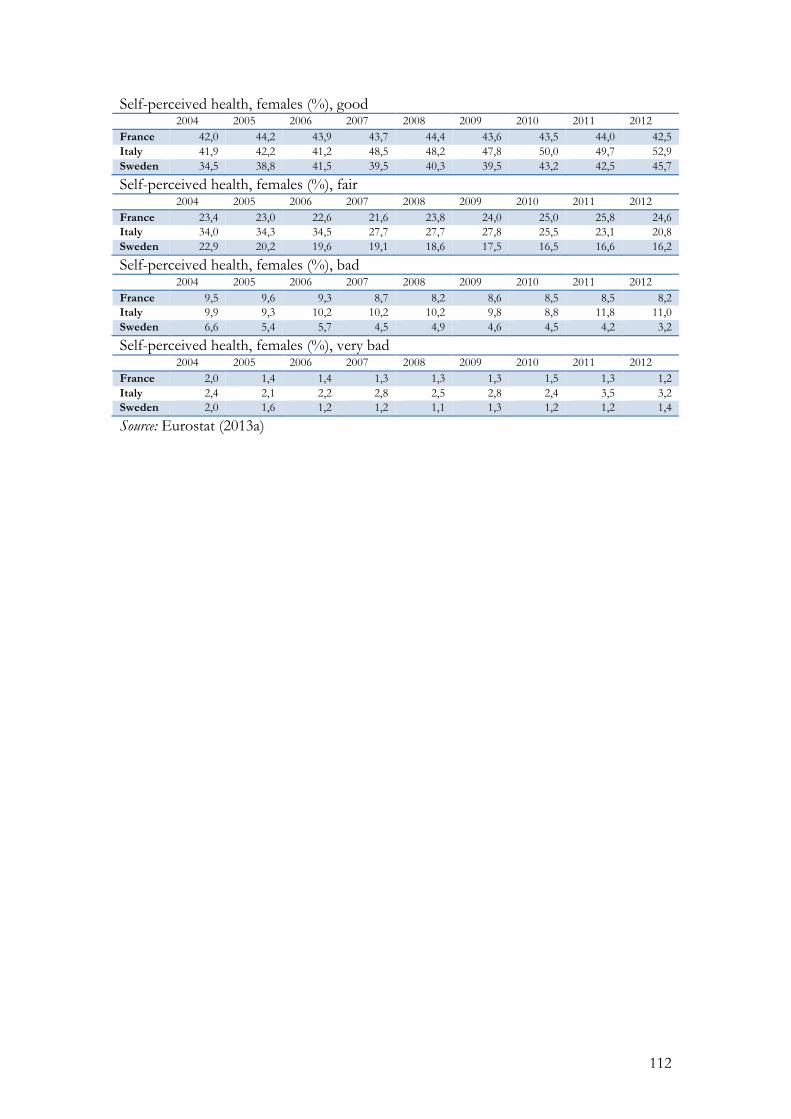
112
Self-perceived health, females (%), good 2004 2005 2006 2007 2008 2009 2010 2011 2012 France 42,0 44,2 43,9 43,7 44,4 43,6 43,5 44,0 42,5 Italy 41,9 42,2 41,2 48,5 48,2 47,8 50,0 49,7 52,9 Sweden 34,5 38,8 41,5 39,5 40,3 39,5 43,2 42,5 45,7
Self-perceived health, females (%), fair 2004 2005 2006 2007 2008 2009 2010 2011 2012 France 23,4 23,0 22,6 21,6 23,8 24,0 25,0 25,8 24,6 Italy 34,0 34,3 34,5 27,7 27,7 27,8 25,5 23,1 20,8 Sweden 22,9 20,2 19,6 19,1 18,6 17,5 16,5 16,6 16,2
Self-perceived health, females (%), bad 2004 2005 2006 2007 2008 2009 2010 2011 2012 France 9,5 9,6 9,3 8,7 8,2 8,6 8,5 8,5 8,2 Italy 9,9 9,3 10,2 10,2 10,2 9,8 8,8 11,8 11,0 Sweden 6,6 5,4 5,7 4,5 4,9 4,6 4,5 4,2 3,2
Self-perceived health, females (%), very bad 2004 2005 2006 2007 2008 2009 2010 2011 2012 France 2,0 1,4 1,4 1,3 1,3 1,3 1,5 1,3 1,2 Italy 2,4 2,1 2,2 2,8 2,5 2,8 2,4 3,5 3,2 Sweden 2,0 1,6 1,2 1,2 1,1 1,3 1,2 1,2 1,4
Source: Eurostat (2013a)
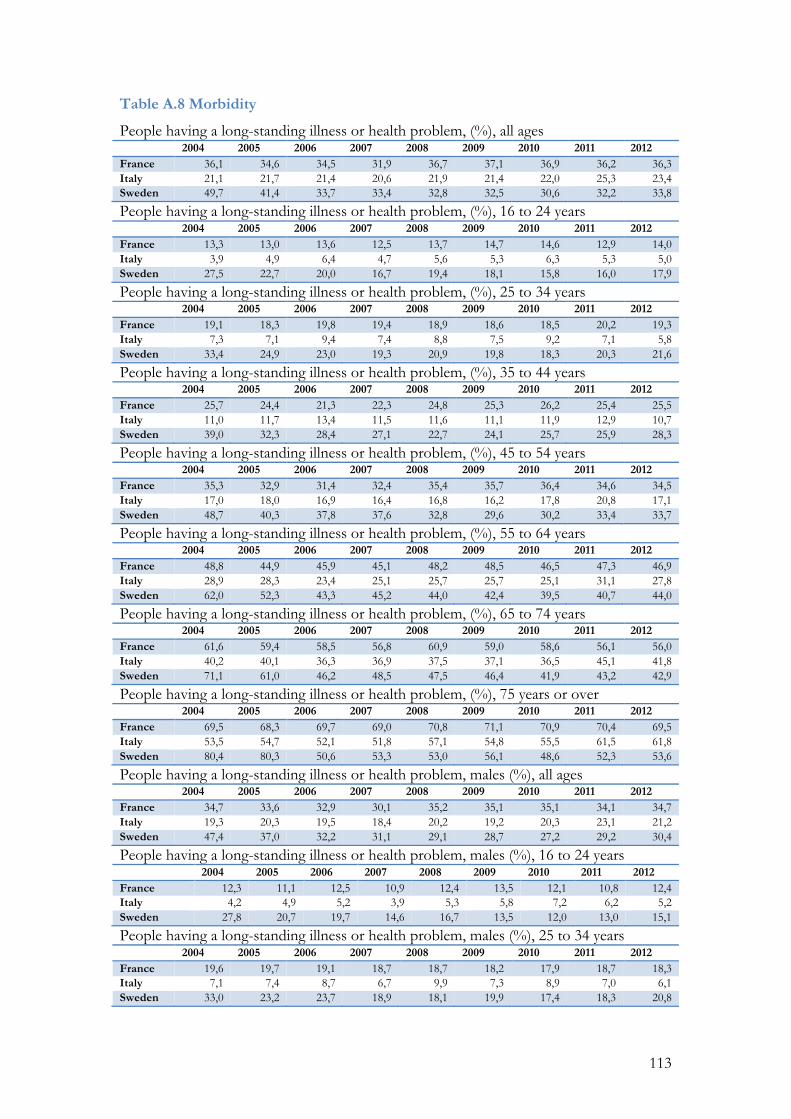
113
Table A.8 Morbidity
People having a long-standing illness or health problem, (%), all ages 2004 2005 2006 2007 2008 2009 2010 2011 2012 France 36,1 34,6 34,5 31,9 36,7 37,1 36,9 36,2 36,3 Italy 21,1 21,7 21,4 20,6 21,9 21,4 22,0 25,3 23,4 Sweden 49,7 41,4 33,7 33,4 32,8 32,5 30,6 32,2 33,8
People having a long-standing illness or health problem, (%), 16 to 24 years 2004 2005 2006 2007 2008 2009 2010 2011 2012 France 13,3 13,0 13,6 12,5 13,7 14,7 14,6 12,9 14,0 Italy 3,9 4,9 6,4 4,7 5,6 5,3 6,3 5,3 5,0 Sweden 27,5 22,7 20,0 16,7 19,4 18,1 15,8 16,0 17,9
People having a long-standing illness or health problem, (%), 25 to 34 years 2004 2005 2006 2007 2008 2009 2010 2011 2012 France 19,1 18,3 19,8 19,4 18,9 18,6 18,5 20,2 19,3 Italy 7,3 7,1 9,4 7,4 8,8 7,5 9,2 7,1 5,8 Sweden 33,4 24,9 23,0 19,3 20,9 19,8 18,3 20,3 21,6
People having a long-standing illness or health problem, (%), 35 to 44 years 2004 2005 2006 2007 2008 2009 2010 2011 2012 France 25,7 24,4 21,3 22,3 24,8 25,3 26,2 25,4 25,5 Italy 11,0 11,7 13,4 11,5 11,6 11,1 11,9 12,9 10,7 Sweden 39,0 32,3 28,4 27,1 22,7 24,1 25,7 25,9 28,3
People having a long-standing illness or health problem, (%), 45 to 54 years 2004 2005 2006 2007 2008 2009 2010 2011 2012 France 35,3 32,9 31,4 32,4 35,4 35,7 36,4 34,6 34,5 Italy 17,0 18,0 16,9 16,4 16,8 16,2 17,8 20,8 17,1 Sweden 48,7 40,3 37,8 37,6 32,8 29,6 30,2 33,4 33,7
People having a long-standing illness or health problem, (%), 55 to 64 years 2004 2005 2006 2007 2008 2009 2010 2011 2012 France 48,8 44,9 45,9 45,1 48,2 48,5 46,5 47,3 46,9 Italy 28,9 28,3 23,4 25,1 25,7 25,7 25,1 31,1 27,8 Sweden 62,0 52,3 43,3 45,2 44,0 42,4 39,5 40,7 44,0
People having a long-standing illness or health problem, (%), 65 to 74 years 2004 2005 2006 2007 2008 2009 2010 2011 2012 France 61,6 59,4 58,5 56,8 60,9 59,0 58,6 56,1 56,0 Italy 40,2 40,1 36,3 36,9 37,5 37,1 36,5 45,1 41,8 Sweden 71,1 61,0 46,2 48,5 47,5 46,4 41,9 43,2 42,9
People having a long-standing illness or health problem, (%), 75 years or over 2004 2005 2006 2007 2008 2009 2010 2011 2012 France 69,5 68,3 69,7 69,0 70,8 71,1 70,9 70,4 69,5 Italy 53,5 54,7 52,1 51,8 57,1 54,8 55,5 61,5 61,8 Sweden 80,4 80,3 50,6 53,3 53,0 56,1 48,6 52,3 53,6
People having a long-standing illness or health problem, males (%), all ages 2004 2005 2006 2007 2008 2009 2010 2011 2012 France 34,7 33,6 32,9 30,1 35,2 35,1 35,1 34,1 34,7 Italy 19,3 20,3 19,5 18,4 20,2 19,2 20,3 23,1 21,2 Sweden 47,4 37,0 32,2 31,1 29,1 28,7 27,2 29,2 30,4
People having a long-standing illness or health problem, males (%), 16 to 24 years 2004 2005 2006 2007 2008 2009 2010 2011 2012 France 12,3 11,1 12,5 10,9 12,4 13,5 12,1 10,8 12,4 Italy 4,2 4,9 5,2 3,9 5,3 5,8 7,2 6,2 5,2 Sweden 27,8 20,7 19,7 14,6 16,7 13,5 12,0 13,0 15,1
People having a long-standing illness or health problem, males (%), 25 to 34 years 2004 2005 2006 2007 2008 2009 2010 2011 2012 France 19,6 19,7 19,1 18,7 18,7 18,2 17,9 18,7 18,3 Italy 7,1 7,4 8,7 6,7 9,9 7,3 8,9 7,0 6,1 Sweden 33,0 23,2 23,7 18,9 18,1 19,9 17,4 18,3 20,8
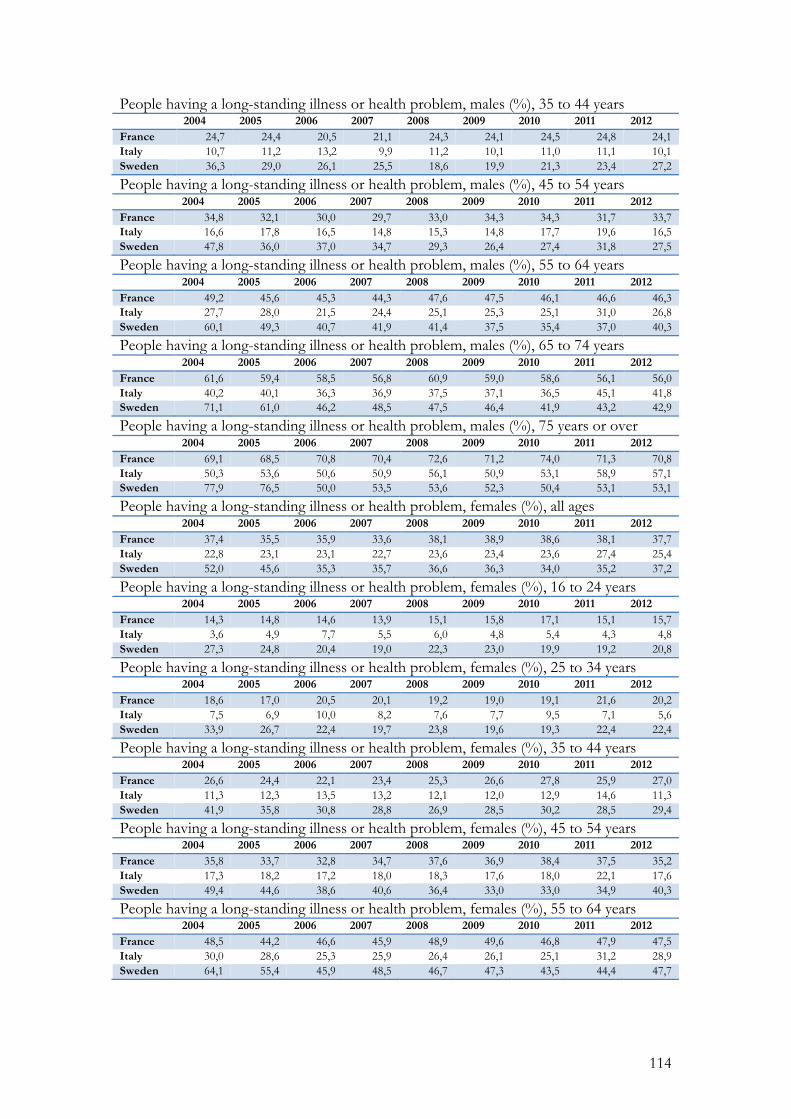
114
People having a long-standing illness or health problem, males (%), 35 to 44 years 2004 2005 2006 2007 2008 2009 2010 2011 2012 France 24,7 24,4 20,5 21,1 24,3 24,1 24,5 24,8 24,1 Italy 10,7 11,2 13,2 9,9 11,2 10,1 11,0 11,1 10,1 Sweden 36,3 29,0 26,1 25,5 18,6 19,9 21,3 23,4 27,2
People having a long-standing illness or health problem, males (%), 45 to 54 years 2004 2005 2006 2007 2008 2009 2010 2011 2012 France 34,8 32,1 30,0 29,7 33,0 34,3 34,3 31,7 33,7 Italy 16,6 17,8 16,5 14,8 15,3 14,8 17,7 19,6 16,5 Sweden 47,8 36,0 37,0 34,7 29,3 26,4 27,4 31,8 27,5
People having a long-standing illness or health problem, males (%), 55 to 64 years 2004 2005 2006 2007 2008 2009 2010 2011 2012 France 49,2 45,6 45,3 44,3 47,6 47,5 46,1 46,6 46,3 Italy 27,7 28,0 21,5 24,4 25,1 25,3 25,1 31,0 26,8 Sweden 60,1 49,3 40,7 41,9 41,4 37,5 35,4 37,0 40,3
People having a long-standing illness or health problem, males (%), 65 to 74 years 2004 2005 2006 2007 2008 2009 2010 2011 2012 France 61,6 59,4 58,5 56,8 60,9 59,0 58,6 56,1 56,0 Italy 40,2 40,1 36,3 36,9 37,5 37,1 36,5 45,1 41,8 Sweden 71,1 61,0 46,2 48,5 47,5 46,4 41,9 43,2 42,9
People having a long-standing illness or health problem, males (%), 75 years or over 2004 2005 2006 2007 2008 2009 2010 2011 2012 France 69,1 68,5 70,8 70,4 72,6 71,2 74,0 71,3 70,8 Italy 50,3 53,6 50,6 50,9 56,1 50,9 53,1 58,9 57,1 Sweden 77,9 76,5 50,0 53,5 53,6 52,3 50,4 53,1 53,1
People having a long-standing illness or health problem, females (%), all ages 2004 2005 2006 2007 2008 2009 2010 2011 2012 France 37,4 35,5 35,9 33,6 38,1 38,9 38,6 38,1 37,7 Italy 22,8 23,1 23,1 22,7 23,6 23,4 23,6 27,4 25,4 Sweden 52,0 45,6 35,3 35,7 36,6 36,3 34,0 35,2 37,2
People having a long-standing illness or health problem, females (%), 16 to 24 years 2004 2005 2006 2007 2008 2009 2010 2011 2012 France 14,3 14,8 14,6 13,9 15,1 15,8 17,1 15,1 15,7 Italy 3,6 4,9 7,7 5,5 6,0 4,8 5,4 4,3 4,8 Sweden 27,3 24,8 20,4 19,0 22,3 23,0 19,9 19,2 20,8
People having a long-standing illness or health problem, females (%), 25 to 34 years 2004 2005 2006 2007 2008 2009 2010 2011 2012 France 18,6 17,0 20,5 20,1 19,2 19,0 19,1 21,6 20,2 Italy 7,5 6,9 10,0 8,2 7,6 7,7 9,5 7,1 5,6 Sweden 33,9 26,7 22,4 19,7 23,8 19,6 19,3 22,4 22,4
People having a long-standing illness or health problem, females (%), 35 to 44 years 2004 2005 2006 2007 2008 2009 2010 2011 2012 France 26,6 24,4 22,1 23,4 25,3 26,6 27,8 25,9 27,0 Italy 11,3 12,3 13,5 13,2 12,1 12,0 12,9 14,6 11,3 Sweden 41,9 35,8 30,8 28,8 26,9 28,5 30,2 28,5 29,4
People having a long-standing illness or health problem, females (%), 45 to 54 years 2004 2005 2006 2007 2008 2009 2010 2011 2012 France 35,8 33,7 32,8 34,7 37,6 36,9 38,4 37,5 35,2 Italy 17,3 18,2 17,2 18,0 18,3 17,6 18,0 22,1 17,6 Sweden 49,4 44,6 38,6 40,6 36,4 33,0 33,0 34,9 40,3
People having a long-standing illness or health problem, females (%), 55 to 64 years 2004 2005 2006 2007 2008 2009 2010 2011 2012 France 48,5 44,2 46,6 45,9 48,9 49,6 46,8 47,9 47,5 Italy 30,0 28,6 25,3 25,9 26,4 26,1 25,1 31,2 28,9 Sweden 64,1 55,4 45,9 48,5 46,7 47,3 43,5 44,4 47,7
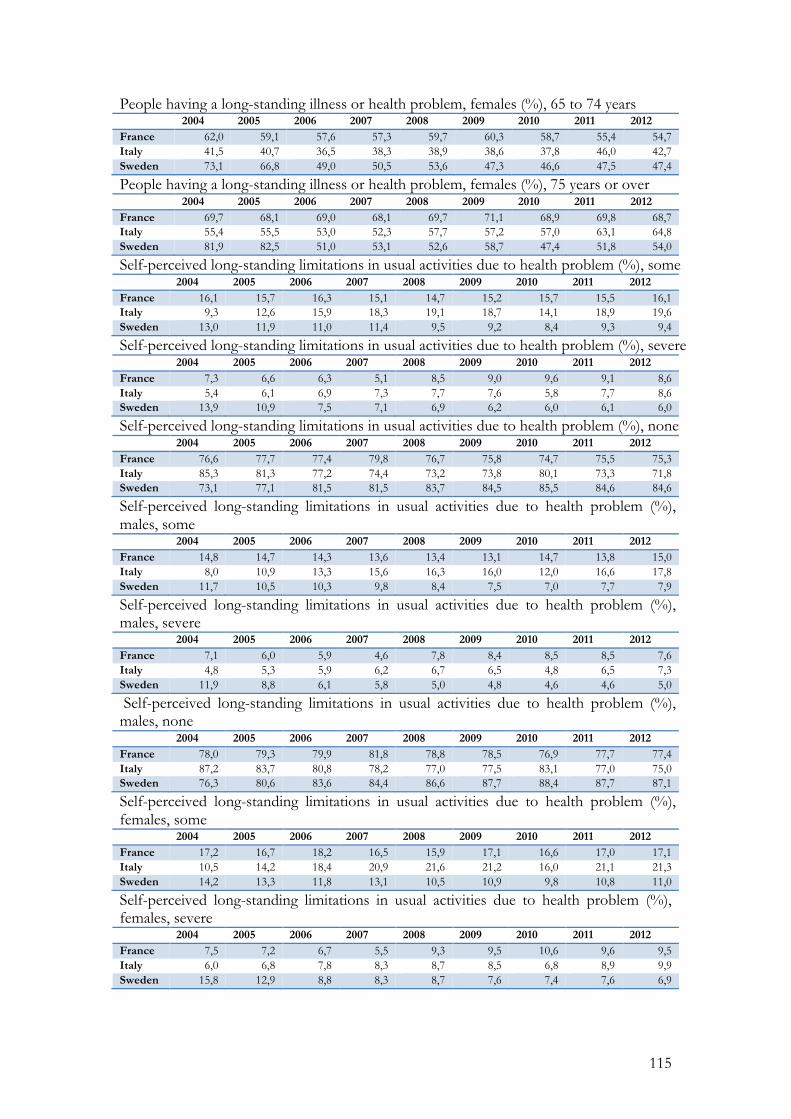
115
People having a long-standing illness or health problem, females (%), 65 to 74 years 2004 2005 2006 2007 2008 2009 2010 2011 2012 France 62,0 59,1 57,6 57,3 59,7 60,3 58,7 55,4 54,7 Italy 41,5 40,7 36,5 38,3 38,9 38,6 37,8 46,0 42,7 Sweden 73,1 66,8 49,0 50,5 53,6 47,3 46,6 47,5 47,4
People having a long-standing illness or health problem, females (%), 75 years or over 2004 2005 2006 2007 2008 2009 2010 2011 2012 France 69,7 68,1 69,0 68,1 69,7 71,1 68,9 69,8 68,7 Italy 55,4 55,5 53,0 52,3 57,7 57,2 57,0 63,1 64,8 Sweden 81,9 82,5 51,0 53,1 52,6 58,7 47,4 51,8 54,0
Self-perceived long-standing limitations in usual activities due to health problem (%), some 2004 2005 2006 2007 2008 2009 2010 2011 2012 France 16,1 15,7 16,3 15,1 14,7 15,2 15,7 15,5 16,1 Italy 9,3 12,6 15,9 18,3 19,1 18,7 14,1 18,9 19,6 Sweden 13,0 11,9 11,0 11,4 9,5 9,2 8,4 9,3 9,4
Self-perceived long-standing limitations in usual activities due to health problem (%), severe 2004 2005 2006 2007 2008 2009 2010 2011 2012 France 7,3 6,6 6,3 5,1 8,5 9,0 9,6 9,1 8,6 Italy 5,4 6,1 6,9 7,3 7,7 7,6 5,8 7,7 8,6 Sweden 13,9 10,9 7,5 7,1 6,9 6,2 6,0 6,1 6,0
Self-perceived long-standing limitations in usual activities due to health problem (%), none 2004 2005 2006 2007 2008 2009 2010 2011 2012 France 76,6 77,7 77,4 79,8 76,7 75,8 74,7 75,5 75,3 Italy 85,3 81,3 77,2 74,4 73,2 73,8 80,1 73,3 71,8 Sweden 73,1 77,1 81,5 81,5 83,7 84,5 85,5 84,6 84,6
Self-perceived long-standing limitations in usual activities due to health problem (%), males, some 2004 2005 2006 2007 2008 2009 2010 2011 2012 France 14,8 14,7 14,3 13,6 13,4 13,1 14,7 13,8 15,0 Italy 8,0 10,9 13,3 15,6 16,3 16,0 12,0 16,6 17,8 Sweden 11,7 10,5 10,3 9,8 8,4 7,5 7,0 7,7 7,9
Self-perceived long-standing limitations in usual activities due to health problem (%), males, severe 2004 2005 2006 2007 2008 2009 2010 2011 2012 France 7,1 6,0 5,9 4,6 7,8 8,4 8,5 8,5 7,6 Italy 4,8 5,3 5,9 6,2 6,7 6,5 4,8 6,5 7,3 Sweden 11,9 8,8 6,1 5,8 5,0 4,8 4,6 4,6 5,0
Self-perceived long-standing limitations in usual activities due to health problem (%), males, none 2004 2005 2006 2007 2008 2009 2010 2011 2012 France 78,0 79,3 79,9 81,8 78,8 78,5 76,9 77,7 77,4 Italy 87,2 83,7 80,8 78,2 77,0 77,5 83,1 77,0 75,0 Sweden 76,3 80,6 83,6 84,4 86,6 87,7 88,4 87,7 87,1
Self-perceived long-standing limitations in usual activities due to health problem (%), females, some 2004 2005 2006 2007 2008 2009 2010 2011 2012 France 17,2 16,7 18,2 16,5 15,9 17,1 16,6 17,0 17,1 Italy 10,5 14,2 18,4 20,9 21,6 21,2 16,0 21,1 21,3 Sweden 14,2 13,3 11,8 13,1 10,5 10,9 9,8 10,8 11,0
Self-perceived long-standing limitations in usual activities due to health problem (%), females, severe 2004 2005 2006 2007 2008 2009 2010 2011 2012 France 7,5 7,2 6,7 5,5 9,3 9,5 10,6 9,6 9,5 Italy 6,0 6,8 7,8 8,3 8,7 8,5 6,8 8,9 9,9 Sweden 15,8 12,9 8,8 8,3 8,7 7,6 7,4 7,6 6,9
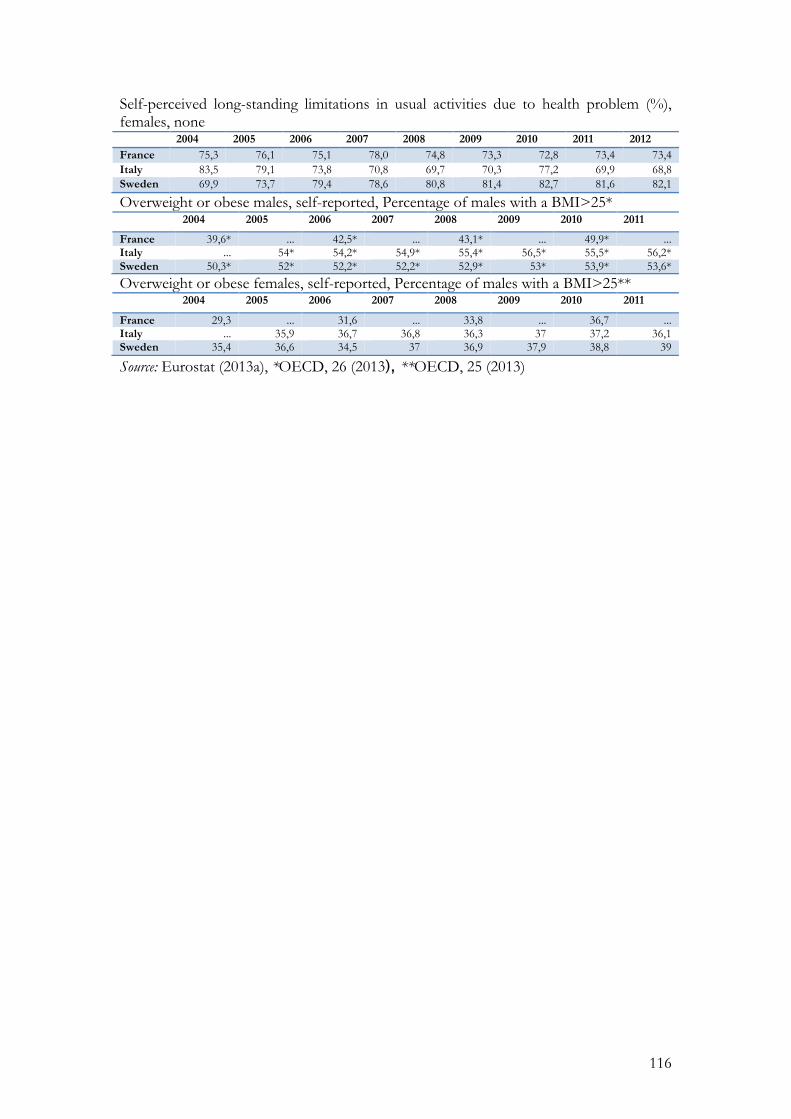
116
Self-perceived long-standing limitations in usual activities due to health problem (%), females, none 2004 2005 2006 2007 2008 2009 2010 2011 2012 France 75,3 76,1 75,1 78,0 74,8 73,3 72,8 73,4 73,4 Italy 83,5 79,1 73,8 70,8 69,7 70,3 77,2 69,9 68,8 Sweden 69,9 73,7 79,4 78,6 80,8 81,4 82,7 81,6 82,1
Overweight or obese males, self-reported, Percentage of males with a BMI>25* 2004 2005 2006 2007 2008 2009 2010 2011
France 39,6* ... 42,5* ... 43,1* ... 49,9* ... Italy ... 54* 54,2* 54,9* 55,4* 56,5* 55,5* 56,2* Sweden 50,3* 52* 52,2* 52,2* 52,9* 53* 53,9* 53,6*
Overweight or obese females, self-reported, Percentage of males with a BMI>25** 2004 2005 2006 2007 2008 2009 2010 2011
France 29,3 ... 31,6 ... 33,8 ... 36,7 ... Italy ... 35,9 36,7 36,8 36,3 37 37,2 36,1 Sweden 35,4 36,6 34,5 37 36,9 37,9 38,8 39
Source: Eurostat (2013a), *OECD, 26 (2013), **OECD, 25 (2013)
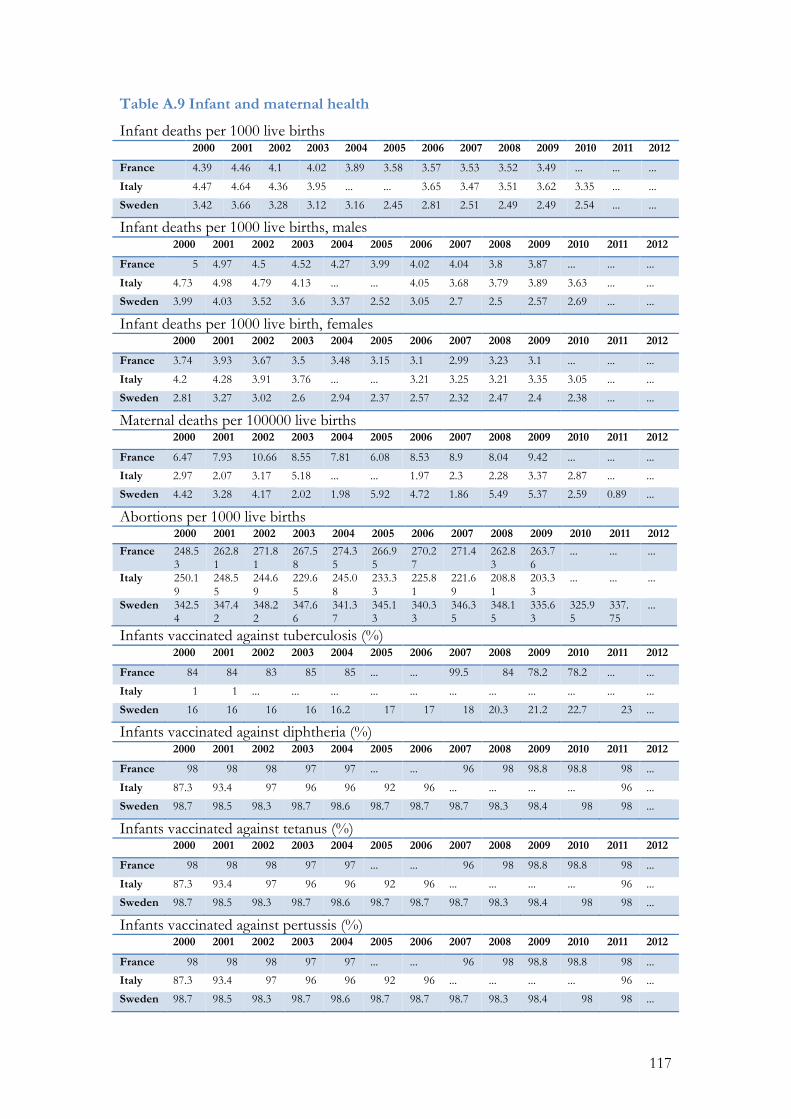
117
Table A.9 Infant and maternal health
Infant deaths per 1000 live births 2000 2001 2002 2003 2004 2005 2006 2007 2008 2009 2010 2011 2012
France 4.39 4.46 4.1 4.02 3.89 3.58 3.57 3.53 3.52 3.49 ... ... ...
Italy 4.47 4.64 4.36 3.95 ... ... 3.65 3.47 3.51 3.62 3.35 ... ...
Sweden 3.42 3.66 3.28 3.12 3.16 2.45 2.81 2.51 2.49 2.49 2.54 ... ...
Infant deaths per 1000 live births, males 2000 2001 2002 2003 2004 2005 2006 2007 2008 2009 2010 2011 2012
France 5 4.97 4.5 4.52 4.27 3.99 4.02 4.04 3.8 3.87 ... ... ...
Italy 4.73 4.98 4.79 4.13 ... ... 4.05 3.68 3.79 3.89 3.63 ... ...
Sweden 3.99 4.03 3.52 3.6 3.37 2.52 3.05 2.7 2.5 2.57 2.69 ... ...
Infant deaths per 1000 live birth, females 2000 2001 2002 2003 2004 2005 2006 2007 2008 2009 2010 2011 2012
France 3.74 3.93 3.67 3.5 3.48 3.15 3.1 2.99 3.23 3.1 ... ... ...
Italy 4.2 4.28 3.91 3.76 ... ... 3.21 3.25 3.21 3.35 3.05 ... ...
Sweden 2.81 3.27 3.02 2.6 2.94 2.37 2.57 2.32 2.47 2.4 2.38 ... ...
Maternal deaths per 100000 live births 2000 2001 2002 2003 2004 2005 2006 2007 2008 2009 2010 2011 2012
France 6.47 7.93 10.66 8.55 7.81 6.08 8.53 8.9 8.04 9.42 ... ... ...
Italy 2.97 2.07 3.17 5.18 ... ... 1.97 2.3 2.28 3.37 2.87 ... ...
Sweden 4.42 3.28 4.17 2.02 1.98 5.92 4.72 1.86 5.49 5.37 2.59 0.89 ...
Abortions per 1000 live births 2000 2001 2002 2003 2004 2005 2006 2007 2008 2009 2010 2011 2012
France 248.53
262.81
271.81
267.58
274.35
266.95
270.27
271.4 262.83
263.76
... ... ...
Italy 250.19
248.55
244.69
229.65
245.08
233.33
225.81
221.69
208.81
203.33
... ... ...
Sweden 342.54
347.42
348.22
347.66
341.37
345.13
340.33
346.35
348.15
335.63
325.95
337.75
...
Infants vaccinated against tuberculosis (%) 2000 2001 2002 2003 2004 2005 2006 2007 2008 2009 2010 2011 2012
France 84 84 83 85 85 ... ... 99.5 84 78.2 78.2 ... ...
Italy 1 1 ... ... ... ... ... ... ... ... ... ... ...
Sweden 16 16 16 16 16.2 17 17 18 20.3 21.2 22.7 23 ...
Infants vaccinated against diphtheria (%) 2000 2001 2002 2003 2004 2005 2006 2007 2008 2009 2010 2011 2012
France 98 98 98 97 97 ... ... 96 98 98.8 98.8 98 ...
Italy 87.3 93.4 97 96 96 92 96 ... ... ... ... 96 ...
Sweden 98.7 98.5 98.3 98.7 98.6 98.7 98.7 98.7 98.3 98.4 98 98 ...
Infants vaccinated against tetanus (%) 2000 2001 2002 2003 2004 2005 2006 2007 2008 2009 2010 2011 2012
France 98 98 98 97 97 ... ... 96 98 98.8 98.8 98 ...
Italy 87.3 93.4 97 96 96 92 96 ... ... ... ... 96 ...
Sweden 98.7 98.5 98.3 98.7 98.6 98.7 98.7 98.7 98.3 98.4 98 98 ...
Infants vaccinated against pertussis (%) 2000 2001 2002 2003 2004 2005 2006 2007 2008 2009 2010 2011 2012
France 98 98 98 97 97 ... ... 96 98 98.8 98.8 98 ...
Italy 87.3 93.4 97 96 96 92 96 ... ... ... ... 96 ...
Sweden 98.7 98.5 98.3 98.7 98.6 98.7 98.7 98.7 98.3 98.4 98 98 ...
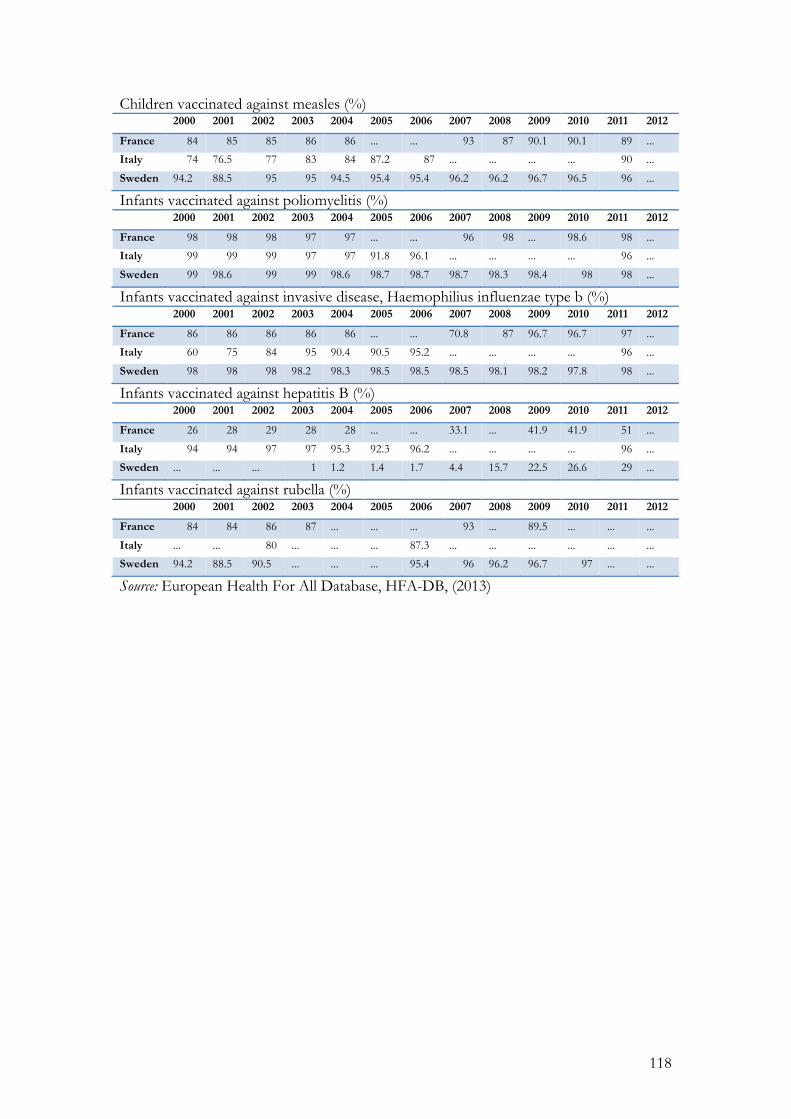
118
Children vaccinated against measles (%) 2000 2001 2002 2003 2004 2005 2006 2007 2008 2009 2010 2011 2012
France 84 85 85 86 86 ... ... 93 87 90.1 90.1 89 ...
Italy 74 76.5 77 83 84 87.2 87 ... ... ... ... 90 ...
Sweden 94.2 88.5 95 95 94.5 95.4 95.4 96.2 96.2 96.7 96.5 96 ...
Infants vaccinated against poliomyelitis (%) 2000 2001 2002 2003 2004 2005 2006 2007 2008 2009 2010 2011 2012
France 98 98 98 97 97 ... ... 96 98 ... 98.6 98 ...
Italy 99 99 99 97 97 91.8 96.1 ... ... ... ... 96 ...
Sweden 99 98.6 99 99 98.6 98.7 98.7 98.7 98.3 98.4 98 98 ...
Infants vaccinated against invasive disease, Haemophilius influenzae type b (%) 2000 2001 2002 2003 2004 2005 2006 2007 2008 2009 2010 2011 2012
France 86 86 86 86 86 ... ... 70.8 87 96.7 96.7 97 ...
Italy 60 75 84 95 90.4 90.5 95.2 ... ... ... ... 96 ...
Sweden 98 98 98 98.2 98.3 98.5 98.5 98.5 98.1 98.2 97.8 98 ...
Infants vaccinated against hepatitis B (%) 2000 2001 2002 2003 2004 2005 2006 2007 2008 2009 2010 2011 2012
France 26 28 29 28 28 ... ... 33.1 ... 41.9 41.9 51 ...
Italy 94 94 97 97 95.3 92.3 96.2 ... ... ... ... 96 ...
Sweden ... ... ... 1 1.2 1.4 1.7 4.4 15.7 22.5 26.6 29 ...
Infants vaccinated against rubella (%) 2000 2001 2002 2003 2004 2005 2006 2007 2008 2009 2010 2011 2012
France 84 84 86 87 ... ... ... 93 ... 89.5 ... ... ...
Italy ... ... 80 ... ... ... 87.3 ... ... ... ... ... ...
Sweden 94.2 88.5 90.5 ... ... ... 95.4 96 96.2 96.7 97 ... ...
Source: European Health For All Database, HFA-DB, (2013)
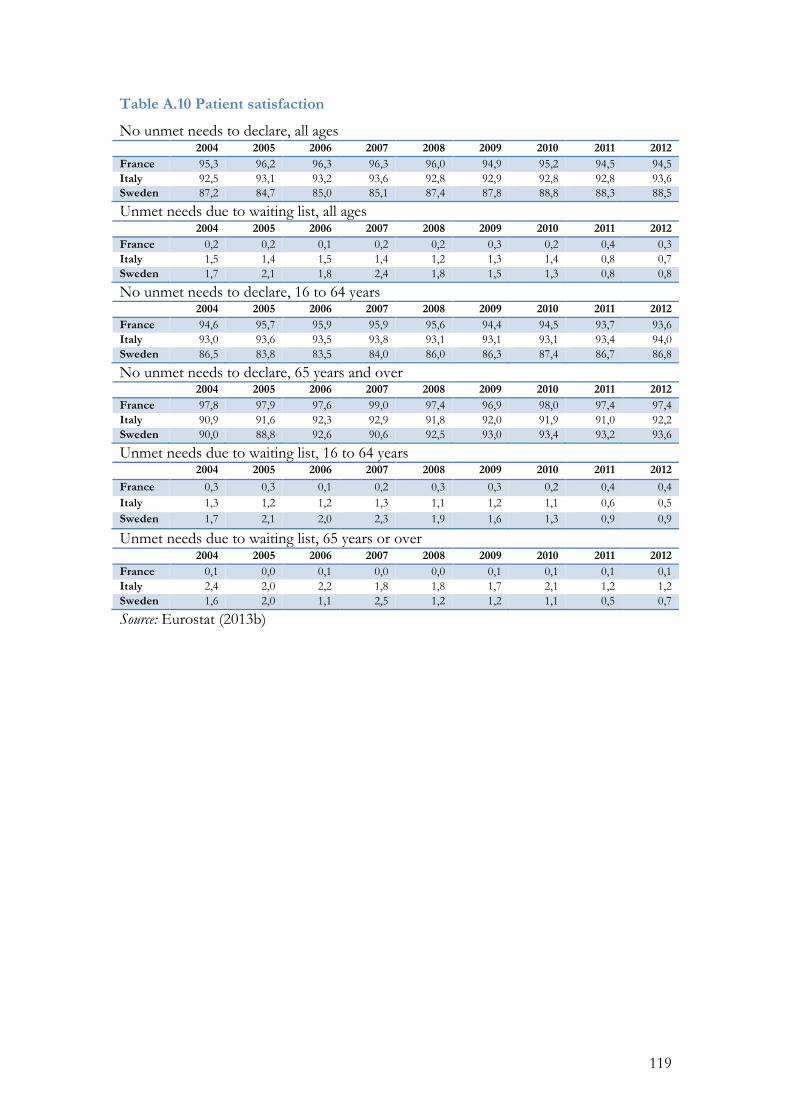
119
Table A.10 Patient satisfaction
No unmet needs to declare, all ages 2004 2005 2006 2007 2008 2009 2010 2011 2012
France 95,3 96,2 96,3 96,3 96,0 94,9 95,2 94,5 94,5 Italy 92,5 93,1 93,2 93,6 92,8 92,9 92,8 92,8 93,6 Sweden 87,2 84,7 85,0 85,1 87,4 87,8 88,8 88,3 88,5
Unmet needs due to waiting list, all ages 2004 2005 2006 2007 2008 2009 2010 2011 2012
France 0,2 0,2 0,1 0,2 0,2 0,3 0,2 0,4 0,3 Italy 1,5 1,4 1,5 1,4 1,2 1,3 1,4 0,8 0,7 Sweden 1,7 2,1 1,8 2,4 1,8 1,5 1,3 0,8 0,8
No unmet needs to declare, 16 to 64 years 2004 2005 2006 2007 2008 2009 2010 2011 2012
France 94,6 95,7 95,9 95,9 95,6 94,4 94,5 93,7 93,6 Italy 93,0 93,6 93,5 93,8 93,1 93,1 93,1 93,4 94,0 Sweden 86,5 83,8 83,5 84,0 86,0 86,3 87,4 86,7 86,8
No unmet needs to declare, 65 years and over 2004 2005 2006 2007 2008 2009 2010 2011 2012
France 97,8 97,9 97,6 99,0 97,4 96,9 98,0 97,4 97,4 Italy 90,9 91,6 92,3 92,9 91,8 92,0 91,9 91,0 92,2 Sweden 90,0 88,8 92,6 90,6 92,5 93,0 93,4 93,2 93,6
Unmet needs due to waiting list, 16 to 64 years 2004 2005 2006 2007 2008 2009 2010 2011 2012
France 0,3 0,3 0,1 0,2 0,3 0,3 0,2 0,4 0,4 Italy 1,3 1,2 1,2 1,3 1,1 1,2 1,1 0,6 0,5 Sweden 1,7 2,1 2,0 2,3 1,9 1,6 1,3 0,9 0,9
Unmet needs due to waiting list, 65 years or over 2004 2005 2006 2007 2008 2009 2010 2011 2012
France 0,1 0,0 0,1 0,0 0,0 0,1 0,1 0,1 0,1 Italy 2,4 2,0 2,2 1,8 1,8 1,7 2,1 1,2 1,2 Sweden 1,6 2,0 1,1 2,5 1,2 1,2 1,1 0,5 0,7
Source: Eurostat (2013b)