Embed Size (px)
Citation preview
March 31, 2005
Health Disparities: Measuring Health Care Use and Access for
Racial/Ethnic Populations
Final Report Part 1
Prepared for
Arthur Meltzer, Ph.D. Centers for Medicare and Medicaid Services
Office of Research, Development, and Information Mail Stop C3-19-07
7500 Security Boulevard Baltimore, MD 21244-1850
Prepared by
Arthur J. Bonito, Ph.D. Celia R. Eicheldinger, M.S.
Christian Evensen, M.S. RTI International
Health, Social, and Economics Research PO Box 21294
Research Triangle Park, NC 27709-2194 RTI Project Number 07964.008
Contract Number: 500-00-0024, Task No. 8
HEALTH DISPARITIES: MEASURING HEALTH CARE USE AND ACCESS FOR RACIAL/ETHNIC POPULATIONS
by Arthur J. Bonito, Ph.D., Project Director,
Celia R. Eicheldinger, M.S. and Christian Evensen, M.S.
Scientific Reviewer: Arthur J. Bonito, Ph.D.
Federal Project Officer: Arthur Meltzer, Ph.D.
RTI International*
CMS Contract No. 500-00-0024, Task No. 8
March 31, 2005
This project was funded by the Centers for Medicare & Medicaid Services under contract no. 500-00-0024. The statements contained in this report are solely those of the authors and do not necessarily reflect the views or policies of the Centers for Medicare & Medicaid Services. RTI assumes responsibility for the accuracy and completeness of the information contained in this report.
*RTI International is a trade name of Research Triangle Institute.

ACKNOWLEDGMENTS
We want to acknowledge the contributions of our programmers, Ann Larsen, Matthew Urato, and Bob Baker, and our technical editor, D.J. Bost. We owe a special debt of thanks to our word processor, Loraine Monroe, who labored tirelessly over what seemed like endless tables and revisions. All of these persons have been wonderful to work with. Without their special skills and hard work, this report would not have been possible.
iii
CONTENTS
EXECUTIVE SUMMARY (PART ONE) .................................................................................... ix
CHAPTER 1 OVERVIEW OF PART 1 OF THE FINAL REPORT..............................................1
CHAPTER 2 ASSESSING AND IMPROVING THE ACCURACY AND COMPLETENESS OF RACE/ETHNICITY CODING ON THE MEDICARE ENROLLMENT DATABASE (EDB) ...................................................................................3 2.1 Introduction....................................................................................................................3 2.2 Data ..............................................................................................................................3 2.3 Limitations of the data ...................................................................................................5 2.4 The Process and Results.................................................................................................6
CHAPTER 3 ASSESSMENT AND ALGORITHM RESULTS.....................................................9 3.1 Assessing and Improving the Accuracy of the Race/Ethnicity Coding in the
EDB ...............................................................................................................................9 3.1.1 Assessment of the EDB Race/Ethnicity Coding: Comparing Self-
Reported Race/Ethnicity from the CAHPS Surveys to Race/Ethnicity in the EDB.................................................................................................................9
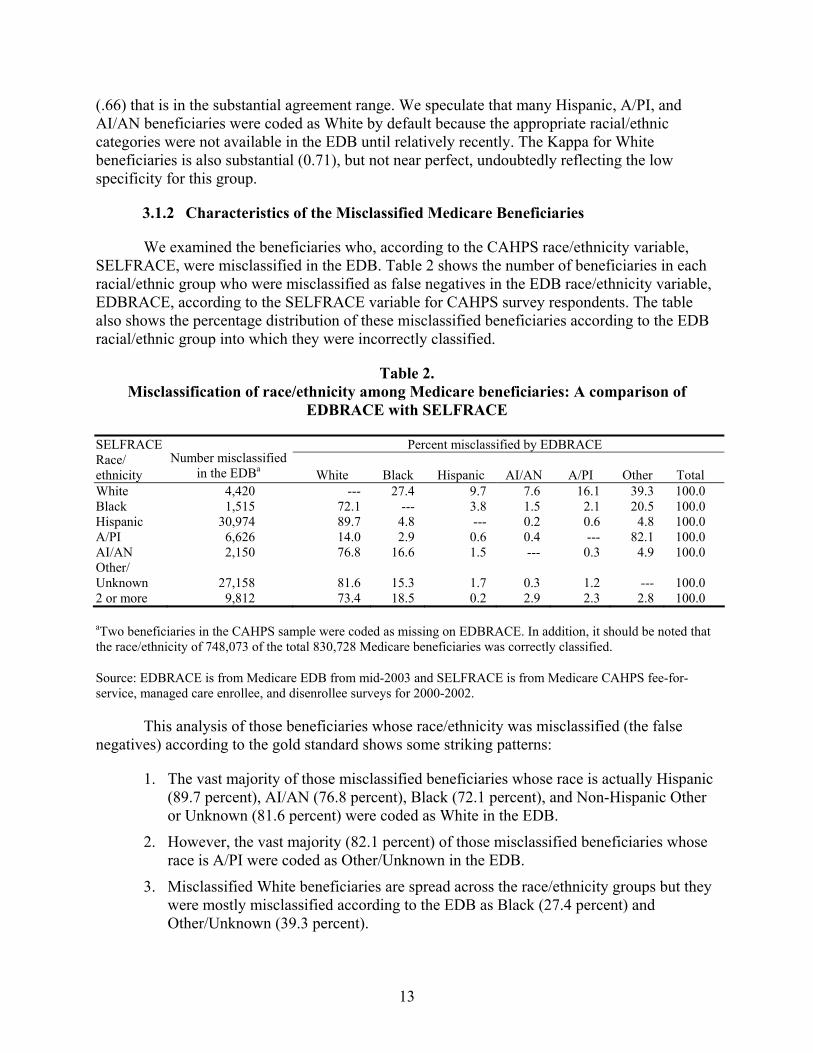
3.1.2 Characteristics of the Misclassified Medicare Beneficiaries ..............................13 3.1.3 Development of a Surname Algorithm to More Correctly Identify
Race/Ethnicity: Comparison of the Algorithm’s Race/Ethnicity Designation to the Self-Reported Race/Ethnicity in CAHPS.............................14
3.1.4 Improving the Surname Algorithms: Using the EDB Race/Ethnicity Variable and Other EDB Variables.....................................................................16
3.1.5 Combining the Improved Hispanic and A/PI Algorithms .................................20 3.2 Accuracy of EDB Race/Ethnicity Coding by Specific Demographic
Subgroups within Minority Populations ......................................................................21 3.2.1 Under-representation in the EDB........................................................................22 3.2.2 Improvement of the Accuracy of the EDB Race Variable .................................25
3.3 Using the Combined Naming Algorithm on the Full EDB to Provide an Improved Race/Ethnicity Variable ..............................................................................26
CHAPTER 4 ASSESSMENT OF BIAS IN UTILIZATION ESTIMATES.................................31 4.1 Identifying Bias in the Estimation of Utilization Rates by the Current EDB
Race/Ethnicity Measure ...............................................................................................31 4.3 Secondary Prevention Services Use and Hospitalization for Diabetes...............38 4.4 Hospital and Emergency Room Admissions for Selected Ambulatory
Care-Sensitive Conditions (ACSCs)...................................................................44 4.5 Use of Different Types of Health Services .........................................................47 4.6 Hospital Services Use for Selected Chronic and Acute Disease
Diagnoses............................................................................................................52
iv
CHAPTER 5 ADDING GEOGRAPHIC-BASED CENSUS MEASURES OF SOCIO-ECONOMIC STATUS (SES) TO THE EDB ......................................................................59 5.1 Introduction..................................................................................................................59 5.2 Development of an Approach to Geocode Beneficiary Addresses to Link SES
Data from the Census to the Medicare Beneficiaries in the EDB................................59 5.2.1 Address Cleaning ................................................................................................60 5.2.2 Running the GeoCode program ..........................................................................64 5.2.3 Summary of GeoCode program accuracy codes.................................................66
5.3 Application of the GeoCode Program Processing to the Full EDB.............................69
CHAPTER 6 ASSESSING HOW REPRESENTATIVE THE MEDICARE CURRENT BENEFICIARY SURVEY’S (MCBS) SAMPLE SITES ARE OF NATIONAL ORIGIN SUBGROUPS FOR HISPANICS AND ASIANS/PACIFIC ISLANDERS.........73 6.1 Introduction..................................................................................................................73 6.2 Methodology................................................................................................................73 6.3 Results..........................................................................................................................77
References......................................................................................................................................79
LIST OF TABLES
Table 1. Accuracy and agreement between EDBRACE and SELFRACE....................................12
Table 2. Misclassification of race/ethnicity among Medicare beneficiaries: A comparison of EDBRACE with SELFRACE ..........................................................................................13
Table 3. Comparison of NAMERACE to SELFRACE for Medicare beneficiaries with Hispanic surnames at different inclusion levels....................................................................15
Table 4. Comparison of NAMERACE to SELFRACE for Medicare beneficiaries with Asian/Pacific Islander surnames at different inclusion levels ..............................................15
Table 5. Comparison of ALGRACE to SELFRACE for Medicare beneficiaries with Hispanic surnames at different inclusion levels....................................................................18
Table 6. Comparison of ALGRACE to SELFRACE for Medicare beneficiaries with Asian/Pacific Islander surnames at different inclusion levels ..............................................19
Table 7. Percent improvement in Hispanic and Asian/Pacific Islander race/ethnicity coding using ALGRACE rather than EDBRACE ................................................................20
Table 8. Comparison of the distribution of race/ethnicity according to EDBRACE, NEWRACE, and SELFRACE..............................................................................................21
Table 9. Comparison of EDBRACE, NEWRACE, and SELFRACE (CAHPS) distributions of race/ethnicity by gender and age .................................................................23
v
Table 10. Comparisons showing improvement in Hispanic and Asian/Pacific Islander coding by gender using NEWRACE and EDBRACE..........................................................26
Table 11. Comparisons showing improvement in Hispanic and Asian/Pacific Islander coding by gender and age using NEWRACE and EDBRACE.............................................26
Table 12. Comparison of the distribution of race/ethnicity according to EDBRACE and NEWRACE for the entire EDB ............................................................................................27
Table 13. Distribution of “new” Hispanic beneficiaries (NEWRACE) according to their EDBRACE, gender, and age group ......................................................................................28
Table 14. Distribution of “new” Asian/Pacific Islander beneficiaries (NEWRACE) according to their EDBRACE, gender, and age group .........................................................29
Table 15. 2000 and 2001 EDB and CAHPS MFFS sample distributions by race/ethnicity..........31
Table 16. Mean DCG HCC Risk score (1.00 = average risk) of 2000 and 2001 Medicare CAHPS fee-for-service respondents by EDBRACE and SELFRACE.................................33
Table 17. Number, percentage, and ratio of female Medicare beneficiaries with claims for mammography in the previous 12 months by EDBRACE and SELFRACE .......................34
Table 18. Number, percentage, and ratio of female Medicare beneficiaries with claims for pap smears in the previous 12 months by EDBRACE and SELFRACE..............................35
Table 19. Number, percentage, and ratio of female Medicare beneficiaries with claims for colorectal cancer screening in the previous 12 months by EDBRACE and SELFRACE...........................................................................................................................36
Table 20. Number, percentage, and ratio of male Medicare beneficiaries with claims for colorectal cancer screening in the previous 12 months by EDBRACE and SELFRACE...........................................................................................................................36
Table 21. Number, percentage, and ratio of male Medicare beneficiaries with claims for a PSA test in the previous 12 months by EDBRACE and SELFRACE..................................37
Table 22. Ratios of number of Medicare beneficiaries with selected cancer screening claims in the previous 12 months by race/ethnicity..............................................................37
Table 23. Ratios of percentage of Medicare beneficiaries with selected cancer screening claims in the previous 12 months by race/ethnicity..............................................................38
Table 24. Number, percentage, and ratio of Medicare beneficiaries with diabetes diagnosis by EDBRACE and SELFRACE...........................................................................39
Table 25. Number, percentage, and ratio of Medicare beneficiaries with diabetes who had foot care in previous 12 months by EDBRACE and SELFRACE .......................................40
vi
Table 26. Number, percentage, and ratio of Medicare beneficiaries with diabetes who had an eye exam in the previous 12 months by EDBRACE and SELFRACE............................40
Table 27. Number, percentage, and ratio of Medicare beneficiaries with diabetes who had selected physiological measures taken in the previous 12 months by EDBRACE and SELFRACE...........................................................................................................................41
Table 28. Number, percentage, and ratio of Medicare beneficiaries with diabetes who had self-care training or diabetes education in the previous 12 months by EDBRACE and SELFRACE....................................................................................................................41
Table 29. Ratios of number of Medicare beneficiaries with diabetes who used selected diabetic services by race/ethnicity ........................................................................................42
Table 30. Ratios of percentage of Medicare beneficiaries with diabetes who used selected diabetic services in the previous 12 months by race/ethnicity..............................................42
Table 31. Number, percentage, and ratio of Medicare beneficiaries with diabetes who had a hospital discharge with a principle diagnosis of diabetes in the previous 12 months by EDBRACE and SELFRACE ...........................................................................................43
Table 32. Mean payment per discharge, mean length of stay in days, and ratio of Medicare beneficiaries with diabetes who had a hospital discharge with a principle diagnosis of diabetes in the previous 12 months by EDBRACE and SELFRACE..............44
Table 33. Number, percentage, and ratio of Medicare beneficiaries with hospital or emergency room admission for a diagnosis of an ambulatory care-sensitive condition in the previous 12 months by EDBRACE and SELFRACE ................................45
Table 34. Number, percentage, and ratio of Medicare beneficiaries with hospital or emergency room admission for a diagnosis of a chronic ambulatory care-sensitive condition in the previous 12 months by EDBRACE and SELFRACE ................................45
Table 35. Number, percentage, and ratio of Medicare beneficiaries with hospital or emergency room admission for a diagnosis of an acute ambulatory care-sensitive condition in the previous 12 months by EDBRACE and SELFRACE ................................46
Table 36. Number, percentage, and ratio of Medicare beneficiaries with hospital or emergency room admission for a diagnosis of a preventable ambulatory care-sensitive condition in the previous 12 months by EDBRACE and SELFRACE .................47
Table 37. Number, percentage, mean payment in dollars, and ratio of Medicare beneficiaries for the sum of selected services billed to Medicare in the previous 12 months by EDBRACE and SELFRACE ..............................................................................48
Table 38. Number, percentage, mean payment in dollars per discharge, and ratio of Medicare beneficiaries for overnight hospital stays in the previous 12 months by EDBRACE and SELFRACE ................................................................................................49
vii
Table 39. Number, percentage, mean payment in dollars, and ratio of Medicare beneficiaries for physician visits in the previous 12 months by EDBRACE and SELFRACE...........................................................................................................................49
Table 40. Number, percentage, mean payment in dollars, and ratio of Medicare beneficiaries for services provided during nursing home stays in the previous 12 months by EDBRACE and SELFRACE ..............................................................................50
Table 41. Number, percentage, mean payment in dollars, and ratio of Medicare beneficiaries for home health services in the previous 12 months by EDBRACE and SELFRACE...........................................................................................................................51
Table 42. Number, percentage, mean payment in dollars, and ratio of Medicare beneficiaries for durable medical equipment in the previous 12 months by EDBRACE and SELFRACE ................................................................................................51
Table 43. Number, percentage, mean payment in dollars, and ratio of Medicare beneficiaries for emergency department use in the previous 12 months by EDBRACE and SELFRACE ................................................................................................52
Table 44. Ratio of number of Medicare beneficiaries hospitalized with selected chronic and acute diagnoses in the previous 12 months by race/ethnicity ........................................53
Table 45. Ratio of percentage of Medicare beneficiaries hospitalized with selected chronic and acute diagnoses in the previous 12 months by race/ethnicity ...........................54
Table 46. Ratio of mean payment in dollars for Medicare beneficiaries hospitalized with selected chronic and acute diagnoses in the previous 12 months by race/ethnicity .............55
Table 47. Ratio of mean length of stay in days of Medicare beneficiaries hospitalized with selected chronic and acute diagnoses in the previous 12 months by race/ethnicity.........................................................................................................................56
Table 48. GeoCode program syntax and lookup errors .................................................................67
Table 49. GeoCode program programmatic and setup errors........................................................67
Table 50. GeoCode program accuracy codes and messages..........................................................68
Table 51. Summary of GeoCode error and accuracy results for the CAHPS test file...................69
Table 52. Summary of GeoCode error and accuracy codes for the 10 segments of the EDB combined......................................................................................................................71
Table 53. Hispanic and Asian/Pacific Islander subgroups as a percent of elderly (age 65 +): National totals vs. MCBS PSUs......................................................................................74
viii
Table 54. Subgroup composition of Hispanic and Asian/Pacific Islander elderly (age 65+): National totals vs. MCBS PSUs..................................................................................76
LIST OF APPENDICES
Appendix A. Spanish Surnames List Documentation .............................................................. A-1 Appendix B. Asian/Pacific Islander Surnames List Documentation ........................................B-1 Appendix C. Detailed Tables Comparing Use of Hospital and Emergency Room Services
for Selected Ambulatory Care Sensitive Conditions by EDB Race/Ethnicity and CAHPS Self-Reported Race/Ethnicity..........................................................C-1
Appendix D. Detailed Tables Comparing Use of Hospital Services for Selected Diagnoses by EDB Race/Ethnicity and CAHPS Self-Reported Race/Ethnicity.................. D-1
Appendix E. Results of the GeoCode Program Processing for Each of the 10 Segments of the Unloaded EDB...........................................................................................E-1
Appendix F. List of Potential SES Variables Extracted from 2000 U.S. Census and Values of the Categories Used for Percentages ...............................................................F-1
ix
EXECUTIVE SUMMARY (PART ONE)
The final report for this project has been prepared in two parts. Part One deals primarily with the methodology and data used to assess and improve race/ethnicity classification on the enrollment database (EDB). Part Two addresses in a detailed fashion issues associated with access to and utilization of various health services according to race/ethnicity, using the improved race/ethnicity classification scheme described in Part One of the final report.
Purpose
The impetus for this project is the continuing interest of the Centers for Medicare & Medicaid Services (CMS) in improving its ability to more accurately identify the race/ethnicity of its beneficiaries. This is an important issue because of the need to properly assess access to care and service use among disadvantaged or vulnerable populations.
Background
Historically, the Medicare program has received its race/ethnicity code for beneficiaries listed on the enrollment database (EDB) from the Social Security Administration’s (SSA) master beneficiary record (MBR). Until 1980, the SS-5 form that the SSA used to collect this information only allowed for three codes: White, Black, or Other. As a result, the EDB was only able to include these three codes for race/ethnicity along with Unknown for those who did not respond to the SS-5 race item.
In 1980, the race/ethnicity categories on the SS-5 form were expanded to five, plus “Unknown.” The expanded categories included: non-Hispanic White; non-Hispanic Black; Hispanic; Asian, Asian-American, or Pacific Islander; and American Indian or Alaska Native. Despite the expanded categories available from the MBR, the EDB continued to classify race/ethnicity into three categories plus “Unknown”, by collapsing the five expanded MBR race/ethnicity codes into the original three codes – White, Black, or Other. In 1994, the expanded race data from the SS-5 forms were used to correct erroneous and missing race/ethnicity information on the EDB. This resulted in changes to the race/ethnicity of more than 2.5 million beneficiaries. This enhancement was done again and in 1997 and 2000, and has been done annually since then.
Also in 1997, the Health Care Financing Administration (now CMS) conducted a survey of nearly 2.2 million persons with Hispanic surnames or countries of birth and persons with Other or Unknown race. Analysis of self-reported race/ethnicity data from this survey resulted in changes in the race/ethnicity of more than 850,000 beneficiaries. Further, CMS has in the past two years entered into an agreement with the Indian Health Service (IHS) to identify Medicare beneficiaries who are recognized as American Indian or Alaskan Native by IHS. This project is the latest effort by CMS to improve the accuracy of the EDB race/ethnicity codes.
Report Objectives
The key objectives of Part 1 of the final report were to: (1) estimate the accuracy of the race and ethnicity data for beneficiaries included on the mid-2003 EDB, (2) assess the extent of
x
bias in estimates of health services utilization for selected conditions and procedures categorized according to the EDB race/ethnicity code, and (3) develop algorithms using surname and other information available on the EDB to more accurately classify Medicare beneficiaries according to their race/ethnicity. The specific focus of this project was on improving the classification of beneficiaries who are Hispanic and Asian/Pacific Islander.
Additional objectives addressed in Part 1 of the final report included (4) describing the procedures employed to geo-code the addresses of the beneficiaries listed on the EDB to allow merging with census measures of socio-economic status, and (5) assessing how representative the racial/ethnic subgroup composition of the Medicare Current Beneficiary Survey (MCBS) is relative to the entire nation.
Methods, Data, and Approach
The accuracy of the Medicare EDB race/ethnicity code was assessed by comparative analysis with self-reported race/ethnicity data obtained from 830,728 respondents to the Medicare CAHPS surveys. The self-reported race/ethnicity of CAHPS respondents came from three different surveys conducted over three consecutive years:
• CAHPS Medicare Fee-for-Service (MFFS) surveys for the years 2000 through 2002,
• CAHPS Medicare Managed Care Enrollee (MMCE) surveys for the years 2000 through 2002, and
• CAHPS Medicare Managed Care Disenrollee (MMCD) surveys for the years 2000 through 2002.
The EDB race/ethnicity for the same Medicare beneficiaries was extracted from the mid-2003 EDB.
The analysis investigated the accuracy of the six race/ethnicity classifications used in the EDB race/ethnicity code (non-Hispanic White, non-Hispanic Black, Hispanic, Asian/Pacific Islander, American Indian/Alaska Native, and Unknown/Other). The measures calculated to estimate the accuracy of the EDB codes included: sensitivity,1 specificity,2 positive predictive value3 (PPV), negative predictive value4 (NPV), and the Kappa5 coefficient of inter-rater reliability.
1 The percentage of persons who self-reported themselves to be of a particular race/ethnicity who are coded as being
of that race on the EDB.
2 The percentage of persons who self-reported themselves not to be of a particular race/ethnicity who are coded as not being of that race on the EDB.
3 The percentage of persons coded in a particular race/ethnicity category on the EDB who really were of that race according to their self-report.
4 The percentage of persons not coded in a particular race/ethnicity category on the EDB who really were not of that race according to their self-report.
xi
The development of an algorithm to more accurately classify the race/ethnicity of Medicare beneficiaries employed Hispanic (Word and Perkins, 1996) and Asian/Pacific Islander (Falkenstein and Word, 2002) surname lists compiled after the 1990 and 2000 Census and surname and other information available on the EDB. In each of the surname lists, a percentage was associated with each name representing the frequency that households with that name were Hispanic (or Asian/Pacific Islander). Improvement in accuracy using the algorithm was assessed by comparing the race/ethnicity resulting from the algorithm to that self-reported in the CAHPS surveys.
An assessment of the bias in measures of health services utilization and access was performed by dividing the number or proportion of persons in each self-reported racial/ethnic group using particular services by the number or proportion of persons using that service according to their race/ethnicity as found on the EDB. The resulting ratios indicated the potential over- (for ratios greater than 1.00) or underestimate (for ratios less than 1.00) of health services utilization. The measures of utilization were based on Medicare claims and were only available for CAHPS respondents in two of the three years (2000 and 2001) and only one of the surveys (Medicare fee-for-service), totaling 221,387 respondents.
Major Findings
Accuracy of the EDB Race/Ethnicity Code
Relative to self-reported data, the accuracy of the EDB was greatest for non-Hispanic Black Medicare beneficiaries: sensitivity was 97.4 percent, specificity was 98.8 percent, PPV was 86.3 percent, NPV was 99.8 percent, and a Kappa coefficient of 0.91 was observed. Non-Hispanic White beneficiaries were the next most accurately identified group on the EDB. Sensitivity was high (99.3 percent), but specificity was just 61.7 percent, suggesting that a sizeable proportion of beneficiaries who were not White were incorrectly coded as White. The PPV and NPV were 91.7 and 95.7 percent, respectively, and the Kappa coefficient was in the substantial range at 0.71, but still clearly reflecting the low level of specificity. Sensitivity for American Indian/Alaska Native beneficiaries was very low at 35.7 percent, and the PPV was low at 59.9 percent. Specificity and NPV for this group, however, were exceptionally high at 99.9 and 99.7 percent, respectively. The low Kappa coefficient of 0.45 reflects the low sensitivity of the EDB for this group.
The focus of this project, however, was on Hispanic and Asian/Pacific Islander beneficiaries because earlier research had shown that the sensitivity of the EDB was especially low for these groups. Indeed, sensitivity of the EDB for Hispanic beneficiaries was only 29.5 percent, but specificity (99.9 percent), PPV (92.7 percent), and NPV (96.2 percent) were very high. The Kappa agreement coefficient of 0.43 reflected the low level of correct identification of Hispanic beneficiaries on the EDB represented in its low sensitivity. The situation on the EDB was somewhat better for Asian/Pacific Islander beneficiaries. Here, sensitivity was 54.7 percent, correctly identifying only slightly more than half of this group. Specificity and NPV were both
5 Kappa measures agreement between two independent race/ethnicity codes for the same person being coded, in this
case between the self-reported and EDB race/ethnicity codes, where a coefficient of 1.00 represents perfect agreement and 0.00 is an absolute lack of agreement.
xii
very high at 99.8 and 99.2, respectively. Even the PPV was respectable at 84.5 percent, and the Kappa coefficient at 0.66 was only slightly lower than for White beneficiaries, reflecting the low sensitivity.
Development of an Algorithm to Improve EDB Race/Ethnicity Coding
In light of the low sensitivity of the Hispanic and Asian/Pacific Islander race/ethnicity categories on the EDB, a multi-stage process was developed through which separate algorithms were developed using several pieces of information on the EDB to improve the correct racial/ethnic identification of both groups. The algorithms started with the EDB race/ethnicity code and changed it based on the following information: the beneficiary’s surname was identified as Hispanic or Asian/Pacific Islander by 70 percent or more of persons in the US Census with that surname; the first name was among the most common Hispanic or Asian/Pacific islander first names; place of residence (Hawaii or Puerto Rico); whether source of the EDB race/ethnicity code was self-identified through a special survey, and the indicated language preference for communications with the beneficiary, i.e., English for residents of Puerto Rico, and Spanish for residents of the remainder of the U.S.
The algorithms made a very significant improvement in the measures used to assess the accuracy of the race/ethnicity categorization of Hispanic and Asian/Pacific Islander Medicare beneficiaries. Among Hispanic beneficiaries, sensitivity improved from 29.5 to 76.6 percent, the Kappa coefficient rose from 0.43 to 0.79, and the other measures were virtually unchanged. The improvement for Asian/Pacific Islander beneficiaries was equally impressive – sensitivity rose from 54.7 to 79.2 percent, Kappa increased from 0.66 to 0.80, and the other measures were not materially changed. Analysis of the improvements indicated that among both groups there were somewhat more males correctly identified than females (possibly due to intermarriage and surname changes for ethnic females), and more 65-74 year olds than those older than 74 (probably because there were more in the younger age group).
The two algorithms were combined and applied to the entire 41.7 million active records in the 10 segments of the mid-2003 unloaded EDB. As with the results for the CAHPS data, the percentage of Hispanic and Asian/Pacific Islander beneficiaries increased, while the percentage of White, Black, and Other beneficiaries decreased. Overall, the combined algorithm recoded the race/ethnicity of 2,290,027 Medicare beneficiaries, substantially improving the EDB race/ethnicity coding.
A total of 1,998,9096 beneficiaries had their race/ethnicity recoded to Hispanic as a result of the combined algorithms. Most of these beneficiaries were originally classified on the EDB as White (83.5 percent), followed by Other/Unknown (11.1 percent), and Black (3.8 percent). Very few beneficiaries were originally coded as Asian/Pacific Islander (1.5 percent) or American Indian/Alaska Native (less than 0.05 percent). Overall, more female beneficiaries (1,068,033) than males (930,875) were recoded to Hispanic. The largest number of “new” Hispanic beneficiaries was created in the group of 65-to-74-year-olds.
6 This excludes 266 beneficiaries who were originally coded as missing on the EDB but are now coded as Hispanic.
Beneficiaries who were already coded as Hispanic on the EDB are also not included in this total.
xiii
Among Asian/Pacific Islander beneficiaries, 290,7487 were recoded as a result of applying the combined algorithm. Unlike the Hispanic beneficiaries who were recoded, the majority of the new Asian/Pacific Islander beneficiaries were originally coded as Other/Unknown on the EDB. Exactly 82.0 percent of the newly coded Asian/Pacific Islander beneficiaries had been originally coded as Other/Unknown. In addition, 16.4 percent were originally coded in the EDB as White, 1.5 percent as Black, and 0.2 percent as American Indian/Alaska Native. No beneficiaries originally coded as Hispanic on the EDB were recoded to Asian/Pacific Islander. In total, 155,744 females were recoded to Asian/Pacific Islander compared to 135,004 males. As with Hispanic beneficiaries, the group 65 to 74 years of age had the most recodes, while the group 85 and older had the least.
Extent of Bias Using the EDB Race/Ethnicity Code
To examine the extent of bias in estimates of health services utilization based on the EDB race/ethnicity code, Medicare claims for one year for the following services were examined:
• four cancer screening procedures,
• four preventive services for persons with diabetes,
• hospital or emergency department admissions for 15 ambulatory care sensitive conditions (ACSCs),
• use of six different types of Medicare covered services, and
• hospital care for five selected chronic and acute conditions.
In this analysis, two estimates of utilization were examined for services relating to: cancer screening services, diabetes prevention services, and ambulatory care sensitive conditions. The first estimate was the number of beneficiaries using the specified service, and the second estimate was the percentage of beneficiaries using the service. In addition to number and percentage estimates, the mean payment was also estimated for types of Medicare covered services and the mean length of stay was further added for hospitalization for selected conditions. These four estimates (number, percentage, mean payment, and mean length of stay) were created from claims for each racial/ethnic group using the EDB race/ethnicity classification and also using the self-reported race/ethnicity classifications. Bias for each estimate was assessed by calculating a ratio of the results using the EDB race/ethnicity classification divided by the results using the self-reported race/ethnicity. The different estimates and the level of bias are described below for each set of services listed above.
Cancer Screening Services. In comparisons of cancer screening services according to EDB race/ethnicity and self-reported race/ethnicity data, estimates of the number who used cancer screening services were, on average, slightly higher for White (four percent) and Black beneficiaries (11 percent). For Hispanic and American Indian/Alaska Native beneficiaries, the
7 This excludes 68 beneficiaries who were originally coded as missing on the EDB but are now coded as A/PI.
Beneficiaries who were already coded as A/PI on the EDB are also not included in this total.
xiv
bias was much larger -- between 207 and 318 percent underestimated, respectively – while for beneficiaries who were Asian/Pacific Islander cancer screening service use was underestimated but only by 45 percent on average.
In comparison to the estimated number of beneficiaries using cancer screening services, estimates of the percentage of beneficiaries using these same cancer screening services were much less biased for all races/ethnicities. There was on average no bias for Black beneficiaries. The bias for White, Hispanic and Asian/Pacific Islander beneficiaries was small -- underestimated by from two to six percent – and for beneficiaries who were American Indian /Alaska Native it was underestimated by 38 percent.
Diabetes Prevention Services. Among beneficiaries identified as having diabetes, the bias in the number estimated to have used preventive services was similar in magnitude to that for the cancer screening services. In comparisons of EDB race/ethnicity data to self-reported race/ethnicity, utilization was overestimated by seven percent and 10 percent for White and Black beneficiaries, respectively. However, utilization was underestimated on average by 153 percent, 34 percent, and 238 percent, respectively, for Hispanic, Asian/Pacific Islander, and American Indian/Alaska Native beneficiaries.
Similar to the situation observed among beneficiaries using cancer screening services, the bias in the percentage of beneficiaries with diabetes using preventive services were reasonably small relative to the estimates of the number of beneficiaries using these services (described in the preceding paragraph). There was no bias in the Black estimates of utilization on average, and for White beneficiaries the average bias in the percentage of users was only a one percent underestimate. Hispanic and Asian/Pacific Islander beneficiaries using these services were overestimated by only six and three percent, respectively, while estimates of American Indian/Alaska Native beneficiaries using preventive services for diabetes were underestimated by 32 percent.
Ambulatory Care Sensitive Conditions. Because there were so few hospital or emergency department admissions for the fifteen ambulatory care sensitive conditions (ACSCs), they were combined to analyze bias. The pattern of bias among beneficiaries with any of the 15 ACSCs is similar to what was found for cancer screening and preventive diabetes services. The number of White and Black beneficiaries with an ACSC admission was overestimated by seven and 10 percent, respectively, by the EDB to self-reported race/ethnicity comparison. For Hispanic, Asian/Pacific Islander, and American Indian/Alaskan Native beneficiaries, the bias resulted in underestimating the numbers by 161, 23, and 198 percent, respectively.
The estimated percentages of beneficiaries with an ACSC admission were much less biased than the estimated number of beneficiaries with an ACSC admission. Bias for the estimates of the percentage of White and Black beneficiaries with ACSC admissions were only one percent overestimated and one percent underestimated, respectively. Estimates for Hispanic, Asian/Pacific Islander, and American Indian/Alaska Native beneficiaries were nine, twelve, and one percent overestimated when compared to EDB race/ethnicity, respectively.
Types of Medicare Covered Services. In assessing the extent of bias in estimates of selected types of services billed to Medicare during the previous 12 months, payments were
xv
examined as well as the number and proportion of beneficiaries submitting claims for any service, for hospitalization, for physician services, for nursing home stays, for home health services, for durable medical equipment, and emergency department. The estimated number of White and Black beneficiaries with claims for any type of service was overestimated by six and 11 percent, respectively, when based on EDB race. The number of Hispanic beneficiaries with claims for the services was underestimated by 186 percent, Asian/Pacific Islander beneficiaries by 43 percent, and American Indian/Alaska Native beneficiaries by 212 percent.
The percentage of beneficiaries with claims for any services was much less biased. The percentage of Black beneficiaries with claims was estimated without bias, while the percentage of Hispanic beneficiaries was overestimated by one percent, and Asian /Pacific Islander and American Indian/Alaska Native beneficiaries were underestimated by two and four percent respectively, using EDB race.
The mean amount paid by Medicare for persons submitting claims for any services was unbiased for White and Black beneficiaries. The mean amounts paid for Hispanic, Asian /Pacific Islander, and American Indian/Alaska Native beneficiaries were all overestimated, respectively, by 10, 22 and seven percent.
Findings of bias in estimates for the use of the specific types of services are on average very similar (within one or two percentage points) to those reported for the use of any type of service for White, Black, and Hispanic beneficiaries for numbers, percentages and mean payments in dollars. However, the estimates for Asian/Pacific Islander beneficiaries by type of service used were on average about 16 percentage points lower for number of persons using, 14 percentage points lower for the percent using, but 11 percent higher in the amount of payments made for their service use. For American Indian/Alaska Native beneficiaries, the bias was consistently higher for estimates of number of persons, the percentage using, and mean payment for utilization for the individual types of services, on average by 18, eight, and five percentage points.
Hospitalizations for Selected Conditions. Estimates of bias in four utilization measures —number hospitalized, percentage hospitalized, mean payment, and mean length of stay—were examined by race/ethnicity. We examined hospitalizations occurring during a one year period for persons with diagnoses of heart disease, stroke, pneumonia, cancer, and fractures.
As with the other results presented above, the bias, regardless of specific race/ethnicity, when using EDB race/ethnicity, compared to self-reported race/ethnicity, is greatest for estimates of the number of persons hospitalized than it is for the proportion of persons hospitalized for one of these conditions. On average across all five conditions, the estimated number of White beneficiaries hospitalized was overestimated by six percent, and for Black beneficiaries it was overestimated by 10 percent. However, for Hispanic, Asian/Pacific Islander, and American Indian/Alaska Native beneficiaries, the estimated numbers were low, on average by 183, 13, and 291 percent.
Estimates of the percentage with hospitalizations were much more accurate on average across the five conditions especially for White, Black, and Hispanic beneficiaries – within one percent. For Asian/Pacific Islander and American Indian/Alaska Native beneficiaries, the
xvi
estimates of the percentage hospitalized were 20 percent too high and 30 percent too low, respectively.
Much the same situation was found with respect to the bias in mean payments in dollars and mean lengths of stay in days. The average for both of these means across all five conditions for White beneficiaries was unbiased, and it was not biased for Black beneficiaries with respect to the mean payments made. The mean length of stay in days for Black beneficiaries, however, was overestimated by three percent when based on EDB race. The situation for Hispanic beneficiaries showed them to have had both of these means underestimated, by six and sixteen percent, respectively. The same was true for American Indian/Alaska Native beneficiaries, except the level of underestimates was higher, 24 and 97 percent, respectively. For Asian/Pacific Islander beneficiaries, the situation was reversed. For them, estimates of both means were overestimated, by nine and 34 percent, respectively.
Success Geo-Coding Medicare Beneficiary Addresses to Link with Census
Beneficiary addresses were successfully geo-coded using codes consistent with the US Census (FIPS or Federal Information Processing Standards codes) in order to link their residential area (block group) to socioeconomic status (SES) indicators available in the US Census. No SES measures at the person level are currently available as part of the Medicare enrollment database (EDB), and despite certain limitations and errors inherent in using residential area rather than person-level measures of SES, the benefit of incorporating SES information with Medicare data seemed obvious.
Overall, 86.8 percent of the total 41,742,407 addresses of Medicare beneficiaries were successfully geocoded by the software leased from GeoLytics Inc. Addresses of beneficiaries residing in foreign countries (including Puerto Rico) or with post office boxes or rural route delivery numbers (5,223,766 or 12.5 percent) could not be processed. Ninety-nine and two-tenths (99.2) percent of the addresses that were processed (36,223,053 or 86.8 percent of the total) were successfully matched to a FIPS code block group. Sixty-one (61.0) percent of the matches made were exact with the addresses that were input, and the remaining 25.6 percent employed one of the available options.
Accuracy of MCBS Race/Ethnicity Subgroup Representation
The objective of this analysis was to assess whether the primary sampling units (PSUs) used in the Medicare Current Beneficiary Survey (MCBS) were representative of the major Hispanic (Mexican, Puerto Rican, Cuban, other) and Asian/Pacific Islander (Indian, Chinese, Filipino, Japanese, Korean, Vietnamese, Pacific islanders, others) national origin subgroups participating in the Medicare program. Because there is no information available from the EDB on Medicare beneficiary ethnic subgroup enrollment, the mixture of persons 65 years of age and older reported in Hispanic and Asian/Pacific Islander subgroups by the US Census in the nation as a whole was adopted as a proxy standard.
Analyses were conducted separately for Hispanic and Asian/Pacific Islander subgroups. Comparison of the proportion of elderly persons in each national origin subgroup in the MCBS PSUs to the proportion of elderly persons in each national origin subgroup in the nation as a
xvii
whole formed the basis of conclusions regarding subgroup representation in the MCBS PSUs. The analysis found that elderly persons of Mexican origin (46.7 percent of the nation’s Hispanic population) are underrepresented by 18 percent, and that elderly persons of Puerto Rican and Cuban origins (11.0 and 13.2 percent of the nation’s Hispanic population, respectively) are overrepresented by 41 and 17 percent, respectively. The pool of elderly Other Hispanics (the remaining 29.1 percent of the nation’s Hispanic population) is represented at about the right level overall, although within the pool, persons from the Dominican Republic, Central America, and South America are overrepresented by from 25 to 36 percent; Spaniards are approximately correctly represented; but the remaining Other Hispanics as a group are underrepresented by about 15 percent.
The situation with respect to representation of elderly persons of Asian/Pacific Islander origins is slightly better insofar as the Japanese (who make up 20.1 percent of the nation’s Asian population) are the only subgroup underrepresented (by 36 percent), and the Chinese (comprising 29.5 percent of the nation’s Asian population) are the only subgroup overrepresented (by 20 percent) by reasonably large amounts. The remaining Asian subgroups – Filipino, Korean, Asian Indian, Vietnamese, and the pool of Other Asians – account for 48.6 percent of the nation’s Asian population and are either just slightly overrepresented (by as little as 12 percent) or slightly underrepresented (by as little as four percent) Elderly persons of Native Hawaiian and Other Pacific Island origin are in the pool of Other Asians. They represent only 2.5 percent of the nation’s population, but are underrepresented in the MCBS PSUs by 44 percent.
Summary and Conclusions
The accuracy of the Medicare EDB race/ethnicity variable was assessed by comparison to self-reported race/ethnicity for a sample of more than 830,000 Medicare beneficiaries. It was found to be excellent for Black and White beneficiaries, each having a sensitivity of 99 percent. However, the sensitivity of the EDB race/ethnicity ranged from low to extremely low for Asian/Pacific Islander (55 percent), American Indian/Alaska Native (36 percent), and Hispanic (30 percent) beneficiaries.
An algorithm using surnames, first names, and information from the EDB including language preference and state of residence was developed to improve the coding of race/ethnicity for beneficiaries of Hispanic or Asian/Pacific Islander origins. The algorithm was run on the same sample of 830,000 Medicare beneficiaries and the sensitivity of the new race/ethnicity code was much improved, reaching good levels for both groups – 77 percent for Hispanic and 79 percent for Asian/Pacific Islander beneficiaries.
The algorithm was next run on the entire 41.7 million active records in the mid-2003 EDB. Nearly 2.3 million beneficiaries were given a new race/ethnicity. Of those, the race/ethnicity of approximately 2 million beneficiaries were recoded to Hispanic, and almost 300,000 were recoded to Asian/Pacific Islander. Nearly 84 percent of the newly identified Hispanic beneficiaries were originally coded as White in the EDB, and 82 percent of the newly identified Asian/Pacific Islander beneficiaries were original coded as Other/Unknown. In both groups, the newly identified included slightly more females than males and 65-74 year olds than older ages.
xviii
The amount of bias associated with estimates of health services utilization when analyzed according to EDB race/ethnicity was also investigated. Claims for the sample of more than 220,000 Medicare fee-for-service beneficiaries were used to compute several measures of utilization – the number and proportion using, and where applicable, the mean payment for the service and the mean length of stay – by EDB and self-reported race/ethnicity. Comparisons of estimates for the same service according to the two race/ethnicity measures were examined for a number of areas of utilization – cancer screening, diabetes prevention, ambulatory care sensitive conditions, different types of services, and hospitalization.
Across all five areas of utilization, the number of White and Black beneficiaries using the services was always overestimated when categorized by EDB race/ethnicity, but consistently underestimated for Hispanic, Asian/Pacific Islander, and American Indian/Alaska Native beneficiaries. The magnitude of the overestimates for White and Black beneficiaries ranged from four to 11 percent, the size of the underestimate for Asian/Pacific Islander beneficiaries was from 13 to 45 percent, but the size of the underestimates for Hispanic and American Indian/Alaska Native ranged from 153 to 318 percent.
The situation was quite different analyzing bias in the percentages using services across all five areas of utilization when categorized by EDB race/ethnicity. There was either no bias in the estimates for White and Black beneficiaries, or there was a one or two percent underestimate or overestimate. Typically, Hispanic and Asian/Pacific Islander beneficiaries had underestimates ranging from three to 12 percent, while for American Indian/Alaska Native beneficiaries the underestimates ran as high as 38 percent.
With respect to the estimates of mean payments made for White and Black beneficiaries, there was no bias. For mean length of stay, there was no bias for White beneficiaries and it was overestimated by three percent for Black beneficiaries. There was greater variation and no consistent pattern for bias across the other racial/ethnic groups for these two measures, but the estimates were clearly more biased than for White and Black beneficiaries.
The algorithm developed in this project greatly improved the accuracy of the EDB race/ethnicity variable, especially regarding identification of Hispanic and Asian/Pacific Islander beneficiaries. Use of this improved variable in future analyses of utilization differences by race/ethnicity will result in less biased numerical, proportional, and mean estimates than is possible with the existing EDB race/ethnicity variable.
1
CHAPTER 1 OVERVIEW OF PART 1 OF THE FINAL REPORT
The overall goal of this project has been identify disparities in health services utilization and expenditures among the different Medicare beneficiary racial/ethnic groups as evidenced in their claims. However, before we could proceed to identify disparities, we needed to confirm the accuracy and completeness of, and where possible to improve, the coding of race/ethnicity in the EDB, the repository of Medicare’s race/ethnicity data. With the growth of minority populations in the U.S., there has been considerable interest and initiatives by Government agencies to reduce and eliminate racial/ethnic health disparities. With this project, the Centers for Medicare & Medicaid Services (CMS) has indicated a commitment to improving its data to permit more extensive analyses of the Medicare program to identify and eliminate barriers to the access to care that can result in racial/ethnic health disparities.
This document, which is Part 1 of a two-part final report, describes the work performed on three separate but related topics as part of this project’s Task 2 requirements:
1. The first topic recounts the efforts made to assess and improve the race and ethnicity coding of Medicare beneficiaries listed in the Medicare enrollment database (EDB). This topic addresses the most complex portion of the work discussed in this part of the final report. Successful completion of this project was premised on having improved and acceptable race/ethnicity data to use to more correctly classify beneficiaries in analyses intended to identify disparities in service utilization.
2. The second topic describes the assignment of geo-codes to the Medicare beneficiaries listed in the EDB. Our goal was to link Medicare beneficiaries to U.S. Census data that describe the socioeconomic status (SES) of the place where beneficiaries reside. To avoid repetition in the body of this report, we have included some of the detailed description of the work in appendices. We performed this work so that our project team and other researchers could attempt to separate the impact of socioeconomic status from that of race/ethnicity in subsequent analyses of disparities in service use and access to care.
3. The third topic presents the work done to compare the distribution of the national origins of racial/ethnic subgroups in the entire U.S. population to that of the areas (primary sampling units or PSUs) represented in the Medicare Current Beneficiary Survey (MCBS). This comparison is important because race/ethnicity is self-reported by the MCBS respondents. Therefore, the MCBS has been a source relied upon for correct information in a variety of analyses of racial and ethnic differences in service use among Medicare beneficiaries.

3
CHAPTER 2 ASSESSING AND IMPROVING THE ACCURACY AND COMPLETENESS OF
RACE/ETHNICITY CODING ON THE MEDICARE ENROLLMENT DATABASE (EDB)
2.1 Introduction
The race/ethnicity code on the Medicare EDB is obtained from the Social Security Administration’s (SSA’s) master beneficiary record (MBR). From 1935 to 1980, the Social Security application form (SS-5) only allowed classification of a person’s race into “White,” “Black,” or “Other” categories. In addition, “Unknown” was used to classify persons who did not report any race. The codes from the SS-5 were incorporated into the MBR. The number of race/ethnicity categories on the SS-5 form was expanded in 1980 to six: “White (non-Hispanic)”; “Black (non-Hispanic)”; “Hispanic”; “Asian, Asian-American, or Pacific Islander”; “American Indian or Alaska Native”; and “Unknown.” In 1989, the SSA began to enroll new participants at birth, extracting data from birth certificates rather than requiring applicants to file form SS-5; however, the race/ethnicity information on the birth certificate was not included in the data extraction because it was considered unnecessary for the administration of the SSA program. Since 1989, the only persons filing an SS-5 form have been those requesting a new number or a name change (Scott, 1999).
In 1994, race data from the SS-5 forms with the expanded race/ethnicity codes were integrated into the EDB in an effort to correct erroneous codes and fill in missing ones. This action changed the race/ethnicity coding for more than 2.5 million beneficiaries (Lauderdale and Goldberg, 1996). This update using the SS-5 form was conducted again in 1997 and 2000, and has been conducted on an annual basis since then. The Medicare program has also been working with the Indian Health Service to improve the coding of American Indians and Alaska Natives.
To correct miscoded data and further reduce the amount of missing race/ethnicity information, in 1997 the Health Care Financing Administration (now the Centers for Medicare & Medicaid Services, or CMS) conducted a postcard survey of nearly 2.2 million beneficiaries. Included in the survey were beneficiaries with: Hispanic surnames, Hispanic countries of birth, or coded “Other” or missing race/ethnicity data. The survey resulted in code changes for approximately 858,000 beneficiaries (Arday et al., 2000). These efforts clearly improved the EDB’s race/ethnicity data. Nonetheless, comparisons of the EDB race/ethnicity codes to the self-reported race/ethnicity from the Medicare Current Beneficiary Survey (MCBS) indicated that identification of Hispanic, Asian/Pacific Islander, and American Indian/Alaska Native beneficiaries was still incomplete and might result in biased analyses involving these groups (Arday et al., 2000).
2.2 Data
We conducted four analyses in the process of assessing and improving the race/ethnicity coding of Medicare beneficiaries listed in the EDB. The data we used in the analyses included the following:
4
1. Separate surname lists obtained from the 1990 and 2000 U.S. Census for Hispanic/Latino and Asian/Pacific Islander origins, respectively.
2. Separate first-name lists compiled from multiple Web sites persons of Hispanic/Latino and Asian/Pacific Islander origins.
3. The self-reported race/ethnicity of 830,728 Medicare beneficiary respondents from three different CAHPS surveys conducted over three consecutive years:
a. CAHPS Medicare Fee-for-Service (MFFS) surveys for the years 2000 through 2002,
b. CAHPS Medicare Managed Care Enrollee (MMCE) surveys for the years 2000 through 2002, and
c. CAHPS Medicare Managed Care Disenrollee (MMCD) surveys for the years 2000 through 2002.
We refer to these data collectively as the CAHPS data. The self-reported race/ethnicity codes from these data are referred to as the SELFRACE variable in the remainder of this chapter.
4. Several variables found on the Medicare EDB that included the following:
a. A Race/Ethnicity8 variable that is referred to as the EDBRACE variable in the remainder of this chapter. The EDBRACE variable has eight different values and only allows beneficiaries one value each. The eight values and their meanings are:
0 = Unknown
1 = White (non-Hispanic)
2 = Black (non-Hispanic)
3 = Other
4 = Asian/Pacific Islander
5 = Hispanic/Latino
6 = American Indian/Alaska Native
Blank = Temporary Record
b. A variable that identifies the language a beneficiary requested CMS (then HCFA) to use when sending the Medicare Handbook. English, Spanish, and blank (no preference specified) are the only allowed values. This variable is referred to as LANGPREF.
c. A variable that identifies the language a beneficiary requested the Social Security Administration (SSA) to use when sending beneficiary notices. This variable is used by CMS for Medicare premium bills. English (for Puerto Rico
8 The meanings of the codes listed for EDBRACE are what we believe to have been intended by the codes. The
definitions for the race/ethnicity variable codes in the EDB codebook actually specify 0 = Unknown, 1 = White, 2 = Black, 3 = Other, 4 = Asian, 5 = Hispanic, 6 = North American Native, and Blank = temporary record.
5
zip codes only), Spanish, and blank (English assumed for non-Puerto Rico zip codes and Spanish assumed for Puerto Rico zip codes) are the only allowed values that HCFA supports. This code is referred to as LANGCD.
d. A variable that identifies the source of a beneficiary’s race code (EDBRACE) in the EDB. This variable is referred to as RACESRC. Three values are allowed:
A = Response from a one-time survey that was mailed to certain beneficiaries in 1995
B = Indian Health Service
Blank = Social Security Administration—Master Beneficiary Record (SSA-MBR) or for SS-5 (NUMIDENT) or Railroad Retirement Board (RRB)
e. A variable that identifies the state a beneficiary lives in. We identified beneficiaries living in Hawaii and Puerto Rico.
2.3 Limitations of the data
Most of the limitations of the data that we are aware of involve the American Indian/Alaska Native portion of the sample used in the assessments of accuracy and bias. First of all, there are only 3,344 out of over 830,000 that self –identified in the CAHPS surveys as American Indian/ Alaska Native, and the EDB only had 1,194 beneficiaries identified as American Indian/ Alaska Native. While such representation of American Indians/Alaskan Natives is quite large relative to surveys such a the Medicare Current Beneficiary Survey (MCBS), with such small numbers, estimates of relatively rare events like hospitalization for ambulatory care sensitive conditions can be quite unstable.
Again with respect to the American Indian/Alaska Native portion of the sample, despite an improvement in the completeness with which CMS has identified this segment of the Medicare population, it has been achieved through an arrangement with the Indian Health Service (HIS) and Tribal health facilities. Those facilities likely have the most information on the enrollment of American Indian/Alaska Native Medicare beneficiaries who live on tribal lands and who utilize services on or around tribal lands and in those few cities where there are urban facilities for American Indians/Alaska Natives.
Finally, with regard to the payments reported for American Indian/Alaska Native Medicare beneficiaries, we were told by CMS staff that HIS and Tribal facilities are often paid on what amounts to a “per capita” basis for certain kinds of services even though the beneficiaries are enrolled in the traditional fee-for-service Medicare. This means that despite having claims, the payment amounts may not be shown for all of the services provided.
Our last caveat concerns the comparability of the EDB and CAHPS race/ethnicity codes. The CAHPS data follow the OMB directive 15 with respect to how race/ethnicity data are collected, separately collecting Hispanic ethnicity from race, and allowing multiple responses to the race item. The CAHPS data were made to conform as closely as possible to the EDB codes which were based on the more limited race/ethnicity alternatives available on the SS-5 form that
6
was used by Social Security Administration which did not permit more than a single race selection.
2.4 The Process and Results
For the purposes of this project, we treated the self-reported race information, the SELFRACE variable, collected via the various CAHPS survey instruments, as the “gold standard” in applying the comparative assessment techniques. The rationale for this decision is that the race/ethnicity of CAHPS respondents was self-identified whereas the methods for EDB race identification have been more variable and did not always conform to the set of codes used today. Using the respondents’ self-reported CAHPS data as our sample, we proceeded through the following four steps:
1. We matched the Medicare HIC numbers of Medicare beneficiaries who appeared in the CAHPS data to their corresponding records in the EDB. We then extracted and appended the EDB race variable, EDBRACE, to their CAHPS data record. Since the CAHPS self-reported race (SELFRACE) was considered the gold standard, we assessed how closely the existing EDB race/ethnicity code (EDBRACE) matched the race/ethnicity code of the CAHPS’ SELFRACE. We evaluated the EDBRACE variable by examining the bivariate agreement/disagreement relationships (2 x 2 contingency tables) between race/ethnicity from the two sources, along with several measures of agreement. We found agreement between SELFRACE and EDBRACE to be fairly low for Asian/Pacific Islander (A/PIs) beneficiaries and even lower for Hispanic beneficiaries.
2. Next, we compared the CAHPS survey respondents’ self-reported race/ethnicity, SELFRACE, to a new race/ethnicity variable we created using naming algorithms based on the Hispanic (Word & Perkins, 1996) and Asian/Pacific Islander (Falkenstein & Word, 2002) surname lists developed by the U.S. Census Bureau. These lists were based on the empirically established fact that certain surnames, and even certain spellings of surnames, are associated with a known probability with a person’s race/ethnicity. By running the naming algorithms on the names of the CAHPS survey respondents, we were able to create a new race variable for each survey respondent based on his or her surname. We refer to this new variable as NAMERACE. It is important to note that NAMERACE was calculated independently of the survey respondent’s race/ethnicity coding from the EDB and the CAHPS survey. We assessed the naming algorithms by comparing each respondent’s NAMERACE code to their SELFRACE code. As in Step 1 above, 2 x 2 contingency tables and other methods of agreement assessment were used in the analysis. SELFRACE in this analysis was again the gold standard.
We created the NAMERACE variable employing a range of empirically established probabilities of correct race/ethnicity categorization (our level of inclusion) for the names in the lists. Regardless of how strict or loose the level of inclusion, we found that starting with no race information at all, the variable created from the naming algorithm, NAMERACE, was no better overall at correctly identifying race/ethnicity for A/PI beneficiaries than the existing EDBRACE variable. For Hispanic
7
beneficiaries, however, the variable created from the naming algorithm did result in a very modest improvement over the EDBRACE variable.
3. Upon further analysis, we found that by using the existing codes for the EDBRACE variable as a starting point, and applying the naming algorithms to them, we were able to obtain markedly improved results. These results led us to investigate how other variables found in the EDB, some simple geographic assumptions, and beneficiaries’ first name could further improve the accuracy of our naming algorithms.
Thus, using race/ethnicity information from the EDB, surname lists, geography, first name lists, and two other EDB variables, we constructed a second new race variable that we called ALGRACE. In the same manner as described above, we assessed the performance of the improved naming algorithm by comparing the agreement/disagreement between ALGRACE and SELFRACE. We found that for both Hispanic and A/PI beneficiaries, ALGRACE was considerably better at correctly identifying race/ethnicity than either the EDBRACE or NAMERACE variables.
4. The success of the ALGRACE variable for Hispanic and A/PI beneficiaries led us to the conclusion that combining the optimal Hispanic and A/PI name algorithms to construct a new “corrected” racial and ethnic variable for the EDB was the obvious next step. Following this step, we obtained the 10 segments of the unloaded EDB containing the entire enrollment of Medicare beneficiaries and the corresponding variables from the EDB used in the final step of the algorithm. Then we ran the final algorithm on the full EDB, creating a new race/ethnicity variable called NEWRACE. This variable can be added to the EDB and used in place of EDBRACE, thereby giving researchers and policy makers an improved race/ethnicity variable to work with. We discuss the detailed results of the analytic process summarized above in the next chapter.

9
CHAPTER 3 ASSESSMENT AND ALGORITHM RESULTS
3.1 Assessing and Improving the Accuracy of the Race/Ethnicity Coding in the EDB
3.1.1 Assessment of the EDB Race/Ethnicity Coding: Comparing Self-Reported Race/Ethnicity from the CAHPS Surveys to Race/Ethnicity in the EDB
In our assessment, we compared the self-reported race variable, SELFRACE, from the CAHPS data to the corresponding EDBRACE variable for all the survey respondents. As indicated above, the EDBRACE variable has eight different values and only allows beneficiaries one value each. Prior to making comparisons, we created the self-reported race variable, SELFRACE, from the two CAHPS survey questions related to race and ethnicity. Below are the two race/ethnicity questions and possible responses that appear in the CAHPS surveys:
1. Are you of Hispanic or Latino origin or descent?
a. Yes, Hispanic or Latino
b. No, not Hispanic or Latino
2. What is your race? Please mark one or more.
a. White
b. Black or African American
c. Asian
d. Native Hawaiian or other Pacific Islander
e. American Indian or Alaskan Native
To make meaningful comparisons, the self-reported race variable, SELFRACE, created from the two survey questions above, had to be created with similar logic and the same codes as the EDBRACE variable. Thus, we devised the following rules to make the SELFRACE codes comparable to EDBRACE codes:
1. If a CAHPS survey respondent answered “Yes” to Question 1, indicating he/she was Hispanic, SELFRACE was set to Hispanic/Latino regardless of how the response to Question 2.
2. Otherwise, if the survey respondent answered “No” to Question 1 (or the response was “Missing”) and only chose one race category in Question 2, then SELFRACE was set to the value of the race that was chosen. For example, if a respondent chose “Asian,” SELFRACE was set to Asia/Pacific Islander. If a respondent selected “Native Hawaiian or other Pacific Islander,” SELFRACE was also set to A/PI.
3. If a respondent answered “No” to Question 1 (or the response was “Missing”) and he/she reported more than one race in Question 2, SELFRACE was set to a new category called “two or more.” Since the EDB did not have an equivalent category, these beneficiaries were not included in our analyses.
10
4. If a survey respondent’s answer was “Missing” for both Questions 1 and 2, then SELFRACE was set to the code for “Unknown.”
5. If the survey respondent answered “No” to Question 1 (or it was “Missing”), and answered “Other” to Question 2, then SELFRACE was set to “Unknown.”
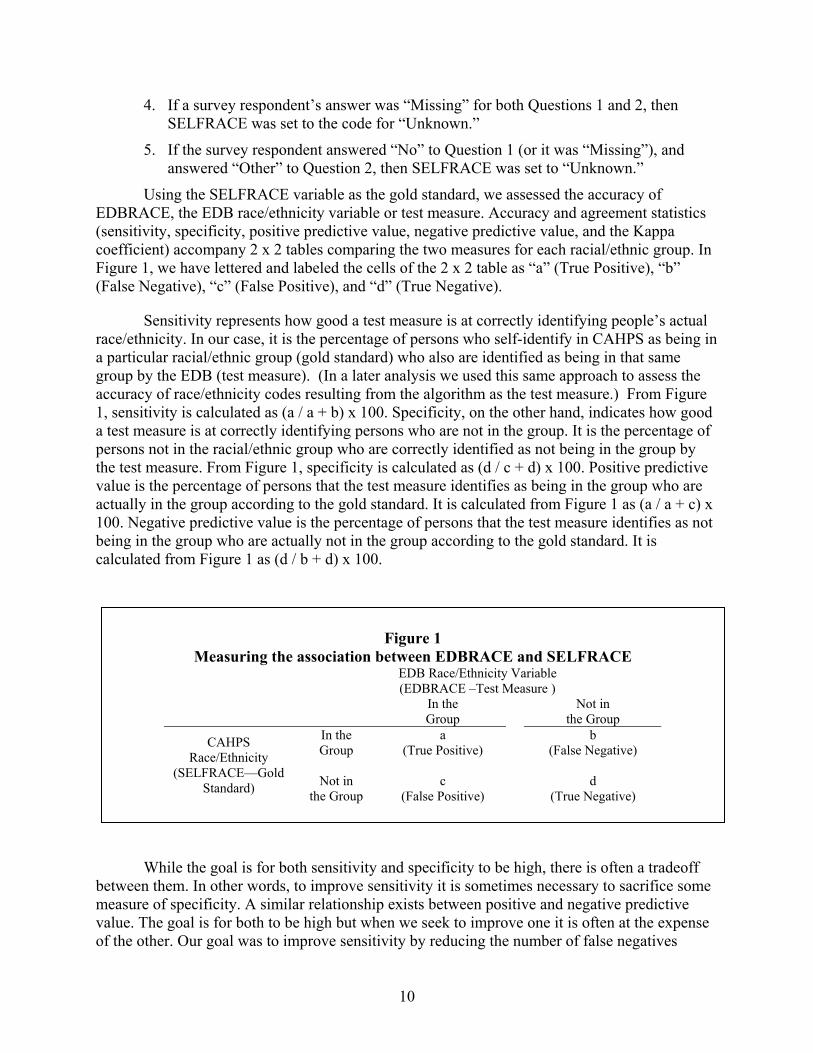
Using the SELFRACE variable as the gold standard, we assessed the accuracy of EDBRACE, the EDB race/ethnicity variable or test measure. Accuracy and agreement statistics (sensitivity, specificity, positive predictive value, negative predictive value, and the Kappa coefficient) accompany 2 x 2 tables comparing the two measures for each racial/ethnic group. In Figure 1, we have lettered and labeled the cells of the 2 x 2 table as “a” (True Positive), “b” (False Negative), “c” (False Positive), and “d” (True Negative).
Sensitivity represents how good a test measure is at correctly identifying people’s actual race/ethnicity. In our case, it is the percentage of persons who self-identify in CAHPS as being in a particular racial/ethnic group (gold standard) who also are identified as being in that same group by the EDB (test measure). (In a later analysis we used this same approach to assess the accuracy of race/ethnicity codes resulting from the algorithm as the test measure.) From Figure 1, sensitivity is calculated as (a / a + b) x 100. Specificity, on the other hand, indicates how good a test measure is at correctly identifying persons who are not in the group. It is the percentage of persons not in the racial/ethnic group who are correctly identified as not being in the group by the test measure. From Figure 1, specificity is calculated as (d / c + d) x 100. Positive predictive value is the percentage of persons that the test measure identifies as being in the group who are actually in the group according to the gold standard. It is calculated from Figure 1 as (a / a + c) x 100. Negative predictive value is the percentage of persons that the test measure identifies as not being in the group who are actually not in the group according to the gold standard. It is calculated from Figure 1 as (d / b + d) x 100.
While the goal is for both sensitivity and specificity to be high, there is often a tradeoff between them. In other words, to improve sensitivity it is sometimes necessary to sacrifice some measure of specificity. A similar relationship exists between positive and negative predictive value. The goal is for both to be high but when we seek to improve one it is often at the expense of the other. Our goal was to improve sensitivity by reducing the number of false negatives
Figure 1 Measuring the association between EDBRACE and SELFRACE
EDB Race/Ethnicity Variable (EDBRACE –Test Measure )
In the Group
Not in the Group
In the Group
a (True Positive)
b (False Negative) CAHPS
Race/Ethnicity (SELFRACE—Gold
Standard)
Not in
the Group c
(False Positive) d
(True Negative)
11
without drastically reducing specificity by increasing the number of false positives. As a means for deciding when to stop our manipulations, we set a pragmatic target of improving sensitivity to at least 75 percent, with negligible adverse impact on specificity.
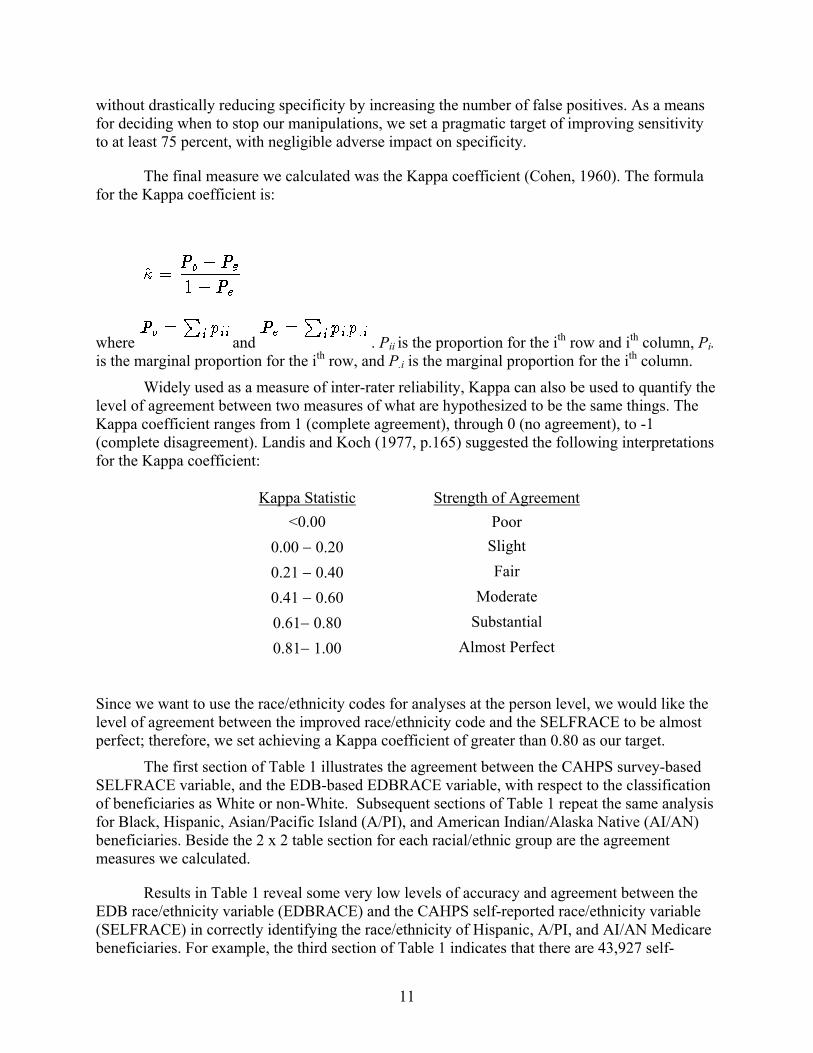
The final measure we calculated was the Kappa coefficient (Cohen, 1960). The formula for the Kappa coefficient is:
where and . Pii is the proportion for the ith row and ith column, Pi. is the marginal proportion for the ith row, and P.i is the marginal proportion for the ith column.
Widely used as a measure of inter-rater reliability, Kappa can also be used to quantify the level of agreement between two measures of what are hypothesized to be the same things. The Kappa coefficient ranges from 1 (complete agreement), through 0 (no agreement), to -1 (complete disagreement). Landis and Koch (1977, p.165) suggested the following interpretations for the Kappa coefficient:
Kappa Statistic Strength of Agreement <0.00 Poor
0.00 − 0.20 Slight
0.21 − 0.40 Fair
0.41 − 0.60 Moderate
0.61− 0.80 Substantial
0.81− 1.00 Almost Perfect
Since we want to use the race/ethnicity codes for analyses at the person level, we would like the level of agreement between the improved race/ethnicity code and the SELFRACE to be almost perfect; therefore, we set achieving a Kappa coefficient of greater than 0.80 as our target.
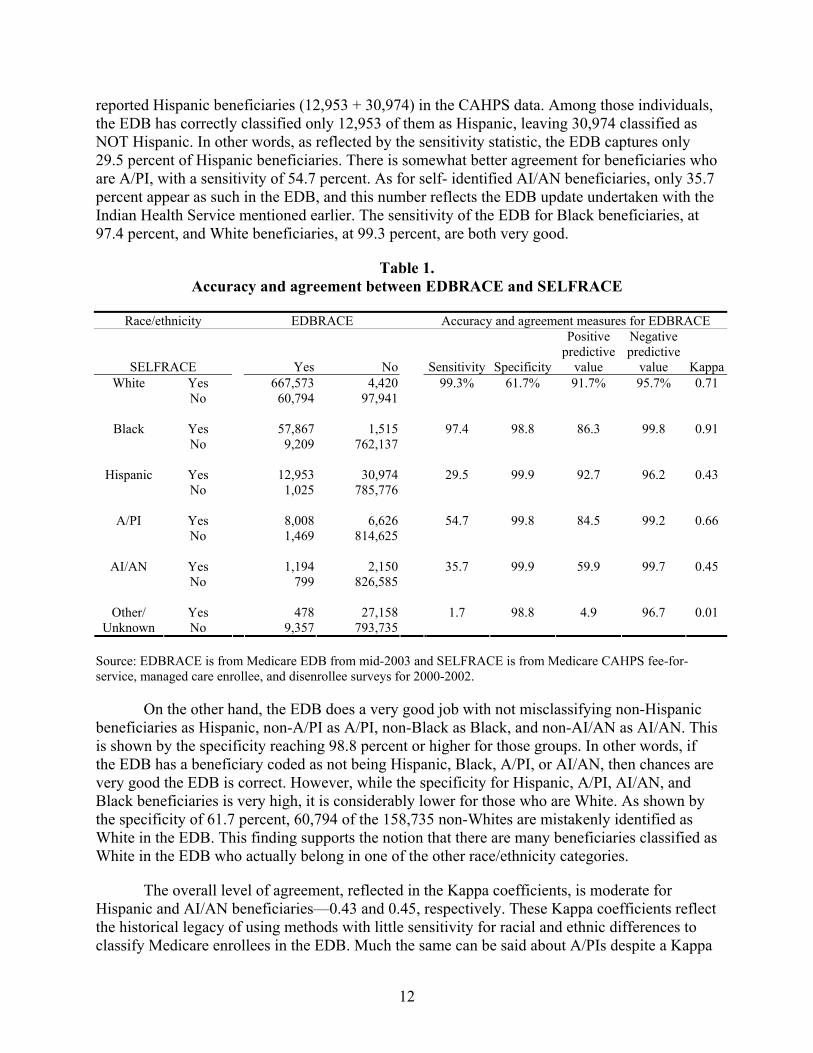
The first section of Table 1 illustrates the agreement between the CAHPS survey-based SELFRACE variable, and the EDB-based EDBRACE variable, with respect to the classification of beneficiaries as White or non-White. Subsequent sections of Table 1 repeat the same analysis for Black, Hispanic, Asian/Pacific Island (A/PI), and American Indian/Alaska Native (AI/AN) beneficiaries. Beside the 2 x 2 table section for each racial/ethnic group are the agreement measures we calculated.
Results in Table 1 reveal some very low levels of accuracy and agreement between the EDB race/ethnicity variable (EDBRACE) and the CAHPS self-reported race/ethnicity variable (SELFRACE) in correctly identifying the race/ethnicity of Hispanic, A/PI, and AI/AN Medicare beneficiaries. For example, the third section of Table 1 indicates that there are 43,927 self-
12
reported Hispanic beneficiaries (12,953 + 30,974) in the CAHPS data. Among those individuals, the EDB has correctly classified only 12,953 of them as Hispanic, leaving 30,974 classified as NOT Hispanic. In other words, as reflected by the sensitivity statistic, the EDB captures only 29.5 percent of Hispanic beneficiaries. There is somewhat better agreement for beneficiaries who are A/PI, with a sensitivity of 54.7 percent. As for self- identified AI/AN beneficiaries, only 35.7 percent appear as such in the EDB, and this number reflects the EDB update undertaken with the Indian Health Service mentioned earlier. The sensitivity of the EDB for Black beneficiaries, at 97.4 percent, and White beneficiaries, at 99.3 percent, are both very good.
Table 1. Accuracy and agreement between EDBRACE and SELFRACE
Race/ethnicity EDBRACE Accuracy and agreement measures for EDBRACE
SELFRACE Yes No Sensitivity Specificity
Positive predictive
value
Negative predictive
value KappaWhite Yes 667,573 4,420 99.3% 61.7% 91.7% 95.7% 0.71
No 60,794 97,941
Black Yes 57,867 1,515 97.4 98.8 86.3 99.8 0.91 No 9,209 762,137
Hispanic Yes 12,953 30,974 29.5 99.9 92.7 96.2 0.43 No 1,025 785,776
A/PI Yes 8,008 6,626 54.7 99.8 84.5 99.2 0.66 No 1,469 814,625
AI/AN Yes 1,194 2,150 35.7 99.9 59.9 99.7 0.45 No 799 826,585
Yes 478 27,158 1.7 98.8 4.9 96.7 0.01 Other/ Unknown No 9,357 793,735
Source: EDBRACE is from Medicare EDB from mid-2003 and SELFRACE is from Medicare CAHPS fee-for-service, managed care enrollee, and disenrollee surveys for 2000-2002.
On the other hand, the EDB does a very good job with not misclassifying non-Hispanic beneficiaries as Hispanic, non-A/PI as A/PI, non-Black as Black, and non-AI/AN as AI/AN. This is shown by the specificity reaching 98.8 percent or higher for those groups. In other words, if the EDB has a beneficiary coded as not being Hispanic, Black, A/PI, or AI/AN, then chances are very good the EDB is correct. However, while the specificity for Hispanic, A/PI, AI/AN, and Black beneficiaries is very high, it is considerably lower for those who are White. As shown by the specificity of 61.7 percent, 60,794 of the 158,735 non-Whites are mistakenly identified as White in the EDB. This finding supports the notion that there are many beneficiaries classified as White in the EDB who actually belong in one of the other race/ethnicity categories.
The overall level of agreement, reflected in the Kappa coefficients, is moderate for Hispanic and AI/AN beneficiaries—0.43 and 0.45, respectively. These Kappa coefficients reflect the historical legacy of using methods with little sensitivity for racial and ethnic differences to classify Medicare enrollees in the EDB. Much the same can be said about A/PIs despite a Kappa
13
(.66) that is in the substantial agreement range. We speculate that many Hispanic, A/PI, and AI/AN beneficiaries were coded as White by default because the appropriate racial/ethnic categories were not available in the EDB until relatively recently. The Kappa for White beneficiaries is also substantial (0.71), but not near perfect, undoubtedly reflecting the low specificity for this group.
3.1.2 Characteristics of the Misclassified Medicare Beneficiaries
We examined the beneficiaries who, according to the CAHPS race/ethnicity variable, SELFRACE, were misclassified in the EDB. Table 2 shows the number of beneficiaries in each racial/ethnic group who were misclassified as false negatives in the EDB race/ethnicity variable, EDBRACE, according to the SELFRACE variable for CAHPS survey respondents. The table also shows the percentage distribution of these misclassified beneficiaries according to the EDB racial/ethnic group into which they were incorrectly classified.
Table 2. Misclassification of race/ethnicity among Medicare beneficiaries: A comparison of
EDBRACE with SELFRACE
Percent misclassified by EDBRACE SELFRACE Race/ ethnicity
Number misclassified in the EDBa White Black Hispanic AI/AN A/PI Other Total
White 4,420 --- 27.4 9.7 7.6 16.1 39.3 100.0 Black 1,515 72.1 --- 3.8 1.5 2.1 20.5 100.0 Hispanic 30,974 89.7 4.8 --- 0.2 0.6 4.8 100.0 A/PI 6,626 14.0 2.9 0.6 0.4 --- 82.1 100.0 AI/AN 2,150 76.8 16.6 1.5 --- 0.3 4.9 100.0 Other/ Unknown 27,158 81.6 15.3 1.7 0.3 1.2 --- 100.0 2 or more 9,812 73.4 18.5 0.2 2.9 2.3 2.8 100.0
aTwo beneficiaries in the CAHPS sample were coded as missing on EDBRACE. In addition, it should be noted that the race/ethnicity of 748,073 of the total 830,728 Medicare beneficiaries was correctly classified.
Source: EDBRACE is from Medicare EDB from mid-2003 and SELFRACE is from Medicare CAHPS fee-for-service, managed care enrollee, and disenrollee surveys for 2000-2002.
This analysis of those beneficiaries whose race/ethnicity was misclassified (the false negatives) according to the gold standard shows some striking patterns:
1. The vast majority of those misclassified beneficiaries whose race is actually Hispanic (89.7 percent), AI/AN (76.8 percent), Black (72.1 percent), and Non-Hispanic Other or Unknown (81.6 percent) were coded as White in the EDB.
2. However, the vast majority (82.1 percent) of those misclassified beneficiaries whose race is A/PI were coded as Other/Unknown in the EDB.
3. Misclassified White beneficiaries are spread across the race/ethnicity groups but they were mostly misclassified according to the EDB as Black (27.4 percent) and Other/Unknown (39.3 percent).
14
4. More than one-third (37.5 percent) of the 82,655 misclassified beneficiaries from the EDB were Hispanic.
3.1.3 Development of a Surname Algorithm to More Correctly Identify Race/Ethnicity: Comparison of the Algorithm’s Race/Ethnicity Designation to the Self-Reported Race/Ethnicity in CAHPS
For this approach, we used two different surname lists—one for Hispanic and one for A/PI surnames—as the basis for developing a surname-based algorithm to estimate a new race/ethnicity variable, NAMERACE, for the CAHPS survey respondents. After using the surname algorithms to create the NAMERACE variable, we compared the results to the CAHPS survey respondent’s self-reported race/ethnicity variable, SELFRACE. As with previous comparisons, SELFRACE was the gold standard for the comparisons.
To create the surname algorithm that produced NAMERACE we obtained a Spanish surname list (see Appendix A) based on the 1990 Census (Word and Perkins, 1996). We also obtained an A/PI surname list (see Appendix B) based on the 2000 Census (Falkenstein and Word, 2002). The Hispanic and A/PI surname lists use similar techniques that allowed us a measure of flexibility in determining whether a given surname should be classified as Hispanic or A/PI. In the Hispanic surname list, Word and Perkins assign a percentage to each name representing the proportion of times a household headed by an individual with an Hispanic surname was indeed in an Hispanic household as identified by the Census. Falkenstein and Word had similar percentages for the A/PI surname list. This feature allowed us to try different percentages as inclusion thresholds, compare the agreement statistics, and thus identify the optimal level of race/ethnicity designation for our particular needs on each list.
Using SAS and the surname lists as “data,” we developed algorithms to create a race/ethnicity variable (NAMERACE) that started at a fairly liberal inclusion level of 50 percent, but then continued to get more restrictive until it reached the 90 percent inclusion level. Our analysis of the results suggested that inclusion levels below 70 percent classified too many non-Hispanic beneficiaries as Hispanic, and non-A/PI as A/PI beneficiaries. For this reason, we limited subsequent analysis to inclusion levels of 70 through 90 percent. Each surname algorithm was analyzed in this way, thereby making it possible for the algorithm for Hispanic and A/PI names to function optimally at different inclusion levels.
The Hispanic and A/PI results are presented in Tables 3 and 4, respectively. They show that we did not meet our target of a sensitivity of 75 percent and a Kappa coefficient of more than 0.80 with either surname algorithm. The best Hispanic results had Kappa coefficients between 0.69 and 0.74 and sensitivity ranged between 59.7 and 69.8 percent. Specificity and negative predictive values remained very high for all levels of the Hispanic algorithm. However, positive predictive values ranged from 82.5 to 84.4 percent.
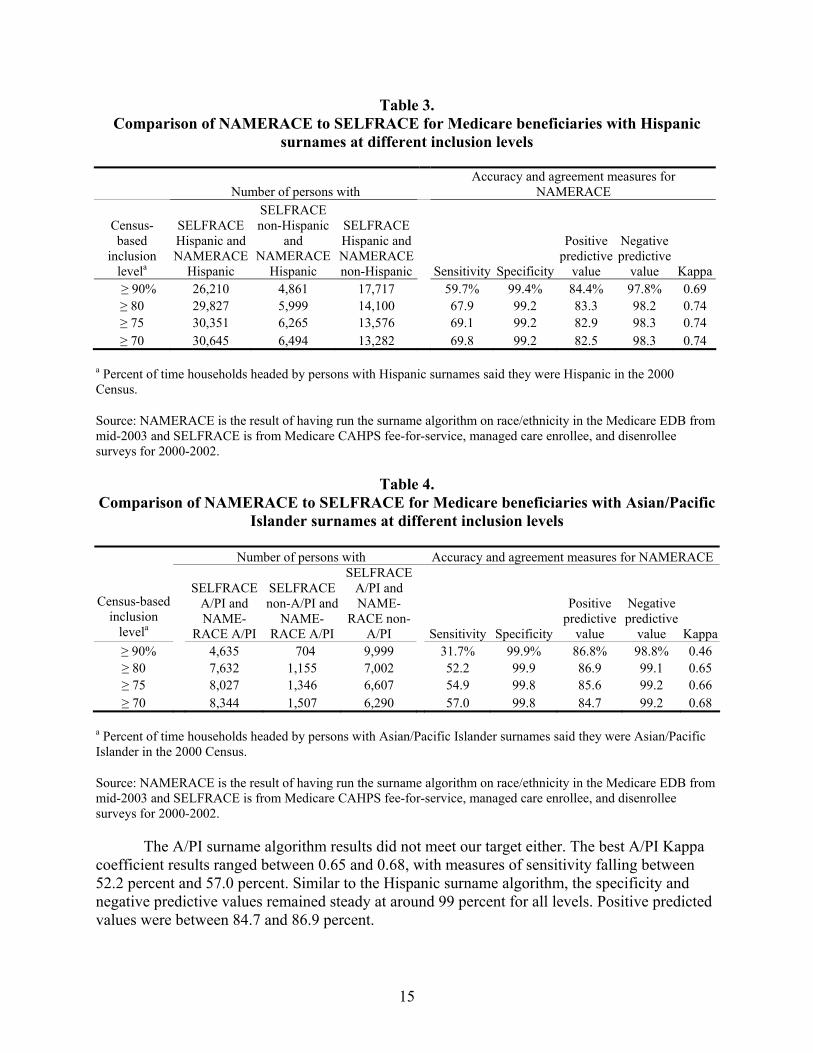
15
Table 3. Comparison of NAMERACE to SELFRACE for Medicare beneficiaries with Hispanic
surnames at different inclusion levels
Number of persons with Accuracy and agreement measures for
NAMERACE
Census-based
inclusion levela
SELFRACE Hispanic and NAMERACE
Hispanic
SELFRACE non-Hispanic
and NAMERACE
Hispanic
SELFRACE Hispanic and NAMERACE non-Hispanic Sensitivity Specificity
Positive predictive
value
Negative predictive
value Kappa ≥ 90% 26,210 4,861 17,717 59.7% 99.4% 84.4% 97.8% 0.69 ≥ 80 29,827 5,999 14,100 67.9 99.2 83.3 98.2 0.74 ≥ 75 30,351 6,265 13,576 69.1 99.2 82.9 98.3 0.74 ≥ 70 30,645 6,494 13,282 69.8 99.2 82.5 98.3 0.74
a Percent of time households headed by persons with Hispanic surnames said they were Hispanic in the 2000 Census.
Source: NAMERACE is the result of having run the surname algorithm on race/ethnicity in the Medicare EDB from mid-2003 and SELFRACE is from Medicare CAHPS fee-for-service, managed care enrollee, and disenrollee surveys for 2000-2002.
Table 4. Comparison of NAMERACE to SELFRACE for Medicare beneficiaries with Asian/Pacific
Islander surnames at different inclusion levels
Number of persons with Accuracy and agreement measures for NAMERACE
Census-based inclusion
levela
SELFRACE A/PI and NAME-
RACE A/PI
SELFRACE non-A/PI and
NAME-RACE A/PI
SELFRACE A/PI and NAME-
RACE non-A/PI Sensitivity Specificity
Positive predictive
value
Negative predictive
value Kappa ≥ 90% 4,635 704 9,999 31.7% 99.9% 86.8% 98.8% 0.46 ≥ 80 7,632 1,155 7,002 52.2 99.9 86.9 99.1 0.65 ≥ 75 8,027 1,346 6,607 54.9 99.8 85.6 99.2 0.66 ≥ 70 8,344 1,507 6,290 57.0 99.8 84.7 99.2 0.68
a Percent of time households headed by persons with Asian/Pacific Islander surnames said they were Asian/Pacific Islander in the 2000 Census.
Source: NAMERACE is the result of having run the surname algorithm on race/ethnicity in the Medicare EDB from mid-2003 and SELFRACE is from Medicare CAHPS fee-for-service, managed care enrollee, and disenrollee surveys for 2000-2002.
The A/PI surname algorithm results did not meet our target either. The best A/PI Kappa coefficient results ranged between 0.65 and 0.68, with measures of sensitivity falling between 52.2 percent and 57.0 percent. Similar to the Hispanic surname algorithm, the specificity and negative predictive values remained steady at around 99 percent for all levels. Positive predicted values were between 84.7 and 86.9 percent.
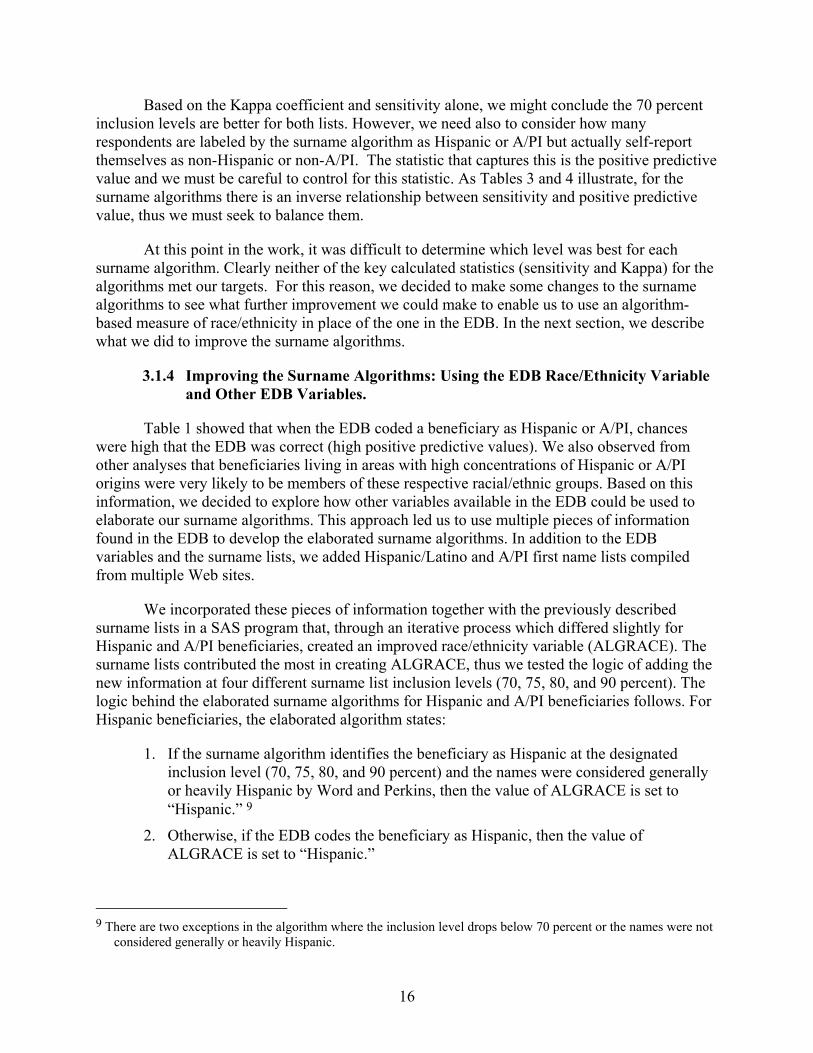
16
Based on the Kappa coefficient and sensitivity alone, we might conclude the 70 percent inclusion levels are better for both lists. However, we need also to consider how many respondents are labeled by the surname algorithm as Hispanic or A/PI but actually self-report themselves as non-Hispanic or non-A/PI. The statistic that captures this is the positive predictive value and we must be careful to control for this statistic. As Tables 3 and 4 illustrate, for the surname algorithms there is an inverse relationship between sensitivity and positive predictive value, thus we must seek to balance them.
At this point in the work, it was difficult to determine which level was best for each surname algorithm. Clearly neither of the key calculated statistics (sensitivity and Kappa) for the algorithms met our targets. For this reason, we decided to make some changes to the surname algorithms to see what further improvement we could make to enable us to use an algorithm-based measure of race/ethnicity in place of the one in the EDB. In the next section, we describe what we did to improve the surname algorithms.
3.1.4 Improving the Surname Algorithms: Using the EDB Race/Ethnicity Variable and Other EDB Variables.
Table 1 showed that when the EDB coded a beneficiary as Hispanic or A/PI, chances were high that the EDB was correct (high positive predictive values). We also observed from other analyses that beneficiaries living in areas with high concentrations of Hispanic or A/PI origins were very likely to be members of these respective racial/ethnic groups. Based on this information, we decided to explore how other variables available in the EDB could be used to elaborate our surname algorithms. This approach led us to use multiple pieces of information found in the EDB to develop the elaborated surname algorithms. In addition to the EDB variables and the surname lists, we added Hispanic/Latino and A/PI first name lists compiled from multiple Web sites.
We incorporated these pieces of information together with the previously described surname lists in a SAS program that, through an iterative process which differed slightly for Hispanic and A/PI beneficiaries, created an improved race/ethnicity variable (ALGRACE). The surname lists contributed the most in creating ALGRACE, thus we tested the logic of adding the new information at four different surname list inclusion levels (70, 75, 80, and 90 percent). The logic behind the elaborated surname algorithms for Hispanic and A/PI beneficiaries follows. For Hispanic beneficiaries, the elaborated algorithm states:
1. If the surname algorithm identifies the beneficiary as Hispanic at the designated inclusion level (70, 75, 80, and 90 percent) and the names were considered generally or heavily Hispanic by Word and Perkins, then the value of ALGRACE is set to “Hispanic.” 9
2. Otherwise, if the EDB codes the beneficiary as Hispanic, then the value of ALGRACE is set to “Hispanic.”
9 There are two exceptions in the algorithm where the inclusion level drops below 70 percent or the names were not
considered generally or heavily Hispanic.
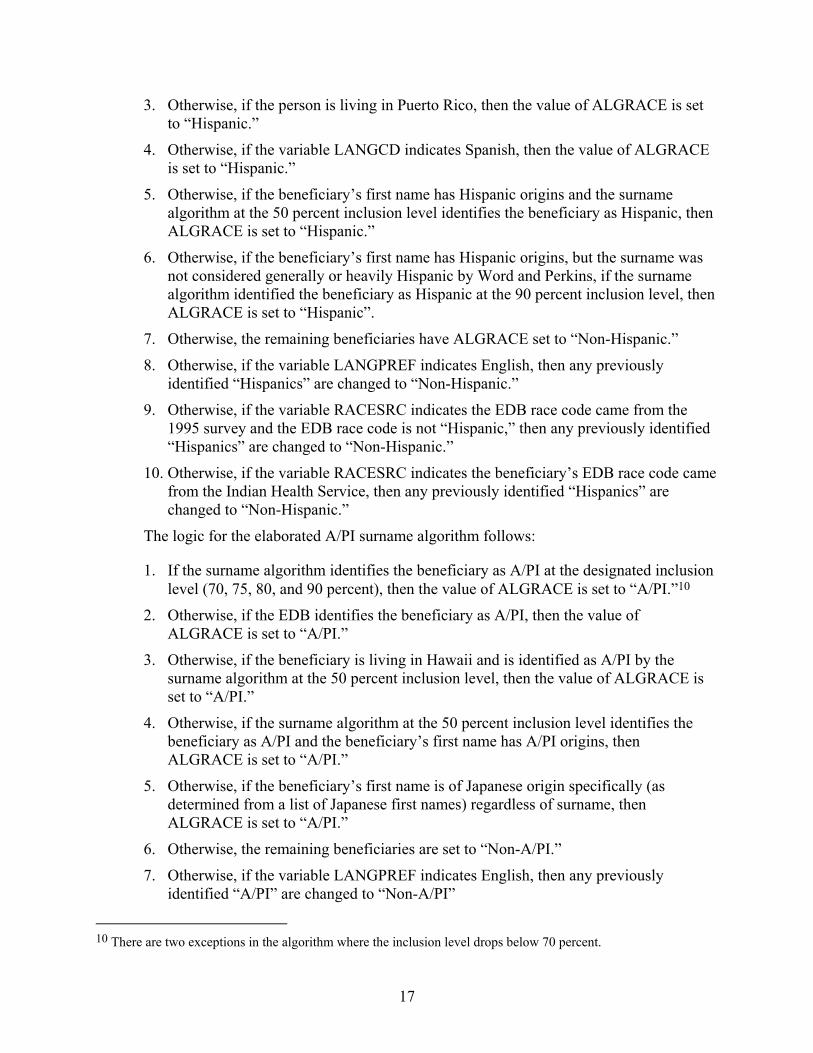
17
3. Otherwise, if the person is living in Puerto Rico, then the value of ALGRACE is set to “Hispanic.”
4. Otherwise, if the variable LANGCD indicates Spanish, then the value of ALGRACE is set to “Hispanic.”
5. Otherwise, if the beneficiary’s first name has Hispanic origins and the surname algorithm at the 50 percent inclusion level identifies the beneficiary as Hispanic, then ALGRACE is set to “Hispanic.”
6. Otherwise, if the beneficiary’s first name has Hispanic origins, but the surname was not considered generally or heavily Hispanic by Word and Perkins, if the surname algorithm identified the beneficiary as Hispanic at the 90 percent inclusion level, then ALGRACE is set to “Hispanic”.
7. Otherwise, the remaining beneficiaries have ALGRACE set to “Non-Hispanic.”
8. Otherwise, if the variable LANGPREF indicates English, then any previously identified “Hispanics” are changed to “Non-Hispanic.”
9. Otherwise, if the variable RACESRC indicates the EDB race code came from the 1995 survey and the EDB race code is not “Hispanic,” then any previously identified “Hispanics” are changed to “Non-Hispanic.”
10. Otherwise, if the variable RACESRC indicates the beneficiary’s EDB race code came from the Indian Health Service, then any previously identified “Hispanics” are changed to “Non-Hispanic.”
The logic for the elaborated A/PI surname algorithm follows:
1. If the surname algorithm identifies the beneficiary as A/PI at the designated inclusion level (70, 75, 80, and 90 percent), then the value of ALGRACE is set to “A/PI.”10
2. Otherwise, if the EDB identifies the beneficiary as A/PI, then the value of ALGRACE is set to “A/PI.”
3. Otherwise, if the beneficiary is living in Hawaii and is identified as A/PI by the surname algorithm at the 50 percent inclusion level, then the value of ALGRACE is set to “A/PI.”
4. Otherwise, if the surname algorithm at the 50 percent inclusion level identifies the beneficiary as A/PI and the beneficiary’s first name has A/PI origins, then ALGRACE is set to “A/PI.”
5. Otherwise, if the beneficiary’s first name is of Japanese origin specifically (as determined from a list of Japanese first names) regardless of surname, then ALGRACE is set to “A/PI.”
6. Otherwise, the remaining beneficiaries are set to “Non-A/PI.”
7. Otherwise, if the variable LANGPREF indicates English, then any previously identified “A/PI” are changed to “Non-A/PI”
10 There are two exceptions in the algorithm where the inclusion level drops below 70 percent.
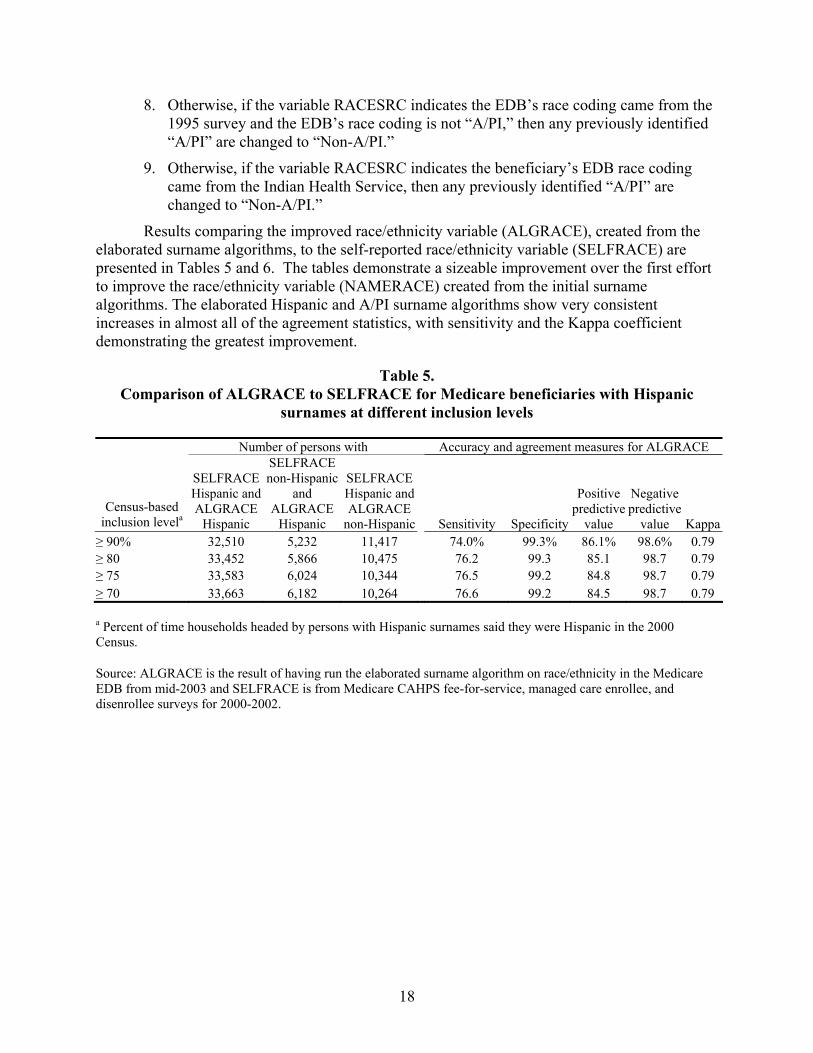
18
8. Otherwise, if the variable RACESRC indicates the EDB’s race coding came from the 1995 survey and the EDB’s race coding is not “A/PI,” then any previously identified “A/PI” are changed to “Non-A/PI.”
9. Otherwise, if the variable RACESRC indicates the beneficiary’s EDB race coding came from the Indian Health Service, then any previously identified “A/PI” are changed to “Non-A/PI.”
Results comparing the improved race/ethnicity variable (ALGRACE), created from the elaborated surname algorithms, to the self-reported race/ethnicity variable (SELFRACE) are presented in Tables 5 and 6. The tables demonstrate a sizeable improvement over the first effort to improve the race/ethnicity variable (NAMERACE) created from the initial surname algorithms. The elaborated Hispanic and A/PI surname algorithms show very consistent increases in almost all of the agreement statistics, with sensitivity and the Kappa coefficient demonstrating the greatest improvement.
Table 5. Comparison of ALGRACE to SELFRACE for Medicare beneficiaries with Hispanic
surnames at different inclusion levels
Number of persons with Accuracy and agreement measures for ALGRACE
Census-based inclusion levela
SELFRACE Hispanic and ALGRACE
Hispanic
SELFRACE non-Hispanic
and ALGRACE
Hispanic
SELFRACEHispanic and ALGRACE
non-Hispanic Sensitivity Specificity
Positive predictive
value
Negative predictive
value Kappa≥ 90% 32,510 5,232 11,417 74.0% 99.3% 86.1% 98.6% 0.79 ≥ 80 33,452 5,866 10,475 76.2 99.3 85.1 98.7 0.79 ≥ 75 33,583 6,024 10,344 76.5 99.2 84.8 98.7 0.79 ≥ 70 33,663 6,182 10,264 76.6 99.2 84.5 98.7 0.79
a Percent of time households headed by persons with Hispanic surnames said they were Hispanic in the 2000 Census.
Source: ALGRACE is the result of having run the elaborated surname algorithm on race/ethnicity in the Medicare EDB from mid-2003 and SELFRACE is from Medicare CAHPS fee-for-service, managed care enrollee, and disenrollee surveys for 2000-2002.
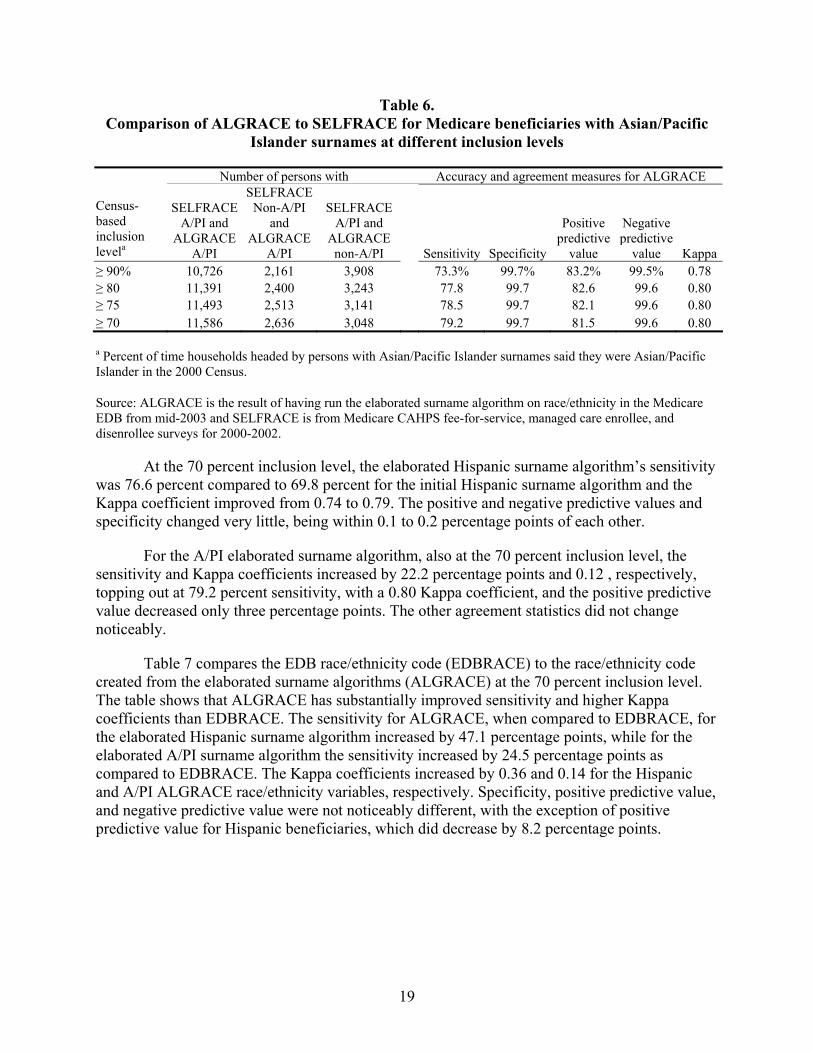
19
Table 6. Comparison of ALGRACE to SELFRACE for Medicare beneficiaries with Asian/Pacific
Islander surnames at different inclusion levels
Number of persons with Accuracy and agreement measures for ALGRACE
Census-based inclusion levela
SELFRACE A/PI and
ALGRACE A/PI
SELFRACE Non-A/PI
and ALGRACE
A/PI
SELFRACE A/PI and
ALGRACE non-A/PI Sensitivity Specificity
Positive predictive
value
Negative predictive
value Kappa≥ 90% 10,726 2,161 3,908 73.3% 99.7% 83.2% 99.5% 0.78 ≥ 80 11,391 2,400 3,243 77.8 99.7 82.6 99.6 0.80 ≥ 75 11,493 2,513 3,141 78.5 99.7 82.1 99.6 0.80 ≥ 70 11,586 2,636 3,048 79.2 99.7 81.5 99.6 0.80
a Percent of time households headed by persons with Asian/Pacific Islander surnames said they were Asian/Pacific Islander in the 2000 Census.
Source: ALGRACE is the result of having run the elaborated surname algorithm on race/ethnicity in the Medicare EDB from mid-2003 and SELFRACE is from Medicare CAHPS fee-for-service, managed care enrollee, and disenrollee surveys for 2000-2002.
At the 70 percent inclusion level, the elaborated Hispanic surname algorithm’s sensitivity was 76.6 percent compared to 69.8 percent for the initial Hispanic surname algorithm and the Kappa coefficient improved from 0.74 to 0.79. The positive and negative predictive values and specificity changed very little, being within 0.1 to 0.2 percentage points of each other.
For the A/PI elaborated surname algorithm, also at the 70 percent inclusion level, the sensitivity and Kappa coefficients increased by 22.2 percentage points and 0.12 , respectively, topping out at 79.2 percent sensitivity, with a 0.80 Kappa coefficient, and the positive predictive value decreased only three percentage points. The other agreement statistics did not change noticeably.
Table 7 compares the EDB race/ethnicity code (EDBRACE) to the race/ethnicity code created from the elaborated surname algorithms (ALGRACE) at the 70 percent inclusion level. The table shows that ALGRACE has substantially improved sensitivity and higher Kappa coefficients than EDBRACE. The sensitivity for ALGRACE, when compared to EDBRACE, for the elaborated Hispanic surname algorithm increased by 47.1 percentage points, while for the elaborated A/PI surname algorithm the sensitivity increased by 24.5 percentage points as compared to EDBRACE. The Kappa coefficients increased by 0.36 and 0.14 for the Hispanic and A/PI ALGRACE race/ethnicity variables, respectively. Specificity, positive predictive value, and negative predictive value were not noticeably different, with the exception of positive predictive value for Hispanic beneficiaries, which did decrease by 8.2 percentage points.
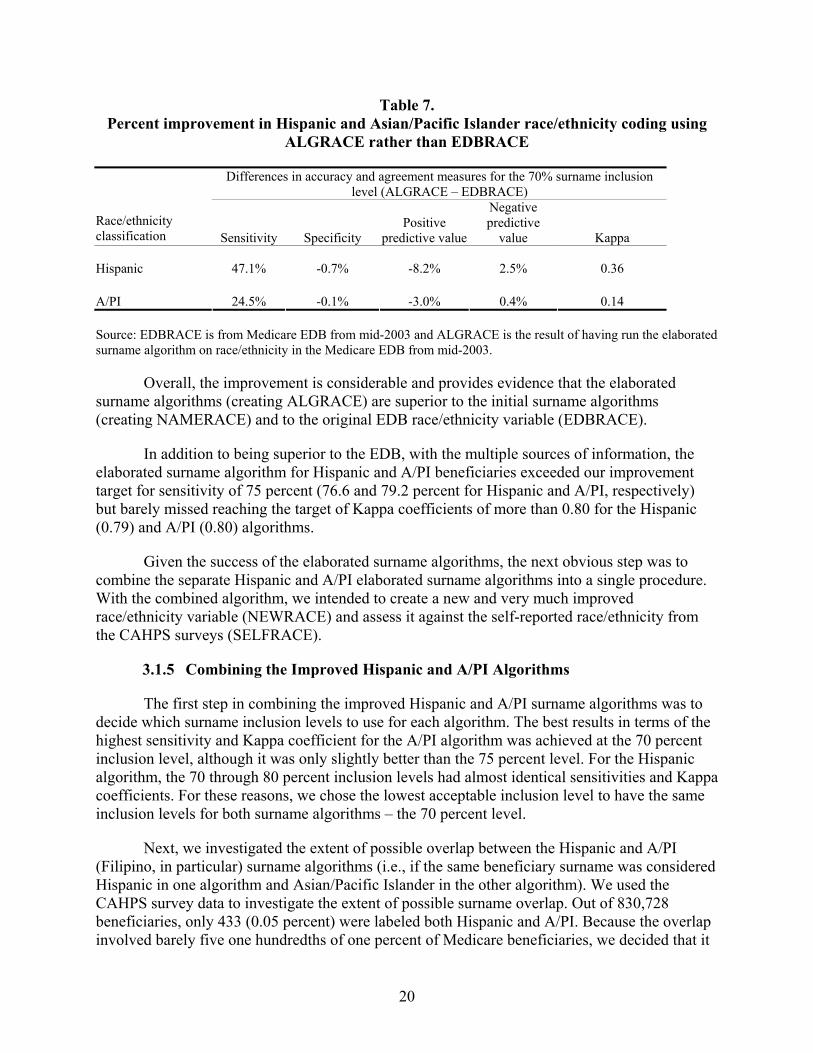
20
Table 7. Percent improvement in Hispanic and Asian/Pacific Islander race/ethnicity coding using
ALGRACE rather than EDBRACE
Differences in accuracy and agreement measures for the 70% surname inclusion level (ALGRACE – EDBRACE)
Race/ethnicity classification Sensitivity Specificity
Positive predictive value
Negative predictive
value Kappa
Hispanic 47.1% -0.7% -8.2% 2.5% 0.36
A/PI 24.5% -0.1% -3.0% 0.4% 0.14
Source: EDBRACE is from Medicare EDB from mid-2003 and ALGRACE is the result of having run the elaborated surname algorithm on race/ethnicity in the Medicare EDB from mid-2003.
Overall, the improvement is considerable and provides evidence that the elaborated surname algorithms (creating ALGRACE) are superior to the initial surname algorithms (creating NAMERACE) and to the original EDB race/ethnicity variable (EDBRACE).
In addition to being superior to the EDB, with the multiple sources of information, the elaborated surname algorithm for Hispanic and A/PI beneficiaries exceeded our improvement target for sensitivity of 75 percent (76.6 and 79.2 percent for Hispanic and A/PI, respectively) but barely missed reaching the target of Kappa coefficients of more than 0.80 for the Hispanic (0.79) and A/PI (0.80) algorithms.
Given the success of the elaborated surname algorithms, the next obvious step was to combine the separate Hispanic and A/PI elaborated surname algorithms into a single procedure. With the combined algorithm, we intended to create a new and very much improved race/ethnicity variable (NEWRACE) and assess it against the self-reported race/ethnicity from the CAHPS surveys (SELFRACE).
3.1.5 Combining the Improved Hispanic and A/PI Algorithms
The first step in combining the improved Hispanic and A/PI surname algorithms was to decide which surname inclusion levels to use for each algorithm. The best results in terms of the highest sensitivity and Kappa coefficient for the A/PI algorithm was achieved at the 70 percent inclusion level, although it was only slightly better than the 75 percent level. For the Hispanic algorithm, the 70 through 80 percent inclusion levels had almost identical sensitivities and Kappa coefficients. For these reasons, we chose the lowest acceptable inclusion level to have the same inclusion levels for both surname algorithms – the 70 percent level.
Next, we investigated the extent of possible overlap between the Hispanic and A/PI (Filipino, in particular) surname algorithms (i.e., if the same beneficiary surname was considered Hispanic in one algorithm and Asian/Pacific Islander in the other algorithm). We used the CAHPS survey data to investigate the extent of possible surname overlap. Out of 830,728 beneficiaries, only 433 (0.05 percent) were labeled both Hispanic and A/PI. Because the overlap involved barely five one hundredths of one percent of Medicare beneficiaries, we decided that it
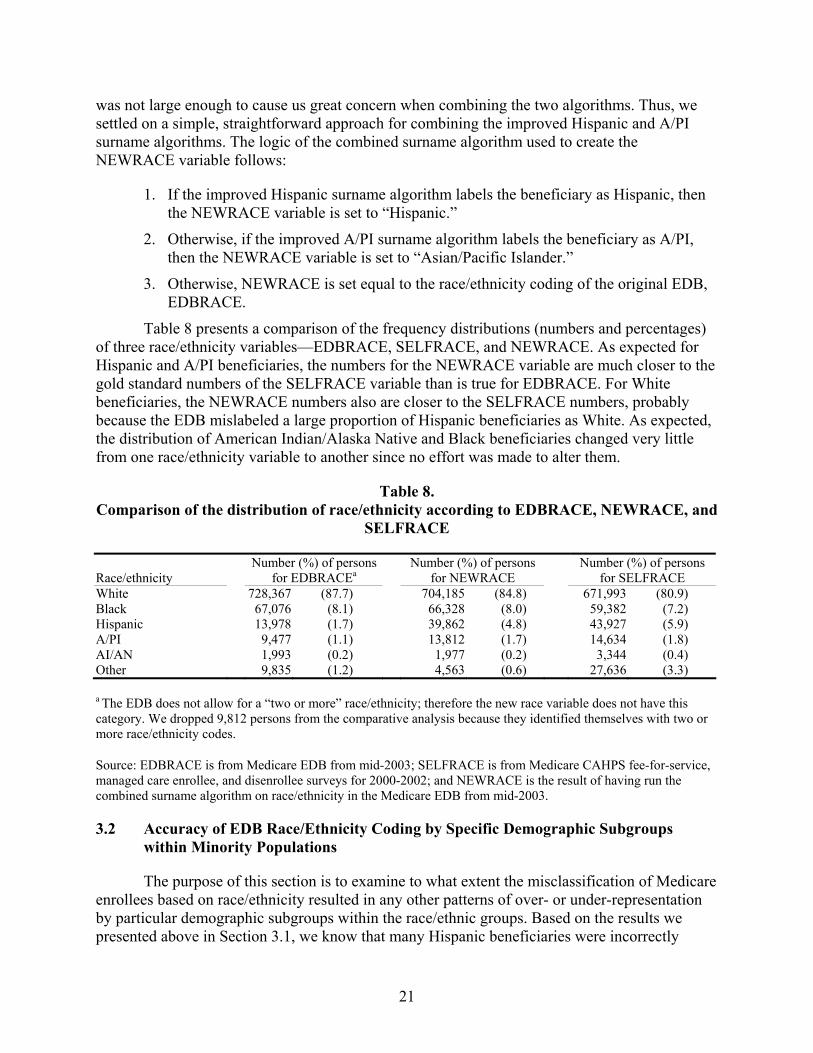
21
was not large enough to cause us great concern when combining the two algorithms. Thus, we settled on a simple, straightforward approach for combining the improved Hispanic and A/PI surname algorithms. The logic of the combined surname algorithm used to create the NEWRACE variable follows:
1. If the improved Hispanic surname algorithm labels the beneficiary as Hispanic, then the NEWRACE variable is set to “Hispanic.”
2. Otherwise, if the improved A/PI surname algorithm labels the beneficiary as A/PI, then the NEWRACE variable is set to “Asian/Pacific Islander.”
3. Otherwise, NEWRACE is set equal to the race/ethnicity coding of the original EDB, EDBRACE.
Table 8 presents a comparison of the frequency distributions (numbers and percentages) of three race/ethnicity variables—EDBRACE, SELFRACE, and NEWRACE. As expected for Hispanic and A/PI beneficiaries, the numbers for the NEWRACE variable are much closer to the gold standard numbers of the SELFRACE variable than is true for EDBRACE. For White beneficiaries, the NEWRACE numbers also are closer to the SELFRACE numbers, probably because the EDB mislabeled a large proportion of Hispanic beneficiaries as White. As expected, the distribution of American Indian/Alaska Native and Black beneficiaries changed very little from one race/ethnicity variable to another since no effort was made to alter them.
Table 8. Comparison of the distribution of race/ethnicity according to EDBRACE, NEWRACE, and
SELFRACE
Race/ethnicity Number (%) of persons
for EDBRACEa Number (%) of persons
for NEWRACE Number (%) of persons
for SELFRACE White 728,367 (87.7) 704,185 (84.8) 671,993 (80.9) Black 67,076 (8.1) 66,328 (8.0) 59,382 (7.2) Hispanic 13,978 (1.7) 39,862 (4.8) 43,927 (5.9) A/PI 9,477 (1.1) 13,812 (1.7) 14,634 (1.8) AI/AN 1,993 (0.2) 1,977 (0.2) 3,344 (0.4) Other 9,835 (1.2) 4,563 (0.6) 27,636 (3.3)
a The EDB does not allow for a “two or more” race/ethnicity; therefore the new race variable does not have this category. We dropped 9,812 persons from the comparative analysis because they identified themselves with two or more race/ethnicity codes.
Source: EDBRACE is from Medicare EDB from mid-2003; SELFRACE is from Medicare CAHPS fee-for-service, managed care enrollee, and disenrollee surveys for 2000-2002; and NEWRACE is the result of having run the combined surname algorithm on race/ethnicity in the Medicare EDB from mid-2003.
3.2 Accuracy of EDB Race/Ethnicity Coding by Specific Demographic Subgroups within Minority Populations
The purpose of this section is to examine to what extent the misclassification of Medicare enrollees based on race/ethnicity resulted in any other patterns of over- or under-representation by particular demographic subgroups within the race/ethnic groups. Based on the results we presented above in Section 3.1, we know that many Hispanic beneficiaries were incorrectly
22
classified as “Non-Hispanic White” in the EDB, and that many A/PI beneficiaries were incorrectly classified as “Non-Hispanic Other” in the EDB.
In this section, we address to what extent the rate of misclassification by race/ethnicity demonstrates any patterns across gender and age groups. In Table 9, the first three data columns each represent one of three variables indicating the race/ethnicity of Medicare enrollees: the original EDB race code (EDBRACE), the “improved” race code (NEWRACE), and self-reported race (SELFRACE) from the CAHPS surveys. The “EDBRACE” column of the table includes only those beneficiaries whose race in the EDB matched their self-reported race on the CAHPS surveys. Likewise, the “NEWRACE” column includes only those beneficiaries whose new race (i.e., race determined by the naming algorithm) matched their self-reported race. Each of the next three columns displays ratios that, taken together, indicate the degree to which we were able to improve the accuracy of race/ethnicity coding in the EDB by using the naming algorithm.
3.2.1 Under-representation in the EDB
The first ratio indicates the proportion of beneficiaries whose EDB race matched their self-reported race from the CAHPS data. As can be seen, both Hispanic and A/PI beneficiaries were under-represented, although the latter group was better represented relative to the former. Of all the respondents in the CAHPS surveys who identified themselves as Hispanic/Latino, only about 30 percent were identified as Hispanic/Latino in the EDB. Similarly, of all respondents in the CAHPS surveys who identified themselves as A/PI, only about 55 percent were identified as A/PI in the EDB.
Table 9 also shows the level of under-representation by gender and age. For both Hispanic and A/PI beneficiaries (the only groups our algorithms seek to improve), females are less well-represented than males, although the differences are small. For each gender group within each racial/ethnic group, the ratio of EDB race to self-reported race is broken down further by age (under 65 versus 65 and older), with the 65 and older category broken down again into three groupings. As shown in the table, among the beneficiaries age 65 and older, the youngest age group (65 to 74) is the least well-represented, followed by the highest age group (85+), then the middle group (75 to 84). This pattern is true for both gender groups, and for both Hispanic and A/PI beneficiaries.
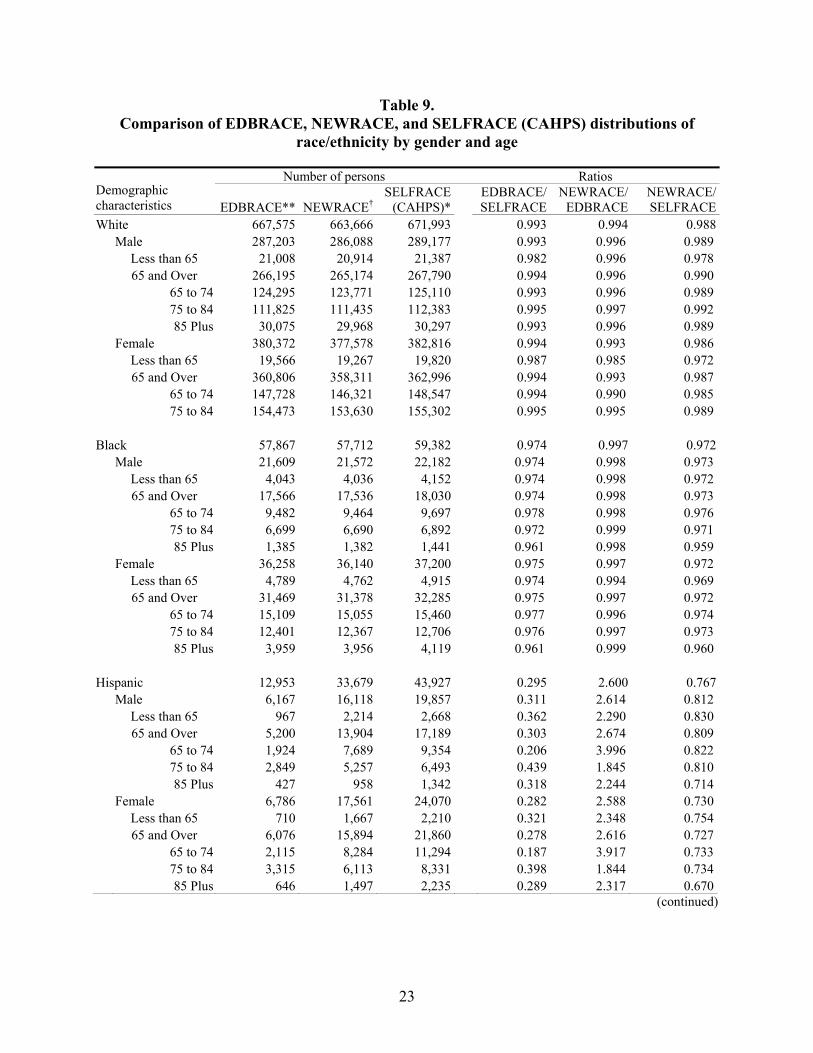
23
Table 9. Comparison of EDBRACE, NEWRACE, and SELFRACE (CAHPS) distributions of
race/ethnicity by gender and age
Number of persons Ratios Demographic characteristics EDBRACE** NEWRACE†
SELFRACE (CAHPS)*
EDBRACE/ SELFRACE
NEWRACE/ EDBRACE
NEWRACE/ SELFRACE
White 667,575 663,666 671,993 0.993 0.994 0.988 Male 287,203 286,088 289,177 0.993 0.996 0.989 Less than 65 21,008 20,914 21,387 0.982 0.996 0.978 65 and Over 266,195 265,174 267,790 0.994 0.996 0.990 65 to 74 124,295 123,771 125,110 0.993 0.996 0.989 75 to 84 111,825 111,435 112,383 0.995 0.997 0.992 85 Plus 30,075 29,968 30,297 0.993 0.996 0.989 Female 380,372 377,578 382,816 0.994 0.993 0.986 Less than 65 19,566 19,267 19,820 0.987 0.985 0.972 65 and Over 360,806 358,311 362,996 0.994 0.993 0.987 65 to 74 147,728 146,321 148,547 0.994 0.990 0.985 75 to 84 154,473 153,630 155,302 0.995 0.995 0.989 Black 57,867 57,712 59,382 0.974 0.997 0.972 Male 21,609 21,572 22,182 0.974 0.998 0.973 Less than 65 4,043 4,036 4,152 0.974 0.998 0.972 65 and Over 17,566 17,536 18,030 0.974 0.998 0.973 65 to 74 9,482 9,464 9,697 0.978 0.998 0.976 75 to 84 6,699 6,690 6,892 0.972 0.999 0.971 85 Plus 1,385 1,382 1,441 0.961 0.998 0.959 Female 36,258 36,140 37,200 0.975 0.997 0.972 Less than 65 4,789 4,762 4,915 0.974 0.994 0.969 65 and Over 31,469 31,378 32,285 0.975 0.997 0.972 65 to 74 15,109 15,055 15,460 0.977 0.996 0.974 75 to 84 12,401 12,367 12,706 0.976 0.997 0.973 85 Plus 3,959 3,956 4,119 0.961 0.999 0.960 Hispanic 12,953 33,679 43,927 0.295 2.600 0.767 Male 6,167 16,118 19,857 0.311 2.614 0.812 Less than 65 967 2,214 2,668 0.362 2.290 0.830 65 and Over 5,200 13,904 17,189 0.303 2.674 0.809 65 to 74 1,924 7,689 9,354 0.206 3.996 0.822 75 to 84 2,849 5,257 6,493 0.439 1.845 0.810 85 Plus 427 958 1,342 0.318 2.244 0.714 Female 6,786 17,561 24,070 0.282 2.588 0.730 Less than 65 710 1,667 2,210 0.321 2.348 0.754 65 and Over 6,076 15,894 21,860 0.278 2.616 0.727 65 to 74 2,115 8,284 11,294 0.187 3.917 0.733 75 to 84 3,315 6,113 8,331 0.398 1.844 0.734 85 Plus 646 1,497 2,235 0.289 2.317 0.670
(continued)
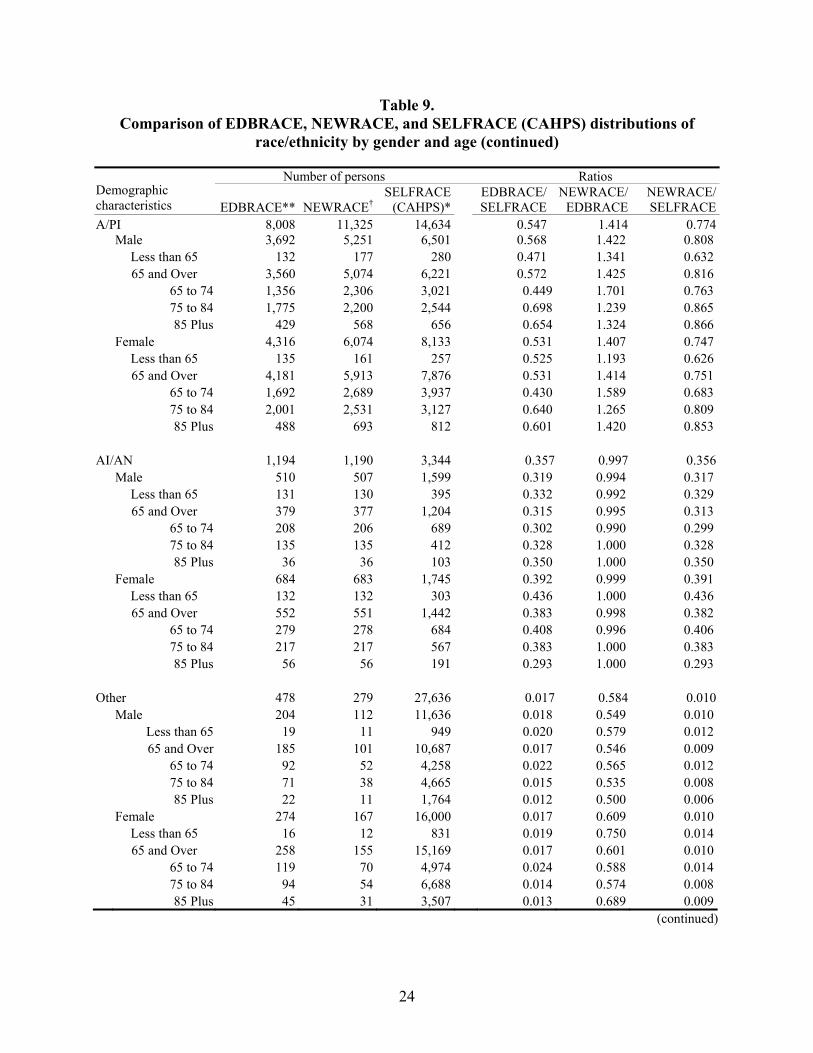
24
Table 9. Comparison of EDBRACE, NEWRACE, and SELFRACE (CAHPS) distributions of
race/ethnicity by gender and age (continued)
Number of persons Ratios Demographic characteristics EDBRACE** NEWRACE†
SELFRACE (CAHPS)*
EDBRACE/ SELFRACE
NEWRACE/ EDBRACE
NEWRACE/ SELFRACE
A/PI 8,008 11,325 14,634 0.547 1.414 0.774 Male 3,692 5,251 6,501 0.568 1.422 0.808 Less than 65 132 177 280 0.471 1.341 0.632 65 and Over 3,560 5,074 6,221 0.572 1.425 0.816 65 to 74 1,356 2,306 3,021 0.449 1.701 0.763 75 to 84 1,775 2,200 2,544 0.698 1.239 0.865 85 Plus 429 568 656 0.654 1.324 0.866 Female 4,316 6,074 8,133 0.531 1.407 0.747 Less than 65 135 161 257 0.525 1.193 0.626 65 and Over 4,181 5,913 7,876 0.531 1.414 0.751 65 to 74 1,692 2,689 3,937 0.430 1.589 0.683 75 to 84 2,001 2,531 3,127 0.640 1.265 0.809 85 Plus 488 693 812 0.601 1.420 0.853 AI/AN 1,194 1,190 3,344 0.357 0.997 0.356 Male 510 507 1,599 0.319 0.994 0.317 Less than 65 131 130 395 0.332 0.992 0.329 65 and Over 379 377 1,204 0.315 0.995 0.313 65 to 74 208 206 689 0.302 0.990 0.299 75 to 84 135 135 412 0.328 1.000 0.328 85 Plus 36 36 103 0.350 1.000 0.350 Female 684 683 1,745 0.392 0.999 0.391 Less than 65 132 132 303 0.436 1.000 0.436 65 and Over 552 551 1,442 0.383 0.998 0.382 65 to 74 279 278 684 0.408 0.996 0.406 75 to 84 217 217 567 0.383 1.000 0.383 85 Plus 56 56 191 0.293 1.000 0.293 Other 478 279 27,636 0.017 0.584 0.010 Male 204 112 11,636 0.018 0.549 0.010 Less than 65 19 11 949 0.020 0.579 0.012 65 and Over 185 101 10,687 0.017 0.546 0.009 65 to 74 92 52 4,258 0.022 0.565 0.012 75 to 84 71 38 4,665 0.015 0.535 0.008 85 Plus 22 11 1,764 0.012 0.500 0.006 Female 274 167 16,000 0.017 0.609 0.010 Less than 65 16 12 831 0.019 0.750 0.014 65 and Over 258 155 15,169 0.017 0.601 0.010 65 to 74 119 70 4,974 0.024 0.588 0.014 75 to 84 94 54 6,688 0.014 0.574 0.008 85 Plus 45 31 3,507 0.013 0.689 0.009
(continued)
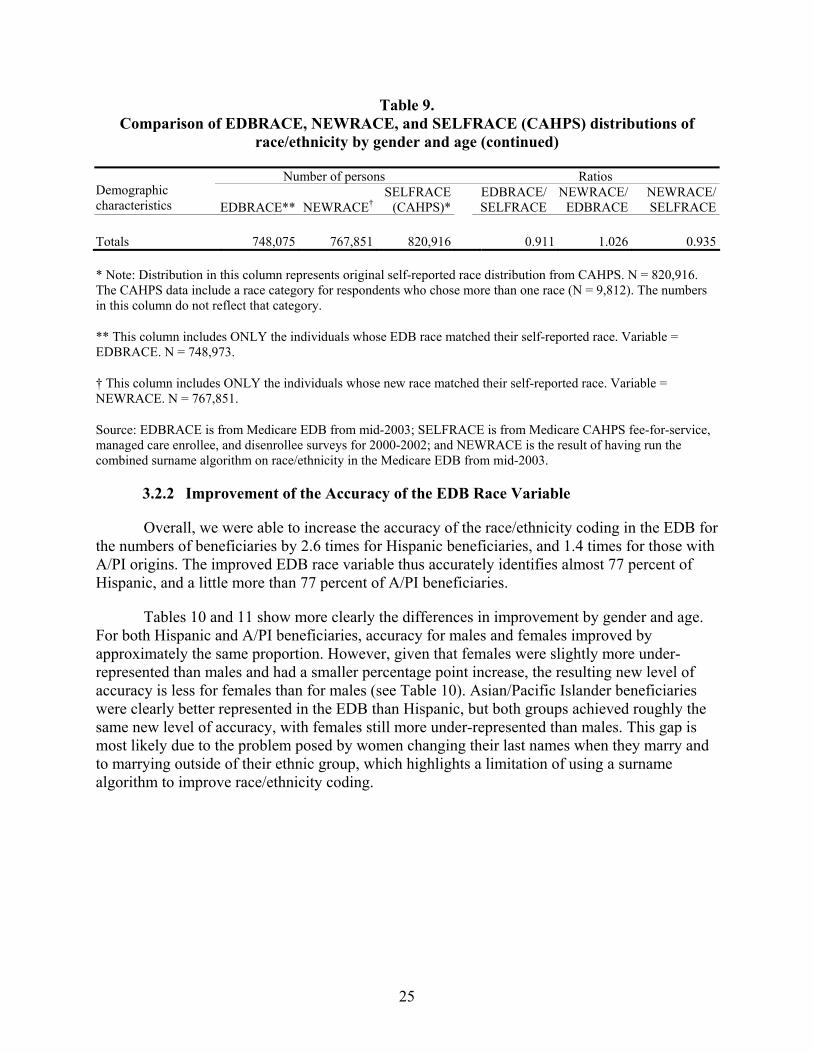
25
Table 9. Comparison of EDBRACE, NEWRACE, and SELFRACE (CAHPS) distributions of
race/ethnicity by gender and age (continued)
Number of persons Ratios Demographic characteristics EDBRACE** NEWRACE†
SELFRACE (CAHPS)*
EDBRACE/ SELFRACE
NEWRACE/ EDBRACE
NEWRACE/ SELFRACE
Totals 748,075 767,851 820,916 0.911 1.026 0.935
* Note: Distribution in this column represents original self-reported race distribution from CAHPS. N = 820,916. The CAHPS data include a race category for respondents who chose more than one race (N = 9,812). The numbers in this column do not reflect that category.
** This column includes ONLY the individuals whose EDB race matched their self-reported race. Variable = EDBRACE. N = 748,973.
† This column includes ONLY the individuals whose new race matched their self-reported race. Variable = NEWRACE. N = 767,851.
Source: EDBRACE is from Medicare EDB from mid-2003; SELFRACE is from Medicare CAHPS fee-for-service, managed care enrollee, and disenrollee surveys for 2000-2002; and NEWRACE is the result of having run the combined surname algorithm on race/ethnicity in the Medicare EDB from mid-2003.
3.2.2 Improvement of the Accuracy of the EDB Race Variable
Overall, we were able to increase the accuracy of the race/ethnicity coding in the EDB for the numbers of beneficiaries by 2.6 times for Hispanic beneficiaries, and 1.4 times for those with A/PI origins. The improved EDB race variable thus accurately identifies almost 77 percent of Hispanic, and a little more than 77 percent of A/PI beneficiaries.
Tables 10 and 11 show more clearly the differences in improvement by gender and age. For both Hispanic and A/PI beneficiaries, accuracy for males and females improved by approximately the same proportion. However, given that females were slightly more under-represented than males and had a smaller percentage point increase, the resulting new level of accuracy is less for females than for males (see Table 10). Asian/Pacific Islander beneficiaries were clearly better represented in the EDB than Hispanic, but both groups achieved roughly the same new level of accuracy, with females still more under-represented than males. This gap is most likely due to the problem posed by women changing their last names when they marry and to marrying outside of their ethnic group, which highlights a limitation of using a surname algorithm to improve race/ethnicity coding.
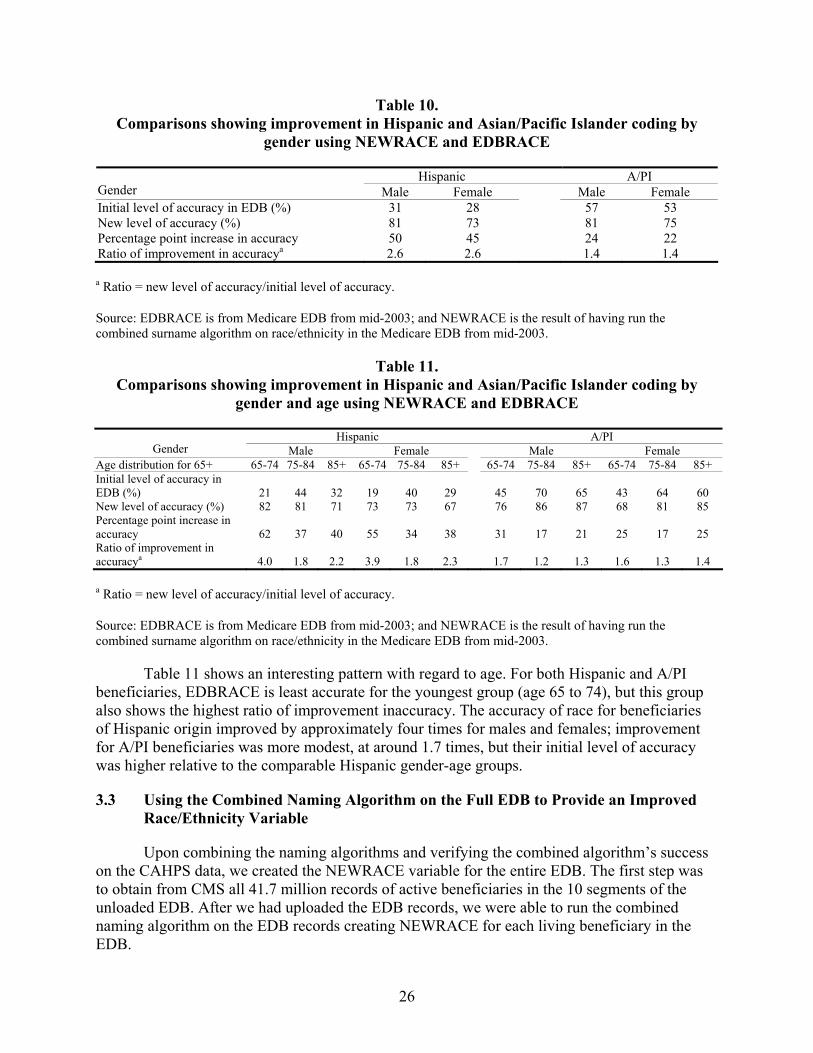
26
Table 10. Comparisons showing improvement in Hispanic and Asian/Pacific Islander coding by
gender using NEWRACE and EDBRACE
Hispanic A/PI Gender Male Female Male Female Initial level of accuracy in EDB (%) 31 28 57 53 New level of accuracy (%) 81 73 81 75 Percentage point increase in accuracy 50 45 24 22 Ratio of improvement in accuracya 2.6 2.6 1.4 1.4
a Ratio = new level of accuracy/initial level of accuracy.
Source: EDBRACE is from Medicare EDB from mid-2003; and NEWRACE is the result of having run the combined surname algorithm on race/ethnicity in the Medicare EDB from mid-2003.
Table 11. Comparisons showing improvement in Hispanic and Asian/Pacific Islander coding by
gender and age using NEWRACE and EDBRACE
Hispanic A/PI Gender Male Female Male Female
Age distribution for 65+ 65-74 75-84 85+ 65-74 75-84 85+ 65-74 75-84 85+ 65-74 75-84 85+ Initial level of accuracy in EDB (%) 21 44 32 19 40 29 45 70 65 43 64 60 New level of accuracy (%) 82 81 71 73 73 67 76 86 87 68 81 85 Percentage point increase in accuracy 62 37 40 55 34 38 31 17 21 25 17 25 Ratio of improvement in accuracya 4.0 1.8 2.2 3.9 1.8 2.3 1.7 1.2 1.3 1.6 1.3 1.4
a Ratio = new level of accuracy/initial level of accuracy.
Source: EDBRACE is from Medicare EDB from mid-2003; and NEWRACE is the result of having run the combined surname algorithm on race/ethnicity in the Medicare EDB from mid-2003.
Table 11 shows an interesting pattern with regard to age. For both Hispanic and A/PI beneficiaries, EDBRACE is least accurate for the youngest group (age 65 to 74), but this group also shows the highest ratio of improvement inaccuracy. The accuracy of race for beneficiaries of Hispanic origin improved by approximately four times for males and females; improvement for A/PI beneficiaries was more modest, at around 1.7 times, but their initial level of accuracy was higher relative to the comparable Hispanic gender-age groups.
3.3 Using the Combined Naming Algorithm on the Full EDB to Provide an Improved Race/Ethnicity Variable
Upon combining the naming algorithms and verifying the combined algorithm’s success on the CAHPS data, we created the NEWRACE variable for the entire EDB. The first step was to obtain from CMS all 41.7 million records of active beneficiaries in the 10 segments of the unloaded EDB. After we had uploaded the EDB records, we were able to run the combined naming algorithm on the EDB records creating NEWRACE for each living beneficiary in the EDB.
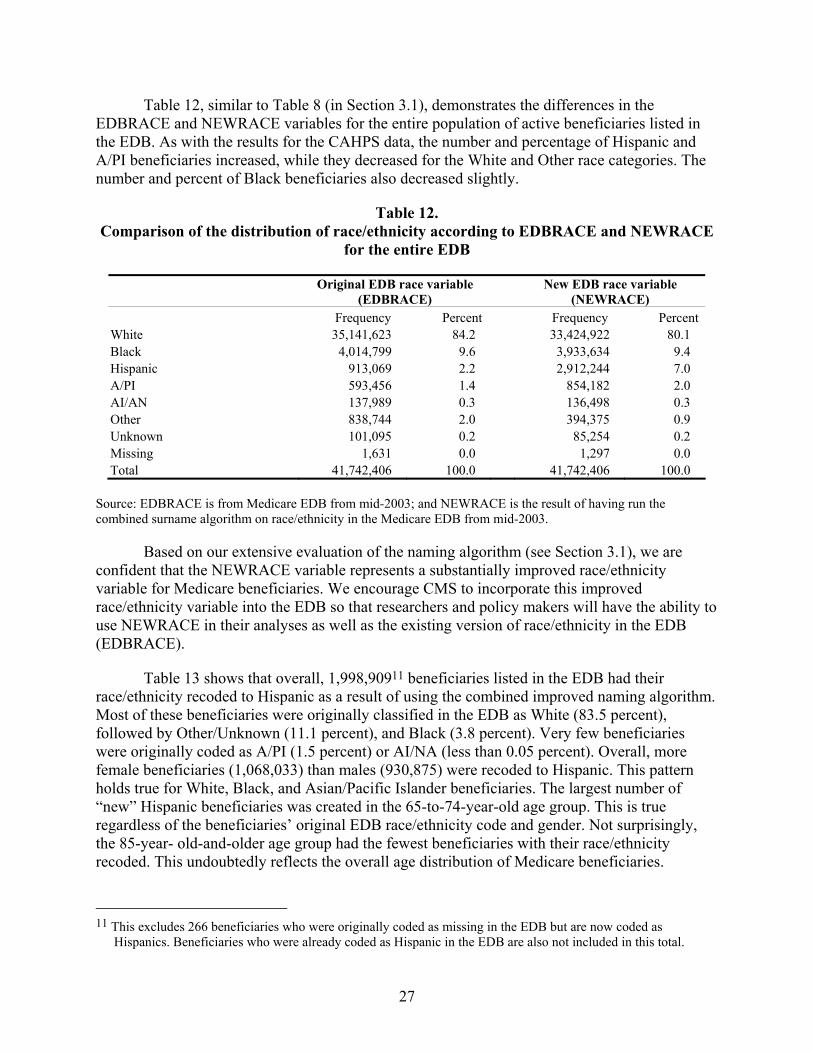
27
Table 12, similar to Table 8 (in Section 3.1), demonstrates the differences in the EDBRACE and NEWRACE variables for the entire population of active beneficiaries listed in the EDB. As with the results for the CAHPS data, the number and percentage of Hispanic and A/PI beneficiaries increased, while they decreased for the White and Other race categories. The number and percent of Black beneficiaries also decreased slightly.
Table 12. Comparison of the distribution of race/ethnicity according to EDBRACE and NEWRACE
for the entire EDB
Original EDB race variable
(EDBRACE) New EDB race variable
(NEWRACE) Frequency Percent Frequency Percent White 35,141,623 84.2 33,424,922 80.1 Black 4,014,799 9.6 3,933,634 9.4 Hispanic 913,069 2.2 2,912,244 7.0 A/PI 593,456 1.4 854,182 2.0 AI/AN 137,989 0.3 136,498 0.3 Other 838,744 2.0 394,375 0.9 Unknown 101,095 0.2 85,254 0.2 Missing 1,631 0.0 1,297 0.0 Total 41,742,406 100.0 41,742,406 100.0
Source: EDBRACE is from Medicare EDB from mid-2003; and NEWRACE is the result of having run the combined surname algorithm on race/ethnicity in the Medicare EDB from mid-2003.
Based on our extensive evaluation of the naming algorithm (see Section 3.1), we are confident that the NEWRACE variable represents a substantially improved race/ethnicity variable for Medicare beneficiaries. We encourage CMS to incorporate this improved race/ethnicity variable into the EDB so that researchers and policy makers will have the ability to use NEWRACE in their analyses as well as the existing version of race/ethnicity in the EDB (EDBRACE).
Table 13 shows that overall, 1,998,90911 beneficiaries listed in the EDB had their race/ethnicity recoded to Hispanic as a result of using the combined improved naming algorithm. Most of these beneficiaries were originally classified in the EDB as White (83.5 percent), followed by Other/Unknown (11.1 percent), and Black (3.8 percent). Very few beneficiaries were originally coded as A/PI (1.5 percent) or AI/NA (less than 0.05 percent). Overall, more female beneficiaries (1,068,033) than males (930,875) were recoded to Hispanic. This pattern holds true for White, Black, and Asian/Pacific Islander beneficiaries. The largest number of “new” Hispanic beneficiaries was created in the 65-to-74-year-old age group. This is true regardless of the beneficiaries’ original EDB race/ethnicity code and gender. Not surprisingly, the 85-year- old-and-older age group had the fewest beneficiaries with their race/ethnicity recoded. This undoubtedly reflects the overall age distribution of Medicare beneficiaries.
11 This excludes 266 beneficiaries who were originally coded as missing in the EDB but are now coded as
Hispanics. Beneficiaries who were already coded as Hispanic in the EDB are also not included in this total.
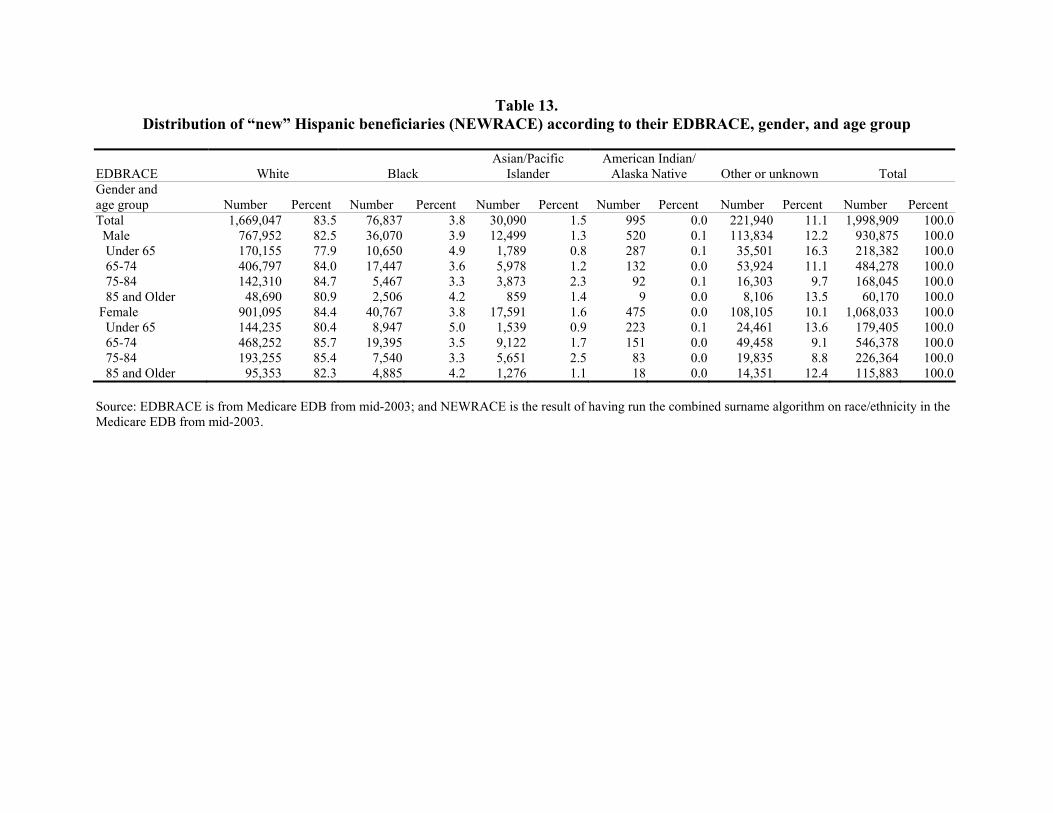
Table 13. Distribution of “new” Hispanic beneficiaries (NEWRACE) according to their EDBRACE, gender, and age group
EDBRACE White Black Asian/Pacific
Islander American Indian/
Alaska Native Other or unknown Total Gender and age group Number Percent Number Percent Number Percent Number Percent Number Percent Number Percent Total 1,669,047 83.5 76,837 3.8 30,090 1.5 995 0.0 221,940 11.1 1,998,909 100.0 Male 767,952 82.5 36,070 3.9 12,499 1.3 520 0.1 113,834 12.2 930,875 100.0 Under 65 170,155 77.9 10,650 4.9 1,789 0.8 287 0.1 35,501 16.3 218,382 100.0 65-74 406,797 84.0 17,447 3.6 5,978 1.2 132 0.0 53,924 11.1 484,278 100.0 75-84 142,310 84.7 5,467 3.3 3,873 2.3 92 0.1 16,303 9.7 168,045 100.0 85 and Older 48,690 80.9 2,506 4.2 859 1.4 9 0.0 8,106 13.5 60,170 100.0 Female 901,095 84.4 40,767 3.8 17,591 1.6 475 0.0 108,105 10.1 1,068,033 100.0 Under 65 144,235 80.4 8,947 5.0 1,539 0.9 223 0.1 24,461 13.6 179,405 100.0 65-74 468,252 85.7 19,395 3.5 9,122 1.7 151 0.0 49,458 9.1 546,378 100.0 75-84 193,255 85.4 7,540 3.3 5,651 2.5 83 0.0 19,835 8.8 226,364 100.0 85 and Older 95,353 82.3 4,885 4.2 1,276 1.1 18 0.0 14,351 12.4 115,883 100.0
Source: EDBRACE is from Medicare EDB from mid-2003; and NEWRACE is the result of having run the combined surname algorithm on race/ethnicity in the Medicare EDB from mid-2003.
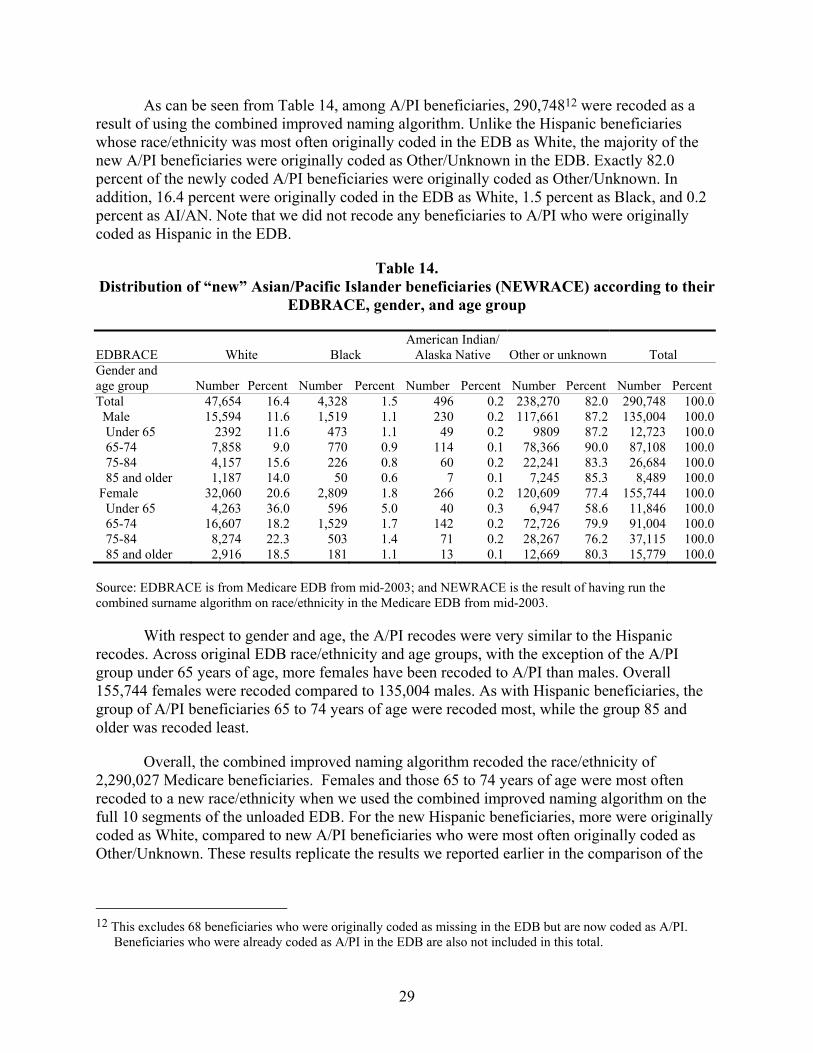
29
As can be seen from Table 14, among A/PI beneficiaries, 290,74812 were recoded as a result of using the combined improved naming algorithm. Unlike the Hispanic beneficiaries whose race/ethnicity was most often originally coded in the EDB as White, the majority of the new A/PI beneficiaries were originally coded as Other/Unknown in the EDB. Exactly 82.0 percent of the newly coded A/PI beneficiaries were originally coded as Other/Unknown. In addition, 16.4 percent were originally coded in the EDB as White, 1.5 percent as Black, and 0.2 percent as AI/AN. Note that we did not recode any beneficiaries to A/PI who were originally coded as Hispanic in the EDB.
Table 14. Distribution of “new” Asian/Pacific Islander beneficiaries (NEWRACE) according to their
EDBRACE, gender, and age group
EDBRACE White Black American Indian/
Alaska Native Other or unknown Total Gender and age group Number Percent Number Percent Number Percent Number Percent Number PercentTotal 47,654 16.4 4,328 1.5 496 0.2 238,270 82.0 290,748 100.0 Male 15,594 11.6 1,519 1.1 230 0.2 117,661 87.2 135,004 100.0 Under 65 2392 11.6 473 1.1 49 0.2 9809 87.2 12,723 100.0 65-74 7,858 9.0 770 0.9 114 0.1 78,366 90.0 87,108 100.0 75-84 4,157 15.6 226 0.8 60 0.2 22,241 83.3 26,684 100.0 85 and older 1,187 14.0 50 0.6 7 0.1 7,245 85.3 8,489 100.0 Female 32,060 20.6 2,809 1.8 266 0.2 120,609 77.4 155,744 100.0 Under 65 4,263 36.0 596 5.0 40 0.3 6,947 58.6 11,846 100.0 65-74 16,607 18.2 1,529 1.7 142 0.2 72,726 79.9 91,004 100.0 75-84 8,274 22.3 503 1.4 71 0.2 28,267 76.2 37,115 100.0 85 and older 2,916 18.5 181 1.1 13 0.1 12,669 80.3 15,779 100.0
Source: EDBRACE is from Medicare EDB from mid-2003; and NEWRACE is the result of having run the combined surname algorithm on race/ethnicity in the Medicare EDB from mid-2003.
With respect to gender and age, the A/PI recodes were very similar to the Hispanic recodes. Across original EDB race/ethnicity and age groups, with the exception of the A/PI group under 65 years of age, more females have been recoded to A/PI than males. Overall 155,744 females were recoded compared to 135,004 males. As with Hispanic beneficiaries, the group of A/PI beneficiaries 65 to 74 years of age were recoded most, while the group 85 and older was recoded least.
Overall, the combined improved naming algorithm recoded the race/ethnicity of 2,290,027 Medicare beneficiaries. Females and those 65 to 74 years of age were most often recoded to a new race/ethnicity when we used the combined improved naming algorithm on the full 10 segments of the unloaded EDB. For the new Hispanic beneficiaries, more were originally coded as White, compared to new A/PI beneficiaries who were most often originally coded as Other/Unknown. These results replicate the results we reported earlier in the comparison of the
12 This excludes 68 beneficiaries who were originally coded as missing in the EDB but are now coded as A/PI.
Beneficiaries who were already coded as A/PI in the EDB are also not included in this total.

30
EDB (EDBRACE), the improved naming algorithm (ALGRACE), and the self-reported race/ethnicity for the CAHPS sample (SELFRACE).
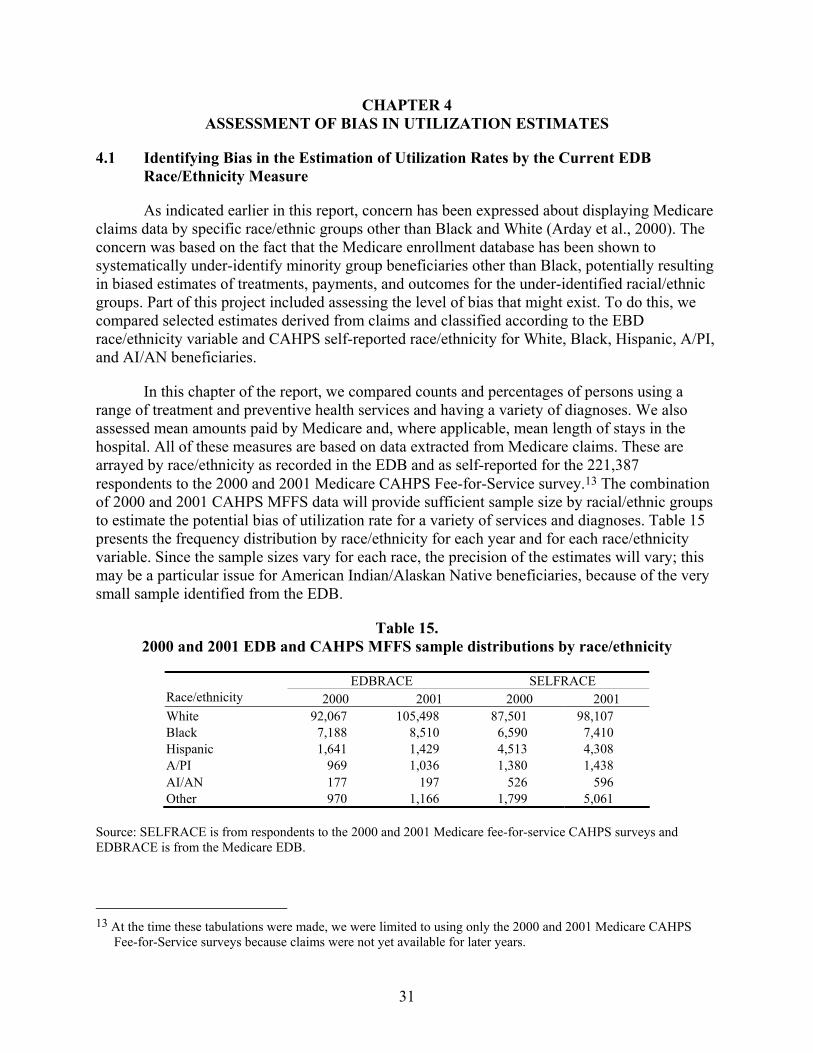
31
CHAPTER 4 ASSESSMENT OF BIAS IN UTILIZATION ESTIMATES
4.1 Identifying Bias in the Estimation of Utilization Rates by the Current EDB Race/Ethnicity Measure
As indicated earlier in this report, concern has been expressed about displaying Medicare claims data by specific race/ethnic groups other than Black and White (Arday et al., 2000). The concern was based on the fact that the Medicare enrollment database has been shown to systematically under-identify minority group beneficiaries other than Black, potentially resulting in biased estimates of treatments, payments, and outcomes for the under-identified racial/ethnic groups. Part of this project included assessing the level of bias that might exist. To do this, we compared selected estimates derived from claims and classified according to the EBD race/ethnicity variable and CAHPS self-reported race/ethnicity for White, Black, Hispanic, A/PI, and AI/AN beneficiaries.
In this chapter of the report, we compared counts and percentages of persons using a range of treatment and preventive health services and having a variety of diagnoses. We also assessed mean amounts paid by Medicare and, where applicable, mean length of stays in the hospital. All of these measures are based on data extracted from Medicare claims. These are arrayed by race/ethnicity as recorded in the EDB and as self-reported for the 221,387 respondents to the 2000 and 2001 Medicare CAHPS Fee-for-Service survey.13 The combination of 2000 and 2001 CAHPS MFFS data will provide sufficient sample size by racial/ethnic groups to estimate the potential bias of utilization rate for a variety of services and diagnoses. Table 15 presents the frequency distribution by race/ethnicity for each year and for each race/ethnicity variable. Since the sample sizes vary for each race, the precision of the estimates will vary; this may be a particular issue for American Indian/Alaskan Native beneficiaries, because of the very small sample identified from the EDB.
Table 15. 2000 and 2001 EDB and CAHPS MFFS sample distributions by race/ethnicity
EDBRACE SELFRACE Race/ethnicity 2000 2001 2000 2001 White 92,067 105,498 87,501 98,107 Black 7,188 8,510 6,590 7,410 Hispanic 1,641 1,429 4,513 4,308 A/PI 969 1,036 1,380 1,438 AI/AN 177 197 526 596 Other 970 1,166 1,799 5,061
Source: SELFRACE is from respondents to the 2000 and 2001 Medicare fee-for-service CAHPS surveys and EDBRACE is from the Medicare EDB.
13 At the time these tabulations were made, we were limited to using only the 2000 and 2001 Medicare CAHPS
Fee-for-Service surveys because claims were not yet available for later years.
32
Note that the focus in this chapter is not on the values of the counts, percentages, or means themselves, but rather on the extent to which these numbers differ depending on whether the race/ethnicity code came from the EDB or was self-reported in the CAHPS survey. Our objective is to indicate for each racial/ethnic group whether the distribution of services used according to the EDB race/ethnicity variable overstates or understates the number and proportion of beneficiaries using the service, the average length of stay, and the average cost to Medicare of the service relative to the measures for CAHPS self-reported race/ethnicity. For our purposes, the CAHPS race/ethnicity represents the gold standard (true race/ethnicity).
To make it obvious when there is a difference in service utilization between the two sources of race/ethnicity, we computed ratios by dividing the count, percentage, or mean for a value based on the CAHPS race/ethnicity self-report by the equivalent count, percentage, or mean value based on the EDB race/ethnicity code. When the two values are exactly the same, the computed ratio of 1.00 and values very close to 1.00 indicate that classification using the two sources of race/ethnicity give the same or a very similar resultant value for a measure. As you would expect, this rarely ever occurs for the counts, but often occurs for the percentages and mean expenditures for some utilization measures and some racial/ethnic groups (Whites and Blacks particularly). If the ratio is greater than one, then the use of the self-reported race/ethnicity from the CAHPS surveys increases the count, percentage, or mean, and using the EDB race/ethnicity variable understates it. If the ratio is less than 1.00, then the use of the self-reported race from the CAHPS survey reduces the count, percentage, or mean and using the EDB race overstates it.
We have examined the differences in utilization by the source of the race/ethnicity code (either EDB or self-reported) for the same persons’ use of a variety of health care services. In particular, these include the following: (1) cancer screening services, (2) secondary preventive care services for persons with diabetes, (3) hospital or emergency department services for ambulatory care-sensitive conditions, (4) services of different types, and (5) hospital services for a variety of common chronic illness diagnoses. While we will discuss changes that occur on a racial/ethnic group basis for each of these, we will not address changes in the group identified as Other and Unreported, which result largely from missing data or multiple race codes in the CAHPS data.
Before assessing the bias resulting from the tabulation of health services utilization according to EDB race/ethnicity, we calculated a Diagnostic Cost Group Hierarchical Condition Category (DCG-HCC) risk score (Pope, Ellis, Ash, et al., 2000) for each of the 221,387 Medicare Fee-for-Service CAHPS sample respondents for 2000 and 2001. The DCG-HCC risk score is created from diagnoses associated with utilization of inpatient, outpatient, physician, and other clinically trained non-physician services during the previous 12 months along with demographic information. It is used to predict Medicare expenditures for the next 12 months. By dividing the expenditures associated with the past year’s diagnosis by the average expenditure for Medicare beneficiaries, a risk score is created in which 1.00 represents the average. Higher scores represent higher expenditures (presumably due to poorer health) while scores below 1.00 represent lower than average expenditures (and presumably better health). Because it is correlated with commonly used health status measures, the DCG-HCC has been used as an indicator of health status.
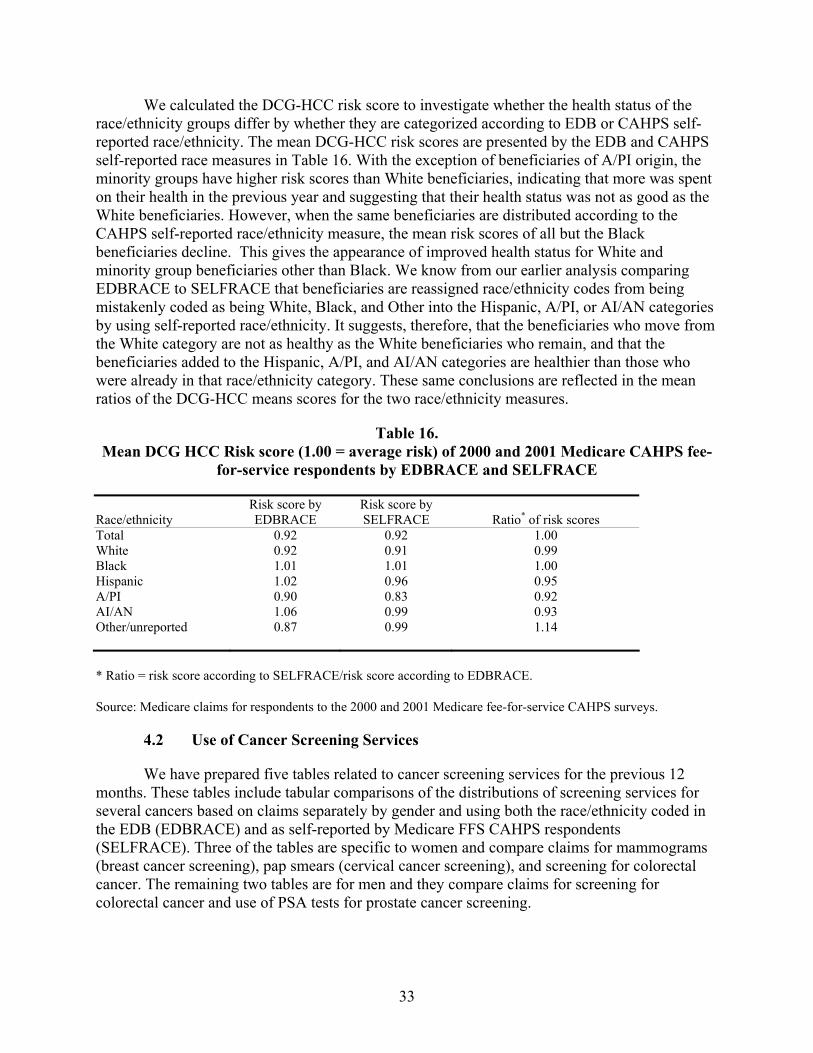
33
We calculated the DCG-HCC risk score to investigate whether the health status of the race/ethnicity groups differ by whether they are categorized according to EDB or CAHPS self-reported race/ethnicity. The mean DCG-HCC risk scores are presented by the EDB and CAHPS self-reported race measures in Table 16. With the exception of beneficiaries of A/PI origin, the minority groups have higher risk scores than White beneficiaries, indicating that more was spent on their health in the previous year and suggesting that their health status was not as good as the White beneficiaries. However, when the same beneficiaries are distributed according to the CAHPS self-reported race/ethnicity measure, the mean risk scores of all but the Black beneficiaries decline. This gives the appearance of improved health status for White and minority group beneficiaries other than Black. We know from our earlier analysis comparing EDBRACE to SELFRACE that beneficiaries are reassigned race/ethnicity codes from being mistakenly coded as being White, Black, and Other into the Hispanic, A/PI, or AI/AN categories by using self-reported race/ethnicity. It suggests, therefore, that the beneficiaries who move from the White category are not as healthy as the White beneficiaries who remain, and that the beneficiaries added to the Hispanic, A/PI, and AI/AN categories are healthier than those who were already in that race/ethnicity category. These same conclusions are reflected in the mean ratios of the DCG-HCC means scores for the two race/ethnicity measures.
Table 16. Mean DCG HCC Risk score (1.00 = average risk) of 2000 and 2001 Medicare CAHPS fee-
for-service respondents by EDBRACE and SELFRACE
Race/ethnicity Risk score by EDBRACE
Risk score by SELFRACE Ratio* of risk scores
Total 0.92 0.92 1.00 White 0.92 0.91 0.99 Black 1.01 1.01 1.00 Hispanic 1.02 0.96 0.95 A/PI 0.90 0.83 0.92 AI/AN 1.06 0.99 0.93 Other/unreported 0.87 0.99 1.14
* Ratio = risk score according to SELFRACE/risk score according to EDBRACE.
Source: Medicare claims for respondents to the 2000 and 2001 Medicare fee-for-service CAHPS surveys.
4.2 Use of Cancer Screening Services
We have prepared five tables related to cancer screening services for the previous 12 months. These tables include tabular comparisons of the distributions of screening services for several cancers based on claims separately by gender and using both the race/ethnicity coded in the EDB (EDBRACE) and as self-reported by Medicare FFS CAHPS respondents (SELFRACE). Three of the tables are specific to women and compare claims for mammograms (breast cancer screening), pap smears (cervical cancer screening), and screening for colorectal cancer. The remaining two tables are for men and they compare claims for screening for colorectal cancer and use of PSA tests for prostate cancer screening.
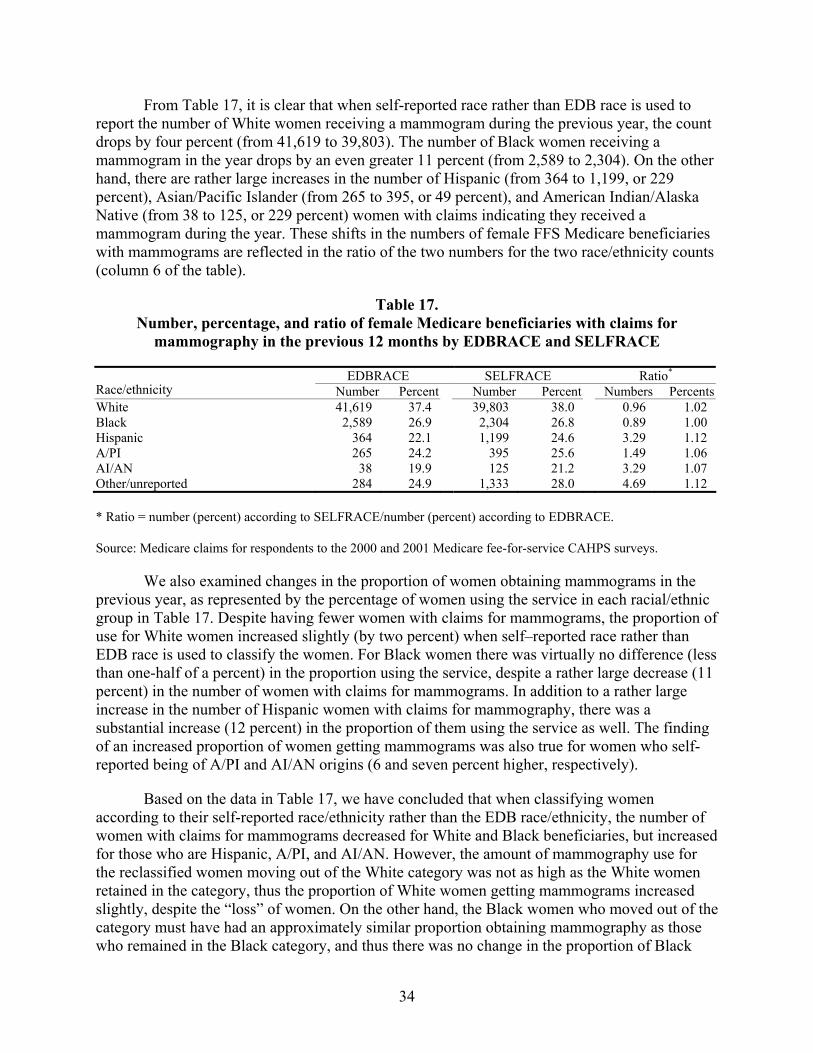
34
From Table 17, it is clear that when self-reported race rather than EDB race is used to report the number of White women receiving a mammogram during the previous year, the count drops by four percent (from 41,619 to 39,803). The number of Black women receiving a mammogram in the year drops by an even greater 11 percent (from 2,589 to 2,304). On the other hand, there are rather large increases in the number of Hispanic (from 364 to 1,199, or 229 percent), Asian/Pacific Islander (from 265 to 395, or 49 percent), and American Indian/Alaska Native (from 38 to 125, or 229 percent) women with claims indicating they received a mammogram during the year. These shifts in the numbers of female FFS Medicare beneficiaries with mammograms are reflected in the ratio of the two numbers for the two race/ethnicity counts (column 6 of the table).
Table 17. Number, percentage, and ratio of female Medicare beneficiaries with claims for
mammography in the previous 12 months by EDBRACE and SELFRACE
EDBRACE SELFRACE Ratio*
Race/ethnicity Number Percent Number Percent Numbers PercentsWhite 41,619 37.4 39,803 38.0 0.96 1.02 Black 2,589 26.9 2,304 26.8 0.89 1.00 Hispanic 364 22.1 1,199 24.6 3.29 1.12 A/PI 265 24.2 395 25.6 1.49 1.06 AI/AN 38 19.9 125 21.2 3.29 1.07 Other/unreported 284 24.9 1,333 28.0 4.69 1.12
* Ratio = number (percent) according to SELFRACE/number (percent) according to EDBRACE.
Source: Medicare claims for respondents to the 2000 and 2001 Medicare fee-for-service CAHPS surveys.
We also examined changes in the proportion of women obtaining mammograms in the previous year, as represented by the percentage of women using the service in each racial/ethnic group in Table 17. Despite having fewer women with claims for mammograms, the proportion of use for White women increased slightly (by two percent) when self–reported race rather than EDB race is used to classify the women. For Black women there was virtually no difference (less than one-half of a percent) in the proportion using the service, despite a rather large decrease (11 percent) in the number of women with claims for mammograms. In addition to a rather large increase in the number of Hispanic women with claims for mammography, there was a substantial increase (12 percent) in the proportion of them using the service as well. The finding of an increased proportion of women getting mammograms was also true for women who self-reported being of A/PI and AI/AN origins (6 and seven percent higher, respectively).
Based on the data in Table 17, we have concluded that when classifying women according to their self-reported race/ethnicity rather than the EDB race/ethnicity, the number of women with claims for mammograms decreased for White and Black beneficiaries, but increased for those who are Hispanic, A/PI, and AI/AN. However, the amount of mammography use for the reclassified women moving out of the White category was not as high as the White women retained in the category, thus the proportion of White women getting mammograms increased slightly, despite the “loss” of women. On the other hand, the Black women who moved out of the category must have had an approximately similar proportion obtaining mammography as those who remained in the Black category, and thus there was no change in the proportion of Black
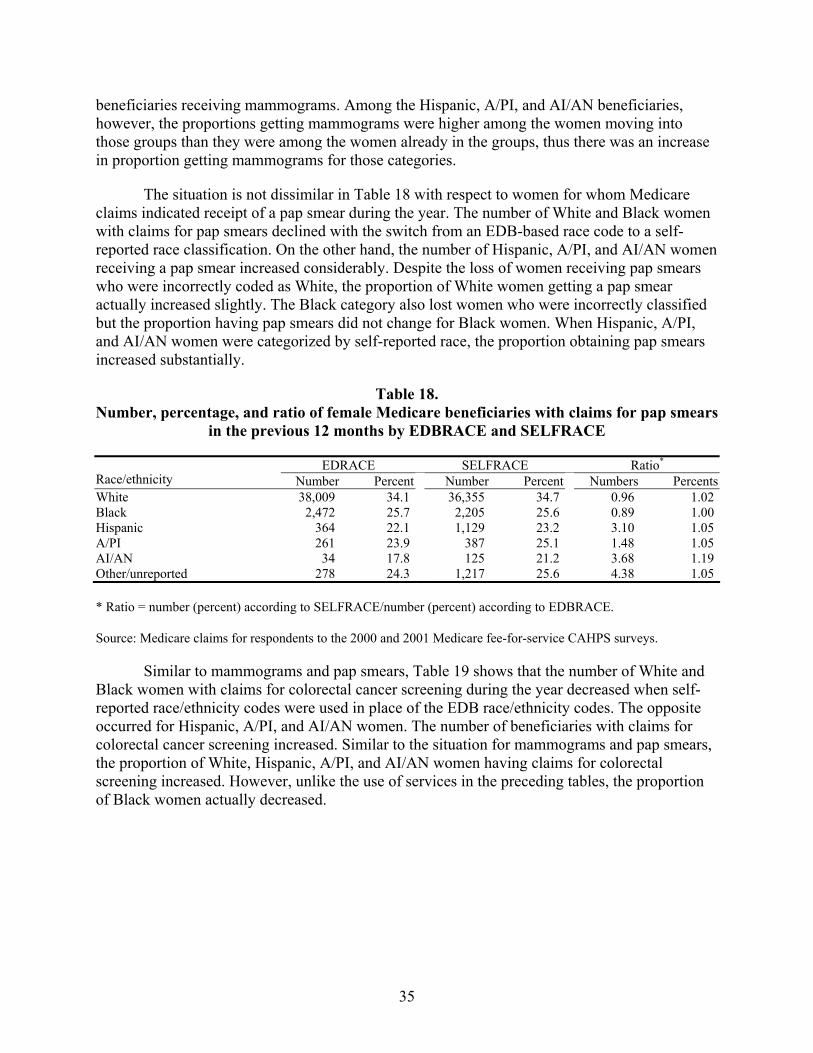
35
beneficiaries receiving mammograms. Among the Hispanic, A/PI, and AI/AN beneficiaries, however, the proportions getting mammograms were higher among the women moving into those groups than they were among the women already in the groups, thus there was an increase in proportion getting mammograms for those categories.
The situation is not dissimilar in Table 18 with respect to women for whom Medicare claims indicated receipt of a pap smear during the year. The number of White and Black women with claims for pap smears declined with the switch from an EDB-based race code to a self-reported race classification. On the other hand, the number of Hispanic, A/PI, and AI/AN women receiving a pap smear increased considerably. Despite the loss of women receiving pap smears who were incorrectly coded as White, the proportion of White women getting a pap smear actually increased slightly. The Black category also lost women who were incorrectly classified but the proportion having pap smears did not change for Black women. When Hispanic, A/PI, and AI/AN women were categorized by self-reported race, the proportion obtaining pap smears increased substantially.
Table 18. Number, percentage, and ratio of female Medicare beneficiaries with claims for pap smears
in the previous 12 months by EDBRACE and SELFRACE
EDRACE SELFRACE Ratio*
Race/ethnicity Number Percent Number Percent Numbers PercentsWhite 38,009 34.1 36,355 34.7 0.96 1.02Black 2,472 25.7 2,205 25.6 0.89 1.00Hispanic 364 22.1 1,129 23.2 3.10 1.05A/PI 261 23.9 387 25.1 1.48 1.05AI/AN 34 17.8 125 21.2 3.68 1.19Other/unreported 278 24.3 1,217 25.6 4.38 1.05
* Ratio = number (percent) according to SELFRACE/number (percent) according to EDBRACE.
Source: Medicare claims for respondents to the 2000 and 2001 Medicare fee-for-service CAHPS surveys.
Similar to mammograms and pap smears, Table 19 shows that the number of White and Black women with claims for colorectal cancer screening during the year decreased when self-reported race/ethnicity codes were used in place of the EDB race/ethnicity codes. The opposite occurred for Hispanic, A/PI, and AI/AN women. The number of beneficiaries with claims for colorectal cancer screening increased. Similar to the situation for mammograms and pap smears, the proportion of White, Hispanic, A/PI, and AI/AN women having claims for colorectal screening increased. However, unlike the use of services in the preceding tables, the proportion of Black women actually decreased.
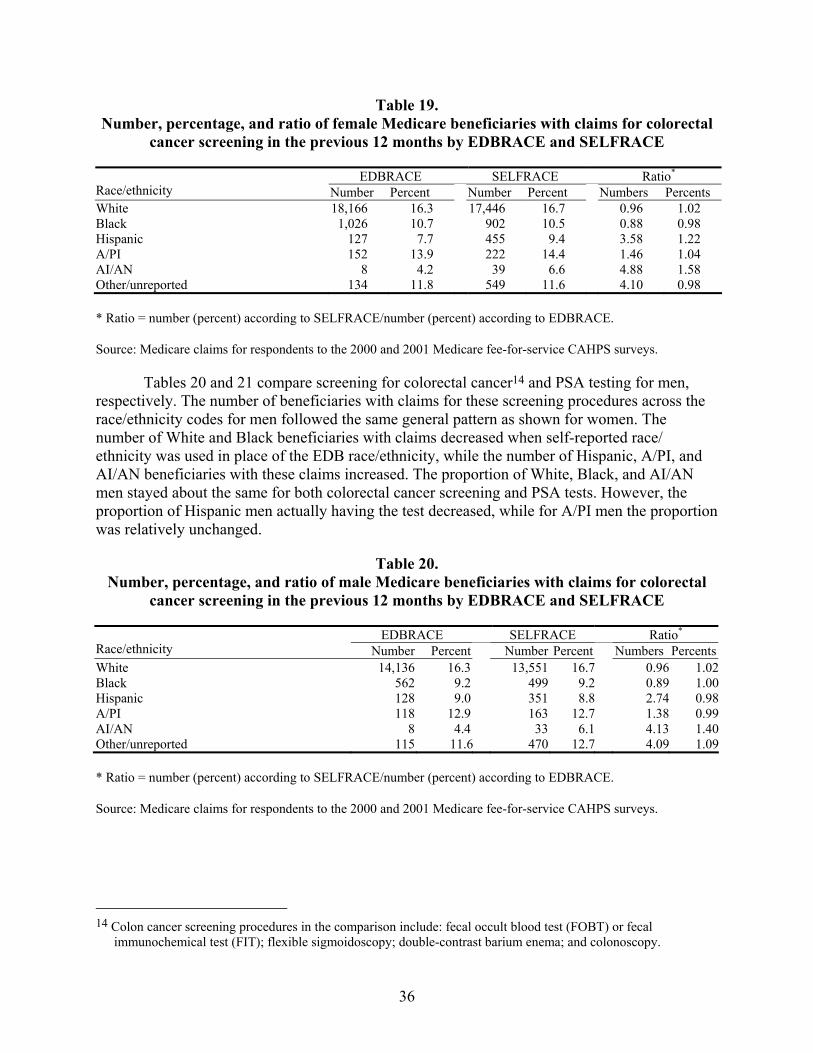
36
Table 19. Number, percentage, and ratio of female Medicare beneficiaries with claims for colorectal
cancer screening in the previous 12 months by EDBRACE and SELFRACE
EDBRACE SELFRACE Ratio*
Race/ethnicity Number Percent Number Percent Numbers Percents White 18,166 16.3 17,446 16.7 0.96 1.02 Black 1,026 10.7 902 10.5 0.88 0.98 Hispanic 127 7.7 455 9.4 3.58 1.22 A/PI 152 13.9 222 14.4 1.46 1.04 AI/AN 8 4.2 39 6.6 4.88 1.58 Other/unreported 134 11.8 549 11.6 4.10 0.98
* Ratio = number (percent) according to SELFRACE/number (percent) according to EDBRACE.
Source: Medicare claims for respondents to the 2000 and 2001 Medicare fee-for-service CAHPS surveys.
Tables 20 and 21 compare screening for colorectal cancer14 and PSA testing for men, respectively. The number of beneficiaries with claims for these screening procedures across the race/ethnicity codes for men followed the same general pattern as shown for women. The number of White and Black beneficiaries with claims decreased when self-reported race/ ethnicity was used in place of the EDB race/ethnicity, while the number of Hispanic, A/PI, and AI/AN beneficiaries with these claims increased. The proportion of White, Black, and AI/AN men stayed about the same for both colorectal cancer screening and PSA tests. However, the proportion of Hispanic men actually having the test decreased, while for A/PI men the proportion was relatively unchanged.
Table 20. Number, percentage, and ratio of male Medicare beneficiaries with claims for colorectal
cancer screening in the previous 12 months by EDBRACE and SELFRACE
EDBRACE SELFRACE Ratio*
Race/ethnicity Number Percent Number Percent Numbers PercentsWhite 14,136 16.3 13,551 16.7 0.96 1.02Black 562 9.2 499 9.2 0.89 1.00Hispanic 128 9.0 351 8.8 2.74 0.98A/PI 118 12.9 163 12.7 1.38 0.99AI/AN 8 4.4 33 6.1 4.13 1.40Other/unreported 115 11.6 470 12.7 4.09 1.09
* Ratio = number (percent) according to SELFRACE/number (percent) according to EDBRACE.
Source: Medicare claims for respondents to the 2000 and 2001 Medicare fee-for-service CAHPS surveys.
14 Colon cancer screening procedures in the comparison include: fecal occult blood test (FOBT) or fecal
immunochemical test (FIT); flexible sigmoidoscopy; double-contrast barium enema; and colonoscopy.
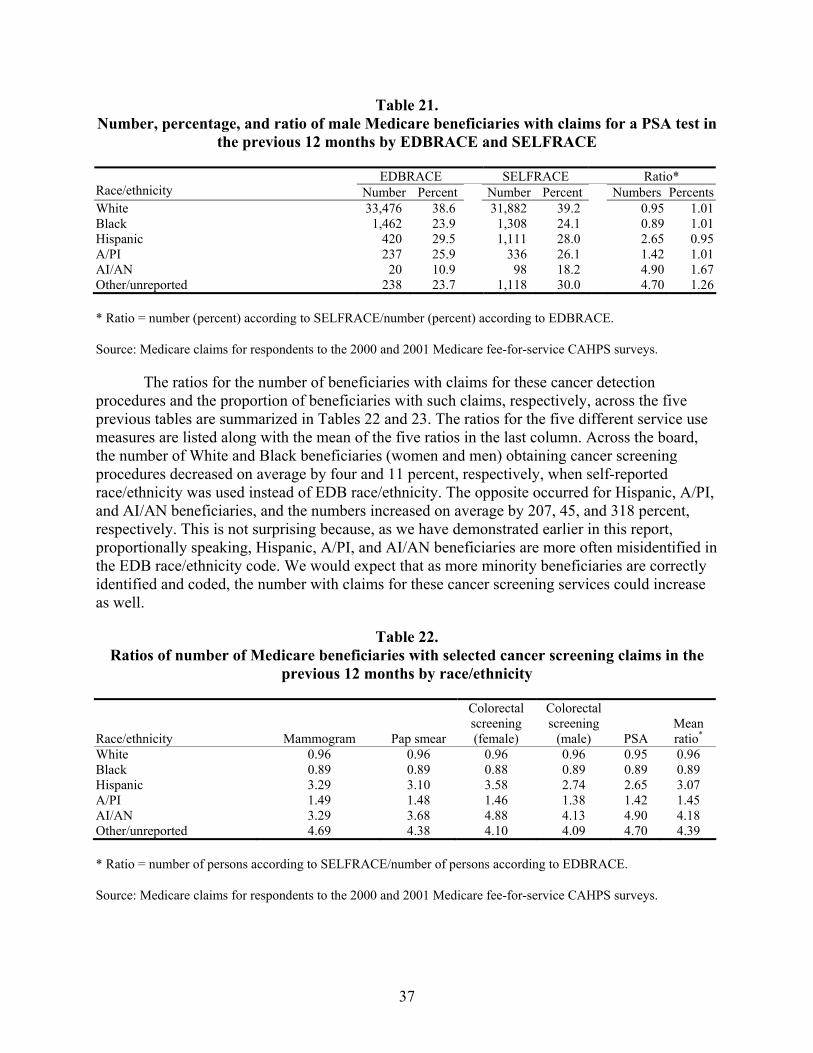
37
Table 21. Number, percentage, and ratio of male Medicare beneficiaries with claims for a PSA test in
the previous 12 months by EDBRACE and SELFRACE
EDBRACE SELFRACE Ratio* Race/ethnicity Number Percent Number Percent Numbers PercentsWhite 33,476 38.6 31,882 39.2 0.95 1.01Black 1,462 23.9 1,308 24.1 0.89 1.01Hispanic 420 29.5 1,111 28.0 2.65 0.95A/PI 237 25.9 336 26.1 1.42 1.01AI/AN 20 10.9 98 18.2 4.90 1.67Other/unreported 238 23.7 1,118 30.0 4.70 1.26
* Ratio = number (percent) according to SELFRACE/number (percent) according to EDBRACE.
Source: Medicare claims for respondents to the 2000 and 2001 Medicare fee-for-service CAHPS surveys.
The ratios for the number of beneficiaries with claims for these cancer detection procedures and the proportion of beneficiaries with such claims, respectively, across the five previous tables are summarized in Tables 22 and 23. The ratios for the five different service use measures are listed along with the mean of the five ratios in the last column. Across the board, the number of White and Black beneficiaries (women and men) obtaining cancer screening procedures decreased on average by four and 11 percent, respectively, when self-reported race/ethnicity was used instead of EDB race/ethnicity. The opposite occurred for Hispanic, A/PI, and AI/AN beneficiaries, and the numbers increased on average by 207, 45, and 318 percent, respectively. This is not surprising because, as we have demonstrated earlier in this report, proportionally speaking, Hispanic, A/PI, and AI/AN beneficiaries are more often misidentified in the EDB race/ethnicity code. We would expect that as more minority beneficiaries are correctly identified and coded, the number with claims for these cancer screening services could increase as well.
Table 22. Ratios of number of Medicare beneficiaries with selected cancer screening claims in the
previous 12 months by race/ethnicity
Race/ethnicity Mammogram Pap smear
Colorectal screening (female)
Colorectal screening
(male) PSA Mean ratio*
White 0.96 0.96 0.96 0.96 0.95 0.96 Black 0.89 0.89 0.88 0.89 0.89 0.89 Hispanic 3.29 3.10 3.58 2.74 2.65 3.07 A/PI 1.49 1.48 1.46 1.38 1.42 1.45 AI/AN 3.29 3.68 4.88 4.13 4.90 4.18 Other/unreported 4.69 4.38 4.10 4.09 4.70 4.39
* Ratio = number of persons according to SELFRACE/number of persons according to EDBRACE.
Source: Medicare claims for respondents to the 2000 and 2001 Medicare fee-for-service CAHPS surveys.
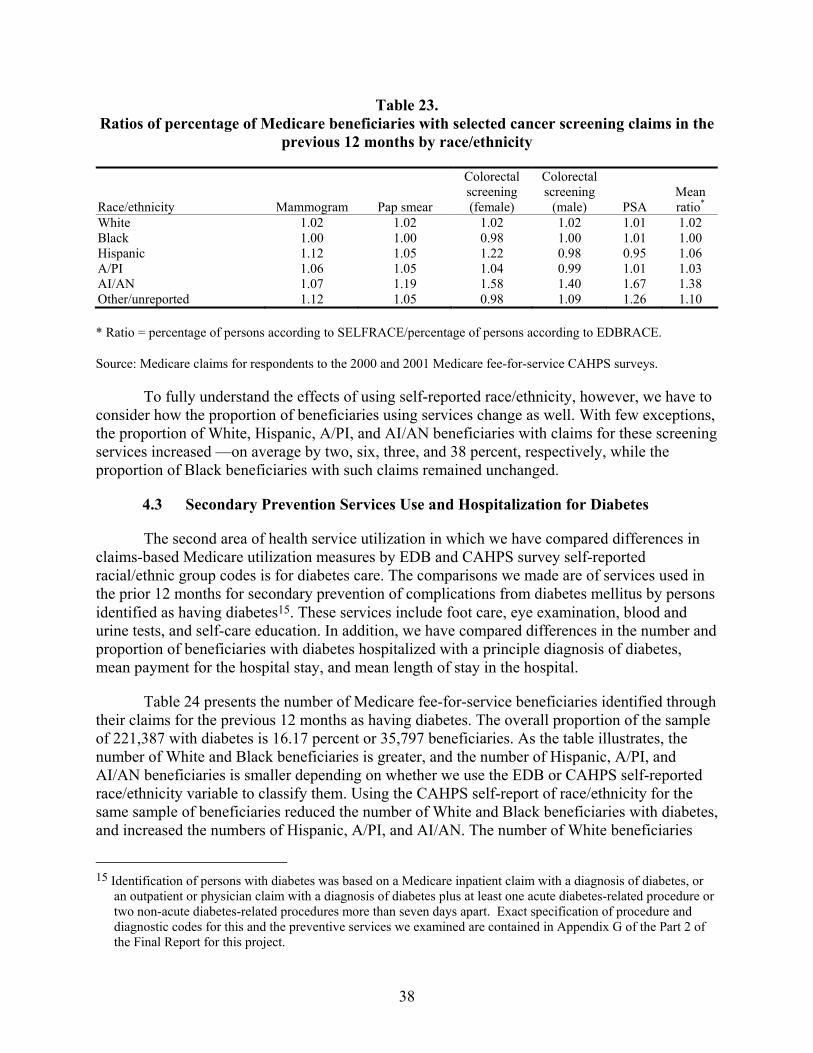
38
Table 23. Ratios of percentage of Medicare beneficiaries with selected cancer screening claims in the
previous 12 months by race/ethnicity
* Ratio = percentage of persons according to SELFRACE/percentage of persons according to EDBRACE.
Source: Medicare claims for respondents to the 2000 and 2001 Medicare fee-for-service CAHPS surveys.
To fully understand the effects of using self-reported race/ethnicity, however, we have to consider how the proportion of beneficiaries using services change as well. With few exceptions, the proportion of White, Hispanic, A/PI, and AI/AN beneficiaries with claims for these screening services increased —on average by two, six, three, and 38 percent, respectively, while the proportion of Black beneficiaries with such claims remained unchanged.
4.3 Secondary Prevention Services Use and Hospitalization for Diabetes
The second area of health service utilization in which we have compared differences in claims-based Medicare utilization measures by EDB and CAHPS survey self-reported racial/ethnic group codes is for diabetes care. The comparisons we made are of services used in the prior 12 months for secondary prevention of complications from diabetes mellitus by persons identified as having diabetes15. These services include foot care, eye examination, blood and urine tests, and self-care education. In addition, we have compared differences in the number and proportion of beneficiaries with diabetes hospitalized with a principle diagnosis of diabetes, mean payment for the hospital stay, and mean length of stay in the hospital.
Table 24 presents the number of Medicare fee-for-service beneficiaries identified through their claims for the previous 12 months as having diabetes. The overall proportion of the sample of 221,387 with diabetes is 16.17 percent or 35,797 beneficiaries. As the table illustrates, the number of White and Black beneficiaries is greater, and the number of Hispanic, A/PI, and AI/AN beneficiaries is smaller depending on whether we use the EDB or CAHPS self-reported race/ethnicity variable to classify them. Using the CAHPS self-report of race/ethnicity for the same sample of beneficiaries reduced the number of White and Black beneficiaries with diabetes, and increased the numbers of Hispanic, A/PI, and AI/AN. The number of White beneficiaries
15 Identification of persons with diabetes was based on a Medicare inpatient claim with a diagnosis of diabetes, or
an outpatient or physician claim with a diagnosis of diabetes plus at least one acute diabetes-related procedure or two non-acute diabetes-related procedures more than seven days apart. Exact specification of procedure and diagnostic codes for this and the preventive services we examined are contained in Appendix G of the Part 2 of the Final Report for this project.
Race/ethnicity Mammogram Pap smear
Colorectal screening (female)
Colorectal screening
(male) PSA Mean ratio*
White 1.02 1.02 1.02 1.02 1.01 1.02 Black 1.00 1.00 0.98 1.00 1.01 1.00 Hispanic 1.12 1.05 1.22 0.98 0.95 1.06 A/PI 1.06 1.05 1.04 0.99 1.01 1.03 AI/AN 1.07 1.19 1.58 1.40 1.67 1.38 Other/unreported 1.12 1.05 0.98 1.09 1.26 1.10
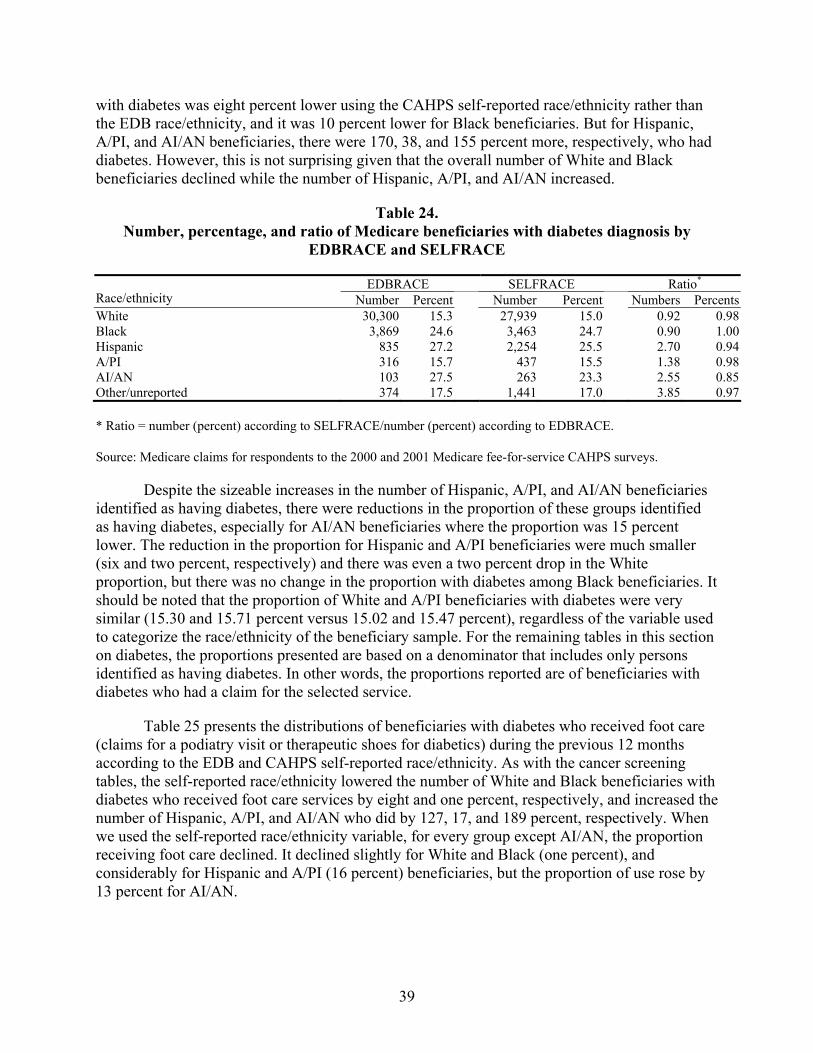
39
with diabetes was eight percent lower using the CAHPS self-reported race/ethnicity rather than the EDB race/ethnicity, and it was 10 percent lower for Black beneficiaries. But for Hispanic, A/PI, and AI/AN beneficiaries, there were 170, 38, and 155 percent more, respectively, who had diabetes. However, this is not surprising given that the overall number of White and Black beneficiaries declined while the number of Hispanic, A/PI, and AI/AN increased.
Table 24. Number, percentage, and ratio of Medicare beneficiaries with diabetes diagnosis by
EDBRACE and SELFRACE
EDBRACE SELFRACE Ratio*
Race/ethnicity Number Percent Number Percent Numbers PercentsWhite 30,300 15.3 27,939 15.0 0.92 0.98Black 3,869 24.6 3,463 24.7 0.90 1.00Hispanic 835 27.2 2,254 25.5 2.70 0.94A/PI 316 15.7 437 15.5 1.38 0.98AI/AN 103 27.5 263 23.3 2.55 0.85Other/unreported 374 17.5 1,441 17.0 3.85 0.97
* Ratio = number (percent) according to SELFRACE/number (percent) according to EDBRACE.
Source: Medicare claims for respondents to the 2000 and 2001 Medicare fee-for-service CAHPS surveys.
Despite the sizeable increases in the number of Hispanic, A/PI, and AI/AN beneficiaries identified as having diabetes, there were reductions in the proportion of these groups identified as having diabetes, especially for AI/AN beneficiaries where the proportion was 15 percent lower. The reduction in the proportion for Hispanic and A/PI beneficiaries were much smaller (six and two percent, respectively) and there was even a two percent drop in the White proportion, but there was no change in the proportion with diabetes among Black beneficiaries. It should be noted that the proportion of White and A/PI beneficiaries with diabetes were very similar (15.30 and 15.71 percent versus 15.02 and 15.47 percent), regardless of the variable used to categorize the race/ethnicity of the beneficiary sample. For the remaining tables in this section on diabetes, the proportions presented are based on a denominator that includes only persons identified as having diabetes. In other words, the proportions reported are of beneficiaries with diabetes who had a claim for the selected service.
Table 25 presents the distributions of beneficiaries with diabetes who received foot care (claims for a podiatry visit or therapeutic shoes for diabetics) during the previous 12 months according to the EDB and CAHPS self-reported race/ethnicity. As with the cancer screening tables, the self-reported race/ethnicity lowered the number of White and Black beneficiaries with diabetes who received foot care services by eight and one percent, respectively, and increased the number of Hispanic, A/PI, and AI/AN who did by 127, 17, and 189 percent, respectively. When we used the self-reported race/ethnicity variable, for every group except AI/AN, the proportion receiving foot care declined. It declined slightly for White and Black (one percent), and considerably for Hispanic and A/PI (16 percent) beneficiaries, but the proportion of use rose by 13 percent for AI/AN.
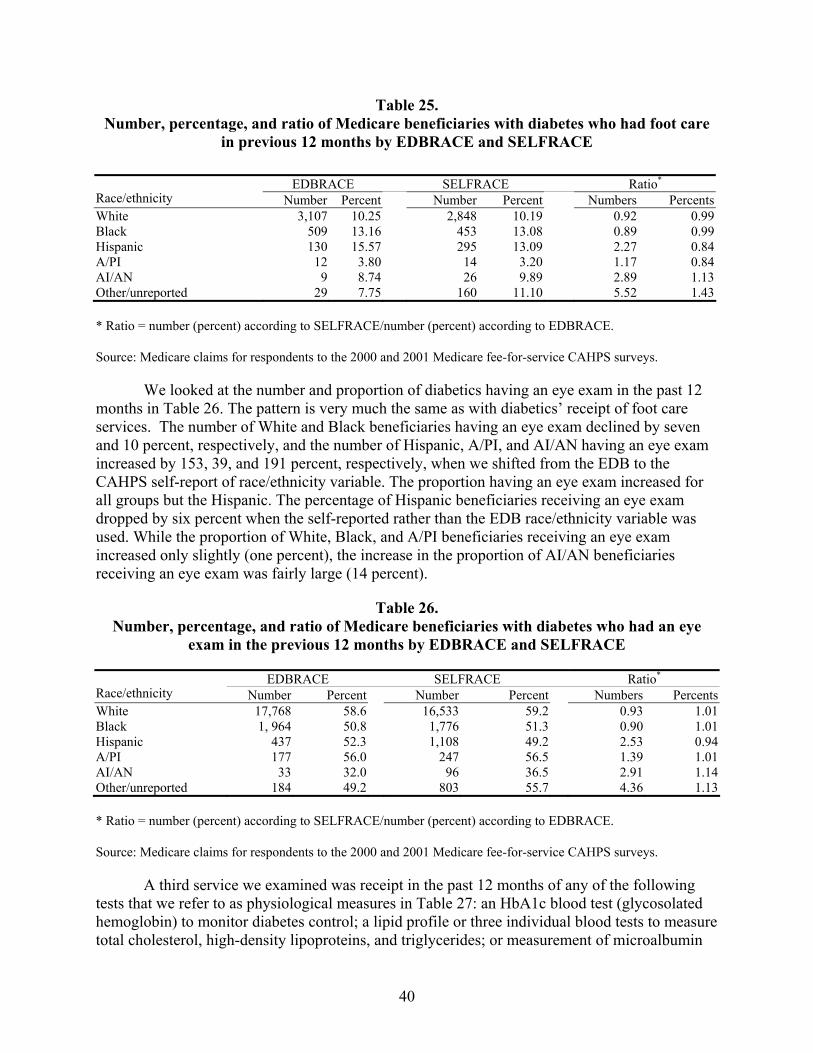
40
Table 25. Number, percentage, and ratio of Medicare beneficiaries with diabetes who had foot care
in previous 12 months by EDBRACE and SELFRACE
* Ratio = number (percent) according to SELFRACE/number (percent) according to EDBRACE.
Source: Medicare claims for respondents to the 2000 and 2001 Medicare fee-for-service CAHPS surveys.
We looked at the number and proportion of diabetics having an eye exam in the past 12 months in Table 26. The pattern is very much the same as with diabetics’ receipt of foot care services. The number of White and Black beneficiaries having an eye exam declined by seven and 10 percent, respectively, and the number of Hispanic, A/PI, and AI/AN having an eye exam increased by 153, 39, and 191 percent, respectively, when we shifted from the EDB to the CAHPS self-report of race/ethnicity variable. The proportion having an eye exam increased for all groups but the Hispanic. The percentage of Hispanic beneficiaries receiving an eye exam dropped by six percent when the self-reported rather than the EDB race/ethnicity variable was used. While the proportion of White, Black, and A/PI beneficiaries receiving an eye exam increased only slightly (one percent), the increase in the proportion of AI/AN beneficiaries receiving an eye exam was fairly large (14 percent).
Table 26. Number, percentage, and ratio of Medicare beneficiaries with diabetes who had an eye
exam in the previous 12 months by EDBRACE and SELFRACE
EDBRACE SELFRACE Ratio*
Race/ethnicity Number Percent Number Percent Numbers PercentsWhite 17,768 58.6 16,533 59.2 0.93 1.01Black 1, 964 50.8 1,776 51.3 0.90 1.01Hispanic 437 52.3 1,108 49.2 2.53 0.94A/PI 177 56.0 247 56.5 1.39 1.01AI/AN 33 32.0 96 36.5 2.91 1.14Other/unreported 184 49.2 803 55.7 4.36 1.13
* Ratio = number (percent) according to SELFRACE/number (percent) according to EDBRACE.
Source: Medicare claims for respondents to the 2000 and 2001 Medicare fee-for-service CAHPS surveys.
A third service we examined was receipt in the past 12 months of any of the following tests that we refer to as physiological measures in Table 27: an HbA1c blood test (glycosolated hemoglobin) to monitor diabetes control; a lipid profile or three individual blood tests to measure total cholesterol, high-density lipoproteins, and triglycerides; or measurement of microalbumin
EDBRACE SELFRACE Ratio*
Race/ethnicity Number Percent Number Percent Numbers PercentsWhite 3,107 10.25 2,848 10.19 0.92 0.99Black 509 13.16 453 13.08 0.89 0.99Hispanic 130 15.57 295 13.09 2.27 0.84A/PI 12 3.80 14 3.20 1.17 0.84AI/AN 9 8.74 26 9.89 2.89 1.13Other/unreported 29 7.75 160 11.10 5.52 1.43
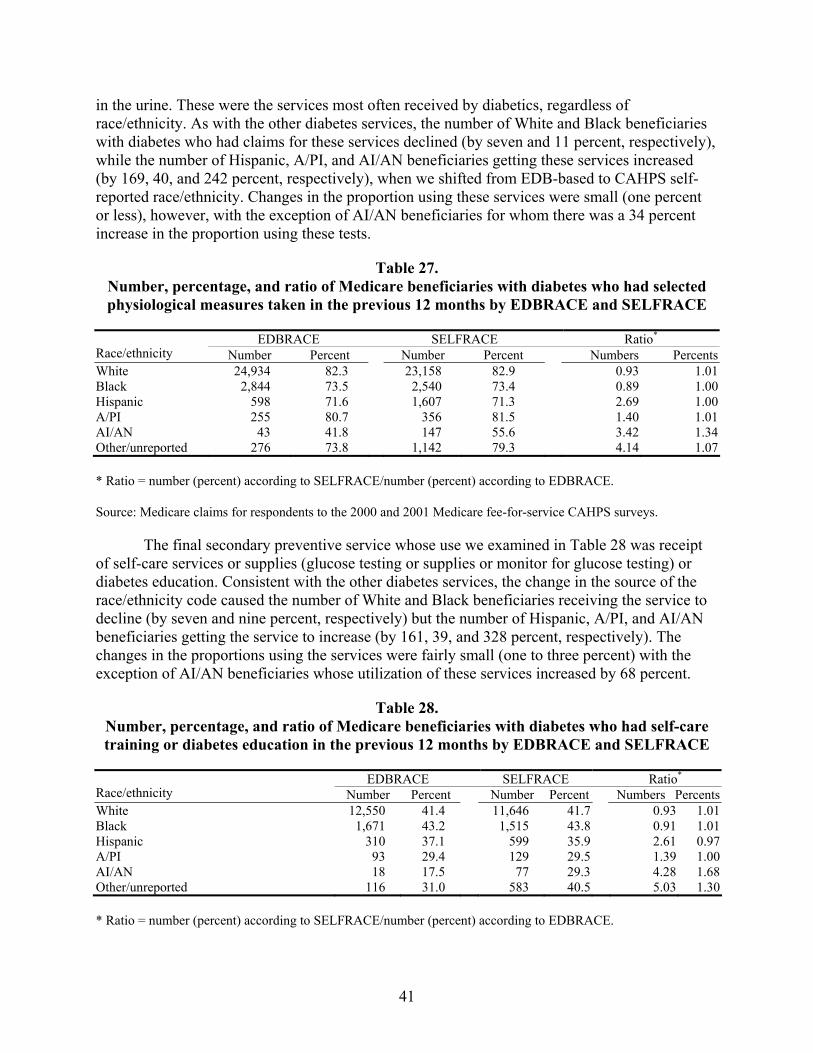
41
in the urine. These were the services most often received by diabetics, regardless of race/ethnicity. As with the other diabetes services, the number of White and Black beneficiaries with diabetes who had claims for these services declined (by seven and 11 percent, respectively), while the number of Hispanic, A/PI, and AI/AN beneficiaries getting these services increased (by 169, 40, and 242 percent, respectively), when we shifted from EDB-based to CAHPS self-reported race/ethnicity. Changes in the proportion using these services were small (one percent or less), however, with the exception of AI/AN beneficiaries for whom there was a 34 percent increase in the proportion using these tests.
Table 27. Number, percentage, and ratio of Medicare beneficiaries with diabetes who had selected physiological measures taken in the previous 12 months by EDBRACE and SELFRACE
EDBRACE SELFRACE Ratio*
Race/ethnicity Number Percent Number Percent Numbers PercentsWhite 24,934 82.3 23,158 82.9 0.93 1.01Black 2,844 73.5 2,540 73.4 0.89 1.00Hispanic 598 71.6 1,607 71.3 2.69 1.00A/PI 255 80.7 356 81.5 1.40 1.01AI/AN 43 41.8 147 55.6 3.42 1.34Other/unreported 276 73.8 1,142 79.3 4.14 1.07
* Ratio = number (percent) according to SELFRACE/number (percent) according to EDBRACE.
Source: Medicare claims for respondents to the 2000 and 2001 Medicare fee-for-service CAHPS surveys.
The final secondary preventive service whose use we examined in Table 28 was receipt of self-care services or supplies (glucose testing or supplies or monitor for glucose testing) or diabetes education. Consistent with the other diabetes services, the change in the source of the race/ethnicity code caused the number of White and Black beneficiaries receiving the service to decline (by seven and nine percent, respectively) but the number of Hispanic, A/PI, and AI/AN beneficiaries getting the service to increase (by 161, 39, and 328 percent, respectively). The changes in the proportions using the services were fairly small (one to three percent) with the exception of AI/AN beneficiaries whose utilization of these services increased by 68 percent.
Table 28. Number, percentage, and ratio of Medicare beneficiaries with diabetes who had self-care training or diabetes education in the previous 12 months by EDBRACE and SELFRACE
EDBRACE SELFRACE Ratio*
Race/ethnicity Number Percent Number Percent Numbers PercentsWhite 12,550 41.4 11,646 41.7 0.93 1.01Black 1,671 43.2 1,515 43.8 0.91 1.01Hispanic 310 37.1 599 35.9 2.61 0.97A/PI 93 29.4 129 29.5 1.39 1.00AI/AN 18 17.5 77 29.3 4.28 1.68Other/unreported 116 31.0 583 40.5 5.03 1.30
* Ratio = number (percent) according to SELFRACE/number (percent) according to EDBRACE.
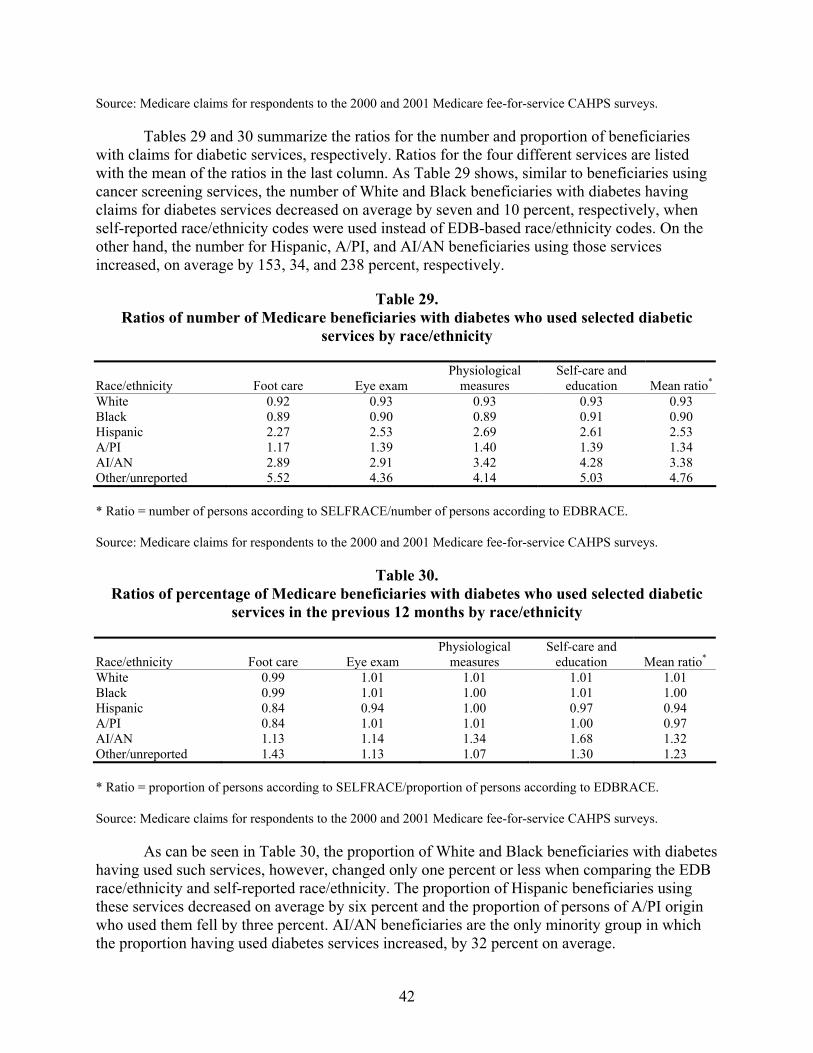
42
Source: Medicare claims for respondents to the 2000 and 2001 Medicare fee-for-service CAHPS surveys.
Tables 29 and 30 summarize the ratios for the number and proportion of beneficiaries with claims for diabetic services, respectively. Ratios for the four different services are listed with the mean of the ratios in the last column. As Table 29 shows, similar to beneficiaries using cancer screening services, the number of White and Black beneficiaries with diabetes having claims for diabetes services decreased on average by seven and 10 percent, respectively, when self-reported race/ethnicity codes were used instead of EDB-based race/ethnicity codes. On the other hand, the number for Hispanic, A/PI, and AI/AN beneficiaries using those services increased, on average by 153, 34, and 238 percent, respectively.
Table 29. Ratios of number of Medicare beneficiaries with diabetes who used selected diabetic
services by race/ethnicity
Race/ethnicity Foot care Eye exam Physiological
measures Self-care and
education Mean ratio* White 0.92 0.93 0.93 0.93 0.93 Black 0.89 0.90 0.89 0.91 0.90 Hispanic 2.27 2.53 2.69 2.61 2.53 A/PI 1.17 1.39 1.40 1.39 1.34 AI/AN 2.89 2.91 3.42 4.28 3.38 Other/unreported 5.52 4.36 4.14 5.03 4.76
* Ratio = number of persons according to SELFRACE/number of persons according to EDBRACE.
Source: Medicare claims for respondents to the 2000 and 2001 Medicare fee-for-service CAHPS surveys.
Table 30. Ratios of percentage of Medicare beneficiaries with diabetes who used selected diabetic
services in the previous 12 months by race/ethnicity
Race/ethnicity Foot care Eye exam Physiological
measures Self-care and
education Mean ratio* White 0.99 1.01 1.01 1.01 1.01 Black 0.99 1.01 1.00 1.01 1.00 Hispanic 0.84 0.94 1.00 0.97 0.94 A/PI 0.84 1.01 1.01 1.00 0.97 AI/AN 1.13 1.14 1.34 1.68 1.32 Other/unreported 1.43 1.13 1.07 1.30 1.23
* Ratio = proportion of persons according to SELFRACE/proportion of persons according to EDBRACE.
Source: Medicare claims for respondents to the 2000 and 2001 Medicare fee-for-service CAHPS surveys.
As can be seen in Table 30, the proportion of White and Black beneficiaries with diabetes having used such services, however, changed only one percent or less when comparing the EDB race/ethnicity and self-reported race/ethnicity. The proportion of Hispanic beneficiaries using these services decreased on average by six percent and the proportion of persons of A/PI origin who used them fell by three percent. AI/AN beneficiaries are the only minority group in which the proportion having used diabetes services increased, by 32 percent on average.
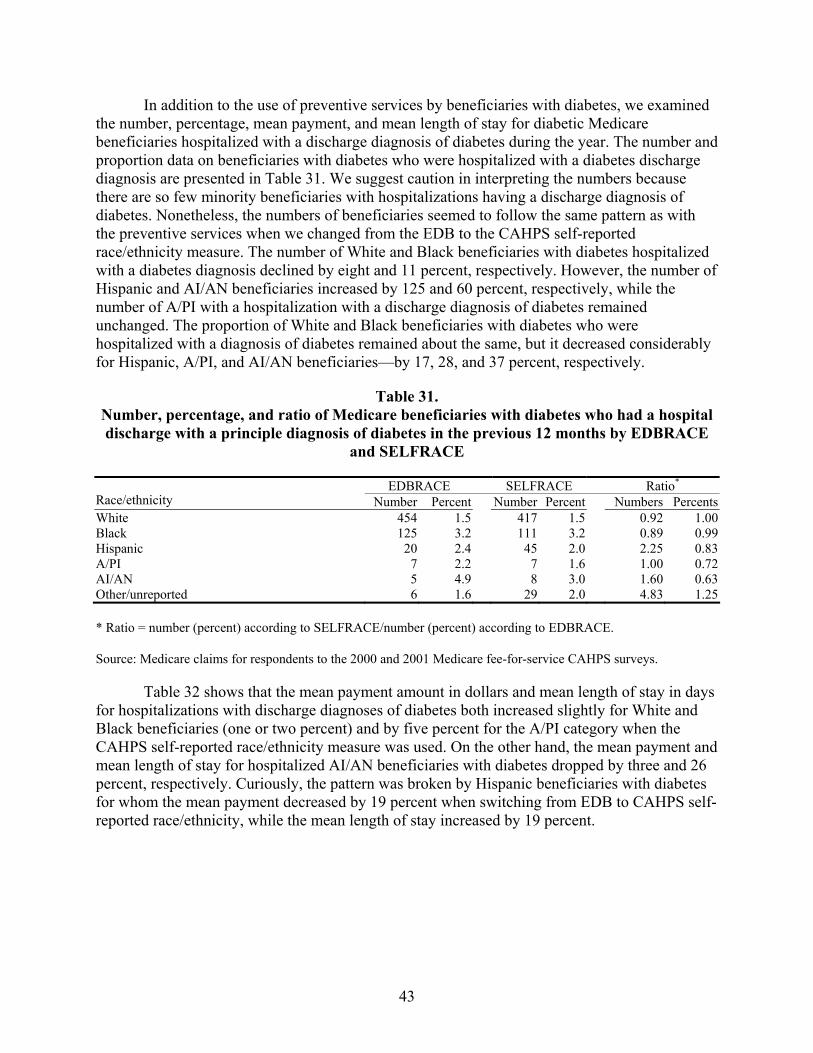
43
In addition to the use of preventive services by beneficiaries with diabetes, we examined the number, percentage, mean payment, and mean length of stay for diabetic Medicare beneficiaries hospitalized with a discharge diagnosis of diabetes during the year. The number and proportion data on beneficiaries with diabetes who were hospitalized with a diabetes discharge diagnosis are presented in Table 31. We suggest caution in interpreting the numbers because there are so few minority beneficiaries with hospitalizations having a discharge diagnosis of diabetes. Nonetheless, the numbers of beneficiaries seemed to follow the same pattern as with the preventive services when we changed from the EDB to the CAHPS self-reported race/ethnicity measure. The number of White and Black beneficiaries with diabetes hospitalized with a diabetes diagnosis declined by eight and 11 percent, respectively. However, the number of Hispanic and AI/AN beneficiaries increased by 125 and 60 percent, respectively, while the number of A/PI with a hospitalization with a discharge diagnosis of diabetes remained unchanged. The proportion of White and Black beneficiaries with diabetes who were hospitalized with a diagnosis of diabetes remained about the same, but it decreased considerably for Hispanic, A/PI, and AI/AN beneficiaries—by 17, 28, and 37 percent, respectively.
Table 31. Number, percentage, and ratio of Medicare beneficiaries with diabetes who had a hospital discharge with a principle diagnosis of diabetes in the previous 12 months by EDBRACE
and SELFRACE
EDBRACE SELFRACE Ratio*
Race/ethnicity Number Percent Number Percent Numbers PercentsWhite 454 1.5 417 1.5 0.92 1.00Black 125 3.2 111 3.2 0.89 0.99Hispanic 20 2.4 45 2.0 2.25 0.83A/PI 7 2.2 7 1.6 1.00 0.72AI/AN 5 4.9 8 3.0 1.60 0.63Other/unreported 6 1.6 29 2.0 4.83 1.25
* Ratio = number (percent) according to SELFRACE/number (percent) according to EDBRACE.
Source: Medicare claims for respondents to the 2000 and 2001 Medicare fee-for-service CAHPS surveys.
Table 32 shows that the mean payment amount in dollars and mean length of stay in days for hospitalizations with discharge diagnoses of diabetes both increased slightly for White and Black beneficiaries (one or two percent) and by five percent for the A/PI category when the CAHPS self-reported race/ethnicity measure was used. On the other hand, the mean payment and mean length of stay for hospitalized AI/AN beneficiaries with diabetes dropped by three and 26 percent, respectively. Curiously, the pattern was broken by Hispanic beneficiaries with diabetes for whom the mean payment decreased by 19 percent when switching from EDB to CAHPS self-reported race/ethnicity, while the mean length of stay increased by 19 percent.
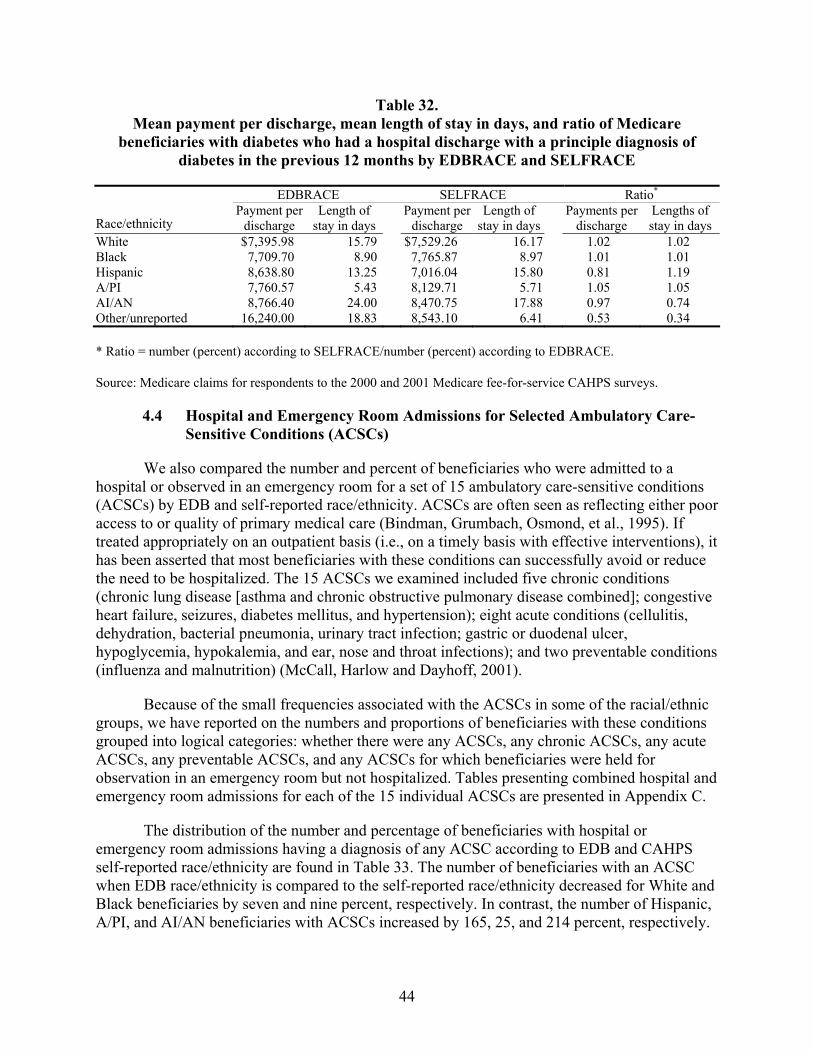
44
Table 32. Mean payment per discharge, mean length of stay in days, and ratio of Medicare
beneficiaries with diabetes who had a hospital discharge with a principle diagnosis of diabetes in the previous 12 months by EDBRACE and SELFRACE
EDBRACE SELFRACE Ratio*
Race/ethnicity Payment per
discharge Length of
stay in days Payment per
discharge Length of
stay in days Payments per
discharge Lengths of stay in days
White $7,395.98 15.79 $7,529.26 16.17 1.02 1.02 Black 7,709.70 8.90 7,765.87 8.97 1.01 1.01 Hispanic 8,638.80 13.25 7,016.04 15.80 0.81 1.19 A/PI 7,760.57 5.43 8,129.71 5.71 1.05 1.05 AI/AN 8,766.40 24.00 8,470.75 17.88 0.97 0.74 Other/unreported 16,240.00 18.83 8,543.10 6.41 0.53 0.34
* Ratio = number (percent) according to SELFRACE/number (percent) according to EDBRACE.
Source: Medicare claims for respondents to the 2000 and 2001 Medicare fee-for-service CAHPS surveys.
4.4 Hospital and Emergency Room Admissions for Selected Ambulatory Care-Sensitive Conditions (ACSCs)
We also compared the number and percent of beneficiaries who were admitted to a hospital or observed in an emergency room for a set of 15 ambulatory care-sensitive conditions (ACSCs) by EDB and self-reported race/ethnicity. ACSCs are often seen as reflecting either poor access to or quality of primary medical care (Bindman, Grumbach, Osmond, et al., 1995). If treated appropriately on an outpatient basis (i.e., on a timely basis with effective interventions), it has been asserted that most beneficiaries with these conditions can successfully avoid or reduce the need to be hospitalized. The 15 ACSCs we examined included five chronic conditions (chronic lung disease [asthma and chronic obstructive pulmonary disease combined]; congestive heart failure, seizures, diabetes mellitus, and hypertension); eight acute conditions (cellulitis, dehydration, bacterial pneumonia, urinary tract infection; gastric or duodenal ulcer, hypoglycemia, hypokalemia, and ear, nose and throat infections); and two preventable conditions (influenza and malnutrition) (McCall, Harlow and Dayhoff, 2001).
Because of the small frequencies associated with the ACSCs in some of the racial/ethnic groups, we have reported on the numbers and proportions of beneficiaries with these conditions grouped into logical categories: whether there were any ACSCs, any chronic ACSCs, any acute ACSCs, any preventable ACSCs, and any ACSCs for which beneficiaries were held for observation in an emergency room but not hospitalized. Tables presenting combined hospital and emergency room admissions for each of the 15 individual ACSCs are presented in Appendix C.
The distribution of the number and percentage of beneficiaries with hospital or emergency room admissions having a diagnosis of any ACSC according to EDB and CAHPS self-reported race/ethnicity are found in Table 33. The number of beneficiaries with an ACSC when EDB race/ethnicity is compared to the self-reported race/ethnicity decreased for White and Black beneficiaries by seven and nine percent, respectively. In contrast, the number of Hispanic, A/PI, and AI/AN beneficiaries with ACSCs increased by 165, 25, and 214 percent, respectively.
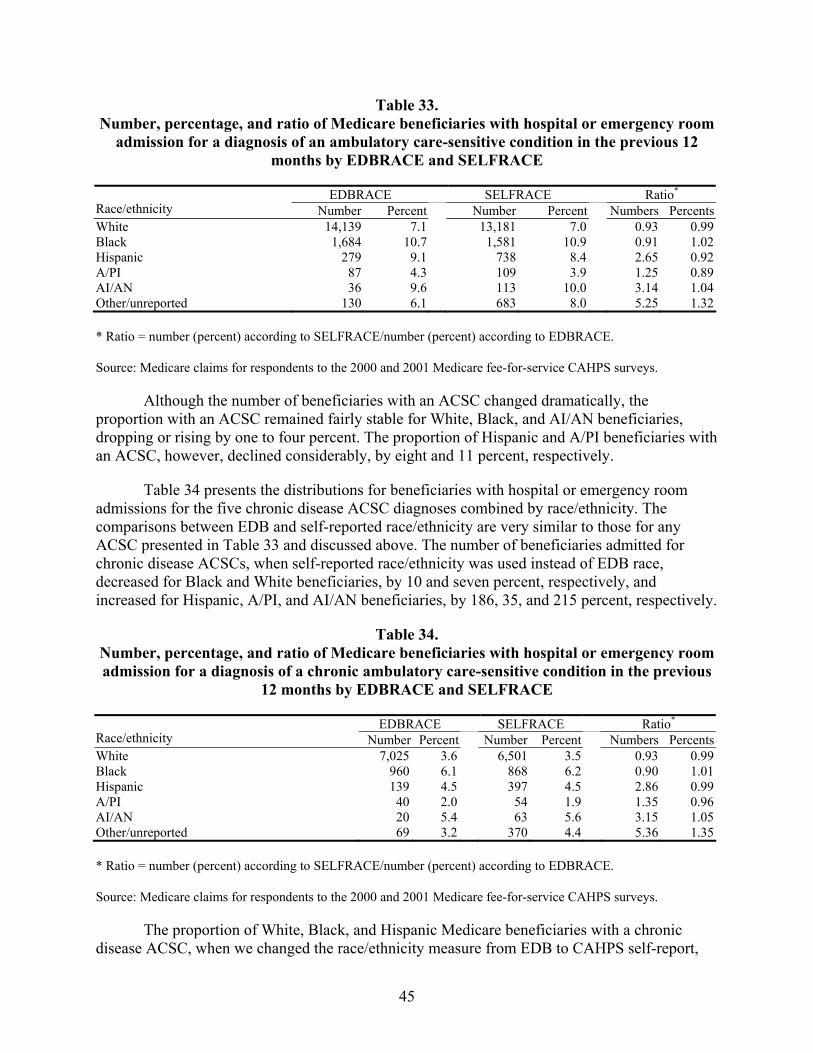
45
Table 33. Number, percentage, and ratio of Medicare beneficiaries with hospital or emergency room
admission for a diagnosis of an ambulatory care-sensitive condition in the previous 12 months by EDBRACE and SELFRACE
EDBRACE SELFRACE Ratio*
Race/ethnicity Number Percent Number Percent Numbers PercentsWhite 14,139 7.1 13,181 7.0 0.93 0.99Black 1,684 10.7 1,581 10.9 0.91 1.02Hispanic 279 9.1 738 8.4 2.65 0.92A/PI 87 4.3 109 3.9 1.25 0.89AI/AN 36 9.6 113 10.0 3.14 1.04Other/unreported 130 6.1 683 8.0 5.25 1.32
* Ratio = number (percent) according to SELFRACE/number (percent) according to EDBRACE.
Source: Medicare claims for respondents to the 2000 and 2001 Medicare fee-for-service CAHPS surveys.
Although the number of beneficiaries with an ACSC changed dramatically, the proportion with an ACSC remained fairly stable for White, Black, and AI/AN beneficiaries, dropping or rising by one to four percent. The proportion of Hispanic and A/PI beneficiaries with an ACSC, however, declined considerably, by eight and 11 percent, respectively.
Table 34 presents the distributions for beneficiaries with hospital or emergency room admissions for the five chronic disease ACSC diagnoses combined by race/ethnicity. The comparisons between EDB and self-reported race/ethnicity are very similar to those for any ACSC presented in Table 33 and discussed above. The number of beneficiaries admitted for chronic disease ACSCs, when self-reported race/ethnicity was used instead of EDB race, decreased for Black and White beneficiaries, by 10 and seven percent, respectively, and increased for Hispanic, A/PI, and AI/AN beneficiaries, by 186, 35, and 215 percent, respectively.
Table 34. Number, percentage, and ratio of Medicare beneficiaries with hospital or emergency room admission for a diagnosis of a chronic ambulatory care-sensitive condition in the previous
12 months by EDBRACE and SELFRACE
EDBRACE SELFRACE Ratio*
Race/ethnicity Number Percent Number Percent Numbers PercentsWhite 7,025 3.6 6,501 3.5 0.93 0.99Black 960 6.1 868 6.2 0.90 1.01Hispanic 139 4.5 397 4.5 2.86 0.99A/PI 40 2.0 54 1.9 1.35 0.96AI/AN 20 5.4 63 5.6 3.15 1.05Other/unreported 69 3.2 370 4.4 5.36 1.35
* Ratio = number (percent) according to SELFRACE/number (percent) according to EDBRACE.
Source: Medicare claims for respondents to the 2000 and 2001 Medicare fee-for-service CAHPS surveys.
The proportion of White, Black, and Hispanic Medicare beneficiaries with a chronic disease ACSC, when we changed the race/ethnicity measure from EDB to CAHPS self-report,
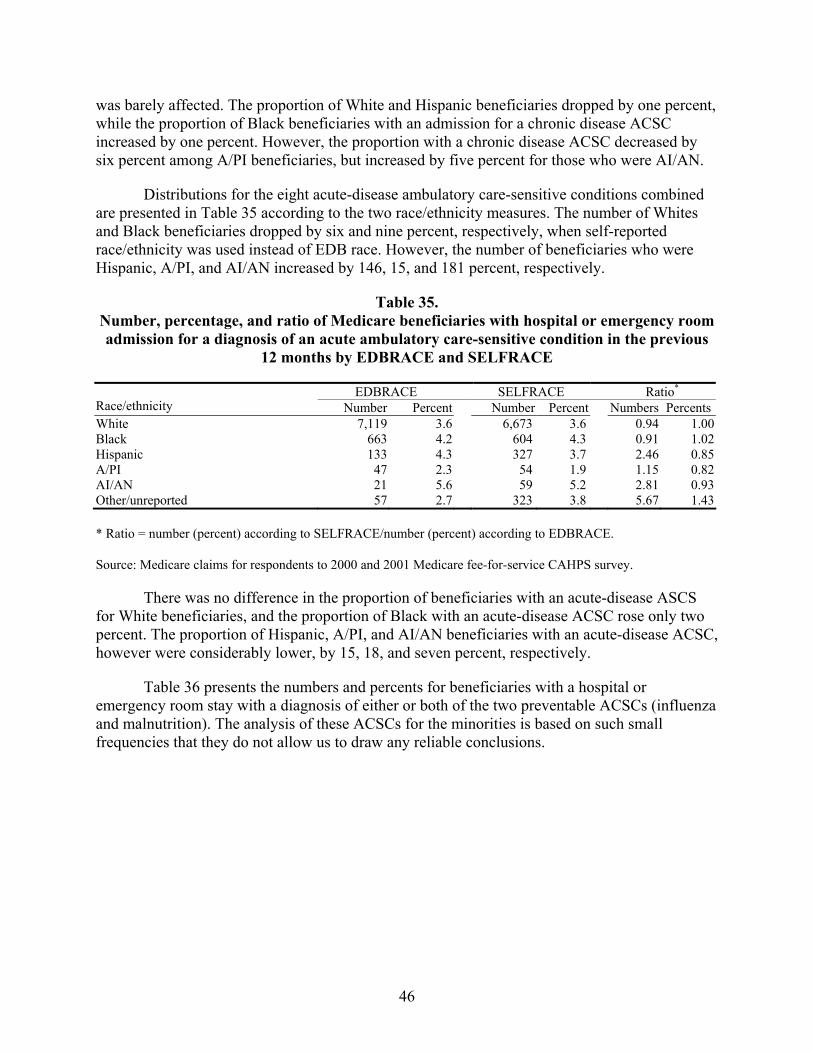
46
was barely affected. The proportion of White and Hispanic beneficiaries dropped by one percent, while the proportion of Black beneficiaries with an admission for a chronic disease ACSC increased by one percent. However, the proportion with a chronic disease ACSC decreased by six percent among A/PI beneficiaries, but increased by five percent for those who were AI/AN.
Distributions for the eight acute-disease ambulatory care-sensitive conditions combined are presented in Table 35 according to the two race/ethnicity measures. The number of Whites and Black beneficiaries dropped by six and nine percent, respectively, when self-reported race/ethnicity was used instead of EDB race. However, the number of beneficiaries who were Hispanic, A/PI, and AI/AN increased by 146, 15, and 181 percent, respectively.
Table 35. Number, percentage, and ratio of Medicare beneficiaries with hospital or emergency room admission for a diagnosis of an acute ambulatory care-sensitive condition in the previous
12 months by EDBRACE and SELFRACE
EDBRACE SELFRACE Ratio*
Race/ethnicity Number Percent Number Percent Numbers PercentsWhite 7,119 3.6 6,673 3.6 0.94 1.00Black 663 4.2 604 4.3 0.91 1.02Hispanic 133 4.3 327 3.7 2.46 0.85A/PI 47 2.3 54 1.9 1.15 0.82AI/AN 21 5.6 59 5.2 2.81 0.93Other/unreported 57 2.7 323 3.8 5.67 1.43
* Ratio = number (percent) according to SELFRACE/number (percent) according to EDBRACE.
Source: Medicare claims for respondents to 2000 and 2001 Medicare fee-for-service CAHPS survey.
There was no difference in the proportion of beneficiaries with an acute-disease ASCS for White beneficiaries, and the proportion of Black with an acute-disease ACSC rose only two percent. The proportion of Hispanic, A/PI, and AI/AN beneficiaries with an acute-disease ACSC, however were considerably lower, by 15, 18, and seven percent, respectively.
Table 36 presents the numbers and percents for beneficiaries with a hospital or emergency room stay with a diagnosis of either or both of the two preventable ACSCs (influenza and malnutrition). The analysis of these ACSCs for the minorities is based on such small frequencies that they do not allow us to draw any reliable conclusions.
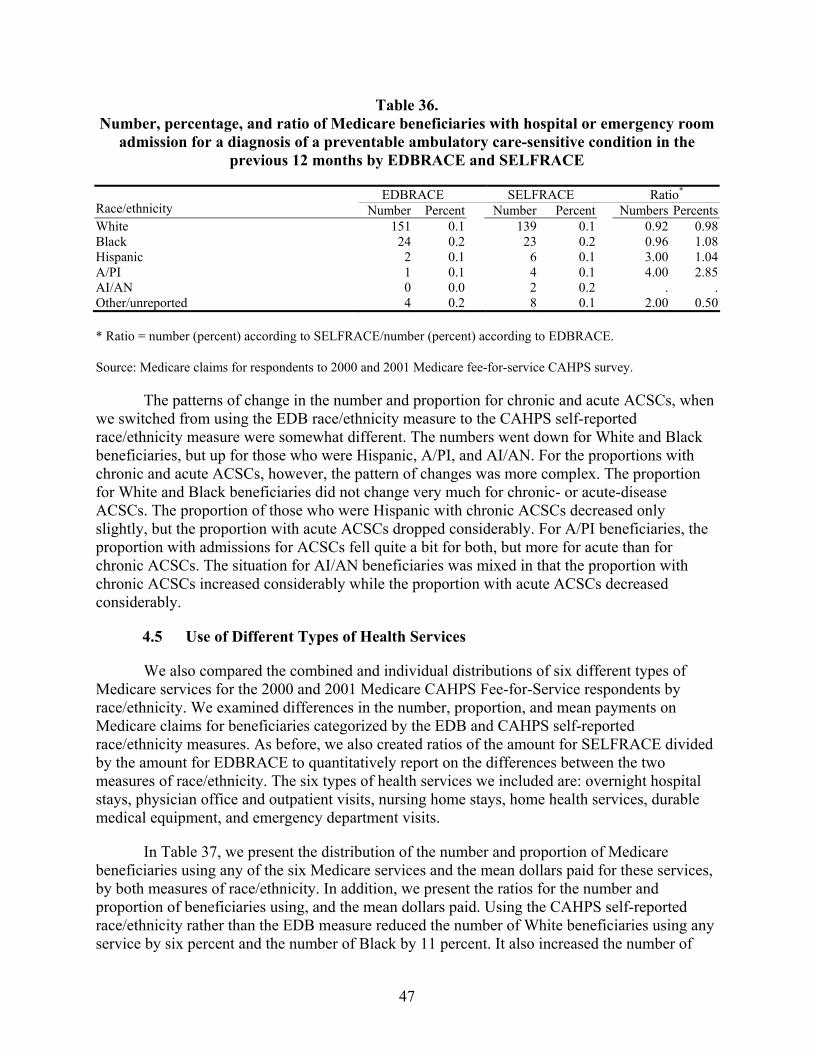
47
Table 36. Number, percentage, and ratio of Medicare beneficiaries with hospital or emergency room
admission for a diagnosis of a preventable ambulatory care-sensitive condition in the previous 12 months by EDBRACE and SELFRACE
EDBRACE SELFRACE Ratio*
Race/ethnicity Number Percent Number Percent Numbers PercentsWhite 151 0.1 139 0.1 0.92 0.98Black 24 0.2 23 0.2 0.96 1.08Hispanic 2 0.1 6 0.1 3.00 1.04A/PI 1 0.1 4 0.1 4.00 2.85AI/AN 0 0.0 2 0.2 . .Other/unreported 4 0.2 8 0.1 2.00 0.50
* Ratio = number (percent) according to SELFRACE/number (percent) according to EDBRACE.
Source: Medicare claims for respondents to 2000 and 2001 Medicare fee-for-service CAHPS survey.
The patterns of change in the number and proportion for chronic and acute ACSCs, when we switched from using the EDB race/ethnicity measure to the CAHPS self-reported race/ethnicity measure were somewhat different. The numbers went down for White and Black beneficiaries, but up for those who were Hispanic, A/PI, and AI/AN. For the proportions with chronic and acute ACSCs, however, the pattern of changes was more complex. The proportion for White and Black beneficiaries did not change very much for chronic- or acute-disease ACSCs. The proportion of those who were Hispanic with chronic ACSCs decreased only slightly, but the proportion with acute ACSCs dropped considerably. For A/PI beneficiaries, the proportion with admissions for ACSCs fell quite a bit for both, but more for acute than for chronic ACSCs. The situation for AI/AN beneficiaries was mixed in that the proportion with chronic ACSCs increased considerably while the proportion with acute ACSCs decreased considerably.
4.5 Use of Different Types of Health Services
We also compared the combined and individual distributions of six different types of Medicare services for the 2000 and 2001 Medicare CAHPS Fee-for-Service respondents by race/ethnicity. We examined differences in the number, proportion, and mean payments on Medicare claims for beneficiaries categorized by the EDB and CAHPS self-reported race/ethnicity measures. As before, we also created ratios of the amount for SELFRACE divided by the amount for EDBRACE to quantitatively report on the differences between the two measures of race/ethnicity. The six types of health services we included are: overnight hospital stays, physician office and outpatient visits, nursing home stays, home health services, durable medical equipment, and emergency department visits.
In Table 37, we present the distribution of the number and proportion of Medicare beneficiaries using any of the six Medicare services and the mean dollars paid for these services, by both measures of race/ethnicity. In addition, we present the ratios for the number and proportion of beneficiaries using, and the mean dollars paid. Using the CAHPS self-reported race/ethnicity rather than the EDB measure reduced the number of White beneficiaries using any service by six percent and the number of Black by 11 percent. It also increased the number of
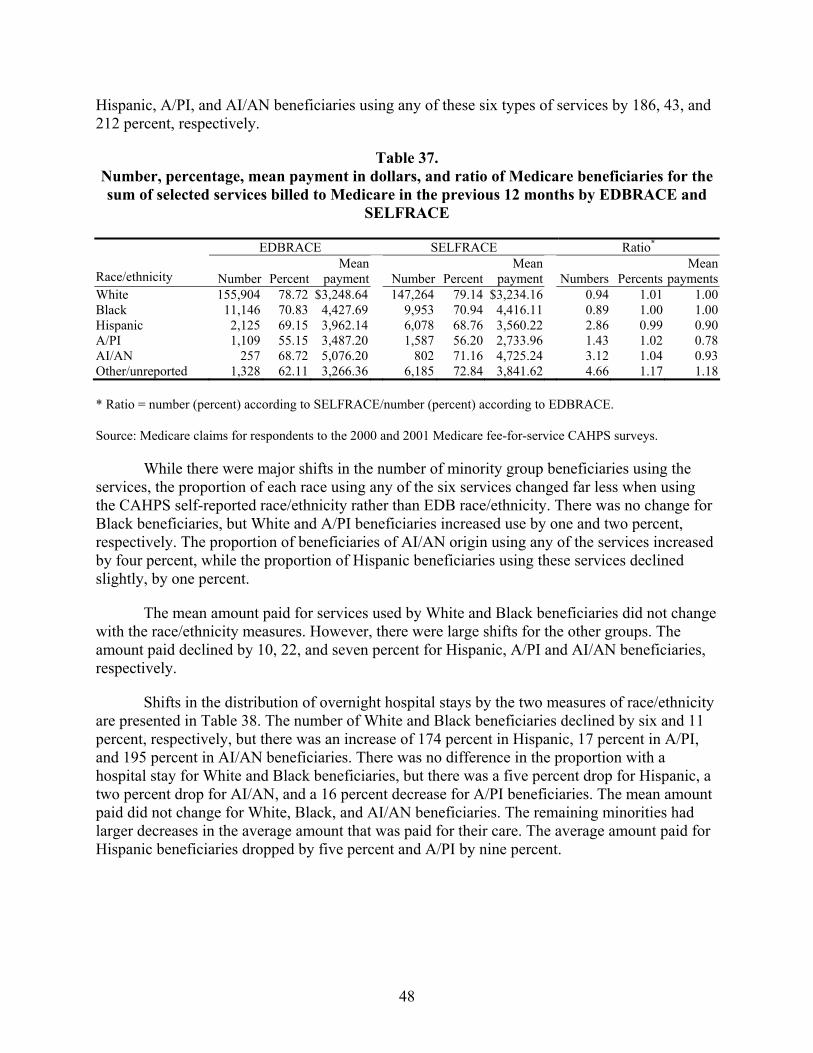
48
Hispanic, A/PI, and AI/AN beneficiaries using any of these six types of services by 186, 43, and 212 percent, respectively.
Table 37. Number, percentage, mean payment in dollars, and ratio of Medicare beneficiaries for the sum of selected services billed to Medicare in the previous 12 months by EDBRACE and
SELFRACE
EDBRACE SELFRACE Ratio*
Race/ethnicity Number Percent Mean
payment Number PercentMean
payment Numbers PercentsMean
paymentsWhite 155,904 78.72 $3,248.64 147,264 79.14 $3,234.16 0.94 1.01 1.00Black 11,146 70.83 4,427.69 9,953 70.94 4,416.11 0.89 1.00 1.00Hispanic 2,125 69.15 3,962.14 6,078 68.76 3,560.22 2.86 0.99 0.90A/PI 1,109 55.15 3,487.20 1,587 56.20 2,733.96 1.43 1.02 0.78AI/AN 257 68.72 5,076.20 802 71.16 4,725.24 3.12 1.04 0.93Other/unreported 1,328 62.11 3,266.36 6,185 72.84 3,841.62 4.66 1.17 1.18
* Ratio = number (percent) according to SELFRACE/number (percent) according to EDBRACE.
Source: Medicare claims for respondents to the 2000 and 2001 Medicare fee-for-service CAHPS surveys.
While there were major shifts in the number of minority group beneficiaries using the services, the proportion of each race using any of the six services changed far less when using the CAHPS self-reported race/ethnicity rather than EDB race/ethnicity. There was no change for Black beneficiaries, but White and A/PI beneficiaries increased use by one and two percent, respectively. The proportion of beneficiaries of AI/AN origin using any of the services increased by four percent, while the proportion of Hispanic beneficiaries using these services declined slightly, by one percent.
The mean amount paid for services used by White and Black beneficiaries did not change with the race/ethnicity measures. However, there were large shifts for the other groups. The amount paid declined by 10, 22, and seven percent for Hispanic, A/PI and AI/AN beneficiaries, respectively.
Shifts in the distribution of overnight hospital stays by the two measures of race/ethnicity are presented in Table 38. The number of White and Black beneficiaries declined by six and 11 percent, respectively, but there was an increase of 174 percent in Hispanic, 17 percent in A/PI, and 195 percent in AI/AN beneficiaries. There was no difference in the proportion with a hospital stay for White and Black beneficiaries, but there was a five percent drop for Hispanic, a two percent drop for AI/AN, and a 16 percent decrease for A/PI beneficiaries. The mean amount paid did not change for White, Black, and AI/AN beneficiaries. The remaining minorities had larger decreases in the average amount that was paid for their care. The average amount paid for Hispanic beneficiaries dropped by five percent and A/PI by nine percent.
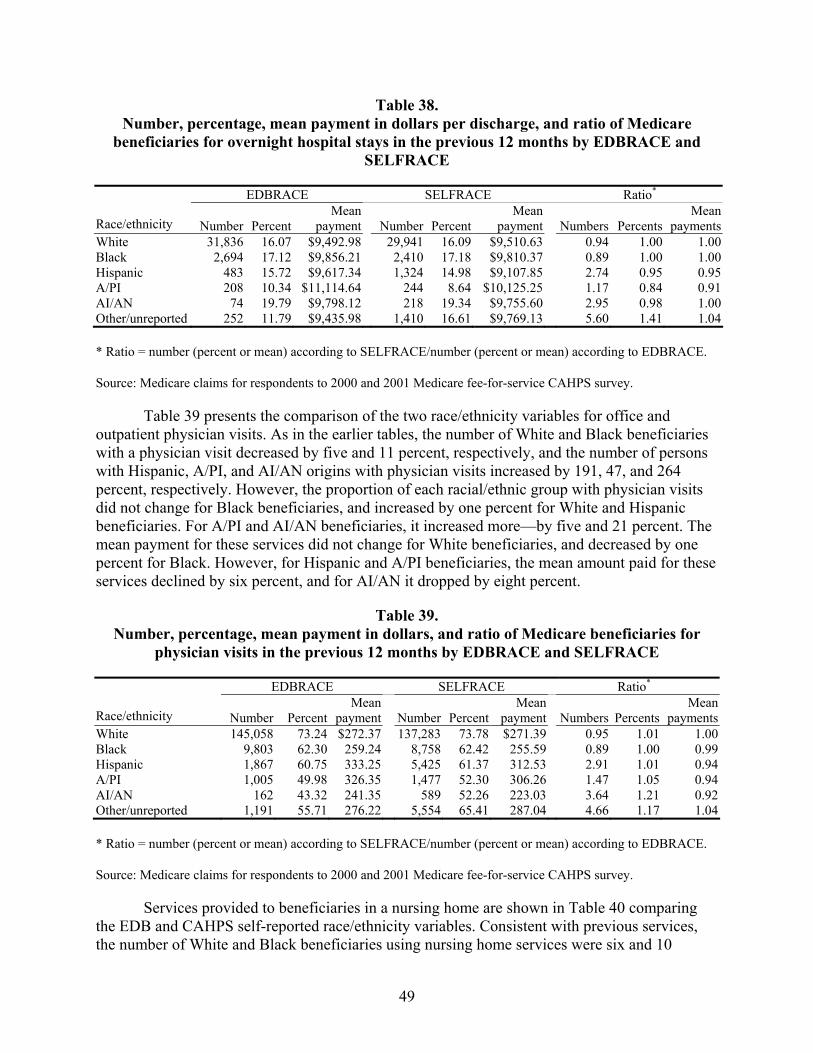
49
Table 38. Number, percentage, mean payment in dollars per discharge, and ratio of Medicare
beneficiaries for overnight hospital stays in the previous 12 months by EDBRACE and SELFRACE
EDBRACE SELFRACE Ratio*
Race/ethnicity Number Percent Mean
payment Number PercentMean
payment Numbers PercentsMean
paymentsWhite 31,836 16.07 $9,492.98 29,941 16.09 $9,510.63 0.94 1.00 1.00Black 2,694 17.12 $9,856.21 2,410 17.18 $9,810.37 0.89 1.00 1.00Hispanic 483 15.72 $9,617.34 1,324 14.98 $9,107.85 2.74 0.95 0.95A/PI 208 10.34 $11,114.64 244 8.64 $10,125.25 1.17 0.84 0.91AI/AN 74 19.79 $9,798.12 218 19.34 $9,755.60 2.95 0.98 1.00Other/unreported 252 11.79 $9,435.98 1,410 16.61 $9,769.13 5.60 1.41 1.04
* Ratio = number (percent or mean) according to SELFRACE/number (percent or mean) according to EDBRACE.
Source: Medicare claims for respondents to 2000 and 2001 Medicare fee-for-service CAHPS survey.
Table 39 presents the comparison of the two race/ethnicity variables for office and outpatient physician visits. As in the earlier tables, the number of White and Black beneficiaries with a physician visit decreased by five and 11 percent, respectively, and the number of persons with Hispanic, A/PI, and AI/AN origins with physician visits increased by 191, 47, and 264 percent, respectively. However, the proportion of each racial/ethnic group with physician visits did not change for Black beneficiaries, and increased by one percent for White and Hispanic beneficiaries. For A/PI and AI/AN beneficiaries, it increased more—by five and 21 percent. The mean payment for these services did not change for White beneficiaries, and decreased by one percent for Black. However, for Hispanic and A/PI beneficiaries, the mean amount paid for these services declined by six percent, and for AI/AN it dropped by eight percent.
Table 39. Number, percentage, mean payment in dollars, and ratio of Medicare beneficiaries for
physician visits in the previous 12 months by EDBRACE and SELFRACE
EDBRACE SELFRACE Ratio*
Race/ethnicity Number PercentMean
payment Number PercentMean
payment Numbers PercentsMean
paymentsWhite 145,058 73.24 $272.37 137,283 73.78 $271.39 0.95 1.01 1.00Black 9,803 62.30 259.24 8,758 62.42 255.59 0.89 1.00 0.99Hispanic 1,867 60.75 333.25 5,425 61.37 312.53 2.91 1.01 0.94A/PI 1,005 49.98 326.35 1,477 52.30 306.26 1.47 1.05 0.94AI/AN 162 43.32 241.35 589 52.26 223.03 3.64 1.21 0.92Other/unreported 1,191 55.71 276.22 5,554 65.41 287.04 4.66 1.17 1.04
* Ratio = number (percent or mean) according to SELFRACE/number (percent or mean) according to EDBRACE.
Source: Medicare claims for respondents to 2000 and 2001 Medicare fee-for-service CAHPS survey.
Services provided to beneficiaries in a nursing home are shown in Table 40 comparing the EDB and CAHPS self-reported race/ethnicity variables. Consistent with previous services, the number of White and Black beneficiaries using nursing home services were six and 10
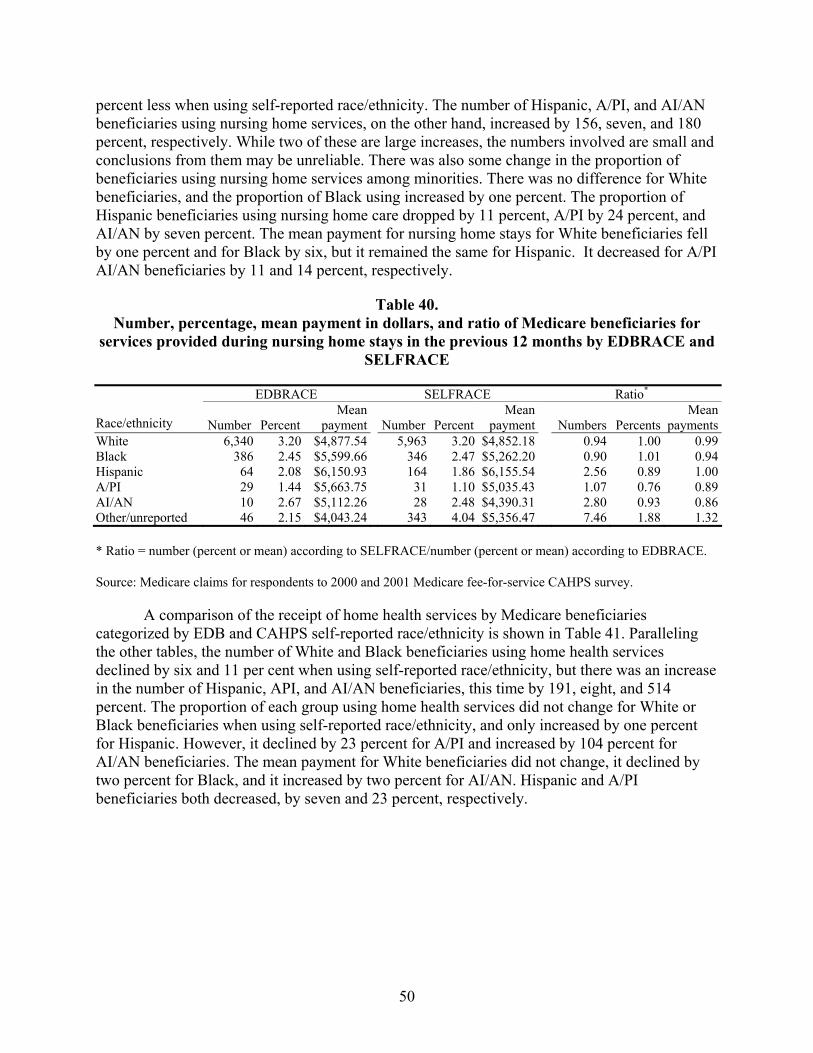
50
percent less when using self-reported race/ethnicity. The number of Hispanic, A/PI, and AI/AN beneficiaries using nursing home services, on the other hand, increased by 156, seven, and 180 percent, respectively. While two of these are large increases, the numbers involved are small and conclusions from them may be unreliable. There was also some change in the proportion of beneficiaries using nursing home services among minorities. There was no difference for White beneficiaries, and the proportion of Black using increased by one percent. The proportion of Hispanic beneficiaries using nursing home care dropped by 11 percent, A/PI by 24 percent, and AI/AN by seven percent. The mean payment for nursing home stays for White beneficiaries fell by one percent and for Black by six, but it remained the same for Hispanic. It decreased for A/PI AI/AN beneficiaries by 11 and 14 percent, respectively.
Table 40. Number, percentage, mean payment in dollars, and ratio of Medicare beneficiaries for
services provided during nursing home stays in the previous 12 months by EDBRACE and SELFRACE
EDBRACE SELFRACE Ratio*
Race/ethnicity Number Percent Mean
payment Number PercentMean
payment Numbers PercentsMean
paymentsWhite 6,340 3.20 $4,877.54 5,963 3.20 $4,852.18 0.94 1.00 0.99Black 386 2.45 $5,599.66 346 2.47 $5,262.20 0.90 1.01 0.94Hispanic 64 2.08 $6,150.93 164 1.86 $6,155.54 2.56 0.89 1.00A/PI 29 1.44 $5,663.75 31 1.10 $5,035.43 1.07 0.76 0.89AI/AN 10 2.67 $5,112.26 28 2.48 $4,390.31 2.80 0.93 0.86Other/unreported 46 2.15 $4,043.24 343 4.04 $5,356.47 7.46 1.88 1.32
* Ratio = number (percent or mean) according to SELFRACE/number (percent or mean) according to EDBRACE.
Source: Medicare claims for respondents to 2000 and 2001 Medicare fee-for-service CAHPS survey.
A comparison of the receipt of home health services by Medicare beneficiaries categorized by EDB and CAHPS self-reported race/ethnicity is shown in Table 41. Paralleling the other tables, the number of White and Black beneficiaries using home health services declined by six and 11 per cent when using self-reported race/ethnicity, but there was an increase in the number of Hispanic, API, and AI/AN beneficiaries, this time by 191, eight, and 514 percent. The proportion of each group using home health services did not change for White or Black beneficiaries when using self-reported race/ethnicity, and only increased by one percent for Hispanic. However, it declined by 23 percent for A/PI and increased by 104 percent for AI/AN beneficiaries. The mean payment for White beneficiaries did not change, it declined by two percent for Black, and it increased by two percent for AI/AN. Hispanic and A/PI beneficiaries both decreased, by seven and 23 percent, respectively.
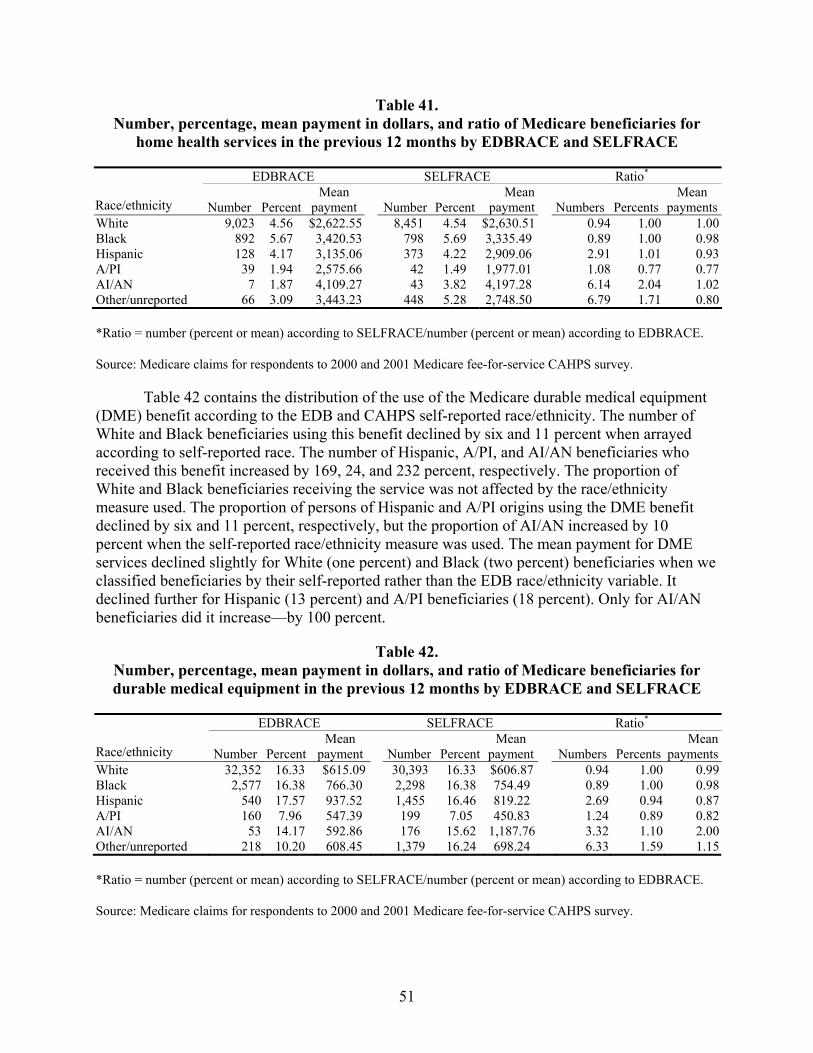
51
Table 41. Number, percentage, mean payment in dollars, and ratio of Medicare beneficiaries for
home health services in the previous 12 months by EDBRACE and SELFRACE
EDBRACE SELFRACE Ratio*
Race/ethnicity Number Percent Mean
payment Number PercentMean
payment Numbers PercentsMean
paymentsWhite 9,023 4.56 $2,622.55 8,451 4.54 $2,630.51 0.94 1.00 1.00Black 892 5.67 3,420.53 798 5.69 3,335.49 0.89 1.00 0.98Hispanic 128 4.17 3,135.06 373 4.22 2,909.06 2.91 1.01 0.93A/PI 39 1.94 2,575.66 42 1.49 1,977.01 1.08 0.77 0.77AI/AN 7 1.87 4,109.27 43 3.82 4,197.28 6.14 2.04 1.02Other/unreported 66 3.09 3,443.23 448 5.28 2,748.50 6.79 1.71 0.80
*Ratio = number (percent or mean) according to SELFRACE/number (percent or mean) according to EDBRACE.
Source: Medicare claims for respondents to 2000 and 2001 Medicare fee-for-service CAHPS survey.
Table 42 contains the distribution of the use of the Medicare durable medical equipment (DME) benefit according to the EDB and CAHPS self-reported race/ethnicity. The number of White and Black beneficiaries using this benefit declined by six and 11 percent when arrayed according to self-reported race. The number of Hispanic, A/PI, and AI/AN beneficiaries who received this benefit increased by 169, 24, and 232 percent, respectively. The proportion of White and Black beneficiaries receiving the service was not affected by the race/ethnicity measure used. The proportion of persons of Hispanic and A/PI origins using the DME benefit declined by six and 11 percent, respectively, but the proportion of AI/AN increased by 10 percent when the self-reported race/ethnicity measure was used. The mean payment for DME services declined slightly for White (one percent) and Black (two percent) beneficiaries when we classified beneficiaries by their self-reported rather than the EDB race/ethnicity variable. It declined further for Hispanic (13 percent) and A/PI beneficiaries (18 percent). Only for AI/AN beneficiaries did it increase—by 100 percent.
Table 42. Number, percentage, mean payment in dollars, and ratio of Medicare beneficiaries for durable medical equipment in the previous 12 months by EDBRACE and SELFRACE
EDBRACE SELFRACE Ratio*
Race/ethnicity Number Percent Mean
payment Number PercentMean
payment Numbers PercentsMean
paymentsWhite 32,352 16.33 $615.09 30,393 16.33 $606.87 0.94 1.00 0.99Black 2,577 16.38 766.30 2,298 16.38 754.49 0.89 1.00 0.98Hispanic 540 17.57 937.52 1,455 16.46 819.22 2.69 0.94 0.87A/PI 160 7.96 547.39 199 7.05 450.83 1.24 0.89 0.82AI/AN 53 14.17 592.86 176 15.62 1,187.76 3.32 1.10 2.00Other/unreported 218 10.20 608.45 1,379 16.24 698.24 6.33 1.59 1.15
*Ratio = number (percent or mean) according to SELFRACE/number (percent or mean) according to EDBRACE.
Source: Medicare claims for respondents to 2000 and 2001 Medicare fee-for-service CAHPS survey.
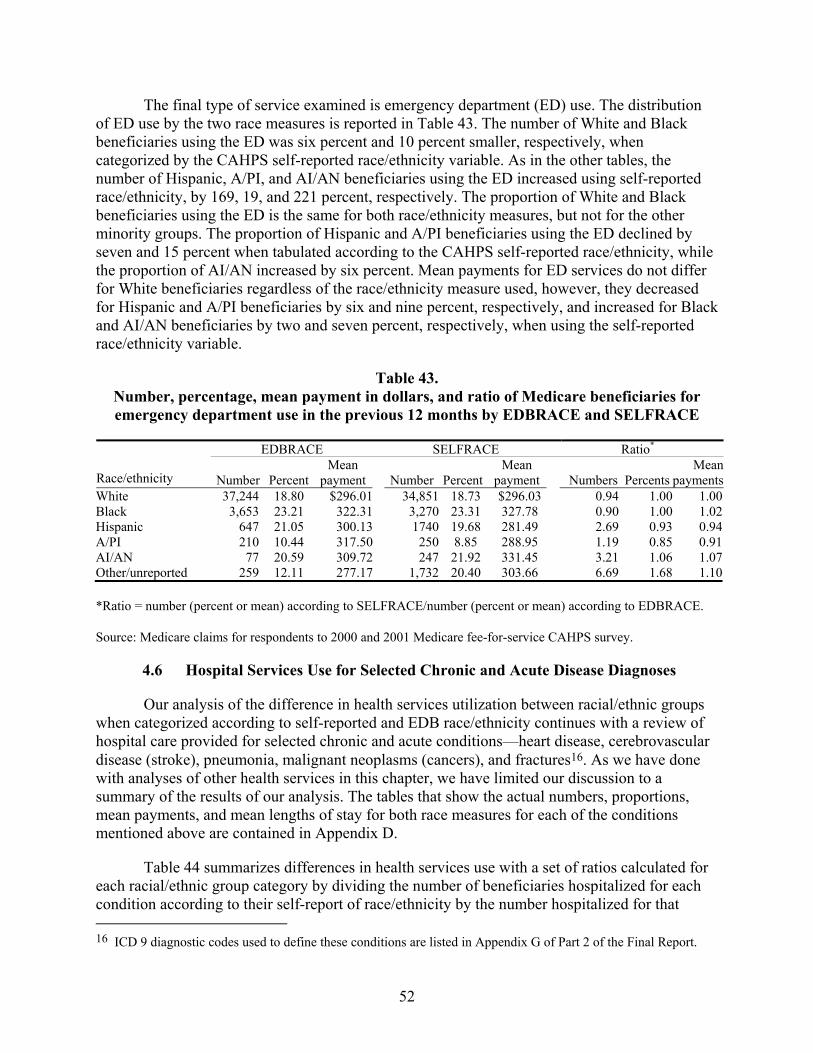
52
The final type of service examined is emergency department (ED) use. The distribution of ED use by the two race measures is reported in Table 43. The number of White and Black beneficiaries using the ED was six percent and 10 percent smaller, respectively, when categorized by the CAHPS self-reported race/ethnicity variable. As in the other tables, the number of Hispanic, A/PI, and AI/AN beneficiaries using the ED increased using self-reported race/ethnicity, by 169, 19, and 221 percent, respectively. The proportion of White and Black beneficiaries using the ED is the same for both race/ethnicity measures, but not for the other minority groups. The proportion of Hispanic and A/PI beneficiaries using the ED declined by seven and 15 percent when tabulated according to the CAHPS self-reported race/ethnicity, while the proportion of AI/AN increased by six percent. Mean payments for ED services do not differ for White beneficiaries regardless of the race/ethnicity measure used, however, they decreased for Hispanic and A/PI beneficiaries by six and nine percent, respectively, and increased for Black and AI/AN beneficiaries by two and seven percent, respectively, when using the self-reported race/ethnicity variable.
Table 43. Number, percentage, mean payment in dollars, and ratio of Medicare beneficiaries for emergency department use in the previous 12 months by EDBRACE and SELFRACE
EDBRACE SELFRACE Ratio*
Race/ethnicity Number Percent Mean
payment Number PercentMean
payment Numbers PercentsMean
paymentsWhite 37,244 18.80 $296.01 34,851 18.73 $296.03 0.94 1.00 1.00Black 3,653 23.21 322.31 3,270 23.31 327.78 0.90 1.00 1.02Hispanic 647 21.05 300.13 1740 19.68 281.49 2.69 0.93 0.94A/PI 210 10.44 317.50 250 8.85 288.95 1.19 0.85 0.91AI/AN 77 20.59 309.72 247 21.92 331.45 3.21 1.06 1.07Other/unreported 259 12.11 277.17 1,732 20.40 303.66 6.69 1.68 1.10
*Ratio = number (percent or mean) according to SELFRACE/number (percent or mean) according to EDBRACE.
Source: Medicare claims for respondents to 2000 and 2001 Medicare fee-for-service CAHPS survey.
4.6 Hospital Services Use for Selected Chronic and Acute Disease Diagnoses
Our analysis of the difference in health services utilization between racial/ethnic groups when categorized according to self-reported and EDB race/ethnicity continues with a review of hospital care provided for selected chronic and acute conditions—heart disease, cerebrovascular disease (stroke), pneumonia, malignant neoplasms (cancers), and fractures16. As we have done with analyses of other health services in this chapter, we have limited our discussion to a summary of the results of our analysis. The tables that show the actual numbers, proportions, mean payments, and mean lengths of stay for both race measures for each of the conditions mentioned above are contained in Appendix D.
Table 44 summarizes differences in health services use with a set of ratios calculated for each racial/ethnic group category by dividing the number of beneficiaries hospitalized for each condition according to their self-report of race/ethnicity by the number hospitalized for that 16 ICD 9 diagnostic codes used to define these conditions are listed in Appendix G of Part 2 of the Final Report.
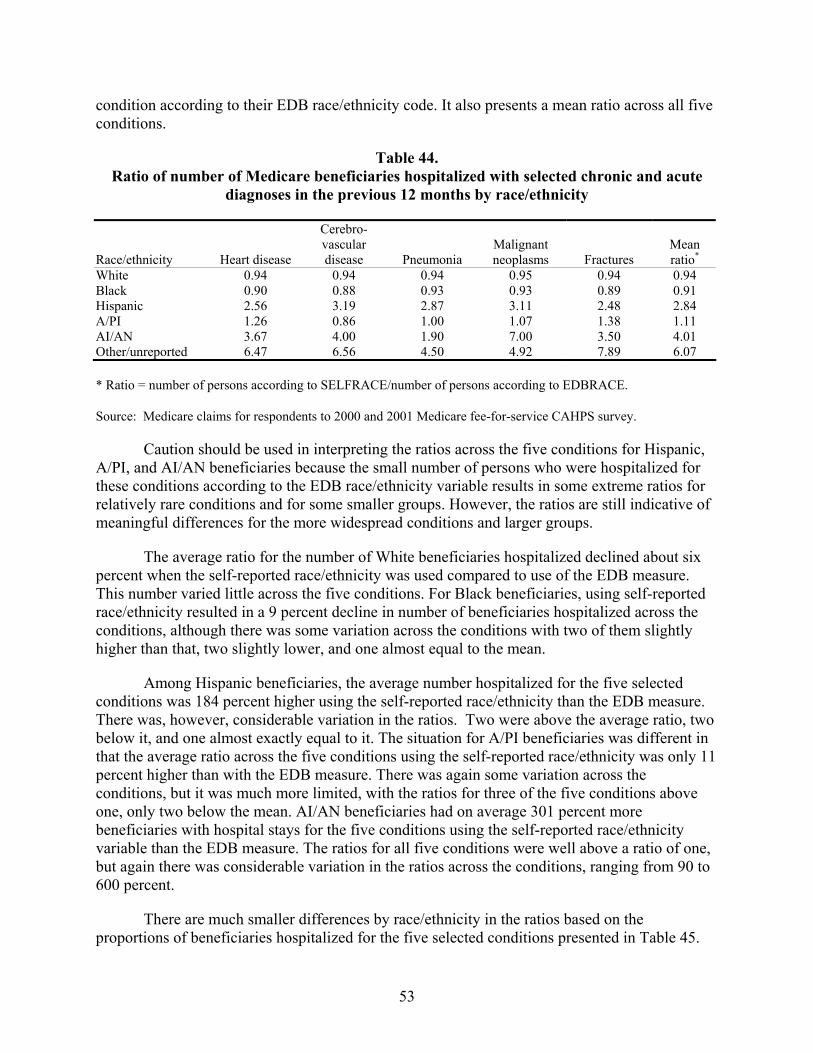
53
condition according to their EDB race/ethnicity code. It also presents a mean ratio across all five conditions.
Table 44. Ratio of number of Medicare beneficiaries hospitalized with selected chronic and acute
diagnoses in the previous 12 months by race/ethnicity
Race/ethnicity Heart disease
Cerebro- vascular disease Pneumonia
Malignant neoplasms Fractures
Mean ratio*
White 0.94 0.94 0.94 0.95 0.94 0.94 Black 0.90 0.88 0.93 0.93 0.89 0.91 Hispanic 2.56 3.19 2.87 3.11 2.48 2.84 A/PI 1.26 0.86 1.00 1.07 1.38 1.11 AI/AN 3.67 4.00 1.90 7.00 3.50 4.01 Other/unreported 6.47 6.56 4.50 4.92 7.89 6.07
* Ratio = number of persons according to SELFRACE/number of persons according to EDBRACE.
Source: Medicare claims for respondents to 2000 and 2001 Medicare fee-for-service CAHPS survey.
Caution should be used in interpreting the ratios across the five conditions for Hispanic, A/PI, and AI/AN beneficiaries because the small number of persons who were hospitalized for these conditions according to the EDB race/ethnicity variable results in some extreme ratios for relatively rare conditions and for some smaller groups. However, the ratios are still indicative of meaningful differences for the more widespread conditions and larger groups.
The average ratio for the number of White beneficiaries hospitalized declined about six percent when the self-reported race/ethnicity was used compared to use of the EDB measure. This number varied little across the five conditions. For Black beneficiaries, using self-reported race/ethnicity resulted in a 9 percent decline in number of beneficiaries hospitalized across the conditions, although there was some variation across the conditions with two of them slightly higher than that, two slightly lower, and one almost equal to the mean.
Among Hispanic beneficiaries, the average number hospitalized for the five selected conditions was 184 percent higher using the self-reported race/ethnicity than the EDB measure. There was, however, considerable variation in the ratios. Two were above the average ratio, two below it, and one almost exactly equal to it. The situation for A/PI beneficiaries was different in that the average ratio across the five conditions using the self-reported race/ethnicity was only 11 percent higher than with the EDB measure. There was again some variation across the conditions, but it was much more limited, with the ratios for three of the five conditions above one, only two below the mean. AI/AN beneficiaries had on average 301 percent more beneficiaries with hospital stays for the five conditions using the self-reported race/ethnicity variable than the EDB measure. The ratios for all five conditions were well above a ratio of one, but again there was considerable variation in the ratios across the conditions, ranging from 90 to 600 percent.
There are much smaller differences by race/ethnicity in the ratios based on the proportions of beneficiaries hospitalized for the five selected conditions presented in Table 45.
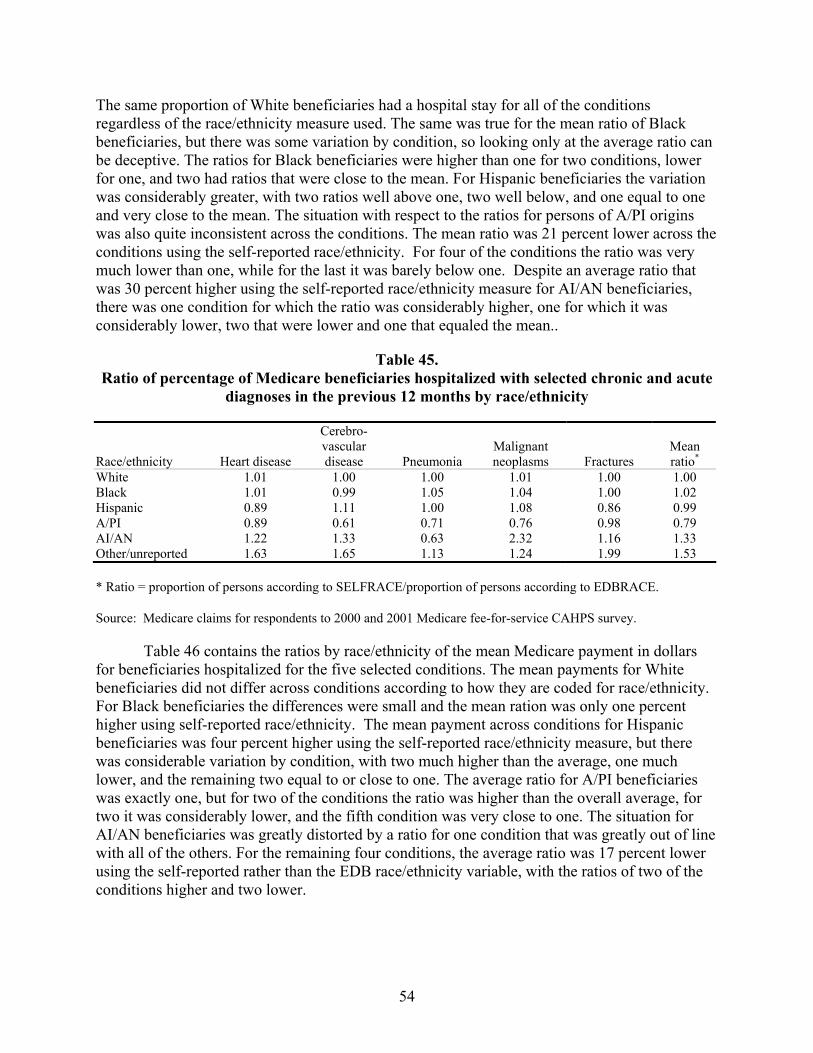
54
The same proportion of White beneficiaries had a hospital stay for all of the conditions regardless of the race/ethnicity measure used. The same was true for the mean ratio of Black beneficiaries, but there was some variation by condition, so looking only at the average ratio can be deceptive. The ratios for Black beneficiaries were higher than one for two conditions, lower for one, and two had ratios that were close to the mean. For Hispanic beneficiaries the variation was considerably greater, with two ratios well above one, two well below, and one equal to one and very close to the mean. The situation with respect to the ratios for persons of A/PI origins was also quite inconsistent across the conditions. The mean ratio was 21 percent lower across the conditions using the self-reported race/ethnicity. For four of the conditions the ratio was very much lower than one, while for the last it was barely below one. Despite an average ratio that was 30 percent higher using the self-reported race/ethnicity measure for AI/AN beneficiaries, there was one condition for which the ratio was considerably higher, one for which it was considerably lower, two that were lower and one that equaled the mean..
Table 45. Ratio of percentage of Medicare beneficiaries hospitalized with selected chronic and acute
diagnoses in the previous 12 months by race/ethnicity
Race/ethnicity Heart disease
Cerebro- vascular disease Pneumonia
Malignant neoplasms Fractures
Mean ratio*
White 1.01 1.00 1.00 1.01 1.00 1.00 Black 1.01 0.99 1.05 1.04 1.00 1.02 Hispanic 0.89 1.11 1.00 1.08 0.86 0.99 A/PI 0.89 0.61 0.71 0.76 0.98 0.79 AI/AN 1.22 1.33 0.63 2.32 1.16 1.33 Other/unreported 1.63 1.65 1.13 1.24 1.99 1.53
* Ratio = proportion of persons according to SELFRACE/proportion of persons according to EDBRACE.
Source: Medicare claims for respondents to 2000 and 2001 Medicare fee-for-service CAHPS survey.
Table 46 contains the ratios by race/ethnicity of the mean Medicare payment in dollars for beneficiaries hospitalized for the five selected conditions. The mean payments for White beneficiaries did not differ across conditions according to how they are coded for race/ethnicity. For Black beneficiaries the differences were small and the mean ration was only one percent higher using self-reported race/ethnicity. The mean payment across conditions for Hispanic beneficiaries was four percent higher using the self-reported race/ethnicity measure, but there was considerable variation by condition, with two much higher than the average, one much lower, and the remaining two equal to or close to one. The average ratio for A/PI beneficiaries was exactly one, but for two of the conditions the ratio was higher than the overall average, for two it was considerably lower, and the fifth condition was very close to one. The situation for AI/AN beneficiaries was greatly distorted by a ratio for one condition that was greatly out of line with all of the others. For the remaining four conditions, the average ratio was 17 percent lower using the self-reported rather than the EDB race/ethnicity variable, with the ratios of two of the conditions higher and two lower.
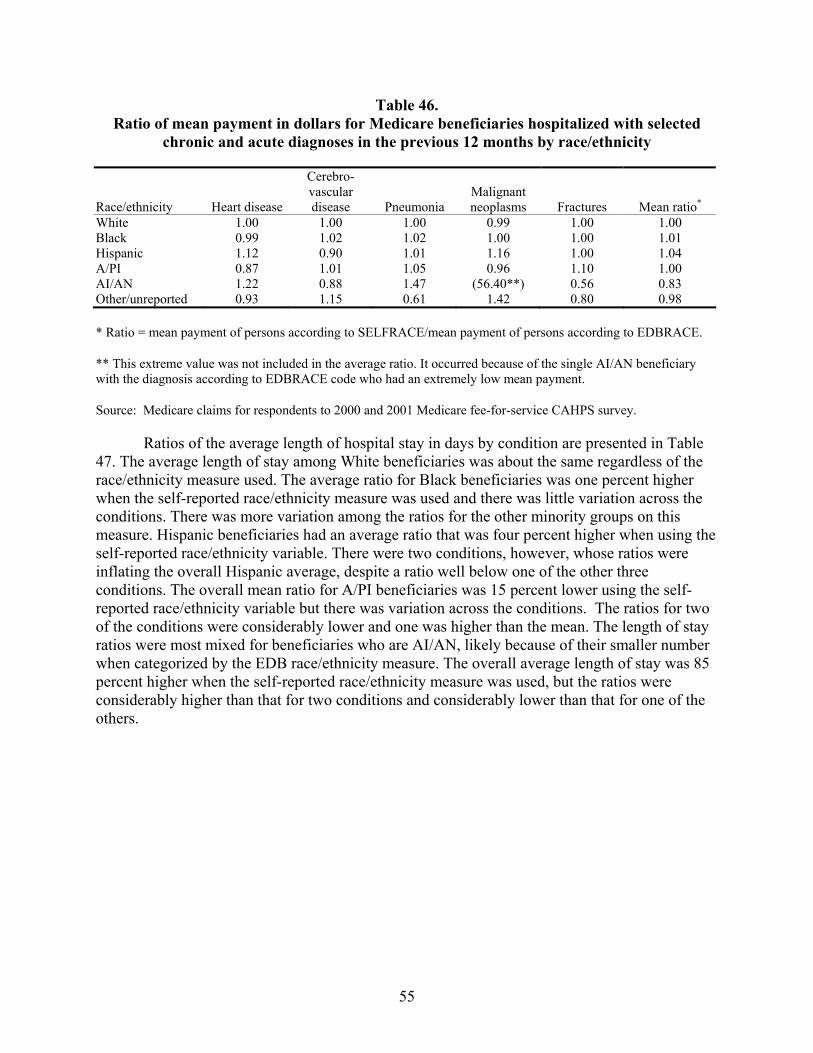
55
Table 46. Ratio of mean payment in dollars for Medicare beneficiaries hospitalized with selected
chronic and acute diagnoses in the previous 12 months by race/ethnicity
Race/ethnicity Heart disease
Cerebro- vascular disease Pneumonia
Malignant neoplasms Fractures Mean ratio*
White 1.00 1.00 1.00 0.99 1.00 1.00 Black 0.99 1.02 1.02 1.00 1.00 1.01 Hispanic 1.12 0.90 1.01 1.16 1.00 1.04 A/PI 0.87 1.01 1.05 0.96 1.10 1.00 AI/AN 1.22 0.88 1.47 (56.40**) 0.56 0.83 Other/unreported 0.93 1.15 0.61 1.42 0.80 0.98
* Ratio = mean payment of persons according to SELFRACE/mean payment of persons according to EDBRACE.
** This extreme value was not included in the average ratio. It occurred because of the single AI/AN beneficiary with the diagnosis according to EDBRACE code who had an extremely low mean payment.
Source: Medicare claims for respondents to 2000 and 2001 Medicare fee-for-service CAHPS survey.
Ratios of the average length of hospital stay in days by condition are presented in Table 47. The average length of stay among White beneficiaries was about the same regardless of the race/ethnicity measure used. The average ratio for Black beneficiaries was one percent higher when the self-reported race/ethnicity measure was used and there was little variation across the conditions. There was more variation among the ratios for the other minority groups on this measure. Hispanic beneficiaries had an average ratio that was four percent higher when using the self-reported race/ethnicity variable. There were two conditions, however, whose ratios were inflating the overall Hispanic average, despite a ratio well below one of the other three conditions. The overall mean ratio for A/PI beneficiaries was 15 percent lower using the self-reported race/ethnicity variable but there was variation across the conditions. The ratios for two of the conditions were considerably lower and one was higher than the mean. The length of stay ratios were most mixed for beneficiaries who are AI/AN, likely because of their smaller number when categorized by the EDB race/ethnicity measure. The overall average length of stay was 85 percent higher when the self-reported race/ethnicity measure was used, but the ratios were considerably higher than that for two conditions and considerably lower than that for one of the others.
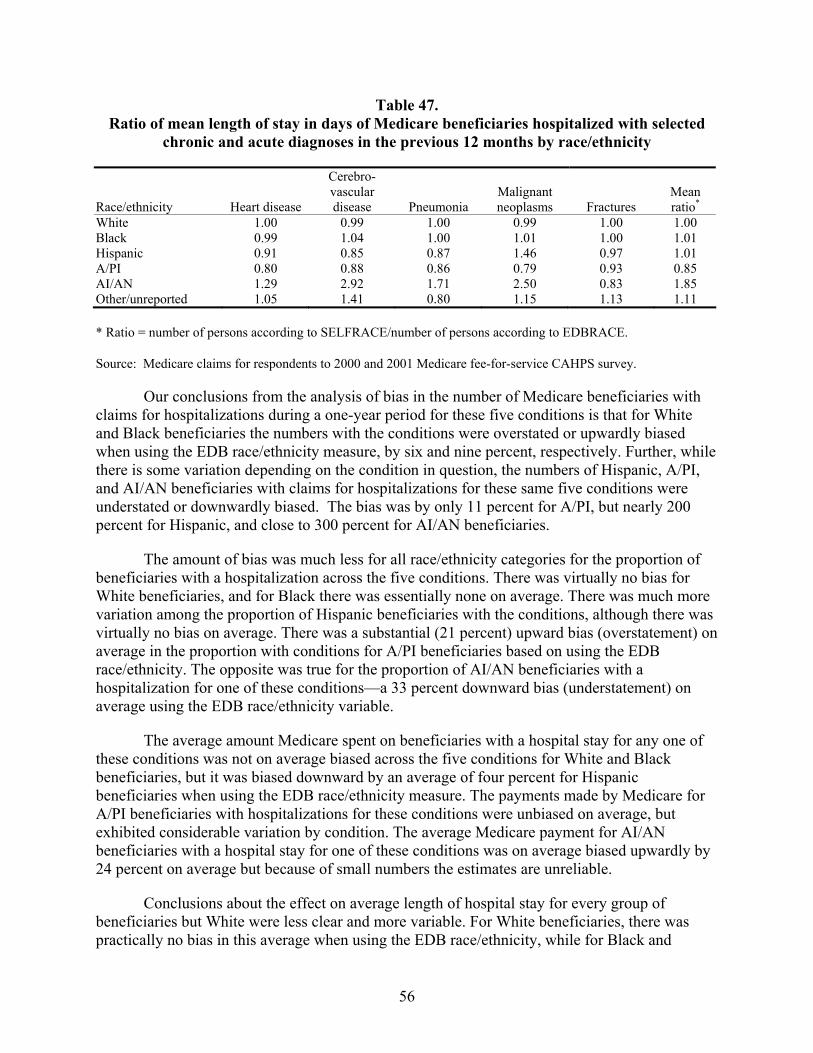
56
Table 47. Ratio of mean length of stay in days of Medicare beneficiaries hospitalized with selected
chronic and acute diagnoses in the previous 12 months by race/ethnicity
Race/ethnicity Heart disease
Cerebro- vascular disease Pneumonia
Malignant neoplasms Fractures
Mean ratio*
White 1.00 0.99 1.00 0.99 1.00 1.00 Black 0.99 1.04 1.00 1.01 1.00 1.01 Hispanic 0.91 0.85 0.87 1.46 0.97 1.01 A/PI 0.80 0.88 0.86 0.79 0.93 0.85 AI/AN 1.29 2.92 1.71 2.50 0.83 1.85 Other/unreported 1.05 1.41 0.80 1.15 1.13 1.11
* Ratio = number of persons according to SELFRACE/number of persons according to EDBRACE.
Source: Medicare claims for respondents to 2000 and 2001 Medicare fee-for-service CAHPS survey.
Our conclusions from the analysis of bias in the number of Medicare beneficiaries with claims for hospitalizations during a one-year period for these five conditions is that for White and Black beneficiaries the numbers with the conditions were overstated or upwardly biased when using the EDB race/ethnicity measure, by six and nine percent, respectively. Further, while there is some variation depending on the condition in question, the numbers of Hispanic, A/PI, and AI/AN beneficiaries with claims for hospitalizations for these same five conditions were understated or downwardly biased. The bias was by only 11 percent for A/PI, but nearly 200 percent for Hispanic, and close to 300 percent for AI/AN beneficiaries.
The amount of bias was much less for all race/ethnicity categories for the proportion of beneficiaries with a hospitalization across the five conditions. There was virtually no bias for White beneficiaries, and for Black there was essentially none on average. There was much more variation among the proportion of Hispanic beneficiaries with the conditions, although there was virtually no bias on average. There was a substantial (21 percent) upward bias (overstatement) on average in the proportion with conditions for A/PI beneficiaries based on using the EDB race/ethnicity. The opposite was true for the proportion of AI/AN beneficiaries with a hospitalization for one of these conditions—a 33 percent downward bias (understatement) on average using the EDB race/ethnicity variable.
The average amount Medicare spent on beneficiaries with a hospital stay for any one of these conditions was not on average biased across the five conditions for White and Black beneficiaries, but it was biased downward by an average of four percent for Hispanic beneficiaries when using the EDB race/ethnicity measure. The payments made by Medicare for A/PI beneficiaries with hospitalizations for these conditions were unbiased on average, but exhibited considerable variation by condition. The average Medicare payment for AI/AN beneficiaries with a hospital stay for one of these conditions was on average biased upwardly by 24 percent on average but because of small numbers the estimates are unreliable.
Conclusions about the effect on average length of hospital stay for every group of beneficiaries but White were less clear and more variable. For White beneficiaries, there was practically no bias in this average when using the EDB race/ethnicity, while for Black and
57
Hispanic, there was upward and downward bias depending on the conditions, but on average it was relatively unbiased. There was clearly an upward bias with respect to the average length of stay in the hospital using the EDB race/ethnicity code for A/PI beneficiaries. It was the opposite for AI/AN; the average length of stay was typically understated using the EDB race/ethnicity measure by 85 percent on average, but the amount differed considerably by condition.

59
CHAPTER 5 ADDING GEOGRAPHIC-BASED CENSUS MEASURES OF SOCIO-ECONOMIC
STATUS (SES) TO THE EDB
5.1 Introduction
This chapter of the report describes the work performed on a task that was added to this project after the project had begun. It was described as a data processing modification to the contract, the purpose of which was to obtain socioeconomic status (SES) indicators for Medicare beneficiaries’ residential areas. No SES measures at the person level are currently available as part of the Medicare enrollment database (EDB). Despite the obvious limitations and errors inherent in using residential area rather than person-level measures of SES, it was the only real option available to us on this project for obtaining SES measures. Having such measures as covariates is critical to analyses of racial/ethnic disparities in health care utilization to separate the impact on access and use of socioeconomic status considerations from those effects expected to be associated primarily with race/ethnicity. The objective of this task, therefore, was to identify socioeconomic indicators available from the 2000 U.S. Census that could be linked to the residential addresses of Medicare beneficiaries listed in the mid-2003 EDB so these data could be used as covariates to control on the effects of socioeconomic status in analyses of racial/ethnic disparities, alongside the person-level variables available in the EDB.
5.2 Development of an Approach to Geocode Beneficiary Addresses to Link SES Data from the Census to the Medicare Beneficiaries in the EDB
Geocoding refers to the process of assigning a code number to each Medicare beneficiary’s address that allows it to be linked to the U.S. Census data that describes characteristics of the beneficiary’s place of residence. The primary reason to geocode the addresses of Medicare beneficiaries in the EDB is to enable the association of geographic-based U.S. Census measures of socioeconomic status (SES) with the beneficiaries. While U.S. Census SES measures are not individual-level measures, they can be aggregated to specified geographic units, such as the census block, block group, tract, county, or state, which are associated with every beneficiary. For example, a block group-level file containing a variable for median household income would have one record for each block group, and would contain the following fields:
• A “key” variable serving as the unique identifier for each record. This key would consist of a string of federal information processing standards (FIPS) codes identifying the state, county, census tract, and block group of each record.
• An income variable indicating the median household income (in dollars) for each block group.
The details of Census geography and related data elements are described more fully further in this chapter. Much more detailed information on Census geography can be found in the Geographic Area Reference Manual http://www.census.gov/geo/www/garm.html .
In the remainder of this chapter, we will discuss the following topics:
60
• Address preparation
• The GeoCode program process
• Final data file creation
5.2.1 Address Cleaning
In order to link the beneficiaries in the EDB to the Census information available for the beneficiaries’ residential area, there must be something in common on both records. The U.S. Census data is identified by a federal information processing standard (FIPS) code that can identify values for areas as small as blocks and block groups for the SES data in which were interested. The beneficiary’s residential area on the other hand is identified by an address. We needed some mechanism for efficiently translating the addresses in the EDB to FIPS codes that corresponded to those in the Census. We obtained a computer database product from GeoLytics Incorporated of East Brunswick, New Jersey – GeoCode program 2003 Version 1.02 – that was promoted by the manufacturer as being able to correctly assign FIPS codes to the level of Census blocks to addresses that were read into it.
Address information on Medicare beneficiaries is stored in the EDB in six address fields, each with a length of 22 characters. These address fields are generic, and labeled ADDRESS1, ADDRESS2, etc., and thus there is the potential for great variation in the type and order of information contained within the address fields. Upon examination, it appeared that the six fields were simply filled from left to right with whatever information had been collected about the beneficiary’s address. The one exception was the beneficiary’s zip code, which was always stored in the RESZIP field. However, the GeoLytics GeoCode program product requires that the beneficiaries’ address input files be formatted in the following way:
STREET, CITY, STATE ZIP
The GeoCode program requires that STREET contains the street number and street name, separated by a space, with street name followed by a comma; then city followed by a comma, and then the two-letter state postal abbreviation code, a space, and the five digit zip code. It was a challenge and extremely time-consuming to extract, validate, and format these four pieces of information from the EDB address fields so they could be used as input for the GeoCode program. To meet this challenge, we developed the following procedures to apply to the EDB records:
1. Identify, for each beneficiary, what information is contained in each EDB address field
2. Extract the necessary information from the address fields, and create separate street, city, state, and zip code variables.
3. Verify that street, city, and state variables contain the information they are supposed to, check that the information is in the correct format, and, if not, put it in the correct format.
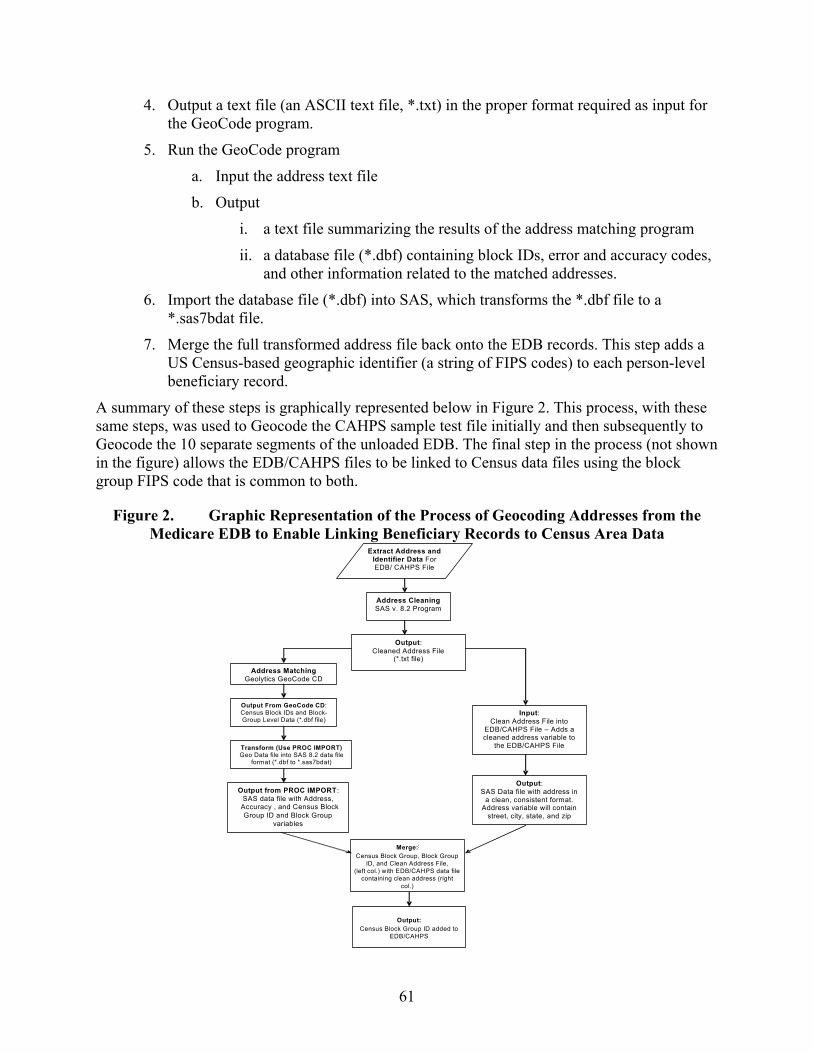
61
4. Output a text file (an ASCII text file, *.txt) in the proper format required as input for the GeoCode program.
5. Run the GeoCode program
a. Input the address text file
b. Output
i. a text file summarizing the results of the address matching program
ii. a database file (*.dbf) containing block IDs, error and accuracy codes, and other information related to the matched addresses.
6. Import the database file (*.dbf) into SAS, which transforms the *.dbf file to a *.sas7bdat file.
7. Merge the full transformed address file back onto the EDB records. This step adds a US Census-based geographic identifier (a string of FIPS codes) to each person-level beneficiary record.
A summary of these steps is graphically represented below in Figure 2. This process, with these same steps, was used to Geocode the CAHPS sample test file initially and then subsequently to Geocode the 10 separate segments of the unloaded EDB. The final step in the process (not shown in the figure) allows the EDB/CAHPS files to be linked to Census data files using the block group FIPS code that is common to both.
Figure 2. Graphic Representation of the Process of Geocoding Addresses from the Medicare EDB to Enable Linking Beneficiary Records to Census Area Data
Extract Address andIdentifier Data ForEDB/ CAHPS File
Address CleaningSAS v. 8.2 Program
Address MatchingGeolytics GeoCode CD
Transform (Use PROC IMPORT)Geo Data file into SAS 8.2 data file
format (*.dbf to *.sas7bdat)
Input:Clean Address File into
EDB/CAHPS File – Adds acleaned address variable to
the EDB/CAHPS File
Merge:Census Block Group, Block Group
ID, and Clean Address File,(left col.) with EDB/CAHPS data file
containing clean address (rightcol.)
:
Output From GeoCode CD:Census Block IDs and Block-Group Level Data (*.dbf file)
Output:SAS Data file with address in
a clean, consistent format.Address variable will contain
street, city, state, and zip
Output from PROC IMPORT :SAS data file with Address,
Accuracy , and Census BlockGroup ID and Block Group
variables
Output:Cleaned Address File
(*.txt file)
Output:Census Block Group ID added to
EDB/CAHPS
62
We could not perform all of the necessary address preparation and verification activities manually on all 41 million-plus beneficiaries in the EDB because the sheer number of beneficiaries. Instead, we determined that we would use a random sample of addresses to identify patterns present in the beneficiaries’ addresses in the EDB. Thus, we took a smaller batch of EDB records, specifically those EDB records corresponding to the 830,728 beneficiaries who responded to the CAHPS surveys we used earlier (to develop the algorithm to improve on the EDB race/ethnicity coding) to identify the various data patterns exhibited in the EDB address fields. We developed SAS programs to extract, format, and validate the address information we needed, and then tested the performance of the GeoCode program. The following are the steps we performed to get the addresses from the EDB in good enough shape to run through the GeoCode program.
Identify and extract the information in each address field. EDB address fields could potentially follow many different patterns, and some did contain a good deal of superfluous or invalid information. Fortunately, the majority of records did follow a standard pattern:
• ADDRESS1 contained the beneficiary’s street address – both the street number and the street name. In some cases, this field also contained a direction (e.g., “East 1st Street,” or “E 1st Street,” or “1st Street E”), and/or an apartment number. 17
• ADDRESS2 contained either:
• the beneficiary’s city and state of residence, or
• the beneficiary’s apartment number
• ADDRESS3, in cases where the ADDRESS2 field contained the apartment number or the like, contained the beneficiary’s city and state of residence.
• The last field with non-missing data typically contained the city and state of residence. So, in most cases, address fields 4, 5, and 6 were blank; a lesser number of cases had a blank for address field 3 as well.
The SAS program we wrote set the variable STREET equal to the EDB address field that should contain the street address (typically ADDRESS1). It also extracted separate CITY and STATE variables from the EDB address field that contained the city and state.
The RESZIP field in the EDB data contains the 9-digit Zip code. The SAS program dropped the last four digits of the EDB RESZIP variable, and created a new variable with the 5-digit Zip code (ZIP).
Verify the values and formats of STREET, CITY, and STATE. The first part of this step is completed prior to running addresses through the GeoCode program search engine. To
17 There are also several analogues to apartment number that appear in address fields, including suite number, lot
number (in the case of mobile home parks), unit number, etc.
63
verify that STREET and STATE contain the correct data, the SAS program checked for two things:
1. That the string of characters contained in the new variable, STREET, actually started with a number. This does not provide 100 percent verification, as it is possible for the string of characters contained in the variable STREET to start with a number, but not be an actual street address. However, this step does help ensure that STREET contains a street address.
2. That the string we identified as the state of residence (the new variable, STATE) was a valid two letter state postal abbreviation.
At this point, the STATE and ZIP variables were considered finalized. The remainder of the SAS algorithm focused on cleaning the STREET variable and ensuring that it was in the proper format. Before cleaning STREET, we dropped any cases where the GeoCode program would be unable to make a match, and for which we could obtain a match simply by reformatting the data. Dropped were addresses where:
• The street address was missing
• The beneficiary’s state was invalid (as indicated by an invalid two letter state postal abbreviation which was often a foreign country), or they lived in Puerto Rico18
• If the beneficiary’s address was a rural route, an RFD, a P.O. Box, or Box number
For the remaining cases, CITY appeared to be relatively clean, and we did not attempt to reformat or validate that particular variable subsequent to dropping the cases listed above. Approximately 12.5 percent of the EDB records were dropped by this point, leaving us with about 87.5 percent of the records to which we applied further cleaning algorithms.
At this point, we began an iterative process of running small samples of the Medicare CAHPS survey addresses through the GeoCode address-matching process, identifying format-related problems in the street address field, and developing SAS code to repair the problems. Based on this testing process, we developed a series of six19 “fixes,” all of which were targeted to reformat specific anomalies that occurred regularly in the street address field. These fixes made repairs related to three basic elements of a street address that caused the address matching program to fail to find a valid match for what is a valid address:
1. Street address fields sometimes contained apartment, suite, lot, or unit numbers. While these are valid for mailing, the GeoCode program will return an error (i.e., “street not found”) on an address containing one of these numbers. The first “fix” applied to the EDB address removed the apartment number (or analogue) out of the
18 The GeoCode program does not match addresses in Puerto Rico.
19 The “fixes” were numbered according to the order in which they were developed. However, the order in which they were applied in the SAS programs does not follow this numbering. Some fixes developed later (Fix 5, for example) had to be applied before earlier fixes.
64
STREET field. This fix cleared the path for the subsequent five fixes that were applied to the STREET field.
2. In cases where the street NAME was actually a number (e.g., 25th Street, 1st Avenue, etc.), the Geocode program failed to find a valid match for the street if the suffix was missing from the numbered street. The suffix was almost always missing in the EDB address fields. We tested the suffix problem manually, and found that the simple addition of a suffix could, in many cases, turn a null match into an exact match. Numerical street names appear in a variety of patterns in the STREET variable, and four out of the five remaining fixes were designed to detect these patterns, and make the appropriate changes.
3. In some records, the street address contained what appeared to be a double street number – one 2- or 3-digit number, followed by a space, then another 2- or 3-digit number. We discovered that in some places, particularly Queens, NY, the space needs to be replaced by a dash. In other places, however, it is unclear if the double number with a space is valid, or if the space should be deleted. In those cases, the double number was left as is.
For each fix, the SAS program outputs a text file listing, for each “fixed” record, the Medicare beneficiary’s HIC number, the observation number, the address in it’s original, “pre-fixed” format, the pattern of the new format, and the actual “fixed” address. This allowed us to check that the fix actually did what we expected it to, and it provides a record of the difference between the old addresses and the new addresses.
Output corrected addresses. The SAS program uses the PUT statement in conjunction with the FILE statement to output a single ASCII text file (*.txt) of addresses in the STREET, CITY, STATE ZIP format. This file contains all of the addresses that have been cleaned (100 percent of the records that were run through the fixes, or about 87.5 percent of the total number of beneficiary records). During testing we started with a CAHPS-matched EDB file with 830,728 records, which was reduced to 760,961 after the first stage of the SAS program was run.
5.2.2 Running the GeoCode program
In testing the GeoCode program, we discovered that the program had a tendency for erratic performance. The help staff at GeoLytics seemed unable to explain the variations in performance. The primary problem was due to a lookup error—“failure to open data member” (eFOM). Between two and six percent of addresses we tested returned this error. Upon examination, we could not find any syntax errors that prevented these records from being successfully coded, and the technical support people at GeoLytics could not explain why these errors were occurring. However, we found that when we ran the addresses receiving the eFOM error code back through the GeoCode program a second time by themselves, they were matched at a 100 percent success rate.
The GeoLytics GeoCode program product allows the user to choose a variety of options that alter the balance between completeness of address coverage and speed of processing. In order to obtain maximum coverage, and thereby match the most addresses possible, we ran the GeoCode program with the following options turned on:
65
• Allow phonetic match of state name
– The geocoder phonetically matches the full state name in an address (but not an abbreviation).
• Allow place-based ZIP code match
– If a street is not found in a ZIP, the geocoder scans other ZIP codes associated with the place (typically a city or a town) for a match.
• Allow phonetic match of street name
– The geocoder uses a phonetic match for street names (e.g., an input address with the street name “Maine St.” is considered a match with Main St. in the database).
• Disregard parity for address match
– Normally, the geocoder matches even/odd addresses with even/odd address ranges. This option disregards this practice.
• Allow closest address match
– The geocoder finds the closest address range to match the house number (rather than an exact one)
• Allow fuzzy street type match
– The geocoder will match addresses with the same street name, even if the street types are different (e.g., Greenwood Drive is considered a match with Greenwood Road)
• Geocode no matter what
– If it cannot find an exact match, the geocoder will assign to the address the census coordinates associated with the center of a ZIP code (ZIP centroid20), or the center of a state (state centroid).
The GeoCode program outputs two files as it runs – a text file (*.txt) summarizing the geocoder performance, the accuracy codes, and the error codes; and a database file (*.dbf) containing the fields selected by the user. For each database file, we selected the following fields21:
20 The centroid of a 5-digit ZIP code area is the balance point of the polygon formed by its boundaries. The centroid
is calculated based on the coordinate extremes of the polygon.
21 One field we did not include, the MATCH field, contained the full address that the GeoCode search engine determined to be the closest match to the input address. We had intended to include this field, but during the
66
SEQNO Sequential Number ADDRESS Input Address ACCURACY Accuracy and Error Codes BLOCK Matched Block Code PLACE Place FIPS Code MCD MCD (Minor Civil Division) Code STATE State FIPS Code ZIP ZIP Code for 2003 PLACENAME Matched Place Name AreaKey Block Group Code
The sequential number field contains a number between 1 and n, where n is the total number of records processed by the program. The input address is the address in the STREET, CITY, STATE ZIP format constructed and output by the address cleaning SAS program. Accuracy and error codes are explained below. The matched block code is a string of fifteen digits that indicates, respectively, an individual’s state (2 digit FIPS code), county (3 digit FIPS code), census tract (6 digit FIPS code), and block (4 digit FIPS code, the first digit in the 4-digit string indicates the block group). The full string constitutes a unique, block-level identifier. Any persons living within the same block will have the same matched block code. Place indicates the city or town FIPS code, and MCD indicates the Minor Civil Division code. The area key is basically a substring of the matched block code that contains the first twelve, rather than the full fifteen digits, and constitutes a unique block group-level identifier.
5.2.3 Summary of GeoCode program accuracy codes
Failure details. The geocoding process can fail for a number of reasons, including setup or programmatic errors, a missing database entry, or an invalid input address. Failures fall under two general categories: syntax/lookup errors and programmatic/setup errors. Failed GeoCode results are indicated by error codes, which are summarized in Tables 48 and 49.
testing phase, we discovered problems with the MATCH field that led to major problems when trying to transform the *.dbf files into SAS files.
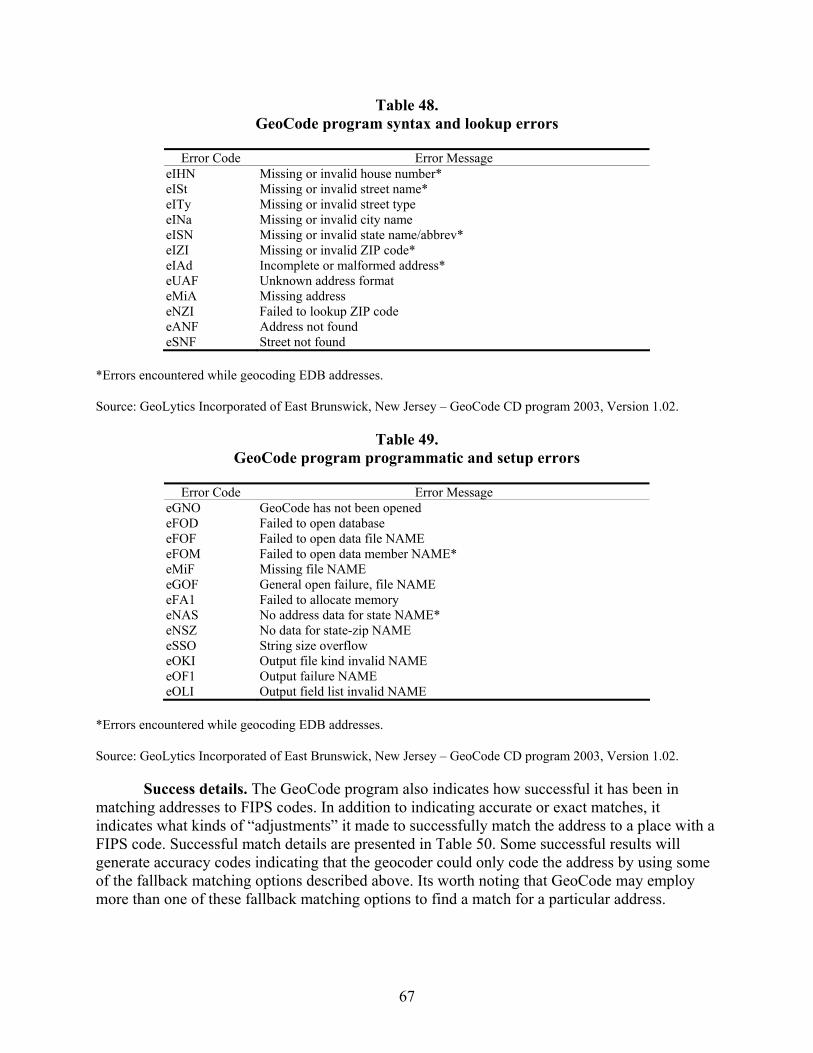
67
Table 48. GeoCode program syntax and lookup errors
Error Code Error Message eIHN Missing or invalid house number* eISt Missing or invalid street name* eITy Missing or invalid street type eINa Missing or invalid city name eISN Missing or invalid state name/abbrev* eIZI Missing or invalid ZIP code* eIAd Incomplete or malformed address* eUAF Unknown address format eMiA Missing address eNZI Failed to lookup ZIP code eANF Address not found eSNF Street not found
*Errors encountered while geocoding EDB addresses.
Source: GeoLytics Incorporated of East Brunswick, New Jersey – GeoCode CD program 2003, Version 1.02.
Table 49. GeoCode program programmatic and setup errors
Error Code Error Message eGNO GeoCode has not been opened eFOD Failed to open database eFOF Failed to open data file NAME eFOM Failed to open data member NAME* eMiF Missing file NAME eGOF General open failure, file NAME eFA1 Failed to allocate memory eNAS No address data for state NAME* eNSZ No data for state-zip NAME eSSO String size overflow eOKI Output file kind invalid NAME eOF1 Output failure NAME eOLI Output field list invalid NAME
*Errors encountered while geocoding EDB addresses.
Source: GeoLytics Incorporated of East Brunswick, New Jersey – GeoCode CD program 2003, Version 1.02.
Success details. The GeoCode program also indicates how successful it has been in matching addresses to FIPS codes. In addition to indicating accurate or exact matches, it indicates what kinds of “adjustments” it made to successfully match the address to a place with a FIPS code. Successful match details are presented in Table 50. Some successful results will generate accuracy codes indicating that the geocoder could only code the address by using some of the fallback matching options described above. Its worth noting that GeoCode may employ more than one of these fallback matching options to find a match for a particular address.
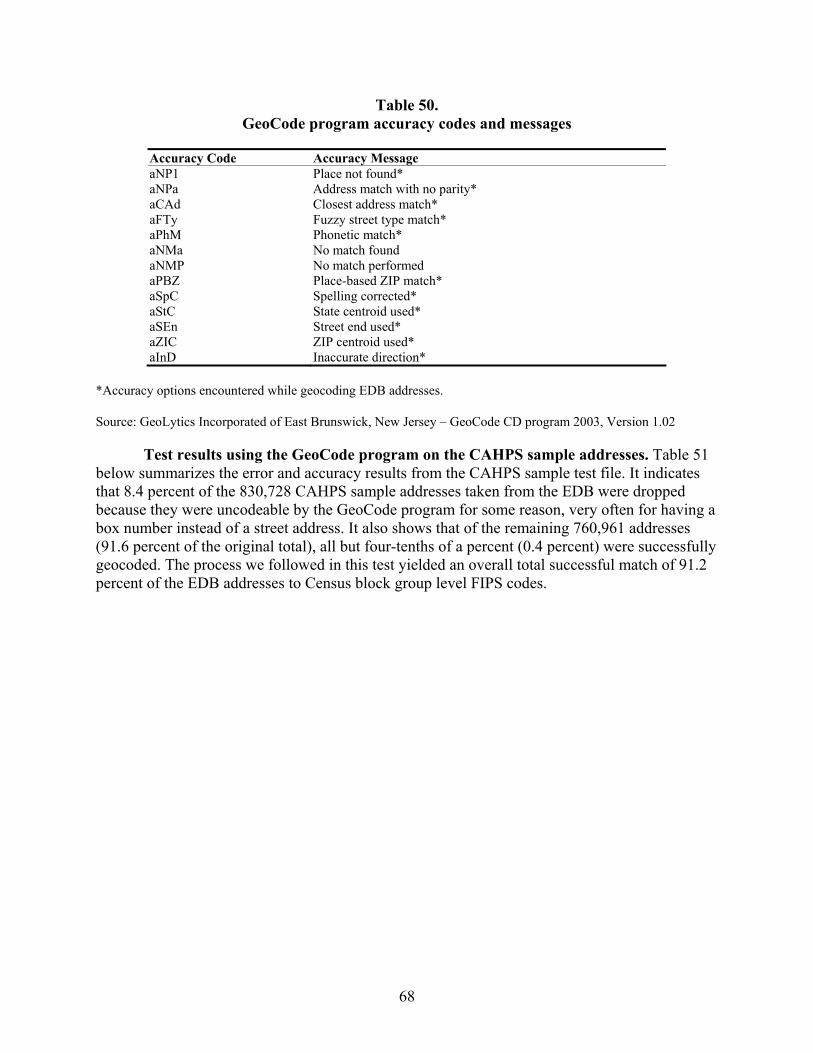
68
Table 50. GeoCode program accuracy codes and messages
Accuracy Code Accuracy Message aNP1 Place not found* aNPa Address match with no parity* aCAd Closest address match* aFTy Fuzzy street type match* aPhM Phonetic match* aNMa No match found aNMP No match performed aPBZ Place-based ZIP match* aSpC Spelling corrected* aStC State centroid used* aSEn Street end used* aZIC ZIP centroid used* aInD Inaccurate direction*
*Accuracy options encountered while geocoding EDB addresses.
Source: GeoLytics Incorporated of East Brunswick, New Jersey – GeoCode CD program 2003, Version 1.02
Test results using the GeoCode program on the CAHPS sample addresses. Table 51 below summarizes the error and accuracy results from the CAHPS sample test file. It indicates that 8.4 percent of the 830,728 CAHPS sample addresses taken from the EDB were dropped because they were uncodeable by the GeoCode program for some reason, very often for having a box number instead of a street address. It also shows that of the remaining 760,961 addresses (91.6 percent of the original total), all but four-tenths of a percent (0.4 percent) were successfully geocoded. The process we followed in this test yielded an overall total successful match of 91.2 percent of the EDB addresses to Census block group level FIPS codes.
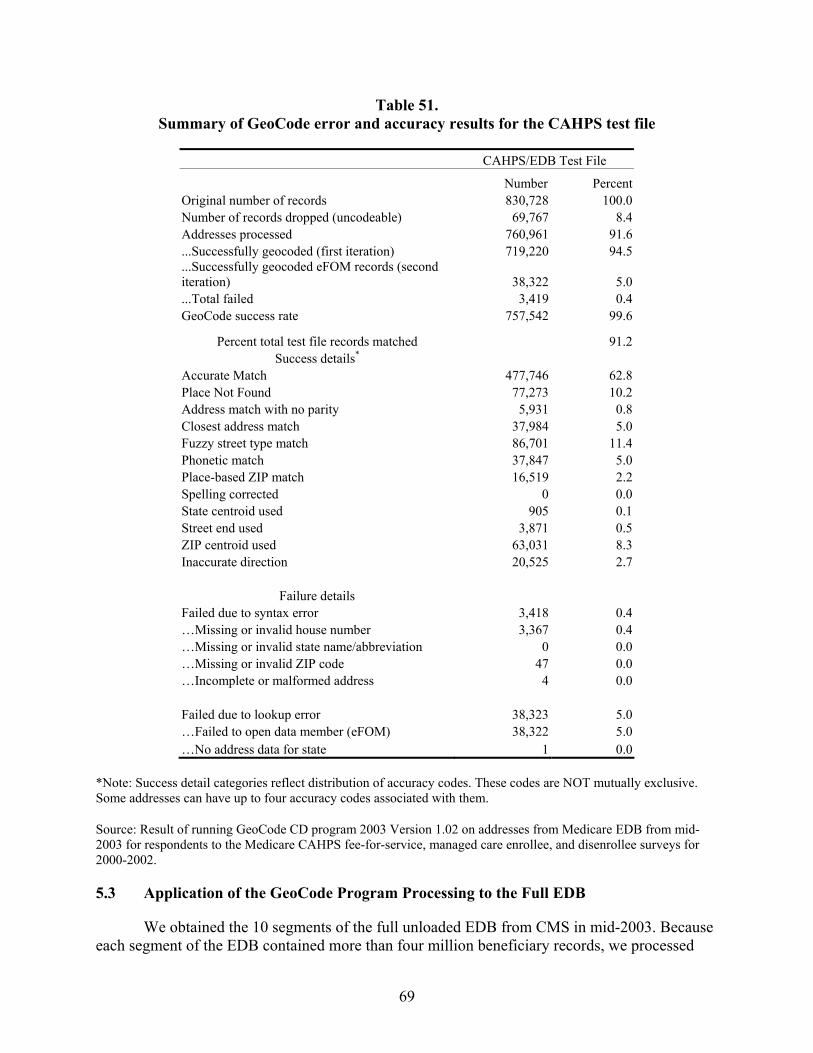
69
Table 51. Summary of GeoCode error and accuracy results for the CAHPS test file
CAHPS/EDB Test File
Number Percent Original number of records 830,728 100.0 Number of records dropped (uncodeable) 69,767 8.4 Addresses processed 760,961 91.6 ...Successfully geocoded (first iteration) 719,220 94.5 ...Successfully geocoded eFOM records (second iteration) 38,322 5.0 ...Total failed 3,419 0.4 GeoCode success rate 757,542 99.6
Percent total test file records matched 91.2 Success details*
Accurate Match 477,746 62.8 Place Not Found 77,273 10.2 Address match with no parity 5,931 0.8 Closest address match 37,984 5.0 Fuzzy street type match 86,701 11.4 Phonetic match 37,847 5.0 Place-based ZIP match 16,519 2.2 Spelling corrected 0 0.0 State centroid used 905 0.1 Street end used 3,871 0.5 ZIP centroid used 63,031 8.3 Inaccurate direction 20,525 2.7
Failure details Failed due to syntax error 3,418 0.4 …Missing or invalid house number 3,367 0.4 …Missing or invalid state name/abbreviation 0 0.0 …Missing or invalid ZIP code 47 0.0 …Incomplete or malformed address 4 0.0 Failed due to lookup error 38,323 5.0 …Failed to open data member (eFOM) 38,322 5.0 …No address data for state 1 0.0
*Note: Success detail categories reflect distribution of accuracy codes. These codes are NOT mutually exclusive. Some addresses can have up to four accuracy codes associated with them.
Source: Result of running GeoCode CD program 2003 Version 1.02 on addresses from Medicare EDB from mid-2003 for respondents to the Medicare CAHPS fee-for-service, managed care enrollee, and disenrollee surveys for 2000-2002.
5.3 Application of the GeoCode Program Processing to the Full EDB
We obtained the 10 segments of the full unloaded EDB from CMS in mid-2003. Because each segment of the EDB contained more than four million beneficiary records, we processed
70
each segment separately, first extracting the addresses and other necessary identification variables from the EDB, correcting the addresses using the SAS programs we developed, and finally running them through the GeoCode program. Each segment of the EDB was run through the GeoCode program separately. The program took from 16 to 36 hours to process and match the more than four million records contained in each segment. As indicated above in the description of the test results on the CAHPS sample addresses, it was necessary to rerun the addresses with an eFOM error that failed to match on the first iteration, and virtually all of them were successfully matched on the second iteration through the GeoCode program.
Run EDB segments through the GeoCode program. The results of the GeoCode program processing are summarized in Table 52 for all 10 segments of the unloaded EDB combined. The results were extremely similar for each of the 10 segments. However, a separate summary has been prepared for each segment and included in Appendix F. Overall, 86.8 percent of the 41,742,407 addresses of Medicare beneficiaries were processed through the Geocode program. Ninety-nine and two tenths percent of the addresses that were processed (or 36,223,053) were successfully matched to a FIPS code that included the block group. As Table 52 shows, 61 percent of the matches made were exact with the addresses that were input.
Import Geocode output files and merge with EDB records. We used PROC IMPORT in SAS 8.2 to transform the database (*.dbf) files produced by the GeoCode program into SAS data files (*.sas7bdat). Using the ADDRESS field we prepared as input from the EDB to the GeoCode program as the common key (common to the EDB and the GeoCode output), we merged the output files (containing Census-based geographic identifiers including the AreaKey number string that identifies block groups) onto the EDB records.
Identifying and extracting socioeconomic status indicators from the 2000 U.S. Census. Rather than be limited in the number and type of socioeconomic status indicators available to CMS from this effort, we extracted a rather extensive list of block group level measures from the 2000 U.S. Census. Our thinking on taking all of these was that that some of these could be could be used alone or in combinations to describe the SES of the block group in which the Medicare beneficiary resided. For a list of the variables we extracted and the values for which they are reported, see Appendix F. Included in the measures we extracted were:
• median family income in 1999
• median household income in 1999
• per capita income in 1999
• median rent asked
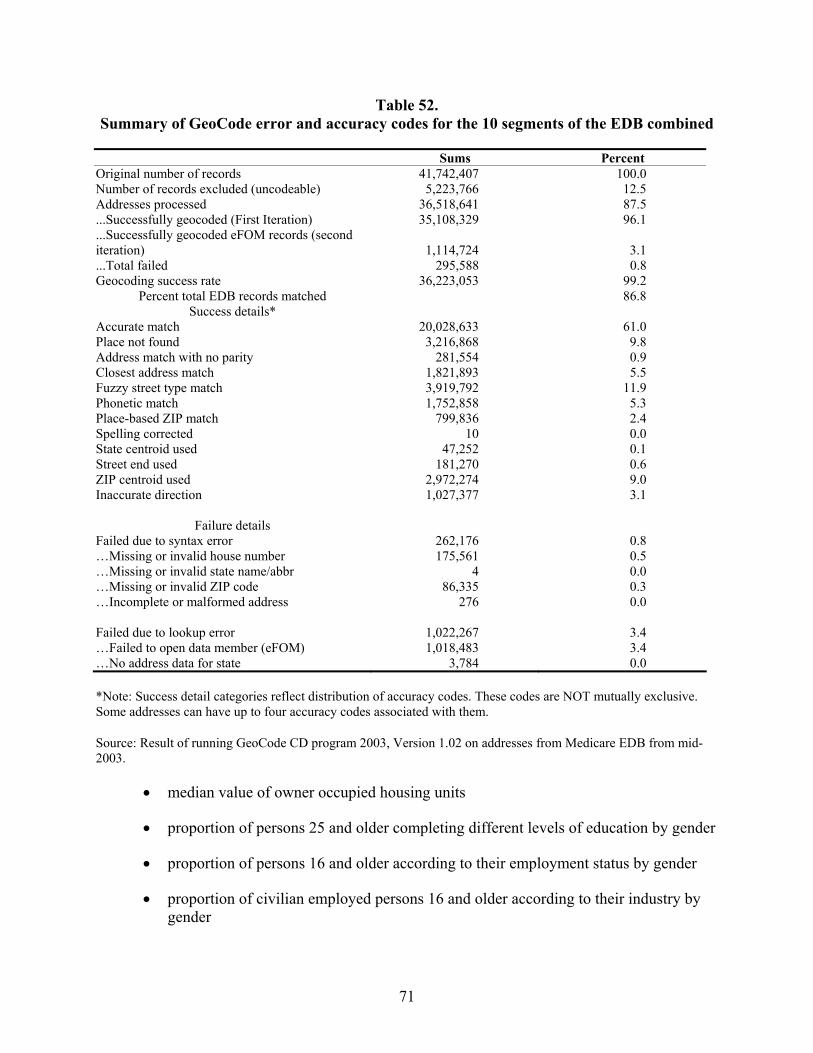
71
Table 52. Summary of GeoCode error and accuracy codes for the 10 segments of the EDB combined
Sums Percent Original number of records 41,742,407 100.0 Number of records excluded (uncodeable) 5,223,766 12.5 Addresses processed 36,518,641 87.5 ...Successfully geocoded (First Iteration) 35,108,329 96.1 ...Successfully geocoded eFOM records (second iteration) 1,114,724 3.1 ...Total failed 295,588 0.8 Geocoding success rate 36,223,053 99.2
Percent total EDB records matched 86.8 Success details*
Accurate match 20,028,633 61.0 Place not found 3,216,868 9.8 Address match with no parity 281,554 0.9 Closest address match 1,821,893 5.5 Fuzzy street type match 3,919,792 11.9 Phonetic match 1,752,858 5.3 Place-based ZIP match 799,836 2.4 Spelling corrected 10 0.0 State centroid used 47,252 0.1 Street end used 181,270 0.6 ZIP centroid used 2,972,274 9.0 Inaccurate direction 1,027,377 3.1
Failure details Failed due to syntax error 262,176 0.8 …Missing or invalid house number 175,561 0.5 …Missing or invalid state name/abbr 4 0.0 …Missing or invalid ZIP code 86,335 0.3 …Incomplete or malformed address 276 0.0 Failed due to lookup error 1,022,267 3.4 …Failed to open data member (eFOM) 1,018,483 3.4 …No address data for state 3,784 0.0
*Note: Success detail categories reflect distribution of accuracy codes. These codes are NOT mutually exclusive. Some addresses can have up to four accuracy codes associated with them.
Source: Result of running GeoCode CD program 2003, Version 1.02 on addresses from Medicare EDB from mid-2003.
• median value of owner occupied housing units
• proportion of persons 25 and older completing different levels of education by gender
• proportion of persons 16 and older according to their employment status by gender
• proportion of civilian employed persons 16 and older according to their industry by gender
72
• proportion of civilian employed persons 16 and older according to their occupation by gender
• proportion of families according to their income level in 1999
• proportion of households according to their income level in 1999
• proportion of families according to poverty level in 1999 by age of head
• proportion of families according to their income level in 1999 divided by the poverty level in 1999
• median household income in 1999 by race of householder
• median household income in 1999 by age of householder
• proportion of households with income below the poverty level in 1999 by race and age of householder
These variables were extracted for all block groups in the nation along with their Block group FIPS codes and saved in a file. This file can readily be used to link to any particular beneficiary in the EDB and be used to supply the value (percent, median, per capita amount) of any block group level measure chosen from this file for his/her place of residence because both files have the block group FIPS code (AreaKey) on them.
73
CHAPTER 6 ASSESSING HOW REPRESENTATIVE THE MEDICARE CURRENT BENEFICIARY SURVEY’S (MCBS) SAMPLE SITES ARE OF NATIONAL ORIGIN SUBGROUPS FOR
HISPANICS AND ASIANS/PACIFIC ISLANDERS
6.1 Introduction
The objective of the analysis reported in this chapter is to assess whether the primary sampling units (PSUs) used by the Medicare Current Beneficiary Survey (MCBS) appropriately represent Hispanic and Asian/Pacific Islander beneficiaries in the Medicare program. “Appropriately” in this context means that the areas from which the MCBS sample is selected are composed of the same mixture of Hispanic and Asian/Pacific Islander subgroups as the nation as a whole. This would allow one to reasonably expect that the samples of persons selected in the MCBS could represent Hispanic and Asian/Pacific Islander (A/PI) Medicare beneficiaries with the same mix of national origins as the nation as a whole.
Since the focus was on the nation as a whole, we used the 2000 U.S. Census counts of persons by race/ethnicity and national origins as the baseline of our assessment. However, the Medicare program includes both persons under 65 years of age who are disabled or have been certified as having end stage renal disease, as well as persons 65 years of age and older. There are no Census data that report on the population’s level of disability by race/ethnicity according to national origins but there are data on age by race/ethnicity according to national origins. For this reason, we have focused solely on the segment of the population in these two diverse race/ethnic groups who were 65 years of age and older at the time of the Census and, therefore, are very likely to be eligible for Medicare.
6.2 Methodology
To assess the similarity of the nation and the MCBS PSUs with respect to representation of racial/ethnic subgroups, we summed the 2000 U.S. Census counts for the nation as a whole for persons of Hispanic and Asian/Pacific Islander origins who were 65 years of age and older by national origin subgroup and in total, separately for Hispanic and Asian/Pacific Islander persons. Next, we obtained the list of MCBS counties (the PSUs are counties and groups of counties). Then, we summed the 2000 U.S. Census counts for Hispanic and Asian/Pacific Islander persons 65 years of age and older by national origin subgroup and in total just for the counties included in the 107 MCBS PSUs. These are presented in Table 53. From this table, it is clear that the MCBS PSU’s have included a large proportion of the nation’s elderly Hispanics (1,086,909 out of 1,733,591, or 62.7 percent) and an even larger proportion of the nation’s elderly Asians/Pacific Islanders (546,351 out of 821,616, or 66.5 percent).
It is also apparent from this table that the Hispanic population 65 years of age and older constitutes 4.91 percent of the Hispanic population in the nation but is a slightly smaller proportion (4.81 percent) of the Hispanic population included in the MCBS PSUs. The same situation exists with respect to the elderly Asian/Pacific Islander population. They represent 7.72 percent of the Asian/Pacific Islander population nationally, but only 7.53 percent of the
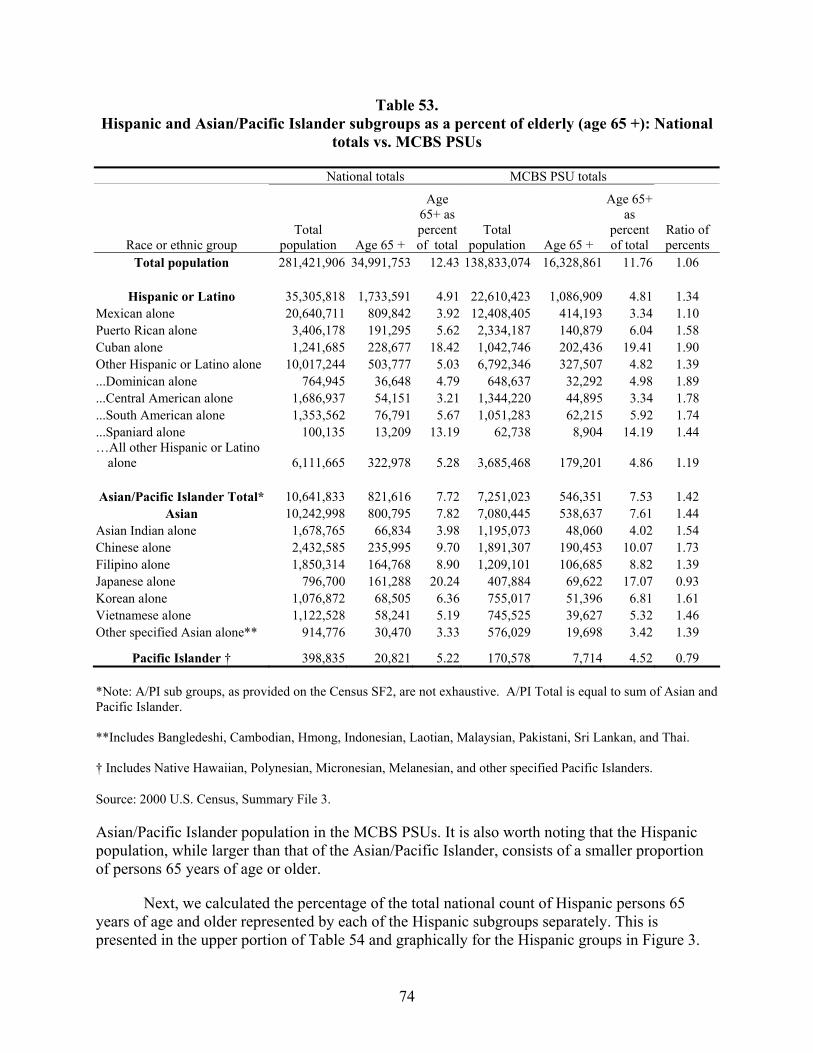
74
Table 53. Hispanic and Asian/Pacific Islander subgroups as a percent of elderly (age 65 +): National
totals vs. MCBS PSUs
National totals MCBS PSU totals
Race or ethnic group Total
population Age 65 +
Age 65+ as percent of total
Total population Age 65 +
Age 65+ as
percent of total
Ratio of percents
Total population 281,421,906 34,991,753 12.43 138,833,074 16,328,861 11.76 1.06
Hispanic or Latino 35,305,818 1,733,591 4.91 22,610,423 1,086,909 4.81 1.34 Mexican alone 20,640,711 809,842 3.92 12,408,405 414,193 3.34 1.10 Puerto Rican alone 3,406,178 191,295 5.62 2,334,187 140,879 6.04 1.58 Cuban alone 1,241,685 228,677 18.42 1,042,746 202,436 19.41 1.90 Other Hispanic or Latino alone 10,017,244 503,777 5.03 6,792,346 327,507 4.82 1.39 ...Dominican alone 764,945 36,648 4.79 648,637 32,292 4.98 1.89 ...Central American alone 1,686,937 54,151 3.21 1,344,220 44,895 3.34 1.78 ...South American alone 1,353,562 76,791 5.67 1,051,283 62,215 5.92 1.74 ...Spaniard alone 100,135 13,209 13.19 62,738 8,904 14.19 1.44 …All other Hispanic or Latino
alone 6,111,665 322,978 5.28 3,685,468 179,201 4.86 1.19 Asian/Pacific Islander Total* 10,641,833 821,616 7.72 7,251,023 546,351 7.53 1.42
Asian 10,242,998 800,795 7.82 7,080,445 538,637 7.61 1.44 Asian Indian alone 1,678,765 66,834 3.98 1,195,073 48,060 4.02 1.54 Chinese alone 2,432,585 235,995 9.70 1,891,307 190,453 10.07 1.73 Filipino alone 1,850,314 164,768 8.90 1,209,101 106,685 8.82 1.39 Japanese alone 796,700 161,288 20.24 407,884 69,622 17.07 0.93 Korean alone 1,076,872 68,505 6.36 755,017 51,396 6.81 1.61 Vietnamese alone 1,122,528 58,241 5.19 745,525 39,627 5.32 1.46 Other specified Asian alone** 914,776 30,470 3.33 576,029 19,698 3.42 1.39
Pacific Islander † 398,835 20,821 5.22 170,578 7,714 4.52 0.79
*Note: A/PI sub groups, as provided on the Census SF2, are not exhaustive. A/PI Total is equal to sum of Asian and Pacific Islander. **Includes Bangledeshi, Cambodian, Hmong, Indonesian, Laotian, Malaysian, Pakistani, Sri Lankan, and Thai. † Includes Native Hawaiian, Polynesian, Micronesian, Melanesian, and other specified Pacific Islanders.
Source: 2000 U.S. Census, Summary File 3.
Asian/Pacific Islander population in the MCBS PSUs. It is also worth noting that the Hispanic population, while larger than that of the Asian/Pacific Islander, consists of a smaller proportion of persons 65 years of age or older.
Next, we calculated the percentage of the total national count of Hispanic persons 65 years of age and older represented by each of the Hispanic subgroups separately. This is presented in the upper portion of Table 54 and graphically for the Hispanic groups in Figure 3.
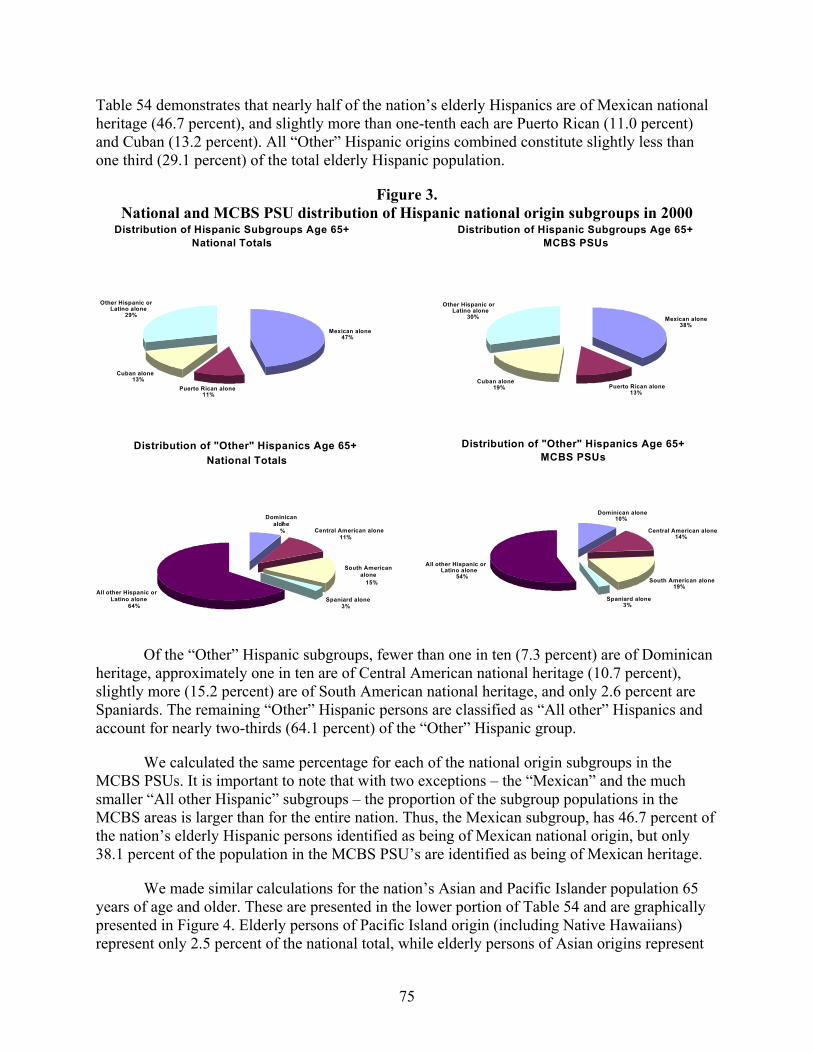
75
Table 54 demonstrates that nearly half of the nation’s elderly Hispanics are of Mexican national heritage (46.7 percent), and slightly more than one-tenth each are Puerto Rican (11.0 percent) and Cuban (13.2 percent). All “Other” Hispanic origins combined constitute slightly less than one third (29.1 percent) of the total elderly Hispanic population.
Figure 3. National and MCBS PSU distribution of Hispanic national origin subgroups in 2000
Of the “Other” Hispanic subgroups, fewer than one in ten (7.3 percent) are of Dominican heritage, approximately one in ten are of Central American national heritage (10.7 percent), slightly more (15.2 percent) are of South American national heritage, and only 2.6 percent are Spaniards. The remaining “Other” Hispanic persons are classified as “All other” Hispanics and account for nearly two-thirds (64.1 percent) of the “Other” Hispanic group.
We calculated the same percentage for each of the national origin subgroups in the MCBS PSUs. It is important to note that with two exceptions – the “Mexican” and the much smaller “All other Hispanic” subgroups – the proportion of the subgroup populations in the MCBS areas is larger than for the entire nation. Thus, the Mexican subgroup, has 46.7 percent of the nation’s elderly Hispanic persons identified as being of Mexican national origin, but only 38.1 percent of the population in the MCBS PSU’s are identified as being of Mexican heritage.
We made similar calculations for the nation’s Asian and Pacific Islander population 65 years of age and older. These are presented in the lower portion of Table 54 and are graphically presented in Figure 4. Elderly persons of Pacific Island origin (including Native Hawaiians) represent only 2.5 percent of the national total, while elderly persons of Asian origins represent
Distribution of Hispanic Subgroups Age 65+National Totals
Mexican alone47%
Puerto Rican alone11%
Cuban alone13%
Other Hispanic or Latino alone
29%
Distribution of Hispanic Subgroups Age 65+MCBS PSUs
Mexican alone38%
Puerto Rican alone13%
Cuban alone19%
Other Hispanic orLatino alone
30%
Distribution of "Other" Hispanics Age 65+MCBS PSUs
Spaniard alone3%
South American alone19%
Central American alone14%
Dominican alone10%
All other Hispanic orLatino alone
54%
Distribution of "Other" Hispanics Age 65+ National Totals
All other Hispanic orLatino alone
64%Spaniard alone
3%
South Americanalone
15%
Central American alone11%
Dominicanalone7
%
76
97.5 percent. The largest elderly Asian subgroup is the Chinese (29.5 percent of Asians), followed by Filipinos (20.6 percent) and the Japanese (20.1 percent). Koreans constitute
Table 54. Subgroup composition of Hispanic and Asian/Pacific Islander elderly (age 65+): National
totals vs. MCBS PSUs
National totals MCBS PSUs
Race or ethnic group Age 65 + Subgroup as
% of total Age 65 + Subgroup as
% of total
Ratio of MCBS
to nation percent
Hispanic or Latino 1,733,591 100.0% 1,086,909 100.0% 1.00 Mexican alone 809,842 46.7% 414,193 38.1% 0.82 Puerto Rican alone 191,295 11.0% 140,879 13.0% 1.17 Cuban alone 228,677 13.2% 202,436 18.6% 1.41 Other Hispanic or Latino alone 503,777 29.1% 327,507 30.1% 1.04 ...Dominican alone 36,648 7.3% 32,292 9.9% 1.36...Central American alone 54,151 10.7% 44,895 13.7% 1.28...South American alone 76,791 15.2% 62,215 19.0% 1.25...Spaniard alone 13,209 2.6% 8,904 2.7% 1.04…All other Hispanic or Latino alone 322,978 64.1% 179,201 54.7% 0.85
A/PI total* 821,616 100.0% 546,351 100.0% 1.00 Asian 800,795 97.5% 538,637 98.6% 1.01
Asian Indian alone 66,834 8.3% 48,060 8.9% 1.07Chinese alone 235,995 29.5% 190,453 35.4% 1.20Filipino alone 164,768 20.6% 106,685 19.8% 0.96Japanese alone 161,288 20.1% 69,622 12.9% 0.64Korean alone 68,505 8.6% 51,396 9.5% 1.12Vietnamese alone 58,241 7.3% 39,627 7.4% 1.01Other specified Asian alone** 30,470 3.8% 19,698 3.7% 0.96
Native Hawaiian/Other Pacific Islander (NHPI)† 20,821 2.53% 7,714 1.41% 0.56
*Note: A/PI sub groups, as provided on the Census SF2, are not exhaustive. A/PI Total is equal to sum of Asian and NHPI. **Includes Bangledeshi, Cambodian, Hmong, Indonesian, Laotian, Malaysian, Pakistani, Sri Lankan, and Thai. † Includes Polynesian, Micronesian, Melanesian, and Other specified Pacific Islanders.
Source: 2000 U.S. Census, Summary File 3.
8.6 percent of elderly Asians followed by Asian Indians (8.3 percent), and the Vietnamese (7.3 percent). Other Asians represent only 3.8 percent of the national total Asians and include persons of Bangladeshi, Cambodian, Hmong, Indonesian, Laotian, Malaysian, Pakistani, Sri Lankan, and Thai national origins.
As with the Hispanic elderly population, we also calculated the percentage of Asian/Pacific Islander elderly in the MCBS PSUs for each of the national origin subgroups. Noteworthy here is that 29.5 percent of the nation’s Asian/Pacific Islander elderly population is
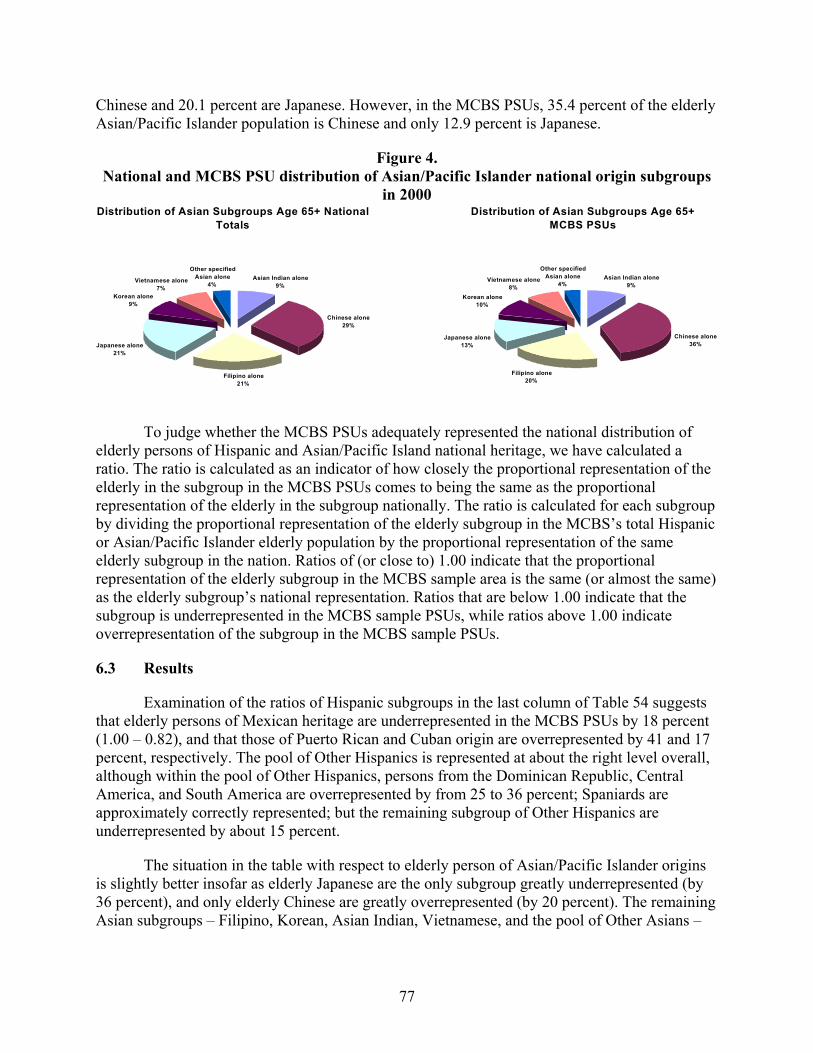
77
Chinese and 20.1 percent are Japanese. However, in the MCBS PSUs, 35.4 percent of the elderly Asian/Pacific Islander population is Chinese and only 12.9 percent is Japanese.
Figure 4. National and MCBS PSU distribution of Asian/Pacific Islander national origin subgroups
in 2000
To judge whether the MCBS PSUs adequately represented the national distribution of elderly persons of Hispanic and Asian/Pacific Island national heritage, we have calculated a ratio. The ratio is calculated as an indicator of how closely the proportional representation of the elderly in the subgroup in the MCBS PSUs comes to being the same as the proportional representation of the elderly in the subgroup nationally. The ratio is calculated for each subgroup by dividing the proportional representation of the elderly subgroup in the MCBS’s total Hispanic or Asian/Pacific Islander elderly population by the proportional representation of the same elderly subgroup in the nation. Ratios of (or close to) 1.00 indicate that the proportional representation of the elderly subgroup in the MCBS sample area is the same (or almost the same) as the elderly subgroup’s national representation. Ratios that are below 1.00 indicate that the subgroup is underrepresented in the MCBS sample PSUs, while ratios above 1.00 indicate overrepresentation of the subgroup in the MCBS sample PSUs.
6.3 Results
Examination of the ratios of Hispanic subgroups in the last column of Table 54 suggests that elderly persons of Mexican heritage are underrepresented in the MCBS PSUs by 18 percent (1.00 – 0.82), and that those of Puerto Rican and Cuban origin are overrepresented by 41 and 17 percent, respectively. The pool of Other Hispanics is represented at about the right level overall, although within the pool of Other Hispanics, persons from the Dominican Republic, Central America, and South America are overrepresented by from 25 to 36 percent; Spaniards are approximately correctly represented; but the remaining subgroup of Other Hispanics are underrepresented by about 15 percent.
The situation in the table with respect to elderly person of Asian/Pacific Islander origins is slightly better insofar as elderly Japanese are the only subgroup greatly underrepresented (by 36 percent), and only elderly Chinese are greatly overrepresented (by 20 percent). The remaining Asian subgroups – Filipino, Korean, Asian Indian, Vietnamese, and the pool of Other Asians –
Distribution of Asian Subgroups Age 65+ NationalTotals
Asian Indian alone9%
Chinese alone29%
Filipino alone21%
Japanese alone21%
Korean alone9%
Vietnamese alone7%
Other specifiedAsian alone
4%
Distribution of Asian Subgroups Age 65+MCBS PSUs
Asian Indian alone9%
Chinese alone36%
Filipino alone20%
Japanese alone13%
Korean alone10%
Vietnamese alone8%
Other specifiedAsian alone
4%

78
are either just slightly overrepresented or slightly underrepresented with ratios ranging from 0.96 to 1.12.
79
REFERENCES
Arday, S.L., D.R. Arday, S. Monroe, and J. Zhang. HCFA’s Racial and Ethnic Data: Current Accuracy and Recent Improvements. Health Care Financing Review. Volume 21, Number 4, 107-116, Summer 2000.
Bindman, A.B., Grumbach, K., Osmond, D. et al. Preventable Hospitalizations and Access to Care. Journal of the American Medical Association, Vol. 274, No. 4, 305-311, July 26, 1995.
Eggers, P.W. and L. G. Greenberg. Racial Differences in Hospitalization Rates among Aged Medicare Beneficiaries, 1998. Health Care Financing Review. Volume 21, Number 4, 1-15, Summer 2000.
Falkenstein, M.R., and Word, D.L.: The Asian and Pacific Islander Surname List: As Developed from Census 2000. Bureau of the Census, December 2002.
Landis, J.R., and Koch, G.G. The measurement of observer agreement for categorical data. Biometrics, 33, pp. 159 - 174, 1977.
Lauderdale, D.S. and J. Goldberg. The Expanded Racial and Ethnic Codes in the Medicare Data Files: Their Completeness of Coverage and Accuracy. American Journal of Public Health, Volume 86, Number 5, 712-716, May1996.
McCall, N., Harlow, J., and Dayhoff, D. Rates of Hospitalization for Ambulatory Care Sensitive Conditions in the Medicare+Choice Population. Health Care Financing Review, Vol. 22, No. 3, 127-145, Spring 2001.
Medicare and Medicaid Statistical Supplement, 2000. Health Care Financing Review., Publication Number 03424, June 2001.
Pope, G.G., Ellis, R.P., Ash, A.S. et al. Diagnostic Cost Group Hierarchical Condition Category Models for Medicare Risk Adjustment. Health Economics Research, Inc. Waltham, MA. December 21, 2000.
U.S. Department of Health and Human Services. Healthy People 2010: Understanding and Improving Health. 2nd Edition. Washington, D.C.: U.S. Government Printing Office, November, 2000.
Word, D.L., and Perkins, R.C. Jr.: Building a Spanish Surname List for the 1990’s – A New Approach to an Old Problem. Bureau of the Census, Population Division Technical Working Paper No. 13, March 1996. Available at: http://www.census.gov/population/documentation/twpno13.pdf.

Appendix A Spanish Surnames List Documentation

Appendix A Spanish Surnames
Technical Working Paper No. 13
U.S. Census Bureau March 1996
TECHNICAL WORKING PAPER NO. 13March 1996
Building a Spanish Surname List for the 1990’s— A New Approach to an Old ProblembyDavid L. Word and R. Colby Perkins Jr.
Population DivisionU. S. Bureau of the CensusWashington D.C.
The data and results appearing in this working paper were originally introduced at the AnnualMeeting of the Population Association of America (PAA) Miami, Florida May 1994.
The views expressed in this paper are solely attributable to the two authors and do notnecessarily reflect the position of the United States Bureau of the Census.
Technical Working Paper No. 13 i
U.S. Census Bureau March 1996
ABSTRACT
The United States Census Bureau produced and released Spanish surname products for 1950, 1960,1970 and 1980. This 1990 version is another way station in an ongoing research journey. This pa-per, “Building a Spanish Surname List for the 1990’s—A New Approach to an Old Problem,” differsfrom its predecessors in two significant respects.
(1) Until 1990, name has never been part of a permanent Census electronic record. Following the1990 Census, the Census Bureau appended name to 7 millio n Census records for the purposesof determining undercount. The “List” i s constructed by tabulating the responses (surname bysurname) to the Spanish origin question for persons in that sample. Well over 90 percent ofmale householders with the surnames: GARCIA, MARTINEZ, RODRIGUEZ, and LOPEZresponded affirmatively to the Spanish origin question while less than 1.0 percent of malehouseholders named SMITH, JOHNSON, and BROWN provided a positive response to theSpanish origin question.
(2) In the past, a name was either on the list (e.g., Garcia) and was taken to be Spanish or it did notappear on the list. The assumption was that any name not on the list was not Spanish. Sinceneither BROWN nor SILVA appeared on the 1980 Spanish Surname list, one would naturallyassume that neither name was Spanish. In the electronic version of the 1990 “List” we appendauxiliary data for 25,000 surnames including both SILVA and BROWN that allow users to formtheir own lists. Almost 60 percent of the SILVA’ s in our 1990 Census sample responded thatthey were Hispanic while less than 1 percent of BROWN’s claimed to be Hispanic. Moreover,another auxiliary item suggests that the letters S I L V A form a potentially Spanish word. Thatsame statement cannot be made for B R O W N. From this data, some users might includeSILVA on their own personal Spanish surname list, while others would justifiably arrive at anopposite conclusion.
We must emphasize that this product does not violate the confidentiality of Census responses. Onaverage, each captured surname represents about 40 householders. Moreover, we provide no subna-tional geographic data nor is there any indication of first name or age of respondent. Given theseconditions, we are confident that this file does not provide information that could identify any indi-vidual enumerated in the 1990 Census.
Technical Working Paper No. 13 ii
U.S. Census Bureau March 1996
ACKNOWLEDGEMENTS
This paper could not have been written without the help of our colleagues at the Census Bureau. Six of our co-workers provided so much assistance that they are singled out for special thanks.
1. Randy Klear single-handedly built the data base used in the surname extraction operation. Hewrote the programs to normalize names (JOHN SMITH JR is normalized to JOHN SMITH) aswell as creating the algorithms for inverting names (JOHNSON CYNTHIA is inverted to CYN-THIA JOHNSON) when appropriate.
2. Sam Davis designed the programs to delineate infrequently occurring surnames into variousHispanic categories.
3. Marie Pees created the electronic diskettes that are an important supplement to the paper. Forpersons needing specific information on individual surnames, the statistical material located onthe diskette is crucial.
4. Signe Wetrogan gave the authors a great deal of her time, enthusiasm and expertise in their ear-ly efforts at organizing and writing this paper. Many of her suggestions on points of emphasishave been included in this document.
5. Gregg Robinson painstakingly read and re-read several versions of this paper. His sense forwhere to expand and where to modify the authors’ original phrasing were almost always righton the money.
6. Finally, we want to commend Rheta Pemberton on her word processing skill s and her patiencein producing “just one more final draft”. The typographical errors which have crept into thispaper are the sole responsibility of the authors.
Technical Working Paper No. 13 iii
U.S. Census Bureau March 1996
TABLE OF CONTENTS1.0 Introduction Page 1
2.0 Background Page 2
3.0 Purpose of Constructing a Spanish Surname List Page 3
4.0 One Dozen Common Spanish Surnames Page 4
5.1 Statistical Properties for Frequently Occurring Surnames Page 6
5.2 Statistical Properties for Infrequently Occurring Surnames Page 8
6.0 Limitations Page 9
7.0 Rarely Occurring Surnames: Or When Do Statistics End and When Does Common Sense Take Over? Page 10
8.0 Conclusion Page 13
9.0 References Page 14
10.0 Appendix Page 15
TEXT TABLESTable 1 Tabular Entries in an Ideal Situation Page 2
Table 2 Tabular Entries in a Normal Situation Page 2
Table 3 Ranking Spanish Surnames by Householder Page 4
Table 4 Percent of Householders and Persons Self-Identified as Hispanic Page 5
Table 5 Criteria for Spanish Surname Classification Page 6
Table 6A Categorizing Frequently Occurring Spanish Surnames (1980 List) by Proportion Hispanic Page 6
Table 6B Categorizing Frequently Occurring Non-Spanish Surnames(1980 List) by Proportion Hispanic Page 7
Table 7 Hispanic Classification for Surnames Occurring 25 or More Times on the SOR File Page 7
Table 8 Classifying Surnames on the 1980 Spanish Surname List According to Number of Observations on the SOR File Page 8
Table 9 1990 Hispanic Classification of Surnames Occurring 5 to 24 Times inthe SOR File Based on Hispanic Classification in 1980 Page 9
Table 10 Standard Errors in Proportion Hispanic Arising From a Sample Page 10
Table 11 Probability of Finding “X” Hispanics from 5 Independent Observations Page 11
Table 12 Surnames Included on the 1980 Spanish Surname List WhichAppear 4 or Fewer Times on the SOR File Page 11
Table 13 Surnames That Are Not Included on the 1980 Spanish Surname List and Appear 4 or Fewer Times on the SOR File Page 12
APPENDIX TABLESTable A 639 Most Frequently Occurring Heavily Hispanic Surnames Page 20
Table B Spanish Surname Categories Page 22
Table C Selected Summary Statistics for Spanish Surnames Page 24
Technical Working Paper No. 13 1
U.S. Census Bureau March 1996
Buildin g a Spanish Surname List for the 1990’s—A New Approach to An Old Problem
by
David L. Word and R. Colby Perkins Jr.
This paper describes a direct and reproducible method for creating an inventory of surnames charac-teristic of the Hispanic origin population in the United States. The individual surnames included inthis inventory are created by combining distinct surnames into groups and then analyzing group re-sponses to the 1990 Hispanic origin question. Persons wishing to purchase an electronic file need tobe specific as to whether they want the long list (Section 10.1.2) or the short list (Section 10.1.3).
Both electronic versions are available through the Population Division’s Statistical Information Of-fice (301-457-2422). If you would like or need additional insight into the contents of this paper,David Word (301-457-2103) [email protected] and Colby Perkins (301-457-2428) [email protected] wil l welcome your comments.
1.0 INTRODUCTION
In 1980 the Census Bureau published a list of 12,497 different “Spanish” surnames. The centralpremise for including a surname on that list was the “similarity” of that name’s geographic distribu-tion to the geographic distribution of the Hispanic origin population within the United States. The12,497 surnames appearing on the 1980 Spanish surname list were culled from a data base of 85million taxpayers filing individual federal tax returns for 1977.
Each of the 1.4 millio n distinct names appearing on the 1977 IRS file was subjected to a complexmathematical function incorporating Bayes’ theorem to determine the “odds” that any particular sur-name was Spanish (Word, et al 1978). When the arithmetic value of the function exceeded a prede-termined standard, that surname became a potential candidate for inclusion on the 1980 Spanish sur-name list. If the numerical value of the multinomial function failed to reach that criterion, the sur-name being tested was immediately discarded. This procedure works remarkably well for common-ly occurring surnames, but a great amount of “hands on” effort was required to dispose of infre-quently occurring surnames that surfaced as “Spanish” on the initial selection pass.
In this paper, Perkins and Word discard that indirect Bayesian approach in favor of a direct methodto reach the same ends. Here, instead of attempting to “classify” surnames through geographic dis-tribution, we actually link ethnicity and name. The ideal data source for classifying surnames byproportion Hispanic origin would be the 1990 Census in its entirety. Because of disclosure concerns,name has never been part of the computerized permanent record even though the Decennial Censusroutinely requests name for followup purposes.
Nevertheless, a very large sample data set is available that does link name (first and last) to individu-al 1990 Census records. This individual record file, hereafter called the SOR—(Spanish Ori-gin)—file contains 7,154,390 person records1 and was originally created for the purpose of estimat-ing undercount in the 1990 Census. Since slightly over 1.5 millio n of those records lack name and/or Hispanic origin information, we limited ourselves to the 5,609,592 records that include both avalid surname and a response to the Hispanic origin question.
1Following the 1990 Census, the Census Bureau instituted a large scale post-enumerative survey (PES) to measureundercount in the 1990 census (Hogan, 1993; 1992). The formal PES sample was limited to 377,000 persons residing in171,000 households in 5300 preselected blocks. The much larger SOR sample includes those PES blocks AND surround-ing ring blocks. The SOR sample file used in this analysis is nearly 20 times as large as the formal PES sample.
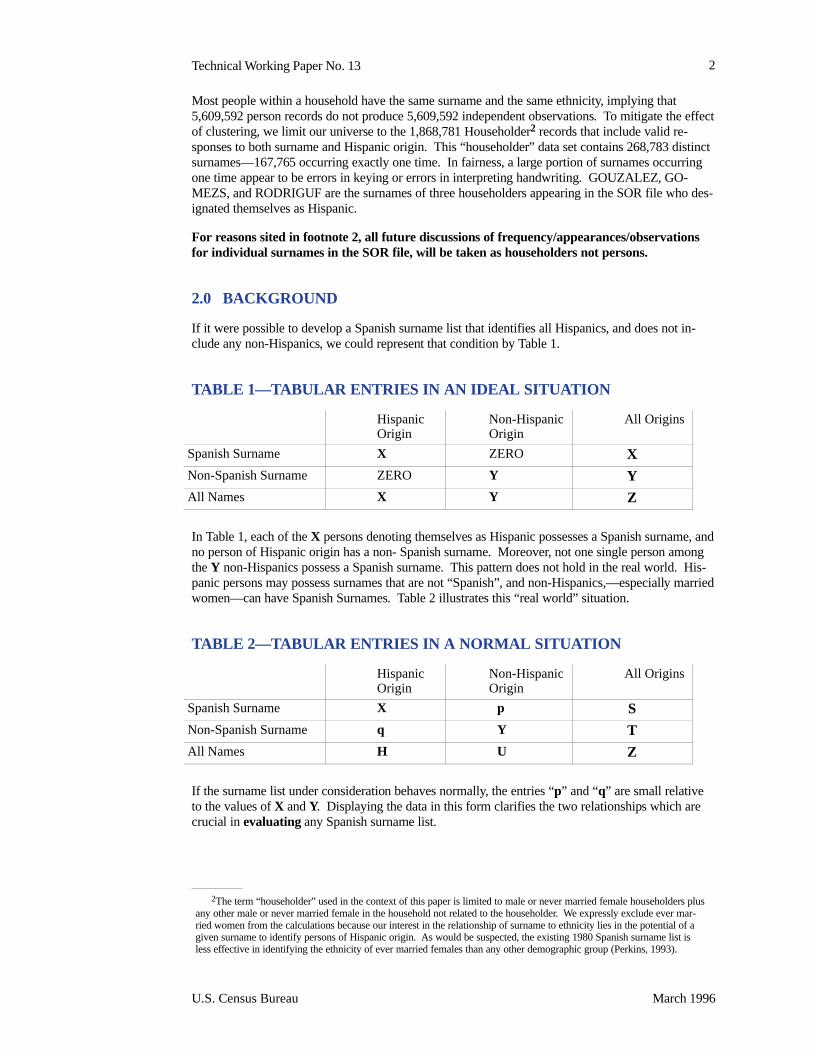
Technical Working Paper No. 13 2
U.S. Census Bureau March 1996
Most people within a household have the same surname and the same ethnicity, implying that5,609,592 person records do not produce 5,609,592 independent observations. To mitigate the effectof clustering, we limit our universe to the 1,868,781 Householder2 records that include valid re-sponses to both surname and Hispanic origin. This “householder” data set contains 268,783 distinctsurnames—167,765 occurring exactly one time. In fairness, a large portion of surnames occurringone time appear to be errors in keying or errors in interpreting handwriting. GOUZALEZ, GO-MEZS, and RODRIGUF are the surnames of three householders appearing in the SOR file who des-ignated themselves as Hispanic.
For r easons sited in footnote 2, all future discussions of frequency/appearances/observationsfor i ndividual surnames in the SOR file, wil l be taken as householders not persons.
2.0 BACKGROUND
If it were possible to develop a Spanish surname list that identifies all Hispanics, and does not in-clude any non-Hispanics, we could represent that condition by Table 1.
TABLE 1—TABULA R ENTRIE S IN AN IDEAL SITUATION
HispanicOrigin
Non-HispanicOrigin
All Origins
Spanish Surname X ZERO XNon-Spanish Surname ZERO Y YAll Names X Y Z
In Table 1, each of the X persons denoting themselves as Hispanic possesses a Spanish surname, andno person of Hispanic origin has a non- Spanish surname. Moreover, not one single person amongthe Y non-Hispanics possess a Spanish surname. This pattern does not hold in the real world. His-panic persons may possess surnames that are not “Spanish”, and non-Hispanics,—especially marriedwomen—can have Spanish Surnames. Table 2 illustrates this “real world” situation.
TABLE 2—TABULA R ENTRIE S IN A NORMA L SITUATION
HispanicOrigin
Non-HispanicOrigin
All Origins
Spanish Surname X p SNon-Spanish Surname q Y TAll Names H U Z
If the surname list under consideration behaves normally, the entries “p” and “q” are small relativeto the values of X and Y. Displaying the data in this form clarifies the two relationships which arecrucial in evaluating any Spanish surname list.
2The term “householder” used in the context of this paper is limited to male or never married female householders plusany other male or never married female in the household not related to the householder. We expressly exclude ever mar-ried women from the calculations because our interest in the relationship of surname to ethnicity lies in the potential of agiven surname to identify persons of Hispanic origin. As would be suspected, the existing 1980 Spanish surname list isless effective in identifying the ethnicity of ever married females than any other demographic group (Perkins, 1993).
Technical Working Paper No. 13 3
U.S. Census Bureau March 1996
1. The entry “p” represents the number of persons possessing any “Spanish surname” appearing onan existing Spanish surname list who do not identify themselves as Hispanic. We define Errorof Commission to be the ratio of p to S. That is, of the S persons who have Spanish surnames,“p” are not Hispanic. As a rule of thumb, fewer than 10 percent of the persons with generallyaccepted “Spanish” surnames fail to identify themselves as Hispanic. Ambiguous surnames,such as SANTOS and SILVA , should be excluded from any Spanish Surname list if a user’sgoal is to minimize Error of Commission.
2. The entry “q” represents persons who identify themselves as Hispanic, but whose surname isnot found on a given Spanish surname list. Erro r of Omission is analogous to Error of Com-mission and is the ratio of q to H. However, Error of Omission is not strictly a rate. It is theproportion of the Hispanic origin population whose last name does not appear on a particularSpanish surname list. Although fewer than 1 percent of persons with non-Spanish surnamesidentify themselves as Hispanic, non-Hispanics outnumber Hispanics by 10 to 1 in the UnitedStates. For that reason, it is virtually impossible for Error of Omission to dip much below 10percent, regardless of “ fringe” surnames that are added to an existing surname list. If one de-sires to lower the Error of Omission at the expense of Error of Commission, indefinite surnamessuch as SANTOS and SILVA need to be included on a Spanish surname list.
3.0 PURPOSE OF CONSTRUCTING A SPANISH SURNAM E LIST
The existing 1980 Spanish surname list was originally created to code persons of Spanish surname inthe five Southwestern States at the time of the 1980 Census (Passel and Word, 1980). But that sur-name list has had a far wider range of uses and users since its release. Five practical applicationsinvolving the use of Spanish surnames follow:
3.1 Mortalit y Studies. Until very recently (late 1960’s) there was no attempt to identify the LatinAmerican community with a single unifying term. As a result, Mexicans, Germans, Iraqis andPeruvians were terms for persons of four distinct ethnic groups. By the late 1970’s, the termSpanish origin came into vogue and Mexicans, Peruvians, Puerto Ricans, etc. were combinedunder a single generic designation—Spanish origin population. (The term Spanish origin hasgradually been replaced or used interchangeably with the term Hispanic origin.) At the sametime (1980) the Social Security Administration (SSA) revised their application form to requestethnic (”Hispanic”) information for Social Security applicants. But neither Social Security norits sister agency, Health Care Financing Administration (HCFA/Medicare), felt that it was nec-essary to obtain direct information on Hispanic origin for persons who had applied for and re-ceived Social Security numbers prior to 1980.
In order to obtain information on mortality of the elderly Hispanic population, HCFA is contem-plating a large scale mortality study of the Hispanic origin population enrolled in Medicare. Fora large proportion of that population, “Hispanic origin” wil l be defined and assigned on the ba-sis of surnames contained on either the existing 1980 or the new 1990 Spanish surname list.
3.2 Population Estimates. The Census Bureau’s initial effort at producing local area populationestimates for the Hispanic population (Word, 1989) relied on the premise that the domesticmigration rate of the Hispanic origin population could be approximated from the migration ofthe Spanish surnamed population as defined in 1980.
3.3 Customer Base. A utilit y company knows its customer base (by surname) at time t0 and timet1. The ratio of Spanish surnamed customers at the end point relative to the starting point pro-vides an excellent basis for estimating change in the Hispanic origin population from the begin-ning to the end of the time period.
3.4 Marketing. In the first three applications, it was more important to limit errors of commissionthan errors of omission. But for marketing purposes it is generally useful to approach personswho are tangential to the group being studied. Suppose that a publisher wishes to launch a mag-
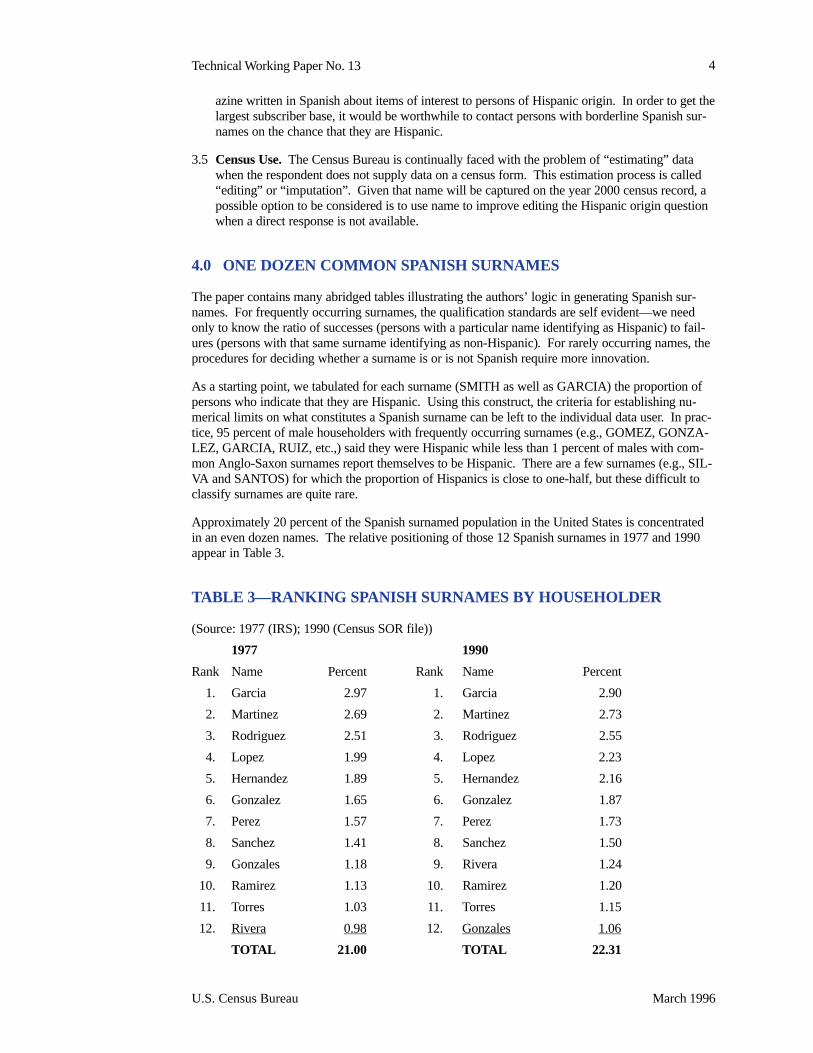
Technical Working Paper No. 13 4
U.S. Census Bureau March 1996
azine written in Spanish about items of interest to persons of Hispanic origin. In order to get thelargest subscriber base, it would be worthwhile to contact persons with borderline Spanish sur-names on the chance that they are Hispanic.
3.5 Census Use. The Census Bureau is continually faced with the problem of “estimating” datawhen the respondent does not supply data on a census form. This estimation process is called“editing” or “imputation”. Given that name wil l be captured on the year 2000 census record, apossible option to be considered is to use name to improve editing the Hispanic origin questionwhen a direct response is not available.
4.0 ONE DOZEN COMMO N SPANISH SURNAMES
The paper contains many abridged tables illustrating the authors’ l ogic in generating Spanish sur-names. For frequently occurring surnames, the qualification standards are self evident—we needonly to know the ratio of successes (persons with a particular name identifying as Hispanic) to fail-ures (persons with that same surname identifying as non-Hispanic). For rarely occurring names, theprocedures for deciding whether a surname is or is not Spanish require more innovation.
As a starting point, we tabulated for each surname (SMITH as well as GARCIA) the proportion ofpersons who indicate that they are Hispanic. Using this construct, the criteria for establishing nu-merical limits on what constitutes a Spanish surname can be left to the individual data user. In prac-tice, 95 percent of male householders with frequently occurring surnames (e.g., GOMEZ, GONZA-LEZ, GARCIA, RUIZ, etc.,) said they were Hispanic while less than 1 percent of males with com-mon Anglo-Saxon surnames report themselves to be Hispanic. There are a few surnames (e.g., SIL-VA and SANTOS) for which the proportion of Hispanics is close to one-half, but these difficul t toclassify surnames are quite rare.
Approximately 20 percent of the Spanish surnamed population in the United States is concentratedin an even dozen names. The relative positioning of those 12 Spanish surnames in 1977 and 1990appear in Table 3.
TABLE 3—RANKIN G SPANISH SURNAME S BY HOUSEHOLDER
(Source: 1977 (IRS); 1990 (Census SOR file))
1977 1990
Rank Name Percent Rank Name Percent
1. Garcia 2.97 1. Garcia 2.90
2. Martinez 2.69 2. Martinez 2.73
3. Rodriguez 2.51 3. Rodriguez 2.55
4. Lopez 1.99 4. Lopez 2.23
5. Hernandez 1.89 5. Hernandez 2.16
6. Gonzalez 1.65 6. Gonzalez 1.87
7. Perez 1.57 7. Perez 1.73
8. Sanchez 1.41 8. Sanchez 1.50
9. Gonzales 1.18 9. Rivera 1.24
10. Ramirez 1.13 10. Ramirez 1.20
11. Torres 1.03 11. Torres 1.15
12. Rivera 0.98 12. Gonzales 1.06
TOTAL 21.00 TOTAL 22.31
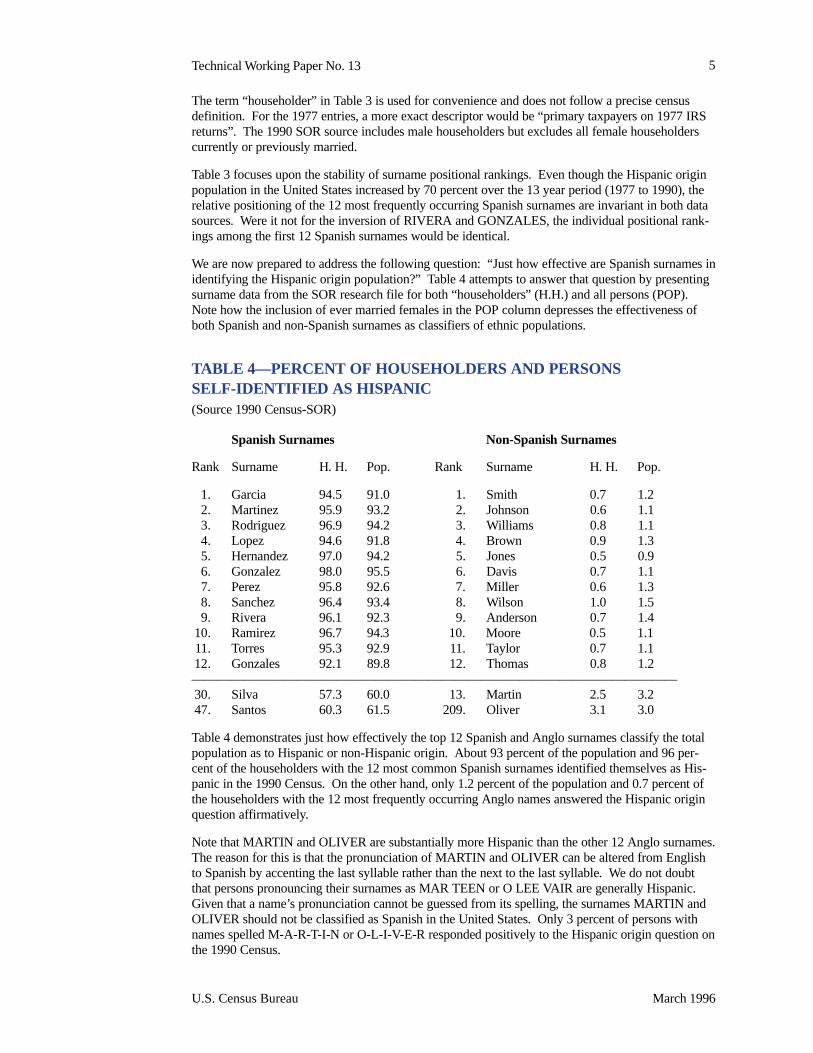
Technical Working Paper No. 13 5
U.S. Census Bureau March 1996
The term “householder” i n Table 3 is used for convenience and does not follow a precise censusdefinition. For the 1977 entries, a more exact descriptor would be “primary taxpayers on 1977 IRSreturns”. The 1990 SOR source includes male householders but excludes all female householderscurrently or previously married.
Table 3 focuses upon the stability of surname positional rankings. Even though the Hispanic originpopulation in the United States increased by 70 percent over the 13 year period (1977 to 1990), therelative positioning of the 12 most frequently occurring Spanish surnames are invariant in both datasources. Were it not for the inversion of RIVERA and GONZALES, the individual positional rank-ings among the first 12 Spanish surnames would be identical.
We are now prepared to address the following question: “Just how effective are Spanish surnames inidentifying the Hispanic origin population?” Table 4 attempts to answer that question by presentingsurname data from the SOR research file for both “householders” (H.H.) and all persons (POP).Note how the inclusion of ever married females in the POP column depresses the effectiveness ofboth Spanish and non-Spanish surnames as classifiers of ethnic populations.
TABLE 4—PERCENT OF HOUSEHOLDERS AND PERSONSSELF-IDENTIFIE D AS HISPANIC (Source 1990 Census-SOR)
Spanish Surnames Non-Spanish Surnames
Rank Surname H. H. Pop. Rank Surname H. H. Pop.
1. Garcia 94.5 91.0 1. Smith 0.7 1.22. Martinez 95.9 93.2 2. Johnson 0.6 1.1
3. Rodriguez 96.9 94.2 3. Williams 0.8 1.1 4. Lopez 94.6 91.8 4. Brown 0.9 1.3 5. Hernandez 97.0 94.2 5. Jones 0.5 0.96. Gonzalez 98.0 95.5 6. Davis 0.7 1.1 7. Perez 95.8 92.6 7. Miller 0.6 1.3
8. Sanchez 96.4 93.4 8. Wilson 1.0 1.5 9. Rivera 96.1 92.3 9. Anderson 0.7 1.410. Ramirez 96.7 94.3 10. Moore 0.5 1.111. Torres 95.3 92.9 11. Taylor 0.7 1.112. Gonzales 92.1 89.8 12. Thomas 0.8 1.2—————————————————————————————————————30. Silva 57.3 60.0 13. Martin 2.5 3.247. Santos 60.3 61.5 209. Oliver 3.1 3.0
Table 4 demonstrates just how effectively the top 12 Spanish and Anglo surnames classify the totalpopulation as to Hispanic or non-Hispanic origin. About 93 percent of the population and 96 per-cent of the householders with the 12 most common Spanish surnames identified themselves as His-panic in the 1990 Census. On the other hand, only 1.2 percent of the population and 0.7 percent ofthe householders with the 12 most frequently occurring Anglo names answered the Hispanic originquestion affirmatively.
Note that MARTIN and OLIVER are substantially more Hispanic than the other 12 Anglo surnames.The reason for this is that the pronunciation of MARTIN and OLIVER can be altered from Englishto Spanish by accenting the last syllable rather than the next to the last syllable. We do not doubtthat persons pronouncing their surnames as MAR TEEN or O LEE VAIR are generally Hispanic.Given that a name’s pronunciation cannot be guessed from its spelling, the surnames MARTIN andOLIVER should not be classified as Spanish in the United States. Only 3 percent of persons withnames spelled M-A-R-T-I-N or O-L-I-V-E-R responded positively to the Hispanic origin question onthe 1990 Census.
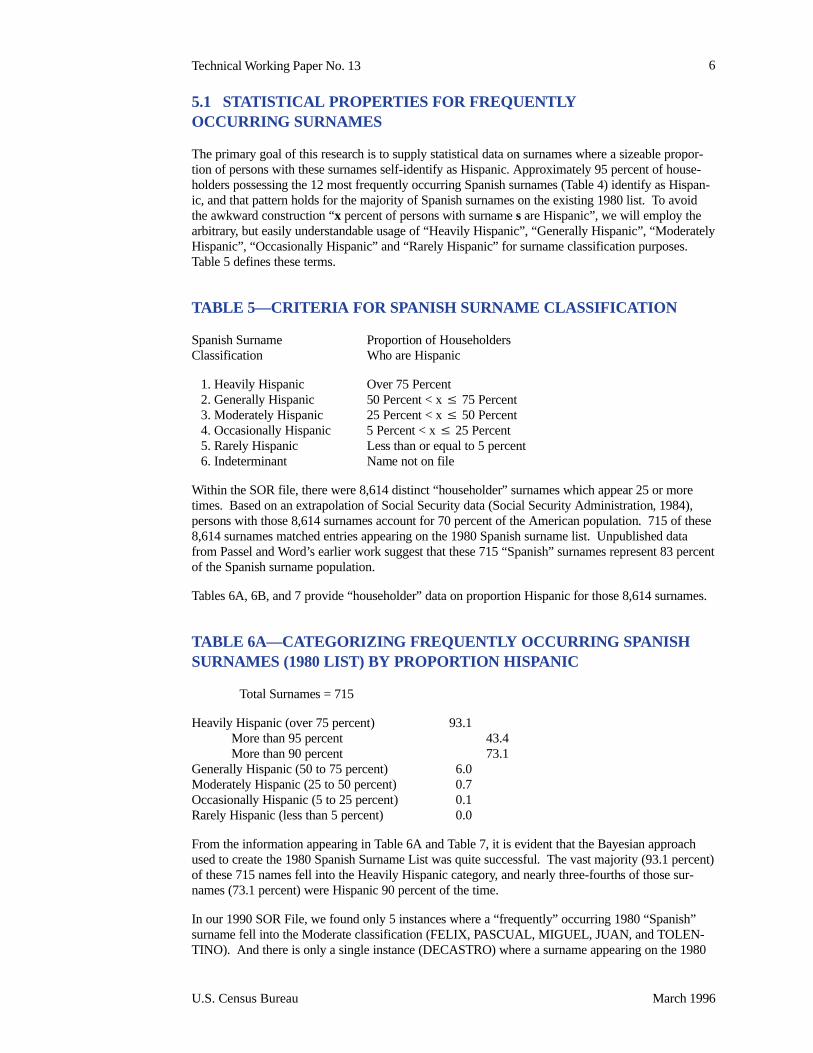
Technical Working Paper No. 13 6
U.S. Census Bureau March 1996
5.1 STATISTICA L PROPERTIES FOR FREQUENTLY OCCURRING SURNAMES
The primary goal of this research is to supply statistical data on surnames where a sizeable propor-tion of persons with these surnames self-identify as Hispanic. Approximately 95 percent of house-holders possessing the 12 most frequently occurring Spanish surnames (Table 4) identify as Hispan-ic, and that pattern holds for the majority of Spanish surnames on the existing 1980 list. To avoidthe awkward construction “x percent of persons with surname s are Hispanic”, we wil l employ thearbitrary, but easily understandable usage of “Heavily Hispanic”, “Generally Hispanic”, “ModeratelyHispanic”, “Occasionally Hispanic” and “Rarely Hispanic” for surname classification purposes.Table 5 defines these terms.
TABLE 5—CRITERI A FOR SPANISH SURNAM E CLASSIFICATION
Spanish Surname Proportion of HouseholdersClassification Who are Hispanic
1. Heavily Hispanic Over 75 Percent2. Generally Hispanic 50 Percent < x � 75 Percent3. Moderately Hispanic 25 Percent < x � 50 Percent4. Occasionally Hispanic 5 Percent < x � 25 Percent5. Rarely Hispanic Less than or equal to 5 percent6. Indeterminant Name not on file
Within the SOR file, there were 8,614 distinct “householder” surnames which appear 25 or moretimes. Based on an extrapolation of Social Security data (Social Security Administration, 1984),persons with those 8,614 surnames account for 70 percent of the American population. 715 of these8,614 surnames matched entries appearing on the 1980 Spanish surname list. Unpublished datafrom Passel and Word’s earlier work suggest that these 715 “Spanish” surnames represent 83 percentof the Spanish surname population.
Tables 6A, 6B, and 7 provide “householder” data on proportion Hispanic for those 8,614 surnames.
TABLE 6A—CATEGORIZIN G FREQUENTLY OCCURRING SPANISHSURNAMES (1980 LIST) BY PROPORTION HISPANIC
Total Surnames = 715
Heavily Hispanic (over 75 percent) 93.1More than 95 percent 43.4More than 90 percent 73.1
Generally Hispanic (50 to 75 percent) 6.0Moderately Hispanic (25 to 50 percent) 0.7Occasionally Hispanic (5 to 25 percent) 0.1Rarely Hispanic (less than 5 percent) 0.0
From the information appearing in Table 6A and Table 7, it is evident that the Bayesian approachused to create the 1980 Spanish Surname List was quite successful. The vast majority (93.1 percent)of these 715 names fell into the Heavily Hispanic category, and nearly three-fourths of those sur-names (73.1 percent) were Hispanic 90 percent of the time.
In our 1990 SOR File, we found only 5 instances where a “frequently” occurring 1980 “Spanish”surname fell into the Moderate classification (FELIX, PASCUAL, MIGUEL, JUAN, and TOLEN-TINO). And there is only a single instance (DECASTRO) where a surname appearing on the 1980
Technical Working Paper No. 13 7
U.S. Census Bureau March 1996
Spanish list would be classified as Occasionally Hispanic based on data in the SOR file. No sur-name appearing on the 1980 Spanish surname list occurring 25 or more times falls into the RarelyHispanic category.
We now turn to the 7,899 surnames occurring at least 25 times in the SOR file that do not appear onthe 1980 Spanish surname list.
TABLE 6B—CATEGORIZIN G FREQUENTLY OCCURRINGNON-SPANISH SURNAME S (1980 LIST) BY PROPORTION HISPANIC
(Total Surnames = 7,899)
Rarely Hispanic (less than 5 percent) 96.3Less than 2 percent 84.3
Occasionally Hispanic (5 to 25 percent) 3.0Moderately Hispanic (25 to 50 percent) 0.5Generally Hispanic (50 to 75 percent) 0.3Heavily Hispanic (over 75 percent) 0.0
Based on results from the SOR sample, not one of the 7,899 most frequently occurring “non-Spanishsurnames” would now be assigned to the Heavily Hispanic category. There are, however, 20 sur-names categorized as Generally Hispanic based on the SOR sample. They are, in order of Hispanicoccurrence: (1) SILVA , (2) ROMAN, (3) MACHADO, (4) VENTURA, (5) PIMENTEL, (6) PAL-MA, (7) AQUINO, (8) BELLO, (9) ARAUJO, (10) CHAVES, (11) LEMOS, (12) VALERIO, (13)MANZO, (14) MATTA, (15) SALVADOR, (16) MACEDO, (17) VICTORIA, (18) BARBOZA,(19) REAL, and (20) LOMAS
Table 7 provides a numerical assessment of the Hispanic classification for the 8,614 surnames whichappear 25 or more times in the SOR file. When Passel and Word created their 1980 Spanish sur-name list, they did not have the luxury of using the General or Moderate classification where most ofthe inconsistencies lie. As might be expected many of the surnames falling into those two categorieswere considered “close calls” by Word and Passel when they developed the 1980 Spanish surnamelist.
TABLE 7—HISPANIC CLASSIFICATIO N FOR SURNAME S OCCURRING 25 OR MORE TIME S ON THE SOR FILE
(On List: surname classified as Spanish in 1980)
On List Not on List
Heavily Hispanic (75% and over) 666 0Generally Hispanic (50-75%) 43 20Moderately Hispanic (25-50%) 5 42Occasionally Hispanic (5-25%) 1 234Rarely Hispanic (less than 5%) 0 7603
TOTAL 715 7899
Technical Working Paper No. 13 8
U.S. Census Bureau March 1996
Summary: The most frequent 8,614 surnames (715 + 7899) in the SOR file are exceedingly effi-cient for differentiating the Hispanic and Non-Hispanic populations. All of the 666 names which areover 75 percent Hispanic in the SOR file were identified as Spanish surnames in 1980. There are7,603 surnames, none previously categorized as “Spanish”, where fewer than 5 percent of respond-ents indicated that they are Hispanic. Note the paucity of surnames falling into the General andModerate categories.
5.2 STATISTICA L PROPERTIES FOR INFREQUENTLY OCCURRING SURNAMES
Even though the 8,614 most frequently occurring surnames in the SOR file contain 70 percent of thetotal population and 83 percent of the Spanish surname population, they represent a very small pro-portion of all surnames or all surnames designated as “Spanish”. The information appearing in Table8 demonstrates that the correspondence between surnames classified as Spanish in 1980 and 1990becomes somewhat weaker as the SOR sample thins. Nevertheless, the correspondence betweensurname and ethnicity for surnames occurring as few as 5 to 9 times in the SOR “householder” sam-ple is stil l strong.
TABLE 8—CLASSIFYIN G SURNAME S ON THE 1980 SPANISHSURNAME LIST ACCORDING TO NUMBER OF OBSERVATIONS ONTHE SOR FIL E (householder only)
Group I, 25 or More Observations n = 715Group II, 10 to 24 Observation n = 605Group III, 5 to 9 Observations n = 776
Group I Group II Group IIIn = 715 n = 605 n = 776
Heavily Hispanic 93.1 84.3 78.4Generally Hispanic 6.0 10.4 11.1Moderately Hispanic 0.7 3.3 6.1Occasionally Hispanic 0.1 1.6 2.6Rarely Hispanic 0.0 0.3 1.9
Again referring to Passel and Word’s unpublished data, the most frequent 1320 (those occurring 10or more times) Spanish surnames on their 1980 list cover 90.6 percent of the Spanish surnamed pop-ulation. When we extend the universe to the most frequent 2096 Spanish surnames (those occurring5 or more times in the SOR sample), we reach 93.6 percent of the 1980 Spanish surnamed popula-tion.
Table 9, following, is similar to Table 7 but is confined to surnames appearing 5 to 24 times in theSOR file.
Technical Working Paper No. 13 9
U.S. Census Bureau March 1996
TABLE 9—1990 HISPANIC CLASSIFICATIO N OF SURNAMESOCCURRING 5 TO 24 TIME S IN THE SOR FIL E BASED ON HISPANICCLASSIFICATIO N IN 1980
10 to 24 5 to 9Observations Observations
1990 Hispanic On 1980 Not On On 1980 Not OnClassification List 1980 List List 1980 List
Heavily Hispanic 510 9 600 58Generally Hispanic 63 22 94 53Moderately Hispanic 20 79 50 151Occasionally Hispanic 10 893 17 1005Rarely Hispanic 2 9033 15 15345
TOTAL 605 10036 776 16612
As before, the terms “On” and “Not On” refer to whether the surname does or does not appear onthe 1980 Spanish surname list. There are 1381 (605+776) different surnames on the 1980 Spanishsurname list which appear 5 to 24 times in the SOR sample file. Only 44 (10 + 2 + 17 + 15) ofthose surnames wil l be reclassified as either Occasionally or Rarely Hispanic based on the 1990analysis.
Again referring to Table 9, we find that there are 26,648 (10,036 + 16,612) different surnames occur-ring 5 to 24 times on the SOR file that do not appear on the 1980 Spanish surname list. Only 67(9+58) of those names are now classified as Heavily Hispanic. An additional 75 names (22+53) fallinto the Generally Hispanic category.
Summary: Of the 605 Spanish names on the 1980 list occurring 10 to 24 times, 95 percent fall intothe Heavy or General classifications, and only 2 names fall into the Rarely Hispanic group. For 776names that occurred 5 to 9 times, almost 90 percent continue to be classified as Heavily or GenerallySpanish. Fifteen surnames previously classified as Hispanic are now Rarely Hispanic.
6.0 LIMITATIONS
The data presented in Tables 3 through 9 are derived from a sample—albeit a very large one. The5,609,592 matchable SOR records contain 597,533 individuals who reported themselves to be His-panic in the 1990 Census. The proportion Hispanic (10.7 percent) within the SOR sample is higherthan the Hispanic proportion (9.0 percent) enumerated in the 1990 Census. This finding is not unex-pected as there was a conscious effort to oversample Hispanics in the PES. If we were using un-weighted responses to estimate the total proportion of population with Spanish surnames, we wouldcertainly overstate that ratio. But this analysis does not attempt to estimate population totals; rather,our goal is to estimate (on a name by name basis) the proportion of persons who are Hispanic. Withthis goal in mind there is no inherent reason against using unweighted observations.
Another limitation is response variance. We must accept the individuals census designation as to hisor her origin. For most census question such as sex and age, a respondent wil l provide answers thatare consistent over time. Based on the 1990 Decennial Census Content Reinterview Survey(McKenney et al, 1993), about 7 percent of persons saying that they were Hispanic origin in the1990 Census decided that they were non-Spanish at the later date. And 11 percent of persons sayingthat they were Hispanic origin in the reinterview, indicated that they were non-Spanish on their 1990Census forms. This recent finding on lack of consistency for Hispanic origin response reinforce pre-vious findings from reinterview surveys.
Technical Working Paper No. 13 10
U.S. Census Bureau March 1996
Finally, we have errors in measurement due to random sampling. When 90 persons out of 100 witha particular name in the SOR sample answer the Spanish origin question affirmatively, we say that90 percent of persons with that surname are Hispanic. But, there is an error associated with that esti-mate. Using the normal approximation to the binomial, the standard error of that estimate is approx-
imately p * (1� p)�(n��. Here p = 0.9 and n = 100. Table 10 below displays values of sampling
errors associated with two choices of “p” and three values of “n”.
TABLE 10—STANDARD ERRORS IN PROPORTION HISPANIC ARISIN G FROM A SAMPLE
N X P Sp
300 270 90.0 1.7100 90 90.0 3.030 27 90.0 5.5*
300 210 70.0 2.6100 70 70.0 4.630 21 70.0 8.4
In Table 10, N = observations;X = Hispanics;P = Proportion Hispanic (x/n)Sp = Standard error of p in percent
* When x or (n-x) drops below 5, the values of the normal distribution are no longer appropriate.For this row, the two sigma upper and lower limits are 97.5 and 73.7 percent.
7.0 RARELY OCCURRING SURNAMES: OR WHEN DO STATISTICSEND AND WHEN DOES COMMO N SENSE TAK E OVER?
To this point we have confined our comments to surnames appearing 5 or more times in our data set.Those 34,000 surnames encompass 85 percent of the householder population in the SOR file but lessthan 15 percent of the number of different surnames appearing in that file. Our goal is to classifyevery surname appearing on the SOR file; but for names appearing less than five times the propor-tion Hispanic should not and wil l not be the sole criterion for classification. In this section, we out-line the thought process used in classifying infrequently occurring surnames. The exact details arefound in Appendix Section 10.2 on page 21.
The 7.2 millio n record SOR file is a reasonably representative national sample (almost 3 percent) ofpersons enumerated in the 1990 Census. In general terms, it is quite possible to designate a surnameas being Heavily Hispanic or Rarely Hispanic from samples of three or possibly even two surnames;but samples of this size are inappropriate for separating Generally Hispanic from Moderately His-panic or Moderately Hispanic from Occasionally Hispanic. Table 11 presents data demonstratingwhy it is difficul t to badly misclassify the ethnicity of a surname when 5 independent observationsof that surname exist.
Assume that we are trying to categorize three separate surnames, and that five independent observa-tions exist for each name. We also happen to know that among all Americans, surname “H” (Heavi-ly) is 90 percent Hispanic; surname “M” (Midway) is 50 percent Hispanic and surname “R” (Rarely)is 2 percent Hispanic. Table 11 provides binomial probabilities (in percent) of getting 0, 1, 2, 3, 4,and 5 persons identifying as Hispanic for each of these three surnames.
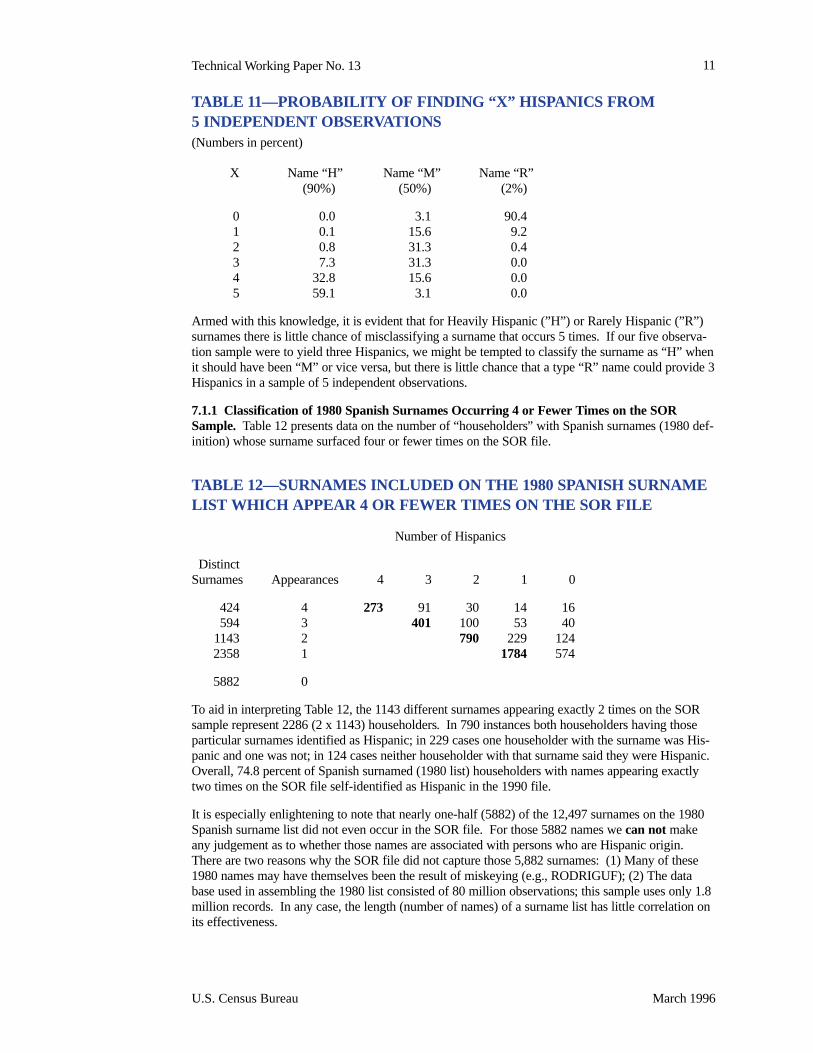
Technical Working Paper No. 13 11
U.S. Census Bureau March 1996
TABLE 11—PROBABILIT Y OF FINDIN G “X” H ISPANICS FROM 5 INDEPENDENT OBSERVATIONS (Numbers in percent)
X Name “H” Name “M” Name “R”(90%) (50%) (2%)
0 0.0 3.1 90.41 0.1 15.6 9.22 0.8 31.3 0.43 7.3 31.3 0.04 32.8 15.6 0.05 59.1 3.1 0.0
Armed with this knowledge, it is evident that for Heavily Hispanic (”H” ) or Rarely Hispanic (”R”)surnames there is little chance of misclassifying a surname that occurs 5 times. If our five observa-tion sample were to yield three Hispanics, we might be tempted to classify the surname as “H” whenit should have been “M” or vice versa, but there is little chance that a type “R” name could provide 3Hispanics in a sample of 5 independent observations.
7.1.1 Classification of 1980 Spanish Surnames Occurrin g 4 or Fewer T imes on the SOR Sample. Table 12 presents data on the number of “householders” with Spanish surnames (1980 def-inition) whose surname surfaced four or fewer times on the SOR file.
TABLE 12—SURNAMES INCLUDED ON THE 1980 SPANISH SURNAMELIST WHIC H APPEAR 4 OR FEWER TIME S ON THE SOR FILE
Number of Hispanics
DistinctSurnames Appearances 4 3 2 1 0
424 4 273 91 30 14 16594 3 401 100 53 40
1143 2 790 229 1242358 1 1784 574
5882 0
To aid in interpreting Table 12, the 1143 different surnames appearing exactly 2 times on the SORsample represent 2286 (2 x 1143) householders. In 790 instances both householders having thoseparticular surnames identified as Hispanic; in 229 cases one householder with the surname was His-panic and one was not; in 124 cases neither householder with that surname said they were Hispanic.Overall, 74.8 percent of Spanish surnamed (1980 list) householders with names appearing exactlytwo times on the SOR file self-identified as Hispanic in the 1990 file.
It is especially enlightening to note that nearly one-half (5882) of the 12,497 surnames on the 1980Spanish surname list did not even occur in the SOR file. For those 5882 names we can not makeany judgement as to whether those names are associated with persons who are Hispanic origin.There are two reasons why the SOR file did not capture those 5,882 surnames: (1) Many of these1980 names may have themselves been the result of miskeying (e.g., RODRIGUF); (2) The database used in assembling the 1980 list consisted of 80 millio n observations; this sample uses only 1.8million records. In any case, the length (number of names) of a surname list has little correlation onits effectiveness.
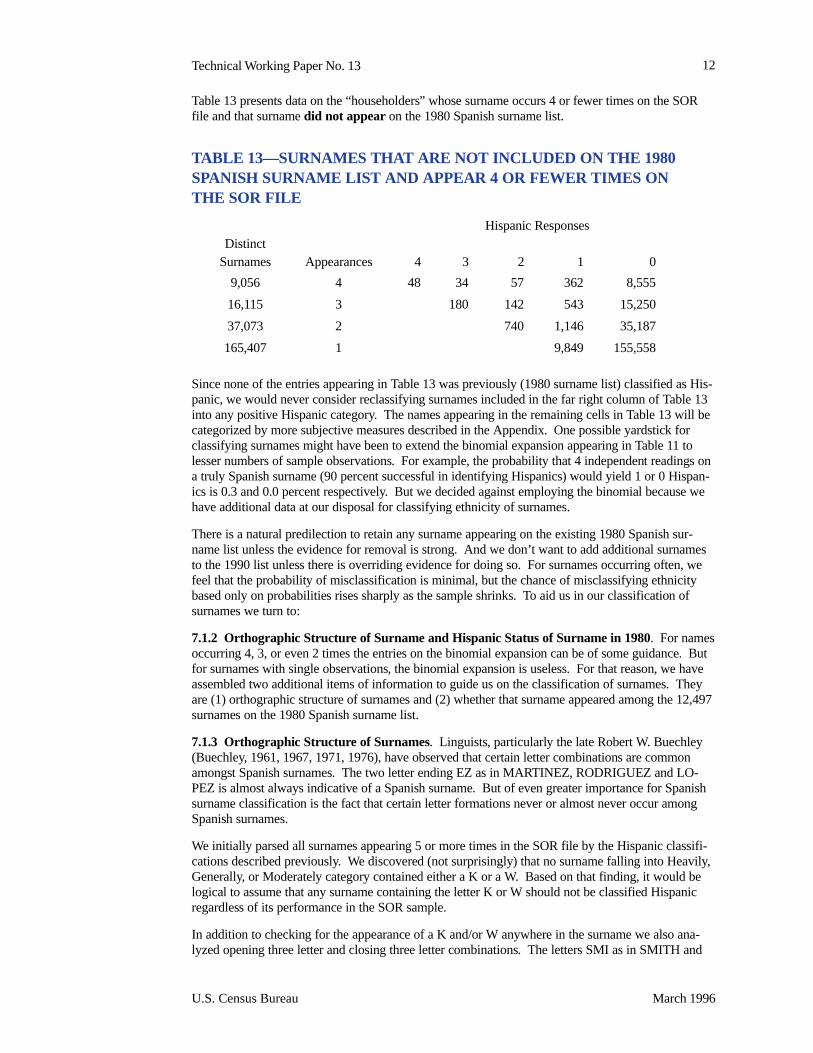
Technical Working Paper No. 13 12
U.S. Census Bureau March 1996
Table 13 presents data on the “householders” whose surname occurs 4 or fewer times on the SORfil e and that surname did not appear on the 1980 Spanish surname list.
TABLE 13—SURNAMES THAT ARE NOT INCLUDED ON THE 1980SPANISH SURNAM E LIST AND APPEAR 4 OR FEWER TIME S ON THE SOR FILE
Hispanic ResponsesDistinct
Surnames Appearances 4 3 2 1 0
9,056 4 48 34 57 362 8,555
16,115 3 180 142 543 15,250
37,073 2 740 1,146 35,187
165,407 1 9,849 155,558
Since none of the entries appearing in Table 13 was previously (1980 surname list) classified as His-panic, we would never consider reclassifying surnames included in the far right column of Table 13into any positive Hispanic category. The names appearing in the remaining cells in Table 13 wil l becategorized by more subjective measures described in the Appendix. One possible yardstick forclassifying surnames might have been to extend the binomial expansion appearing in Table 11 tolesser numbers of sample observations. For example, the probability that 4 independent readings ona truly Spanish surname (90 percent successful in identifying Hispanics) would yield 1 or 0 Hispan-ics is 0.3 and 0.0 percent respectively. But we decided against employing the binomial because wehave additional data at our disposal for classifying ethnicity of surnames.
There is a natural predilection to retain any surname appearing on the existing 1980 Spanish sur-name list unless the evidence for removal is strong. And we don’t want to add additional surnamesto the 1990 list unless there is overriding evidence for doing so. For surnames occurring often, wefeel that the probability of misclassification is minimal, but the chance of misclassifying ethnicitybased only on probabilities rises sharply as the sample shrinks. To aid us in our classification ofsurnames we turn to:
7.1.2 Orthographi c Structur e of Surname and Hispanic Status of Surname in 1980. For namesoccurring 4, 3, or even 2 times the entries on the binomial expansion can be of some guidance. Butfor surnames with single observations, the binomial expansion is useless. For that reason, we haveassembled two additional items of information to guide us on the classification of surnames. Theyare (1) orthographic structure of surnames and (2) whether that surname appeared among the 12,497surnames on the 1980 Spanish surname list.
7.1.3 Orthographi c Structur e of Surnames. Linguists, particularly the late Robert W. Buechley(Buechley, 1961, 1967, 1971, 1976), have observed that certain letter combinations are commonamongst Spanish surnames. The two letter ending EZ as in MARTINEZ, RODRIGUEZ and LO-PEZ is almost always indicative of a Spanish surname. But of even greater importance for Spanishsurname classification is the fact that certain letter formations never or almost never occur amongSpanish surnames.
We initially parsed all surnames appearing 5 or more times in the SOR file by the Hispanic classifi-cations described previously. We discovered (not surprisingly) that no surname falling into Heavily,Generally, or Moderately category contained either a K or a W. Based on that finding, it would belogical to assume that any surname containing the letter K or W should not be classified Hispanicregardless of its performance in the SOR sample.
In addition to checking for the appearance of a K and/or W anywhere in the surname we also ana-lyzed opening three letter and closing three letter combinations. The letters SMI as in SMITH and
Technical Working Paper No. 13 13
U.S. Census Bureau March 1996
JOH as in JOHNSON never initiated surnames falling into the first 3 Hispanic categories and ITH isnot a Hispanic ending among frequently occurring SOR names. Buechley had previously deter-mined that there are 1465 valid 3 letter starts and 1114 valid 3 letter endings among Spanish sur-names. (More information on starts and endings appear in the technical Appendix.)
A third orthographic finding is that double letters excepting R and L just don’t occur. The notableexceptions are S AA VEDRA, JA SS O, DELO SS ANTOS, and CO TT O. Thus a surname con-taining a double letter excepting RR and LL should not be classified as Spanish regardless of theproportion of householders with that surname who are Hispanic in the SOR file.
7.1.4 Hispanic Status of Surname in 1980. A second and final auxiliary item of information usedin determining Hispanic classification for low occurrence surnames in the SOR was the 1980 status.We felt that the previous research was sound and the knowledge of whether a surname was or wasnot Spanish on the previous list was a piece of information to be used in categorizing surnames.
Summary—For frequently occurring surnames (e.g., 5 or more times in the SOR file), we believethat proportion Hispanic should be the sole means for classifying a surname. For rarely occurringsurnames, there are three indicators used in classifying. They are, listed in importance: (1) propor-tion Hispanic, (2) orthographic structure, and (3) appearance on 1980 surnames list. See Section10.2 in the Appendix for additional details on how these three criteria fit into a point value system.
8.0 CONCLUSION
The authors hope that the evidence presented here convinces the reader that a well constructed Span-ish surname list is a useful alternative for identifying persons of Hispanic origin when Hispanic ori-gin is not known. In some instances (estimating rate of change in the Hispanic origin population)defining Spanish origin solely through the use of surname may be preferable to self-designated His-panic origin because surname provides a “consistent” response.
With very few exceptions every frequently occurring surname is either Heavily Hispanic or RarelyHispanic and there is no middle ground. This finding is the determining factor why Spanish sur-name is such an excellent proxy for identifying Hispanics within the United States. Based on theanalysis of the SOR file, fewer than 1000 surnames are sufficient for capturing 80 percent of theHispanic population in the United States. Moreover, householders with those surnames are Hispanic95 percent of the time.
The Census Bureau has released Spanish surnames following the Censuses of 1950, 1960, 1970, and1980. This 1990 edition is only another station on an ongoing research journey, but this 1990 prod-uct does differ significantly from its predecessors. Each of the 25,277 individual surnames appear-ing on the electronic file that supplements this report contain auxiliary information allowing prospec-tive users the flexibility to construct their own Spanish surname list if necessary. For example, weprovide data on the surnames SMITH , JONES, and ROBINSON as well as GARCIA , GOMEZ,and SILVA . Granted, it is unlikely that any one would use this auxiliary information to concludethat SMITH is a Spanish surname. In theory, we are not providing a Spanish surname “list” . Rath-er, we provide auxiliary data for each surname that can be sorted into a continuum allowing the pro-spective user to determine his or her own criteria as to what is or is not a Spanish surname.
If the SOR sample universe was doubled or even tripled (we had 1.9 millio n households in the SORsample), we might have a better measure for classifying surnames that now appear 3 to 5 times. Buta larger sample would also double or triple the number of persons named SMIT H and GARCIAwhere the current sample size is already sufficient for classifying Hispanic status. Moreover, sur-names that do not occur in this sample might appear 1 or 2 times in the larger sample and the prob-lems with infrequently occurring surnames would stil l remain; only the infrequent surnames wouldbe different.
Technical Working Paper No. 13 14
U.S. Census Bureau March 1996
9.0 REFERENCES
1. Word, David L., Jeffrey S. Passel, Beverly D. Causey, and Edward F. Fernandez , “Determininga List of Spanish Surnames by Analysis of Geographical Distributions.” Unpublished paperdelivered at annual meeting of Southern Regional Demographic Group, San Antonio Texas,October 1978
2a. Hogan, Howard, “The 1990 Post-Enumeration Survey: Operations and Results,” The Journalof the American Statistical Association, 88:423, pp. 1047-1060, 1993.
2b. Hogan, Howard, “The 1990 Post-Enumeration Survey: An Overview”, The American Statisti-cian, 46:4, pp. 291-269, 1992.
3. Perkins, R. Colby, “Evaluating the Passel-Word Spanish Surname List: 1990 Decennial CensusPost Enumeration Survey Results.”, Population Estimates and Projections Technical WorkingPaper Series, August 1993
4. Passel, Jeffrey S. and David L. Word, “Constructing the List of Spanish Surnames for the 1980Census: An Application of Bayes’ Theorem”, paper presented at the Annual Meeting of thePopulation Association of America, Denver, 1980.
4. Word, David L, “Population Estimates by Race and Hispanic Origin for States, MetropolitanAreas, and Selected Counties: 1980 to 1985.”, Current Population Reports, Series P-25, No1040 RD-1, Bureau of the Census, May 1989.
5. McKenney, Nampeo, Claudette Bennett, Roderick Harrison, and Jorge del Pinal, “EvaluatingRacial and Ethnic Reporting in the 1990 Census”, American Statistical Association, Proceedingsof the Section on Survey Research Methods, 1993.
6. Social Security Administration, “Report of Distribution of Surnames in the Social SecurityNumber File September 1, 1984”, 1984.
7a. Buechley, Robert W., 1961. “A Reproducible Method of Counting Persons of Spanish Sur-name”, Journal of the American Statistical Association 56 (March 1961)
7b. Buechley, Robert W., 1967. “Characteristic Name Sets of Spanish Populations”, Names 15 (1,March 1967): 53-69.
7c. Buechley, Robert W., 1971. “Spanish Surnames Among the 2,000 Most Common United StatesSurnames”, Names 19, (2, June 1971)
7d. Buechley, Robert W., 1976. “Generally Useful Ethnic Search System: GUESS”, mimeographedpaper, Cancer Research and Treatment Center, University of New Mexico, Albuquerque, NewMexico, November 1976.
Technical Working Paper No. 13 15
U.S. Census Bureau March 1996
10.0 APPENDIX
A significant portion of the Appendix is written for persons requiring electronic access to individualsurname data. Consequently, persons with only a casual interest in Spanish surnames can be ade-quately served by reading section 10.3 and browsing the contents of Appendix Table A.
10.1 SERVIN G OUR CUSTOMERS
From talking to prospective customers of Spanish surname data, we conclude that we are servingtwo or perhaps even three classes of customers. The three classes include:
10.1.1 Persons who are satisfied with a minimal number of surnames (preferably on a piece ofpaper) that adequately cover a large proportion of the Hispanic origin/surnamed population withinthe United States. For these persons, we provide 639 Heavily Hispanic Spanish surnames arrangedin alphabetic order in Appendix Table A. Persons with those surnames represent more than two-thirds of the Hispanic origin population and approximately 80 percent of the Spanish surnamed pop-ulation (see Section 5.1 of the main text). The 639 surnames share two characteristics:
(1) For each surname appearing in Appendix Table A, at least 25 SOR “householders” providedpositive responses to the Spanish origin question on their 1990 Census forms.
(2) Each of the 639 surnames listed in Appendix Table A qualify as heavily (75 percent) Hispanic.Overall, 94 percent of the householders in the United States with those surnames answered the1990 Hispanic origin question affirmatively.
Note that these criteria do not precisely produce the tabulations appearing in Table 6A. There, wetabulated responses from 715 surnames that both occurred 25 or more times in the SOR file andappeared on the 1980 Spanish surname list. None of those 715 surnames were subjected to a mini-mum standard for percent Hispanic. In fact, one of those 715 surnames (DECASTRO) is now clas-sified as occasional Hispanic.
For a surname to appear in Appendix Table A, we require 25 positive responses in the SOR file anda minimum Hispanic “hit rate” of 75 percent. Thus a 1980 Spanish surname that appeared 27 timesin the SOR file with 24 positive Hispanic entries would be an entry in Table 6A but not in AppendixTable A.
For many purposes, this abridged 639 surname list is sufficient for making a reasonably accurateassessment on the number or proportion Hispanic within a group. Consider an organization of 100persons. Twenty of the organization’s members have surnames that match the abbreviated 639 entrysurname list. Armed with this information one can reasonably conclude that between 20 and 30members are Hispanic. The number 30 is derived by dividing matched members (20) by 2/3—theproportion of the Hispanic population with these 639 surnames. For many/most uses an approxima-tion with this level of accuracy suffices as a “ball park” estimator.
10.1.2 Persons who need surname data in electronic form and want the flexibilit y of customiz-ing their own Spanish surname lists. The authors have arbitrarily categorized a surname to beHeavily Hispanic if more than 75 percent of householders with that name are Hispanic. Some usersof Spanish surname data might wish to construct a surname base of Heavily Hispanic names wherethe criteria for Heavily is 90 percent, or 60 percent or some intermediate value. These customerswil l receive a flat file of 25,276 surnames arranged in nine data fields.
Technical Working Paper No. 13 16
U.S. Census Bureau March 1996
For purposes of illustration, we provide the contents for four individual names.
Field 1 Field 2 Field 3 Field 4 Field 5 Field 6 Field 7 Field 8 Field 90225 SILVA 0 2 710 499 407 344 0.441
0105 FEBUS 0 -2 8 5 7 5 1.875
0325 FELIX 1 2 187 132 88 78 -0.160
5500 BROOKS 0 -6 1714 587 5 4 -2.987
SILVA’s category—0225—indicates that the surname is Generally Hispanic with more than 25 posi-tive occurrences. The name did not appear on the 1980 list, but it does pass the Buechley test. Thesurname is much more likely (344/499) to be Hispanic in Hispanic states than non-Hispanic states(63/211).
FEBUS’s, 0105 classification signifies that the surname is Heavily Hispanic with between 5 and 9positive occurrences. The surname was not on the 1980 Spanish surname list. The final three lettersin the surname (BUS) do not match the Buechley “Ends”. Of the 8 householders with the name FE-BUS, 7 are Hispanic. All 5 householders living in “Spanish States” are Hispanic.
FELIX is similar to SILVA except that the surname FELIX did appear on the 1980 Spanish surnamelist. It’s category 0325 indicates that the surname is classified as Moderately Hispanic and there aremore than 25 positive replies to the Hispanic question in the SOR sample.
BROOKS appears on the electronic file because it had at least one (actually 5) positive responses onthe SOR file. The category 5500 indicates that the surname is Rarely Hispanic and that there are atleast 500 negative responses for that surname. BROOKS (as expected) was not on the 1980 Spanishsurname list. The score of -6 for Buechley occurs because of the existence of the letter K, the end-ing (OKS), and the double OO in the middle of the name.
Field 1 A numeric descriptor (located in positions 1-4) that provides both a Hispanic classifica-tion and a frequency grouping. Each of the 25,276 surnames appearing in these files fallsinto one and only one of 28 mutually exclusive categories. Appendix Table B (SpanishSurname Categories) define these 28 groupings.
Field 2 The surname itself—limited to 13 characters and appearing in positions 6 through 18.
Field 3 A “1” or a “0” appearing in column 20. A “1” signifies that this particular surname ap-pears on the 1980 Spanish surname list; a “0” i ndicates that it did not.
Field 4 A positive “2” i n column 24 or a negative even number appearing in columns 22 through24. A “2” i n column 24 signifies that the particular surname passes all the Buechley crite-ria. (See section 7.1.3 in main text for reference to Robert A. Buechley) A negative 2, 4,6, 8, or 10 indicates whether the surname violates 1, 2, 3, 4, or even 5 Buechley rules.
Buechley Rule 1 — the letter K anywhere in nameBuechley Rule 2 — the letter W anywhere in nameBuechley Rule 3 — starts (initial 3 letters)Buechley Rule 4 — ends (final 3 letters)Buechley Rule 5 — double letters (excepting rr and $$)
Field 5 Total number of householders in the SOR File possessing the surname appearing in Field2. Columns 25 through 30.
Field 6 Number of householders in the SOR file residing in one of the 11 states with large num-bers of Hispanics. Columns 31 through 35.
We define the following 11 states to contain a large number of Hispanics: 1. Arizona, 2.California, 3. Colorado, 4. Connecticut, 5. Florida, 6. Illinois, 7. New Jersey, 8. NewMexico, 9. New York, 10. Pennsylvania, and 11. Texas.
Technical Working Paper No. 13 17
U.S. Census Bureau March 1996
Field 7 Total householders (national) with this surname who provide a positive response to theSpanish origin question. Columns 36 through 40. The ratio of the entry in Field 7 to theentry in Field 5 generates national Hispanic proportions for that particular surname.
Field 8 Hispanic householders in 11 States with large numbers of Hispanics. Columns 41 through45. The ratio of the entry in Field 8 to the entry in Field 6 yields the Hispanic proportionfor those 11 States.
Field 9 “Point Value of Surname” An integer (possibly preceded by a negative sign), decimalpoint, followed by three digits appears in columns 47 through 52. Although each andevery one of the 25,276 surnames appearing in the electronic file is assigned a point val-ue, that point value is only germane for classifying surnames when the number of positiveand negative responses is fewer than 5.
10.1.3 Customers who want surname data in electronic form, but are willin g to accept census“Hispanic” classifications. For those customers, we provide a file of surnames arranged in strictalphabetic order with the same 9 data fields described above. The major difference is that the num-ber of surnames is limited to the 12,215 names which are classified as Heavily Hispanic. In additionto the surname data described above, we also furnish two additional tables which are:
(2) Electronic Table 3—STARTS is a file of 1465 three letter combination which start Spanish sur-name.
(3) Electronic Table 4—ENDS is a file of Buechley’s 1114 three letter combinations which endSpanish surname.
The entries appearing in STARTS and ENDS are primarily a product of Buechley’s research; butPassel and Word uncovered some inconsistencies which were relayed to Buechley in 1978. Thisversion of STARTS and ENDS does not incorporate those additions to Buechley’s original work.
10.2 POINT VALUE S FOR INFREQUENTLY OCCURRING SURNAMES
In Section 7.0 of this paper (Rarely Occurring Surnames: or Where Do Statistics End and WhenDoes Common Sense Take Over?) we allude to the fact that proportion Hispanic would not andcould not be the sole determinant for whether a prospective surname is Spanish and to which of thefive categories (Heavily, Generally, Moderately, Occasionally, and Rarely) the surname is assigned.
From rereading the description of Field 9 in Section 10.1.2, it is immediately clear that any surnameappearing 9 or more times is classified solely on the basis of proportion Spanish and any surnamewith fewer than 5 householder occurrences wil l be classified on the basis of point value. Somenames appearing 5 to 9 times in the SOR file are assigned a Hispanic category based on proportionHispanic while other surnames with 5 to 9 SOR appearances are classified only on point value.
As described in Section 7.0 there are three characteristics that can be used to classify a surname.These characteristics are:
(1) proportion of times possessor of surname is Spanish, (2) whether or not the surname follows ac-ceptable Spanish language constructions, and (3) whether or not the 1980 research assigned that sur-name to be Spanish. We assigned points for each of these three attributes, with the assignment fol-lowing the order described below:
1. For “householders” with a given surname captured in the SOR sample, how often does the posses-sor of that surname provide a positive Hispanic response? Give each Hispanic response a value of+3 and each non-Hispanic response a value of negative 3.
Technical Working Paper No. 13 18
U.S. Census Bureau March 1996
2. Does the surname adhere to or violate “orthographic correctness?” I f the surname follows all 5orthographic rules assign the surname a value of +2; assign a value of -2 for each violation.
For example, DAVI S (which could be pronounced Dah Vees) violates no orthographicprecepts. The starting three letters D A V appear in DAVILLA , the ending three letters VI S occur in OROVIS. DAVI S contains no W’s, no K’s, nor does it contain a double let-ter. All five American surnames occurring more frequently than DAVI S (eg. SMITH,JOHNSON, WILLIAMS , BROWN, and JONES) violate at least one of the orthographicrules which typify “Spanish” surnames.
3. Did the surname appear on the Census Bureau’s 1980 Spanish Surname List? Give the surname avalue of +1 if yes, and a value of -1 if no.
The point value of the surname is defined to be total points divided by total occurrences. If a nameoccurs only once, it could have a value as high as +6.00, and a theoretical low of -14.00. For exam-ple, the surname WEEKS receives -10 points on the orthographic variable alone. For frequentlyoccurring surnames, the number of points awarded for orthographics and appearance on the 1980Spanish surname list has very little weight. We illustrate this point with a surname occurring 100times and a success rate of 95 percent.
AN ILLUSTRATIO N OF POINT SCORE CALCULATION : Based on 100 observations
Answers Points Awarded
Yes No Yes No Total
(1) Response to Spanish origin question 95 5 285 -15 270
(2) Orthographics 1 2 2
(3) Appearance on 1980 List 1 1 1
Total Points 288 -15 273
Point Score 2.73
A frequently occurring Heavily Hispanic surname wil l achieve a point value ranging between 1.5and 3.0. Point values of 2.5 to 2.7 are typical. The Heavily Hispanic standard for infrequently oc-curring surnames is set at equal to or greater than 2.00. It is possible for a surname appearing exact-ly one time on the SOR file with a single positive Spanish response to fall in the Heavily Hispaniccategory even though the surname did not appear on the 1980 Spanish surname list. But that sur-name must satisfy all five orthographic principles to receive the Heavily Hispanic designation.
The point values for Generally Hispanic were set at +1.00 to +1.99. The bounds for ModeratelyHispanic were pegged from -0.50 to +0.99. As might be expected, the point values used in classify-ing infrequently occurring surnames parallel the values for frequently occurring surnames. We de-cided that it was virtually impossible to make an Occasionally Hispanic determination for infre-quently occurring surnames. For that reason Spanish categories 0401 and 0402 (Appendix Table B)do not exist.
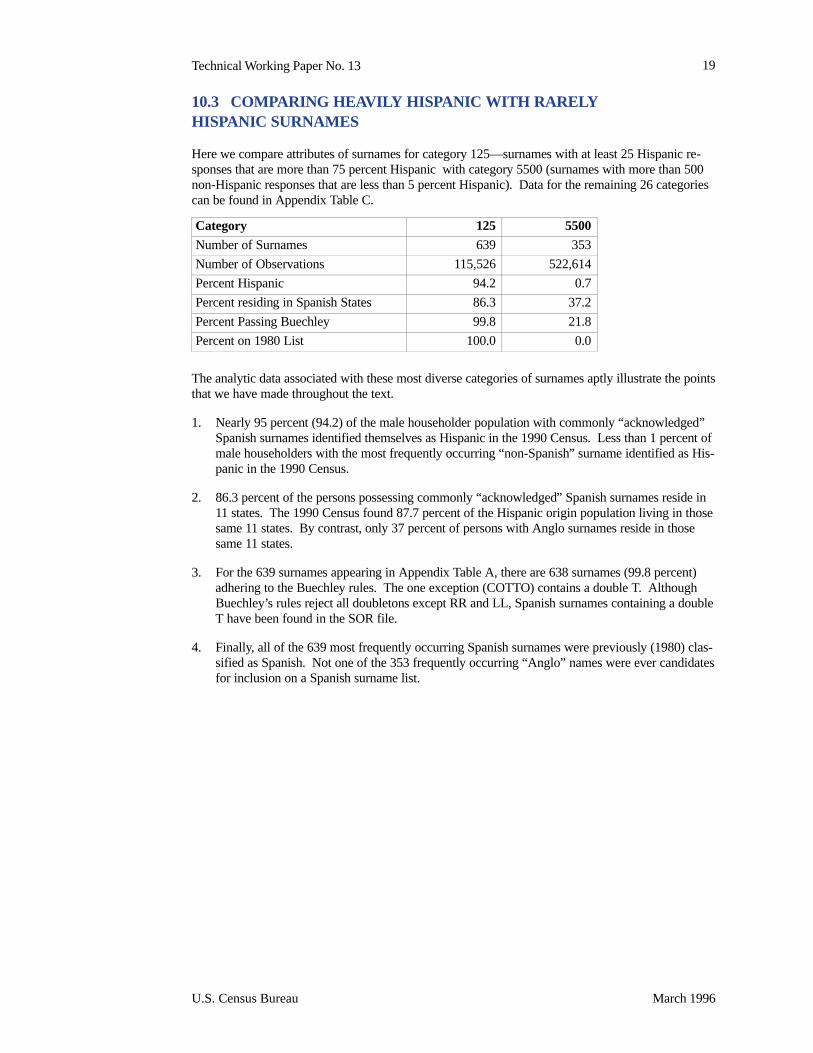
Technical Working Paper No. 13 19
U.S. Census Bureau March 1996
10.3 COMPARIN G HEAVIL Y HISPANIC WIT H RARELY HISPANIC SURNAMES
Here we compare attributes of surnames for category 125—surnames with at least 25 Hispanic re-sponses that are more than 75 percent Hispanic with category 5500 (surnames with more than 500non-Hispanic responses that are less than 5 percent Hispanic). Data for the remaining 26 categoriescan be found in Appendix Table C.
Category 125 5500Number of Surnames 639 353
Number of Observations 115,526 522,614
Percent Hispanic 94.2 0.7
Percent residing in Spanish States 86.3 37.2
Percent Passing Buechley 99.8 21.8
Percent on 1980 List 100.0 0.0
The analytic data associated with these most diverse categories of surnames aptly illustrate the pointsthat we have made throughout the text.
1. Nearly 95 percent (94.2) of the male householder population with commonly “acknowledged”Spanish surnames identified themselves as Hispanic in the 1990 Census. Less than 1 percent ofmale householders with the most frequently occurring “non-Spanish” surname identified as His-panic in the 1990 Census.
2. 86.3 percent of the persons possessing commonly “acknowledged” Spanish surnames reside in11 states. The 1990 Census found 87.7 percent of the Hispanic origin population living in thosesame 11 states. By contrast, only 37 percent of persons with Anglo surnames reside in thosesame 11 states.
3. For the 639 surnames appearing in Appendix Table A, there are 638 surnames (99.8 percent)adhering to the Buechley rules. The one exception (COTTO) contains a double T. AlthoughBuechley’s rules reject all doubletons except RR and LL, Spanish surnames containing a doubleT have been found in the SOR file.
4. Finally, all of the 639 most frequently occurring Spanish surnames were previously (1980) clas-sified as Spanish. Not one of the 353 frequently occurring “Anglo” names were ever candidatesfor inclusion on a Spanish surname list.
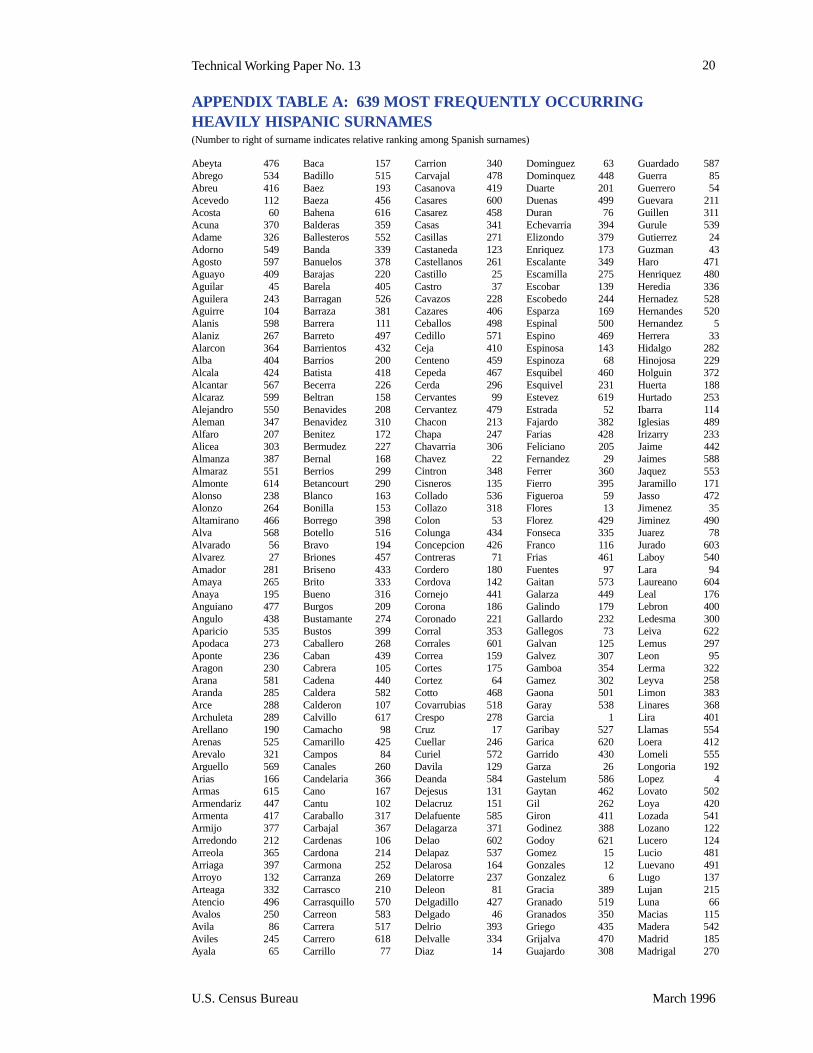
Technical Working Paper No. 13 20
U.S. Census Bureau March 1996
APPENDIX TABL E A: 639 MOST FREQUENTLY OCCURRINGHEAVIL Y HISPANIC SURNAMES(Number to right of surname indicates relative ranking among Spanish surnames)
Abeyta 476 Baca 157 Carrion 340 Dominguez 63 Guardado 587Abrego 534 Badillo 515 Carvajal 478 Dominquez 448 Guerra 85Abreu 416 Baez 193 Casanova 419 Duarte 201 Guerrero 54Acevedo 112 Baeza 456 Casares 600 Duenas 499 Guevara 211Acosta 60 Bahena 616 Casarez 458 Duran 76 Guillen 311Acuna 370 Balderas 359 Casas 341 Echevarria 394 Gurule 539Adame 326 Ballesteros 552 Casillas 271 Elizondo 379 Gutierrez 24Adorno 549 Banda 339 Castaneda 123 Enriquez 173 Guzman 43Agosto 597 Banuelos 378 Castellanos 261 Escalante 349 Haro 471Aguayo 409 Barajas 220 Castillo 25 Escamilla 275 Henriquez 480Aguilar 45 Barela 405 Castro 37 Escobar 139 Heredia 336Aguilera 243 Barragan 526 Cavazos 228 Escobedo 244 Hernadez 528Aguirre 104 Barraza 381 Cazares 406 Esparza 169 Hernandes 520Alanis 598 Barrera 111 Ceballos 498 Espinal 500 Hernandez 5Alaniz 267 Barreto 497 Cedillo 571 Espino 469 Herrera 33Alarcon 364 Barrientos 432 Ceja 410 Espinosa 143 Hidalgo 282Alba 404 Barrios 200 Centeno 459 Espinoza 68 Hinojosa 229Alcala 424 Batista 418 Cepeda 467 Esquibel 460 Holguin 372Alcantar 567 Becerra 226 Cerda 296 Esquivel 231 Huerta 188Alcaraz 599 Beltran 158 Cervantes 99 Estevez 619 Hurtado 253Alejandro 550 Benavides 208 Cervantez 479 Estrada 52 Ibarra 114Aleman 347 Benavidez 310 Chacon 213 Fajardo 382 Iglesias 489Alfaro 207 Benitez 172 Chapa 247 Farias 428 Irizarry 233Alicea 303 Bermudez 227 Chavarria 306 Feliciano 205 Jaime 442Almanza 387 Bernal 168 Chavez 22 Fernandez 29 Jaimes 588Almaraz 551 Berrios 299 Cintron 348 Ferrer 360 Jaquez 553Almonte 614 Betancourt 290 Cisneros 135 Fierro 395 Jaramillo 171Alonso 238 Blanco 163 Collado 536 Figueroa 59 Jasso 472Alonzo 264 Bonilla 153 Collazo 318 Flores 13 Jimenez 35Altamirano 466 Borrego 398 Colon 53 Florez 429 Jiminez 490Alva 568 Botello 516 Colunga 434 Fonseca 335 Juarez 78Alvarado 56 Bravo 194 Concepcion 426 Franco 116 Jurado 603Alvarez 27 Briones 457 Contreras 71 Frias 461 Laboy 540Amador 281 Briseno 433 Cordero 180 Fuentes 97 Lara 94Amaya 265 Brito 333 Cordova 142 Gaitan 573 Laureano 604Anaya 195 Bueno 316 Cornejo 441 Galarza 449 Leal 176Anguiano 477 Burgos 209 Corona 186 Galindo 179 Lebron 400Angulo 438 Bustamante 274 Coronado 221 Gallardo 232 Ledesma 300Aparicio 535 Bustos 399 Corral 353 Gallegos 73 Leiva 622Apodaca 273 Caballero 268 Corrales 601 Galvan 125 Lemus 297Aponte 236 Caban 439 Correa 159 Galvez 307 Leon 95Aragon 230 Cabrera 105 Cortes 175 Gamboa 354 Lerma 322Arana 581 Cadena 440 Cortez 64 Gamez 302 Leyva 258Aranda 285 Caldera 582 Cotto 468 Gaona 501 Limon 383Arce 288 Calderon 107 Covarrubias 518 Garay 538 Linares 368Archuleta 289 Calvillo 617 Crespo 278 Garcia 1 Lira 401Arellano 190 Camacho 98 Cruz 17 Garibay 527 Llamas 554Arenas 525 Camarillo 425 Cuellar 246 Garica 620 Loera 412Arevalo 321 Campos 84 Curiel 572 Garrido 430 Lomeli 555Arguello 569 Canales 260 Davila 129 Garza 26 Longoria 192Arias 166 Candelaria 366 Deanda 584 Gastelum 586 Lopez 4Armas 615 Cano 167 Dejesus 131 Gaytan 462 Lovato 502Armendariz 447 Cantu 102 Delacruz 151 Gil 262 Loya 420Armenta 417 Caraballo 317 Delafuente 585 Giron 411 Lozada 541Armijo 377 Carbajal 367 Delagarza 371 Godinez 388 Lozano 122Arredondo 212 Cardenas 106 Delao 602 Godoy 621 Lucero 124Arreola 365 Cardona 214 Delapaz 537 Gomez 15 Lucio 481Arriaga 397 Carmona 252 Delarosa 164 Gonzales 12 Luevano 491Arroyo 132 Carranza 269 Delatorre 237 Gonzalez 6 Lugo 137Arteaga 332 Carrasco 210 Deleon 81 Gracia 389 Lujan 215Atencio 496 Carrasquillo 570 Delgadillo 427 Granado 519 Luna 66Avalos 250 Carreon 583 Delgado 46 Granados 350 Macias 115Avila 86 Carrera 517 Delrio 393 Griego 435 Madera 542Aviles 245 Carrero 618 Delvalle 334 Grijalva 470 Madrid 185Ayala 65 Carrillo 77 Diaz 14 Guajardo 308 Madrigal 270
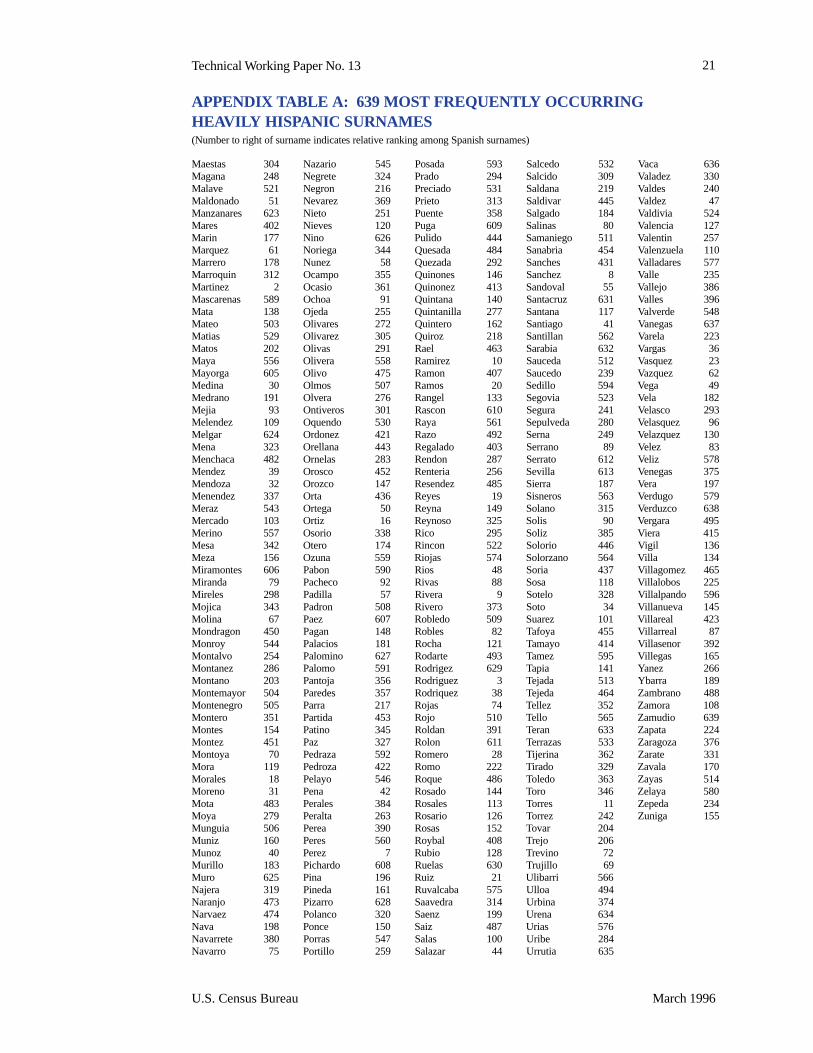
Technical Working Paper No. 13 21
U.S. Census Bureau March 1996
APPENDIX TABL E A: 639 MOST FREQUENTLY OCCURRINGHEAVIL Y HISPANIC SURNAMES(Number to right of surname indicates relative ranking among Spanish surnames)
Maestas 304 Nazario 545 Posada 593 Salcedo 532 Vaca 636Magana 248 Negrete 324 Prado 294 Salcido 309 Valadez 330Malave 521 Negron 216 Preciado 531 Saldana 219 Valdes 240Maldonado 51 Nevarez 369 Prieto 313 Saldivar 445 Valdez 47Manzanares 623 Nieto 251 Puente 358 Salgado 184 Valdivia 524Mares 402 Nieves 120 Puga 609 Salinas 80 Valencia 127Marin 177 Nino 626 Pulido 444 Samaniego 511 Valentin 257Marquez 61 Noriega 344 Quesada 484 Sanabria 454 Valenzuela 110Marrero 178 Nunez 58 Quezada 292 Sanches 431 Valladares 577Marroquin 312 Ocampo 355 Quinones 146 Sanchez 8 Valle 235Martinez 2 Ocasio 361 Quinonez 413 Sandoval 55 Vallejo 386Mascarenas 589 Ochoa 91 Quintana 140 Santacruz 631 Valles 396Mata 138 Ojeda 255 Quintanilla 277 Santana 117 Valverde 548Mateo 503 Olivares 272 Quintero 162 Santiago 41 Vanegas 637Matias 529 Olivarez 305 Quiroz 218 Santillan 562 Varela 223Matos 202 Olivas 291 Rael 463 Sarabia 632 Vargas 36Maya 556 Olivera 558 Ramirez 10 Sauceda 512 Vasquez 23Mayorga 605 Olivo 475 Ramon 407 Saucedo 239 Vazquez 62Medina 30 Olmos 507 Ramos 20 Sedillo 594 Vega 49Medrano 191 Olvera 276 Rangel 133 Segovia 523 Vela 182Mejia 93 Ontiveros 301 Rascon 610 Segura 241 Velasco 293Melendez 109 Oquendo 530 Raya 561 Sepulveda 280 Velasquez 96Melgar 624 Ordonez 421 Razo 492 Serna 249 Velazquez 130Mena 323 Orellana 443 Regalado 403 Serrano 89 Velez 83Menchaca 482 Ornelas 283 Rendon 287 Serrato 612 Veliz 578Mendez 39 Orosco 452 Renteria 256 Sevilla 613 Venegas 375Mendoza 32 Orozco 147 Resendez 485 Sierra 187 Vera 197Menendez 337 Orta 436 Reyes 19 Sisneros 563 Verdugo 579Meraz 543 Ortega 50 Reyna 149 Solano 315 Verduzco 638Mercado 103 Ortiz 16 Reynoso 325 Solis 90 Vergara 495Merino 557 Osorio 338 Rico 295 Soliz 385 Viera 415Mesa 342 Otero 174 Rincon 522 Solorio 446 Vigil 136Meza 156 Ozuna 559 Riojas 574 Solorzano 564 Villa 134Miramontes 606 Pabon 590 Rios 48 Soria 437 Villagomez 465Miranda 79 Pacheco 92 Rivas 88 Sosa 118 Villalobos 225Mireles 298 Padilla 57 Rivera 9 Sotelo 328 Villalpando 596Mojica 343 Padron 508 Rivero 373 Soto 34 Villanueva 145Molina 67 Paez 607 Robledo 509 Suarez 101 Villareal 423Mondragon 450 Pagan 148 Robles 82 Tafoya 455 Villarreal 87Monroy 544 Palacios 181 Rocha 121 Tamayo 414 Villasenor 392Montalvo 254 Palomino 627 Rodarte 493 Tamez 595 Villegas 165Montanez 286 Palomo 591 Rodrigez 629 Tapia 141 Yanez 266Montano 203 Pantoja 356 Rodriguez 3 Tejada 513 Ybarra 189Montemayor 504 Paredes 357 Rodriquez 38 Tejeda 464 Zambrano 488Montenegro 505 Parra 217 Rojas 74 Tellez 352 Zamora 108Montero 351 Partida 453 Rojo 510 Tello 565 Zamudio 639Montes 154 Patino 345 Roldan 391 Teran 633 Zapata 224Montez 451 Paz 327 Rolon 611 Terrazas 533 Zaragoza 376Montoya 70 Pedraza 592 Romero 28 Tijerina 362 Zarate 331Mora 119 Pedroza 422 Romo 222 Tirado 329 Zavala 170Morales 18 Pelayo 546 Roque 486 Toledo 363 Zayas 514Moreno 31 Pena 42 Rosado 144 Toro 346 Zelaya 580Mota 483 Perales 384 Rosales 113 Torres 11 Zepeda 234Moya 279 Peralta 263 Rosario 126 Torrez 242 Zuniga 155Munguia 506 Perea 390 Rosas 152 Tovar 204Muniz 160 Peres 560 Roybal 408 Trejo 206Munoz 40 Perez 7 Rubio 128 Trevino 72Murillo 183 Pichardo 608 Ruelas 630 Trujillo 69Muro 625 Pina 196 Ruiz 21 Ulibarri 566Najera 319 Pineda 161 Ruvalcaba 575 Ulloa 494Naranjo 473 Pizarro 628 Saavedra 314 Urbina 374Narvaez 474 Polanco 320 Saenz 199 Urena 634Nava 198 Ponce 150 Saiz 487 Urias 576Navarrete 380 Porras 547 Salas 100 Uribe 284Navarro 75 Portillo 259 Salazar 44 Urrutia 635
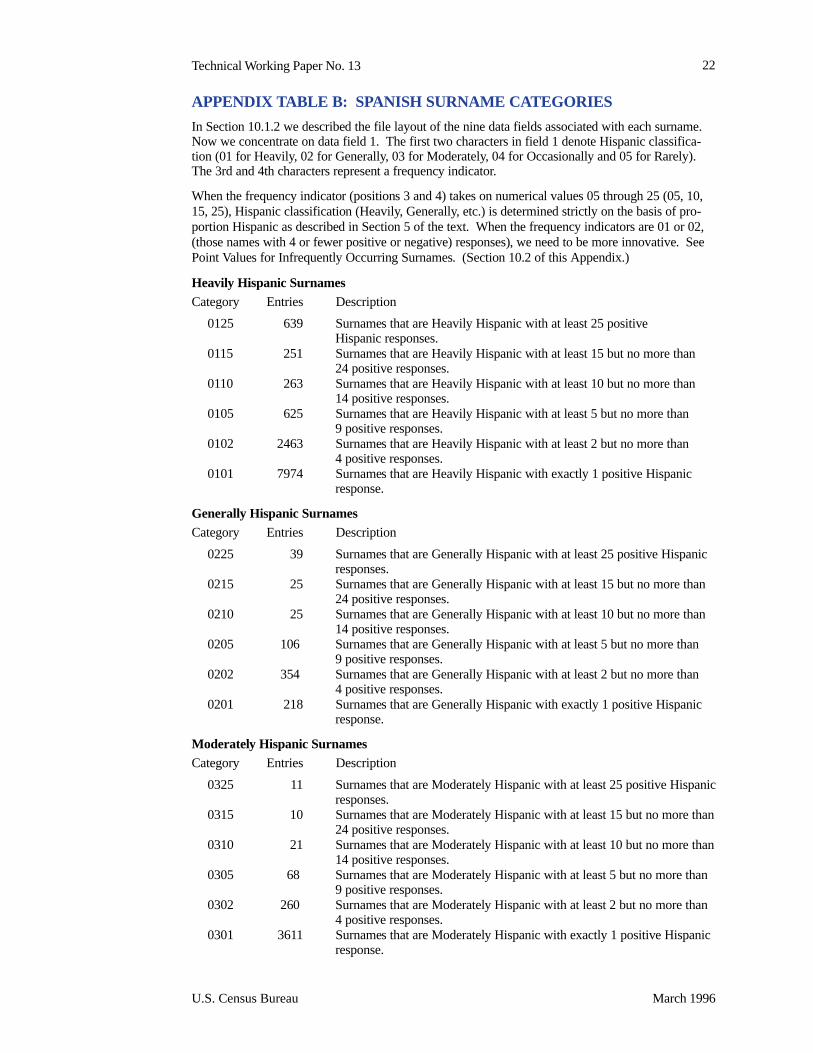
Technical Working Paper No. 13 22
U.S. Census Bureau March 1996
APPENDIX TABL E B: SPANISH SURNAM E CATEGORIES
In Section 10.1.2 we described the file layout of the nine data fields associated with each surname.Now we concentrate on data field 1. The first two characters in field 1 denote Hispanic classifica-tion (01 for Heavily, 02 for Generally, 03 for Moderately, 04 for Occasionally and 05 for Rarely).The 3rd and 4th characters represent a frequency indicator.
When the frequency indicator (positions 3 and 4) takes on numerical values 05 through 25 (05, 10,15, 25), Hispanic classification (Heavily, Generally, etc.) is determined strictly on the basis of pro-portion Hispanic as described in Section 5 of the text. When the frequency indicators are 01 or 02,(those names with 4 or fewer positive or negative) responses), we need to be more innovative. SeePoint Values for Infrequently Occurring Surnames. (Section 10.2 of this Appendix.)
Heavily Hispanic SurnamesCategory Entries Description
0125 639 Surnames that are Heavily Hispanic with at least 25 positive Hispanic responses.
0115 251 Surnames that are Heavily Hispanic with at least 15 but no more than 24 positive responses.
0110 263 Surnames that are Heavily Hispanic with at least 10 but no more than 14 positive responses.
0105 625 Surnames that are Heavily Hispanic with at least 5 but no more than 9 positive responses.
0102 2463 Surnames that are Heavily Hispanic with at least 2 but no more than 4 positive responses.
0101 7974 Surnames that are Heavily Hispanic with exactly 1 positive Hispanicresponse.
Generally Hispanic SurnamesCategory Entries Description
0225 39 Surnames that are Generally Hispanic with at least 25 positive Hispanicresponses.
0215 25 Surnames that are Generally Hispanic with at least 15 but no more than 24 positive responses.
0210 25 Surnames that are Generally Hispanic with at least 10 but no more than 14 positive responses.
0205 106 Surnames that are Generally Hispanic with at least 5 but no more than 9 positive responses.
0202 354 Surnames that are Generally Hispanic with at least 2 but no more than 4 positive responses.
0201 218 Surnames that are Generally Hispanic with exactly 1 positive Hispanicresponse.
Moderately Hispanic SurnamesCategory Entries Description
0325 11 Surnames that are Moderately Hispanic with at least 25 positive Hispanicresponses.
0315 10 Surnames that are Moderately Hispanic with at least 15 but no more than24 positive responses.
0310 21 Surnames that are Moderately Hispanic with at least 10 but no more than14 positive responses.
0305 68 Surnames that are Moderately Hispanic with at least 5 but no more than9 positive responses.
0302 260 Surnames that are Moderately Hispanic with at least 2 but no more than4 positive responses.
0301 3611 Surnames that are Moderately Hispanic with exactly 1 positive Hispanicresponse.
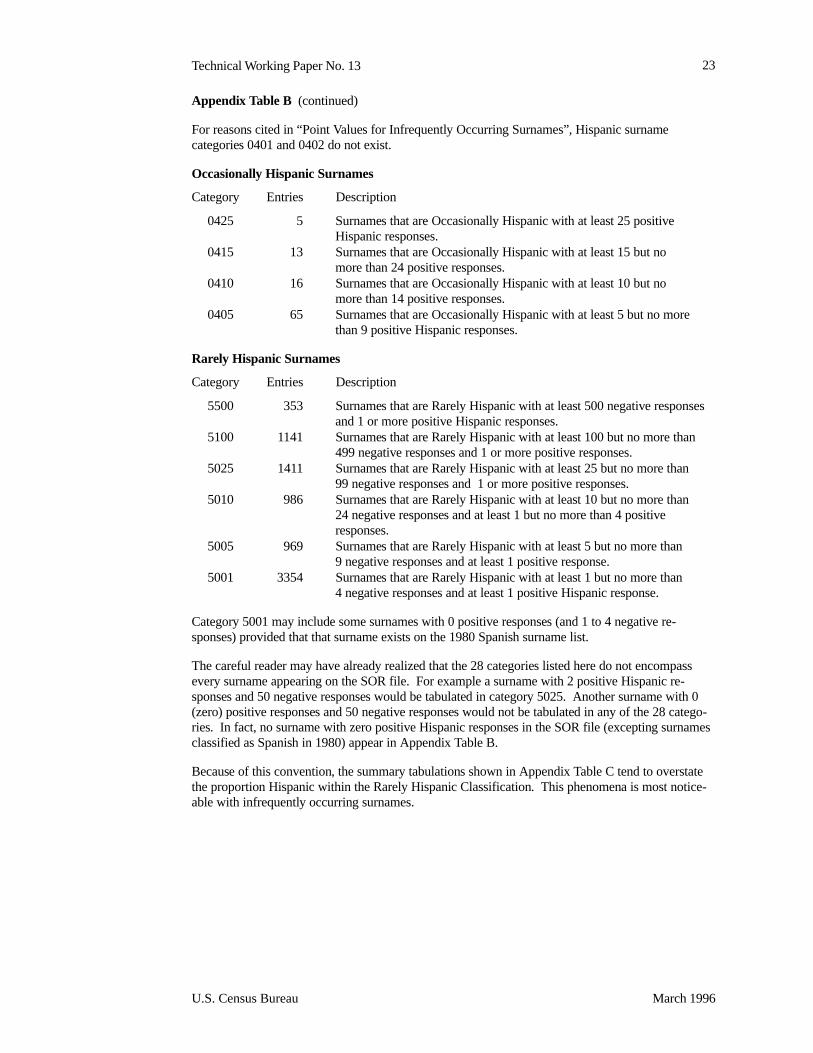
Technical Working Paper No. 13 23
U.S. Census Bureau March 1996
Appendix Table B (continued)
For reasons cited in “Point Values for Infrequently Occurring Surnames”, Hispanic surname categories 0401 and 0402 do not exist.
Occasionally Hispanic Surnames
Category Entries Description
0425 5 Surnames that are Occasionally Hispanic with at least 25 positive Hispanic responses.
0415 13 Surnames that are Occasionally Hispanic with at least 15 but no more than 24 positive responses.
0410 16 Surnames that are Occasionally Hispanic with at least 10 but no more than 14 positive responses.
0405 65 Surnames that are Occasionally Hispanic with at least 5 but no more than 9 positive Hispanic responses.
Rarely Hispanic Surnames
Category Entries Description
5500 353 Surnames that are Rarely Hispanic with at least 500 negative responsesand 1 or more positive Hispanic responses.
5100 1141 Surnames that are Rarely Hispanic with at least 100 but no more than499 negative responses and 1 or more positive responses.
5025 1411 Surnames that are Rarely Hispanic with at least 25 but no more than 99 negative responses and 1 or more positive responses.
5010 986 Surnames that are Rarely Hispanic with at least 10 but no more than 24 negative responses and at least 1 but no more than 4 positive responses.
5005 969 Surnames that are Rarely Hispanic with at least 5 but no more than 9 negative responses and at least 1 positive response.
5001 3354 Surnames that are Rarely Hispanic with at least 1 but no more than 4 negative responses and at least 1 positive Hispanic response.
Category 5001 may include some surnames with 0 positive responses (and 1 to 4 negative re-sponses) provided that that surname exists on the 1980 Spanish surname list.
The careful reader may have already realized that the 28 categories listed here do not encompassevery surname appearing on the SOR file. For example a surname with 2 positive Hispanic re-sponses and 50 negative responses would be tabulated in category 5025. Another surname with 0(zero) positive responses and 50 negative responses would not be tabulated in any of the 28 catego-ries. In fact, no surname with zero positive Hispanic responses in the SOR file (excepting surnamesclassified as Spanish in 1980) appear in Appendix Table B.
Because of this convention, the summary tabulations shown in Appendix Table C tend to overstatethe proportion Hispanic within the Rarely Hispanic Classification. This phenomena is most notice-able with infrequently occurring surnames.
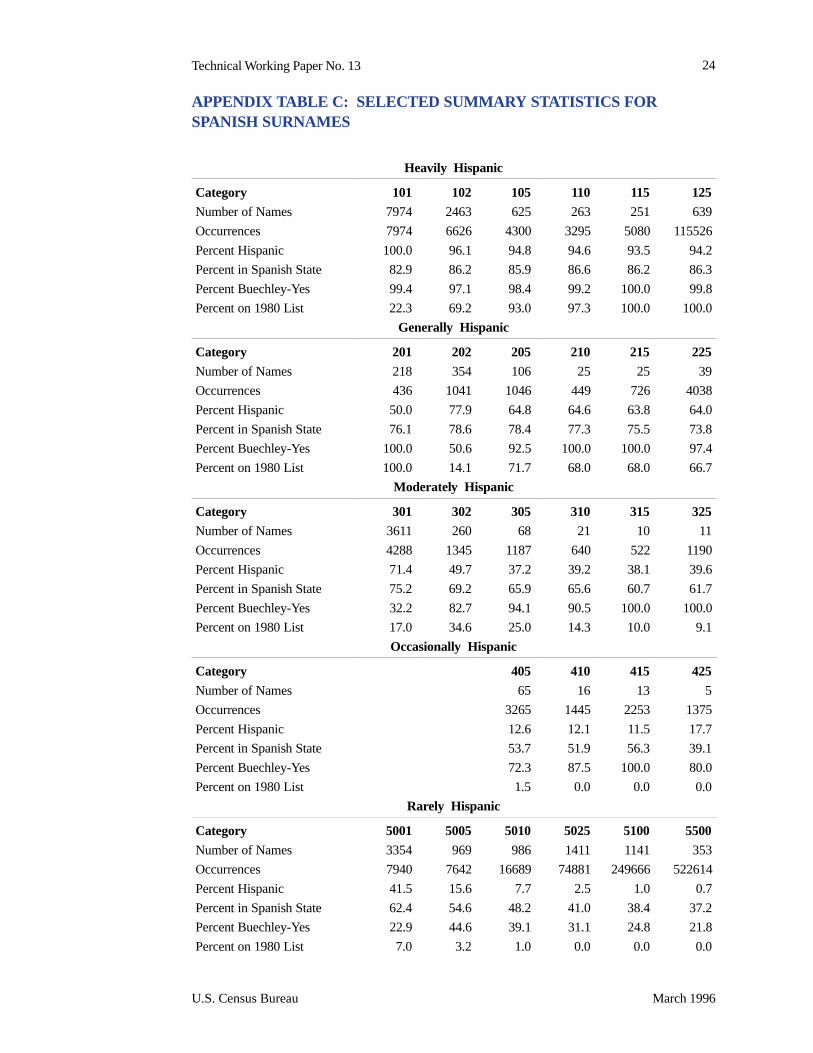
Technical Working Paper No. 13 24
U.S. Census Bureau March 1996
APPENDIX TABL E C: SELECTE D SUMMAR Y STATISTIC S FORSPANISH SURNAMES
Heavily Hispanic
Category 101 102 105 110 115 125
Number of Names 7974 2463 625 263 251 639
Occurrences 7974 6626 4300 3295 5080 115526
Percent Hispanic 100.0 96.1 94.8 94.6 93.5 94.2
Percent in Spanish State 82.9 86.2 85.9 86.6 86.2 86.3
Percent Buechley-Yes 99.4 97.1 98.4 99.2 100.0 99.8
Percent on 1980 List 22.3 69.2 93.0 97.3 100.0 100.0
Generally Hispanic
Category 201 202 205 210 215 225
Number of Names 218 354 106 25 25 39
Occurrences 436 1041 1046 449 726 4038
Percent Hispanic 50.0 77.9 64.8 64.6 63.8 64.0
Percent in Spanish State 76.1 78.6 78.4 77.3 75.5 73.8
Percent Buechley-Yes 100.0 50.6 92.5 100.0 100.0 97.4
Percent on 1980 List 100.0 14.1 71.7 68.0 68.0 66.7
Moderately Hispanic
Category 301 302 305 310 315 325
Number of Names 3611 260 68 21 10 11
Occurrences 4288 1345 1187 640 522 1190
Percent Hispanic 71.4 49.7 37.2 39.2 38.1 39.6
Percent in Spanish State 75.2 69.2 65.9 65.6 60.7 61.7
Percent Buechley-Yes 32.2 82.7 94.1 90.5 100.0 100.0
Percent on 1980 List 17.0 34.6 25.0 14.3 10.0 9.1
Occasionally Hispanic
Category 405 410 415 425
Number of Names 65 16 13 5
Occurrences 3265 1445 2253 1375
Percent Hispanic 12.6 12.1 11.5 17.7
Percent in Spanish State 53.7 51.9 56.3 39.1
Percent Buechley-Yes 72.3 87.5 100.0 80.0
Percent on 1980 List 1.5 0.0 0.0 0.0
Rarely Hispanic
Category 5001 5005 5010 5025 5100 5500
Number of Names 3354 969 986 1411 1141 353
Occurrences 7940 7642 16689 74881 249666 522614
Percent Hispanic 41.5 15.6 7.7 2.5 1.0 0.7
Percent in Spanish State 62.4 54.6 48.2 41.0 38.4 37.2
Percent Buechley-Yes 22.9 44.6 39.1 31.1 24.8 21.8
Percent on 1980 List 7.0 3.2 1.0 0.0 0.0 0.0
Technical Working Paper No. 13 25
U.S. Census Bureau March 1996
It is important to note the low proportion of surnames in categories 102 (69.2 percent) and 101 (22.3percent) that were classified as Hispanic in 1980. The evidence (proportion Hispanic, a pass onBuechley, and residence in 11 states where most Hispanic reside) suggests that the majority of per-sons possessing these names are borne by persons of Hispanic origin. But an examination of thosesurnames on a case by case basis suggests that the precise spelling of many of the names is incorrect.In other words, the sizeable number of surnames recorded as VILLANVEVA are almost assuredly amisinterpretation of VILLANUEVA.
POPULATION DIVISIO N WORKIN G PAPER SERIESNO. 1 - “The Census Bureau Approach for Allocating International Migration to States, Counties,
and Places: 1981-1991.” David L. Word. October 1992.
NO. 2 - “Geographic Coding of Administrative Records—Past Experience and Current Research.”Douglas K. Sater. April 1993.
NO. 3 - “Postcensal Population Estimates: States, Counties, and Places.” John F. Long. August1993.
NO. 4 - “Evaluating the Passel-Word Spanish Surname List: 1990 Decennial Census Post Enu-meration Survey Results.” R. Colby Perkins. August 1993.
NO. 5 - “Evaluation of Postcensal County Estimates for the 1980s.” Sam T. Davis. March 1994.
NO. 6 - “Metropolitan Growth and Expansion in the 1980s.” Richard L. Forstall and James D.Fitzsimmons. April 1993.
NO. 7 - “Geographic Coding of Administrative Records — Current Research in ZIP/Sector-to-County Coding Process.” Douglas K. Sater. June 1994.
NO. 8 - “Illustrative Ranges of the Distribution of Undocumented Immigrants by State.” EdwardW. Fernandez & J. Gregory Robinson. October 1994.
NO. 9 - “Estimates of Emigration of the Foreign-Born Population: 1980-1990.” Bashir Ahmedand J. Gregory Robinson. December 1994.
NO. 10 - “Estimation of the Annual Emigration of U.S. Born Persons by Using Foreign Censusesand Selected Administrative Data: Circa 1980.” Edward W. Fernandez. January 1995.
NO. 11 - “Using Analytic Techniques to Evaluate the 1990 Census Coverage of Young Hispanics.”Edward W. Fernandez. May 1995.
NO. 12 - “Metropolitan and Nonmetropolitan Areas: New Approaches to Geographical Definition.”Donald C. Dahmann and James D. Fitzsimmons. October 1995.
NO. 13 - “Building a Spanish Surname List for the 1990’s—A New Approach to An Old Problem.”David L. Word and R. Colby Perkins, Jr. February 1996.
For copies of these Working Papers, please contact author at: Population Division, Bureau of theCensus, Washington, DC 20233.

Appendix B Asian and Pacific Islander Surnames List Documentation
The Asian and Pacific
Islander Surname List:
As Developed from Census 2000
Matthew R. Falkenstein
Planning, Research and Evaluation Division
David Word Population Division
U.S. Bureau of the Census
December 3, 2002
This paper reports the results of research and analysis undertaken by Census Bureau staff. It has undergone a Census Bureau review more limited in scope than that given to official Census Bureau publications. This report is released to inform interested parties
of ongoing research and to encourage discussion of work in progress.
3
ABSTRACT The Census Bureau has previously released a Spanish Surname list based on past decennial censuses. Among researchers, there is a demand for a similar list based on Asian race and Pacific Islander race. We call this list the Asian and Pacific Islander (API) Surname List. We produced the API Surname List as a tool for the specific purpose of acting as an input to a logistic regression model that imputes missing race on administrative records. However, the API Surname List may be applied to other research as a comparison tool or even as a basic race imputation tool. After preliminary edits, we summed the number of times a Census respondent with a given surname chose a race. We then calculated the proportion of persons with that surname by race; we divided the surname count for each race by the total count for each surname. Finally, we summed all of the Asian and Pacific Islander race proportions for each surname. We divided surnames into two groups: those with an API proportion of 0.50 or greater and those with a proportion less than 0.50. Note that only surnames with an API proportion of 0.50 or greater made the final list. Given these restrictions, about 56.8% of the API population had a surname on the final surname list. The count was 11,446 surnames. To protect the privacy of the individual respondent, we set a minimum of 50 occurrences on Census 2000 as the limit for inclusion of a surname on the list. There is no link on the list to a respondent’s geographic data, age, or first name; therefore no identification of an individual respondent is possible. Given this condition, we believe the API Surname List does not violate Title XIII or other U.S. privacy laws.
Although we combined eleven API races together, we did not limit the use of the data to our purposes only. Because of the method used, race specific lists can be readily derived using the same data. Researchers interested in a specific race such as Chinese or Korean can derive a surname list for that race only. Data comparison or race imputation are just two applications of the API Surname List.
4
INTRODUCTION The Asian and Pacific Islander (API) population has rapidly grown from a small minority a few decades ago to large and ethnically diverse population groups. Since 1980, the Census Bureau has allowed for more accurate self-identification of race, including the introduction of eleven race categories for the API race. Thanks partially to better API race reporting stemming from the new category scheme, interest in detailed race data has spurred a demand for a surname list tied to Census Asian and Native Hawaiian/Pacific Islander (NHPI) races. The principal purpose for the API Surname list is to improve race and ethic origin models on administrative records. Other applications of the API Surname list include, but are not limited to: • Imputation of missing race on administrative records, surveys and censuses • Planning for special enumeration methods focusing on the race of the respondent • Evaluation of research data by comparison Although an API race category was on included Census 1990, there is no single API race category on Census 2000.We assembled a race category called API from Census 2000 data, specifically for our race models. However, the API Surname list was designed to be flexible, in that a surname list specific to race can be produced for any of the eleven Asian or NHPI race groups. This flexibility may provide the researcher with an alternative to a pervasive problem when using demographic survey or administrative data for survey or research: inaccurate or incomplete race data. The association of a surname with the Asian or NHPI race groups will allow researchers to fill missing data, or at the very least make reasonable assumptions about the race of the respondent based on their surname. The possibility of using surname to enhance Census operations has been explored for many years at the Census Bureau. Various Spanish surname lists were produced from the censuses of 1950, 1960, 1970, 1980, and 1990. For example, the 1950 Spanish Surname List helped identify Hispanic population found in the five southwestern states of Arizona, California, Colorado, New Mexico, and Texas. More comprehensive lists were developed as additional data became available. For example, the 1980 Spanish Surname List attempted to link the geographic distribution of a Spanish name to the distribution of the Hispanic population in the United States. Previous logistical race modeling efforts include research from Bye (1998), who compiled an API surname file based on four existing files: 1. From the Census Bureau, the 1990 Post Enumeration Survey (PES) 2. From the Social Security Administration (SSA) NUMIDENT file, a list of Hawaiian-
born persons obtaining Social Security Numbers (SSN)
5
3. From SSA NUMIDENT, a list of over-50 persons born in 19 Asian countries who had an SSN in 1995 or earlier
4. From an Immigration and Naturalization Service file, a list of naturalized citizens born in 19 Asian countries
The resulting list contributed to the Census Numident Race and Ethnicity Individual Level Regression Model (Bye 1998). Note that the universe was somewhat limited due to a small sample size of API respondents. Lauderdale and Kestenbaum (2000) attempted to improve Asian ethnic category identification. To this end, they compiled six Asian surname lists based on six major Asian ethnic categories using Social Security Administration data. The 1990 Spanish Surname list (Word and Perkins 1996) was based on the Census Spanish Origin File (SOR). Since the SOR uses race self-identification, with a direct connection to a respondent’s Hispanic origin and their first and last name, we considered the 1990 Spanish Surname list as the best model for our API Surname list, based on Census 2000. The extensive race data associated with surnames from Census 2000 provided a unique opportunity to develop an API Surname list (Philipp 2001). Census 2000 was the first decennial census in which surnames were captured to data files. The methodology is similar to the 1990 Spanish Surname List, in that it relies on a Census respondent’s actual race self-identification. The size of this file (over 282 million records, with nearly 12 million self identified as API) is self-validating, and no sampling error was introduced. About 2.4 percent of Census 2000 respondents chose more than one race. In our methodology, if a respondent chose more than one race, we tallied each race as a fraction of the total. For example, if a Census respondent chose Chinese, Vietnamese, and Korean as their race makeup, each race was counted as 0.333, for a total of 1.0 for that person. It should also be noted we made no attempt to tally any write-in race, due to the small number of write-ins and the complications involved with interpretation and translation to an electronic file. We also excluded imputed race responses, which were not self-identified. Maintaining the privacy of all U.S. citizens is a primary concern of the Census Bureau. Since the API Surname List is expected to be available to other Federal agencies, academia, and the public, certain limitations protecting the individual’s privacy were required. To protect the privacy of the individual respondent, we set a minimum of 50 occurrences on Census 2000 as the limit for inclusion of a surname on the list. There is no link on the list to a respondent’s geographic data, age, or first name; therefore no identification of an individual respondent is possible. Given this condition, we believe the API Surname List does not violate Title XIII of the U.S. Code. The Census Bureau’s Disclosure Review Board reviewed and approved these measures used for API Surname List privacy protection.
6
METHODOLOGY
Each Census 2000 respondent was asked to self-identify race. There were fifteen general race check boxes including eleven Asian/NHPI race boxes. Based on that data we tallied the surname count for each Census 2000 race. A few pre-edits were done in preparation for calculation of the API proportion. About 20 million records with surnames or races with the following conditions were excluded: 1. Surname was only filled with blanks or character strings of “A” or “X”. Note that “A”
and “X” were by far the most common nonsensical character strings, and most others drop out after additional exclusions based on number of times a surname occurred on Census 2000.
2. Surname was only a single character (except “O”). We allowed the single character surname “O” because of the possibility of some Asians spelling their surname this way. About 770 Asians on Census 2000 have a surname given as “O”.
3. Race was only a write in race. No write in race was allowed. 4. No race chosen. Only unedited race was used, and no imputed race was allowed. These four edits excluded about 20 million records, or about 7.6% of the U.S. population. After editing, about 262 million records were processed. Of those, about 10.9 million were self-identified as one or more of the Asian or NHPI races. About 8.5% of the API respondents were excluded by the pre-edits. Each time a race was chosen for a particular surname, we tallied it. Race was then divided by the total surname count to produce a proportion. The next step was to sum all of the proportions for each surname to give a total API proportion. The calculation is as follows:
API Proportion for surname =
(Chinese + Japanese + Vietnamese + Korean + Asian Indian + Filipino + Other Asian + Native Hawaiian + Guamanian/Chamorro + Samoan + Other Pacific Islander)
Total API Population by surname
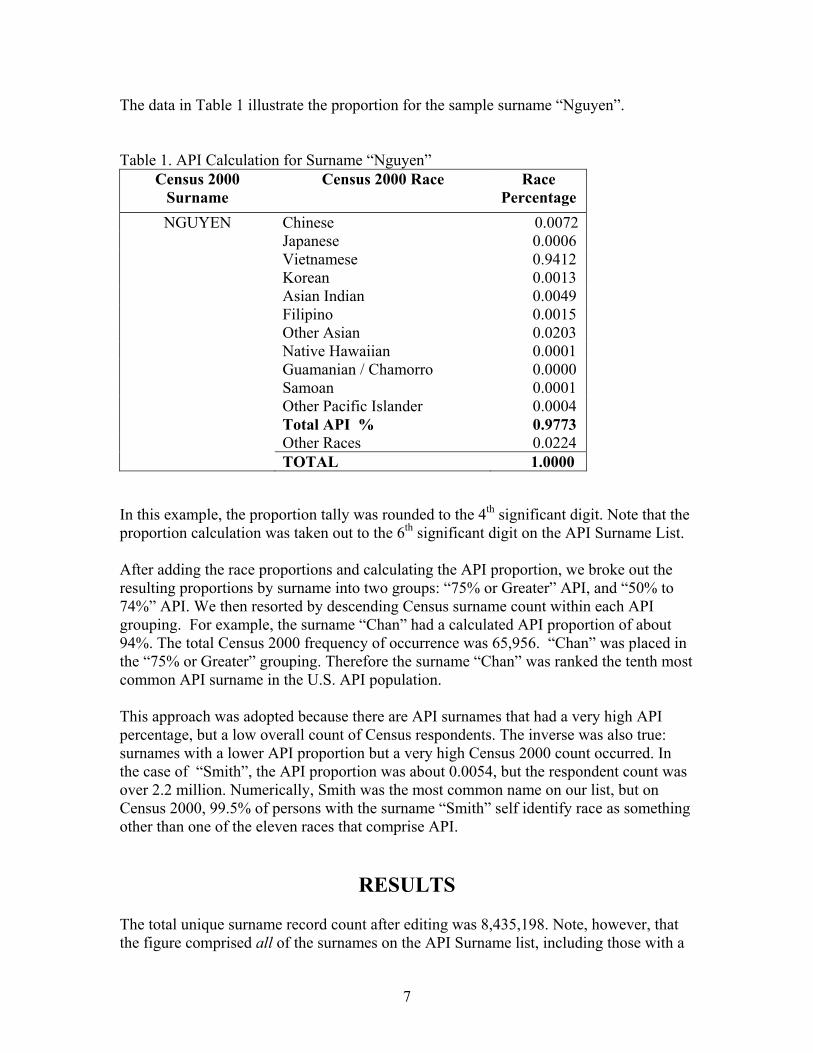
7
The data in Table 1 illustrate the proportion for the sample surname “Nguyen”. Table 1. API Calculation for Surname “Nguyen”
Census 2000 Surname
Census 2000 Race
Race Percentage
NGUYEN Chinese 0.0072 Japanese 0.0006 Vietnamese 0.9412 Korean 0.0013 Asian Indian 0.0049 Filipino 0.0015 Other Asian 0.0203 Native Hawaiian 0.0001 Guamanian / Chamorro 0.0000 Samoan 0.0001 Other Pacific Islander 0.0004 Total API % 0.9773 Other Races 0.0224 TOTAL 1.0000
In this example, the proportion tally was rounded to the 4th significant digit. Note that the proportion calculation was taken out to the 6th significant digit on the API Surname List. After adding the race proportions and calculating the API proportion, we broke out the resulting proportions by surname into two groups: “75% or Greater” API, and “50% to 74%” API. We then resorted by descending Census surname count within each API grouping. For example, the surname “Chan” had a calculated API proportion of about 94%. The total Census 2000 frequency of occurrence was 65,956. “Chan” was placed in the “75% or Greater” grouping. Therefore the surname “Chan” was ranked the tenth most common API surname in the U.S. API population. This approach was adopted because there are API surnames that had a very high API percentage, but a low overall count of Census respondents. The inverse was also true: surnames with a lower API proportion but a very high Census 2000 count occurred. In the case of “Smith”, the API proportion was about 0.0054, but the respondent count was over 2.2 million. Numerically, Smith was the most common name on our list, but on Census 2000, 99.5% of persons with the surname “Smith” self identify race as something other than one of the eleven races that comprise API.
RESULTS The total unique surname record count after editing was 8,435,198. Note, however, that the figure comprised all of the surnames on the API Surname list, including those with a
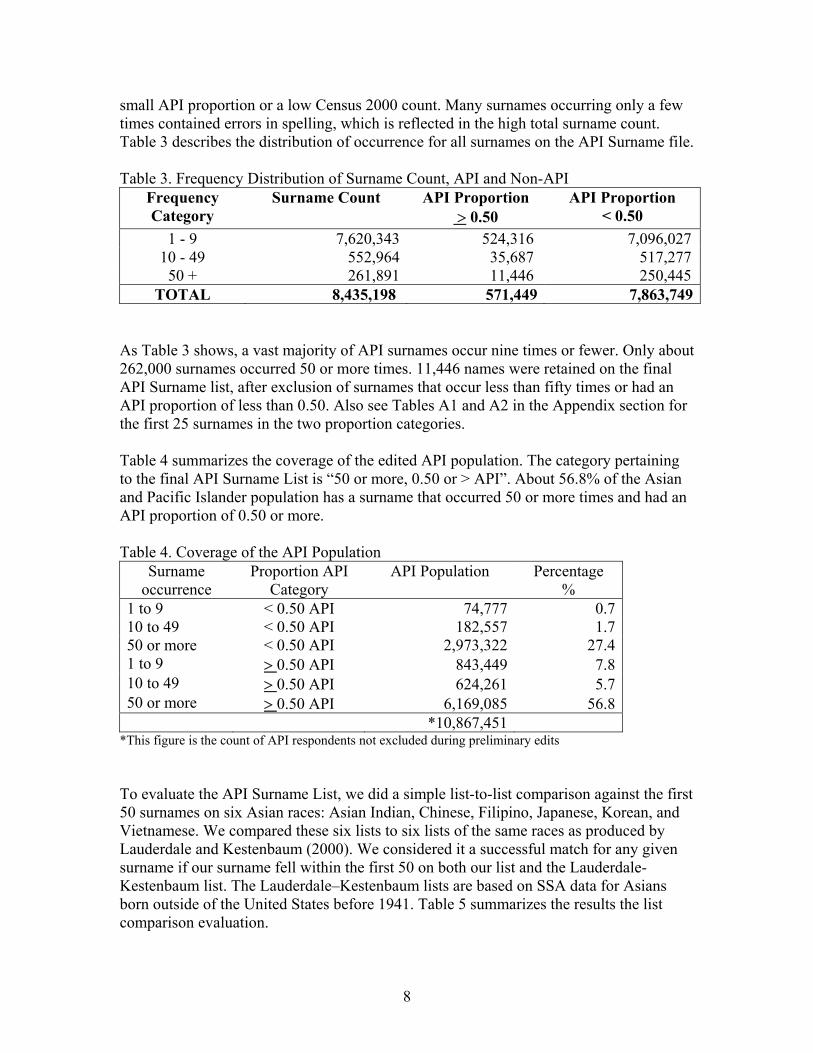
8
small API proportion or a low Census 2000 count. Many surnames occurring only a few times contained errors in spelling, which is reflected in the high total surname count. Table 3 describes the distribution of occurrence for all surnames on the API Surname file. Table 3. Frequency Distribution of Surname Count, API and Non-API
Frequency Category
Surname Count API Proportion > 0.50
API Proportion < 0.50
1 - 9 7,620,343 524,316 7,096,027 10 - 49 552,964 35,687 517,277
50 + 261,891 11,446 250,445 TOTAL 8,435,198 571,449 7,863,749
As Table 3 shows, a vast majority of API surnames occur nine times or fewer. Only about 262,000 surnames occurred 50 or more times. 11,446 names were retained on the final API Surname list, after exclusion of surnames that occur less than fifty times or had an API proportion of less than 0.50. Also see Tables A1 and A2 in the Appendix section for the first 25 surnames in the two proportion categories. Table 4 summarizes the coverage of the edited API population. The category pertaining to the final API Surname List is “50 or more, 0.50 or > API”. About 56.8% of the Asian and Pacific Islander population has a surname that occurred 50 or more times and had an API proportion of 0.50 or more. Table 4. Coverage of the API Population
Surname occurrence
Proportion API Category
API Population Percentage %
1 to 9 < 0.50 API 74,777 0.7 10 to 49 < 0.50 API 182,557 1.7 50 or more < 0.50 API 2,973,322 27.4 1 to 9 > 0.50 API 843,449 7.8 10 to 49 > 0.50 API 624,261 5.7 50 or more > 0.50 API 6,169,085 56.8 *10,867,451
*This figure is the count of API respondents not excluded during preliminary edits To evaluate the API Surname List, we did a simple list-to-list comparison against the first 50 surnames on six Asian races: Asian Indian, Chinese, Filipino, Japanese, Korean, and Vietnamese. We compared these six lists to six lists of the same races as produced by Lauderdale and Kestenbaum (2000). We considered it a successful match for any given surname if our surname fell within the first 50 on both our list and the Lauderdale-Kestenbaum list. The Lauderdale–Kestenbaum lists are based on SSA data for Asians born outside of the United States before 1941. Table 5 summarizes the results the list comparison evaluation.
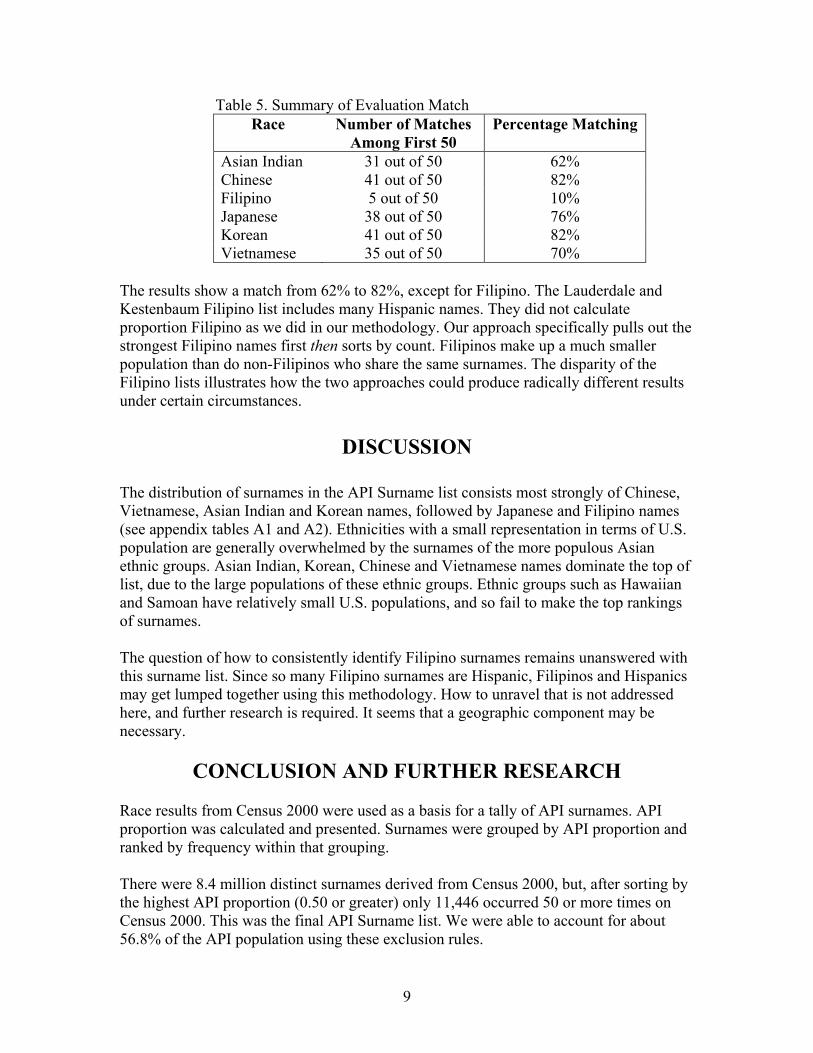
9
Table 5. Summary of Evaluation Match Race Number of Matches
Among First 50 Percentage Matching
Asian Indian 31 out of 50 62% Chinese 41 out of 50 82% Filipino 5 out of 50 10% Japanese 38 out of 50 76% Korean 41 out of 50 82% Vietnamese 35 out of 50 70%
The results show a match from 62% to 82%, except for Filipino. The Lauderdale and Kestenbaum Filipino list includes many Hispanic names. They did not calculate proportion Filipino as we did in our methodology. Our approach specifically pulls out the strongest Filipino names first then sorts by count. Filipinos make up a much smaller population than do non-Filipinos who share the same surnames. The disparity of the Filipino lists illustrates how the two approaches could produce radically different results under certain circumstances.
DISCUSSION
The distribution of surnames in the API Surname list consists most strongly of Chinese, Vietnamese, Asian Indian and Korean names, followed by Japanese and Filipino names (see appendix tables A1 and A2). Ethnicities with a small representation in terms of U.S. population are generally overwhelmed by the surnames of the more populous Asian ethnic groups. Asian Indian, Korean, Chinese and Vietnamese names dominate the top of list, due to the large populations of these ethnic groups. Ethnic groups such as Hawaiian and Samoan have relatively small U.S. populations, and so fail to make the top rankings of surnames. The question of how to consistently identify Filipino surnames remains unanswered with this surname list. Since so many Filipino surnames are Hispanic, Filipinos and Hispanics may get lumped together using this methodology. How to unravel that is not addressed here, and further research is required. It seems that a geographic component may be necessary.
CONCLUSION AND FURTHER RESEARCH Race results from Census 2000 were used as a basis for a tally of API surnames. API proportion was calculated and presented. Surnames were grouped by API proportion and ranked by frequency within that grouping. There were 8.4 million distinct surnames derived from Census 2000, but, after sorting by the highest API proportion (0.50 or greater) only 11,446 occurred 50 or more times on Census 2000. This was the final API Surname list. We were able to account for about 56.8% of the API population using these exclusion rules.
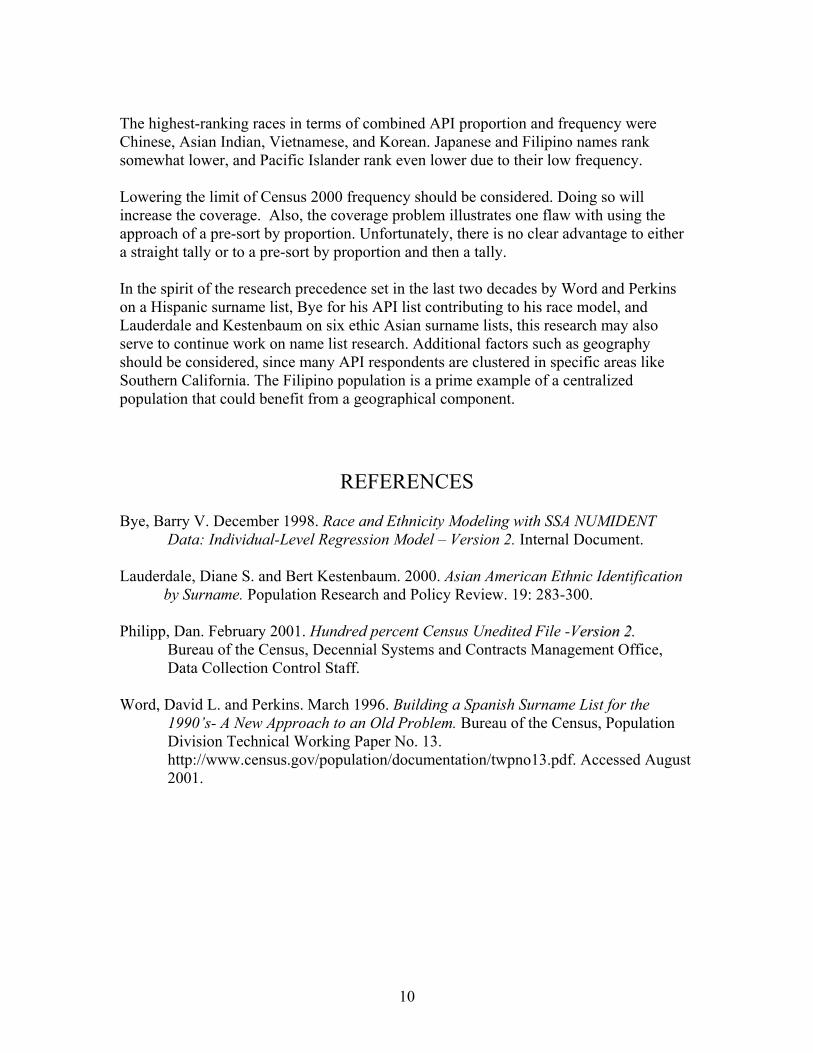
10
The highest-ranking races in terms of combined API proportion and frequency were Chinese, Asian Indian, Vietnamese, and Korean. Japanese and Filipino names rank somewhat lower, and Pacific Islander rank even lower due to their low frequency. Lowering the limit of Census 2000 frequency should be considered. Doing so will increase the coverage. Also, the coverage problem illustrates one flaw with using the approach of a pre-sort by proportion. Unfortunately, there is no clear advantage to either a straight tally or to a pre-sort by proportion and then a tally. In the spirit of the research precedence set in the last two decades by Word and Perkins on a Hispanic surname list, Bye for his API list contributing to his race model, and Lauderdale and Kestenbaum on six ethic Asian surname lists, this research may also serve to continue work on name list research. Additional factors such as geography should be considered, since many API respondents are clustered in specific areas like Southern California. The Filipino population is a prime example of a centralized population that could benefit from a geographical component.
REFERENCES Bye, Barry V. December 1998. Race and Ethnicity Modeling with SSA NUMIDENT Data: Individual-Level Regression Model – Version 2. Internal Document. Lauderdale, Diane S. and Bert Kestenbaum. 2000. Asian American Ethnic Identification by Surname. Population Research and Policy Review. 19: 283-300. Philipp, Dan. February 2001. Hundred percent Census Unedited File -Veerrssiioonn 22..
Bureau of the Census, Decennial Systems and Contracts Management Office, Data Collection Control Staff.
Word, David L. and Perkins. March 1996. Building a Spanish Surname List for the
1990’s- A New Approach to an Old Problem. Bureau of the Census, Population Division Technical Working Paper No. 13. http://www.census.gov/population/documentation/twpno13.pdf. Accessed August 2001.
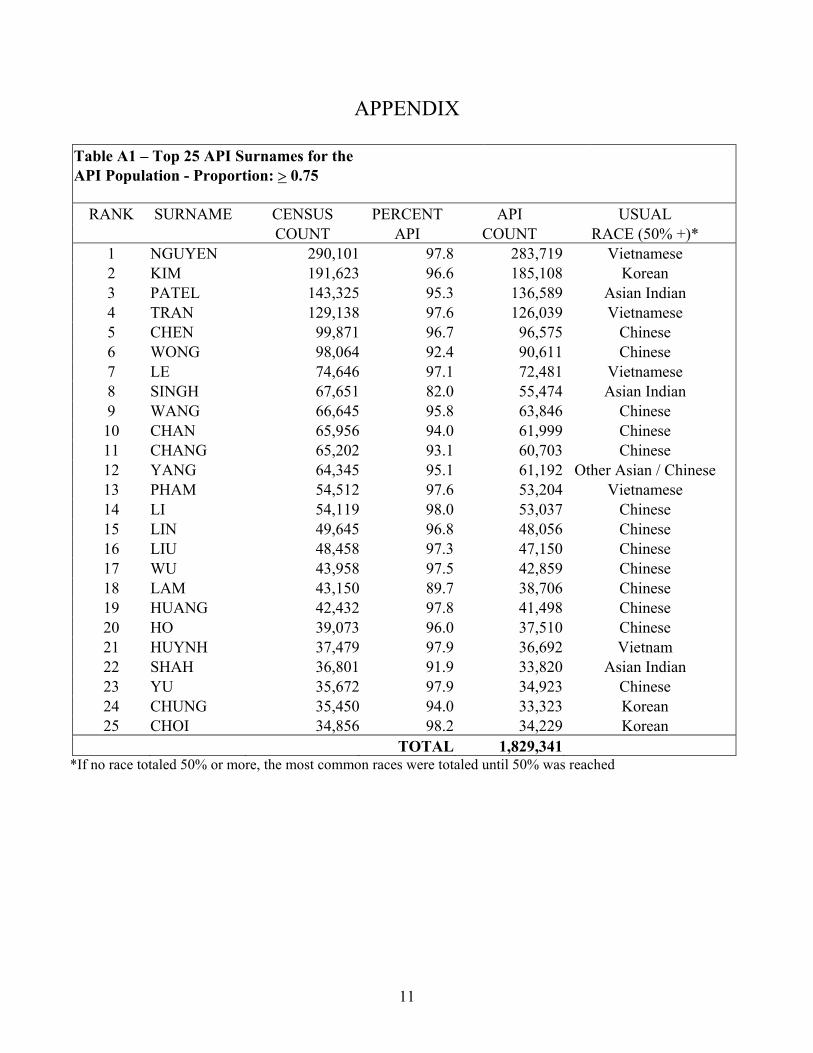
11
APPENDIX
Table A1 – Top 25 API Surnames for the API Population - Proportion: > 0.75
RANK SURNAME CENSUS PERCENT API USUAL COUNT API COUNT RACE (50% +)* 1 NGUYEN 290,101 97.8 283,719 Vietnamese 2 KIM 191,623 96.6 185,108 Korean 3 PATEL 143,325 95.3 136,589 Asian Indian 4 TRAN 129,138 97.6 126,039 Vietnamese 5 CHEN 99,871 96.7 96,575 Chinese 6 WONG 98,064 92.4 90,611 Chinese 7 LE 74,646 97.1 72,481 Vietnamese 8 SINGH 67,651 82.0 55,474 Asian Indian 9 WANG 66,645 95.8 63,846 Chinese 10 CHAN 65,956 94.0 61,999 Chinese 11 CHANG 65,202 93.1 60,703 Chinese 12 YANG 64,345 95.1 61,192 Other Asian / Chinese 13 PHAM 54,512 97.6 53,204 Vietnamese 14 LI 54,119 98.0 53,037 Chinese 15 LIN 49,645 96.8 48,056 Chinese 16 LIU 48,458 97.3 47,150 Chinese 17 WU 43,958 97.5 42,859 Chinese 18 LAM 43,150 89.7 38,706 Chinese 19 HUANG 42,432 97.8 41,498 Chinese 20 HO 39,073 96.0 37,510 Chinese 21 HUYNH 37,479 97.9 36,692 Vietnam 22 SHAH 36,801 91.9 33,820 Asian Indian 23 YU 35,672 97.9 34,923 Chinese 24 CHUNG 35,450 94.0 33,323 Korean 25 CHOI 34,856 98.2 34,229 Korean TOTAL 1,829,341
*If no race totaled 50% or more, the most common races were totaled until 50% was reached
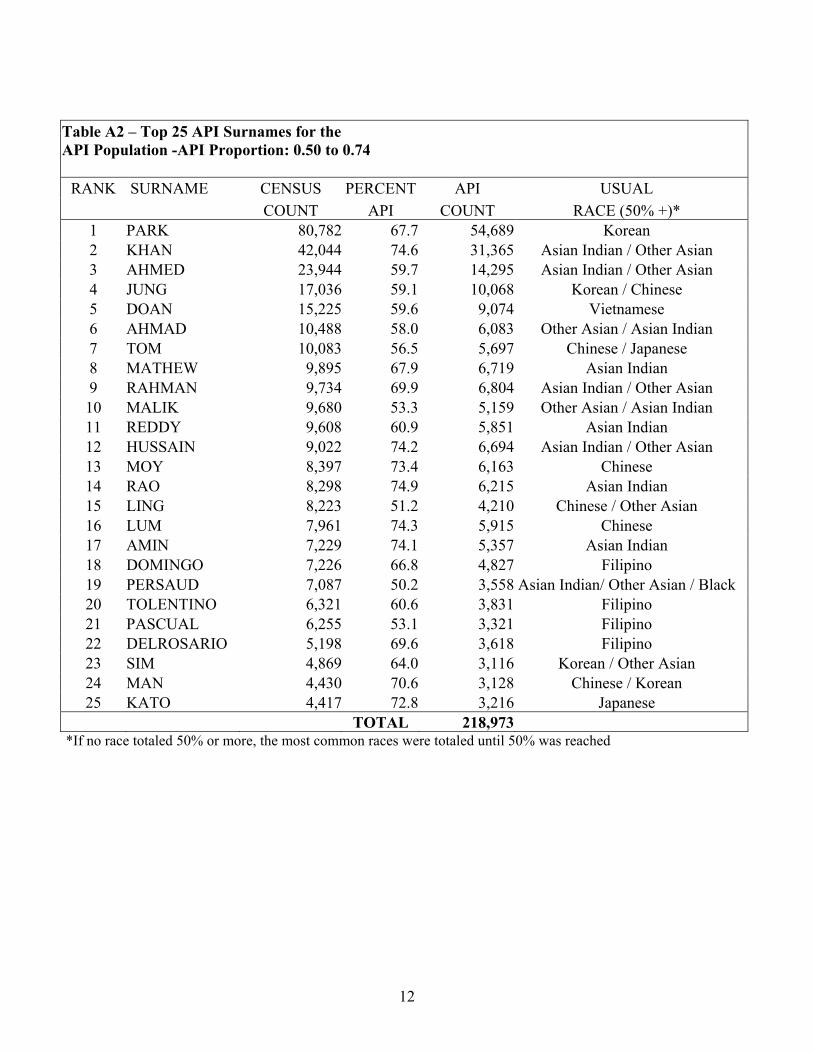
12
Table A2 – Top 25 API Surnames for the API Population -API Proportion: 0.50 to 0.74
RANK SURNAME CENSUS PERCENT API USUAL COUNT API COUNT RACE (50% +)* 1 PARK 80,782 67.7 54,689 Korean 2 KHAN 42,044 74.6 31,365 Asian Indian / Other Asian 3 AHMED 23,944 59.7 14,295 Asian Indian / Other Asian 4 JUNG 17,036 59.1 10,068 Korean / Chinese 5 DOAN 15,225 59.6 9,074 Vietnamese 6 AHMAD 10,488 58.0 6,083 Other Asian / Asian Indian 7 TOM 10,083 56.5 5,697 Chinese / Japanese 8 MATHEW 9,895 67.9 6,719 Asian Indian 9 RAHMAN 9,734 69.9 6,804 Asian Indian / Other Asian 10 MALIK 9,680 53.3 5,159 Other Asian / Asian Indian 11 REDDY 9,608 60.9 5,851 Asian Indian 12 HUSSAIN 9,022 74.2 6,694 Asian Indian / Other Asian 13 MOY 8,397 73.4 6,163 Chinese 14 RAO 8,298 74.9 6,215 Asian Indian 15 LING 8,223 51.2 4,210 Chinese / Other Asian 16 LUM 7,961 74.3 5,915 Chinese 17 AMIN 7,229 74.1 5,357 Asian Indian 18 DOMINGO 7,226 66.8 4,827 Filipino 19 PERSAUD 7,087 50.2 3,558 Asian Indian/ Other Asian / Black 20 TOLENTINO 6,321 60.6 3,831 Filipino 21 PASCUAL 6,255 53.1 3,321 Filipino 22 DELROSARIO 5,198 69.6 3,618 Filipino 23 SIM 4,869 64.0 3,116 Korean / Other Asian 24 MAN 4,430 70.6 3,128 Chinese / Korean 25 KATO 4,417 72.8 3,216 Japanese TOTAL 218,973
*If no race totaled 50% or more, the most common races were totaled until 50% was reached

Appendix C Detailed Tables Comparing Use of Hospital and Emergency Room
Services for Selected Ambulatory Care Sensitive Conditions by EDB Race/Ethnicity and CAHPS Self-Reported Race/Ethnicity

C-1
Table C1. Number, percentage, and ratio of Medicare CAHPS beneficiaries with hospital or emergency room admission with a diagnosis of cellulitis in previous 12 months by
EDBRACE and SELFRACE
EDBRACE SELFRACE Ratio*
Race/ethnicity Number Percent Number Percent Numbers PercentsWhite 1,085 0.55 1,013 0.54 0.93 0.99Black 94 0.60 84 0.60 0.89 1.00Hispanic 27 0.88 63 0.71 2.33 0.81A/PI 11 0.55 11 0.39 1.00 0.71AI/AN 4 1.07 10 0.89 2.50 0.83Other/unreported 7 0.33 47 0.55 6.71 1.69
* Ratio = number (percent) according to SELFRACE/number (percent) according to EDBRACE.
Source: Medicare claims for respondents to the 2000 and 2001 Medicare fee-for-service CAHPS surveys.
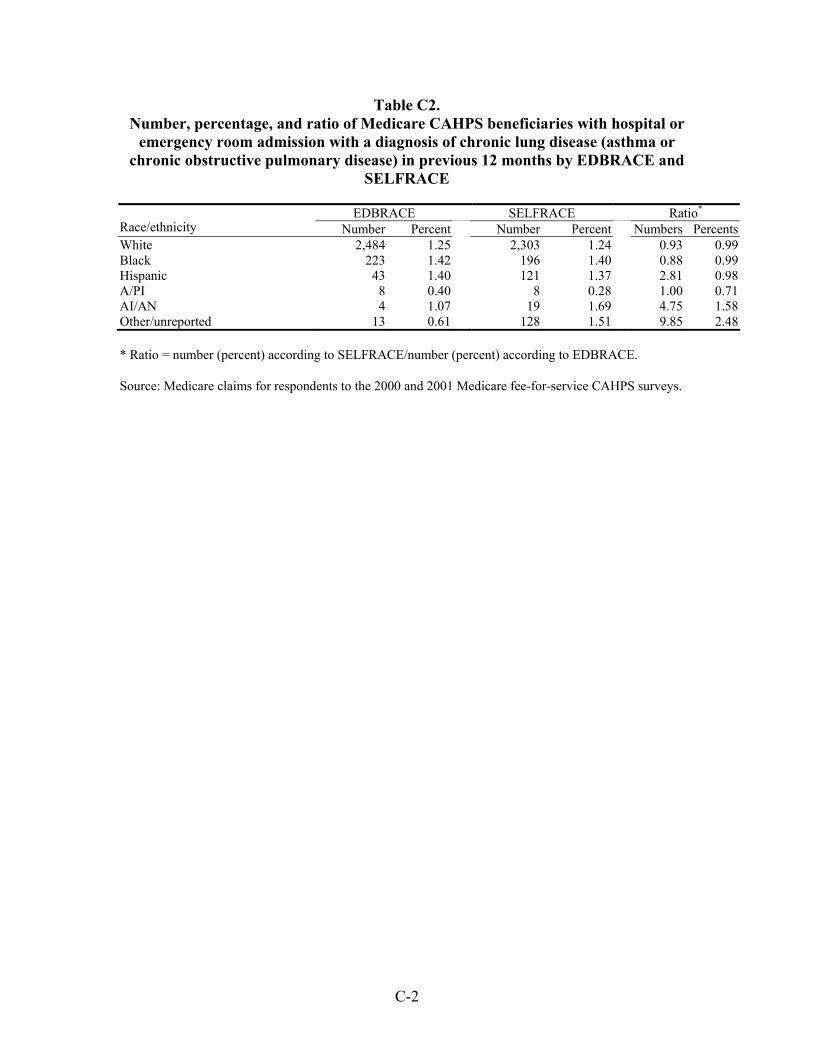
C-2
Table C2. Number, percentage, and ratio of Medicare CAHPS beneficiaries with hospital or
emergency room admission with a diagnosis of chronic lung disease (asthma or chronic obstructive pulmonary disease) in previous 12 months by EDBRACE and
SELFRACE
EDBRACE SELFRACE Ratio*
Race/ethnicity Number Percent Number Percent Numbers PercentsWhite 2,484 1.25 2,303 1.24 0.93 0.99Black 223 1.42 196 1.40 0.88 0.99Hispanic 43 1.40 121 1.37 2.81 0.98A/PI 8 0.40 8 0.28 1.00 0.71AI/AN 4 1.07 19 1.69 4.75 1.58Other/unreported 13 0.61 128 1.51 9.85 2.48
* Ratio = number (percent) according to SELFRACE/number (percent) according to EDBRACE.
Source: Medicare claims for respondents to the 2000 and 2001 Medicare fee-for-service CAHPS surveys.

C-3
Table C3. Number, percentage, and ratio of Medicare CAHPS beneficiaries with hospital or emergency room admission with a diagnosis of congestive heart failure in previous
12 months by EDBRACE and SELFRACE
EDBRACE SELFRACE Ratio*
Race/ethnicity Number Percent Number Percent Numbers PercentsWhite 2,543 1.28 2,353 1.26 0.93 0.98Black 341 2.17 302 2.15 0.89 0.99Hispanic 39 1.27 123 1.39 3.15 1.10A/PI 14 0.70 16 0.57 1.14 0.81AI/AN 7 1.87 20 1.77 2.86 0.95Other/unreported 19 0.89 149 1.75 7.84 1.98
* Ratio = number (percent) according to SELFRACE/number (percent) according to EDBRACE.
Source: Medicare claims for respondents to the 2000 and 2001 Medicare fee-for-service CAHPS surveys.

C-4
Table C4. Number, percentage, and ratio of Medicare CAHPS beneficiaries with hospital or
emergency room admission with a diagnosis of hypertension in previous 12 months by EDBRACE and SELFRACE
EDBRACE SELFRACE Ratio*
Race/ethnicity Number Percent Number Percent Numbers PercentsWhite 828 0.42 774 0.42 0.93 1.00Black 198 1.26 183 1.30 0.92 1.04Hispanic 25 0.81 62 0.70 2.48 0.86A/PI 6 0.30 9 0.32 1.50 1.07AI/AN 1 0.27 4 0.35 4.00 1.33Other/unreported 14 0.65 40 0.47 2.86 0.72
* Ratio = number (percent) according to SELFRACE/number (percent) according to EDBRACE.
Source: Medicare claims for respondents to the 2000 and 2001 Medicare fee-for-service CAHPS surveys.

C-5
Table C5. Number, percentage, and ratio of Medicare CAHPS beneficiaries with hospital or emergency room admission with a diagnosis of seizures in previous 12 months by
EDBRACE and SELFRACE
EDBRACE SELFRACE Ratio*
Race/ethnicity Number Percent Number Percent Numbers PercentsWhite 350 0.18 317 0.17 0.91 0.96Black 73 0.46 65 0.46 0.89 1.00Hispanic 9 0.29 36 0.41 4.00 1.39A/PI 4 0.20 5 0.18 1.25 0.89AI/AN 1 0.27 8 0.71 8.00 2.66Other/unreported 11 0.51 17 0.20 1.55 0.39
* Ratio = number (percent) according to SELFRACE/number (percent) according to EDBRACE.
Source: Medicare claims for respondents to the 2000 and 2001 Medicare fee-for-service CAHPS surveys.
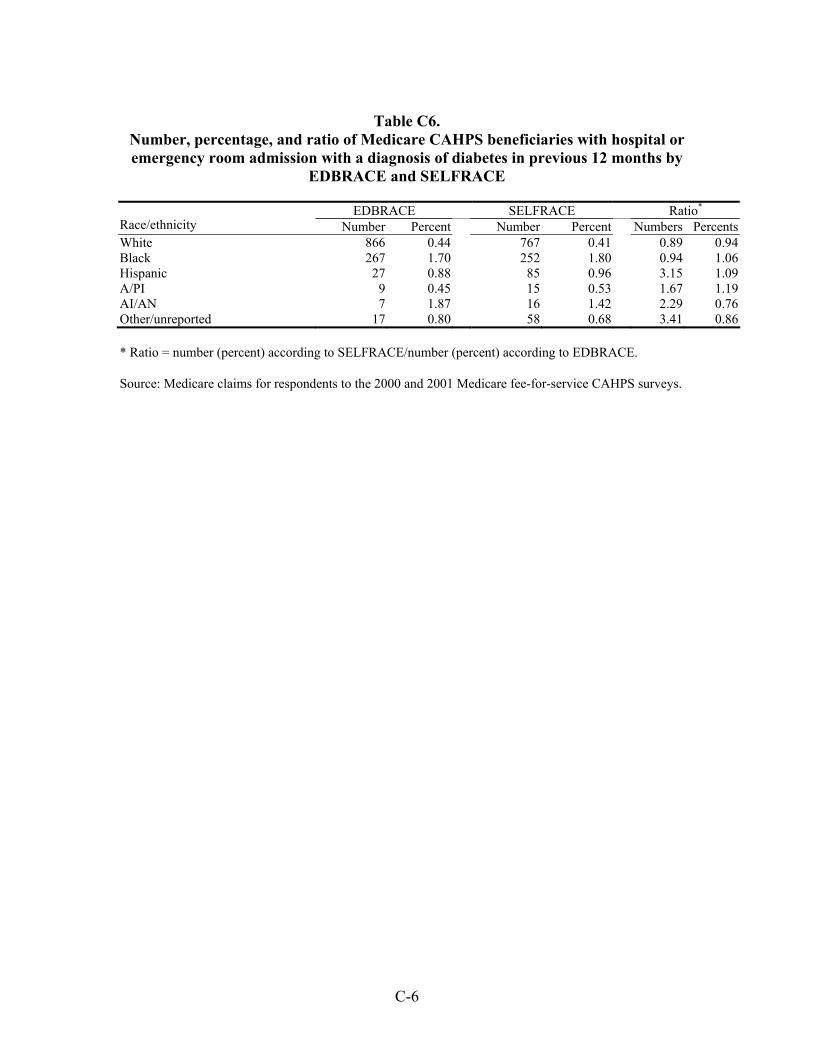
C-6
Table C6. Number, percentage, and ratio of Medicare CAHPS beneficiaries with hospital or emergency room admission with a diagnosis of diabetes in previous 12 months by
EDBRACE and SELFRACE
EDBRACE SELFRACE Ratio*
Race/ethnicity Number Percent Number Percent Numbers PercentsWhite 866 0.44 767 0.41 0.89 0.94Black 267 1.70 252 1.80 0.94 1.06Hispanic 27 0.88 85 0.96 3.15 1.09A/PI 9 0.45 15 0.53 1.67 1.19AI/AN 7 1.87 16 1.42 2.29 0.76Other/unreported 17 0.80 58 0.68 3.41 0.86
* Ratio = number (percent) according to SELFRACE/number (percent) according to EDBRACE.
Source: Medicare claims for respondents to the 2000 and 2001 Medicare fee-for-service CAHPS surveys.

C-7
Table C7. Number, percentage, and ratio of Medicare CAHPS beneficiaries with hospital or
emergency room admission with a diagnosis of pneumonia in previous 12 months by EDBRACE and SELFRACE
EDBRACE SELFRACE Ratio*
Race/ethnicity Number Percent Number Percent Numbers PercentsWhite 2,891 1.46 2,699 1.45 0.93 0.99Black 193 1.23 179 1.28 0.93 1.04Hispanic 41 1.33 114 1.29 2.78 0.97A/PI 14 0.70 15 0.53 1.07 0.76AI/AN 9 2.41 27 2.40 3.00 1.00Other/unreported 23 1.08 137 1.61 5.96 1.50
* Ratio = number (percent) according to SELFRACE/number (percent) according to EDBRACE.
Source: Medicare claims for respondents to the 2000 and 2001 Medicare fee-for-service CAHPS surveys.
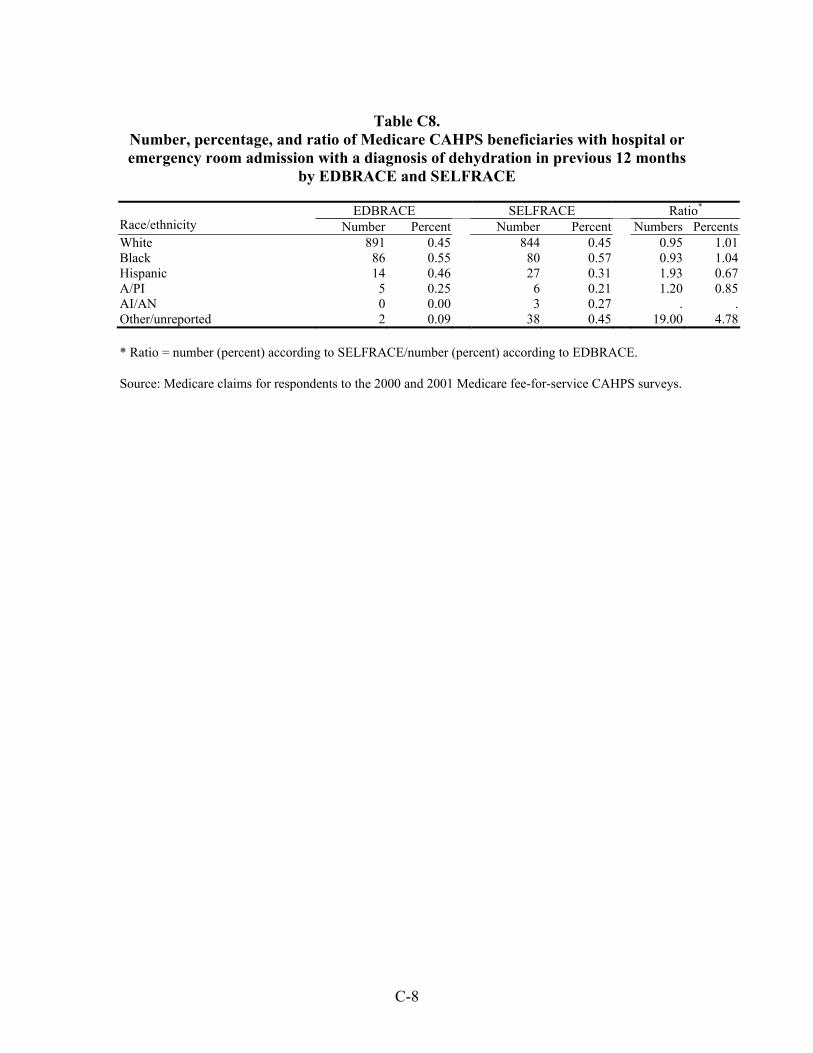
C-8
Table C8. Number, percentage, and ratio of Medicare CAHPS beneficiaries with hospital or emergency room admission with a diagnosis of dehydration in previous 12 months
by EDBRACE and SELFRACE
EDBRACE SELFRACE Ratio*
Race/ethnicity Number Percent Number Percent Numbers PercentsWhite 891 0.45 844 0.45 0.95 1.01Black 86 0.55 80 0.57 0.93 1.04Hispanic 14 0.46 27 0.31 1.93 0.67A/PI 5 0.25 6 0.21 1.20 0.85AI/AN 0 0.00 3 0.27 . .Other/unreported 2 0.09 38 0.45 19.00 4.78
* Ratio = number (percent) according to SELFRACE/number (percent) according to EDBRACE.
Source: Medicare claims for respondents to the 2000 and 2001 Medicare fee-for-service CAHPS surveys.

C-9
Table C9. Number, percentage, and ratio of Medicare CAHPS beneficiaries with hospital or
emergency room admission with a diagnosis of urinary tract infection in previous 12 months by EDBRACE and SELFRACE
EDBRACE SELFRACE Ratio*
Race/ethnicity Number Percent Number Percent Numbers PercentsWhite 1,417 0.72 1,334 0.72 0.94 1.00Black 153 0.97 140 1.00 0.92 1.03Hispanic 24 0.78 61 0.69 2.54 0.88A/PI 10 0.50 7 0.25 0.70 0.50AI/AN 2 0.53 11 0.98 5.50 1.83Other/unreported 8 0.37 61 0.72 7.63 1.92
* Ratio = number (percent) according to SELFRACE/number (percent) according to EDBRACE.
Source: Medicare claims for respondents to the 2000 and 2001 Medicare fee-for-service CAHPS surveys.

C-10
Table C10. Number, percentage, and ratio of Medicare CAHPS beneficiaries with hospital or
emergency room admission with a diagnosis of ulcer in previous 12 months by EDBRACE and SELFRACE
EDBRACE SELFRACE Ratio*
Race/ethnicity Number Percent Number Percent Numbers PercentsWhite 474 0.24 455 0.24 0.96 1.02Black 39 0.25 39 0.28 1.00 1.12Hispanic 9 0.29 19 0.21 2.11 0.73A/PI 2 0.10 5 0.18 2.50 1.78AI/AN 4 1.07 2 0.18 0.50 0.17Other/unreported 5 0.23 13 0.15 2.60 0.65
* Ratio = number (percent) according to SELFRACE/number (percent) according to EDBRACE.
Source: Medicare claims for respondents to the 2000 and 2001 Medicare fee-for-service CAHPS surveys.

C-11
Table C11. Number, percentage, and ratio of Medicare CAHPS beneficiaries with hospital or
emergency room admission with a diagnosis of hypoglycemia in previous 12 months by EDBRACE and SELFRACE
EDBRACE SELFRACE Ratio*
Race/ethnicity Number Percent Number Percent Numbers PercentsWhite 72 0.04 66 0.04 0.92 0.98Black 19 0.12 15 0.11 0.79 0.89Hispanic 2 0.07 6 0.07 3.00 1.04A/PI 0 0.00 1 0.04 . .AI/AN 1 0.27 1 0.09 1.00 0.33Other/unreported 2 0.09 7 0.08 3.50 0.88
* Ratio = number (percent) according to SELFRACE/number (percent) according to EDBRACE.
Source: Medicare claims for respondents to the 2000 and 2001 Medicare fee-for-service CAHPS surveys.

C-12
Table C12. Number, percentage, and ratio of Medicare CAHPS beneficiaries with hospital or emergency room admission with a diagnosis of hypokalemia in previous 12 months
by EDBRACE and SELFRACE
EDBRACE SELFRACE Ratio*
Race/ethnicity Number Percent Number Percent Numbers PercentsWhite 94 0.05 86 0.05 0.91 0.97Black 19 0.12 17 0.12 0.89 1.00Hispanic 1 0.03 5 0.06 5.00 1.74A/PI 1 0.05 2 0.07 2.00 1.42AI/AN 0 0.00 1 0.09 . .Other/unreported 0 0.00 4 0.05 . .
* Ratio = number (percent) according to SELFRACE/number (percent) according to EDBRACE.
Source: Medicare claims for respondents to the 2000 and 2001 Medicare fee-for-service CAHPS surveys.

C-13
Table C13. Number, percentage, and ratio of Medicare CAHPS beneficiaries with hospital or
emergency room admission with a diagnosis of ENT infection in previous 12 months by EDBRACE and SELFRACE
EDBRACE SELFRACE Ratio*
Race/ethnicity Number Percent Number Percent Numbers PercentsWhite 571 0.29 520 0.28 0.91 0.97Black 100 0.64 88 0.63 0.88 0.99Hispanic 22 0.72 55 0.62 2.50 0.87A/PI 5 0.25 7 0.25 1.40 1.00AI/AN 3 0.80 6 0.53 2.00 0.66Other/unreported 12 0.56 37 0.44 3.08 0.78
* Ratio = number (percent) according to SELFRACE/number (percent) according to EDBRACE.
Source: Medicare claims for respondents to the 2000 and 2001 Medicare fee-for-service CAHPS surveys.
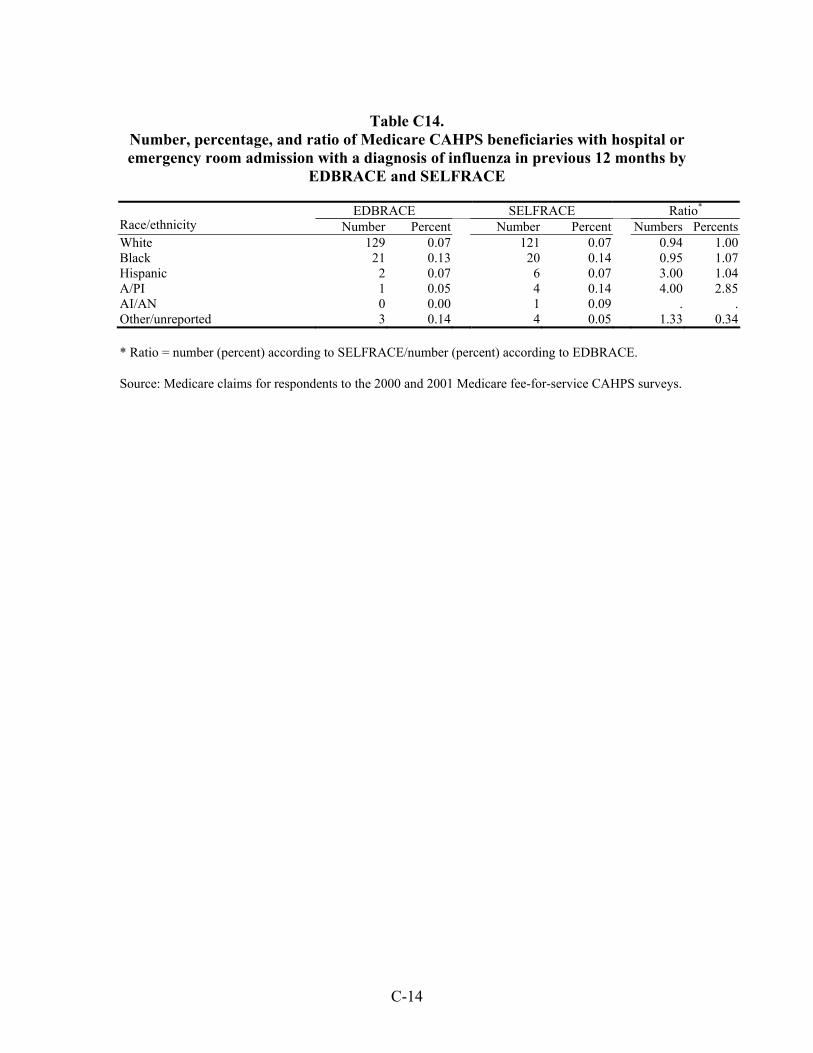
C-14
Table C14. Number, percentage, and ratio of Medicare CAHPS beneficiaries with hospital or emergency room admission with a diagnosis of influenza in previous 12 months by
EDBRACE and SELFRACE
EDBRACE SELFRACE Ratio*
Race/ethnicity Number Percent Number Percent Numbers PercentsWhite 129 0.07 121 0.07 0.94 1.00Black 21 0.13 20 0.14 0.95 1.07Hispanic 2 0.07 6 0.07 3.00 1.04A/PI 1 0.05 4 0.14 4.00 2.85AI/AN 0 0.00 1 0.09 . .Other/unreported 3 0.14 4 0.05 1.33 0.34
* Ratio = number (percent) according to SELFRACE/number (percent) according to EDBRACE.
Source: Medicare claims for respondents to the 2000 and 2001 Medicare fee-for-service CAHPS surveys.
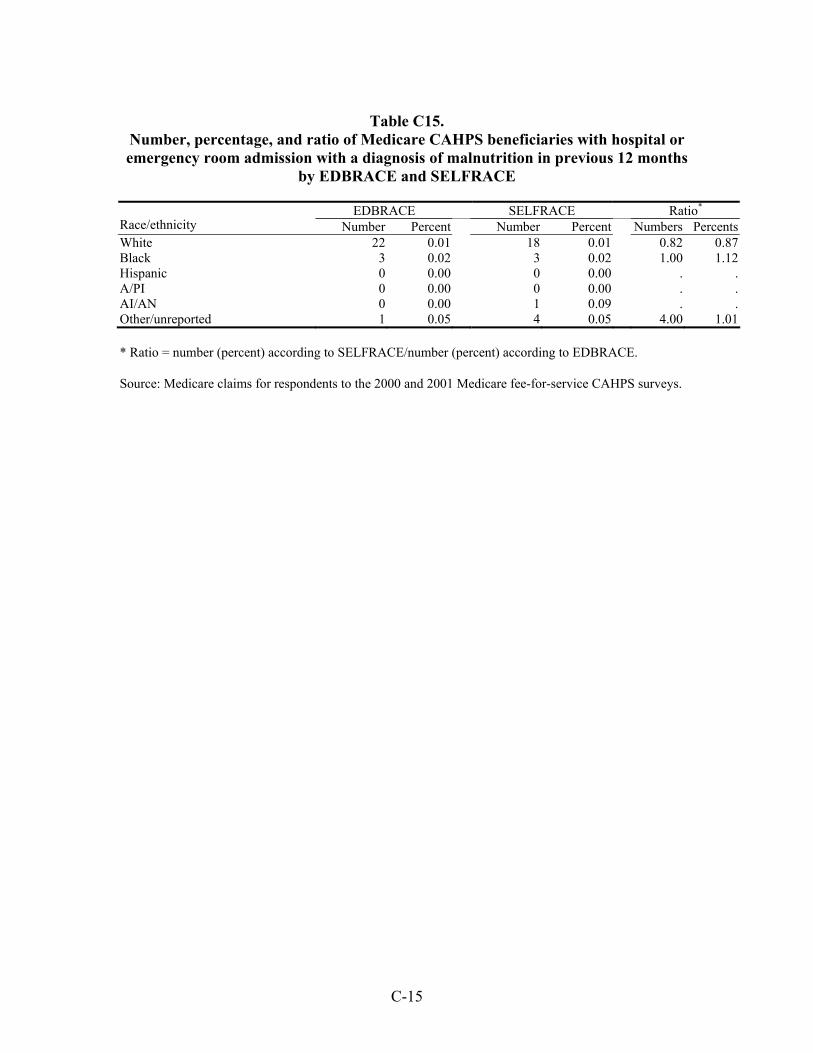
C-15
Table C15. Number, percentage, and ratio of Medicare CAHPS beneficiaries with hospital or emergency room admission with a diagnosis of malnutrition in previous 12 months
by EDBRACE and SELFRACE
EDBRACE SELFRACE Ratio*
Race/ethnicity Number Percent Number Percent Numbers PercentsWhite 22 0.01 18 0.01 0.82 0.87Black 3 0.02 3 0.02 1.00 1.12Hispanic 0 0.00 0 0.00 . .A/PI 0 0.00 0 0.00 . .AI/AN 0 0.00 1 0.09 . .Other/unreported 1 0.05 4 0.05 4.00 1.01
* Ratio = number (percent) according to SELFRACE/number (percent) according to EDBRACE.
Source: Medicare claims for respondents to the 2000 and 2001 Medicare fee-for-service CAHPS surveys.

Appendix D Detailed Tables Comparing Use of Hospital Services for Selected
Diagnoses by EDB Race/Ethnicity and CAHPS Self-Reported Race/Ethnicity

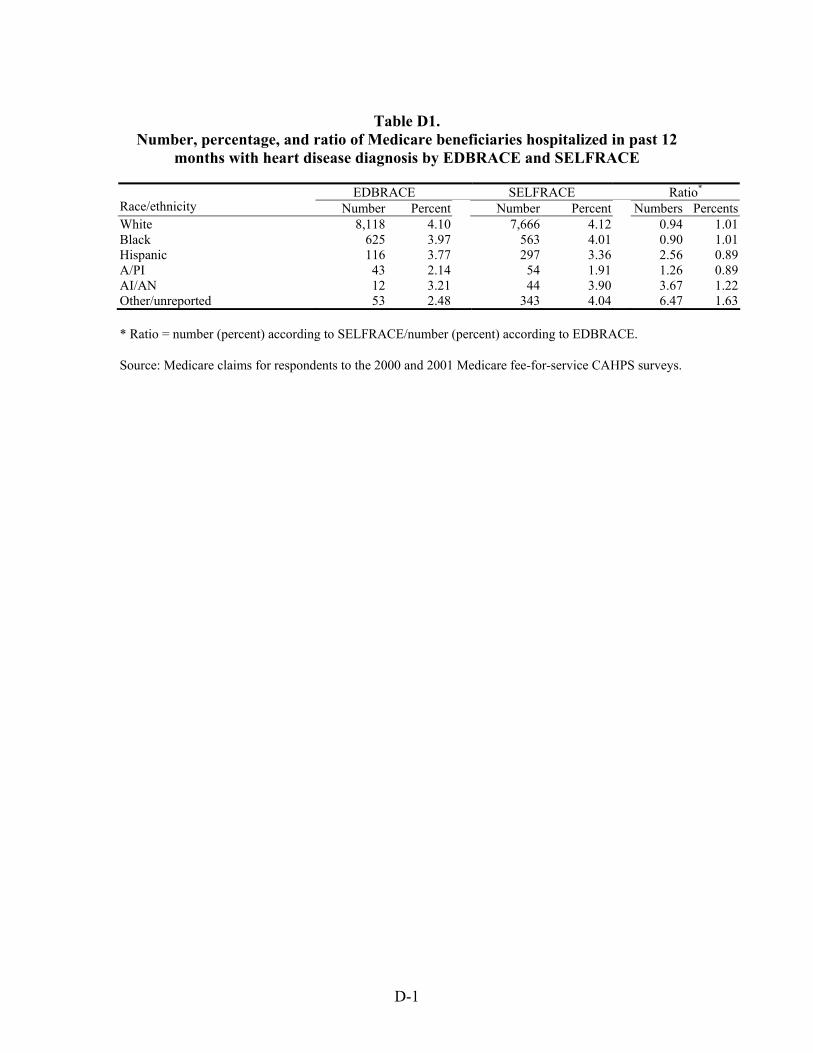
D-1
Table D1. Number, percentage, and ratio of Medicare beneficiaries hospitalized in past 12
months with heart disease diagnosis by EDBRACE and SELFRACE
EDBRACE SELFRACE Ratio*
Race/ethnicity Number Percent Number Percent Numbers PercentsWhite 8,118 4.10 7,666 4.12 0.94 1.01Black 625 3.97 563 4.01 0.90 1.01Hispanic 116 3.77 297 3.36 2.56 0.89A/PI 43 2.14 54 1.91 1.26 0.89AI/AN 12 3.21 44 3.90 3.67 1.22Other/unreported 53 2.48 343 4.04 6.47 1.63
* Ratio = number (percent) according to SELFRACE/number (percent) according to EDBRACE.
Source: Medicare claims for respondents to the 2000 and 2001 Medicare fee-for-service CAHPS surveys.

D-2
Table D2. Mean payment and mean length of stay of Medicare beneficiaries hospitalized in
past 12 months with heart disease diagnosis by EDBRACE and SELFRACE
EDBRACE SELFRACE Ratio*
Race/ethnicity PaymentLength of stay Payment
Length of stay Payments
Lengths of stay
White $11,997.41 6.04 $12,029.60 6.03 1.00 1.00 Black $9,372.78 6.25 $9,237.18 6.21 0.99 0.99 Hispanic $9,466.03 7.80 $10,568.04 7.12 1.12 0.91 A/PI $15,232.49 7.44 $13,234.39 5.93 0.87 0.80 AI/AN $10,270.42 5.25 $12,499.59 6.75 1.22 1.29 Other/unreported $12,529.34 5.77 $11,575.92 6.08 0.92 1.05
* Ratio = number (percent) according to SELFRACE/number (percent) according to EDBRACE.
Source: Medicare claims for respondents to the 2000 and 2001 Medicare fee-for-service CAHPS surveys.
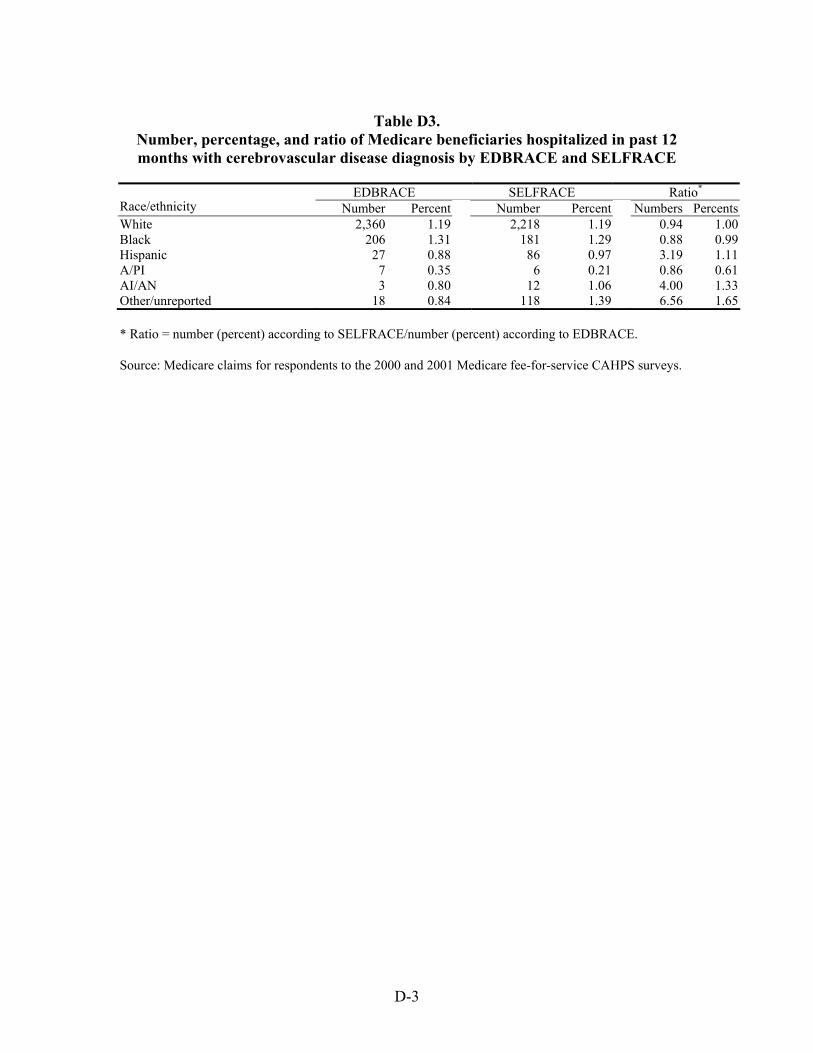
D-3
Table D3. Number, percentage, and ratio of Medicare beneficiaries hospitalized in past 12 months with cerebrovascular disease diagnosis by EDBRACE and SELFRACE
EDBRACE SELFRACE Ratio*
Race/ethnicity Number Percent Number Percent Numbers PercentsWhite 2,360 1.19 2,218 1.19 0.94 1.00Black 206 1.31 181 1.29 0.88 0.99Hispanic 27 0.88 86 0.97 3.19 1.11A/PI 7 0.35 6 0.21 0.86 0.61AI/AN 3 0.80 12 1.06 4.00 1.33Other/unreported 18 0.84 118 1.39 6.56 1.65
* Ratio = number (percent) according to SELFRACE/number (percent) according to EDBRACE.
Source: Medicare claims for respondents to the 2000 and 2001 Medicare fee-for-service CAHPS surveys.
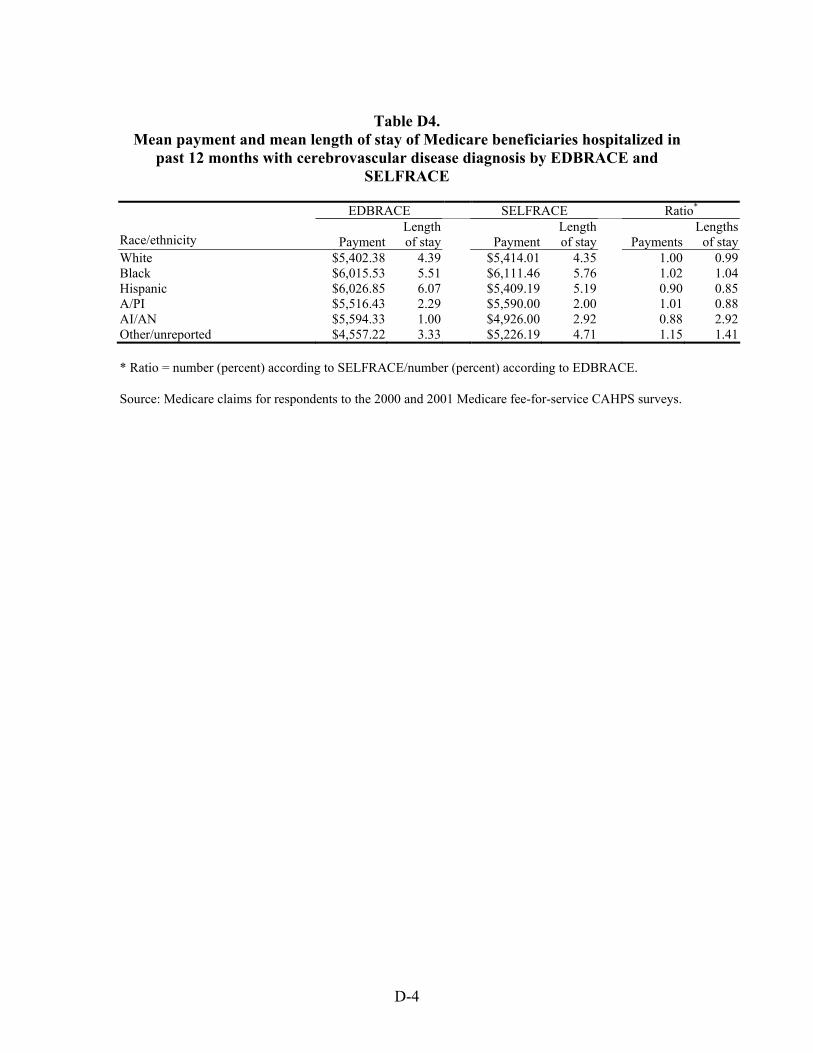
D-4
Table D4. Mean payment and mean length of stay of Medicare beneficiaries hospitalized in
past 12 months with cerebrovascular disease diagnosis by EDBRACE and SELFRACE
EDBRACE SELFRACE Ratio*
Race/ethnicity PaymentLength of stay Payment
Length of stay Payments
Lengths of stay
White $5,402.38 4.39 $5,414.01 4.35 1.00 0.99Black $6,015.53 5.51 $6,111.46 5.76 1.02 1.04Hispanic $6,026.85 6.07 $5,409.19 5.19 0.90 0.85A/PI $5,516.43 2.29 $5,590.00 2.00 1.01 0.88AI/AN $5,594.33 1.00 $4,926.00 2.92 0.88 2.92Other/unreported $4,557.22 3.33 $5,226.19 4.71 1.15 1.41
* Ratio = number (percent) according to SELFRACE/number (percent) according to EDBRACE.
Source: Medicare claims for respondents to the 2000 and 2001 Medicare fee-for-service CAHPS surveys.

D-5
Table D5. Number, percentage, and ratio of Medicare beneficiaries hospitalized in past 12
months with pneumonia diagnosis by EDBRACE and SELFRACE
EDBRACE SELFRACE Ratio*
Race/ethnicity Number Percent Number Percent Numbers PercentsWhite 2,108 1.06 1,974 1.06 0.94 1.00Black 149 0.95 139 0.99 0.93 1.05Hispanic 31 1.01 89 1.01 2.87 1.00A/PI 11 0.55 11 0.39 1.00 0.71AI/AN 10 2.67 19 1.69 1.90 0.63Other/unreported 22 1.03 99 1.17 4.50 1.13
* Ratio = number (percent) according to SELFRACE/number (percent) according to EDBRACE.
Source: Medicare claims for respondents to the 2000 and 2001 Medicare fee-for-service CAHPS surveys.
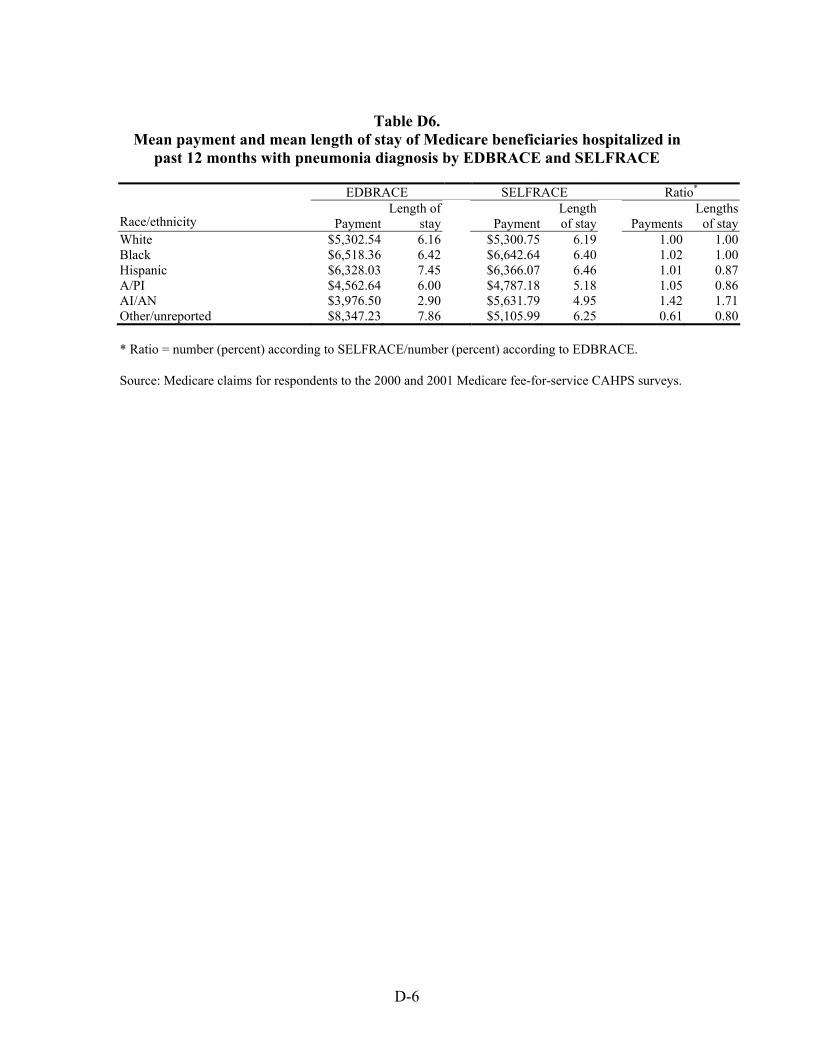
D-6
Table D6. Mean payment and mean length of stay of Medicare beneficiaries hospitalized in
past 12 months with pneumonia diagnosis by EDBRACE and SELFRACE
EDBRACE SELFRACE Ratio*
Race/ethnicity PaymentLength of
stay PaymentLength of stay Payments
Lengths of stay
White $5,302.54 6.16 $5,300.75 6.19 1.00 1.00 Black $6,518.36 6.42 $6,642.64 6.40 1.02 1.00 Hispanic $6,328.03 7.45 $6,366.07 6.46 1.01 0.87 A/PI $4,562.64 6.00 $4,787.18 5.18 1.05 0.86 AI/AN $3,976.50 2.90 $5,631.79 4.95 1.42 1.71 Other/unreported $8,347.23 7.86 $5,105.99 6.25 0.61 0.80
* Ratio = number (percent) according to SELFRACE/number (percent) according to EDBRACE.
Source: Medicare claims for respondents to the 2000 and 2001 Medicare fee-for-service CAHPS surveys.

D-7
Table D7. Number, percentage, and ratio of Medicare beneficiaries hospitalized in past 12
months with malignant neoplasm diagnosis by EDBRACE and SELFRACE
EDBRACE SELFRACE Ratio*
Race/ethnicity Number Percent Number Percent Numbers PercentsWhite 1,738 0.88 1,651 0.89 0.95 1.01Black 127 0.81 118 0.84 0.93 1.04Hispanic 18 0.59 56 0.63 3.11 1.08A/PI 14 0.70 15 0.53 1.07 0.76AI/AN 1 0.27 7 0.62 7.00 2.32Other/unreported 13 0.61 64 0.75 4.92 1.24
* Ratio = number (percent) according to SELFRACE/number (percent) according to EDBRACE.
Source: Medicare claims for respondents to the 2000 and 2001 Medicare fee-for-service CAHPS surveys.
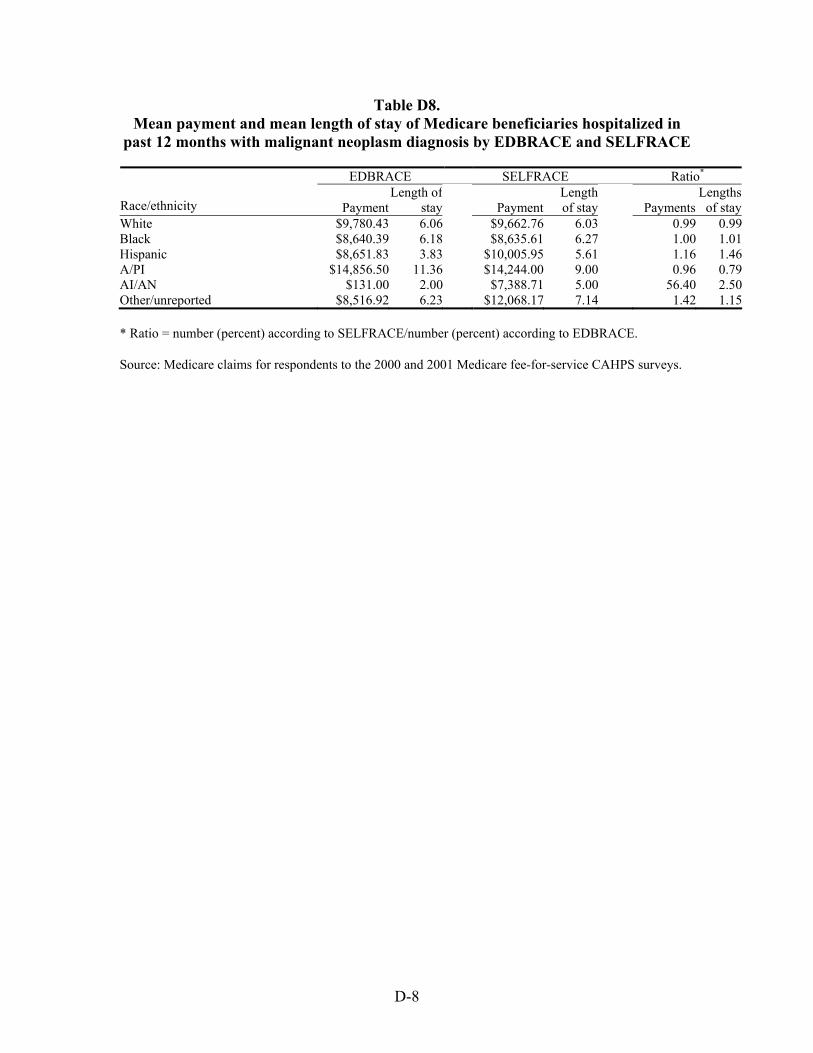
D-8
Table D8. Mean payment and mean length of stay of Medicare beneficiaries hospitalized in
past 12 months with malignant neoplasm diagnosis by EDBRACE and SELFRACE
EDBRACE SELFRACE Ratio*
Race/ethnicity PaymentLength of
stay PaymentLength of stay Payments
Lengths of stay
White $9,780.43 6.06 $9,662.76 6.03 0.99 0.99 Black $8,640.39 6.18 $8,635.61 6.27 1.00 1.01 Hispanic $8,651.83 3.83 $10,005.95 5.61 1.16 1.46 A/PI $14,856.50 11.36 $14,244.00 9.00 0.96 0.79 AI/AN $131.00 2.00 $7,388.71 5.00 56.40 2.50 Other/unreported $8,516.92 6.23 $12,068.17 7.14 1.42 1.15
* Ratio = number (percent) according to SELFRACE/number (percent) according to EDBRACE.
Source: Medicare claims for respondents to the 2000 and 2001 Medicare fee-for-service CAHPS surveys.
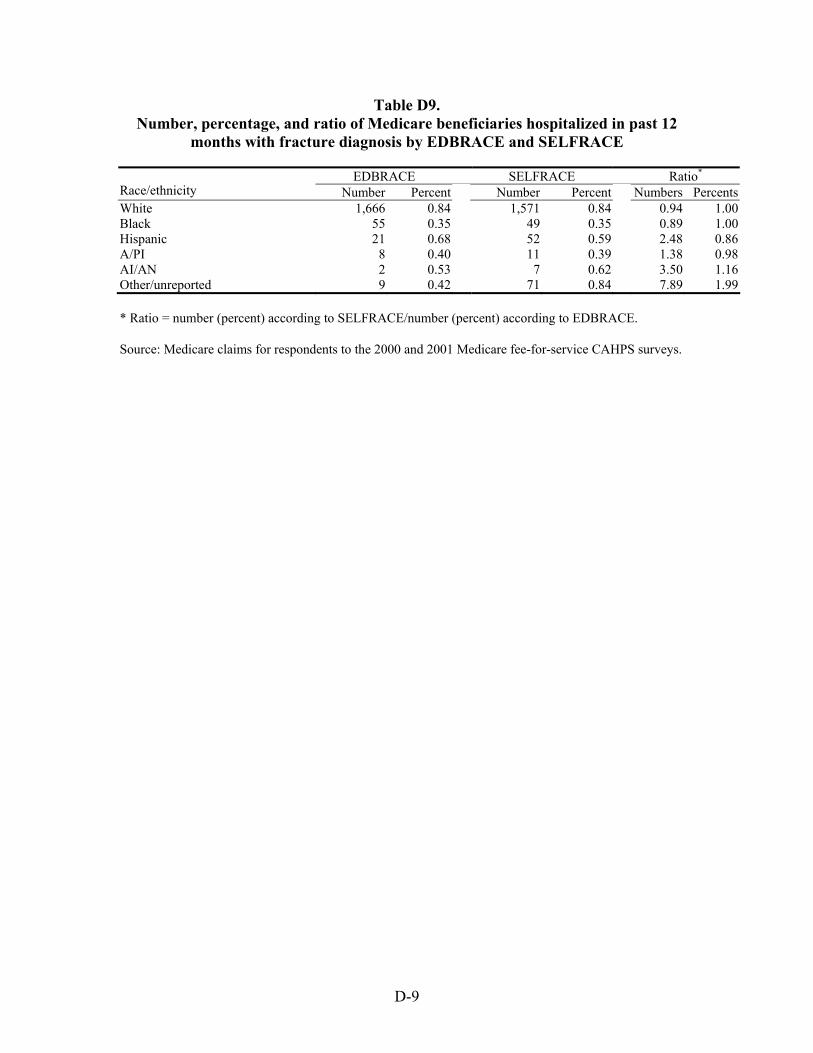
D-9
Table D9. Number, percentage, and ratio of Medicare beneficiaries hospitalized in past 12
months with fracture diagnosis by EDBRACE and SELFRACE
EDBRACE SELFRACE Ratio*
Race/ethnicity Number Percent Number Percent Numbers PercentsWhite 1,666 0.84 1,571 0.84 0.94 1.00Black 55 0.35 49 0.35 0.89 1.00Hispanic 21 0.68 52 0.59 2.48 0.86A/PI 8 0.40 11 0.39 1.38 0.98AI/AN 2 0.53 7 0.62 3.50 1.16Other/unreported 9 0.42 71 0.84 7.89 1.99
* Ratio = number (percent) according to SELFRACE/number (percent) according to EDBRACE.
Source: Medicare claims for respondents to the 2000 and 2001 Medicare fee-for-service CAHPS surveys.

D-10
Table D10. Mean payment and mean length of stay of Medicare beneficiaries hospitalized in
past 12 months with fracture diagnosis by EDBRACE and SELFRACE
EDBRACE SELFRACE Ratio*
Race/ethnicity PaymentLength of stay Payment
Length of stay Payments
Lengths of stay
White $6,174.39 5.58 $6,188.13 5.57 1.00 1.00 Black $7,398.04 6.31 $7,430.45 6.29 1.00 1.00 Hispanic $6,923.52 6.38 $6,925.58 6.17 1.00 0.97 A/PI $7,065.63 6.63 $7,770.91 6.18 1.10 0.93 AI/AN $9,050.50 5.00 $4,788.71 4.14 0.53 0.83 Other/unreported $7,291.67 5.00 $5,835.04 5.63 0.80 1.13
* Ratio = number (percent) according to SELFRACE/number (percent) according to EDBRACE.
Source: Medicare claims for respondents to the 2000 and 2001 Medicare fee-for-service CAHPS surveys.

Appendix E Results of the GeoCode Program Processing for Each of the 10
Segments of the Unloaded EDB
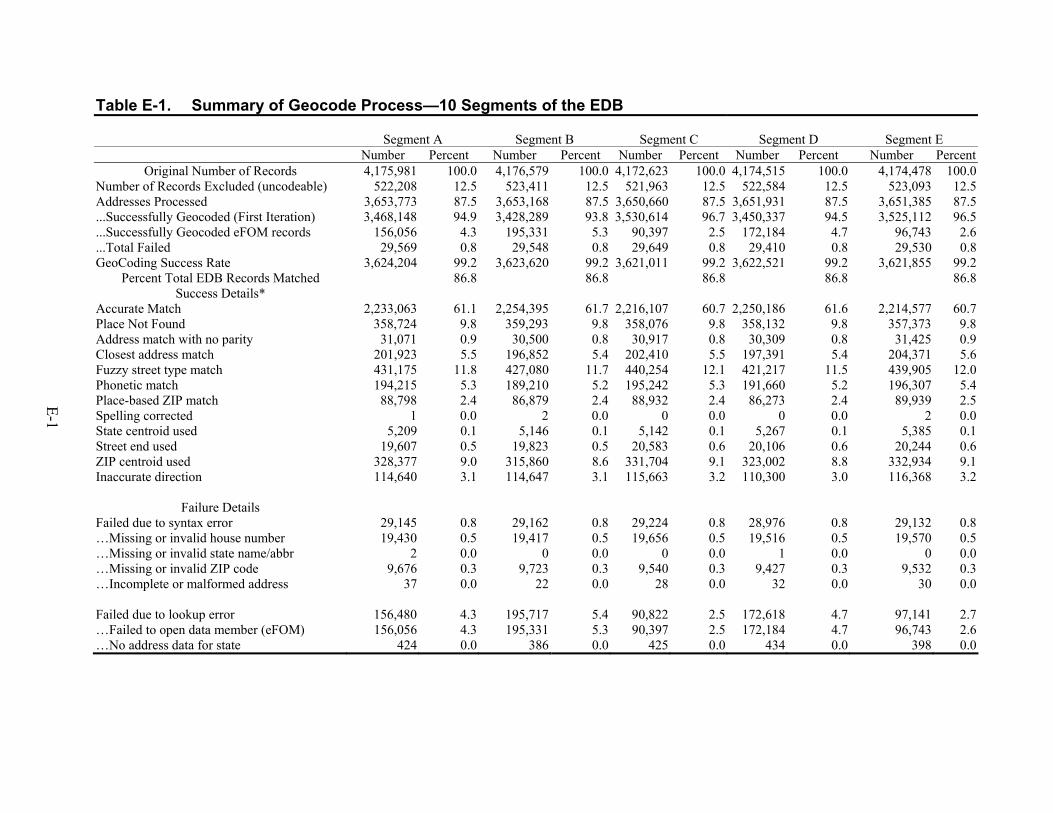
E-1
Table E-1. Summary of Geocode Process—10 Segments of the EDB
Segment A Segment B Segment C Segment D Segment E Number Percent Number Percent Number Percent Number Percent Number Percent
Original Number of Records 4,175,981 100.0 4,176,579 100.0 4,172,623 100.0 4,174,515 100.0 4,174,478 100.0Number of Records Excluded (uncodeable) 522,208 12.5 523,411 12.5 521,963 12.5 522,584 12.5 523,093 12.5Addresses Processed 3,653,773 87.5 3,653,168 87.5 3,650,660 87.5 3,651,931 87.5 3,651,385 87.5...Successfully Geocoded (First Iteration) 3,468,148 94.9 3,428,289 93.8 3,530,614 96.7 3,450,337 94.5 3,525,112 96.5...Successfully Geocoded eFOM records 156,056 4.3 195,331 5.3 90,397 2.5 172,184 4.7 96,743 2.6...Total Failed 29,569 0.8 29,548 0.8 29,649 0.8 29,410 0.8 29,530 0.8GeoCoding Success Rate 3,624,204 99.2 3,623,620 99.2 3,621,011 99.2 3,622,521 99.2 3,621,855 99.2
Percent Total EDB Records Matched 86.8 86.8 86.8 86.8 86.8Success Details*
Accurate Match 2,233,063 61.1 2,254,395 61.7 2,216,107 60.7 2,250,186 61.6 2,214,577 60.7Place Not Found 358,724 9.8 359,293 9.8 358,076 9.8 358,132 9.8 357,373 9.8Address match with no parity 31,071 0.9 30,500 0.8 30,917 0.8 30,309 0.8 31,425 0.9Closest address match 201,923 5.5 196,852 5.4 202,410 5.5 197,391 5.4 204,371 5.6Fuzzy street type match 431,175 11.8 427,080 11.7 440,254 12.1 421,217 11.5 439,905 12.0Phonetic match 194,215 5.3 189,210 5.2 195,242 5.3 191,660 5.2 196,307 5.4Place-based ZIP match 88,798 2.4 86,879 2.4 88,932 2.4 86,273 2.4 89,939 2.5Spelling corrected 1 0.0 2 0.0 0 0.0 0 0.0 2 0.0State centroid used 5,209 0.1 5,146 0.1 5,142 0.1 5,267 0.1 5,385 0.1Street end used 19,607 0.5 19,823 0.5 20,583 0.6 20,106 0.6 20,244 0.6ZIP centroid used 328,377 9.0 315,860 8.6 331,704 9.1 323,002 8.8 332,934 9.1Inaccurate direction 114,640 3.1 114,647 3.1 115,663 3.2 110,300 3.0 116,368 3.2
Failure Details Failed due to syntax error 29,145 0.8 29,162 0.8 29,224 0.8 28,976 0.8 29,132 0.8…Missing or invalid house number 19,430 0.5 19,417 0.5 19,656 0.5 19,516 0.5 19,570 0.5…Missing or invalid state name/abbr 2 0.0 0 0.0 0 0.0 1 0.0 0 0.0…Missing or invalid ZIP code 9,676 0.3 9,723 0.3 9,540 0.3 9,427 0.3 9,532 0.3…Incomplete or malformed address 37 0.0 22 0.0 28 0.0 32 0.0 30 0.0 Failed due to lookup error 156,480 4.3 195,717 5.4 90,822 2.5 172,618 4.7 97,141 2.7…Failed to open data member (eFOM) 156,056 4.3 195,331 5.3 90,397 2.5 172,184 4.7 96,743 2.6…No address data for state 424 0.0 386 0.0 425 0.0 434 0.0 398 0.0
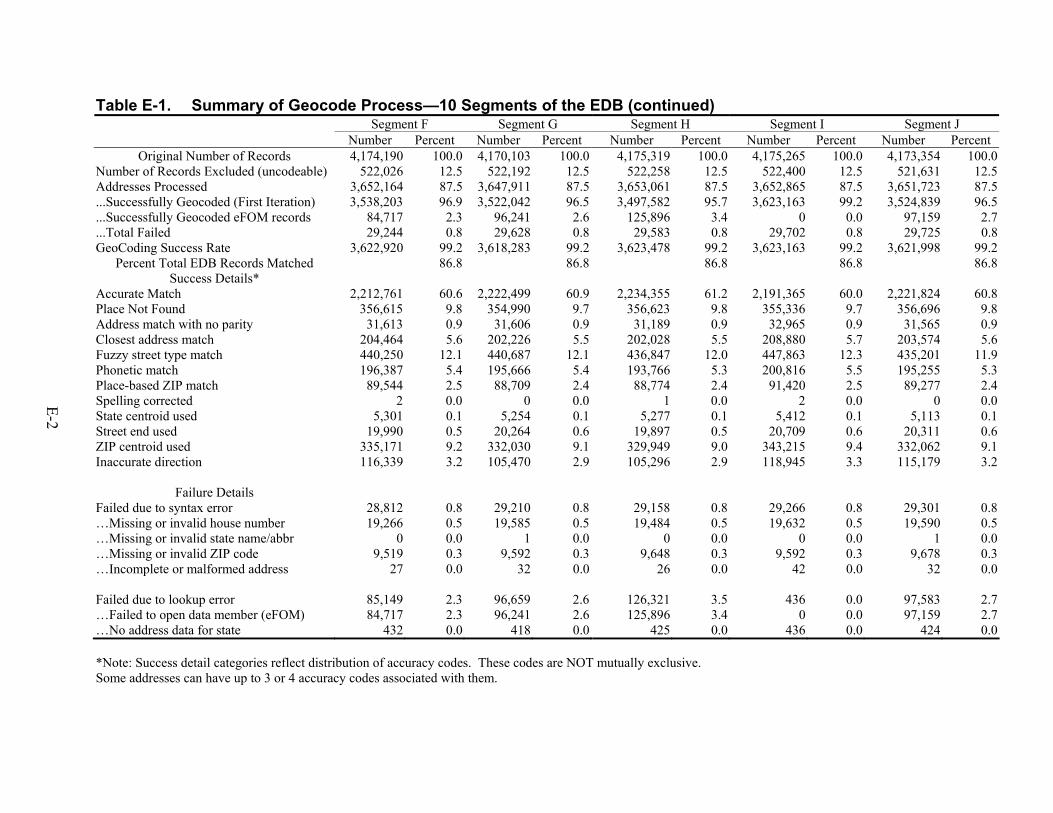
E-2
Table E-1. Summary of Geocode Process—10 Segments of the EDB (continued) Segment F Segment G Segment H Segment I Segment J
Number Percent Number Percent Number Percent Number Percent Number Percent Original Number of Records 4,174,190 100.0 4,170,103 100.0 4,175,319 100.0 4,175,265 100.0 4,173,354 100.0
Number of Records Excluded (uncodeable) 522,026 12.5 522,192 12.5 522,258 12.5 522,400 12.5 521,631 12.5 Addresses Processed 3,652,164 87.5 3,647,911 87.5 3,653,061 87.5 3,652,865 87.5 3,651,723 87.5 ...Successfully Geocoded (First Iteration) 3,538,203 96.9 3,522,042 96.5 3,497,582 95.7 3,623,163 99.2 3,524,839 96.5 ...Successfully Geocoded eFOM records 84,717 2.3 96,241 2.6 125,896 3.4 0 0.0 97,159 2.7 ...Total Failed 29,244 0.8 29,628 0.8 29,583 0.8 29,702 0.8 29,725 0.8 GeoCoding Success Rate 3,622,920 99.2 3,618,283 99.2 3,623,478 99.2 3,623,163 99.2 3,621,998 99.2
Percent Total EDB Records Matched 86.8 86.8 86.8 86.8 86.8 Success Details*
Accurate Match 2,212,761 60.6 2,222,499 60.9 2,234,355 61.2 2,191,365 60.0 2,221,824 60.8 Place Not Found 356,615 9.8 354,990 9.7 356,623 9.8 355,336 9.7 356,696 9.8 Address match with no parity 31,613 0.9 31,606 0.9 31,189 0.9 32,965 0.9 31,565 0.9 Closest address match 204,464 5.6 202,226 5.5 202,028 5.5 208,880 5.7 203,574 5.6 Fuzzy street type match 440,250 12.1 440,687 12.1 436,847 12.0 447,863 12.3 435,201 11.9 Phonetic match 196,387 5.4 195,666 5.4 193,766 5.3 200,816 5.5 195,255 5.3 Place-based ZIP match 89,544 2.5 88,709 2.4 88,774 2.4 91,420 2.5 89,277 2.4 Spelling corrected 2 0.0 0 0.0 1 0.0 2 0.0 0 0.0 State centroid used 5,301 0.1 5,254 0.1 5,277 0.1 5,412 0.1 5,113 0.1 Street end used 19,990 0.5 20,264 0.6 19,897 0.5 20,709 0.6 20,311 0.6 ZIP centroid used 335,171 9.2 332,030 9.1 329,949 9.0 343,215 9.4 332,062 9.1 Inaccurate direction 116,339 3.2 105,470 2.9 105,296 2.9 118,945 3.3 115,179 3.2
Failure Details Failed due to syntax error 28,812 0.8 29,210 0.8 29,158 0.8 29,266 0.8 29,301 0.8 …Missing or invalid house number 19,266 0.5 19,585 0.5 19,484 0.5 19,632 0.5 19,590 0.5 …Missing or invalid state name/abbr 0 0.0 1 0.0 0 0.0 0 0.0 1 0.0 …Missing or invalid ZIP code 9,519 0.3 9,592 0.3 9,648 0.3 9,592 0.3 9,678 0.3 …Incomplete or malformed address 27 0.0 32 0.0 26 0.0 42 0.0 32 0.0 Failed due to lookup error 85,149 2.3 96,659 2.6 126,321 3.5 436 0.0 97,583 2.7 …Failed to open data member (eFOM) 84,717 2.3 96,241 2.6 125,896 3.4 0 0.0 97,159 2.7 …No address data for state 432 0.0 418 0.0 425 0.0 436 0.0 424 0.0 *Note: Success detail categories reflect distribution of accuracy codes. These codes are NOT mutually exclusive. Some addresses can have up to 3 or 4 accuracy codes associated with them.

Appendix F List of Potential SES Variables Extracted from 2000 U.S. Census
and Values of the Categories Used for Percentages

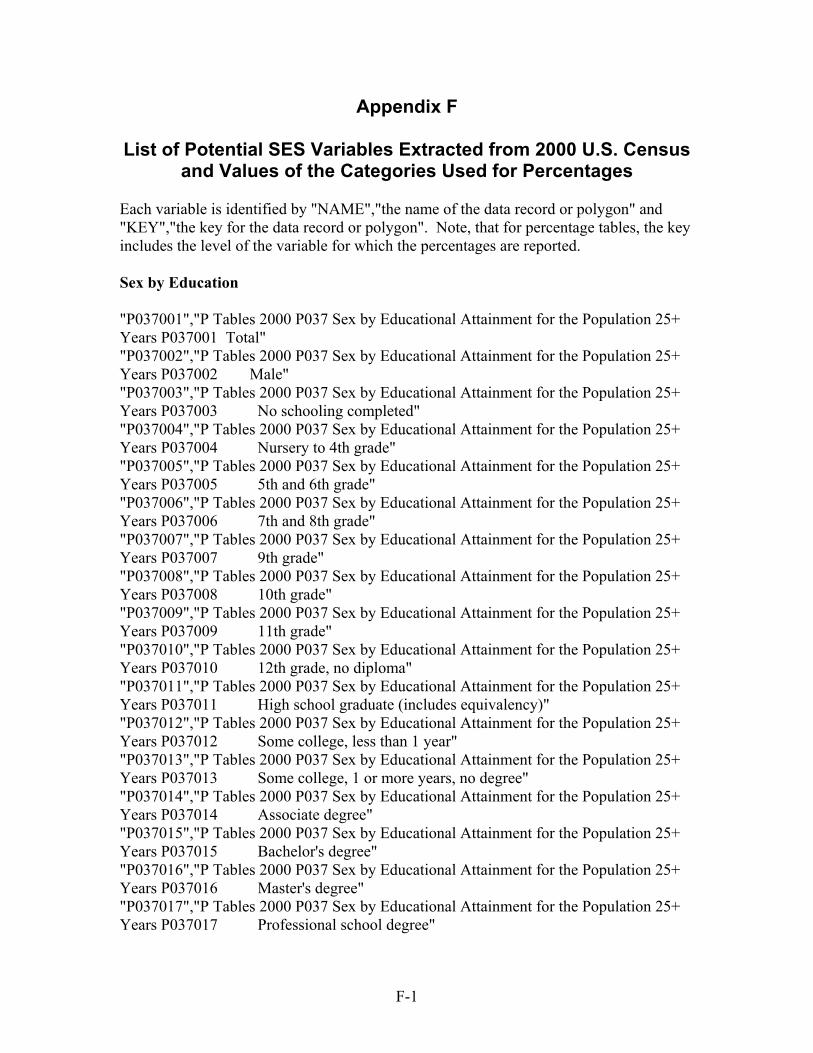
F-1
Appendix F
List of Potential SES Variables Extracted from 2000 U.S. Census and Values of the Categories Used for Percentages
Each variable is identified by "NAME","the name of the data record or polygon" and "KEY","the key for the data record or polygon". Note, that for percentage tables, the key includes the level of the variable for which the percentages are reported. Sex by Education "P037001","P Tables 2000 P037 Sex by Educational Attainment for the Population 25+ Years P037001 Total" "P037002","P Tables 2000 P037 Sex by Educational Attainment for the Population 25+ Years P037002 Male" "P037003","P Tables 2000 P037 Sex by Educational Attainment for the Population 25+ Years P037003 No schooling completed" "P037004","P Tables 2000 P037 Sex by Educational Attainment for the Population 25+ Years P037004 Nursery to 4th grade" "P037005","P Tables 2000 P037 Sex by Educational Attainment for the Population 25+ Years P037005 5th and 6th grade" "P037006","P Tables 2000 P037 Sex by Educational Attainment for the Population 25+ Years P037006 7th and 8th grade" "P037007","P Tables 2000 P037 Sex by Educational Attainment for the Population 25+ Years P037007 9th grade" "P037008","P Tables 2000 P037 Sex by Educational Attainment for the Population 25+ Years P037008 10th grade" "P037009","P Tables 2000 P037 Sex by Educational Attainment for the Population 25+ Years P037009 11th grade" "P037010","P Tables 2000 P037 Sex by Educational Attainment for the Population 25+ Years P037010 12th grade, no diploma" "P037011","P Tables 2000 P037 Sex by Educational Attainment for the Population 25+ Years P037011 High school graduate (includes equivalency)" "P037012","P Tables 2000 P037 Sex by Educational Attainment for the Population 25+ Years P037012 Some college, less than 1 year" "P037013","P Tables 2000 P037 Sex by Educational Attainment for the Population 25+ Years P037013 Some college, 1 or more years, no degree" "P037014","P Tables 2000 P037 Sex by Educational Attainment for the Population 25+ Years P037014 Associate degree" "P037015","P Tables 2000 P037 Sex by Educational Attainment for the Population 25+ Years P037015 Bachelor's degree" "P037016","P Tables 2000 P037 Sex by Educational Attainment for the Population 25+ Years P037016 Master's degree" "P037017","P Tables 2000 P037 Sex by Educational Attainment for the Population 25+ Years P037017 Professional school degree"
F-2
"P037018","P Tables 2000 P037 Sex by Educational Attainment for the Population 25+ Years P037018 Doctorate degree" "P037019","P Tables 2000 P037 Sex by Educational Attainment for the Population 25+ Years P037019 Female" "P037020","P Tables 2000 P037 Sex by Educational Attainment for the Population 25+ Years P037020 No schooling completed" "P037021","P Tables 2000 P037 Sex by Educational Attainment for the Population 25+ Years P037021 Nursery to 4th grade" "P037022","P Tables 2000 P037 Sex by Educational Attainment for the Population 25+ Years P037022 5th and 6th grade" "P037023","P Tables 2000 P037 Sex by Educational Attainment for the Population 25+ Years P037023 7th and 8th grade" "P037024","P Tables 2000 P037 Sex by Educational Attainment for the Population 25+ Years P037024 9th grade" "P037025","P Tables 2000 P037 Sex by Educational Attainment for the Population 25+ Years P037025 10th grade" "P037026","P Tables 2000 P037 Sex by Educational Attainment for the Population 25+ Years P037026 11th grade" "P037027","P Tables 2000 P037 Sex by Educational Attainment for the Population 25+ Years P037027 12th grade, no diploma" "P037028","P Tables 2000 P037 Sex by Educational Attainment for the Population 25+ Years P037028 High school graduate (includes equivalency)" "P037029","P Tables 2000 P037 Sex by Educational Attainment for the Population 25+ Years P037029 Some college, less than 1 year" "P037030","P Tables 2000 P037 Sex by Educational Attainment for the Population 25+ Years P037030 Some college, 1 or more years, no degree" "P037031","P Tables 2000 P037 Sex by Educational Attainment for the Population 25+ Years P037031 Associate degree" "P037032","P Tables 2000 P037 Sex by Educational Attainment for the Population 25+ Years P037032 Bachelor's degree" "P037033","P Tables 2000 P037 Sex by Educational Attainment for the Population 25+ Years P037033 Master's degree" "P037034","P Tables 2000 P037 Sex by Educational Attainment for the Population 25+ Years P037034 Professional school degree" "P037035","P Tables 2000 P037 Sex by Educational Attainment for the Population 25+ Years P037035 Doctorate degree" Sex by Employment Status "P043001","P Tables 2000 P043 Sex by Employment Status for the Population 16+ Years P043001 Total" "P043002","P Tables 2000 P043 Sex by Employment Status for the Population 16+ Years P043002 Male" "P043003","P Tables 2000 P043 Sex by Employment Status for the Population 16+ Years P043003 In labor force"
F-3
"P043004","P Tables 2000 P043 Sex by Employment Status for the Population 16+ Years P043004 In Armed Forces" "P043005","P Tables 2000 P043 Sex by Employment Status for the Population 16+ Years P043005 Civilian" "P043006","P Tables 2000 P043 Sex by Employment Status for the Population 16+ Years P043006 Employed" "P043007","P Tables 2000 P043 Sex by Employment Status for the Population 16+ Years P043007 Unemployed" "P043008","P Tables 2000 P043 Sex by Employment Status for the Population 16+ Years P043008 Not in labor force" "P043009","P Tables 2000 P043 Sex by Employment Status for the Population 16+ Years P043009 Female" "P043010","P Tables 2000 P043 Sex by Employment Status for the Population 16+ Years P043010 In labor force" "P043011","P Tables 2000 P043 Sex by Employment Status for the Population 16+ Years P043011 In Armed Forces" "P043012","P Tables 2000 P043 Sex by Employment Status for the Population 16+ Years P043012 Civilian" "P043013","P Tables 2000 P043 Sex by Employment Status for the Population 16+ Years P043013 Employed" "P043014","P Tables 2000 P043 Sex by Employment Status for the Population 16+ Years P043014 Unemployed" "P043015","P Tables 2000 P043 Sex by Employment Status for the Population 16+ Years P043015 Not in labor force" Sex by Industry for Civilian Employees "P049001","P Tables 2000 P049 Sex by Industry for the Employed Civilian Population 16+ Years P049001 Total" "P049002","P Tables 2000 P049 Sex by Industry for the Employed Civilian Population 16+ Years P049002 Male" "P049003","P Tables 2000 P049 Sex by Industry for the Employed Civilian Population 16+ Years P049003 Agriculture, forestry, fishing and hunting, and mining" "P049004","P Tables 2000 P049 Sex by Industry for the Employed Civilian Population 16+ Years P049004 Agriculture, forestry, fishing and hunting" "P049005","P Tables 2000 P049 Sex by Industry for the Employed Civilian Population 16+ Years P049005 Mining" "P049006","P Tables 2000 P049 Sex by Industry for the Employed Civilian Population 16+ Years P049006 Construction" "P049007","P Tables 2000 P049 Sex by Industry for the Employed Civilian Population 16+ Years P049007 Manufacturing" "P049008","P Tables 2000 P049 Sex by Industry for the Employed Civilian Population 16+ Years P049008 Wholesale trade" "P049009","P Tables 2000 P049 Sex by Industry for the Employed Civilian Population 16+ Years P049009 Retail trade"
F-4
"P049010","P Tables 2000 P049 Sex by Industry for the Employed Civilian Population 16+ Years P049010 Transportation and warehousing, and utilities" "P049011","P Tables 2000 P049 Sex by Industry for the Employed Civilian Population 16+ Years P049011 Transportation and warehousing" "P049012","P Tables 2000 P049 Sex by Industry for the Employed Civilian Population 16+ Years P049012 Utilities" "P049013","P Tables 2000 P049 Sex by Industry for the Employed Civilian Population 16+ Years P049013 Information" "P049014","P Tables 2000 P049 Sex by Industry for the Employed Civilian Population 16+ Years P049014 Finance, insurance, real estate and rental and leasing" "P049015","P Tables 2000 P049 Sex by Industry for the Employed Civilian Population 16+ Years P049015 Finance and insurance" "P049016","P Tables 2000 P049 Sex by Industry for the Employed Civilian Population 16+ Years P049016 Real estate and rental and leasing" "P049017","P Tables 2000 P049 Sex by Industry for the Employed Civilian Population 16+ Years P049017 Professional, scientific, management, administrative, and waste management services" "P049018","P Tables 2000 P049 Sex by Industry for the Employed Civilian Population 16+ Years P049018 Professional, scientific, and technical services" "P049019","P Tables 2000 P049 Sex by Industry for the Employed Civilian Population 16+ Years P049019 Management of companies and enterprises" "P049020","P Tables 2000 P049 Sex by Industry for the Employed Civilian Population 16+ Years P049020 Administrative and support and waste management services" "P049021","P Tables 2000 P049 Sex by Industry for the Employed Civilian Population 16+ Years P049021 Educational, health and social services" "P049022","P Tables 2000 P049 Sex by Industry for the Employed Civilian Population 16+ Years P049022 Educational services" "P049023","P Tables 2000 P049 Sex by Industry for the Employed Civilian Population 16+ Years P049023 Health care and social assistance" "P049024","P Tables 2000 P049 Sex by Industry for the Employed Civilian Population 16+ Years P049024 Arts, entertainment, recreation, accommodation and food services" "P049025","P Tables 2000 P049 Sex by Industry for the Employed Civilian Population 16+ Years P049025 Arts, entertainment, and recreation" "P049026","P Tables 2000 P049 Sex by Industry for the Employed Civilian Population 16+ Years P049026 Accommodation and food services" "P049027","P Tables 2000 P049 Sex by Industry for the Employed Civilian Population 16+ Years P049027 Other services (except public administration)" "P049028","P Tables 2000 P049 Sex by Industry for the Employed Civilian Population 16+ Years P049028 Public administration" "P049029","P Tables 2000 P049 Sex by Industry for the Employed Civilian Population 16+ Years P049029 Female" "P049030","P Tables 2000 P049 Sex by Industry for the Employed Civilian Population 16+ Years P049030 Agriculture, forestry, fishing and hunting, and mining" "P049031","P Tables 2000 P049 Sex by Industry for the Employed Civilian Population 16+ Years P049031 Agriculture, forestry, fishing and hunting"
F-5
"P049032","P Tables 2000 P049 Sex by Industry for the Employed Civilian Population 16+ Years P049032 Mining" "P049033","P Tables 2000 P049 Sex by Industry for the Employed Civilian Population 16+ Years P049033 Construction" "P049034","P Tables 2000 P049 Sex by Industry for the Employed Civilian Population 16+ Years P049034 Manufacturing" "P049035","P Tables 2000 P049 Sex by Industry for the Employed Civilian Population 16+ Years P049035 Wholesale trade" "P049036","P Tables 2000 P049 Sex by Industry for the Employed Civilian Population 16+ Years P049036 Retail trade" "P049037","P Tables 2000 P049 Sex by Industry for the Employed Civilian Population 16+ Years P049037 Transportation and warehousing, and utilities" "P049038","P Tables 2000 P049 Sex by Industry for the Employed Civilian Population 16+ Years P049038 Transportation and warehousing" "P049039","P Tables 2000 P049 Sex by Industry for the Employed Civilian Population 16+ Years P049039 Utilities" "P049040","P Tables 2000 P049 Sex by Industry for the Employed Civilian Population 16+ Years P049040 Information" "P049041","P Tables 2000 P049 Sex by Industry for the Employed Civilian Population 16+ Years P049041 Finance, insurance, real estate and rental and leasing" "P049042","P Tables 2000 P049 Sex by Industry for the Employed Civilian Population 16+ Years P049042 Finance and insurance" "P049043","P Tables 2000 P049 Sex by Industry for the Employed Civilian Population 16+ Years P049043 Real estate and rental and leasing" "P049044","P Tables 2000 P049 Sex by Industry for the Employed Civilian Population 16+ Years P049044 Professional, scientific, management, administrative, and waste management services" "P049045","P Tables 2000 P049 Sex by Industry for the Employed Civilian Population 16+ Years P049045 Professional, scientific, and technical services" "P049046","P Tables 2000 P049 Sex by Industry for the Employed Civilian Population 16+ Years P049046 Management of companies and enterprises" "P049047","P Tables 2000 P049 Sex by Industry for the Employed Civilian Population 16+ Years P049047 Administrative and support and waste management services" "P049048","P Tables 2000 P049 Sex by Industry for the Employed Civilian Population 16+ Years P049048 Educational, health and social services" "P049049","P Tables 2000 P049 Sex by Industry for the Employed Civilian Population 16+ Years P049049 Educational services" "P049050","P Tables 2000 P049 Sex by Industry for the Employed Civilian Population 16+ Years P049050 Health care and social assistance" "P049051","P Tables 2000 P049 Sex by Industry for the Employed Civilian Population 16+ Years P049051 Arts, entertainment, recreation, accommodation and food services" "P049052","P Tables 2000 P049 Sex by Industry for the Employed Civilian Population 16+ Years P049052 Arts, entertainment, and recreation" "P049053","P Tables 2000 P049 Sex by Industry for the Employed Civilian Population 16+ Years P049053 Accommodation and food services"
F-6
"P049054","P Tables 2000 P049 Sex by Industry for the Employed Civilian Population 16+ Years P049054 Other services (except public administration)" "P049055","P Tables 2000 P049 Sex by Industry for the Employed Civilian Population 16+ Years P049055 Public administration" Sex by Occupation "P050001","P Tables 2000 P050 Sex by Occupation for the Employed Civilian Population 16+ Years P050001 Total" "P050002","P Tables 2000 P050 Sex by Occupation for the Employed Civilian Population 16+ Years P050002 Male" "P050003","P Tables 2000 P050 Sex by Occupation for the Employed Civilian Population 16+ Years P050003 Management, professional, and related occupations" "P050004","P Tables 2000 P050 Sex by Occupation for the Employed Civilian Population 16+ Years P050004 Management, business, and financial operations occupations" "P050005","P Tables 2000 P050 Sex by Occupation for the Employed Civilian Population 16+ Years P050005 Management occupations, except farmers and farm managers" "P050006","P Tables 2000 P050 Sex by Occupation for the Employed Civilian Population 16+ Years P050006 Farmers and farm managers" "P050007","P Tables 2000 P050 Sex by Occupation for the Employed Civilian Population 16+ Years P050007 Business and financial operations occupations" "P050008","P Tables 2000 P050 Sex by Occupation for the Employed Civilian Population 16+ Years P050008 Business operations specialists" "P050009","P Tables 2000 P050 Sex by Occupation for the Employed Civilian Population 16+ Years P050009 Financial specialists" "P050010","P Tables 2000 P050 Sex by Occupation for the Employed Civilian Population 16+ Years P050010 Professional and related occupations" "P050011","P Tables 2000 P050 Sex by Occupation for the Employed Civilian Population 16+ Years P050011 Computer and mathematical occupations" "P050012","P Tables 2000 P050 Sex by Occupation for the Employed Civilian Population 16+ Years P050012 Architecture and engineering occupations" "P050013","P Tables 2000 P050 Sex by Occupation for the Employed Civilian Population 16+ Years P050013 Architects, surveyors, cartographers, and engineers" "P050014","P Tables 2000 P050 Sex by Occupation for the Employed Civilian Population 16+ Years P050014 Drafters, engineering, and mapping technicians" "P050015","P Tables 2000 P050 Sex by Occupation for the Employed Civilian Population 16+ Years P050015 Life, physical, and social science occupations" "P050016","P Tables 2000 P050 Sex by Occupation for the Employed Civilian Population 16+ Years P050016 Community and social services occupations" "P050017","P Tables 2000 P050 Sex by Occupation for the Employed Civilian Population 16+ Years P050017 Legal occupations" "P050018","P Tables 2000 P050 Sex by Occupation for the Employed Civilian Population 16+ Years P050018 Education, training, and library occupations"
F-7
"P050019","P Tables 2000 P050 Sex by Occupation for the Employed Civilian Population 16+ Years P050019 Arts, design, entertainment, sports, and media occupations" "P050020","P Tables 2000 P050 Sex by Occupation for the Employed Civilian Population 16+ Years P050020 Healthcare practitioners and technical occupations" "P050021","P Tables 2000 P050 Sex by Occupation for the Employed Civilian Population 16+ Years P050021 Health diagnosing and treating practitioners and technical occupations" "P050022","P Tables 2000 P050 Sex by Occupation for the Employed Civilian Population 16+ Years P050022 Health technologists and technicians" "P050023","P Tables 2000 P050 Sex by Occupation for the Employed Civilian Population 16+ Years P050023 Service occupations" "P050024","P Tables 2000 P050 Sex by Occupation for the Employed Civilian Population 16+ Years P050024 Healthcare support occupations" "P050025","P Tables 2000 P050 Sex by Occupation for the Employed Civilian Population 16+ Years P050025 Protective service occupations" "P050026","P Tables 2000 P050 Sex by Occupation for the Employed Civilian Population 16+ Years P050026 Fire fighting, prevention, and law enforcement workers, including supervisors" "P050027","P Tables 2000 P050 Sex by Occupation for the Employed Civilian Population 16+ Years P050027 Other protective service workers, including supervisors" "P050028","P Tables 2000 P050 Sex by Occupation for the Employed Civilian Population 16+ Years P050028 Food preparation and serving related occupations" "P050029","P Tables 2000 P050 Sex by Occupation for the Employed Civilian Population 16+ Years P050029 Building and grounds cleaning and maintenance occupations" "P050030","P Tables 2000 P050 Sex by Occupation for the Employed Civilian Population 16+ Years P050030 Personal care and service occupations" "P050031","P Tables 2000 P050 Sex by Occupation for the Employed Civilian Population 16+ Years P050031 Sales and office occupations" "P050032","P Tables 2000 P050 Sex by Occupation for the Employed Civilian Population 16+ Years P050032 Sales and related occupations" "P050033","P Tables 2000 P050 Sex by Occupation for the Employed Civilian Population 16+ Years P050033 Office and administrative support occupations" "P050034","P Tables 2000 P050 Sex by Occupation for the Employed Civilian Population 16+ Years P050034 Farming, fishing, and forestry occupations" "P050035","P Tables 2000 P050 Sex by Occupation for the Employed Civilian Population 16+ Years P050035 Construction, extraction, and maintenance occupations" "P050036","P Tables 2000 P050 Sex by Occupation for the Employed Civilian Population 16+ Years P050036 Construction and extraction occupations" "P050037","P Tables 2000 P050 Sex by Occupation for the Employed Civilian Population 16+ Years P050037 Supervisors, construction and extraction workers"
F-8
"P050038","P Tables 2000 P050 Sex by Occupation for the Employed Civilian Population 16+ Years P050038 Construction trades workers" "P050039","P Tables 2000 P050 Sex by Occupation for the Employed Civilian Population 16+ Years P050039 Extraction workers" "P050040","P Tables 2000 P050 Sex by Occupation for the Employed Civilian Population 16+ Years P050040 Installation, maintenance, and repair occupations" "P050041","P Tables 2000 P050 Sex by Occupation for the Employed Civilian Population 16+ Years P050041 Production, transportation, and material moving occupations" "P050042","P Tables 2000 P050 Sex by Occupation for the Employed Civilian Population 16+ Years P050042 Production occupations" "P050043","P Tables 2000 P050 Sex by Occupation for the Employed Civilian Population 16+ Years P050043 Transportation and material moving occupations" "P050044","P Tables 2000 P050 Sex by Occupation for the Employed Civilian Population 16+ Years P050044 Supervisors, transportation and material moving workers" "P050045","P Tables 2000 P050 Sex by Occupation for the Employed Civilian Population 16+ Years P050045 Aircraft and traffic control occupations" "P050046","P Tables 2000 P050 Sex by Occupation for the Employed Civilian Population 16+ Years P050046 Motor vehicle operators" "P050047","P Tables 2000 P050 Sex by Occupation for the Employed Civilian Population 16+ Years P050047 Rail, water and other transportation occupations" "P050048","P Tables 2000 P050 Sex by Occupation for the Employed Civilian Population 16+ Years P050048 Material moving workers" "P050049","P Tables 2000 P050 Sex by Occupation for the Employed Civilian Population 16+ Years P050049 Female" "P050050","P Tables 2000 P050 Sex by Occupation for the Employed Civilian Population 16+ Years P050050 Management, professional, and related occupations" "P050051","P Tables 2000 P050 Sex by Occupation for the Employed Civilian Population 16+ Years P050051 Management, business, and financial operations occupations" "P050052","P Tables 2000 P050 Sex by Occupation for the Employed Civilian Population 16+ Years P050052 Management occupations, except farmers and farm managers" "P050053","P Tables 2000 P050 Sex by Occupation for the Employed Civilian Population 16+ Years P050053 Farmers and farm managers" "P050054","P Tables 2000 P050 Sex by Occupation for the Employed Civilian Population 16+ Years P050054 Business and financial operations occupations" "P050055","P Tables 2000 P050 Sex by Occupation for the Employed Civilian Population 16+ Years P050055 Business operations specialists" "P050056","P Tables 2000 P050 Sex by Occupation for the Employed Civilian Population 16+ Years P050056 Financial specialists" "P050057","P Tables 2000 P050 Sex by Occupation for the Employed Civilian Population 16+ Years P050057 Professional and related occupations" "P050058","P Tables 2000 P050 Sex by Occupation for the Employed Civilian Population 16+ Years P050058 Computer and mathematical occupations"
F-9
"P050059","P Tables 2000 P050 Sex by Occupation for the Employed Civilian Population 16+ Years P050059 Architecture and engineering occupations" "P050060","P Tables 2000 P050 Sex by Occupation for the Employed Civilian Population 16+ Years P050060 Architects, surveyors, cartographers, and engineers" "P050061","P Tables 2000 P050 Sex by Occupation for the Employed Civilian Population 16+ Years P050061 Drafters, engineering, and mapping technicians" "P050062","P Tables 2000 P050 Sex by Occupation for the Employed Civilian Population 16+ Years P050062 Life, physical, and social science occupations" "P050063","P Tables 2000 P050 Sex by Occupation for the Employed Civilian Population 16+ Years P050063 Community and social services occupations" "P050064","P Tables 2000 P050 Sex by Occupation for the Employed Civilian Population 16+ Years P050064 Legal occupations" "P050065","P Tables 2000 P050 Sex by Occupation for the Employed Civilian Population 16+ Years P050065 Education, training, and library occupations" "P050066","P Tables 2000 P050 Sex by Occupation for the Employed Civilian Population 16+ Years P050066 Arts, design, entertainment, sports, and media occupations" "P050067","P Tables 2000 P050 Sex by Occupation for the Employed Civilian Population 16+ Years P050067 Healthcare practitioners and technical occupations" "P050068","P Tables 2000 P050 Sex by Occupation for the Employed Civilian Population 16+ Years P050068 Health diagnosing and treating practitioners and technical occupations" "P050069","P Tables 2000 P050 Sex by Occupation for the Employed Civilian Population 16+ Years P050069 Health technologists and technicians" "P050070","P Tables 2000 P050 Sex by Occupation for the Employed Civilian Population 16+ Years P050070 Service occupations" "P050071","P Tables 2000 P050 Sex by Occupation for the Employed Civilian Population 16+ Years P050071 Healthcare support occupations" "P050072","P Tables 2000 P050 Sex by Occupation for the Employed Civilian Population 16+ Years P050072 Protective service occupations" "P050073","P Tables 2000 P050 Sex by Occupation for the Employed Civilian Population 16+ Years P050073 Fire fighting, prevention, and law enforcement workers, including supervisors" "P050074","P Tables 2000 P050 Sex by Occupation for the Employed Civilian Population 16+ Years P050074 Other protective service workers, including supervisors" "P050075","P Tables 2000 P050 Sex by Occupation for the Employed Civilian Population 16+ Years P050075 Food preparation and serving related occupations" "P050076","P Tables 2000 P050 Sex by Occupation for the Employed Civilian Population 16+ Years P050076 Building and grounds cleaning and maintenance occupations" "P050077","P Tables 2000 P050 Sex by Occupation for the Employed Civilian Population 16+ Years P050077 Personal care and service occupations"
F-10
"P050078","P Tables 2000 P050 Sex by Occupation for the Employed Civilian Population 16+ Years P050078 Sales and office occupations" "P050079","P Tables 2000 P050 Sex by Occupation for the Employed Civilian Population 16+ Years P050079 Sales and related occupations" "P050080","P Tables 2000 P050 Sex by Occupation for the Employed Civilian Population 16+ Years P050080 Office and administrative support occupations" "P050081","P Tables 2000 P050 Sex by Occupation for the Employed Civilian Population 16+ Years P050081 Farming, fishing, and forestry occupations" "P050082","P Tables 2000 P050 Sex by Occupation for the Employed Civilian Population 16+ Years P050082 Construction, extraction, and maintenance occupations" "P050083","P Tables 2000 P050 Sex by Occupation for the Employed Civilian Population 16+ Years P050083 Construction and extraction occupations" "P050084","P Tables 2000 P050 Sex by Occupation for the Employed Civilian Population 16+ Years P050084 Supervisors, construction and extraction workers" "P050085","P Tables 2000 P050 Sex by Occupation for the Employed Civilian Population 16+ Years P050085 Construction trades workers" "P050086","P Tables 2000 P050 Sex by Occupation for the Employed Civilian Population 16+ Years P050086 Extraction workers" "P050087","P Tables 2000 P050 Sex by Occupation for the Employed Civilian Population 16+ Years P050087 Installation, maintenance, and repair occupations" "P050088","P Tables 2000 P050 Sex by Occupation for the Employed Civilian Population 16+ Years P050088 Production, transportation, and material moving occupations" "P050089","P Tables 2000 P050 Sex by Occupation for the Employed Civilian Population 16+ Years P050089 Production occupations" "P050090","P Tables 2000 P050 Sex by Occupation for the Employed Civilian Population 16+ Years P050090 Transportation and material moving occupations" "P050091","P Tables 2000 P050 Sex by Occupation for the Employed Civilian Population 16+ Years P050091 Supervisors, transportation and material moving workers" "P050092","P Tables 2000 P050 Sex by Occupation for the Employed Civilian Population 16+ Years P050092 Aircraft and traffic control occupations" "P050093","P Tables 2000 P050 Sex by Occupation for the Employed Civilian Population 16+ Years P050093 Motor vehicle operators" "P050094","P Tables 2000 P050 Sex by Occupation for the Employed Civilian Population 16+ Years P050094 Rail, water and other transportation occupations" "P050095","P Tables 2000 P050 Sex by Occupation for the Employed Civilian Population 16+ Years P050095 Material moving workers" Household Income "P052001","P Tables 2000 P052 Household Income in 1999 P052001 Total" "P052002","P Tables 2000 P052 Household Income in 1999 P052002 Less than $10,000"
F-11
"P052003","P Tables 2000 P052 Household Income in 1999 P052003 $10,000 to $14,999" "P052004","P Tables 2000 P052 Household Income in 1999 P052004 $15,000 to $19,999" "P052005","P Tables 2000 P052 Household Income in 1999 P052005 $20,000 to $24,999" "P052006","P Tables 2000 P052 Household Income in 1999 P052006 $25,000 to $29,999" "P052007","P Tables 2000 P052 Household Income in 1999 P052007 $30,000 to $34,999" "P052008","P Tables 2000 P052 Household Income in 1999 P052008 $35,000 to $39,999" "P052009","P Tables 2000 P052 Household Income in 1999 P052009 $40,000 to $44,999" "P052010","P Tables 2000 P052 Household Income in 1999 P052010 $45,000 to $49,999" "P052011","P Tables 2000 P052 Household Income in 1999 P052011 $50,000 to $59,999" "P052012","P Tables 2000 P052 Household Income in 1999 P052012 $60,000 to $74,999" "P052013","P Tables 2000 P052 Household Income in 1999 P052013 $75,000 to $99,999" "P052014","P Tables 2000 P052 Household Income in 1999 P052014 $100,000 to $124,999" "P052015","P Tables 2000 P052 Household Income in 1999 P052015 $125,000 to $149,999" "P052016","P Tables 2000 P052 Household Income in 1999 P052016 $150,000 to $199,999" "P052017","P Tables 2000 P052 Household Income in 1999 P052017 $200,000 or more" "P053001","P Tables 2000 P053 Median Household Income in 1999 (Dollars) P053001 Median household income in 1999" Family Income "P076001","P Tables 2000 P076 Family Income in 1999 P076001 Total" "P076002","P Tables 2000 P076 Family Income in 1999 P076002 Less than $10,000" "P076003","P Tables 2000 P076 Family Income in 1999 P076003 $10,000 to $14,999" "P076004","P Tables 2000 P076 Family Income in 1999 P076004 $15,000 to $19,999" "P076005","P Tables 2000 P076 Family Income in 1999 P076005 $20,000 to $24,999" "P076006","P Tables 2000 P076 Family Income in 1999 P076006 $25,000 to $29,999"
F-12
"P076007","P Tables 2000 P076 Family Income in 1999 P076007 $30,000 to $34,999" "P076008","P Tables 2000 P076 Family Income in 1999 P076008 $35,000 to $39,999" "P076009","P Tables 2000 P076 Family Income in 1999 P076009 $40,000 to $44,999" "P076010","P Tables 2000 P076 Family Income in 1999 P076010 $45,000 to $49,999" "P076011","P Tables 2000 P076 Family Income in 1999 P076011 $50,000 to $59,999" "P076012","P Tables 2000 P076 Family Income in 1999 P076012 $60,000 to $74,999" "P076013","P Tables 2000 P076 Family Income in 1999 P076013 $75,000 to $99,999" "P076014","P Tables 2000 P076 Family Income in 1999 P076014 $100,000 to $124,999" "P076015","P Tables 2000 P076 Family Income in 1999 P076015 $125,000 to $149,999" "P076016","P Tables 2000 P076 Family Income in 1999 P076016 $150,000 to $199,999" "P076017","P Tables 2000 P076 Family Income in 1999 P076017 $200,000 or more" "P077001","P Tables 2000 P077 Median Family Income in 1999 (Dollars) P077001 Median family income in 1999" Per Capita Income "P082001","P Tables 2000 P082 Per Capita Income in 1999 (Dollars) P082001 Per capita income in 1999" Poverty Status by Age "P087001","P Tables 2000 P087 Poverty Status in 1999 by Age P087001 Total" "P087002","P Tables 2000 P087 Poverty Status in 1999 by Age P087002 Income in 1999 below poverty level" "P087010","P Tables 2000 P087 Poverty Status in 1999 by Age P087010 Income in 1999 at or above poverty level" Ratio of Income to Poverty Level "P088001","P Tables 2000 P088 Ratio of Income in 1999 to Poverty Level P088001 Total" "P088002","P Tables 2000 P088 Ratio of Income in 1999 to Poverty Level P088002 Under .50" "P088003","P Tables 2000 P088 Ratio of Income in 1999 to Poverty Level P088003 50 to .74"
F-13
"P088004","P Tables 2000 P088 Ratio of Income in 1999 to Poverty Level P088004 75 to .99" "P088005","P Tables 2000 P088 Ratio of Income in 1999 to Poverty Level P088005 1.00 to 1.24" "P088006","P Tables 2000 P088 Ratio of Income in 1999 to Poverty Level P088006 1.25 to 1.49" "P088007","P Tables 2000 P088 Ratio of Income in 1999 to Poverty Level P088007 1.50 to 1.74" "P088008","P Tables 2000 P088 Ratio of Income in 1999 to Poverty Level P088008 1.75 to 1.84" "P088009","P Tables 2000 P088 Ratio of Income in 1999 to Poverty Level P088009 1.85 to 1.99" "P088010","P Tables 2000 P088 Ratio of Income in 1999 to Poverty Level P088010 2.00 and over" Median Rent "H060001","H Tables 2000 H060 Median Rent Asked (Dollars) H060001 Median rent asked" Median Home Value "H085001","H Tables 2000 H085 Median Value (Dollars) for All Owner-Occupied Housing Units H085001 Median value" Median Income by Race "P152B001","P Tables 2000 P152B Median Household Income in 1999 (Dollars) (Black Alone Householder) P152B001 Median household income in 1999" "P152C001","P Tables 2000 P152C Median Household Income in 1999 (Dollars) (AIAN Alone Householder) P152C001 Median household income in 1999" "P152D001","P Tables 2000 P152D Median Household Income in 1999 (Dollars) (Asian Alone Householder) P152D001 Median household income in 1999" "P152E001","P Tables 2000 P152E Median Household Income in 1999 (Dollars) (NHPI Alone Householder) P152E001 Median household income in 1999" "P152F001","P Tables 2000 P152F Median Household Income in 1999 (Dollars) (Some Other Race Alone Householder) P152F001 Median household income in 1999" "P152G001","P Tables 2000 P152G Median Household Income in 1999 (Dollars) (Two or More Races Householder) P152G001 Median household income in 1999" "P152H001","P Tables 2000 P152H Median Household Income in 1999 (Dollars) (Hispanic Householder) P152H001 Median household income in 1999" "P152I001","P Tables 2000 P152I Median Household Income in 1999 (Dollars) (White Alone, Not Hispanic Householder) P152I001 Median household income in 1999"
F-14
Median Income by Age "P055002","P Tables 2000 P055 Age of Householder by Household Income in 1999 P055002 Householder under 25 years" "P055019","P Tables 2000 P055 Age of Householder by Household Income in 1999 P055019 Householder 25 to 34 years" "P055036","P Tables 2000 P055 Age of Householder by Household Income in 1999 P055036 Householder 35 to 44 years" "P055053","P Tables 2000 P055 Age of Householder by Household Income in 1999 P055053 Householder 45 to 54 years" "P055070","P Tables 2000 P055 Age of Householder by Household Income in 1999 P055070 Householder 55 to 64 years" "P055087","P Tables 2000 P055 Age of Householder by Household Income in 1999 P055087 Householder 65 to 74 years" "P055104","P Tables 2000 P055 Age of Householder by Household Income in 1999 P055104 Householder 75 years and over" Number Below the Poverty Level by Race and Age Group "P159B007","P Tables 2000 P159B Poverty Status in 1999 by Age (Black Alone) P159B007 18 to 64 years" "P159B008","P Tables 2000 P159B Poverty Status in 1999 by Age (Black Alone) P159B008 65 to 74 years" "P159B009","P Tables 2000 P159B Poverty Status in 1999 by Age (Black Alone) P159B009 75 years and over" "P159C007","P Tables 2000 P159C Poverty Status in 1999 by Age (AIAN Alone) P159C007 18 to 64 years" "P159C008","P Tables 2000 P159C Poverty Status in 1999 by Age (AIAN Alone) P159C008 65 to 74 years" "P159C009","P Tables 2000 P159C Poverty Status in 1999 by Age (AIAN Alone) P159C009 75 years and over" "P159D007","P Tables 2000 P159D Poverty Status in 1999 by Age (Asian Alone) P159D007 18 to 64 years" "P159D008","P Tables 2000 P159D Poverty Status in 1999 by Age (Asian Alone) P159D008 65 to 74 years" "P159D009","P Tables 2000 P159D Poverty Status in 1999 by Age (Asian Alone) P159D009 75 years and over" "P159E007","P Tables 2000 P159E Poverty Status in 1999 by Age (NHPI Alone) P159E007 18 to 64 years" "P159E008","P Tables 2000 P159E Poverty Status in 1999 by Age (NHPI Alone) P159E008 65 to 74 years" "P159E009","P Tables 2000 P159E Poverty Status in 1999 by Age (NHPI Alone) P159E009 75 years and over" "P159F007","P Tables 2000 P159F Poverty Status in 1999 by Age (Some Other Race Alone) P159F007 18 to 64 years"
F-15
"P159F008","P Tables 2000 P159F Poverty Status in 1999 by Age (Some Other Race Alone) P159F008 65 to 74 years" "P159F009","P Tables 2000 P159F Poverty Status in 1999 by Age (Some Other Race Alone) P159F009 75 years and over" "P159G007","P Tables 2000 P159G Poverty Status in 1999 by Age (Two or More Races) P159G007 18 to 64 years" "P159G008","P Tables 2000 P159G Poverty Status in 1999 by Age (Two or More Races) P159G008 65 to 74 years" "P159G009","P Tables 2000 P159G Poverty Status in 1999 by Age (Two or More Races) P159G009 75 years and over" "P159H007","P Tables 2000 P159H Poverty Status in 1999 by Age (Hispanic) P159H007 18 to 64 years" "P159H008","P Tables 2000 P159H Poverty Status in 1999 by Age (Hispanic) P159H008 65 to 74 years" "P159H009","P Tables 2000 P159H Poverty Status in 1999 by Age (Hispanic) P159H009 75 years and over" "P159I007","P Tables 2000 P159I Poverty Status in 1999 by Age (White Alone, Not Hispanic) P159I007 18 to 64 years" "P159I008","P Tables 2000 P159I Poverty Status in 1999 by Age (White Alone, Not Hispanic) P159I008 65 to 74 years" "P159I009","P Tables 2000 P159I Poverty Status in 1999 by Age (White Alone, Not Hispanic) P159I009 75 years and over" Number At or Above the Poverty Level by Race and Age Group "P159B015","P Tables 2000 P159B Poverty Status in 1999 by Age (Black Alone) P159B015 18 to 64 years" "P159B016","P Tables 2000 P159B Poverty Status in 1999 by Age (Black Alone) P159B016 65 to 74 years" "P159B017","P Tables 2000 P159B Poverty Status in 1999 by Age (Black Alone) P159B017 75 years and over" "P159C015","P Tables 2000 P159C Poverty Status in 1999 by Age (AIAN Alone) P159C015 18 to 64 years" "P159C016","P Tables 2000 P159C Poverty Status in 1999 by Age (AIAN Alone) P159C016 65 to 74 years" "P159C017","P Tables 2000 P159C Poverty Status in 1999 by Age (AIAN Alone) P159C017 75 years and over" "P159D015","P Tables 2000 P159D Poverty Status in 1999 by Age (Asian Alone) P159D015 18 to 64 years" "P159D016","P Tables 2000 P159D Poverty Status in 1999 by Age (Asian Alone) P159D016 65 to 74 years" "P159D017","P Tables 2000 P159D Poverty Status in 1999 by Age (Asian Alone) P159D017 75 years and over" "P159E015","P Tables 2000 P159E Poverty Status in 1999 by Age (NHPI Alone) P159E015 18 to 64 years"
F-16
"P159E016","P Tables 2000 P159E Poverty Status in 1999 by Age (NHPI Alone) P159E016 65 to 74 years" "P159E017","P Tables 2000 P159E Poverty Status in 1999 by Age (NHPI Alone) P159E017 75 years and over" "P159F015","P Tables 2000 P159F Poverty Status in 1999 by Age (Some Other Race Alone) P159F015 18 to 64 years" "P159F016","P Tables 2000 P159F Poverty Status in 1999 by Age (Some Other Race Alone) P159F016 65 to 74 years" "P159F017","P Tables 2000 P159F Poverty Status in 1999 by Age (Some Other Race Alone) P159F017 75 years and over" "P159G015","P Tables 2000 P159G Poverty Status in 1999 by Age (Two or More Races) P159G015 18 to 64 years" "P159G016","P Tables 2000 P159G Poverty Status in 1999 by Age (Two or More Races) P159G016 65 to 74 years" "P159G017","P Tables 2000 P159G Poverty Status in 1999 by Age (Two or More Races) P159G017 75 years and over" "P159H015","P Tables 2000 P159H Poverty Status in 1999 by Age (Hispanic) P159H015 18 to 64 years" "P159H016","P Tables 2000 P159H Poverty Status in 1999 by Age (Hispanic) P159H016 65 to 74 years" "P159H017","P Tables 2000 P159H Poverty Status in 1999 by Age (Hispanic) P159H017 75 years and over" "P159I015","P Tables 2000 P159I Poverty Status in 1999 by Age (White Alone, Not Hispanic) P159I015 18 to 64 years" "P159I016","P Tables 2000 P159I Poverty Status in 1999 by Age (White Alone, Not Hispanic) P159I016 65 to 74 years" "P159I017","P Tables 2000 P159I Poverty Status in 1999 by Age (White Alone, Not Hispanic) P159I017 75 years and over" Proportion Below Poverty Level by Race and Age Group (Calculated from Census Number at or above and Number Below Poverty Level by Race and Age Group). “pctpov18_64Black”, “Percent below the poverty level 18-64, Black Alone” “pctpov65_75Black” , “Percent below the poverty level 65-74, Black Alone” “pctpovover75Black” , “Percent below the poverty level over 75, Black Alone” “pctpov18_64AIAN” , “Percent below the poverty level 18-64, AIAN Alone” “pctpov65_75AIAN” , “Percent below the poverty level 65-74, AIAN Alone” “pctpovover75AIAN” , “Percent below the poverty level over 75, AIAN Alone” “pctpov18_64Asian” , “Percent below the poverty level 18-64, Asian Alone” “pctpov65_75Asian” , “Percent below the poverty level 65-74, Asian Alone” “pctpovover75Asian” , “Percent below the poverty level over 75, Asian Alone” “pctpov18_64NHPI” , “Percent below the poverty level 18-64, NHPI Alone” “pctpov65_75NHPI” , “Percent below the poverty level 65-74, NHPI Alone” “pctpovover75NHPI” , “Percent below the poverty level over 75, NHPI Alone” “pctpov18_64Other” , “Percent below the poverty level 18-64, Some Other Race Alone” “pctpov65_75Other” , “Percent below the poverty level 65-74, Some Other Race Alone”
F-17
“pctpovover75Other” , “Percent below the poverty level over 75, Some Other Race Alone” “pctpov18_64more2” , “Percent below the poverty level 18-64, Two or More Races” “pctpov65_75more2” , “Percent below the poverty level 65-74, Two or More Races” “pctpovover75more2” , “Percent below the poverty level over 75, Two or More Races” “pctpov18_64Hispanic” , “Percent below the poverty level 18-64, Hispanic” “pctpov65_75Hispanic” , “Percent below the poverty level 65-74, Hispanic” “pctpovover75Hispanic” , “Percent below the poverty level over 75, Hispanic” “pctpov18_64White” , “Percent below the poverty level 18-64, White Alone, Not Hispanic” “pctpov65_75White” , “Percent below the poverty level 65-74, White Alone, Not Hispanic” “pctpovover75White” , “Percent below the poverty level over 75, White Alone, Not Hispanic”