Embed Size (px)
Citation preview

Health enhancing traditional foods in Brazil: an interdisciplinary approach to food and nutritional security
Thesis presented in fulfillment of requirement for the degree of Doctor of Philosophy in Natural Sciences (Dr. rer. nat.)
Faculty of Natural Sciences
University of Hohenheim
Institute for Biological Chemistry and Nutrition
Chair of Nutritional Biochemistry
Prof. Dr. rer. nat. Lutz Graeve
Presented by
Fernanda Dias Bartolomeu Abadio Finco
From Rio de Janeiro, Brazil.
2012

Health enhancing traditional foods in Brazil: an interdisciplinary approach to food and nutritional security
Dissertation zur Erlangung des Doktorgrades der Naturwissenschaften (Dr. rer. nat.)
Fakultät Naturwissenschaften
Universität Hohenheim
Institut für Biologische Chemie und Ernährungswissenschaft
Lehrstuhl Biochemie der Ernährung
Prof. Dr. rer. nat. Lutz Graeve
vorgelegt von
Fernanda Dias Bartolomeu Abadio Finco
aus Rio de Janeiro, Brazil.
2012

Dean of Faculty: Prof. Dr. rer. nat. Heinz Breer
1. Supervisor: Prof. Dr. rer. nat. Lutz Graeve
2. Co-supervisor: Prof. Dr. med. Hans Konrad Biesalski
3. Examiner: Prof. Dr. Anne Camilla Bellows (Ph.D.)
Date of oral examination: November 5th, 2012.

“Imagination is more important than knowledge. Knowledge is limited. Imagination encircles the world”.
Albert Einstein
(1879 - 1955)

I dedicate this work
To the love of my life,
My husband Marcus
and
My dad Pedro Abadio (in memorium).

Acknowledgments
To Prof. Lutz Graeve for his friendly and competent supervision, for the great
opportunity to develop my own ideas during my PhD project which, surely enhanced
and boosted my professional skills. For always supporting me on all initiatives, ideas,
experiments etc. and for his ever open mind and ears. Also for the pleasant lab
meetings, the great talks, and for the great humanistic and exemplary conducting of
the academic work and “Arbeitsgruppe”, I extend my gratitude.
To Prof. Biesalski for accepting to be my second supervisor and for keeping the
Institute of Biological Chemistry at University of Hohenheim’s doors permanently
open to foreign talents.
To Prof. Anne Bellows for being my third examiner, for the support during grant
applications.
To Eiselen Foundation, Ulm; International Foundation for the Promotion of Nutrition
Research and Nutrition Education (Internationale Stiftung für Ernährungsforschung
und Ernährungsaufklärung) Switzerland. and to the
Landesgraduiertenförderungsgesetz (LGFG) for the financial support.
To the Institute of Plant Foodstuff Technology (150d) on the persons of Prof. Dr.
Carle and Dr. Kammerer for the valuable and professional assistance with the
chromatographic analysis.
To the Institute of Nutritional medicine (180) for the access to the FACS facilities.
To the students Larissa Borges, Juliane Guimarães, Sabrina Böser, Wen-Hsin
Tseng, Anne Volkert, Lorraine Kloss for their participation and contribution to this
work.

To Dagmar Mvondo, Monika Schumacher and Suzana Cvek for their technical
assistance.
To all staff from Institute 140 and all working groups, which were very supportive and
open during my project performance and stay at Hohenheim.
To Instituto Sócio Ambiental Missão Verde, on the persons of Mr. William and Mr.
Deusimar for the help with the field study.
To the two rural communities and all participants of the field study, for opening their
houses and lives to science and to share the amazing rural world with me.
To all friends I met in German, for the moments of happiness and sadness, for the
conversations and for introducing me to the German culture.
And to my friends in Brazil, for the virtual laughs and supportive talks, keeping my
Brazilian soul warm and alive.
To my family in Brazil, for the love and support.
And last, but not least, to my husband Marcus, for his everlasting love and for his
support during the entire time we spent in Germany.

i
Preliminary remarks: Origin and Development of the work: The current work is the result of the original research project entitled: Community
Based Nutrition Strategies: Assessing Savannah fruits as a health promotion strategy
in Tocantins, Brazil. The project was authored and coordinated by Fernanda Abadio
Finco under the supervision of Prof. Dr. Graeve as first Brazilian-German cooperation
initiative between the Food and Nutrition Security lab of the Federal University of
Tocantins, Brazil and the Institute of Biological chemistry and Nutrition of the
University of Hohenheim, Germany.
The idea was conceived based on the preliminary experience of the Mrs. Abadio
Finco in Food and Nutrition Security topics in Brazil, especially in the Tocantins State,
which belongs to the Legal Amazon Area. The previous activity in the food and
nutritional security discussions combined with the holistic profile of the author lead
the research to an interdisciplinary approach. Therefore, the first part of the work
comprises fieldwork with rural communities in Tocantins State and was financially
supported by Eiselen Foundation, Ulm, Germany. The second part covered the
biofunctional properties of the Brazilian fruit bacaba (Oenocarpus Bacaba) and had
the financial support of the International Foundation for the Promotion of Nutrition
Research and Nutrition Education (Internationale Stiftung für Ernährungsforschung
und Ernährungsaufklärung) Switzerland.

ii
The present work has in part been published or presented as follows:
Accepted full papers:
1. Abadio Finco, F.D.B.; Böser, S.; Graeve, L. Antiproliferative activity of bacaba
(Oenocarpus bacaba) and jenipapo (Genipa americana L.) phenolic extracts: a
comparison of assays. Nutrition & Food Science, v. 43 n.2
2. Abadio Finco, F.D.B.; Kammerer, D. R.; Carle, R.; Tseng, W-H.; Böser, S.;
Graeve, L. Antioxidant activity and characterization of phenolic compounds
from bacaba (Oenocarpus bacaba Mart.) fruit by HPLC-DAD-MSn. Journal of
Agriculture and Food Chemistry. 2012, 60 (31), pp 7665–7673.
DOI:
10.1021/jf3007689
Submitted full papers:
3. Abadio Finco, F.D.B.; Tseng, W-H.; Böser, S.; Kammerer, D. R.; Carle, R.;
Graeve, L.Determination of phenolic contents and antioxidant capacity of
extracts from Genipa americana L. (“Jenipapo”) fruit.
Invited talks:
4. Abadio Finco, F.D.B. Health Enhancing Local Foods: an interdisciplinary
approach to Gender and Nutritional Security. Summer 2009 Speaker series:
New Perspectives in Food and Gender. Kompetenzzentrum Gender und
Ernährung, University of Hohenheim, Stuttgart, Germany, July, 1st
2009.
5. Abadio Finco, F.D.B. Chemopreventive effect of bacaba (Oenocarpus bacaba)
on MCF-7 cells. 9th SLACA Simpósio Latino Americano de Ciência e
Tecnologia de Alimentos (Latin American Symposium of Food Science and
Technology) November 5th to 8 th
, 2011 Campinas, Brazil).

iii
Poster presentations:
6. Abadio Finco, F.D.B. Chemopreventive effect of bacaba (Oenocarpus bacaba)
on MCF-7 cells. 9th SLACA Simpósio Latino Americano de Ciência e
Tecnologia de Alimentos (Latin American Symposium of Food Science and
Technology) November 5th to 8 th
, 2011 Campinas, Brazil).
7. Kloss, L. Abadio Finco, F.D.B.; Graeve, L. The apoptotic effect of bacaba
(Oenocarpus bacaba) phenolic extract on MCF-7 breast cancer cells.
Scientific Student Conference 2010, Wageningen University, The Netherlands,
20-21 October, 2011.
8. Volkert, A. Abadio Finco, F.D.B.; Graeve, L. The effect of bacaba phenolic
extract (Oenocarpus bacaba) on the differentiation of 3T3-L1 preadipocytes
into adipocytes. Scientific Student Conference 2010,Wageningen University,
The Netherlands, 20-21 October, 2011.
9. Böser, S.; Abadio Finco, F.D.B.; Graeve, L. Antioxidant and Antiproliferative
Effects of Phenolic Extracts from Bacaba (Oenocarpus bacaba) and Jenipapo
(Genipa americana) on HepG2 Cancer Cell Line. ELLS Scientific Student
Conference 2010, November, 11-12, Copenhagen, Denmark.
10. Abadio Finco, F.D.B.; Graeve, L. Apoptotic effect of the Brazilian berry Bacaba
(Oenocarpus bacaba Martius) on MCF-7 breast cancer cells. SFRR Europe:
Society for Free Radical Research Meeting. September 12 - 15, 2010, Oslo,
Norway.
11. Abadio Finco, F.D.B.; Graeve, L. Apoptotic effect of the Brazilian berry Bacaba
(Oenocarpus bacaba Martius) on MCF-7 breast cancer cells. Metabolomics
2010 27th June to 1st July Amsterdam, The Netherlands

iv
Collaborators: During the project evolution a work team of students and researchers contributed to
its development and therefore are co-authors in the respective publications. Sabrina
Böser (2010); Wen-Hsin-Tseng (2011); Loreen Kloss (2011) and Anne Volkert (2011)
were involved and developed their respective bachelor or master theses under my
co-supervision in the Institute of Biological Chemistry and Nutrition at the University
of Hohenheim. Therefore, their contributions also take part in this doctoral thesis. Dr.
Kammerer and Prof. Carle (Institute of Food Technology, Section Plant Foodstuff
Technology, Hohenheim University) contributed valuably to the extraction
optimization and chromatography analysis and Dr. Marcus Finco (Food and
Nutritional Security Lab, Federal University of Tocantins) collaborated on the
interpretations of the regression analysis and socioeconomic data.

v
Table of Contents
1. Introduction ....................................................................................... 1
1.1. The Brazilian Amazon Rainforest ....................................................................... 2
1.2. The Brazilian nutritional situation ....................................................................... 7
1.3. The Brazilian public policies towards food and nutrition security .......................10
1.3.2. Health enhancing local foods: a food and nutrition-relevant action that offers a
sustainable alternative and solutions to forestry protection. ......................................13
1.4 The potential preventive role of traditional fruits in health and nutrition through
bioactive compounds .................................................................................................21
1.4.1. Phytochemicals ...............................................................................................23
1.4.1.1. Phenolic compounds ....................................................................................25
1.4.1.2. The chemopreventive effect of phenolic compounds on cancer ...................26
1.5. Objective .............................................................................................................27
2. Methodology .................................................................................... 28
2.1 Research Design .................................................................................................28
2.2. Field study ..........................................................................................................28
2.2.1. Research area and Sampling ..........................................................................28
2.2.2. Socioeconomic status of Households ..............................................................30
2.2.3. Analysis of Nutritional situation of adults from the two rural communities ........31
2.2.3.1. Anthropometric measures of subjects ...........................................................31
2.2.3.2. Dietary intake and Energy requirements .......................................................32
2.2.3.3. Statistical Analysis ........................................................................................34
2.2.4.1. The Linear model ..........................................................................................34
2.3. Biofunctional properties of traditional Brazilian fruits in vitro ...............................36
2.3.1. Chemicals ........................................................................................................36
2.3.2 Plant Materials and Sample preparation ...........................................................36
2.3.2.1. Bacaba (Oenocarpus Bacaba Mart.) and Jenipapo (Genipa Americana L.) .36
2.3.2.2. Plant materials ..............................................................................................37
2.3.2.3. Fruit Extract Preparation for HPLC analysis .................................................37
2.3.2.4. Fruit Extract Preparation for biological assays with cells ..............................38

vi
2.3.3. Total phenolic contents, antioxidant and antiproliferative activities of bacaba
and jenipapo phenolic extracts. .................................................................................38
2.3.3.1. Total phenolics .............................................................................................38
2.3.3.2. Total flavonoids ............................................................................................38
2.3.3.3. Total anthocyanins ........................................................................................39
2.3.3.4. Oxygen radical absorbance capacity (ORAC) assay ....................................39
2.3.3.5. Trolox equivalent antioxidant capacity (TEAC) assay ...................................40
2.3.3.6. Ferric reducing ability of plasma (FRAP) assay ............................................41
2.3.3.7. Free radical scavenging capacity (DPPH assay) ..........................................41
2.3.3.8. Cell culture of HepG2 cells ...........................................................................42
2.3.3.9. Cellular antioxidant activity assay (CAA) ......................................................42
2.3.3.10. MTT assay ..................................................................................................44
2.3.3.11. MUH assay .................................................................................................44
2.3.3.12. MTT and MUH assay of cell-free fruit extracts ............................................45
2.3.3.13. Trypan blue assay ......................................................................................45
2.3.3.14. Methylene blue assay .................................................................................46
2.3.4. Characterization of phenolic compounds of bacaba extract by HPLC-DAD-MSn
..................................................................................................................................46
2.3.5. Chemopreventive effect of bacaba Phenolic Extract on MCF-7 cells ..............48
2.3.5.1. Cell culture of MCF-7 cells ............................................................................48
2.3.5.2. Measurement of cell proliferation ..................................................................48
2.3.5.3. Morphology assessment ...............................................................................48
2.3.5.4. Ethidium Bromide/Acridine Orange Assay ....................................................49
2.3.5.5. DNA fragmentation assay .............................................................................49
2.3.5.6. Annexin V and PI double staining assay .......................................................50
2.3.5.7. Estimation of cell volume ..............................................................................50
2.3.5.8. Measurement of mitochondrial membrane potential (ΔΨm) .........................50
2.3.5.9. Determination of caspase-9 activity ..............................................................51
2.3.5.10. Determination of caspases-6 and -8 activities ............................................51
2.3.5.11. Assessment of PARP (Poly (ADP-ribose) polymerase) cleavage ...........52
2.3.5.12. Western Blotting .........................................................................................53

vii
2.3.5.13. Statistical analysis ......................................................................................53
3. Results ............................................................................................. 54
3.1. Nutrition Survey ..................................................................................................54
3.1.1 Socioeconomic, health and food security assessment of two rural communities
in the region of APA/Cantão, Tocantins state (Brazilian Amazon Region) ................54
3.1.2. Nutritional situation of adults of two rural communities in the region of APA-
Cantão, Tocantins state (Brazilian Amazon Region) .................................................65
3.2. Biofunctional properties of traditional fruits .........................................................75
3.2.1. Optimization of Phenolics Extraction ...............................................................75
3.2.2. Phenolics Content of bacaba and jenipapo fruits .............................................76
3.2.3. Antioxidant activity of bacaba and jenipapo fruits. ...........................................76
3.2.4. Inhibition of Cell Proliferation ...........................................................................80
3.3.5 Characterization of phenolic compounds of bacaba by HPLC-DAD-MSn .........83
3.3.6. Chemopreventive effect of bacaba extract on MCF -7 cells ............................93
3.3.6.1. Effects of bacaba extract on MCF-7 cell proliferation and morphology .........93
3.3.7.2. DNA fragmentation and PARP cleavage ......................................................96
3.3.7.3 Bacaba induced apoptosis as measured by annexin V/propidium iodide (PI)
flow cytometry ............................................................................................................97
3.3.7.4. Reduction of cell volume .............................................................................100
3.3.7.5. Bacaba extract reduces the mitochondrial membrane potential (ΔΨm) in
MCF-7 cells .............................................................................................................102
3.3.7.6. Apoptosis induced by bacaba extract is caspase-dependent: activation of
caspases -6, -8 and -9 .............................................................................................103
3.3.7.7. PARP-cleavage by caspase – 9 in MCF-7 cells .........................................105
4. Discussion ..................................................................................... 107
4.1 Nutrition Survey .................................................................................................107
4.1.1 Socioeconomic, health and food security assessment of two rural communities
in the region of APA/Cantão, Tocantins state (Brazilian Amazon Region) ..............107
4.1.2. Nutritional Situation of adults in two rural settlements of APA – Cantão ........110
4.2. Biofunctional properties of bacaba phenolic extract .........................................114
4.3.1. Total phenol, total flavonoid and total anthocyanin contents in bacaba and

viii
jenipapo ...................................................................................................................114
4.3.2. Antioxidant Activity of bacaba and jenipapo extracts .....................................118
4.3.3. Antiproliferative activities of bacaba and jenipapo fruits ................................123
4.3.4. Characterization of phenolic compounds of bacaba extract by HPLC-DAD-MSn
................................................................................................................................129
4.3.5. Chemopreventive effect of bacaba extract on MCF -7 cells ..........................129
5. Summary ........................................................................................................135
6. Zusammenfassung .......................................................................................138
7. Resumo ..........................................................................................................141
8. References .....................................................................................................144
9. Abbreviations ................................................................................................173
10. Curriculum Vitae ............................................................................ 179

ix
List of Tables
Table 1: Classification for Nutritional Status according to BMI ..................................32
Table 2: Codification of weekly food consumption ....................................................33
Table 3: Equations for estimating BMR from body weight: .......................................33
Table 4: Variables description of linear regression ...................................................35
Table 5: Family size and its composition ...................................................................55
Table 6: Land use change .........................................................................................56
Table 7: Possession of goods by farm families .........................................................57
Table 8: Credit access by families ............................................................................58
Table 9: Composition of family income .....................................................................59
Table 10: Housing, water, garbage and energy facilities ..........................................61
Table 11: Food and nutrition security condition of families .......................................62
Table 12: Heath condition of farm families ................................................................64
Table 13: Subjects Characteristics ............................................................................65
Table 14: Health Profile of the study population ........................................................66
Table 15: Anthropometric profile of eutrophic and overweight adults ........................67
Table 16: Dietary variables (Energy) and Physical activity levels (PAL) of eutrophic
and overweight adults ................................................................................................68
Table 17: Macronutrients daily intake of eutrophic and overweight adults ................69
Table 18: Regression coefficients and p-values for correlates of BMI ......................70
Table 19: Quantitative analysis of food consumption of eutrophic and overweight
adults .........................................................................................................................72
Table 20: Food pattern of surveyed people based on quantitative analysis ..............74
Table 21: Water content and yield of fruit samples ..................................................75
Table 22: Total phenol, total flavonoid and total anthocyanin content of Bacaba and
jenipapo fruits. ...........................................................................................................76
Table 23: Antioxidant activity of bacaba and jenipapo fruits ......................................77
Table 24: EC50 and CAA values for the inhibition of peroxyl radical-induced DCFH
oxidation by Quercetin, Bacaba and Jenipapo .........................................................79

x
Table 25: IC50 values and regression coefficients (R2) for bacaba and jenipapo
extracts in MTT, MUH, Methylene blue (MB) and Trypan blue (TB) assay ...............83
Table 26: Spearman’s Correlation coefficients among different assays (MTT, MUH,
MB, TB) .....................................................................................................................83
Table 27: Characterization of individual phenolic compounds in bacaba extracts by
HPLC/DAD/ESI-MSn ..................................................................................................86
Table 28: UV/Vis and mass spectrometric characterization of individual anthocyanins
in bacaba extracts by HPLC/DAD/ESI-MSn ...............................................................91
Table 29: Comparison between bacaba and jenipapo phenolic, flavonoid and
anthocyanin total contents and other fruits described in the literature. ....................116
Table 30: Antioxidant values of bacaba, jenipapo and other fruits. ........................120
xi
List of Figures
Figure 1: Brazilian Legal Amazon. ............................................................................. 3
Figure 2: Boundaries of Legal Amazon and the spatial distribution of deforestation
with highlights on the “Arc of deforestation” . .............................................................. 5
Figure 3: Components of Brazilian Food and Nutritional Security Concept. .............11
Figure 4: Amazonian species with known functional properties. ...............................14
Figure 5: Overall Impact of Health enhancing local foods in Brazil. .........................20
Figure 6: Classification schema of dietary phytochemicals .......................................24
Figure 7: APA-Cantão - (with the green borderline). .................................................29
Figure 8: Participant being interviewed during field research. ...................................30
Figure 9: Participant family. .....................................................................................31
Figure 10: Gender distribution of household head . ..................................................55
Figure 11: Social assistance from federal and/or state government. ........................60
Figure 12: Self-production is enough to feed the family. ..........................................62
Figure 13: Physical activity levels of eutrophic and overweight adults. .....................70
Figure 14: Extraction optimization for bacaba (A) and jenipapo (B) samples. ..........76
Figure 15: Dose-response curves for the inhibition of peroxyl radical-induced DCFH
oxidation by Quercetin, Bacaba and Jenipapo.. ........................................................78
Figure 16: Median effect plots inhibition of peroxyl radical-induced DCFH oxidation
by Quercetin, Bacaba and Jenipapo. .........................................................................78
Figure 17: MTT and MUH cell-free test of both fruit extracts . ..................................81
Figure 18: Percentage inhibition of HepG2 cell proliferation by bacaba extracts .....81
Figure 19: Percentage inhibition of HepG2 cell proliferation by jenipapo extracts . ..82
Figure 20: HLPC chromatogram of the phenolics present in a bacaba (Oenocarpus
bacaba Mart.) extract at a detection wavelength of 370 nm. .....................................84
Figure 21: HPLC chromatogram of anthocyanins from a bacaba (Oenocarpus
bacaba Mart.) sample at a detection wavelength of 520 nm. .....................................90
Figure 22: Antiproliferative effect of bacaba extract on MCF-7 cells. ........................94
Figure 23: EB/AO staining of MCF-7 cells treated with 0 and 250 μg/mL of bacaba
extract after 72h of incubation. ..................................................................................95

xii
Figure 24: PARP – cleavage by bacaba extract. Cells were incubated with bacaba
extract (0-1000µg/mL) for 24 h and 48 h. ..................................................................97
Figure 25: Annexin V/PI staining of cells treated with bacaba extract . ....................99
Figure 26: Decrease of cell volume in MCF-7 cells exposed to different
concentrations of bacaba extract. ............................................................................101
Figure 27: Mitochondral membrane potential of MCF-7 cells. ................................102
Figure 28: Caspases activation by bacaba extracts. ..............................................104
Figure 29: PARP –cleavage by Caspase-9. ...........................................................106

Introduction
1
1. Introduction Industrialization, rapid urbanization and market globalization have affected countries
all over the world in different fields such as economy, social systems, health and
environment. In this context, countries like Brazil suffer impacts of all natures, which
also have consequences on people’s lifestyle and health conditions. The latter are
characterized by an increasing prevalence of non-communicable diseases (NCD),
such as obesity, cardiovascular disease and cancer, for instance (2).
Currently, the big challenge for Brazil is to keep the potential food production within
the sustainability framework. Therefore, small scale agriculture, especially focused on
traditional communities has received some attention and support, although the food
production in Brazil is mostly performed by large scale farming. It is important to note
that the country is ranked as one of the main food producers in the world. On the
other hand, Brazil is also recognized by its richness in biodiversity especially when
one considers the Amazon Rainforest.
More recently, traditional communities are also recognized for their role in
environmental protection. As these people are immersed in the natural environment
and possess traditional knowledge, they are enabled to use native species available
in the forest in a sustainable fashion. Moreover, traditional products are becoming
more popular in NCD prevention and therefore, the positive health benefit of plant
extracts is being increasingly investigated. Last but not least, the consumer market is
also facing a growing demand for traditional products that improve health conditions.
In this context, the debate about native and underutilized plants arises with great
importance. From the nutritional aspects of native species, different issues can be
improved regarding income generation, health and nutrition of traditional communities
in the Amazon Region. Considering nutritional and health properties, traditional
communities can also improve their diets with fruits and vegetables and at the same
time add value to the artisan and traditional food produced by them.

Introduction
2
As the utilization of the native species is performed by gathering them directly from
the natural environment through suitable forest management, improving and
establishing products from native species and traditional communities can be an
important strategy for forest preservation. Furthermore, based on the positive health
benefit of fruit and vegetable consumption, more research about protective
ingredients is necessary in developing countries in order to show the possible
functional properties of native fruits. When investigated properly, some of these fruits
could be very strategic from a physiological, pharmacological and economic
standpoint and therefore, more studies about traditional fruits in the Amazon region
are absolutely important and required. In addition, nutrient density needs to be
analyzed to obtain knowledge about the importance of different food related to
adequate micronutrient supply. Until recently, there has been little data about the
nutrient and non-nutrient composition of native foods from Latin America, especially
from the Brazilian Amazon region (1, 3).
Based on the discussion above and aiming at supporting the food chain of traditional
food and communities in the Brazilian Amazon, actions should be carried out to bring
together different fields of knowledge and scientific disciplines. For this purpose,
issues regarding environmental, economic, nutritional and health aspects should be
integrated towards a main and unique initiative. Thus, to better comprehend this
panorama in Brazil, different issues regarding socioeconomic, environmental,
nutritional and political aspects are described hereunder.
1.1. The Brazilian Amazon Rainforest
Brazil is considered a tropical country endowed with great and rich biodiversity within
different biomes, such as Savannah, Semi-arid, Atlantic forest, Pampa, Caatinga and
Rainforest. However, when the discussion goes towards biodiversity and
environmental protection, it is unavoidable to immediately associate the topic with the
Amazon Rainforest.

Introduction
3
The Amazon Rainforest is considered the biggest rainforest in the world and
comprises an area from the Atlantic Ocean to the eastern hills of the Andes, covering
a large territory belonging to nine different countries in South America. The Brazilian
Amazon Rainforest covers 69% of the total Amazon Rainforest (4). In Brazil, the
Amazon region has an area of 4,871,000 km2
5
and a population of 20 million of people
( ). In addition, it possesses a colossal flora and fauna. It is estimated that the
highest biodiversity worldwide is present in this biome, which therefore, has the
biggest genetic bank of animal and vegetal species in the world.
The Brazilian Amazon is politically defined as “Legal Amazon” and includes different
states (Pará, Amazonas, Maranhão, Tocantins, Mato Grosso, Acre, Amapá,
Rondônia and Roraima) (Figure 1). The Brazilian Legal Amazon corresponds to 60%
of the national territory, and is characterized by a large diversity when considering
socio-cultural issues (6, 7).
Figure 1: Brazilian Legal Amazon.

Introduction
4
The traditional model of the Legal Amazon occupation has being taken vis-à-vis an
intense process of deforestation, which can be defined as a complex and
multifaceted phenomenon (8). When one looks into the historical process of
colonization motivated by the Brazilian government during the 1960’s, for instance,
one realizes that this process was promoted via exploitation of the forest without any
thought of sustainability. The process of colonization boosted the agriculture and
livestock production at the expense of the Amazon deforestation – a process that
remains until today (4, 8, 9). In addition, economic activities such as timber extraction
started to play an important role as a catalyst in the exhaustion of the Amazon biome
(9, 10).
Tropical forests are continuing to disappear at an alarming rate: between 1990 and
2005, the rate of deforestation averaged about 13 million hectares a year, occurring
mostly in tropical countries (3). In the Brazilian Legal Amazon the area of
deforestation reached approximately 653 thousand of km2
Figure 2
in 2003. However, this
deforestation is not based on a homogeneous dynamic. By contrast, the
deforestation is highly concentrated in the southern-eastern Amazon, whose
boundaries comprise the southern part of Maranhão state, northern part of Tocantins
state, southern part of Pará state, northern part of Mato Grosso state, Rondônia,
southern part of Amazonas state and southeast part of Acre state, forming the so-
called “Arch of Deforestation” ( ) (11-14).

Introduction
5
Figure 2:
Boundaries of Legal Amazon and the spatial distribution of deforestation with highlights on
the “Arc of deforestation” (adapted from Brasil 2008 (6) by Lui and Molina, 2009) (14).
As one can see in Figure 2, the “Arc of deforestation” defines a wide area of the
Brazilian territory that covers the mid-western and northern of Brazil, where the
Ecotone zone, i.e. a transition region between Rainforest and Savannah biome is
located.
The process of deforestation is also linked to soil erosion, changes in the
groundwater and biodiversity loss. The process also contributes to global climate
instability, since the forest develops a key role in carbon sequestration preventing
global warming and its secondary effects. An Ecotone zone, for instance, includes
species from both Savannah and Amazon rain forest and, therefore, has more
capacity to store carbon when compared to Savannah ‘stricto sensu’. The range of
carbon sequestration values reflects the fact that the entire process depends on
several natural conditions, such as humidity, quantity of rain and sun, which are
negative impacted by forest degradation (3). In addition, traditional communities also
have their access to fruits and other forest-based foods diminished due to natural
resources exhaustion.

Introduction
6
The Amazon Rainforest is characterized by a high complexity of ecological and social
relationships, and can be considered a “hotspot study field” regarding different
disciplines and point of views. For this reason and based on the need of forest
preservation, efforts should be integrated aiming at promoting the sustainable
development in the region. Albeit the significant role of the Amazon Rainforest to the
global climate and the richness of biodiversity, deforestation is presently being
considered as a
threat to the biome and traditional communities. The combination of
roads overture and the political tax incentives given to agribusiness led to a condition
of predatory occupation, where the native forest is considered by farmers as an
obstacle to be overcome. Therefore, the great current challenge is to merge the
production profitability of the large-farming activity with the forest preservation and
the small-scale (traditional communities) well-being as well.
Despite the importance of large-scale agriculture to the country’s economy especially
regarding the Gross Domestic Product (GDP)1
15
, the small-scale farming system has
its economic, social and environmental relevancy to Brazil. The family agriculture
sector is always mentioned by its social reproduction and its capacity to supply the
national and international markets as well. However, it is important to highlight some
other factors that are extremely important. The family agriculture plays an important
role in rural population fixation, decreasing therefore, the rural exodus, especially in
the Amazon region. In addition, family agriculture and its pluri-activity profile is
responsible for income generation and pushes some small-scale farmers out of rural
poverty. Therefore, a social approach is usually focused on the economic
characteristics of this sector, that corresponds about 10% of the GDP, on average
( ). Also, family agriculture in Brazil is characterized by regional differences. Despite
these characteristics, the great feature of the family agriculture model considers
sustainable development and forest preservation.
1 GDP - Refers to the market value of all final goods and services produced in a country in a given
period

Introduction
7
Based on the Brazilian agriculture profile mentioned above, it is undeniable that up-
to-date technology-based farming is indispensable for producing food for the world
population. However, interests in crop quality and production rarely include nutritional
sciences and their links to traditional community activities performed by those living in
the forest. Albeit, some interventional actions and research have focused on
providing micronutrients through processes such as biofortification, more concern
has to be given to the use of native species containing nutritional assets such as
micronutrients, fibers and phytochemicals with antioxidant power, especially within
the family agriculture system (6, 16, 17).
1.2. The Brazilian nutritional situation Until the beginning of the 1940s, infectious diseases in Brazil were the main cause of
death, being responsible for more than 40% of the deaths. However, in 1986,
cardiovascular diseases took over as the main cause of deaths (33.5%) in the
country. In 2005, at least 35 millions of people died from NCD (non-communicable
diseases) all over the world. This figure corresponds to the double of deaths related
to infectious diseases and shows the nutritional transition experienced in Brazil up to
now (18). In addition, NCD caused the majority of deaths in the last decades. In
2004, for instance, it reached 74.3% of proportional mortality in Brazil (6).
Surely, NCD are considered as a serious public health problem in both developed
and developing countries. However, developing countries suffer from it at higher
levels due to a reduced ability to implement public policies that aim to positively
change the social determinants. Also, NCD are important causes of morbidity,
mortality and invalid status and are responsible for major economic costs for families,
health systems and society over all. The costs can occur directly (costs related to
internment, medicines, clinical treatment) or indirectly (loss of production associated
with these diseases, early retirement, etc.). In this way, preventing NCD can also be
related not only to social and public health but also to economic benefits (19).

Introduction
8
The multiple aetiology of NCD does not allow its causes to be comprehended or
defined clearly. However, biomedical investigations made it possible to identify many
risk factors involved. As obesity and inadequate diet are closely related - both are
considered as risk factors. Diet, however, is a risk factor that has as an advantage
the possibility to be improved and changed (20).
Obesity has taken hold as a nutritional problem associated with a high incidence of
cardiovascular diseases, cancer, and diabetes, thereby influencing the morbidity and
mortality profile of populations. At least 40% of the adult Brazilian population are
presently overweight (BMI > 25Kg/m2) and at the same time, obesity (BMI > 30
Kg/m2 7) is found in 8.9% of adult men and 13.1% of adult women ( ).
It is important to highlight that NCD are present in all strata of population and have a
high prevalence even in poor rural areas. Vellasquez-Meléndez et al. have found that
33.6% of women had a Metabolic Syndrome in rural settlements of Vale do
Jequitinhonha (a very poor region of Brazil). Obesity risk factors can be controlled.
Individual factors (for example diet and lifestyle) are associated with several
diseases. The reduction of one of these risk factors can result in the prevention and
control of several diseases at the same time (obesity, atherosclerotic cardiovascular
disease, lipidemic disorders, hypertension and diabetes mellitus) (21, 22).
As previoulsy reported (22), the scientific base for prevention is based on two
components: the first is the knowledge of the biological and epidemic processes
underlying the emergence of the diseases; and the second is the effectiveness of its
prevention. In this context, a healthy and affordable diet for the prevention of NCD
should be designed, and the increase of fruit consumption can be considered as an
important element that fulfills these requirements. This illustrates the importance to
study the relation between the increased consumption of fruits (including new species
of fruits) and nutritional status and health (22).

Introduction
9
Fruits and vegetables, in general, have played an important role in the prevention of
NCD. Evidence-based studies suggest a role for oxidative stress on the
physiopathology of obesity and several chronic diseases, such as atherosclerosis,
cancer and degenerative diseases (23). Therefore, the frequent use of foods with
antioxidant capacity and phytochemical protectors can be relevant for the prevention
of diseases related to increased oxidative stress (23). The protective effect of fruits
and vegetables against chronic diseases is attributed to their content of
phytochemicals with corresponding antioxidant activity and is leading researchers
world-wide to investigate this functional role of foods.
Many studies have shown that “berries” (e.g. strawberries, blackberries) play a role in
NCD prevention and others have been done with fruits which have an established
high consumption pattern all over the world, such as apple, mango, peaches and
pear (24). However, until now few researchers are engaged to investigate the
preventive role of wild fruits that are consumed and accessed locally in Brazil.
The urgent need to better demonstrate and document the association between
biological diversity, dietary diversification and improved nutritional situation requires
an integrative research at the laboratory, community and food system levels.
Therefore, it is important to examine the relationships between dietary antioxidant
intakes, oxidative stress and inflammation in populations that are at risk for future
disease (25). Prevalence data of NCD are still insufficient in the Legal Amazon,
especially in Tocantins State (Brazil) and those obtained by the Government
information systems are often incomplete (26). Despite the absence of nutritional
information in Tocantins State, a similar epidemiological and nutritional trend can be
presumed (like in northern region and Brazil as a whole) with a high prevalence and
incidence of overweight/obesity and their associated diseases. Also, there is a lack of
information in the scientific literature on dietary intake and nutritional status of rural
populations and their relationship with the consumption of local fruits from Brazilian
traditional food.

Introduction
10
1.3. The Brazilian public policies towards food and nutrition security
Internationally, the loss of biodiversity and how other environmental changes affect
diet and health are usually perceived as a food security issue, regarding mainly food
supply and access. However, Brazil can be considered in the vanguard of food and
nutritional security, as its perception and comprehension on food security includes a
holistic approach to the topic. Based on this, Brazil does not consider the terminology
“food security” alone, but “food and nutritional security” in issues regarding this topic.
Recently, Brazil significantly advanced the topic of Food and Nutrition Security (FNS)
during the II and III CNSAN (National Conference of Food and Nutrition Security) in
2004 and 2007, respectively. Through a participatory process during the II CNSAN a
definition of “Food and Nutrition Security” was established and also a specific policy
for the country was designed. Both were in accordance with the Brazilian reality
(which comprises an enormous diversity of people, culture, environment and so on),
as follows:
“Food and Nutrition Security is the achievement of the right of all people to
access food regularly and permanently, with quality and enough quantity, without
compromising the access to other basic needs, based on food practices to promote
health, with respect to cultural differences and being social, economic and
environmentally sustainable” (27).
According to the definition above, Food and Nutrition Security is focused not only on
hunger eradication, but also on the assurance of the exercise of the Right to
Adequate Food, which means that people have access to a diet containing not only
an adequate quantity of calories but also all micronutrients (vitamins, minerals) and
any other compounds that are important to health and nutrition. Moreover, this diet
should consider the culture factor and the environment into which each individual is
emersed. In fact, the nutritional value of a food has to be considered but its social

Introduction
11
and anthropological role cannot be forgotten (27). The components of the Brazilian
FNS policy can be seen in Figure 3.
Figure 3: Components of Brazilian Food and Nutritional Security Concept.
Surely, to fully reach the FNS of the population, initiatives involving various fields of
knowledge and science should be established. However, not only the mix of
knowledge is necessary, but also the interrelationship between the various sectors
and institutions at different levels is necessary in order to outline their FNS programs
and policies together. It is worth mentioning that any policy of social inclusion may
resort to emergency activities in order to solve an urgent situation.
However, structural actions shall be executed in parallel in order to keep the situation
provided for emergency action and ensure the perfect social inclusion. In this sense,

Introduction
12
actions that promote sustainable development generate income and social justice
have been designed and executed by the Brazilian government. These actions have
a transversal nature and include the civil society and the academic sector.
In the Brazilian FNS context, which includes among other things, production, culture
and environment, family farmers and traditional communities have an extremely
important role for the achievement of the FNS goal.
Therefore, one can realize the perfect integration between the policies of FNS and
another Brazilian public policy (28): the National Policy for Sustainable Development
of Traditional Peoples and Communities which aims at "... include support and
ensure productive inclusion with the promotion of sustainable technologies,
respecting the system of social organization of peoples and traditional communities,
valuing natural resources and local practices, knowledge and traditional
technologies."
Among other issues, this policy aims at achieving food security and nutrition of the
rural population, and respect for cultural issues. Thus, special attention has been
given to the culture and traditions, the richness of biodiversity and the integration of
policies and programs.
In line with the policy of FNS, and in order to articulate government policies aimed at
sustainable development, income generation and social inclusion, in 2009 the
National Plan for Promotion of Socio-Biodiversity Product Chains (PNPSB) was
established (29). PNPSB is a joint coordination effort by the Brazilian Ministry of
Agrarian Development, Ministry of the Environment, Ministry of Social Development
and Fight Against Hunger and the National Supply Company. PNPSB is a policy
strategy supported by relevant public authorities, civil society, private sector, financial
institutions and the German Agency for International Cooperation (GIZ) in Brazil2
2 MDA – Ministry of Agrarian Development, Brazil.

Introduction
13
The PNPSB was developed through a participatory process, being guided in the
Brazilian scene of great biological diversity, social and cultural. Therefore, the plan
considers the insertion of biodiversity into the socio-cultural panorama exercised by
traditional communities, family farmers and extractive farmers. This raises the
concept of sociobiodiversity.
The aim of this plan is to develop integrated actions for promoting and strengthening
the role of socio-biodiversity product chains in building sustainable markets.
Moreover, it aims to ensure environmental conservation and income generation by
means of the productive inclusion of traditional peoples and communities, as well as
family farmers. Its major actions include the promotion of public policies, such as
credit delivery mechanisms, technical assistance and agricultural extension, markets
and marketing tools, social and environmental added value and income-generating
activities, food security, enhancement of social and productive organization, and
business management.
Altogether the Brazilian national policy for Food and Nutrition Security merged to a
current policy will motivate researchers to organize themselves into an
interdisciplinary arrangement in order to meet the country’s aims regarding the
scientific contribution towards sustainable development. As a result, actions
concerning food and nutrition in Brazil should take health, environmental and
economic issues in combination with sustainability. Therefore, this thesis considers,
among other references, the Brazilian perspective on Food and Nutrition Security at
present, conducting the discussion in an interdisciplinary and holistic approach.
1.3.2. Health enhancing local foods: a food and nutrition-relevant action that offers a sustainable alternative and solutions to forestry protection. According to Lajolo (1) and Melissa Williams (30) there are many opportunities to
develop traditional plant markets in rural areas with indigenous knowledge and with

Introduction
14
lower costs due to lower labor costs. Some species can be mentioned as an example
of this statement as described in Figure 4.
In summary, health enhancing local foods, also defined as functional foods, can
contribute to health promotion; many Brazilian species have no commercial value
and are locally consumed in an artisan manner. Nothing is known about their
biofunctional properties and getting to know the health properties of these native
fruits from the Amazon adds commercial and environmental values to underutilized
species. In addition, health enhancing local foods would contribute to health
promotion of local communities, going along with the aforementioned FNS policy.
The hypotheses, assumed to address the relationship of biodiversity and nutrition,
should consider the access and consumption revealing the food component of FNS
through socioeconomic and dietetic inquiry. However, research considering
physiological, and biochemical investigation meets the nutritional factor of FNS. In
addition, research aiming at providing data in contribution to food and nutrition
security advances, should combine both aspects sharing a transdisciplinary
approach. For this, aiming at the effective contribution of research initiatives on
sustainability, scientific investigation should be performed within a transdisciplinary
Figure 4: Amazonian species with known functional properties. Source: Lajolo (1)
Introduction
15
approach and therefore, connected to policy makers, executioners and practitioners.
Most societies recognize that food, medicine and health are interconnected. Ingested
plant and animal products offer functional benefits to health in addition to essential
nutrition (31).
The concept of functional foods was raised in Japan in the early 1980s and the first
legislation for functional foods was first established as “Foods for Specified Health
Use” (FOSHU) and in the early 1990s a first discussion for legislation was
implemented. In addition, due to high costs of health care, especially because of the
increased rates of non-communicable diseases and prolonged life spans, the country
fostered a special research programme funded by the Japanese Ministry of
Education, when the term “food function” appeared for the first time(32). Since, 2001
FOSHU products in Japan can also take the form of pills and tablets, even though
most products are still in more conventional forms (33).
In Europe, The European Commission Concerted Action on Functional Food Science
in Europe (FUFOSE), coordinated by International Life Science Institute (ILSI)
defined functional food as: ‘‘a food product can only be considered functional if
together with the basic nutritional impact it has beneficial effects on one or more
functions of the human organism thus either improving the general and physical
conditions or/and decreasing the risk of the evolution of diseases. The amount of
intake and form of the functional food should be as it is normally expected for dietary
issues. Thus, according to this, a functional food could not be in the form of pill or
capsule, but just in the normal food form’’ (34). The European legislation however,
does not contemplate functional foods as specific food categories, but somewhat as
a concept (35). Based on this, the rules to be applied are numerous and depend on
the nature of the foodstuff (36, 37).
Currently, a worldwide consensus defines functional foods as “foods expected to
have specific healthy effects due to relevant constituents or foods from which
allergens have been removed and foods where the effects of such an additional or

Introduction
16
removal has been significantly evaluated, permission has been granted to make
claims regarding the specific beneficial effect on health expected from their
consumption”. In another shorter definition it can be defined “food that may provide
benefits beyond basic nutrition” (38, 39).
In Latin America, being at the vanguard in this issue, Brazil was the first country to
establish a committee and develop legislation concerning functional foods in line with
the international discussions, especially to the Codex Alimentarius Commission (40).
In the late 1990s, a legal structure was developed concerning the biofunctionality
properties of foods and ingredients.
In line with the European trend, the Brazilian legislation does not define properly the
functional or health food, being more focused on the regulation of functional or health
claims. However, it establishes that those foods that claim to be health and functional
food are foods or ingredients that beyond their basic nutritional function, with regard
to a nutrient, can produce metabolically or physiological effects and/or health
benefits, being safe for consumption without medical supervision (41).
Firstly, the Brazilian legislation defines and establishes the guidelines for the analysis
and proof of the functional property claims of a food (41). Based on this, a food
should have its functional property claim proven and recognized by means of
previously consumption or recommended by the producer, function, conditions of use
and nutritional value, if relevant. Applied scientific evidence such as, nutritional,
chemical and molecular composition; biochemical, nutritional, physiological and
toxicological in vivo assays; epidemiological studies and clinical trials should also be
a basis for the claim. Furthermore, wide evidence in scientific literature, institution of
health and legislation internationally renown are also taken into account. Importantly,
the legislation also mentions that the traditional use observed in the population
without any association with health damage, is also considered in the proof basis
requirements (41).

Introduction
17
In addition, the food health and functional claims are also recommended as follow
(41):
-Functional property claim - regarding the metabolic or physiological role of a
nutrient or non-nutrient compound in the growth, development, maintenance and
other normal functions of human organism.
-Health property claim - regarding the statement, suggestion or implication of
the existence of a relationship between the food or ingredient and the disease or the
condition related to health.
Health or functional claims can deal with the general maintenance of health, to the
physiological role of nutrients and non-nutrients compounds or to the risk reduction to
diseases. However, curative, therapeutic or preventive claims are not allowed (41).
Secondly, the Brazilian legislation regulates the procedures to register a food with
health or functional properties. Every food which contains any health or functional
claims should be submitted to health authorities and get registered identification (42).
With regard to the use of isolated bioactive compounds and probiotics, those have
also been regulated since 2002 (43). The isolated bioactive compounds are defined
as any compound extracted from its original source e.g. carotenoids, flavonoids and
polyphenols. Considering the isolated bioactive compounds, any health or functional
claim should follow the suitable regulation (41). Moreover, the product should also
have safe quality for the recommended consumption and consider the use as a
isolated bioactive compound within the food practices of the population. This type of
product can be presented in solid or liquid forms such as, tablets, pills, granules,
solutions or suspensions (43).
The Brazilian legislation defines the functional foods based on the nutritional concept
of it and does not consider functional food as a pharmacological issue (1, 41, 42).
The legislation for food claims is necessary to protect consumers with regard to
public health issues. Also, having the legal issue well established is an
encouragement to the technological development, since it formalizes the food
product category and establishes a new market for it (44).

Introduction
18
However, it is undeniable that although the Brazilian legislation is considered at the
vanguard with regard to Latin America, it still has to be improved since there is some
overlapping in the regulations concerning food with functional and health claims, new
food or ingredients, and bioactive substance or probiotics with functional properties
and/or health claim yet (45, 46). As reported previously (45) lycopene, chitosan and
garlic could be classified differently according to the current Brazilian regulations. For
instance, lycopene could either be: a bioactive substance or a probiotic, a food with
functional properties and/or health claims a new food or ingredient, or a medicinal
plant, according to the current Brazilian legislation (45).
In addition to the health benefits, functional foods present new economic
opportunities for many developing countries endowed with a rich biodiversity and
traditional knowledge of the health effects of certain indigenous species. In a market-
oriented economy, biodiversity including wild and agricultural ecosystems provides a
significant portion of food consumed by either urban or rural populations (31, 47, 48).
Currently, the demand for natural products, including functional foods, is continuously
increasing worldwide. As reported previously (30) functional foods entered the global
markets with force in the past decade and rapidly gained market shares
conservatively estimated to exceed those for organic food.
Many plants used as ethnic foods are getting consumer’s attention and are welcome
in the marketing of nutraceuticals extracted from them (49, 50). In developing
countries, the market for functional food is also emerging e.g. in China and Latin
American (51, 52). Despite the health consciousness and the interest in well-being,
consumers are not so open to excessive novelty (53). According to Barcelos et al.
(2009) Brazilian consumers are expected to demonstrate a more traditional eating
behavior due to strong regional and cultural roots of conservative consumers (54).
Based on this, the development of functional food which takes the cultural aspects of
food and nutrition could be an advantage. Although the eating culture is very diverse,
health enhancing local foods could be not only a forestry preservation strategy but
also an encouragement to new market frontiers.

Introduction
19
With the population care and awareness of health and the growing market of
functional and traditional foods, recently there have been many researchers engaged
in discovering and studying the healthy functional compounds of vegetables, fruits
and plants. Previous research was focused on studying the healthy effects such as
anti-oxidant and anti-inflammatory effects of fruits and vegetables. Currently, much
research is also focused on the anti-cancer effects of functional foods. The methods
could apply qualitative or quantitative research to search for new molecules or
content of beneficial elements existing in samples and applying in vivo or in vitro
model testing to examine cell pathways.
For developing countries, the market of functional foods is important not only for its
economic return but also in helping local communities to develop and/or improve their
livelihoods. During the development of a functional food market, many job
opportunities can be provided for local communities e.g. in raw material planting, food
processing factories and wholesalers and retailers. According to Lajolo (1) and
Melissa Williams (30) there are many opportunities to develop traditional plant
markets in rural areas with indigenous knowledge and with lower costs due to lower
labor costs. Some species can be mentioned as an example of this statement as
described in Figure 4.
Besides the opportunity for diversified and high-value production, farming for the
functional foods industry can benefit primary producers and rural communities in
other ways. Poorer communities can benefit from growing functional food markets
through domestication of wild plant species. Moreover, some of the crops with health-
enhancing features may be native to marginal areas, where more traditional farming
is difficult and returns are low. Also, functional properties can increase the value of
otherwise rare plant species, which can aid in biodiversity conservation if their
sustainable use is carefully managed (Figure 5).

Introduction
20
Figure 5 reflects some of the fields affected by health enhancing traditional foods. As
aforementioned, the valorization of traditional species by the investigation of health
properties could provide opportunities to primary farmers though extractivism activity.
Extractivism is a sustainable activity since it preserves the forest. In addition, by
knowing the health properties of neglected species, those could have their
consumption reinforced, having an impact on rural community health without
excluding their food culture practices.
As previously report (55) there is a growing movement of corporations which are
perceiving environmental sustainability as simple and good business. Furthermore,
the need for an improved debate about cohesive interactions among stakeholders
such as industrial, governmental, large and small farmers, non-governmental
organizations, scientific and conservation interests are of great importance.
Figure 5: Overall Impact of Health enhancing local foods in Brazil. Source: Authors.

Introduction
21
The hypothesis assumes to address the relationship of biodiversity and nutrition, and
should consider the access and consumption revealing the food component of FNS
through socioeconomic and dietetic inquiry. However, research considering
physiological, and biochemical investigation meets the nutritional factor of FNS. In
addition, research aiming at providing data in contribution to food and nutrition
security advances, should combine both aspects sharing a transdisciplinary
approach. For this, aiming at the effective contribution of research initiatives in
sustainability, the scientific investigation should be performed within a
transdisciplinary approach and therefore, connected to policy makers, executioners
and practitioners.
1.4 The potential preventive role of traditional fruits in health and nutrition through bioactive compounds According to epidemiological studies, an increased intake of fruits, and hence of
phytochemicals, can reduce the risk of non-communicable diseases such as
cardiovascular diseases and cancer, which are still the leading causes of death all
over the world. Most of NCDs are linked to aging and have been associated with
oxidative damage caused by free radicals formed in a constant process occurring in
aerobic organisms (56).
Free radicals are very reactive chemical species having an unpaired electron and are
produced continuously in cells either as accidental by-products of metabolism or
deliberately during e.g. phagocytosis. In cells, the most relevant are oxygen and its
radical derivatives i.e. superoxide and hydroxyl radical, hydrogen peroxide and
transition metals.
Reactive free radicals generated within cells can oxidize biomolecules and lead to
cell death and tissue injury. However, cells possess several mechanisms of
antioxidant defenses to prevent free radical formation or to at least counteract their
harmful effects. Among enzymes that decompose peroxides and proteins that

Introduction
22
sequester transition metals there are a great variety of compounds to “scavenge” free
radicals (57)
According to Halliwell and Gutteridge (58) the biological antioxidant defenses are
classified in radical chain–breaking antioxidants and preventive antioxidants. The first
act by converting reactive free radicals to stable and non-aggressive molecules
through hydrogen atom transfer reactions; the second act either by converting
reactive oxidative precursors to unreactive species or by inhibiting the oxidation
reaction to occur.
Antioxidants contribute to our biological antioxidant defense system and help to
protect cells from oxidative species. Antioxidant systems for example scavenge
reactive oxygen and nitrogen-free radical species, metabolize peroxides to non-
radical products and prevent the generation of oxidizing species by chelating metal
ions (59). Antioxidants can be of endogenous as well as of exogenous origin.
Endogenous antioxidants are e.g. enzymatic systems like mitochondrial superoxide
dismutase, glutathione peroxidase or catalase (23). Proteins that minimize the
availability of pro-oxidants such as iron ions, copper ions and haem are also
important (e.g. transferrin) (58). Most important exogenous antioxidants come from
the diet.
An imbalance between oxidants and antioxidants and the overproduction of oxidants
can lead to cell damage, which is called “oxidative stress”. It is widely believed that
oxidative stress contributes crucially to the development of NCDs (60). Human cells
are permanently exposed to various oxidizing agents. Some of them are necessary
for life such as normal endogenous metabolic processes. Chronic inflammations are
also important sources of free radicals. Moreover, external sources such as
pollutants, cigarette smoke and sunlight have to be taken into account (56, 61).
Oxidative damage affects all types of biomolecules, including lipids, proteins and
DNA (23). Oxidative stress is a highly relevant factor causing oxidative DNA damage

Introduction
23
that can eventually lead to mutations if left unrepaired. However, the impact on the
development of cancer is not only based on direct effects on the DNA but also on
processes like signal transduction, cell proliferation and cell death. Since injury
mechanisms can overlap, it is unclear in many situations which one is the major
target. The primary cellular target of oxidative stress varies depending on the cell, the
type of stress imposed and how severe the stress is.
The search for antioxidants from natural sources is ongoing and efforts have been
made to identify compounds which could help to prevent oxidative damage from
occurring in the body. Dietary phytochemicals in fruits and vegetables have recently
been made responsible for decreasing cancer risk by reducing oxidative stress and
modulating signal transduction pathways involved in cell proliferation and survival.
1.4.1. Phytochemicals
Phytochemicals are chemical compounds found in plants and defined as bioactive
compounds. They have been associated with a reduced risk of major chronic
diseases e.g. cancer and cardiovascular disease due their antioxidant abilities (62).
Until recently, more than 5000 individual phytochemicals have been identified in
fruits, vegetables and grains. But a large part of them is still not characterized and
needs to be investigated (63). Phytochemicals are classified into five different groups
namely carotenoids, phenolics, alkaloids, nitrogen-containing compounds and
organosulfur compounds. Most of the phytochemicals belong to the “phenolics”
group. This group can be further divided into five sub-groups: phenolic acids,
flavonoids, stilbenes, coumarins and tannins (62). Figure 6 shows a classification
schema of dietary phytochemicals.

Introduction
24
Figure 6: Classification chema of dietary phytochemicals: Classification schema of dietary
phytochemicals (63).
Phytochemicals can improve the immune system, regulate gene expression in cell
proliferation and apoptosis, regulate the hormone metabolism, and have antibacterial
effects (61). Studies with phytochemicals from several common fruits and vegetables
have already shown an antioxidant and antiproliferative effect on different cell lines
(61, 64, 65). Proteggente et al. (66) showed that fruits and vegetables rich in
anthocyanins (e.g. strawberry, raspberry and red plum) displayed the highest
antioxidant activities, followed by those rich in flavonones (e.g. orange and grapefruit)
and flavonols (e.g. onions, leek, spinach), while the hydroxycinnamate rich fruits (e.g.
apple, tomato, peach) had lower antioxidant activities. Numerous studies point out
that the antioxidant and anticancer activities of fruits and vegetables are based on the
additive and synergistic effects of their phytochemicals (63, 65, 67, 68). Thus, the
benefit of a diet rich in a variety of fruits and vegetables goes back to the complex
mixture of phytochemicals which are present in whole fruits (63).

Introduction
25
1.4.1.1. Phenolic compounds
Phenolics are important products of the secondary plant metabolism characterized by
possessing one or more aromatic groups with one or more hydroxyl groups. They
can be conjugated to mono- and disaccharides or even form a complex with
oligosaccharides, lipids, amines and carboxylic and organic acids (59). In plants, they
affect physiological functions, such as reproduction and growth; they are also part of
the defense mechanisms against pathogens, parasites and predator. In addition to
these crucial functional aspects in plant life, phenolics also play structural roles in
different supporting and protective tissues and have signaling properties which are
especially important for the interactions between plants and their environment (69);
finally, phenolics also contribute to plant color.
The important antioxidant activities of phenolic compounds can be used in processed
food as a natural antioxidant. However, in addition to their major roles in plants,
phenolics play a significant protective role concerning health benefits for humans.
Currently, many studies are conducted with phenolic compounds with antioxidant
ability or anti-cancer activity in vegetables, fruits, whole grains and other plants; this
can also help make phenolics healthy food additives in order to prevent chronic
diseases. Due to their antioxidant activity, phytochemicals can scavenge free radicals
and modulate enzyme activities of detoxification, oxidation and reduction (70).
The antioxidant capacity of phenolics is mainly due to their redox properties. For
example they are able to donate a hydrogen atom from an aromatic hydroxyl (OH)
group to a free radical and to support unpaired electrons by delocalization (59). They
can act as singlet oxygen quenchers and reducing agents (71, 72). Most of the
phenolics can be found in berry, fruits, tea and coffee. The best sources of berries
are chokeberry (96 mg/100g), blueberry (85 mg/100g), sweet rowanberry
(75mg/100g). The content in teas range from 30 to 36 mg/100g and coffee has an
amount of 96mg/100g (62, 73, 74).
Introduction
26
1.4.1.2. The chemopreventive effect of phenolic compounds on cancer There are many oxidizing agents existing in the environment. The agents appear in
food, water, air or can be activated by metabolism through the cell itself.
Overproduction of oxidants can cause an imbalance of physiological conditions of the
human body. Oxidative stress can cause damage of DNA, proteins and lipids leading
to diseases in human body such as cancer (75). Cancer is a disease in which cells of
the body start to grow out of control and finally spread all over the body forming
metastases. Many types of cancer form a lump or a tumor which derives its name
from the part of the body where it initially grows, e.g. hepatocellular carcinoma (76).
There are three main steps involved in the process of cancer formation: tumor
initiation, promotion and progression. The initiation stage is fast and irreversible and
a chain reaction of extracellular and intracellular events. In this stage, uptake or
exposure to a carcinogenic agent happens. The carcinogenic agent can be
transported to the target tissue or organ where it is either detoxified or reacts with the
target DNA leading to genotoxic
77
damage. The promotion stage is a relatively long
and reversible process; pre-neoplastic cells can proliferate and accumulate during
this stage. In the final progression stages, transformation of neoplastic cells to fast
growing tumor cells occurs with aggressive and lethal potential to the human body
( ).
Dietary phytochemicals in fruits and vegetables are likely responsible for a decreased
cancer risk by reducing oxidative stress and modulating signal transduction pathways
involved in cell proliferation and survival. Numerous phenolic plant compounds have
been found to exhibit an antiproliferative activity (61, 73, 78, 79). Liu et al. (80)
observed a direct relationship between phenolic compounds and antiproliferative
activity in raspberries. Strawberries’ phenolic extracts inhibited hepatoma HepG2 cell
proliferation significantly and in a dose-dependent manner (81).

Introduction
27
1.5. Objective The absence of information about the health situation and dietary intake spawned a
nutritional survey as a first step in this research; based on these preliminary results, a
second phase was developed to determine the biochemical profile of two Brazilian
traditional fruits.
Based on the Food and Nutrition Security concept aforementioned, the work
comprised an interdisciplinary profile and aimed at studying the potential of traditional
Brazilian fruits as a possible strategy in health promotion in NCD prevention,
especially for the rural people of Tocantins State by the investigation of these fruits
as a functional food in a community-based study.

Methodology
28
2. Methodology 2.1 Research Design
Based on the principle of Sustainable Food and Nutrition Security discussed in the
introduction topic, this study was performed in two parts. The first part consists of a
nutrition survey (field study) involving two different communities in the territory of
Cantão, Tocantins. The food and nutritional status of families and the nutritional
status of adults were assessed in this part, based on realistic data of the health and
nutritional situation of the communities. Also based on the contact with the rural
people, two fruits were selected for the second part of the study. Then, laboratory
assays aiming at investigating the functional properties of the selected fruits were
performed.
2.2. Field study 2.2.1. Research area and Sampling The research was carried out in the Tocantins State, located in the northern Brazil, in
a region well-known as Brazilian Legal Amazon Region. The State is situated in a
transition area, having climate and vegetation from the Amazon Rainforest (15%) and
Cerrado (85%) - or Brazilian savannah This transition area, so-called Ecotone zone,
comprises traditional communities (family agriculture, indigenous as well as
quilombolas) and a rich biodiversity, which is responsible for several environmental
services. For this reason, scientific efforts, studies and research in the area are
extremely important aiming at understanding the different farming systems and their
linkages to the local economy and environment.

Methodology
29
The region also comprises an Environmental Preservation Area of Bananal
Island/Cantão3
Figure 7
(APA-Cantão), which was created by a law of Tocantins State in
1997, and occupies around 1,687,000 hectares, and is characterized as a
“Conservation Unit of Direct Use” which means that exploitation and economic use
are allowed if done in a sustainable manner. It is also defined as a “Unit of
Sustainable Use”, where the preservation of biodiversity and natural resources must
be in harmony and equilibrium with the exploitation of these resources. In addition,
the biological value of Cantão is based on its formation as a Delta of the Javaés
River with more than 800 lakes and channels, and it is considered a complex ecotone
area with elements of Savannah, Amazon Rainforest, Pantanal and Atlantic Forest
( ). Although APA-Cantão is considered a local priority for, conservation, it
also involves different stakeholders due to the increasing human occupation and
agricultural activities in this area.
Figure 7: APA-Cantão - (with the green borderline).
3 The APA-Cantão (Environmental preservation Area – Cantão) comprises the following municipalities:
Abreulândia, Araguacema, Caseara, Chapada de Areia, Divinópolis, Dois Irmãos, Marianópolis, Monte
Santo e Pium.
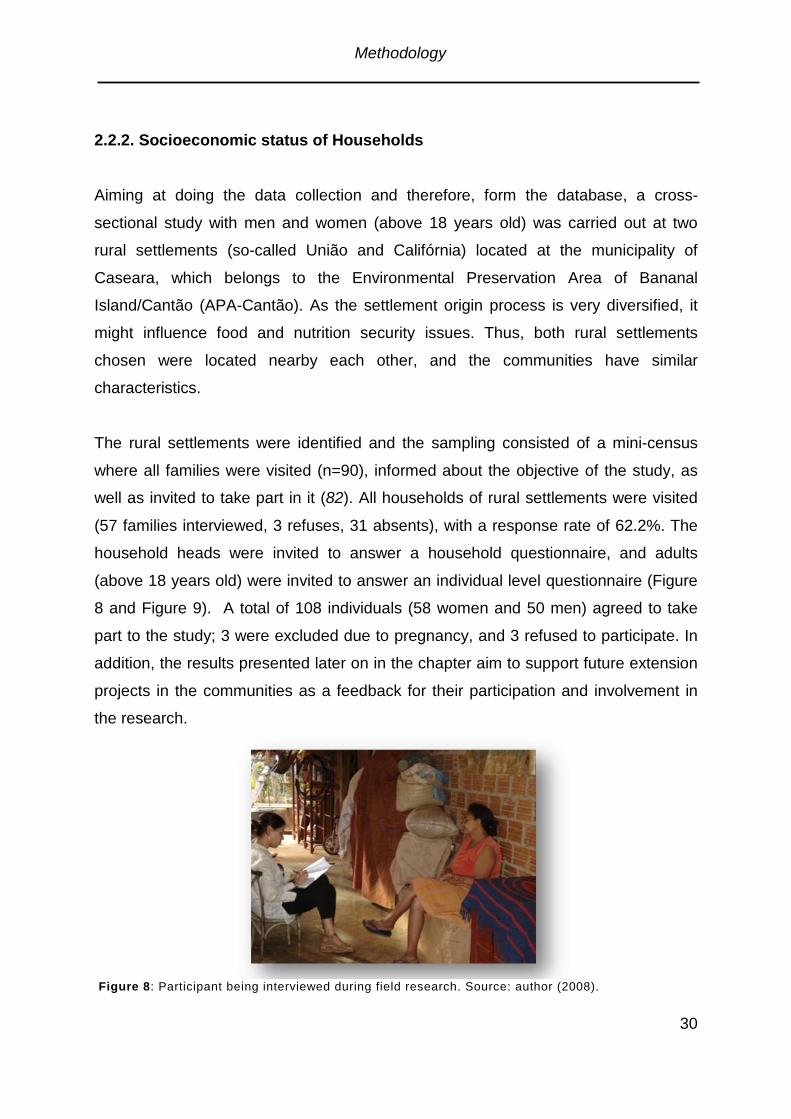
Methodology
30
2.2.2. Socioeconomic status of Households
Aiming at doing the data collection and therefore, form the database, a cross-
sectional study with men and women (above 18 years old) was carried out at two
rural settlements (so-called União and Califórnia) located at the municipality of
Caseara, which belongs to the Environmental Preservation Area of Bananal
Island/Cantão (APA-Cantão). As the settlement origin process is very diversified, it
might influence food and nutrition security issues. Thus, both rural settlements
chosen were located nearby each other, and the communities have similar
characteristics.
The rural settlements were identified and the sampling consisted of a mini-census
where all families were visited (n=90), informed about the objective of the study, as
well as invited to take part in it (82). All households of rural settlements were visited
(57 families interviewed, 3 refuses, 31 absents), with a response rate of 62.2%. The
household heads were invited to answer a household questionnaire, and adults
(above 18 years old) were invited to answer an individual level questionnaire (Figure
8 and Figure 9). A total of 108 individuals (58 women and 50 men) agreed to take
part to the study; 3 were excluded due to pregnancy, and 3 refused to participate. In
addition, the results presented later on in the chapter aim to support future extension
projects in the communities as a feedback for their participation and involvement in
the research.
Figure 8: Participant being interviewed during field research. Source: author (2008).

Methodology
31
Information concerning socioeconomic, health and food security were accessed by
the household questionnaires. Socioeconomic data is very important and widely used
for its contribution to the knowledge of the public under study and helping the
interpretation of other variables. The household food security level was evaluated
through the household questionnaire and measured by the Brazilian Scale on Food
and Nutrition Security (EBIA), which was validated in a national study involving rural
and urban populations (83). For the purpose of the research, the software package
SPSS version 16 (2007; SPSS Inc., Chicago, IL, USA) was used to compute all
statistical analysis.
Figure 9: Participant family. Source: author (2008)
2.2.3. Analysis of Nutritional situation of adults from the two rural communities
2.2.3.1. Anthropometric measures of subjects
Anthropometric measures were carried out in triplicate, by well-trained
anthropometrists and the mean values were recorded. At the home visit, subjects
(adults) were weighed with light clothes but without shoes or socks, using an
electronic portable scale with an accuracy of 100g (Plena®, São Paulo, Brazil) and
height was obtained by a stadiometer with an accuracy of 0.1cm (Altura Exata®,

Methodology
32
Minas Gerais, Brazil), in standing position, feet together and head placed according
to the Frankfurt plan. Waist circumference (WC) was determined with a flexible non-
elastic measuring tap, and taken exactly halfway between the margin of the lowest rib
and above the iliac crest. The used cut-off point for WC was identified for the
Brazilian population by (84) which indicates 88cm for men and 83 cm for women.
Body mass index (BMI) was calculated as Kg/m2
as the following expression:
BMI= weight (Kg)/height2
(m)
BMI was analyzed in accordance to World Health Organization (WHO) cut-off point
as described in Table 1.
Table 1: Classification for Nutritional Status according to BMI
Classification BMI (kg/m²)
underweight <18.50
eutrophic 18.50 - 24.99
overweight ≥25.00
obese ≥30.00
Source: WHO, 2004 (18).
2.2.3.2. Dietary intake and Energy requirements During home visit subjects were interviewed about their 24-hour recall and food
frequency questionnaire (FFQ) to achieve dietary intake and food patterns. Dietary
data from 24-hour recall were analyzed for food composition using AvaNutri Software
(food database: TACO) (
2008; Avanutri, Rio de Janeiro, Brazil).
Food frequency questionnaires (FFQ) for the previous last two months were used to
measure dietary patterns. Consumption frequency of each group of food was divided
into six categories and the consumption of each food was quantified, receiving the
weights presented in Table 1 The food consumption was specified based on weekly

Methodology
33
frequency The codification used in the research was adapted from those used by
(85)(85)(85)Liu et al. (85, 86).
Table 2: Codification of weekly food consumption
No
consumption
1 to 3 times /month
Once a week
2 to 4 times/
week
5 to 6 times/week
Once
a day
2 or more times/day
0 0 1 3 5.5 7 14
Source: adapted from Liu et al. (85).
Basal Metabolic Rate (BMR) was calculated using the equation of Schofield for the
specific age as described in Table 3.
Table 3: Equations for estimating BMR from body weight*:
Age (years)
BMR: MJ/day see BMR: kcal/day a see
Males
a
< 3 0.249kg – 0.127 0.292 59.512kg – 30.4 70
3–10 0.095kg + 2.110 0.280 22.706kg + 504.3 67
10–18 0.074kg + 2.754 0.441 17.686kg + 658.2 105
18–30 0.063kg + 2.896 0.641 15.057kg + 692.2 153
30–60 0.048kg + 3.653 0.700 11.472kg + 873.1 167
≥60 0.049kg + 2.459 0.686 11.711kg + 587.7 164
Females
< 3 0.244kg – 0.130 0.246 58.317kg – 31.1 59
3–10 0.085kg + 2.033 0.292 20.315kg+ 485.9 70
10–18 0.056kg + 2.898 0.466 13.384kg + 692.6 111
18–30 0.062kg + 2.036 0.497 14.818kg + 486.6 119
30–60 0.034kg + 3.538 0.465 8.126kg + 845.6 111
≥ 60 0.038kg + 2.755 0.451 9.082kg + 658.5 108 *Weight is expressed in Kg. Source: Schofield (87) FAO, (88). a see = standard error of estimate.

Methodology
34
Total energy expenditure (TEE) was calculated by totaling Basal Metabolic Rate
(BMR) multiplied by the physical activity level factor (PAL) which, is equivalent to the
energy requirement. Minimum limits for PAL internationally suggested by FAO
(2004)(88) were applied. Mild PAL (1.4) was used for those subjects involved in light
activity lifestyle (domestic work, teaching, office work, driving cars). Moderate PAL
(1.7) was used to those with active lifestyle and high PAL (2.0) was applied to
subjects with vigorous lifestyle and occupation e.g. non-mechanized rural workers.
Energy Balance (EB) was calculated from energy intake minus total energy
expenditure.
The Nutrition Survey data was collected during the months of June, July and August
of 2008. The study was approved by the Ethics Committee of the Federal University
of Tocantins and conducted in accordance with the Brazilian resolution CNS 196/96.
2.2.3.3. Statistical Analysis Data is expressed as means + standard deviation (SD), and the statistical differences
between eutrophic and overweight/obese of the same sex were determined with an
unpaired student’s t test, after checking for normality of distribution of the dependent
variable with Kolmogorov-Smirnov test. Otherwise, a Mann-Whitney test was
performed. χ2 (Chi-square) test was carried out for the proportions.
2.2.4.1. The Linear model
In the linear probability model, the estimated coefficients express the effect of unit
variations in the independent variables about the probability of the dependent
variable takes value equal to one. Linear regression was carried out as the equation
n. 1 and variables description is illustrated in Table 4.
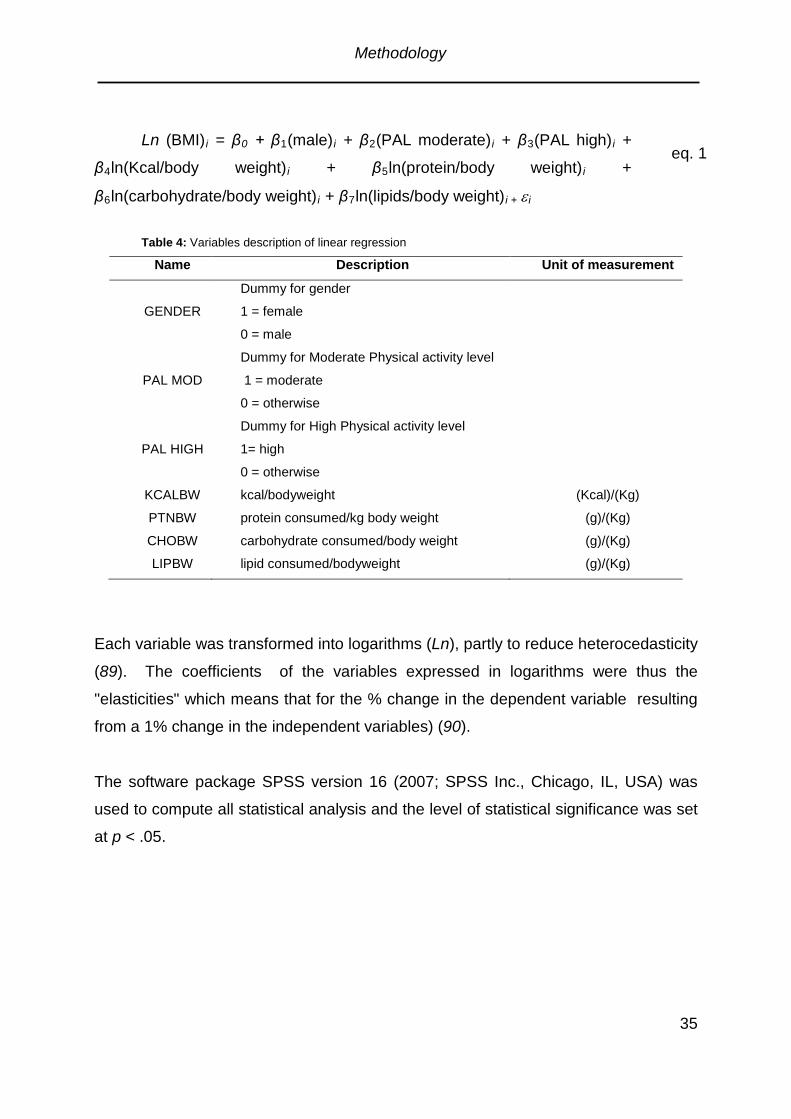
Methodology
35
Ln (BMI) i = β0 + β1(male) i + β2(PAL moderate) i + β3(PAL high) i +
β4ln(Kcal/body weight) i + β5ln(protein/body weight) i +
β6ln(carbohydrate/body weight) i + β7ln(lipids/body weight) i + ε
i
Table 4: Variables description of linear regression
Name Description Unit of measurement
GENDER
Dummy for gender
1 = female
0 = male
PAL MOD
Dummy for Moderate Physical activity level
1 = moderate
0 = otherwise
PAL HIGH
Dummy for High Physical activity level
1= high
0 = otherwise
KCALBW kcal/bodyweight (Kcal)/(Kg)
PTNBW protein consumed/kg body weight (g)/(Kg)
CHOBW carbohydrate consumed/body weight (g)/(Kg)
LIPBW lipid consumed/bodyweight (g)/(Kg)
Each variable was transformed into logarithms (Ln), partly to reduce heterocedasticity
(89). The coefficients of the variables expressed in logarithms were thus the
"elasticities" which means that for the % change in the dependent variable resulting
from a 1% change in the independent variables) (90).
The software package SPSS version 16 (2007; SPSS Inc., Chicago, IL, USA) was
used to compute all statistical analysis and the level of statistical significance was set
at p < .05.
eq. 1

Methodology
36
2.3. Biofunctional properties of traditional Brazilian fruits in vitro 2.3.1. Chemicals
All chemicals used in the study were of analytical or HPLC grade. Gallic acid,
aluminum chloride (AlCl3), (+)-catechin, cyanidin–3-glucoside, 2,2-diphenyl-1-
picrylhydrazyl (DPPH), 6-hydroxy-2, 5, 7, 8-tetramethylchromane-2-carboxylic acid
(Trolox), DCFH-DA (2’-7’-dichlorofluoresceindi-acetate); 2,2’-azinobis (3-ethyl-
benzothiazoline-6-sulfonate) (ABTS), MTT (3,-(4,5-dimethyl-2-thiazolyl)-2,5-diphenyl-
2-tetrazolium bromide), MUH (4-methylumbelliferyl heptanoate), methylene blue were
obtained from Sigma–Aldrich (Steinheim, Germany). Folin-Ciocalteau reagent;
2,4,6-tris(2-pyridyl)-s-triazine (TPTZ), quercetin dihydrate and 2,2`-azobis(2-
amidino-propane) dihydrochloride (AAPH), fluorescein in CAPS solution (20 mM) and
Trypan blue solution were obtained from Fluka-Chemie (Buchs, Switzerland). ABAP
(2,2‘-azobis (2-amidipropane)) (WakoChemicals, USA); DMEM/Ham’s F-12 was from
PromoCell GmbH (Heidelberg, Germany). Fetal calf serum (FCS),
penicillin/streptomycin, trypsin/EDTA and HBSS (Hanks´ Balanced Salt Solution (with
Ca++, Mg+
, without phenol red)) were obtained from PAA Laboratories (Pasching,
Austria). Water used in all analyses was ultra-pure water produced through a Milli-Q
system (Millipore Corporation, France).
2.3.2 Plant Materials and Sample preparation
2.3.2.1. Bacaba (Oenocarpus Bacaba Mart.) and Jenipapo (Genipa Americana L.)
Bacaba and jenipapo are edible native fruits from Brazil originating from the Amazon
and Cerrado (Brazilian Savannah). The fruits locally consumed are processed into
drinks, jelly, ice cream etc. In folk medicine, these fruits are believed to possess
functional properties; however, there are no studies investigating the assumed
functional properties such as antioxidant activity until recently.

Methodology
37
Fruit samples of bacaba (Oenocarpus bacaba Mart.) and jenipapo (Genipa
americana L.) were acquired from small farmers and gathered in Tocantins State,
Brazil, during November and December of 2008, washed with water to remove debris
and dried manually (Figure 1). Fruits were selected and damaged units were
excluded. For bacaba fruit only seeds were discarded. Subsequently, samples were
lyophilized (LS 3000, Terroni, Brazil), milled in a knife mill (8500 rpm; 12 s) (Retsch,
Grindomix GM200, Germany), sealed under vacuum and stored in the dark in a
refrigerator (4 °C) until use (Figure 1). Additionally, water contents of original samples
were determined by drying at 105 °C ± 5 °C to constant weight to allow calculations
based on fresh weights of fruits (FW) (91). Consequently, all results are expressed
and referred to fresh weight contents of fruits.
2.3.2.2. Plant materials Fruit samples of bacaba (Oenocarpus bacaba Mart.) and jenipapo (Genipa
americana L.) were acquired from small farmers and gathered in Tocantins State,
Brazil, during November and December of 2008. Fruits were washed with water to
remove debris and dried manually. Afterwards, fruits were selected and damaged
units were excluded. Shell and seeds were removed from jenipapo, but for bacaba
only seeds were discarded. Then, samples were lyophilized (LS 3000, Terroni, Brazil)
and milled in a knife mill (Grindomix GM200, Retsch, Germany) at 8500 rpm for 12 s.
Powders were sealed under vacuum and stored in the dark and at 4°C until further
use.
2.3.2.3. Fruit Extract Preparation for HPLC analysis On the basis of methodology tests to establish optimal conditions for the quantitative
recovery of phenolic compounds (data not shown), aqueous acetone (80%; v:v) was
used for the extraction of phenolic compounds from bacaba fruit. Extracts were
prepared as described by Kammerer et al. (92). Briefly, aliquots of 50 mg were
weighed into conical flasks and extracted with 5 mL of solvent for 2 h under stirring

Methodology
38
after flushing with argon in order to prevent oxidation during extraction. The extracts
were centrifuged (10 min, 4000g). The combined supernatants were evaporated to
dryness in vacuum at 30 °C. For the HPLC analysis the residue was dissolved in 10
mL of acidified water (final pH= 2.25), whereas to the additional analyses the residue
was resuspended in PBS-
(final pH = 6.35).
2.3.2.4. Fruit Extract Preparation for biological assays with cells
Fruit extracts were prepared as described by Kammerer et al. (92) with slight
modifications. Aliquots of 20 g were weighted into conical flasks and extracted with
400 mL of solvent (80% acetone) for 2 h under stirring after flushing with argon in
order to prevent oxidation during extraction. The extracts were filtered and
centrifuged for 10 min at 4000 g. The supernatant was evaporated to dryness in
vacuum at 30°C and the residue dissolved in 100mL of PBS-
(Phosphate saline
buffer), resulting in a stock solution of 200 mg of fruit dry weight (DW)/mL. The final
solution was sterile-filtered aliquoted and kept in -80 °C until use.
2.3.3. Total phenolic contents, antioxidant and antiproliferative activities of bacaba and jenipapo phenolic extracts. 2.3.3.1. Total phenolics
The quantification of polyphenols was performed using the Folin-Ciocalteau (FC)
assay (93). Total phenolic contents were expressed as milligram of gallic acid
equivalents (GAE) per gram of fruit fresh weight (FW).
2.3.3.2. Total flavonoids The content of total flavonoids was assessed by the colorimetric aluminum chloride
assay described by Sariburun et al. (94) and adapted to microplate measurements in
our lab. Briefly, 20 µL of NaNO2 solution (10%) was added to 50 µL of catechin or

Methodology
39
sample dilutions into 96 well plates. After 5 min, 20 µL of AlCl3
(5%, m/v) was added
to each well and left for 6 min. Subsequently, 100 µL of 1M NaOH solution was
added, and absorbance was read at 510 nm with a microplate reader Synergy MX
(Biotek, USA). Results were expressed as mg of catechin equivalents (CTEq)/100 g
FW.
2.3.3.3. Total anthocyanins Total monomeric anthocyanin content was assessed by the pH-differential method
using two buffer systems - potassium chloride buffer, pH 1.0 (0.025 M) and sodium
acetate buffer, pH 4.5 (0.4 M) as described by Sellappan et al. (95) and adapted to
microplate volumes in our lab. Briefly, 20 µL of standard or sample solution were
pipetted into two different 96 well-plates and mixed with the respective buffers (180
µL). Subsequently, each plate was read at 510mn and 700 nm of absorbance. Wells
containing buffer without sample solution were used as blanks. Cyanidin-3-glucoside
was used as standard, and therefore results were expressed as mg of cyanidin-3-
glucoside equivalents (cyn-3-glcEq)/100 g FW. Absorbance (A) was calculated
according to the following formula (eq.2):
A= (A510 nm-A700 nm) pH 1.0 – (A510 nm-A700 nm) pH 4.5
eq.2
2.3.3.4. Oxygen radical absorbance capacity (ORAC) assay
The ORAC assay procedure applying fluorescein as a fluorescence probe was
performed according to the methodology developed by Cao and Prior (96). Briefly,
fluorescein in 20 mM CAPS solution, pH10 (Fluka, St. Louis, USA) was used as stock
solution and diluted in phosphate buffer solution pH 7.4 (PBS) to obtain a working
solution of 4 nM. AAPH (peroxyl radical was generated using 2,2`-azobis(2-amidino-
propane) dihydrochloride) was freshly prepared for each run at a concentration of 15
mM and kept in ice until automatic injection. Trolox (6 - hydroxy - 2, 5, 7, 8 -
tetramethylchroman-2-carboxylic acid) solutions were used for establishing
calibration curves (0, 6.25, 12.5, 25, 50, 100 µM) and were prepared daily from a 100

Methodology
40
µM stock solution stored at -80 °C. For each set of measurements, a standard curve
with trolox as reference was plotted. Analyses were performed using clear bottom
black 96-well plates (Greiner Bio-one Cellstar, Frickenhausen) and an automated
plate reader (Synergy MX, Biotek, USA). The exterior wells of the plate were filled
with 300 µL of water and pre-heated to 37 °C to avoid oscillation of temperature
during the analysis. Sample aliquots (25 µL) were mixed with 200 µL of fluorescein
solution (4 nM) and incubated for 30 min at 37 °C in the microplate. AAPH (25 µL)
was automatically injected, and the microplate was shaken for 20 s at fast mode.
Fluorescence readings (λexcitation = 485 + 20 nm and λemission
= 520 + 20 nm) were
registered each minute over 60 min. All samples were analyzed in three different
experiments with five wells for each dilution. Antioxidant activity was expressed as
µM of trolox equivalents (TE)/100 g fresh weight (FW) based on the calculation of the
area under the curve (AUC; eq. 3) and interpolation to the regression analysis of
trolox calibration curve.
AUC = 0.5 + (f2/f1) + (f3/f1) + (f4/f1) +........+ 0.5(f60/f1
) eq. 3
2.3.3.5. Trolox equivalent antioxidant capacity (TEAC) assay
This assay was performed as previously described by Re and Pellegrini (97). Briefly,
the radical was formed by mixing 0.5 mL of 20 mM ABTS in phosphate buffer (pH
7.4) with 95 mL of a 2.5 mM ABAP (2, 2’-azobis (2-amidinopropane hydrochloride)
solution. The solution was heated for 15 min at 60 °C and protected from light.
Subsequently, 190 µL of the radical solution was added to 10 µL of different dilutions
of fruit extracts (0.01-0.6 mg/mL) and trolox (5-140 µM) with an automatic injector.
Absorbance was monitored at 734 nm for 30 min. All samples were analyzed in
triplicate for each dilution. Antioxidant activity was expressed as µM TE/100 g FW
based on the calculation of AUC values and interpolation to the regression analysis
of trolox calibration curve (eq. 4).

Methodology
41
AUC = 0.5 + (f2/f1) + (f3/f1) + (f4/f1) +........+ 0.5(f60/f1
) eq. 4
2.3.3.6. Ferric reducing ability of plasma (FRAP) assay
The measurement of the reduction of the ferric 2, 4 ,6-tripyridyl-s-triazine complex
(Fe3+-TPTZ) to its ferrous form (Fe2+
98
-TPTZ) in the presence of antioxidants was
carried out as previously described ( ),(99) Briefly, FRAP solution was prepared by
mixing 30 mM acetate buffer (pH 3.6), 10 mM TPTZ and 20 mM FeCl3x6 H2O with a
ratio of 10:1:1 (v/v/v). FeSO4x7 H2O and trolox were used as standards to allow
further comparisons. A 1.0 mM stock solution of FeSO4x7 H2O and 1.5 mM stock
solution of Trolox were used for preparing different dilutions (0.02-0.14 µM and 15-50
µM, respectively) for the standard curves, and different dilutions of bacaba (0.5-2.5
mg/mL) were also performed in order to build a curve allowing the quantification in a
linear range of detection. A total of 150 µL of FRAP reagent was added to each well.
Additionally, 20 µL of standard or sample solutions were added. Absorbance was read
at 593 nm, and a well containing FRAP reagent without sample was used as blank.
FRAP values were calculated by the interpolation of trolox and FeSO4x7 H2
O
calibration curves
2.3.3.7. Free radical scavenging capacity (DPPH assay) The free radical scavenging capacity was analyzed by the DPPH assay in
accordance with the method described by Al-Duais et al. (100) and adapted to
microplate volumes in our lab. 100 µL of standard or diluted sample solution of
bacaba (0.01-0.5 mg/mL were mixed with 100 µL of DPPH (0.3 mM, ethanolic
solution). Methanol (200 µL) was used as control, and 100 µL of ethanol with 100 µL
of DPPH was used as a blank. A calibration curve was prepared with different
dilutions of trolox (10, 20, 40, 60, 80, 100, 120, and 140 μM). The absorbance was
measured at 510 nm for 30 minutes (101). Absorbance was converted to antioxidant

Methodology
42
activity (AA %). The radical scavenging activity (DPPH ●
) was calculated according to
equation 5:
AA% = 100-[(ASample- ABlank)*100/AControl
Where:
] eq. 5
ASample
A
= sample absorbance after 30 min of reaction;
Blank
A
= blank absorbance;
Control
= control absorbance
Results of DPPH reduction from samples were linearized and interpolated to the
standard trolox curve. Results were obtained from three independent experiments
and expressed in mM of trolox equivalents (TE)/100 g of fruit (FW).
2.3.3.8. Cell culture of HepG2 cells HepG2 cells were cultured in DMEM/Ham’s F12 with stable glutamine supplemented
with 10 % FCS and 1 % Penicilin/Streptomicin at 37 °C in a water-saturated
atmosphere with 5 % CO2
. Media was changed every two or three days and cells
were sub-cultured before reaching 80% confluency.
2.3.3.9. Cellular antioxidant activity assay (CAA) The cellular antioxidant activity assay was performed as described by Wolfe and Liu
(102). Briefly, HepG2 cells were seeded into a black 96-well-plate (Nunc, Denmark)
at a density of 6 x 10⁴ cells/well in 100 µL of growth media without phenol red to
avoid undesired background fluorescence. The outer wells of the plates were filled
with water to favor temperature stability during the assay. After incubation for 24 h
(37 °C; 5% CO2), growth media was removed by gently turning the plate upside-
down onto a towel paper soaked in 70% ethanol, and cells were washed with 100 µL
of Hanks´ Balanced Salt Solution (HBSS). Afterwards, cells were treated for 1 h with

Methodology
43
100 µL of fruit samples (37 °C; 5% CO2
102
). Different concentrations of fruit extracts
were prepared in media containing 25 µM of DCFH-DA and being devoid of phenol
red and FCS. Quercetin was used as a standard compound in different dilutions in
each plate as suggested by Wolfe and Liu ( ). After 1 h of treatment, media were
removed, and cells were washed again with 100 µL of HBSS. Subsequently, 600 µM
ABAP was applied to the cells in 100 µL HBSS. Control triplicates were treated with
DCFH-DA and ABAP but did not contain fruit extracts, and blank triplicates were
treated only with HBSS without ABAP. The outer wells, which were not used in the
beginning, were filled with 300 µL of sterile pre-warmed water (37 °C). Fluorescence
was read at 37 °C in a microplate reader (Synergy MX, Biotek, Bad Friedrichshall,
Germany) (λexcitation = 485 + 20 nm and λemission
= 538 + 20 nm) in 5 min intervals for
90 min. Wells were treated in triplicate for each extract concentration, and control and
blank wells were included containing only media plus DCFH-DA without fruit extracts.
At least three independent experiments were performed to determine cellular
antioxidant activity. Triplicates were used in each experiment for each extract
concentration. After blank subtraction the AUC values for the fluorescence versus
time plot were determined to calculate the CAA units for each fruit concentration
according to equation 6:
CAA unit = 1 – (∫SA / ∫ CA) eq. 6
with:
∫ SA = area under the sample fluorescence versus time curve
∫ CA = area under the control curve.
The median effective dose (EC50) was determined from the median effect plot of
log(fa/fu) versus log(dose), where fa is the fraction affected (CAA unit) and fu is the
fraction unaffected (1-CAA unit) by the treatment. EC50 is the concentration at which
fa/fu = 1, as calculated from the linear regression of the median effect curve. EC50
values are expressed as mean ± SD for triplicate data obtained from the same
experiment. In each experiment, quercetin was used as standard, and cellular

Methodology
44
antioxidant activities for fruit extracts were expressed as µM of quercetin equivalent
(QE) per 100 g of fruit (FW) and µM QE/100 µmol of phenolics.
2.3.3.10. MTT assay
HepG2 cells were seeded at a density of 2 x 10⁴ cells/well into 96-well-plates and
incubated for 4 h at 37°C in a 5 % CO2
atmosphere. Afterwards, media with fruit
extracts in different concentrations (400, 600, 800, 1000, 1200, 1400 µg/mL) were
added and the plate was further incubated for 96 h. As a negative control, culture
media without extracts was added and as a positive control, 2 % DMSO in culture
media was used in order to kill cells.
After incubation, the culture media including the extracts was removed by gently
turning the plate upside-down. Then the cells were washed with 100 µL of PBS-
before being incubated with 20 µL of MTT solution and 100 µL of culture media
without FCS. During 1 h of incubation, mitochondrial enzymes of viable cells reduce
the water-soluble yellow tetrazolium salt into violet formazan. As the formazan
product is generated in a solid form, a so-called “stop mix solution” (10% SDS (w/v),
0.6% acetic acid (v/v) DMSO (pH=4.5)) was added to the reaction in order to
solubilize the formazan crystals. Specifically, 100 µL of stop mix solution was added
and the plate was rocked at room temperature for 30 min. The absorbance was read
at 550 nm as a test wavelength and 630 nm as a reference wavelength. At least
three independent experiments with six replicates each were performed for each fruit
extract.
2.3.3.11. MUH assay
Cells were seeded at a density of 2 x 10⁴ cells/well in 100 µL of growth media without
phenol red in a black 96-well-plate. The plate was incubated for 4 h at 37 °C in a 5 %
CO2 atmosphere. Then 100 µL of growth media including the fruit extracts in different
concentrations were added. As a negative control, culture medium without extract

Methodology
45
dilution was added and as a positive control 2 % DMSO in culture media was used.
After incubation for 96 h, the culture media including the extracts was removed as
described above. Cells were washed with 100 µL of PBS- and treated with 100 µL of
MUH solution. For this, a stock solution of MUH (20 mg/mL) was diluted in PBS-
to a
final concentration of 100 µg/mL. After 30 min of incubation the emission was
measured at 460 nm with excitation at 355 nm.
2.3.3.12. MTT and MUH assay of cell-free fruit extracts
Fruit extracts were tested for undesired reactions between the reagents used in the
MTT and MUH assays and phenolic compounds of the extracts. To this end, the
same extract concentrations were prepared as for the MTT and MUH assay,
however, cells were excluded from the experiment. 100 µL of extracts in media
without FCS and 20 µL of MTT solution were added to 96-well plates. The plate was
incubated for 1 h (37 °C; 5 % CO2
), 100 µL of stop mix solution was added, the plate
was rocked for 30 min at room temperature and absorbance read at the same
conditions as for the original assay.
For the MUH test the same extract concentrations were prepared as for the original
assay. Different extract concentrations were prepared in PBS-
and 50 µL of these
extract dilutions were pipetted in a dark 96-well-plate. 100 µL of MUH solution (100
µg/mL) were added in each well and fluorescence was read after 30 min of
incubation with the same conditions as for the original assay.
2.3.3.13. Trypan blue assay
Cells were seeded in tissue culture dishes (60 x 15 mm) with 4 mL of culture media.
After 4 h of incubation at 37 °C in 5 % CO2, culture media was removed and replaced
for media including the fruit extracts in different concentrations. Negative control
plates for each fruit were included, containing only media without extracts and plates
containing 2 % DMSO in media were used as positive control. The plates were then

Methodology
46
incubated for 96 h. Afterwards cells were harvested by trypsination, centrifuged at
900 g and re-suspended in 1mL of PBS-
. Then, 40 µL of the cell suspension was
added to 40 µL of trypan blue solution (4%) and incubated for 2 min. Cells were
visualized under optical microscope (Telaval 31, Zeiss, Göttingen, Germany) where
blue and colorless cells were counted separately with a hematocytometer (Neubauer
chamber).
2.3.3.14. Methylene blue assay
HepG2 cells were plated at a density of 2 x 10⁴ cells/well in 100 µL of growth media
in each well of a transparent 96-well-plate. The plate was incubated for 4 h at 37 °C
in a 5 % CO2 atmosphere. Afterwards, media were replaced by growth media with
fruit extracts in different concentrations. As a negative control, culture media without
extract dilution was included and 2 % DMSO in culture media was used as a positive
control. After incubation for 96 h, the culture media including the extracts was
removed. Cells were washed with PBS- and stained with 50 µL of fresh methylene
blue solution (1 % glutaraldehyde, 0,6 % methylene blue in Hanks balanced salt
solution, w/v) and incubated for 1 h. The plate was washed three times in a bath with
ultrapure water and dried overnight. On the following day, 100 µL of a elution solution
(49% PBS-
, 50% Ethanol, 1% Acetic Acid) was added to each well and the plate was
shaken at room temperature for 15 min. Absorbance was read at 570 nm. The
resulting absorbance directly correlates with the number of viable cells.
2.3.4. Characterization of phenolic compounds of bacaba extract by HPLC-DAD-MSn
Because the availability of phenolic reference substances is limited and the
identification of structurally related plant secondary metabolites solely on the basis of
their UV/Vis spectra is impossible, and as HPLC coupled to mass spectrometry has
proven to be extremely helpful for peak assignment and further characterization of
individual substances, preliminary mass spectrometric analyses were performed with
Methodology
47
a Esquire 3000+ ion trap system (Bruker, Bremen, Germany) coupled to the HPLC
system described below (103). For this purpose, the residue obtained by freeze
drying was dissolved in 10 mL of water acidified with diluted HCl solution (pH 3.0).
Prior to phenolic compound enrichment, the solution was adjusted to pH 7.0 and
applied to SPE C18 cartridges. Subsequently, phenolic acids and flavonoids were
recovered by elution with methanol. Preliminary analyses were carried out using an
Agilent HPLC series 1100 equipped with ChemStation software, a model G1322A
degasser, a model G1312 binary gradient pump, a model G1329/G1330A
thermoautosampler, a model G1316A column oven, and a model G1315A diode
array detector (Agilent, Waldbronn, Germany). Different LC (liquid chromatography)
systems for phenolic acid and anthocyanin separation were tested, and analyses
were performed according to a method described by Kammerer et al. (92). Different
injection volumes (ranging from 20 to 40 μL) and concentrations of the samples
(ranging from 20 to 200 mg/mL) were tested in order to optimize separation
conditions for further HPLC analysis using the systems described below.
System I (anthocyanins)
: The mobile phase consisted of water/formic acid (95:5, v/v;
eluent A) and water/formic acid/methanol (10:10:80, v/v/v, eluent B) using a gradient
system. Monitoring was performed at 520 nm at a flow rate of 0.4 mL/min. Total run
time was 78 min.
System II (colorless phenolics)
: The mobile phase consisted of 2% (v/v) acetic acid in
water (eluent A) and 0.5% acetic acid in water and methanol (50:50, v/v, eluent B).
Total run time was 72 min. Simultaneous monitoring was performed at 280 nm and at
320 nm at a flow rate of 1.0 mL/min.

Methodology
48
2.3.5. Chemopreventive effect of bacaba Phenolic Extract on MCF-7 cells 2.3.5.1. Cell culture of MCF-7 cells
MCF-7 cells were cultivated in tissue culture flasks at 37 °C in 5% CO2
water-
saturated atmosphere. Cells were cultured and passaged in DMEM high glucose
supplemented with 10% of FCS, 1% Penicilin/Streptomicin (PAA, Pasching, Austria)
and 10 µg/mL insulin. Cells were passaged at pre-confluent densities using 0.25%
Trypsin-EDTA solution (PAA, Pasching, Austria).
2.3.5.2. Measurement of cell proliferation
Cell proliferation was measured as previously described (104). Briefly, MCF-7 cells
were seeded at a density of 2 x 10⁴ cells/well into 96-well-plates and incubated for 4
h at 37°C. Afterwards, media with fruit extracts (final concentration 0-1000 µg/mL)
were added and the plate was incubated for 96 h at 37 °. Culture media including the
extracts were removed and cells were washed with 100 µL of PBS-. 20 µL of MTT
solution and 100 µL of culture media without FCS was added and incubated for 1 h
(37 °C; 5 % CO2
). Then, 100 µL of stop mix solution, an acidified solution of DMSO,
was added and the plate was rocked at room temperature for 30 min. Absorbance
was read at 550 nm as a test wavelength and 630 nm as a reference wavelength. At
least three independent experiments with six replicates were performed to determine
cell proliferation.
2.3.5.3. Morphology assessment
Cells were seeded at 60 mm dishes. After 24 h medium was replaced by bacaba
extracts diluted in growth medium (final concentration 0 - 800µg/mL). After 72h of
incubation cells were visualized in an optical microscopy with 10x and 32x objectives.

Methodology
49
2.3.5.4. Ethidium Bromide/Acridine Orange Assay A stock solution was prepared by dissolving 50 mg Ethidium Bromide and 15 mg of
Acridine Orange (EB/AO) in 1 ml 95% ethanol and 49 ml distilled water. This solution
was aliquoted and stored frozen at -20°C. A working solution was prepared diluting
the stock solution (1:1000 in PBS). For each 500 μl of cell suspension tested, 25 μl of
the dyes mixture was added. 5 x 10⁴
MCF-7 cells were seeded on coverslips in 24
well-plates. After 24h cells were incubated with bacaba extract (250 μg/mL) for 72 h.
Then, cells were washed twice with PBS and stained with 300 µL of EB/AO working
solution. Cells were washed three times with PBS and mounted on glass slides with
Fluoromount G. Cell visualization was performed in a fluorescent microscope using
the Axioplan microscope with 20x, 40x and 100x objectives.
2.3.5.5. DNA fragmentation assay DNA fragmentation was assessed by agarose gel electrophoresis and Ethidium
Bromide staining as previously described by Gong (105). MCF-7 cells were plated at
60-mm plates. After 24h, different concentrations (0 - 500μg/mL) of bacaba extracts
in growth medium were added and incubated for 72 hours. Then, cells were
harvested by trypsinization, centrifuged at 200 g for 5 min and resuspended in 1mL
Hank’s Buffered Salt Solution (HBSS). Cells were transferred into 10mL of ice-cold
70% ethanol and store at -20 °C for 24 hours. Afterwards, samples were centrifuged
at 800 g for 5 min and ethanol was removed. The cell pellet was resuspended in
40μL of phosphate-citrate buffer (PCB), consisting of 192 parts of 0.2M Na2HPO4
and 8 parts of 0.1M citric acid (pH 7.8) and incubated for 30 min. Then, cells were
centrifuged at 1000 g for 5 min and supernatant transferred to new test tubes. After 3
μL of 0.25% of the non-ionic detergent IGEPAL CA-630 and 3 μL of RNase (1mg/mL
in water) were added to the samples and incubated for 30 min at 37°C. Thereafter, 3
μL of proteinase K (Qyagen) was added to the samples and incubated for another 30
min at 37°C. Loading dye (Fermentas) was added to the samples. Samples were
loaded into 1.5% agarose gel (w/v) and ran at 60V for 4h. MassRuler™ DNA Ladder

Methodology
50
Mix (Fermentas) was used as ladder and DNA was detected via Ethidium Bromide
under UV light.
2.3.5.6. Annexin V and PI double staining assay
3 x 10⁵
cells were seeded into 60mm dishes and incubated for 24h. Afterwards, cells
were treated with different concentrations of bacaba extracts (0 - 1000µg/mL).
Staurosporin (STS) 2µM was used as a positive control. After 24 h of incubation,
cells were harvested with Accutase (including dead cells), washed and transferred
into test tubes. Cells were centrifuged for 5 min at 900 g. The cell pellet was washed
with 1 mL FACS Cell Wash. Cells were resuspended in 1 mL of 1x binding buffer and
passed through a cell strainer (0.7µm) to exclude cell clumps. Then, cells were
stained with 7 µL Annexin V-FITC (BD Biosciences, San Diego, California) and 10 µL
PI (BD Biosciences ) for 15 min at room temperature in the dark and subsequently
analyzed by flow cytometry (FACS Canto, Benton Dickson) using FACS Diva
software.
2.3.5.7. Estimation of cell volume
Relative cell volume was estimated by flow cytometry using forward side scatter
(FSC) of the flow cytometry analysis. Cells were incubated with different
concentrations of bacaba (0-1000µg/mL) for 24 h and submitted to flow cytometry
analysis (FACS Canto, Benton Dickson).
2.3.5.8. Measurement of mitochondrial membrane potential (ΔΨm) Mitochondrial membrane potential (ΔΨm) was assessed by the mitochondrial voltage-
sensitive dye 5,5’ ,6,6’-tetrachloro-1,1’ , 3,3’ – tetraethylbenzimidazole carbocyanide
iodide (JC-1, Biotium, USA). Mitochondria with integral membrane potential
concentrate JC-1 into aggregates that show red fluorescence. De-energized
mitochondria cannot concentrate JC-1 and show green fluorescence. Briefly, 3 x 10⁵

Methodology
51
cells were seeded into dishes and incubated for 24 h. Then, cells were washed once
with PBS and stimulated with different concentrations of bacaba extract (0 -
1000µg/mL) for different time points (0, 3, 6 h). Cells were washed twice with PBS/
FACS CellWash (BD Biosciences), respectively, and incubated with 2mL JC-1
working solution (1.6 µM) for 20 minutes. Subsequently, cells were washed again
twice with FACS CellWash, harvested with Trypsin/ EDTA and resuspended in 2 mL
media. Cell pellet was obtained through centrifugation (900 g; 5min) and washed with
FACS Cell Wash solution and resuspended in 500 µL phenol red free medium.
Samples were protected from light exposure and analyzed by flow cytometry (FACS
Canto) using FACS Diva software.
2.3.5.9. Determination of caspase-9 activity
3 x 10⁵
cells were seeded into 60mm petri dishes and incubated for 24 h. Afterwards
cells were treated with different concentrations of bacaba extracts (0 - 1000µg/mL).
Staurosporin (STS) 2µM was used as positive control. After 24 h of incubation, cells
were harvested, washed and transferred into test tubes. Cells were centrifuged for 5
min at 900g. The cell pellet was washed with 1 mL FACS Cell Wash. Cells were
stained with 0.5 µL of FITC-LEHD-FMK (Biocat, Heidelberg, Germany). Additionally,
500 µL pre-warmed phenol red free media without FCS was added and cells were
incubated at 37 °C for at least 45 min. Afterwards cells were washed with 500 µL
Wash Buffer, centrifuged at 900 g for 5 min. The supernatant was removed and cells
were resuspended in 300 µL of Wash Buffer. Samples were analyzed by flow
cytometry (FACS Canto) (FACSCanto) using FACS Diva software.
2.3.5.10. Determination of caspases-6 and -8 activities Cells at 70% of confluence were stimulated with bacaba extract (0 -1000µg/mL) for
24 h. Cells incubated with thapsigargin (2µM) for 24h or TNF- alpha (100ng/mL) for
8h were used as positive, unstimulated cells as negative controls. After exposition,
cells were washed twice with PBS and harvested with a cell scraper. Cell pellet was

Methodology
52
obtained through centrifugation at 900 g 5 min and the supernatant was replaced by
70 µl of chilled/ ice cold cell lysis buffer. The suspension was transferred to a test
tube and incubated on ice for 30 min. Afterwards, the cell lysate was centrifuged at
/2000 g at 4°C. The supernatant containing cytoplasmic proteins was transferred into
new test tubes. Samples were stored at -20°C. Protein determination was performed
with Bio Rad DC. The enzymatic activity of the caspases -6 and -8 induced by
bacaba extract was assessed using a fluorometric assay kit (Biocat) based on
detection of cleavage of the specific substrate, according to the manufacturer’s
protocol. 10 µg of the protein was incubated with 20 µL of Reaction Buffer containing
DTT (10mM) and and 1.6 µL substrate (Ac-VEID-AFC for caspase-6 or Z-IETD-AFC
for caspase-8) at 37°C for 2 h. The fluorescence of the reaction mixture was
quantified using a microplate reader with a 400 nm excitation filter and a 505 nm
emission filter.
2.3.5.11. Assessment of PARP (Poly (ADP-ribose) polymerase
) cleavage
Cells were seeded into small tissue culture plates (60 mm) with normal culture media
for 24 h. When cells were approximately 70 % confluent, the plates were incubated
with the extracts diluted in media without FCS. As a positive control staurosporine
(1µM) was included. After 24 h and 48 h of incubation with fruit extracts, plates were
washed twice with 2 mL of ice-cold PBS-
. Then 200 µL of lysis buffer (20mM Tris-
HCL (pH 7.5), 150mM NaCl, 10mM NaF, 1mM EDTA, 1% Triton X -100; 0.4mM
PMSF, 10μg/mL aprotinin, 10μg/mL leupeptin, 10μg/mL pepstatin) was added to
each plate, cells were scrapped off and transferred into 1.5 mL test tubes and
incubated on ice for 30 minutes on ice. Then, cells were centrifuged at 13.000 g for 5
min at 4 °C. The supernatant was collected and stored at -80°C for later use. PARP-
cleavage was assessed by western blotting. In some experiments the specific
caspase-9 inhibitor Z-LEHD-VAD (BD Biosciences, San Diego, USA) was included.

Methodology
53
2.3.5.12. Western Blotting
50-100 µg of protein for each sample was loaded onto 10% SDS-polyacrylamide gel
together with a prestained molecular weight marker (ColorPlus Prestained Protein
Ladder, New England, Biolabs). Proteins were separated at 100V for 85min, then
transferred to a polyvinylidene membrane (Roti-PVDF, Carl Roth, Germany) which
was afterwards blocked with 5% (w/v) skim milk powder in TBS-Tween (TBST) for 1
hour. The membrane was incubated with primary anti- PARP antibodies (Cell
Signaling Technology, Beverly, USA) (1:1000) overnight. Subsequently, blots were
washed extensively with TBST and incubated with horseradish peroxidase-linked
goat anti-rabbit IgG (1:2000) (Amersham) in TBST containing 5% (w/v) of skim milk
at room temperature for 1 hour. Bands were visualized by enhanced
chemiluminescence (ECL, Thermo scientific).
2.3.5.13. Statistical analysis
All analyses were carried out at least in three independent experiments with six
replicates each and data was reported as mean ± SD. Means were compared with
ANOVA followed by Tukey’s test (p < .05) using XLSTAT software. Correlation
analyses were performed using SPSS version 18.Curve fitting and calculation of IC50
values were done using a nonlinear regression model using Graphpad prism version
5.

Results
54
3. Results
3.1. Nutrition Survey 3.1.1 Socioeconomic, health and food security assessment of two rural communities in the region of APA/Cantão, Tocantins state (Brazilian Amazon Region)
The socioeconomic, health and food security situation of families was assessed by
the methodology of Living Standard (106). According to Doppler (1993) living
standard is a multi-dimensional phenomenon and it is determined by criteria, such as
family income, possession of goods, supply of water, housing and sanitary
equipment, health conditions, as well as food supply and food security. Therefore,
this section presents the living standard of farm families in the study area aiming to
better understand their current situation. The most relevant resources in farm families
can be separated into natural and man-made resources, of which the former are
basic and limited and therefore play an extremely important role in the farm sector.
Based on this, the objective of the present section is to identify and analyse the
resource endowment and therefore provide information about the families’ options for
decision making.
Table 5 presents the main results regarding the family size and its composition in the
study area. The family size averages around 4.74 persons per family, which is slightly
lower than the mean for rural areas in the northern Brazil (4.9 persons per family)
(107).

Results
55
Table 5: Family size and its composition, Tocantins, 2008
Item Family farmers
(n=57)
Mean SE
Family size 4.74 0.28
N. people under 18 years old 1.89 0.25
N. years living in the settlement 7.6 0.42
In Figure 10 is displayed the women’s share as a household head. It is interesting to
point out that the results from the study area are higher (24.6%) if compared to those
of other rural areas in the northern Brazil where only 9.2% of households are
commanded by women. Even when one compares the figures to Brazil as whole,
Tocantins has a larger participation of women as household heads, since just 12.8%
of households in rural areas of Brazil have a woman as the family head (107).
Figure 10: Gender distribution of household head , Tocantins, 2008. Source: author. Notes: female
(24.6%), male (63.2%), both (12.3%).
With regard to land resources, when inquired about the deforestation of native
forests, around 30% of families responded positively, i.e. they have cut down the
forest in order to start crop cultivation or pasture formation. This figure depicts the
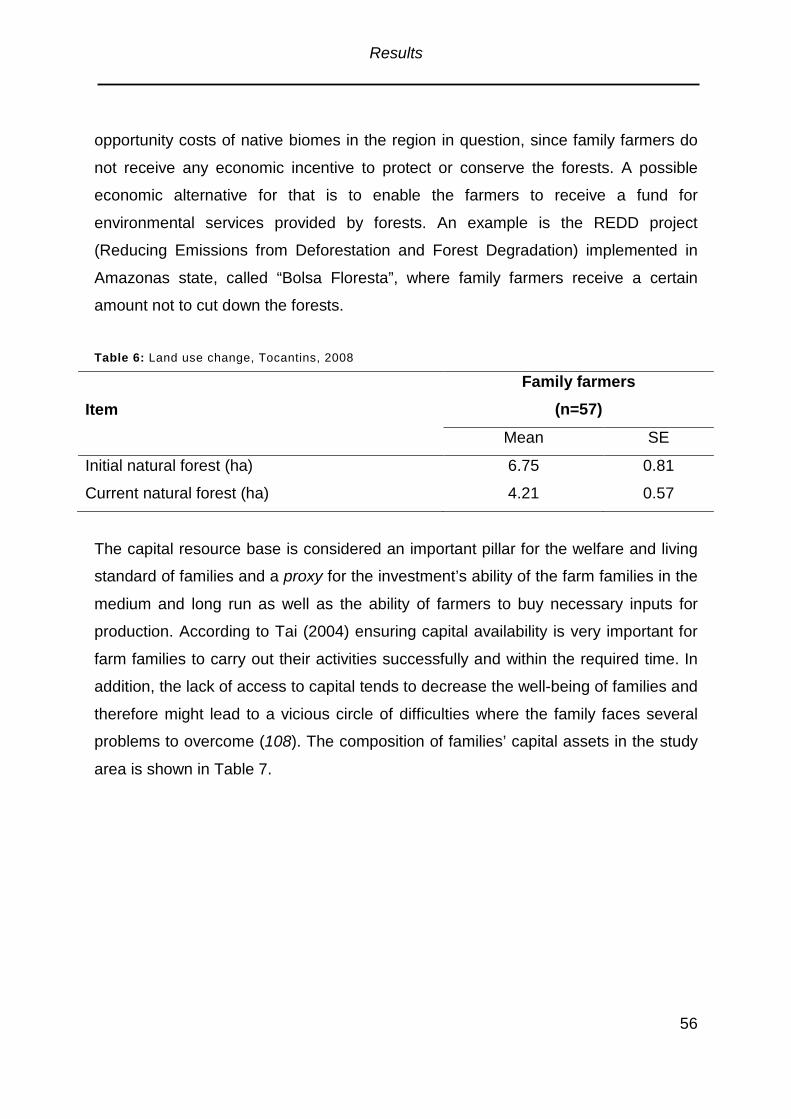
Results
56
opportunity costs of native biomes in the region in question, since family farmers do
not receive any economic incentive to protect or conserve the forests. A possible
economic alternative for that is to enable the farmers to receive a fund for
environmental services provided by forests. An example is the REDD project
(Reducing Emissions from Deforestation and Forest Degradation) implemented in
Amazonas state, called “Bolsa Floresta”, where family farmers receive a certain
amount not to cut down the forests.
Table 6: Land use change, Tocantins, 2008
Item
Family farmers (n=57)
Mean SE
Initial natural forest (ha) 6.75 0.81
Current natural forest (ha) 4.21 0.57
The capital resource base is considered an important pillar for the welfare and living
standard of families and a proxy for the investment’s ability of the farm families in the
medium and long run as well as the ability of farmers to buy necessary inputs for
production. According to Tai (2004) ensuring capital availability is very important for
farm families to carry out their activities successfully and within the required time. In
addition, the lack of access to capital tends to decrease the well-being of families and
therefore might lead to a vicious circle of difficulties where the family faces several
problems to overcome (108). The composition of families’ capital assets in the study
area is shown in Table 7.

Results
57
Table 7: Possession of goods by farm families, Tocantins, 2008
Family farmers (n=57)
Possession of goods Absolute Frequency
(n)
Relative Frequency
(%)
Fridge
No 12 21.1
Yes 45 78.9
Television
No 5 8.8
Yes 52 91.2
Radio
No 23 40.4
Yes 34 59.6
Small wash machine
No 17 29.8
Yes 40 70.2
Motorcycle
No 34 59.6
Yes 23 40.4
Car
No 43 75.4
Yes 14 24.6
As one can see in Table 7, the major part of farm families have access to basic
goods such as fridge, television, radio, as well as a small washing machine. It is
important to note that the currently low number of households deprived of those
goods and services can be explained, at least in part, by the easy access to formal
credit which was fostered by the federal government during the last years. However,
regarding means of transport, one can notice that a significant part of family farmers
still possesses neither a motorcycle nor a car, and therefore has to rely on public

Results
58
transportation in order to sell their products at the market or to reach a hospital, for
instance. It is noteworthy that television is considered an important good for families,
since owing this device (91.2%) is more relevant than owing a fridge (78.9%).With
regard to credit, the percentage of farm families who received formal credit in the last
24 months is considerably high, 73.7% on average, showing that this kind of financial
support is usual and common in the study area (Table 8). However, although many
farm families report that the formal access to credit lines, such as PRONAF (National
Program for the Family Agriculture), is not difficult, many of them default since they
cannot access further credits until they have paid back the amount already borrowed
and interest rates.
Table 8: Credit access by families, Tocantins, 2008
Family farmers (n=57)
Item Absolute Frequency
(n)
Relative Frequency
(%)
Access Credit
No 15 26.3
Yes 42 73.7
The farm and off-farm revenues and therefore the family income were assessed and
analyzed; they are presented in Table 9 In the present study, farm income was
calculated for the year of 2007. Off-farm income, on the other hand, is the income
generated by all activities exerted by members of the family inside (non-agricultural
activity) or outside the rural property (agricultural activity and/or non-agricultural
activity) as well as from pensions and governmental transfers. Based on that, Marini
and Pierroni (109) show that the family as an active unit presents three basic
characteristics: (i) linkages between the production and reproductive spheres: (ii)
internal relationship among members defined by gender, age and labor capacity; and
(iii) the social position in the family life cycle. So the family is transformed in a multi-

Results
59
dimensional unit where both agricultural and non-agricultural activities are practiced
and generate different sorts of revenues. Based on this, the concept of pluri-activity
emerges which is related with the operation of multiple activities by members of the
same family (109). In addition, according to Berdegue, Reardon and Escobar, the
rural non-agricultural job is responsible for 40% of the rural inhabitants’ income in
Latin America (110).
As one can see in Table 9, off-farm income is higher than farm income among farm
families in the region. These figures corroborate a study carried out by Reardon and
Vosti (111), which shows that the non-agricultural incomes are extremely important to
rural communities and in many cases are the only source of income for those
families. With regard to social cash transfer programs, more than 60% of families are
depending on Federal and/or state programs of income transfer, as shown in Figure
11.
Table 9: Composition of family income, Tocantins, 2008
Income and revenue (R$/year) Family farmers
(n=57)
Mean SE
Farm income 4427.49 1072.32
Off-farm income 6017.90 863.27
Family income 10090.08 1256.72
With regard to social assistance, 61.4% of families declared to be included in social
assistance programs i.e., to receive money from federal (Bolsa Família Program) or
State (Pioneiros mirins) programs Figure 11.

Results
60
Figure 11: Social assistance from federal and/or state government.Notes: no (31.6%), yes (61.4%)
The focus of the following data are some living standard criteria that are related to the
living standard of families such as: food supply and food security, supply of water,
housing and energy, health conditions and social security. These criteria include the
supply of basic goods and services that are the minimum for the farm family’s
survival and therefore must be satisfied.
Table 10 shows the basic infrastructure present (or not) inside the farm family’s
house. As one can observe, although almost 90% of families have access to treated
water, only 24.6% of them possess toilet facilities inside the house. And, regarding
the quality of water, just 1 smallholder (or 1.8%) reported that his water has a bad
quality whereas 52,6% reported that the water has a very good quality. Regarding the
garbage, since there is no collection, the most part of families burn it (93%) or leave it
exposed outdoor (7%) what can be a source of different types of diseases.

Results
61
Table 10: Housing, water, garbage and energy facilities, Tocantins, 2008Housing, water, garbage and energy
facilities, Tocantins, 2008
Item
Family farmers (n=57)
Absolute Frequency
(n)
Relative Frequency
(%)
Toilet facilities at home
No 43 75.4
Yes 14 24.6
Energy used for cooking
Wood 46 80.7
Gas 11 19.3
Quality of water
Very Good 30 52.6
Good 19 33.3
Regular 7 12.3
Bad 1 1.8
Treated water
Yes 51 89.5
No 6 10.5
Garbage
Burn 53 93
Outdoor exposed 4 7
As shown in Figure 12, food self-production is not sufficient to feed the family in almost 60% of family farms i.e. they are considered net food buyers and therefore need to acquire food from the local markets.

Results
62
Figure 12: Self-production is enough to feed the family. Tocantins, 2008
The food and nutrition security condition was measured by the Brazilian Scale of Food Insecurity (EBIA), a validated instrument to measure food security in Brazilian studies (83). The majority of families were afflicted with food insecurity (84.2%), mostly (40.3%) expressed as a mild food insecurity situation (Table 11). Table 11: Food and nutrition security condition of families, Tocantins, 2008
Food security
Family farmers (n=57)
n %
With Food security 9 15.5
With Food insecurity 48 84.2
Level of Food Insecurity
Mild Food Insecurity 23 40.3
Moderate Food Insecurity 16 28.1
Severe Food Insecurity 9 15.5
According to Kitchaicharoen (112), social security is defined as security of the
families in the future (113). Moreover, social security may comprise the social capital
that farm families have built up with the aim to support them and therefore minimize
risks, uncertainty and vulnerability whenever facing natural and/or man-made
catastrophes. In addition, social capital is related to norms, institutions and
organizations that promote the trust, reciprocity and cooperation among its members.
Thus, social security is hereby expressed through the farm families’ social capital. On
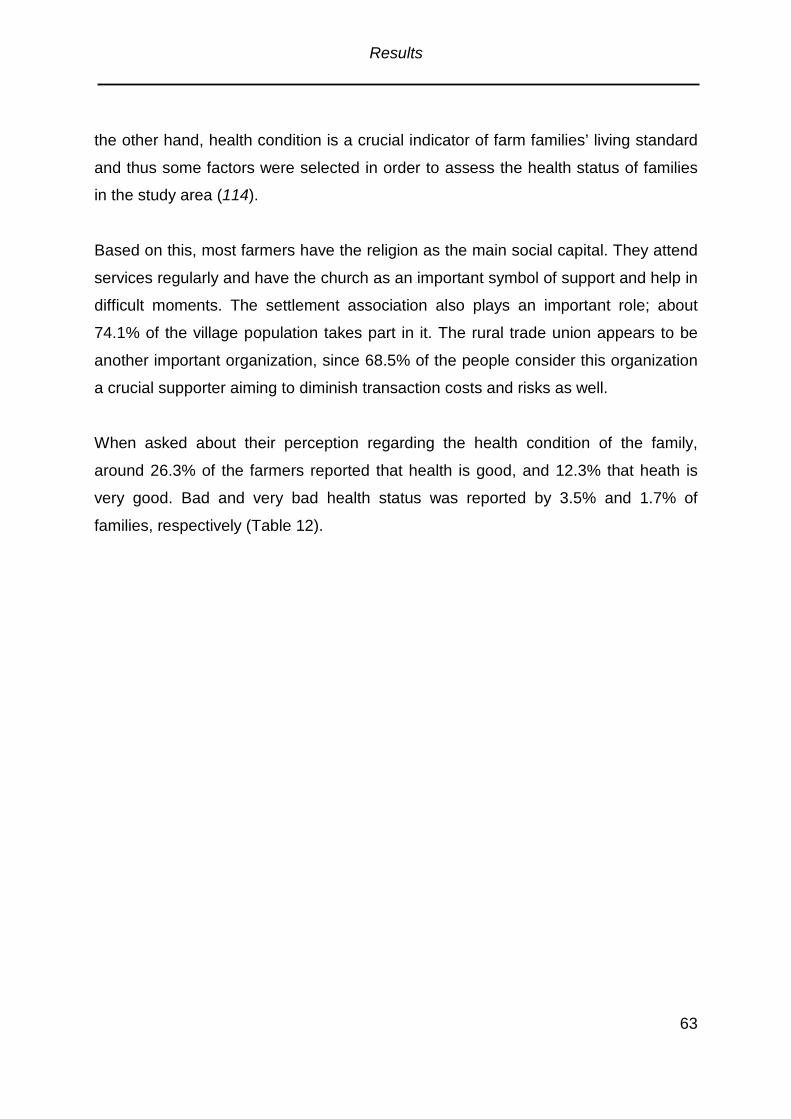
Results
63
the other hand, health condition is a crucial indicator of farm families’ living standard
and thus some factors were selected in order to assess the health status of families
in the study area (114).
Based on this, most farmers have the religion as the main social capital. They attend
services regularly and have the church as an important symbol of support and help in
difficult moments. The settlement association also plays an important role; about
74.1% of the village population takes part in it. The rural trade union appears to be
another important organization, since 68.5% of the people consider this organization
a crucial supporter aiming to diminish transaction costs and risks as well.
When asked about their perception regarding the health condition of the family,
around 26.3% of the farmers reported that health is good, and 12.3% that heath is
very good. Bad and very bad health status was reported by 3.5% and 1.7% of
families, respectively (Table 12).

Results
64
Table 12: Heath condition of farm families, Tocantins, 2008
Item
Family farmers (n=57)
Absolute Frequency (n) Relative Frequency
(%)
Health status
Very good 7 12.3
Good 15 26.3
Regular 32 56.1
Bad 2 3.5
Very bad 1 1.7
Use of traditional methods for health care
Yes 56 98.3
No 1 1.7
Health assistance
Public 54 93.1
Private 3 5.2
Evaluation on Local Health Public Service
Very good 2 3.5
Good 10 17.5
Regular 25 43.9
Bad 6 10.5
Very bad 14 24.6
As one can deduce from Table 12, except for 1 family (1.7%), all other farm families
interviewed responded positively towards the use of traditional methods for health
care (98.3%). Regarding the type of health assistance (public or private), 93.1% of
families have access to the public service (SUS) since they cannot afford a private
health service. When inquired about the quality of the public health service, 43.9% of
families reported that it is regular. Nevertheless, a significant part of families found it
to be bad (10.5%) or very bad (24.67%), respectively. Thus, one can note that a
substantial percentage of families were not satisfied with the quality of public health
services, which in some cases may aggravate the health condition of a family
member.

Results
65
3.1.2. Nutritional situation of adults of two rural communities in the region of APA-Cantão, Tocantins state (Brazilian Amazon Region) The results of the nutritional status of the adults of the two rural settlements studied
are shown in Table 13. The mean (+ standard deviation) age of the study population
was 44.0 + 12 years for women and 47.0 + 15.0 year for men. The mean length of
education was 4.8 + 4.3 years for men and 3.7 + 3.6 years for women which
corresponds to a basic level of education for both genders. Family income/year
(Brazilian Real) was R$ 8599.57 + 7193.84 for males and R$ 10130.34 + 10058.09
for females. Although females had a slightly higher family income, there was no
significant difference between them.
Men were significantly taller than women (p < .05), 1.65 + 0.07 vs. 1.52 + 0.06. The
mean BMI of females was higher (26.6 + 4.31) than the BMI of males (24.4 + 3.58) (p
< .05). Waist circumference (WC) was 86.4 +10.24 for females and 85.79 + 10.24 for
males. Results with main characteristics of the sample are shown in Table 13.
Table 13: Subjects Characteristics
Gender
Male (n=58)
Female (n= 50)
Characteristics Mean + SD Mean + SD p-value
Age (years) 47.0 + 15.0 44.0 + 12.0 .27
Education (years) 3.7 + 3.6 4.8 + 4.3 .19
Family income/year (Brazilian Real) 8599.57 + 7193.84 10130.34 + 10058.09 .54
Weight (Kg) 66.60 + 11.07 61.97 + 10.85 .31
Height (m) 1.65 + 0.07 1.52 + 0.06 <.001
BMI (kg/m²) 24.4 + 3.58 26.6 + 4.31 .04
Waist circumference (cm) 85.79 + 10.24 86.4 + 10.8 .73
*p < .05
The health profile of the study population is shown in Table 14. Most people lived
with partners (76.9%). The overall consumption of alcohol and tobacco were 32.4%

Results
66
and 38.9%, respectively. Men were more often smokers (50.0%) and consumed
more alcohol (42.0%) than women (29.3% and 24.1%, respectively). The prevalence
of NCD for the whole sample was 27.8% showing the same trend pointed out by
another study (21). Table 14: Health Profile of the study population
Gender Combined
Female Male χ2
Sample profile Absolute
Frequency
(n)
Relative
Frequency
(%)
Absolute
Frequency
(n)
Relative
Frequency
(%)
Absolute
Frequency
(n)
Relative
Frequency
(%)
p-value
Gender 58 53.7 50 46.0 108 100
Living with partner
Yes 45 77.6 38 76.0 83 76.9 .84
No 13 22.4 12 24.0 25 23.1
Smoking
Yes 17 29.3 25 50.0 42 38.9 .02
No 41 70.7 25 50.0 66 61.1
Alcohol Consumption
Yes 14 24.1 21 42.0 35 32.4 .02
No 44 75.9 29 58.0 73 67.6
Non Communicable Diseases
Yes 16 27.6 14 28.0 30 27.8 <.001
No 42 72.4 36 72.0 78 72.1
Diabetes
Yes 3 5.2 1.0 2.0 4 3.7 .12
No 55 94.8 49.0 100 104 96.3
Hypertension
Yes 15 25.9 14 28.0 29 26.9 .19
No 43 74.1 36 72.0 79 73.1
Cancer
Yes 0 0 0 0 0 0
No 58 100 50.0 100 108 100
Communicable Diseases
Yes 2 3.4 6 12.0 8 7.4 .14
No 56 96.6 44 88.0 100 92.6
Nutritional Profile (BMI)
Underweight 1 1.7 0 0.0 1 0.9 .01
Eutrophic 18 31.0 31 62.0 49 45.4
Overweight 28 48.3 14 28.0 42 38.9
Obesity 11 19.0 5 10.0 16 14.8
*p < .05

Results
67
3.7% of the study population presented with diabetes and 26.9% had hypertension.
Despite the prevalence of NCD, communicable diseases such as leishmaniasis and
hanseniasis were also prevalent among participants (7.8%). This result reflects the
epidemiological transition characteristics of developing countries which is still
experienced in Brazil (21). In the same context, the nutrition transition was also
recognized as only one participant was underweight and the prevalence of
overweight was 38.9% for the whole sample, being even higher among women
(48.3%).
Overweight and obese adults together make up 60.2% of the study sample and were
considered as one group named as “overweight”. Anthropometric profiles of the
eutrophic and overweight adults are compared in Table 15.
Weight, BMI and WC were different between eutrophic and overweight groups for
both gender. The mean weight for eutrophic men was 61.15 + 7.73 kg whereas for
overweight men it was 76.31+ 9.41. The BMI for eutrophic men was 22.16 + 1.57
whereas for the overweight group was 28.33 + 2.58 kg. Similar results were obtained
for women whose mean BMI values were 22.67+ 2.02 kg for eutrophic and 29.02 +
3.22 for overweight persons. Also, overweight subjects had higher WC values than
eutrophic ones.
Table 15: Anthropometric profile of eutrophic and overweight adults
*p < .05
Eutrophic Overweight
Men
(n=32)
Women
(n=20)
Men
(n=18)
Women
(n=37)
Anthropometric data Mean + SD Mean + SD Mean + SD Mean + SD
Age (years) 46.00 + 15.14 42.10 + 15.53 48.00 + 15.40 45.64 + 10.91
Weight (Kg) 61.15 + 7.73* 53.72 + 7.14* 76.31 + 9.41 66.97 + 9.22
Height (m) 1.65 + 0.07 1.53 + 0.07 1.64 + 0.07 1.51 + 0.05
BMI (kg/m²) 22.16 + 1.57* 22.67 + 2.02* 28.33 + 2.58 29.02 + 3.22
Waist circumference (cm) 79.75 + 5.75* 78.32 + 7.71* 96.52 + 7.17 91.51 + 8.86

Results
68
Table 16 describes the average daily energy intake and expenditure of subjects.
There was no difference between eutrophic and overweight adults. Eutrophic
individuals had higher mean values of PAL than overweight persons for both gender.
TEE was significantly lower between eutrophic and overweight women, showing no
difference in men. There was no difference between energy intakes of eutrophic or
overweight groups. Eutrophic men energy intake was 1466.32 + 901.78 kcal/d and
that of overweight men was 1411.75 + 565.44 kcal/d. Similar results were found for
women, eutrophic women consumed 1889.07 + 910.07 kcal/d and overweight
1957.77 + 1170.35 kcal/d.
Table 16: Dietary variables (Energy) and Physical activity levels (PAL) of eutrophic and overweight
adults*
Eutrophic Overweight Men
(n=32) Women (n=20)
Men (n=18)
Women (n=37)
Daily energy intake Mean+SD Mean+SD Mean+SD Mean+SD
Energy intake (kcal) 1466.32 + 901.78 1889.07 + 910.07 1411.75 + 565.44 1957.77 + 1170.35
Kcal/kg body weight 24.95 + 17.35 36.28 + 20.33 18.89 + 7.89 29.89 + 19.53
Basal metabolic rate (BMR) 1525.08 + 149.09* 1269.88 + 116.16* 1675.64 + 179.16 1454.21 + 145.97
Physical activity factor (PAL) 1.88 + 0.19* 1.50 + 0.20* 1.68 + 0.28 1.42 + 0.10
Total Energy expenditure (TEE) 2873.82 + 901.78 1913.16 + 324.54* 2831.95 + 615.34 2072.15 + 269.26
EB (EI – TEE) (Kcal) -1407.49 + 956.41 -24.09 + 920.60 -1420.20 + 968.46 -114.38 + 1181.81
*p < .05
There was no statistical difference between the groups with regard to the intake of
protein, kilocalories from protein and percentage of energy from protein. The daily
intake of carbohydrate in grams and energy (Kcal) was higher in the eutrophic
groups. However, there was only a statistically significant difference (p < .05)
between eutrophic and overweight for both genders when carbohydrate uptake was
expressed as g/Kg body weight. Eutrophic men had a higher intake of fat than
overweight (p < .05). Eutrophic women had higher daily intake of fat than overweight
when it was expressed as g/kg body weight. Table 17 also shows the fiber intake.
There was no difference in fiber consumption between the groups.

Results
69
Table 17: Macronutrients daily intake of eutrophic and overweight adults*
Eutrophic Overweight Macronutrients Men
(n=32) Women (n=20)
Men (n=18)
Women (n=37)
Mean+SD Mean+SD Mean+SD Mean+SD
Protein (g) 103.07 + 81.56 67.32 + 32.83 96.04 + 47.27 75.71 + 54.44
Protein (Kcal) 412.30 + 327.46 269.28 + 131.33 384.19 + 189 302.83 + 217.73
Protein (%energy) 22.04 + 7.45 21.83 + 11.10 21.49 + 8.93 17.29 + 8.36
g/kg body weight 1.65 + 1.22* 1.25 + 0.60 1.24 + 0.55 1.14 + 0.80
Carbohydrate (g) 318.05 + 204.05 205.60 + 106.48 222.21 + 126.26 159.28 + 82.35
Carbohydrate (Kcal) 1272.20 + 816.21 822.41 + 425.95 888.86 + 505.06 637.12 + 329.42
Carbohydrate (%energy) 51.31 + 13.34 49.37 + 15.55 53.51 + 11.94 55.74 + 14.08
g/Kg body weight 5.17 + 3.30* 3.94 + 2.30* 2.92 + 1.64 2.42 + 1.30
Fat (g) 59.09 + 44.42* 51.80 + 30.02 62.28 + 48.00 42.36 + 24.85
g/Kg body weight 0.95 + 0.65 0.96 + 0.54* 0.79 + 0.58 0.63 + 0.37
Fat (Kcal) 531.86 + 399.81 466.22 + 270.18 560.53 + 440.90 381.31 + 223.70
Fat (%energy) 26.63 + 8.56 28.80 + 9.39 25.00 + 8.15 26.95 + 9.57
Fiber (g) 19.94 + 15.21 8.06 + 5.77 16.95 + 14.21 9.97 + 5.92
*p < .05
The physical activity level of participants describes a sedentary profile for women in
the rural communities for both groups, since 75% of eutrophic women and 94.6% of
overweight women have a mild PAL, as depicted in Figure 13. This is explained by
the fact that men are responsible for the agriculture activity in the field whereas
women are more concerned with domestic duties.

Results
70
With regard to the linear model applied, when one observes the explanatory variable
behavior, one can notice that all of them exert significant influence on the dependent
variable, except for the variable gender and g of protein consumed/kg of body weight
(Table 18).
Table 18: Regression coefficients and p-values for correlates of BMI
Coefficients SE* t p-value
CONSTANT 3.560 0.080 44.462 .00
GENDER -0.029 0.037 -0.792 .43
PAL MOD (Moderate physical activity level) -0.094 0.045 -2.111 .04
PAL HIGH (High physical activity level) -0.095 0.040 -2.375 .02
KCALBW (kcal/bodyweight) -0.064 0.023 -2.769 .00
PTNBW (g of protein consumed/kg body weight) -0.003 0.028 -0.009 .93
CHOBW (g of carbohydrate consumed/kg of body weight) -0.066 0.027 -2.464 .02
LIPBW (g of lipid consumed/kg of bodyweight) 0.001 0.031 0.037 .97
R 0.31 2
F Statistic 6.53 .000
*Standard error
Figure 13: Physical activity levels of eutrophic and overweight adults. Tocantins 2008.

Results
71
Regarding the dummy variables, the coefficients of PALMOD and PALHIGH were
significant and the sign (negative) goes hand in hand with the nutritional science
theory, i.e. the higher PAL performed the lower is the BMI. The elasticity provided by
the model indicates that people performing either PALMOD or PALHIGH have 9%
lower BMI than those who are under PALMILD, ceteris paribus. In other words, in the
studied sample, the gender has no influence on the BMI fluctuation, but the physical
activity level of participants is significantly relevant for their BMI (Table 18).
Regarding the variables KCALBW and CHOBW, one observes that the coefficient is
significant and the sign is negative, i.e. more Kcal/Body weight and more
Carbohydrate/Body weight will decrease the BMI. The elasticities of both variables
are 0.06% i.e. an increase of 10% in Kcal/Body weight or Carbohydrate/Body weight
decreases the BMI by 0.6%, ceteris paribus. When one considers the variables
PTNBW and LIPBW, one observes that the coefficient is not significant. The
coefficient of determination (R2) was 0.31, i.e. 31% of the variation of BMI is
explained by the variation of independent variables in the model. The low value of R2
115was as expected once the data is cross-sectional ( , 116). The F-test pointed out
that the overall model was significant (Table 18). The equation
developed in the
present work was (eq. 7):
Log-log model:
Ln (BMI) i = 3.560 -0.029 Gender i - 0.094PALMod i -0.095PAL Hig i -
0.064KcalBW i - 0.003PTNBW i -0.066 CHOBW i +0.001LIPBW
i
The food frequency questionnaire (FFQ) is the most widely used method for
recording past diet, specifically due to its ability to classify individuals according to
their usual eating patterns. Besides, it is also an easy management tool and
eq.7

Results
72
inexpensive, therefore, enabling its usage in population studies (117). The results
obtained by the FFQ represent the food consumption practiced by adults in their
usual diets. A quantitative approach of food consumption is presented in Table 19
,
which contains a comparison of the average consumption of the same food for both
groups reflecting the food patterns practiced by participants in their daily lives and the
analysis of the average consumption of foods.
Table 19: Quantitative analysis of food consumption of eutrophic and overweight adults
Eutrophic
(n=52)
Overweight
(n=55)
Mean +SD Mean +SD
Acerola berry 0.72 + 1.80 0.48 +2.04
Apple 0.40 + 1.41 0.16 +0.68
Artificial juice 2.07 + 3.27 1.85 +3.08
Bacon, pork fat 0.83 + 2.84 0.84 +2.83
Banana 2.05 + 2.88 2.51 +3.87
Beans 9.96 + 5.49 10.10 +4.96
Bread 1.50 + 2.96 1.46 +2.27
Butter 0.38 + 1.41 0.54 +1.61
Cake 2.17 + 3.38 1.37 +2.07
Cara 0.25 + 0.73 0.62 +1.74
Cheese 0.95 + 1.61 1.08 +2.55
Chicken 1.61 + 2.32 1.71 +2.93
Chocolate 1.42 + 3.25 0.68 +1.84
Coffe with sugar 10.93 + 4.88 9.69 +5.76
Corn products 1.99 + 3.11 1.56 +1.97
Egg 2.45 + 3,55 1,65 +2.54
Fish 1.21 + 1,52 1,75 +2.56
Honey 1.15 + 2,88 1,25 +2.88
Ice cream 0.15 + 0.50 0.18 + 0.61
Jerked beef 0.67 + 1.27 0.80 +1.43
Leafy vegetables 2.54 + 3.92 1.97 +3.05

Results
73
Mayonnaise 0.19 + 0.52 0.16 +0.60
Manioc 1.78 + 1.92 2.56 +2.81
Margarine 4.58 + 4.73 3.10 +3.57
Meat (beef) 7.50 + 5.41 7.55 +5.64
Milk 5.56 + 5.37 5.91 +5.64
Natural juice 2.90 + 3.79 2.64 +3.45
Orange 2.42 + 3.03 2.07 +3.25
Papaya 1.93 + 3.57 2.05 +3.24
Passion fruit 0.87 + 2.29 1.30 +2.69
Pasta 1.94 + 2.74 1.48 +1.97
Pineapple 1.72 + 3.60 1.31 +3.05
Pork meat 0.80 + 1.54 1.32 +2.85
Potato 1.57 + 2.82 1.20 +2.53
Rice 13.60 + 2.13 12.60 +3.33
Salted cookie 1.85 + 2.73 1.73 +2.61
Sausages 0.26 + 0.74 0.48 +1.35
Soft drinks 0.81 + 1.57 1.20 +2.53
Sweet cookie 1.07 + 2.49 1.90 +1.85
Sweets 2.13 + 3.26 1.35 +2.39
Vegetables 2.85 + 3.48 3.38 +3.13
Vegetable oil 11.68 + 4.18 11.02 +5.21
Viscera 0.34 + 0.90 0.29 +1.04
Watermelon 0.64 + 2.31 0.64 +2.32
Yam 0. 71 + 1.52 0.50 +1.22
From the quantitative analysis of food consumption, foods were grouped according to
their values of relative frequency of consumption (0 < 1 = no consumption; ≥1 to < 3
= once a week; ≥ 3 to < 5.5 = 2 to 4 times a week; ≥ 5.5 -7 = 5 to 6 times a week; ≥ 7
to < 14 = once a day; 14 = 2 or more times a day). As a result, this classification
provided the food pattern of the two groups in Table 20.

Results
74
Table 20:
Eutrophic Food pattern of surveyed people based on quantitative analysis
Overweight
No consumption
Acerola berry, apple, bacon, pork fat,
butter, cake, cará, ice cream, jerked
beef, mayonnaise, passion fruit, pork
meat, sausages, soft drinks, viscera,
watermelon, yam,
Acerola berry, apple, pork fat, butter,
cake, cará, chocolate, ice cream, jerked
beef, mayonnaise, passion fruit,
sausages, viscera, watermelon, yam,
Once a week
Artificial juice, Banana, bread,
cheese, chicken, chocolate, corn
products, eggs, fish, honey, leafy
vegetables, manioc, natural juice,
orange, papaya, pasta, pineapple,
potato, salted cookie, sweet cookies,
sweets, vegetables,
Artificial juice, Banana, bread, cheese,
chicken, corn products, eggs, fish,
honey, leafy vegetables, manioc, natural
juice, orange, papaya, pasta, pineapple,
pork meat, potato, salted cookie, soft
drinks, sweet cookies, sweets,
2 to 4 times a week
Margarine Margarine, vegetables
5-6 times/week
Beans, milk Beans, milk
1 or 2 more times a day
Coffee with sugar, meat (beef), rice,
vegetable oil
Coffee with sugar, meet (beef), rice,
vegetable oil
Basically, the food pattern of surveyed people is based on rice, beans and meat as
daily food. Coffee is also highly consumed with added sugar.

Results
75
3.2. Biofunctional properties of traditional fruits Brazilian native fruits bacaba and jenipapo were investigated for their phenolic
compounds, antioxidant and antiproliferative effect on HepG2 cells. Therefore, fruits
were acquired, selected and prepared for experiments. As a first step and aiming at
allowing further calculations expressing results in fresh weight (FW) the water content
of fruit samples was assessed. The moisture content was 69.86 + 1.13 and 43.10 +
1.53 % for jenipapo and bacaba, respectively (Table 21). The yield of pulp was also
assessed during the plant material preparation by weighing residues and obtained
pulp as shown in Table 21.
Table 21: Water content and yield of fruit samples (n=3)
Sample Water content (%)
Yield (%)
Bacaba 43.10 + 1.53 29.13
Jenipapo 69.86+1.13 37.13
3.2.1. Optimization of Phenolics Extraction
Commonly solvents used for phenolic extraction are methanol, acetone and water.
Therefore, in order to optimize extraction procedure, total phenolic content of
samples was assessed by Folin-Ciocalteau assay after extraction with different
dilutions of methanol and acetone. As shown in Figure 14 bacaba phenolics were
significantly better extracted with 80% acetone and for jenipapo fruit only 100%
acetone was significantly different to the others solvents, as can be seen in Figure
14B (p < .05).

Results
76
Figure 14: Extraction optimization for bacaba (A) and jenipapo (B) samples. Different letters mean
significant difference by ANOVA and Tukey’s test of triplicates (p < .05) (n=3).
3.2.2. Phenolics Content of bacaba and jenipapo fruits Fruits were examined for total phenolics, flavonoids and anthocyanins (Table 22).
bacaba fruit had higher values for all those parameters when compared to jenipapo.
Regarding total phenolic content, bacaba fruit had 1759.27 + 1.01 mg GAEq/100g
and jenipapo 426.53 + 0.33 mg GAEq/100g. Flavonoids results were 1134.32 + 0.03
mg CTEq/100g and 7.12 + 0.00 mg CTEq/100g for bacaba and jenipapo,
respectively. Anthocyanins were not detected in jenipapo extracts whereas bacaba
had 34.69 + 0.00 mg cyn-3-glu/100g.
Table 22: Total phenol, total flavonoid and total anthocyanin content of bacaba and jenipapo fruits
(n=3).
Fruit Total phenolic (mg GAEq/100g
(FW))
Total flavonoid (mg CTEq/100g
FW))
Total anthocyanin (mg cyn-3-glu/100g
(FW))
Bacaba 1759.27 + 1.01 1134.32 + 0.03 34.69 + 0.00
Jenipapo 426.53+ 0.33 7.12 + 0.00 0.0 + 0.00
3.2.3. Antioxidant activity of bacaba and jenipapo fruits.
Antioxidant methods differ regarding their assay principle as multiple reactions
mechanisms, characteristics and experimental conditions (118). To this respect a

Results
77
sole assay doesn’t express accurately all antioxidants groups, especially in a mixed
or complex system as fruits matrices. Therefore, for having a better comprehension
about the antioxidant ability of the fruits studied here, different antioxidant assays
were applied (ORAC, TEAC, FRAP, DPPH, CAA) to allow broader comparison with
other fruits already described in the literature. The results of the antioxidants assays
are reported in Table 23.
Table 23: Antioxidant activity of bacaba and jenipapo fruits (n=3).
Sample ORAC
(µmol of TEq /100g (FW))
TEAC (µmol TEq / 100g (FW))
FRAP 1 (mmol
FeSO4.7H2
100g (FW)) O Eq/
FRAP 2 (mmol TEq/ 100g (FW))
DPPH (mmol TEq/100g
(FW))
Bacaba 10750.71 + 1496.51 3294.55 + 301.55 23.60 ± 0.53 13.44 ± 0.20 34.25 ± 0.20
Jenipapo 4655.60 + 562.83 257.62 + 30.46 0.36 ± 0.00 0.21 ± 0.00 0.56 ± 0.02
Both fruits expressed a considerable antioxidant effect. However, as expected from
the results obtained for the phenolics quantification bacaba showed higher
antioxidant ability than jenipapo in all antioxidant assays performed. The ORAC value
for bacaba was 10750.71 + 1496.51 µmol of TEq/100 g of fruit and for jenipapo
4655.6 + 562.83 µM of TEq/100 g of fruit. Bacaba had a TEAC value of 3294.55 +
301.55 whereas jenipapo had 257.62 + 30.46 µmol TE /100 g of fruit. For the FRAP
assay, in order to allow comparisons to other studies FeSO4.7H2O and trolox were
applied as standards as both chemicals are commonly applied to calibration curves in
this test. FRAP values for bacaba were 23.60 ± 0.53 mmol FeSO4.7H2O /100 g of
fruit and 13.442 ± 0.206 mmol TEq/100 g of fruit. FRAP values for jenipapo were
0.364 ± 0.003 FeSO4.7H2
O (mmol/100 g of fruit) and 0.214±0.005 mmol TEq/100 g
of fruit. In the DPPH assay the % of inhibition was calculated for different
concentrations of samples and compared to a calibration curve having Trolox as
standard. The DPPH antioxidant ability of bacaba was 34.25 ± 0.20 mmol TEq/100 g
of fruit whereas jenipapo had 0.561 ± 0.028 mmol TEq/100 g of fruit.
The antioxidant activity of the phenolic extracts from bacaba and jenipapo was also
measured using Cellular Antioxidant Activity (CAA) assay, recently designed and

Results
78
proposed by Wolfe and Liu (102). For assessing the antioxidant activity, cells were
exposed to different fruit extract concentrations. On the basis of methodology
optimization tests (data not shown), concentrations ranging from 0.1 to 5 mg/mL and
0.5 to 25 mg/mL were used for bacaba and jenipapo, respectively. Concentrations
chosen for quercetin ranged from 1 to 10 µM. Each experiment ran at least three
times independently. Following the proposed methodology, EC50
Figure 15
was calculated from
the dose–response curves for the inhibition of peroxyl radical-induced DCFH
oxidation by standard and samples as illustrated by .
Furthermore the EC50 values were calculated from the linear regression of the
median effect was curve plotted by data generated from dose response curves. The
EC50 values express the concentrations of the fruit extracts which have half of the
Figure 15: Dose-response curves for the inhibition of peroxyl radical-induced DCFH oxidation by Quercetin,
Bacaba and Jenipapo. Graphs are an illustration from one single and representative experiment (n=3).
Figure 16: Median effect plots inhibition of peroxyl radical-induced DCFH oxidation by Quercetin, Bacaba and
Jenipapo (n=3).

Results
79
maximum antioxidant activity achieved by samples (Figure 16). Additionally to the
EC50
values the results are expressed as CAA values which describe the antioxidant
activity of the fruit extracts as µM of Quercetin Equivalent (QE) / 100 g of fruit (FW)
and to address the Cellular antioxidant quality (CAQ) results were also expressed in
µM QE/100µmol of phenolics. For calculation of QE’s, quercetin, a pure
phytochemical compound which has a high antioxidant activity, was always run as a
standard. All values are listed in
Table 24 and expressed as mean ± SD. Table 24: EC50 and CAA values for the inhibition of peroxyl radical-induced DCFH oxidation by
Quercetin, Bacaba and Jenipapo (n=3).
Sample
EC
50
CAA values (µM QE/100g fruit FW)
CAQ values (µM QE/100µmol of phenolics)
Mean + SD Mean + SD Mean + SD
Quercetin 4.66 + 0.61
Bacaba 0.7 + 0.21 305.2 + 2.95 + 0.88 90.8
Jenipapo 4. 3+ 1.61 83.0 + 0.80 + 0.30 31.3
The dose-response curve for each phenolic extract shows that all phenolic fruit
extracts express potent antioxidant activities in a dose-dependent manner. Bacaba
had EC50 value of 0.7 ± 0.61 mg/mL and jenipapo 4.3 ± 1.61 mg/mL. Quercetin, the
standard, had an EC50 value of 4.66 ± 0.61 µM. CAA value for bacaba was 305.2 ±
90.8 µM of QE/100 g of fruit and 2.95 + 0.88 µM QE/100µmol of phenolics. Jenipapo
had a CAA value of 83.0 ± 31.3 µM of QE/100 g of fruit and 0.80 + 0.30 µM
QE/100µmol of phenolics. When investigating antioxidants, not only the amount is
needed but the quality of the antioxidants should also be regarded. Cellular
antioxidant quality measures the cellular antioxidant activity provided by 100µmol of
phenolics found in the fruit. The CAQ value of bacaba was 2.95 + 0.88 µM
QE/100µmol of phenolics whereas jenipapo had a value of 0.80 + 0.30 µM
QE/100µmol of phenolics.

Results
80
3.2.4. Inhibition of Cell Proliferation
In order to assess a possible direct effect of the fruit extracts from bacaba and
jenipapo on the MTT and MUH chemicals, a cell-free experiment was performed. The
fruit extracts were incubated with MTT or MUH solution and the absorbance or
fluorescence was measured, respectively. The results from the cell-free tests showed
that the bacaba fruit extract had a reducing influence on the MTT solution, i.e. it led to
a dose-dependent increase in the absorbance measured (Figure 17A). Jenipapo fruit
extracts showed no increasing absorbance in the MTT cell-free test and
consequently had no effect on the chemical (Figure 17A).
In the MUH cell-free test, jenipapo extracts in a dose-dependent manner led to an
increasing fluorescence (Figure 17B). In contrast, bacaba fruit extracts showed no
effect. Therefore, it can be concluded that this fruit had no effect on MUH hydrolysis
alone (Figure 17B).
In the next group of experiments, MTT, MUH, methylene blue and trypan blue assays
were carried out in order to assess the effect of the fruit extracts on living cells.
HepG2 cells were chosen for this as this cell line is a good model to address liver cell
metabolism and since these cells usually give consistent results in such assays
(119). In each assay, HepG2 cell proliferation was measured after cells had been
incubated with bacaba and jenipapo extracts with concentrations ranging from 0 to
1400 µg/mL for 96 h. Cells incubated with 2% DMSO were used as a positive control
for maximal cell proliferation inhibition. Absolute values recorded for non-treated
controls (100%) were an optical density of 0.97 + 0.25 for MTT and a fluorescence
value of 10813.38 + 394.10 relative fluorescence units for MUH, respectively.
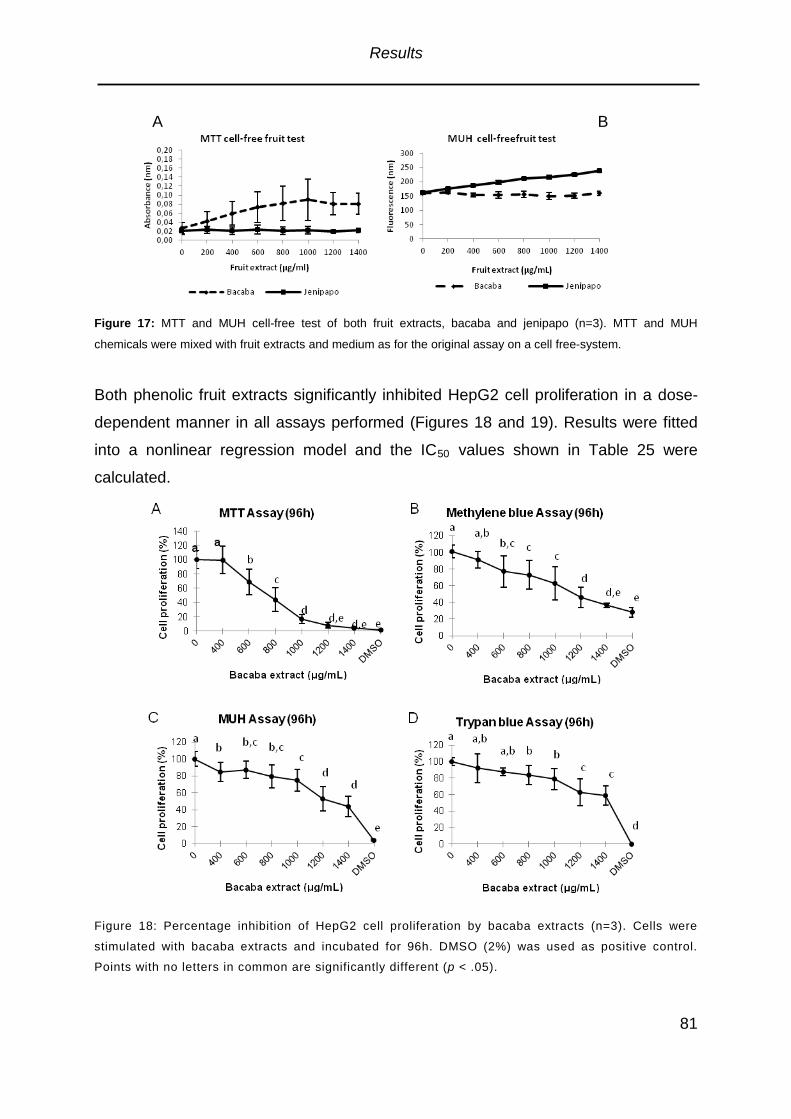
Results
81
Figure 17: MTT and MUH cell-free test of both fruit extracts, bacaba and jenipapo (n=3). MTT and MUH
chemicals were mixed with fruit extracts and medium as for the original assay on a cell free-system.
Both phenolic fruit extracts significantly inhibited HepG2 cell proliferation in a dose-
dependent manner in all assays performed (Figures 18 and 19). Results were fitted
into a nonlinear regression model and the IC50 Table 25 values shown in were
calculated.
Figure 18: Percentage inhibition of HepG2 cell proliferation by bacaba extracts (n=3). Cells were
stimulated with bacaba extracts and incubated for 96h. DMSO (2%) was used as positive control.
Points with no letters in common are significantly different (p < .05).
B
A
A

Results
82
Figure 19: Percentage inhibition of HepG2 cell proliferation by jenipapo extracts (n=3).Cells were
stimulated with jenipapo extracts and incubated for 96h. DMSO (2%) was used as positive control.
Points with no letters in common are significantly different (p < .05).
Bacaba fruit showed the highest antiproliferative capacity with an IC50 of 649.6 ± 90.3
µg/mL in the MTT test and an IC50 of 1080.97 ± 0.7 µg/mL in the MUH assay,
respectively. The Methylene blue and Trypan blue assays did not fit in the nonlinear
regression model for bacaba. For jenipapo, the Methylene blue assay indicated an
IC50 of 1076.7 ± 53 µg/mL, and of 1194.33 ± 96.2 µg/mL in the MTT and 1386 ±
60.32 µg/mL in the MUH assay, respectively. For jenipapo the Trypan blue assay
also did not fit in the nonlinear regression model. Indicated by the IC50
Table 25
values it can
be seen that bacaba has a higher antiproliferative capacity than jenipapo. Jenipapo’s
lower antiproliferative capacity also can be seen when fitted into a nonlinear
regression model ( ).

Results
83
Table 25: IC 50
values and regression coefficients (R2) for bacaba and jenipapo extracts in MTT,
MUH, Methylene blue (MB) and Trypan blue (TB) assay (n=3).
Bacaba Jenipapo
IC (µg/mL)
50 R IC 2 (µg/mL)
50 R
2
Mean + SD Mean + SD Mean + SD Mean + SD
Assay
MTT 649.6 + 90.3 0.97 + 0.02 1194.33 + 96.2 0.88 + 0.03
MUH 1080.97 + 0.7 0.7 + 0.15 1386.0 + 60.32 0.71 + 0.08
Methylene blue Not converged 1076.7 + 53.0 0.71 + 0.08
Trypan blue Not converged Not converged
* Results were obtained from three different experiments and fit into a nonlinear model.
Correlation analysis was performed to ascertain the association among the applied
assays as described in Table 26. The MTT test was highly correlated with all other
assays.
Table 26: Spearman’s Correlation coefficients among different assays (MTT, MUH, MB, TB)*
Bacaba Jenipapo
MTT MUH MTT MUH
MTT - - - -
MUH 0.806 - 0.807 -
MB 0.858 0.705 0.866 0.692
TB 0.808 0.759 0.808 0.759 *All values were significant (p < .05)
3.3.5 Characterization of phenolic compounds of bacaba by HPLC-DAD-MSn
Phenolic compounds were analyzed by RP-HPLC in cooperation with Dr. Dietmar
Kammerer and Prof. Dr. Reinhold Carle at the Institute of Plant Food Technology of
the University of Hohenheim. Ten major compounds were eluted from the HPLC
column and were well separated using the chromatographic system applied. The
HPLC chromatogram demonstrates the presence of 27 compounds absorbing at 370

Results
84
nm. The separation of phenolic components of a bacaba extract is presented in
Figure 20.
Figure 20: HLPC chromatogram of the phenolics present in a bacaba (Oenocarpus bacaba Mart.) extract at a
detection wavelength of 370 nm.
The phenolic fractions were characterized by ESI-MS. The assignment of individual
non-anthocyanin compounds was based on their main [M − H]− ions together with the
interpretation of their fragments produced in collision-induced dissociation (CID)
experiments. Based on the analysis of pseudomolecular ions and on the fragments
released in MS2 and MS3 experiments, some compounds could be tentatively
identified. MSn
120
spectra are very useful for identifying the aglycone of flavonoids, and
the analysis of fragmentation patterns is highly diagnostic, allowing to elucidate
structures by comparison with literature data ( ). MS spectra of flavonoid

Results
85
glycosides reveal characteristic patterns, depending mainly on the number and
nature of the saccharides bound to the aglycon and their linkage type, i.e. C- or O-
glycosidic linkage (121). Many flavonoids reveal low sensitivity in positive ionization
mode MS analyses and are therefore, preferably detected in negative ionization
mode (122). Mass spectrometric data obtained in the present study using negative
ionization mode, are presented in Table 27.

86
Table 27: Characterization of individual phenolic compounds in bacaba extracts by HPLC/DAD/ESI-MSn
Peak t Compound class (R) Compound (tentative identification)
HPLC/DAD UV [M-H] HPLC / ESI (-)-MS- n
(min)
experiment
λmax m/z (nm) m/z (% base peak)
a
1 33.0 C-glycoside
Vicenin 2 (apigenin-6,8-di-C-glycoside
5,7,4'-trihydroxyflavone-6,8-di-C-glycoside)
235, 268, 337 593 MS2
MS
[593]: 473 (100), 353 (39), 503 (37), 383 (20), 354 (17), 285 (15)
3
2 [593 → 473]: 353 (100), 354 (19), 383 (15)
37.0 Flavonoid, C-hexoside Orientin (luteolin-8-C-glucoside) or isorientin (luteolin-6-C-glucoside)
348 447 MS2
3
[447]: 327 (100), 357 (56), 328 (29)
39.4 C-glycosylflavone Apigenin-8-C-glucoside (vitexin) 340 431 MS2
MS [431]: 311 (100), 312 (17), 283 (17), 341 (6)
3
[431 → 311]: 283 (100), 312 (37), 118 (27)
4 39.8 Isorhamnetin hexoside
isorhamnetin-dihexoside or rhamnetin-dihexoside
310 639 MS2
MS [639]: 315 (100), 477 (53)
3
5 [639 → 315]: 300 (100), 270 (67)
43.7 Quercetin hexoside Quercetin-3-O-hexoside
355 463 MS2
6
[463]: 301 (100), 302 (25)
44.1 Quercetin diglycoside Rutin (quercetin 3-O-rutinoside) 265 609 MS2
7
[609]: 301 (100), 302 (27), 300 (20), 271 (14), 343 (14)
45.7 Quercetin glycoside Quercetin-3-O-hexoside 260 505 MS2
[505]: 301 (100), 300 (37), 463 (37)
8 48.5 Flavonoid
Hexose + deoxyhexose attached to methoxyapigenin methoxyluteolin diosmetin
345 608 MS2
MS [607]: 299 (100), 284 (61), 285 (19), 300 (14)
3
9
[607 → 299]: 284 (100), 285 (36)
48.9 Hexose + deoxyhexose methoxyl function
345 637 MS2
MS [637]: 329 (100), 314 (25), 330 (23)
3
10
[637 → 329]: 314 (100), 315 (44), 329 (22)
51.1 Isorhamnetin glucoside Isorhamnetin 355 acetyl-hexoside 519 MS2
MS [519]: 315 (100), 300 (18), 316 (16)
3 [519 → 315]: 300 (100), 255 (17)
a Based on fragmentation pattern in mass spectrometric experiments b Tentative identification was obtained by comparing the elution order and pseudomolecular ions (M-H)- 123 with data available in the literature ( ).

Results
87
Peak 1 - The wavelength of maximum absorption for band Ï (300 – 380 nm) was
below 355 nm and, thus, is indicative of hydroxyl substitution at the 3-position (124).
UV spectra showing a λmax at 267 nm and 338 nm are characteristic of apigenin. In
the MS2 experiment losses 120 Da and 90 Da were observed, thus producing
fragments at m/z 285, 474 and 503. The fragmentation of C-glycosides typically
produces [M–H–90]- and [M–H–120]- 124 ions ( ). MS2 analyses of the predominant
ion at m/z 593 detected for compound 1 provided the typical fragmentation of a di-C-
glycosylflavone. Particularly, the ions at m/z 503 ([M - H - 90]-
Gil-Izquierdo, Riquelme, Porras, &
Ferreres
) and 473 ([M - H - 120],
base peak) suggest the occurrence of a 6,8-di-C-hexoside. The ions at m/z 353
([aglycone + 83 Da]) and 383 ([aglycone + 113 Da]) indicated the aglycone to be a
trihydroxyflavone as similarly described by
(125). The precursor ion and major fragment ions corresponding to peak 1
have previously been described in other studies, and by comparison of these mass
spectrometric data with those obtained in the present study, this compound was
tentatively identified as vicenin-2 (125, 126,127).
Peak 2 - Losses of 120 and 90 Da were observed in the MS2
128
experiment,
corresponding to cross-ring cleavages in the sugar moiety ( ). This fragmentation
of the glycoside was responsible for product ions observed at m/z 357 ([M–H–90]-)
and m/z 327 ([M–H–120]-
128
). The evaluation of the fragmentation behavior indicates
compound 2 to correspond to a flavone C-glycoside such as isoorientin (luteolin-6-C-
glucoside) and orientin (luteolin-8-C-glucoside), respectively. Although the fragment
ions of the parent ion allow the differentiation between C-glycosylation at the 6- and
8-positions, it was impossible in the present study to perform a more detailed
characterization of this compound due to low signal intensities in the fragmentation
experiments ( , 129).
Peak 3 - Among the compounds with UV spectra characteristic of flavones, two
groups of compounds were differentiated on the basis of their MSn fragmentation: C-
glycosylflavones and O-glycosylflavones. In the MS2 experiments of the studied C-
glycosylflavones, losses of 90 and 120 Da were observed, being characteristic of a

Results
88
C-glycosylated compound with a hexose linked to the flavone nucleus. The absence
of an [M - H - 18] −
130
ion presumably indicates the position of the C-glycosylation at
carbon 8 ( ). Additionally, compound 3 revealed an [M−H]− ion at m/z 431, and its
MS/MS spectrum yielded ions at m/z 341 ([M−H−90]−) and 311 ([M−H−120]−
131
).
Consequently, this component was tentatively assigned to apigenin-8-C-glucoside,
also named vitexin ( ,132,133).
Peak 4 - Mass spectrometric experiments of compound 4 in the negative ionization
mode produced an [M-H]− ion at m/z 639 and fragment ions at m/z 477 ([M-H-
hexose]-), and m/z 315 ([M-H-2xhexose]−
122
). The ion at m/z 315 is characteristic of
rhamnetin and isorhamnetin, respectively, and the fragmentation pattern indicated
this compound to contain two hexose moieties ( , 134). Thus, this compound was
tentatively identified either as isorhamnetin-dihexoside or rhamnetin-dihexoside.
Peak 5 - The fragmentation pattern indicates this compound to be a quercetin-
hexoside (135, 136). In ESI experiments in the negative ionization mode, quercetin
mono- and diglycosides are known to produce the quercetin aglycone at m/z 301 as
a result of the loss of the glycosyl moieties (137). CID experiments with compound 5
generated the aglycon ion at m/z 301 revealing a loss of 162 Da together with a
fragment ion at m/z 179, which is characteristic of quercetin-3-O-glucoside (138). The
same findings were also previously described for quercetin hexoside with an [M–H]-
139
ion at m/z 463 showing a typical loss of 162 Da resulting in the characteristic
fragment ion at m/z 301 ( ).
Peak 6 - Compound 6 exhibited a pseudomolecular ion at m/z 609 and the loss of the
glycosidic moiety, releasing the quercetin aglycon ion at m/z 301 and being
equivalent to the loss of a hexose moiety (162 Da) and deoxyhexose moiety (146
Da). Further fragmentation of the fragment ion at m/z 301 produced further fragments
at m/z 179 and 151, which are characteristic of quercetin. Based on similar mass
spectral studies reported in the literature, this compound was tentatively identified as
140rutin (quercetin 3-O-rutinoside) ( ,141).

Results
89
Peak 7 - The mass spectra indicated the presence of a quercetin derivative
(aglycone fragment at m/z 301) glycosylated with a hexose and a acetyl moiety
attached to it (142). The peak was tentative identified as Quercetin-3-O-hexoside
(143).
Peak 8 - The compound with a pseudomolecular ion at m/z 607 revealed a fragment
ion at m/z 299 ([M − H − 308]-) in the MS2
144
spectrum, suggesting the loss of a rutinose
moiety (flavonoid O-rutinoside). Shi et al. ( ) found a similar fragmentation pattern
for diosmin (145).
Peak 9 - Compound 9 showed a UV spectrum typical of a flavonoid. In the mass
spectrometric analyses, a characteristic loss of 308 Da was observed in the MS2
experiment, being indicative of a diglycoside composed of a hexose and a
deoxyhexose moiety.
Peak 10 - The HPLC–ESI–MS/MS experiments brought about the loss of 204 Da
characteristic of an acetylhexoside (162 Da + 42 Da). Further fragmentation in the
MS3 experiment showed a further loss of a methoxyl function (15 Da), and an ion at
m/z 300 characteristic of an isorhamnetin or rhamnetin backbone unit. A similar
spectrum has previously been described for isorhamnetin
acetyl-glucoside (139, 146,
147).

Results
90
Figure 21: HPLC chromatogram of anthocyanins from a bacaba (Oenocarpus bacaba Mart.) sample
at a detection wavelength of 520 nm.
The separation of anthocyanins extracted from a bacaba sample is presented in
Figure 21. As can be seen, baseline separation was achieved for all compounds, and
four major peaks were observed in the chromatogram. UV/Vis spectroscopic and
mass spectrometric data obtained in the positive ionization mode of anthocyanins are
presented in Table 4. All compounds were found to be cyanidin glycosides due to the
release of the characteristic fragment ion at m/z 287. Mass spectrometric analyses of
the four peaks yielded molecular ions M+
Table 28
at m/z 595, 758, 449, 595, 963,
respectively, as specified in .

91
Table 28: UV/Vis and mass spectrometric characterization of individual anthocyanins in bacaba extracts by HPLC/DAD/ESI-MSn
Peak t Compound characterization (R) Tentative identification HPLC/DAD UV [M] HPLC / ESI (+)-MS+ n
experiment
a
(min) λmax m/z (nm) (% base peak)
11 11.6 Cyanidin glycoside 270, 505 758 MS 2
MS
[758]: 596 3
12
[758 →596]:
449, 287
20.5 Cyanidin hexoside Cyanidin 3-O-glucoside 270, 505 449 MS 2
13
[449]: 287
22.5 Cyanidin glycoside Cyanidin-3-O-rutinoside 260, 510 595 MS 2
[595]: 449, 287
14 27.9 Cyanidin glycoside 305, 520 963 MS 2
MS
[963→]: 449,
287 3 [967 →595]:
449, 287 a Based on HPLC–MS mass fragmentation pattern

Results
92
Peak 11 - Compound 1 was assigned to a cyanidin hexoside due to the loss of 162
Da in the MS2
experiment and the release of an ion at m/z 287 upon further
fragmentation.
Peak 12 - The fragmentation of compound 2 was characteristic of a cyanidin (m/z
287) aglycon glycosylated with a hexose (162 Da) moiety.Compound 2 was
tentatively identified as cyanidin 3-O-glucoside.
Peaks 13 and 14 - Compounds 3 and 4 revealed fragmentation patterns
characteristic of anthocyanins containing hexose and deoxyhexose moieties attached
to the cyanidin aglycon, respectively. Compound 3 was tentatively identified as
cyanidin-3-O-rutinoside (129).
The characterization of phenolic compounds is important as these compounds are
associated with a range of different health properties. HPLC with diode array and
mass spectrometric detection has been proven to be very useful for the
characterization of individual phenolic compounds. Ten polyphenols were detected
and characterized in bacaba extracts in the present study. Based on their UV spectral
data, most of these compounds were characterized as quercetin and rhamnetin
derivatives besides a range of further flavonoids. So far, Oenocarpus bacaba extracts
have not been systematically analyzed. To the best of our knowledge, the present
study represents the first chemical investigation of this plant material. Due to the
limited availability of reference compounds, the similarity of spectral characteristics
and the chromatographic behavior allow tentative peak assignment. For this purpose,
mass spectrometric analyses were also performed (92). Nine compounds were
tentatively identified based on the comparison with results previously described in the
literature. Although some compounds were not identified, they are relevant to
comprehensively characterize the chromatographic fingerprint which is a plant-
specific trait. Taking together the outcome of the present study, it becomes apparent
that bacaba is a potential source of pigments and natural antioxidants which should
be considered for future exploitation.

Results
93
3.3.6. Chemopreventive effect of bacaba extract on MCF -7 cells 3.3.6.1. Effects of bacaba extract on MCF-7 cell proliferation and morphology A phenolic extract of the bacaba fruit was prepared as described in materials and
methods and its total phenolic content was determined using the Folin-Ciocalteau
reagent. Bacaba fruit had 1759.27 + 1.01 mg GAEq/100g of phenolic content.
In order to test for an antiproliferative effect of the bacaba extract, MCF-7 breast
cancer cells were incubated with different concentrations of the phenolic extract for
96 h and quantified by the MTT assay. The proliferation of MCF-7 cells was
significantly inhibited by bacaba extract after 96 h of incubation at concentrations of
100μg/mL or above (Figure 22A). The IC50
Figure 22
was 252.10μg/mL with a confidence
interval range from 242.8 - 261.7. Morphological changes in MCF-7 cells treated with
bacaba extract were observed by contrast microscopy ( B). A difference in
cell morphology can be clearly observed when cells were incubated with 400µg/mL
bacaba extract or more (Figure 22B). Control cells showed a typical intact
appearance whereas cells incubated with the bacaba extract displayed morphological
alterations such as cellular shrinkage and reduction of the cell monolayer area
(400µg/mL), rounding and poor adherence as well as floating shapes (600 and 800
µh/mL). These observations suggest that bacaba extracts may induce apoptosis in
MCF-7 cells.
* * * *

Results
94
Figure 22: Antiproliferative effect of bacaba extract on MCF-7 cells. A. Effect of bacaba extract on
cell proliferation. MCF-7 cells were treated with or without different concentrations of bacaba extract
for 96h to assess cell proliferation. Data are presented as means + standard deviation from at least
three independent experiments. Each experiment was conducted in six replicates (* p< .05). B.
Morphological changes in MCF-7 Cells incubated with bacaba extract for 72h. Cells were observed
by contrast optical microscopy (magnification 100x and 320x) in controls and after treatment with
bacaba extracts (200 – 800µg/mL). Pictures are representative of at least three independent
experiments.
- 400 200 800 600
Bacaba extract (µg/mL)
100x
320x

Results
95
Apoptosis is defined by a characteristic set of changes in cell morphology during cell
death. Cell alterations include loss of focal adhesions, formation of cell membrane
buds or blebs and decrease in total cell volume. Recent studies suggest that the
morphological changes are an early prerequisite to apoptosis and precede key
biochemical time-points (148). It has been suggested that as a rule, classification of
cell death in a given model should always include morphological examination coupled
with at least one other assay (149). Following this recommendation, morphological
observation was performed together with two other preliminary assays to check for a
possible apoptotic effect of bacaba extract on MCF-7 cells (ethidium bromide/acridine
orange (EB/AO) staining and DNA laddering) (Figure 23).
Figure 23: EB/AO staining of MCF-7 cells treated with 0 and 250 μg/mL of bacaba extract after 72h
of incubation. A. Cells stained in green are viable cells whereas orange cells indicate apoptotic cells
(magnification 200x). Pictures are representative of at least three independent experiments. B. DNA
fragmentation for MCF-7 cells. Cells were treated with bacaba extract (0,100,200,300,500μg/mL) for
72 h and DNA was analyzed by agarose gel electrophoresis.

Results
96
Fluorescence light microscopy with differential uptake of fluorescent DNA binding
dyes such as ethidium bromide/acridine orange staining (EB/AO) is a suitable
method for the evaluation of cellular viability. During early stages of apoptosis, cells
are impermeable to ethidium bromide and their nuclei stain green, during the later
stages, nuclei stain orange/red. EB also dominates over AO. Representative cellular
morphology of control and treated cells was assessed following staining with AO/EB.
Viable cells were impermeable to ethidium bromide and had normal round nuclei that
stained green (Figure 23A). Cells incubated with 250µg/mL of bacaba extract for 72 h
showed characteristics of late apoptosis, i.e. their nuclei stain mostly orange. Indeed,
this concentration is a value close to that found for the IC50
Figure 23
to the antiproliferative
activity ( ).
3.3.7.2. DNA fragmentation and PARP cleavage
DNA fragmentation and the cleavage of the abundant nuclear enzyme poly(ADP-
ribose) polymerase (PARP) are typical hallmarks of apoptosis and therefore, were
investigated next (150). To assess DNA fragmentation, MCF-7 cells were treated with
bacaba extract for 72 h. Genomic DNA was isolated and run through an agarose gel.
Figure 23 shows that cells exposed to 500µg/mL of bacaba extract demonstrated a
DNA laddering indicating the fragmentation of DNA when compared to control (red
arrows). In later stages of apoptosis, the 116 kD PARP protein is cleaved by
caspase-3 into an 85 kD fragment, whose presence indicates that cells are
undergoing apoptosis (151). To assess PARP cleavage, cells were incubated with
bacaba extract for 24 and 48h. A considerable PARP proteolysis was observed in
cells exposed to bacaba extracts for 48 h in a dose dependent-manner indicating a
significant induction of apoptosis. The control showed no PARP-cleavage whereas
incubation with staurosporin - a known inducer of apoptosis - resulted in complete
PARP cleavage (Figure 24). No PARP cleavage was observed during the incubation
of cells with bacaba extracts for 24 h (Figure 24).

Results
97
Figure 24: PARP – cleavage by bacaba extract. Cells were incubated with bacaba extract (0-
1000µg/mL) for 24 h and 48 h. Cell lysates were prepared and analyzed by SDS-PAGE and western
blotting.
3.3.7.3 Bacaba induced apoptosis as measured by annexin V/propidium iodide (PI) flow cytometry
DNA fragmentation, DNA staining and PARP cleavage are important methods to
characterize apoptosis. However, these methods only detect an increase of apoptotic
signals, and cannot easily quantify percentage of live, apoptotic or dead cells.
Consequently, a quantitative approach was also carried out to characterize the
apoptosis induced by bacaba extract. Therefore, cells were incubated with bacaba
extract for 24h and stained with annexin V-FITC/propidium iodide and analyzed by
flow cytometry (Figure 25).

Results
98
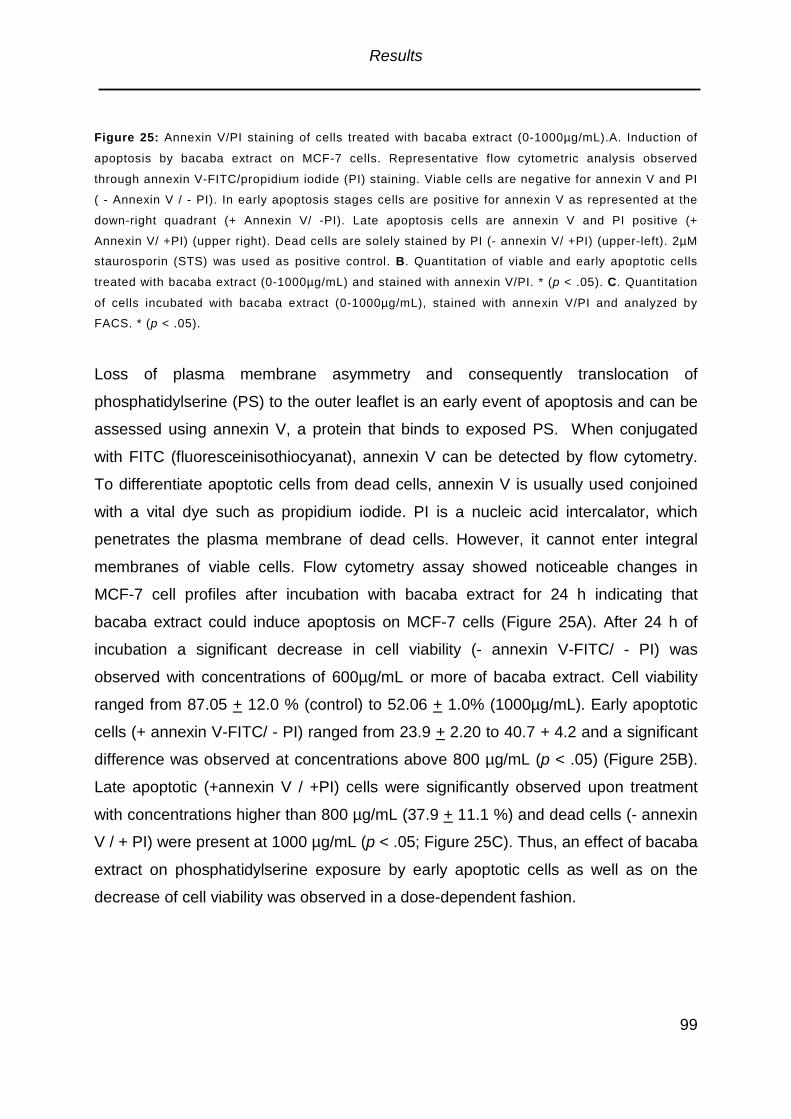
Results
99
Figure 25: Annexin V/PI staining of cells treated with bacaba extract (0-1000µg/mL).A. Induction of
apoptosis by bacaba extract on MCF-7 cells. Representative flow cytometric analysis observed
through annexin V-FITC/propidium iodide (PI) staining. Viable cells are negative for annexin V and PI
( - Annexin V / - PI). In early apoptosis stages cells are positive for annexin V as represented at the
down-right quadrant (+ Annexin V/ -PI). Late apoptosis cells are annexin V and PI positive (+
Annexin V/ +PI) (upper right). Dead cells are solely stained by PI (- annexin V/ +PI) (upper-left). 2µM
staurosporin (STS) was used as positive control. B. Quantitation of viable and early apoptotic cells
treated with bacaba extract (0-1000µg/mL) and stained with annexin V/PI. * (p < .05). C. Quantitation
of cells incubated with bacaba extract (0-1000µg/mL), stained with annexin V/PI and analyzed by
FACS. * (p < .05).
Loss of plasma membrane asymmetry and consequently translocation of
phosphatidylserine (PS) to the outer leaflet is an early event of apoptosis and can be
assessed using annexin V, a protein that binds to exposed PS. When conjugated
with FITC (fluoresceinisothiocyanat), annexin V can be detected by flow cytometry.
To differentiate apoptotic cells from dead cells, annexin V is usually used conjoined
with a vital dye such as propidium iodide. PI is a nucleic acid intercalator, which
penetrates the plasma membrane of dead cells. However, it cannot enter integral
membranes of viable cells. Flow cytometry assay showed noticeable changes in
MCF-7 cell profiles after incubation with bacaba extract for 24 h indicating that
bacaba extract could induce apoptosis on MCF-7 cells (Figure 25A). After 24 h of
incubation a significant decrease in cell viability (- annexin V-FITC/ - PI) was
observed with concentrations of 600µg/mL or more of bacaba extract. Cell viability
ranged from 87.05 + 12.0 % (control) to 52.06 + 1.0% (1000µg/mL). Early apoptotic
cells (+ annexin V-FITC/ - PI) ranged from 23.9 + 2.20 to 40.7 + 4.2 and a significant
difference was observed at concentrations above 800 µg/mL (p < .05) (Figure 25B).
Late apoptotic (+annexin V / +PI) cells were significantly observed upon treatment
with concentrations higher than 800 µg/mL (37.9 + 11.1 %) and dead cells (- annexin
V / + PI) were present at 1000 µg/mL (p < .05; Figure 25C). Thus, an effect of bacaba
extract on phosphatidylserine exposure by early apoptotic cells as well as on the
decrease of cell viability was observed in a dose-dependent fashion.

Results
100
3.3.7.4. Reduction of cell volume
Variation in forward side scatter (FSC) of treated MCF-7 cells indicates a decrease in
cell size. A shift from right to left can be seen after 24 h of incubation with different
concentrations of bacaba extract (0-1000 µg/mL) in Figure 25 A. These data point to
the typical reduction of cell volume during the apoptotic process. Staurosporin (2µM)
was used as a positive control. Cells were quantified and classified as apoptotic and
non-apoptotic accordingly to their size (Figure 25 B). An increase in the number of
cells with reduced size (apoptotic) was observed in a dose-dependent manner after
incubation with bacaba extracts for 24h (Figure 26). Similarly, a decrease of the
number of non-apoptotic cells was observed in the same fashion (p < .05).

Results
101
Figure 26: Decrease of cell volume in MCF-7 cells exposed to different concentrations of bacaba
extract. A. Decrease of cell volume in MCF-7 cells exposed to different concentrations of bacaba
extract. Volume was characterized by FACS analysis using forward side scatter (FSC) of untreated
control cells and cells treated with bacaba extract for 24 h. Staurosporin (2µM) was used as positive
control. P1 represents the gated area for apoptotic cells. Data depicted are representative of at least

Results
102
three independent experiments. B. Quantitation of Light scatter properties (cell size, forward light
scatter (FSC)). Cells were gated according to the controls and values of FSC for apoptotic and
nonapoptotic cells were recorded and analyzed. Cell size distribution differs between apoptotic and
nonapoptotic cells * (p < .05).
3.3.7.5. Bacaba extract reduces the mitochondrial membrane potential (ΔΨm
) in MCF-7 cells
To investigate whether bacaba extract-induced apoptosis involved the mitochondrial
membrane potential (ΔΨm) the cationic fluorescent dye JC-1 was used to detect the
ΔΨm when cells were treated with or without 500 and 1000µg/mL of the extract for 1,
3 or 6h. Samples incubated with 1000µg/mL showed a significant decrease in the
ΔΨm Figure 27at all time points ( ).
Figure 27: Mitochondral membrane potential of MCF-7 cells. Cells were incubated with different
concentrations of bacaba extract (500 and 1000µg/mL) for different time points (1, 3 and 6h).
Afterwards, cells were stained with JC-1 and analyzed by flow cytometry. The loss of percentage
indicates the reduction of ΔΨ m.
* (p < .05).

Results
103
3.3.7.6. Apoptosis induced by bacaba extract is caspase-dependent: activation of caspases -6, -8 and -9
The induction of apoptosis by many cytotoxic agents is highly dependent on the
activation of caspases (152). To characterize the apoptotic process triggered by
bacaba extract, activation of caspases was investigated. Bacaba extract was found to
induce the activation of caspases -6, -8 and 9 using three different fluorogenic
substrates (VEID-AFC, IETD-AFC and FITC-LEHD-FMK) for caspase-6, -8 and -9,
respectively (Figure 28 A, B, C).

Results
104
Figure 28: Caspases activation by bacaba extracts.Caspases activation by bacaba extracts. A.
Caspase-9 activation after incubation with bacaba extracts (0-1000µg/mL) for 24h. B. Caspases-6
and -8 activation after incubation with bacaba extract (0-1000µg/mL) for 24h. C. Comparison of the
level of activation for caspases-6, -8 and -9.

Results
105
Caspase-9 was activated after 24 h of incubation with bacaba extract (400 –
1000µg/mL) in a dose-dependent manner (Figure 28. A). Staurosporin (1µM) was
used as positive control. Also, caspase-8 was activated by all concentrations of
bacaba extract applied (200-1000µg/mL) (Figure 28 B). However, there was no
significant difference among the different doses of extracts, and the response to the
different concentrations did not reach the level of activation of the positive control
used (TNF-alpha 100ng/mL), as can be seen in Figure 28 B. (p < .05). Caspase-6
was also active after 24h of incubation with bacaba extracts (Figure 28). Again, there
was no difference in the level of activation when cells were incubated with 200, 400
and 600µg/mL of bacaba extract, though a significant decrease was observed after
incubation with 800 and 1000µg/mL (p < .05). Thapsigargin (2µM) was used as
positive control in this case. Although all investigated caspases (6-, -8 and -9)
showed a significant higher level of activation from the non-stimulated control cells (p
< .05), the activation of caspase -9 was much more pronounced than the one of
caspase -6 and -8. In comparison to the non-stimulated control cells, caspase-9
reached a maximum of 280.90 + 81.8% of activation (800µg/mL of bacaba extract)
whereas caspase -6 and -8 reached a maximum of 107.2 + 7.59 % (200 µg/mL) and
117.2 + 5.8 (400µg/mL), respectively.
3.3.7.7. PARP-cleavage by caspase – 9 in MCF-7 cells
Initiator caspase-3 is usually located upstream of caspase-8 and -9. Due to a genetic
defect (a deletion mutation in exon 3 of the gene), MCF-7 cells do not express
caspase-3 (153). Therefore, the role of caspase-9 on PARP-cleavage was assessed.
Cells at 70 % of confluence were incubated with 1000µg/mL of bacaba extract for 48
h in the absence or presence of the specific caspase-9 inhibitor Z-LEHD (20µM).
After 48 h of incubation with bacaba extract, a PARP cleavage was observed in
control cells. In contrast, cells incubated with Z-LEHD and bacaba phenolic extract
did not show the characteristic 85KDa band of cleaved PARP (Figure 29) indicating
that caspase-9 is involved in PARP cleavage.

Results
106
Figure 29: PARP–cleavage by Caspase-9. MCF-7 cells were incubated for 48h with or without
bacaba extract and the specific caspase 9 inhibitor Z-LEHD. Cells lysates were prepared and
analyzed by western blotting.

Discussion
107
4. Discussion 4.1 Nutrition Survey 4.1.1. Socioeconomic, health and food security assessment of two rural communities in the region of APA/Cantão, Tocantins state (Brazilian Amazon Region)
Human beings play a central role in farming systems. Every relationship among the
resource usage and its allocation to the farm, household and off-farm sector is
exerted by a human being and its behaviour is crucial to lead the family to a better off
(or worse off) situation. Herein, a family is defined as all members of a household
who share a common kitchen, contribute to family income and/or utilise benefits from
family income permanently. The family size of the two rural communities studied is
similar to (4.7 persons/family) the average for rural areas in northern Brazil (4.9
persons/family) (107). It is noteworthy to mention that the farm families in the study
area are rural settlers who are on average less than 10 years on the land. Thus they
still have relatives, personal contacts and professional relations in urban areas. In
this sense, the rural exodus especially of adolescent male and female members
might be higher compared to other regions within the Brazilian Amazon region.
In the study area, the land use is dictated mainly by its soil quality, availability of
water as well as access to credit. It is important to note that farmers are located in a
transition area between Cerrado and Amazon rainforest, the so-called ecotone
biome, which plays an important role as a source of fauna and flora.
At first glance, the forest deforestation does not seem impressive, since roughly 70%
of the remaining families have not deforested the biome. However, when taking into
account the environmental services provided by native forests, this perspective might
change. It is worth mentioning that forests also provide a range of ecosystem
services, such as water storage, increased rainfall, nutrient recycling, biodiversity and

Discussion
108
soil stabilization. They can help with flood control and boost agricultural productivity,
which surely would contribute to a positive impact on families’ living standards. Thus,
the deforestation of native biomes generates many negative environmental
consequences, up to the risk of species extinction since the entire chain of
environmental services is compromised. Table 6 shows the amount of the native
biome which was deforested for agriculture or livestock production.
With regard to the families' own assets, results give an overview of the family
possessions and briefly indicate their living standard. The absence or presence of
these assets is therefore inextricably linked to the socioeconomic well being of farm
households (154). Based on the families' own assets, food storage and access to
information seem to be not a problem faced by the families in the study area.
However, means of transportation are still an obstacle, since only a small part of
families possesses a motorcycle or car, i.e. the majority of farmers still rely on bicycle
and/or public transportation. Considering the long distances from the rural
settlements to the city (15- 25Km), and also that the public transportation is not
regular, one can conclude that most farmers do not have a good access to markets,
either to purchase or sell the agricultural surpluses, which can lead to a vicious circle
of rural poverty, for instance (3, 155, 156).
Credit is an important driver for farm activities in the study area since farm families
are very sensitive to this external source of capital (3, 155, 156). The credit provides
the cash and the liquidity to fulfill the objectives and needs of the farm families. Once
without it, many of farm families do not plant nor have livestock on their properties. In
this context, the analysis of credit amount and availability is crucial to better
understand the choices made by the farm families in the study area. The main
objective of the credit received by the farm families is to invest in livestock
production. Crop purchase appears to be the second reason for credit demand
together with other activities such as construction of fences, purchase of specific
equipment, etc. It is interesting to note that in Brazil, 69% of credit for family

Discussion
109
agriculture is related to crop and 31% to livestock activities (107). So, the figures of
the study area in question show the importance of livestock activity there.
The strategic role of the pluri-activity in the rural development process is to contribute
to the generation of social inclusion, to reduce poverty and to overcome inequalities.
Despite the fact that social assistance (federal and state income transfer) has a small
but not negligible impact on family income, the number of families that receive social
assistance is high, i.e. more than 60% of families are participating in a federal and/or
state program of income transfer (Figure 11).
Although the majority of farm families have access to drinking water through wells,
only part of them has access to tap water. Another problem is that some farm families
suffer from a drinking water deficit in the dry season (May up to October). The wells
no longer supply water and some farm families have to walk 1, 2 or even 4 km to get
drinking water. Irrigation systems are very rare in the study region due to the costs of
acquisition and maintenance. During the rainy season (November up to April), all the
water for crop production comes from the rain and therefore the irrigation system if
present is not used. Regarding the energy, all farm families have access to it, but the
wood stove is still the facility used most widely.
The majority of families were subject to a mild food and nutrition insecurity. According
to the Brazilian Scale of Food and Nutrition Security (EBIA), mild food and nutrition
insecurity occurs when there is a worry regarding lack of food in the near future,
expressing the psychological component of the insecurity. In this case domestic
arrangements are made with food or meals to extend their availability. A substantial
number of families experienced moderate food insecurity, i.e. a situation in which the
food and meal’s quality is compromised in order to maintain the amount of food
available. At this level, there is a reduction of the amount of food available to the
family (food shortage). Although not in high percentage, the severe food insecurity
was also present in the studied communities (15.5%), which mean that these families
had quantitative food deficiencies leading to hunger among adults and children. This

Discussion
110
data are comparable to the Brazilian National Household Survey (PNAD) which
identified 56.5% of households as standing at any level of food insecurity (157).
Additionally, food and nutrition security was assessed through a quantitative approach focusing on the food supply, where food security comprises the amount and quality of food supply from the farm as well as from the market (158). This amount is influenced by family size, access to the market, diversification within the property and resources for production. In the study area, the market orientation is regular, i.e. even though farm families consume part of their own production, in some cases a surplus is offered in local markets. However, as one can see in Figure 12, self-production is not sufficient to feed the family in the majority of family farms. This demonstrates that families depend on local markets to fulfill their needs, i.e., families in the region in question can be considered as food net buyers.
The health condition is a crucial indicator of farm families’ living standards and thus
some factors were selected in order to assess the health status of families in the
study area. The use of traditional methods for health care is almost a consensus to
the families. Similarly, the public service (SUS) is the main health service used by the
families, since they cannot afford a private health service. But it is worth to mention
that the public health service was not well graded by the users, being classified as
regular or worse, reflecting the dissatisfaction towards the quality of the public health
service, which in some cases can aggravate the health condition of a family member.
4.1.2. Nutritional Situation of adults in two rural settlements of APA – Cantão It has been suggested that excessive energy intake is the main cause of obesity.
However, the role of diet composition in weight control and obesity remains
controversial (159). In the current study, the prevalence of overweight and obesity
altogether was as high as found in other studies in Brazilian rural areas (60.2%) (160,
161). In a study in poor communities in the State of São Paulo, the standardized
prevalence of obesity was significantly higher in the rural area in comparison to the
urban area. In the same study, the researchers also observed that the obesity is

Discussion
111
fundamentally a problem to the women's health since in all age groups women had a
higher prevalence of obesity than men (162). Similarly, the results of the Brazilian
Household Budget Survey (2002-2003) showed that women of rural areas of different
regions in Brazil had a prevalence of 40.7% for overweightness and 12.7% for
obesity (7).
Taking the study of Velasquez-Melendez et al. (163) as reference, in which the
subjects were categorized into those of short stature (women < 150 cm, men <
162cm) and those of normal stature (women > or = 150 cm, men > or = 162 cm), the
population of the current study can be considered as a short one. Indeed, the height
of the participants also suggests a previous undernutrition, especially of women. The
subject’s characteristics also confirmed the vulnerability of women's health. The
abdominal obesity was shown by the waist circumference of women which exceeded
the usual cut-off point for this variable (164). It is well known that excessive
abdominal fat is a determinant factor for insulin resistance and metabolic syndrome
(165, 166).
With regard to the dietetic assessment, the results found for energy expenditure
depicts a significant difference between eutrophic and overweight women. This could
be explained by the fact that this variable is calculated by taking into account body
weight and physical activity and therefore its results could be influenced by these
other variables, as physical activity requests more energy as does the body weight
(167). Possibly, these variables compensate each other in men explaining why there
is no difference observed here. Thus, obese men could have their energy
requirements increased by the higher body weight and eutrophic men by a larger
physical activity factor.
The observed absence of differences between the energy intake for both eutrophic
and overweight groups was also reported by other studies (163). Although, the
intrinsic errors inherent to the dietetic assessment methods (e.g. underreporting) are
well documented, especially concerning the semi-quantitative food frequency

Discussion
112
questionnaire, the instrument approached here (24-hour recall) was shown to
minimize underreporting, which gives more confidence for the analysis here
presented (168). In addition, it is noteworthy to mention that individual organisms can
adapt to low energy intake levels through diet-associated metabolic changes
explaining the similarity for energy intake for both groups (169).
In many studies, gender was shown to be an important factor for obesity in rural
areas. In a study in four rural communities in Mexico, women also had a higher
prevalence for obesity (33.0%) in comparison to men (9.0%) (170). However, in our
study, according to the regression model the gender itself did not have an influence
on the BMI. Actually, physical activity was shown to be an expressive determinant
factor for overweightness in the two rural communities. Data from the linear
regression model confirmed the role of physical activity level (PAL) on body weight
management in the study population; since according to the results, individuals
performing high and moderate PAL have lower BMI than those who practice mild
PAL. This also could explain the fact that the highest prevalence was seen in women
which performed the lowest level of activity due to domestic duties.
Carbohydrate quality and quantity has received considerable attention lately.
However, the hypothesized link between carbohydrate quality and quantity and either
obesity or disease risk is still controversial (171). Dietary fat has been related to
obesity since it has good palatability, high energy density, low effect on satiety and
provides more efficient conversion to fat tissue (167). Most of epidemiologic studies
show an inverse relation between carbohydrate consumption and BMI (172-174).
However, in our cross-sectional study opposite results were obtained from the data
acquired and modeled. According to the regression model, an increase in the values
of the variables KCALBW (Kcal/kg of body weight) and CHOBW (g of carbohydrate
consumed/kg of body weight) would contribute to a reduction of the BMI values in the
two rural communities here investigated. According to the results of the regression
analysis, it could be implied that this population practices an imbalanced diet,
explaining the result found with the variable CHOBW. Indeed, the carbohydrate

Discussion
113
intake of the overweight group is lower than that of the eutrophic one. In the study
population, the physical activity seems to be the main determinant of the observed
overweightness. Similar results were found in a very-low-income population in the
Northeast of Brazil, where the food consumed does not account for the higher
prevalence of obesity among stunted adults (175). Gazzaniga and Burns (176) also
found that overweight individuals consumed less carbohydrate in comparison to their
lean counterparts. Additionally, Miller et al. (177) suggested that body fat is related to
diet composition and exercise activity rather than to energy intake. Randomized
controlled trials with proper controls for confounding dietary variables and behavioral
factors are needed to elucidate the independent effect of carbohydrates on BMI
outcomes. Also, further research is needed to help to explain possible gender and
environmental differences. For instance, some studies point out that the small short
period between pregnancies could also be a determinant factor for overweightness in
women; this was not analyzed in our study.
With regard to lipid consumption, Matos and Ladeia (178) mentioned that in rural
areas the use of saturated fat in food preparation is common. However, in the
present study population, mostly vegetable oil is used for cooking. In addition, the
variable LIPBW (g of lipid consumed/kg of body weight) was not significant, i.e. the
amount of lipid per body weight ingested does not influence the BMI variation in the
study population. Nevertheless, there is some evidence that fat in the diet might not
predispose for obesity (179-181). It is worth mentioning that the modeling applied
here does not have any virtual use for the aim of prediction, since researchers
working with the food consumption surely also possess the information about body
mass and height of individuals, being able to calculate the BMI directly from the data.
Nevertheless, the relevance of the estimated model is to show the existence, the
level and the functional form of the association between BMI and the other analyzed
variables (182).
The food pattern of the two communities expresses an expected monotonous diet,
with the traditional Brazilian combination of rice, beans and beef. Indeed the low

Discussion
114
consumption of vegetables in both groups is typical for the culture of Northern Brazil,
where leafy vegetables and vegetables, in general, are not so common (86). The
added sugar is also observed in the food pattern, especially to coffee and other
beverages, which calls the attention to the glycemic index of the diet practiced by the
studied rural communities. A diet high in fiber-rich, low-glycemic-index foods may
result in less central adiposity, since it may affect the satiety through decreased
gastric emptying, increased colonic transit and decreased insulin response, which
consequently would also decreases hunger and energy intake (183-186). Also, an
imbalance of macronutrient intake can interfere in the biochemical pathways leading
to obesity.
The current study did not address social or demographic issues that may affect
dietary intake. Nevertheless, the genetic factor is a well know component of obesity
(187). However, the role of hereditary factors which may influence the relation
between diet and adiposity was not investigated in the current cross-sectional study.
Prospective studies are needed to address these determinants of obesity especially
in rural and poor areas.
4.2. Biofunctional properties of bacaba phenolic extract 4.3.1. Total phenol, total flavonoid and total anthocyanin contents in bacaba and jenipapo
Total phenolics, total flavonoids and total anthocyanins contents were addressed to
bacaba and jenipapo fruits. Both fruits show good phenolics quality by its content.
However, the results of bacaba qualify this fruit as a good source of phenolics,
flavonoids and even anthocyanins.
The total phenolics contents of bacaba were higher than those found to other native
fruits in a previous study from our lab where cagaita and murici had 32.26 ± 0.051
and 298.26 ± 8.06 mg GAEq/100 g, respectively. A rank of comparison between

Discussion
115
bacaba and jenipapo and fruits already described in literature is depicted in Table
Table 29.

116
Table 29: Comparison between bacaba and jenipapo phenolic, flavonoid and anthocyanin total contents and other fruits described in the literature.
Fruit Scientific name of the fruit
and cultivar (cv.)
Total phenolic (mg GAEq/100
g)
Total flavonoid (mg CTEq/100
g)
Total anthocyanin (mg cyn-3-glu/100
g) Reference
Açaí Euterpe oleracea Mart.
Bacaba Oenocarpus bacaba Mart 1759.27 + 1.01 1134.32 + 0.03 34.69 + 0.00
Bacuri Platonia insignis Mart. 266.80 + 3.3 103.8 + 0.3 -- (188)
Buriti Mauritia vinifera Mart. 108.1 +6.8 71.3 + 3.6 - (188)
Cagaita Eugenia Dysenterica 32.26 ± 0.051 (189)
Jenipapo Genipa americana L. 426.53+ 0.33 7.12 + 0.00 0.0 + 0.00
Guava Psidium guajava L. 344.9 + 33.6 (190)
Murici Byrsonima crassifolia (L.) Rich 298.26 ± 8.06 (189)
Pequi Caryocar villosum (Aubl.) Pers. 4623.4 + 102.4 741.2 + 36.6 - (188)
Rasperry methanolic extract Rubus idaeus L. cv. Hollanda
Boduru 2062.3 + 4.1 41.1 + 0.9 24.3 + 0.3 (94)
Rasperry methanolic extract Rubus idaeus L. cv. Hollanda
Boduru 1822.0 + 11.9 21.1 + 0.1 45.6 + 0.3 (94)
Blackberry water extract Rubus fruticosus L.
cv. Jumbo 2445.9 + 14.8 42.8 + 0.3 87.1 + 1.0 (94)
Blackberry methanolic extract 2786.8 + 21.9 82.2 + 1.3 52.9 + 1.1 (94)
Blueberry Vaccinium myrtilus 670.9 190.3 - (191)
Tucumã Astrocaryum aculeatum G. May 456.8 + 5.2 433.2 + 10.4 - (188)

Discussion
117
Bacaba had a flavonoid content of 1134 ± 0.03 CTE mg/100 g FW versus 7.12 ± 0.00
CTE mg/100 g FW of jenipapo. When comparing flavonoids content of pulp from two
native fruits from Brazil which belongs to the same family of bacaba (Arecaceae)
content of buriti (Mauritia vinifera Mart.) and tucumã (Astrocaryum aculeatum G.
May), both had lower values than bacaba (71.3 + 3.6 CTE mg/100 g FW and 433.2 +
10.4CTE mg/100g FW, respectively). Indeed, regarding the flavonoid contents for
pequi (Caryocar villosumpers Pers.) (741.2 + 36.6 CTE mg/100 g FW), another
Brazilian native fruit, bacaba had higher flavonoid contents (188).
Even when compared to commonly commercial berries which are actually recognized
by its high amounts of phenolics, bacaba results expresses that this fruit can be
included to those berries group. For example, raspberry cultivars, such as Hollanda
Boduru showed a total flavonoid content of 41.1 + 0.9 CTE mg/100g FW. In
comparison to the higher flavonoid content blackberry cv. Jumbo (82.2 + 1.3 CTE
mg/100g FW), bacaba still shows extreme high content (192).
Anthocyanins belong to a class of flavonoid compound which presents the color of
orange, red, purple and blue of fruits and vegetables. From the obtained results, no
anthocyanins were detected in jenipapo fruit. However, bacaba expressed a high
anthocyanin content (34.69 + 0.00 cyn-3-glu mg/100g FW) when compared to the
raspberry cv. Hollanda Boduru (24.3 + 0.3 cyn-3-glu mg/100g FW) (192). Therefore,
this fruit can be considered a good source of anthocyanins. In addition, several
studies have described the biofunctional properties of foods rich in anthocyanins. For
example, in Peru, people consume as a colored infusion made from purple corn (Zea
mays L.), known as “china morada”, to improve health. Actually, purple corn is one of
the plants with higher anthocyanins content and researches have indicated that
purple corn inhibited colorectal carcinogenesis in rats. Purple corn indicated 46 times
more (1.642 cyn-3-glu g/100g FW) and sweet potato showed 5 times more (0.182
cyn-3-glu g/100g FW) of anthocyanin compared to bacaba (193).

Discussion
118
4.3.2. Antioxidant Activity of bacaba and jenipapo extracts
Antioxidant has been defined by the Institute of Medicine of the National Academy of
Sciences as follows: “a substance in foods that significantly decreases the adverse
effects of reactive species, such as reactive oxygen and nitrogen species, on normal
physiologic function in humans”.
According to Wolfe and Liu (102) the measurement of antioxidant activity is an
important screening method to compare the oxidation/reduction potentials of fruits
and vegetables and their phytochemicals in various systems. The antioxidant assays
can deactivate radicals by two main different mechanisms: either by hydrogen atom
transfer (HAT) or single electron transfer (SET). HAT-based methods measure the
classical ability of an antioxidant to quench free radicals by hydrogen donation. SET-
based methods detect the ability of a potential antioxidant to transfer one electron to
reduce any compound, including metals, carbonyls and radicals. In biological
samples, SET and HAT mechanisms occurs simultaneously, with the balance
determined by antioxidant structure and pH (194).
Many chemical methods with different approaches are in wide use to measure the
antioxidant activity as for example the ORAC, TEAC and FRAP assay
(195,175,181,184). ORAC assay is currently the most recommended and used
method. However, even for ORAC assay some misleading are raised as this test
being a unique antioxidant assay to be applied on fruits and vegetables antioxidant
activities. Ou et al. (196) states that ORAC assay covers solely the peroxyl radical
absorbance capacity.
As antioxidants respond to different reactive species in different tests, which is
partially attributed to multiple reaction mechanisms and reaction phases, many
authors highlight that no single antioxidant assay can accurately reflect the
antioxidant potency of food matrix and the need of carrying out more than one type of

Discussion
119
antioxidant test in order to consider the different mechanisms of antioxidant
properties (194, 197, 198).
Seeram et al., found different antioxidant rankings for fruit juices when comparing
different antioxidant assays (ORAC, FRAP, DPPH, LDL oxidation), reinforcing the
need to apply different of assays to cover all aspects of antioxidant activity.
Considering the actual need of applying more than one method for antioxidant
screening investigations, bacaba and jenipapo phenolic extracts were tested for
different antioxidants assays in order to allow comparisons with other food or plant
materials already described in the literature. As most of antioxidant activity features
attributed to food products are based on in vitro assays based solely on chemical
reactions which hardly reflect cellular physiological conditions and do not consider
bioavailability and metabolic issues, the CAA assay was also included as this test
possess a nearer approach to biological systems by having a biological factor (viable
cells) added as a variable (118). Therefore, it is expected that results obtained with
this assay could offer relevant results.
The ORAC assay depicted relevant antioxidant activity for both fruits. Although
bacaba had a higher antioxidant assay, both fruits are among other fruits of well-
known antioxidant activity as blueberry, cranberries and sour cherry as shown in
Table 21 (191, 199). However, none of the samples here analyzed had higher ORAC
value than the Brazilian amazon berry açaí (Euterpe oleracea Mart.) which belongs to
the same family of bacaba (Arecaceae) and is known by the media as a “superfruit”
by its extremely high antioxidant activity. Schauss (200) estimated a ORAC value of
630µmol TEq/g of açaí, in the same units bacaba would have 107.5 µmol TEq/g.
Similarly to ORAC, TEAC value showed higher antioxidant activity for bacaba when
compared to jenipapo. However, in this assay, bacaba did not have such a high value
in comparison to other fruits (e.g. guava) as depicted in Table 30.
.

120
Table 30: Antioxidant values of bacaba, jenipapo and other fruits. *
Sample Scientific name
of the fruit and cultivar (cv.)
ORAC (µmol of
TEeq/100g)
TEAC (µmol TEeq
/100g)
FRAP 1 (mmolFeSO4.7H2
FRAP 2
O Eq/100g) (mmol TEeq/
100g)
DPPH (mmol
TEeq/100g) Reference
Açaí
(FW)
Euterpe oleracea
Mart. cv. allahabad 63000 - - - - (200)
Bacaba
(FW) Oenocarpus Bacaba
10750.71 +
1496.51
3294.55 +
301.55 23.60 ± 0.53
13.44 ±
0.20 34.25 ± 0.20
Blackberry Rubus fruticosus
L.cv Jumbo 17.7 (94)
Blueberry
(FW) Vaccinium 6184 + 775 - - - - (191)
Cranberry
(FW) Vaccinium 9256 + 138 - - - - (191)
Date palm
(DW)
Phoenix dactylifera
L., - - - 3.28 - (201)
Guava
(FW)
Psidium guajava L. 2550 + 160 3790 + 340 3333 + 1.4 - 3200 + 510 (190)
Jenipapo
(FW) Genipa americana L 4655.60 + 562.83 257.62 + 30.46 0.36 ± 0.00 0.21 ± 0.00 0.56 ± 0.02
Raspberry
(FW) Rubus idaeus 4765 + 718 12.7
(94, 191)
Sour Cherry
(FW) Prunus cerasus L 1145 to 1916 2000-2600
(199)
Walnuts
(DW) Juglans regia 6.1
(202)
*FW- fresh weight; DW – dry weight

Discussion
121
Two standard compounds (FeSO4‧7H2O and trolox) were applied for FRAP assay.
bacaba indicated higher FRAP values than jenipapo (23.60 ± 0.54 mmol
FeSO4.7H2O Eq/100g (FW) vs. 0.364 ± 0.00 mmol FeSO4.7H2
203
O Eq/100g (FW).
Khanavi et al. ( ) indicated that the pulp of date palms (cv. Khenizi), which
belongs to the same family as bacaba (Arecaceae), and is usually applied in the folk
medicine in Iran, had 3.28 mmol FeSO4.7H2O Eq/100g (FW) with DMSO extract of
dry plant which is lower than bacaba 23.60 ± 0.53 mmol FeSO4.7H2
94
O Eq/100g
(FW). Berry fruits are known by their usually high antioxidant values when assessed
by different assays. Bacaba had higher FRAP values than the methanol extract
raspberry cv. Hollanda Boduru (12.7 TEq mmol/100g FW) or methanol extract from
blackberry cv. Jumbo (17.7 TEq mmol/100g FW) assessed by Sariburun et al.( ).
From DPPH method, bacaba indicated higher antioxidant power compared to
jenipapo (34.251±0.205 mmol TEq /100g FW and 0.561 ± 0.028 mmol TEq /100g
FW). Bacaba has a high DPPH value when compared to guava (Psidium guajava)
(3.6 TEq mmol/100g FW) and walnuts (Juglans regia) (6.1 TEq mmol/100g DW)
(202).
Regarding the CAA, bacaba and jenipapo phenolic extracts had relatively potent
antioxidant activities with an EC50 value of 0.7 ± 0.61 mg/mL and 4.3 ± 1.61 mg/mL,
respectively. Quercetin, a pure phytochemical, had an EC50 value of 4.66 ± 0.61 µM.
Compared to other fruits assessed by Wolfe et al. with EC50
119
’s of 3.21 ± 0.14 mg/mL
for blackberry, 6.77 ± 1.05 mg/mL for wild blueberry, 11.8 ± 0.9 mg/mL for strawberry
and 14.7 ± 0.8 mg/mL for cranberry ( ), jenipapo fruit seems to have a comparable
EC50 value. However, bacaba with its EC50 of 0.7 ± 0.61 mg/mL has the lowest EC50
119
value of all of these fruits and therefore, seems to have the better antioxidant activity.
Wolfe et al. ( ) showed the highest antioxidant activity for blackberry with a CAA
value of 154 ± 6.8 mg/mL. Blackberry is followed by wild blueberry with a CAA value
of 74.1 ± 12.5 mg/mL, cranberry with 33.6 ± 2.0 mg/mL and strawberry with 42.4 ±
3.3 mg/mL. Bacaba and jenipapo reached CAA values of 305.2 ± 90.8 mg/mL and
83.0 ± 31.3 mg/mL, respectively. Compared to the CAA values named before, it can
be seen that bacaba has the highest CAA value of all the fruits indicating the highest

Discussion
122
antioxidant activity for bacaba fruit. For jenipapo only blackberry has a higher CAA
value and all the other fruits also have a lower value indicating for this fruit also a
very high antioxidant capacity. Wolfe and Liu (2007) concluded in their work that the
CAA values for berries (e.g. wild blueberry, blackberry, strawberry, cranberry) tend to
be the highest ones and that berries tend to be rich in anthocyanins(119). According
to Wolfe et al. (119) the cellular antioxidant quality measure the cellular antioxidant
activity provided by 100µmol of phenolics found in the fruit. The CAQ value for
bacaba is comparable to those found for wild blueberry (2.9) and strawberry (3.0)
(119).
A high antioxidant activity is correlated with a high concentration of phenolics and
therefore higher antioxidant and anticancer activity (61, 204). Song et al. (205)
reported a positive correlation between total phenolics in different vegetables and
CAA values. Fruits rich in anthocyanins have been shown to have the highest
antioxidant activities (66). This could possibly explain the very high antioxidant
activity of bacaba fruit, which, by the results found is an anthocyanin source.
The difference of antioxidant activity values found by different assays for the same
samples, even when using the same standard compound, is based on the reaction
mechanisms from the methods themselves. Either, the fruit extracts could have
different antioxidant values than those stated to their compounds when those are
analyzed purely. Although correlations analyses were not performed, it is implied that
the high antioxidant abilities found in bacaba could be based on its high total
phenolics, flavonoid and anthocyanin contents. Surely, regarding analytical assays of
fruits and vegetables, some factors inherent to the scientific research can influence
the results e.g. environmental characteristics, period of harvesting, cultivar variability,
fruit maturity and extraction solvent procedures. However, this issue doesn’t nullify
the comparison between results already stated in the literature. Indeed, comparing
the results with the other fruits is valuable and gives a clear idea about the status of
bacaba and jenipapo on the discussion of biofunctionality of native fruits in
developing countries.

Discussion
123
4.3.3. Antiproliferative activities of bacaba and jenipapo fruits
Colorimetric assays are extensively used to assess cellular proliferation and viability.
The main advantage of the colorimetric assay besides its high precision is that the
assay can be performed very fast, especially when using a 96 well plate, where a
large number of samples can be measured with a high degree of precision in
multiwell scanning spectrophotometers. Additionally, these assays are non-
radioactive and economic (206, 207). However, regarding the screening of
compounds with intrinsic reductive potential, some precautions have to be taken into
account.
The MTT assay is a test widely used to assess cell viability and proliferation in cell
models, especially for chemical compounds screening. The MTT salt is reduced to
formazan by enzymes in the mitochondria, endosomes and lysosomes and can be
quantified by spectrophotometry (208). However, some authors have argued the
efficacy of MTT test on the purposes aforementioned (209-214). Sims and Plattner
(215) assessed the effect of STI571, an Abl kinase inhibitor that leads melanoma and
breast cancer cells to apoptosis, by the MTT assay. When comparing a non-
reduction assay (Cell titer glo) and MTT, authors observed that in a range of 1-10µM
the MTT test indicated a rise in cell proliferation while cells were actually dead.
Bruggisser et al. (207) reported a possible reducing effect of some screening
compounds (e.g. phytoestrogens, antioxidant substances and dried plant extracts) on
the MTT salt to its violet formazan through cell-independent chemical reaction. All
antioxidant substances they screened reduced the MTT tetrazolium ring. According
to Hanauske (216) the MTT assay is a valuable method but one should be aware of
its limitations and create clever strategies to overcome those and reach confident
results. Based on this discussion and research findings, the antiproliferative effects of
the phenolic extracts from bacaba and jenipapo were assessed by additional assays.
The MUH assay is based on the ability of 4-methylumbelliferyl esters to determine
cell viability. The fluorogenic substrate 4-methylumbelliferyl heptanoate (MUH) was

Discussion
124
shown to be the best substance in providing sufficient activity and low background
(217). The substrate diffuses through the cell membrane and where it is hydrolyzed
by intracellular esterases or sulfatases leading to the highly fluorescent 4-
methylumbelliferone. The MUH has rapidity and simplicity as important advantages,
which are based on a fast uptake and cleavage of the fluorogenic substrate by living
cells which only takes 30 min. According to Virág et al. (217) MUH combines the well-
established MTT assay with the very high sensitivity of fluorescent assays and can
be even accurate when no washing steps are done. However, to prevent a possible
influence of the extracts, a washing step was included. As the production of a
fluorescent compound from a fluorogen substrate in the MUH assay is similar to the
MTT assay, where the tetrazolium salt is cleaved to the blue formazan, these two
assays are completely comparable.
The Methylene blue solution is a redox indicator which turns colorless when reduced
by cellular enzymes. Trypan blue staining is based on the membrane integrity of
living cells since this dye only permeates cellular membranes and stains dead cells.
The MTT and MUH cell-free test indicated that there could be a possible influence of
the fruit extracts themselves on the test chemical. In MTT cell-free test, bacaba fruit
showed a dose-dependent increasing absorbance indicating a reducing effect on
MTT solution whereas jenipapo fruit had no effect on MTT solution. In comparison to
that, jenipapo showed an influencing effect on MUH solution as increasing jenipapo
concentrations lead to increased fluorescence whereas bacaba did not show any
influence on MUH solution.
The plant extracts also had a reducing effect, but for some of them the effect was
only weak. Bruggisser et al. (207) reported that the MTT reduction by the test
compounds could be reduced when a washing step is included (207). When natural
products are assessed, they recommend including a pre-screening in cell-free
systems before any cell culture experiment is performed. Furthermore they
recommend, when reduction occurs, to include a washing procedure and to interpret

Discussion
125
the results carefully to avoid false positive results. It is suggested, that with an
adequate washing the potentially interfering agents can be removed (207).
Therefore, a washing step was included before the chemicals application to all the
assays performed. As relatively potent antiproliferative activities not only in MTT and
MUH assay, but also in Methylene blue and Trypan blue assay could be recorded, it
can be concluded that the results obtained are reliable and not influenced by the fruit
extracts.
The phenolic extracts from bacaba and jenipapo were added to HepG2 human liver
cancer cells to determine whether tumor cell proliferation could be inhibited. The
results gained in MTT, Methylene blue and Trypan blue assay showed that for
bacaba fruit all concentrations ≥ 600 µg/mL and in MUH assay concentrations ≥ 400
µg/mL had stronger inhibiting activity than the control (p < .05). Cell proliferation was
inhibited in a dose-dependent manner when exposed to bacaba concentrations > 400
µg/mL.
However, jenipapo extracts had a weaker inhibiting ability and were less effective
than bacaba extracts. This could also be related to the lower antioxidant capacity of
jenipapo in comparison to bacaba, as shown by the antioxidant activities test. For
jenipapo fruit in MUH assay concentrations ≥ 1400 µg/mL, in MTT assay ≥ 1200
µg/mL, in Methylene blue assay ≥ 1000 µg/mL and in Trypan blue ≥ 800 µg/mL
showed a stronger inhibiting activity than the control (p < .05). Hence, jenipapo fruit
also had more variances between the different assays than bacaba fruit. Jenipapo’s
lower antiproliferative capacity also can be seen when fitted into a non-linear
regression model. The IC50’s calculated with this model are lower for bacaba than for
jenipapo with a lower IC50 indicating higher antiproliferative capacity. IC50 for bacaba
were 649.6 ± 90.3 µg/mL in MTT assay and 1080.97 ± 0.7 µg/mL in MUH assay.
Methylene blue and Trypan blue did not converge in the non-linear regression model.
In comparison to that, IC50’s for jenipapo were 1194.33 ± 96.2 µg/mL in MTT assay,
1386 ± 60.32 µg/mL in MUH assay and 1076.7 ± 53 µg/mL in Methylene blue assay.
Trypan blue also did not fit in the model here.
Discussion
126
Sun et al. (61) assessed the antioxidant and antiproliferative effects of a variety of
common fruits. Highest antiproliferative activity was reached for cranberry and lemon
with an IC50 of 14.50 mg/mL and 30.56 mg/mL, respectively. Apple and strawberry
had an IC50
of 49.37 mg/mL and 56.33 mg/mL, respectively Compared to these
fruits, bacaba and jenipapo have competent antiproliferative activity.
The strong inhibition of tumor cell proliferation in vitro could also be explained by
bacaba’s and jenipapo’s combination of phytochemicals, as it was already suggested
for the antiproliferative effects of apples. These phytochemicals are natural
antioxidants which help to provide an antioxidant balance needed to quench oxygen
species which in turn are associated with tumorigenesis. For example
phytochemicals in apples seem to significantly enhance the antioxidant quality and
their capacity to inhibit tumor cell proliferation in vitro when using HepG2 cells (68).
The inhibition of cancer cell proliferation is – at the moment – attributed to some
unknown phenolic compounds present in bacaba and jenipapo fruits. Probably it is
the additive and synergistic role of phytochemicals present in these fruits which
contributes significantly to the potent ability to inhibit tumor cell proliferation in vitro.
Furthermore, the higher antiproliferative effect of bacaba could also be assigned to
the anthocyanin content of this fruit, as jenipapo does not have detectable content of
these compounds. Multiplicity studies have been showing that plants containing high
content of anthocyanins also depict an antiproliferative effect to cancer cells using in
vitro or in vivo models (218, 219).
Sun et al. (61) found no obvious linear relation between total phenolic content and
inhibition of HepG2 cell proliferation. For the fruits tested in this thesis it has to be
further investigated whether there is a positive correlation or not. Also a significant
relation between total antioxidant activity and antiproliferative activity of the fruits
tested has to be investigated.

Discussion
127
Both assays, MTT and MUH, respectively, give very similar quantitative results which
can be compared (217). IC50
values for bacaba were different for MTT and MUH
assay with 649.6 ± 90.3 µg/mL in MTT and 1080.97 ± 0.7 µg/mL in MUH assay.
Although the cell-free test indicated an interaction between jenipapo extract and the
MUH reagent by the observed increase in the fluorescence this behavior was not
reproduced in any of the tests with cells. Indeed, jenipapo had antiproliferative effect
in all assays and the IC50
values for jenipapo showed comparable results to MTT
(1194.33 ± 96.2 µg/mL) and MUH assay (1386 ± 60.32 µg/mL).
The modified Methylene blue was also comparable therefore this staining can be
recommended. Absorbance is read with a microplate reader and reflects the number
of surviving cells. When multiple samples have to be counted simultaneously this
method is faster and more accurate and especially useful. However, it has to be
considered that cells treated with Methylene blue are necessarily killed by the
addition of glutaraldehyde and the method. Therefore it can only be used when
counting is the final act (220).
The accurate cell counts are essential in both quantitative and qualitative
experiments. To date, the trypan blue assays is commonly used for cell counting and
to determine cell proliferation or cytotoxicity effects through blue staining followed by
microscopic quantification using a hemacytometer. Results of Trypan blue assay did
not converge in the nonlinear model. However, the cell proliferation rates achieved in
this assay for bacaba or jenipapo, were lower than the other three methods
assessed. This difference could be associated to the loss of cells due to
trypsinization before the counting which could lead to underestimation of the cell
number. In addition, trypan blue staining is reliable only when a free cells suspension
is used and cell clumps could influence the accuracy of this assay. Moreover, cell
counting with a hemacytometer can be very subjective and suffer an analyst effect as
it can vary from researcher to researcher as observed during this work (220). In
Discussion
128
addition, the counting of cells included in the Trypan blue assay is a very time
consuming way to assess cell proliferation.
Virág et al. (217) suggested that the differences gained between the assays could
not be due to a difference in the detection technique (e.g. fluorimetric or colorimetric),
but to a difference in the assay principle itself (e.g. different enzymes acting to
assess metabolic functions, loss of membrane integrity). Traditional cell counting
based on staining methods as for example the Trypan blue and Methylene blue
staining are good methods to prove the results gained in other assays. These two
assays are not influenced by natural extracts as it is possible for MTT and MUH
assay when no washing step is included. Most times, these assays are measured
directly on the plate in which the cells were grown and stimulated with the compound
of interest and therefore eliminate some disadvantages which can be seen by Trypan
blue cell counting.
Albeit the test fruit implied a reduction of MTT salt by bacaba extract, results of cell
proliferation was very similar to MUH where the extract did not interfere. Also, as
pointed out by Liu et al. (162,167,170,177,176, 208, 209). The MTT assay is not only
based on the salt reduction but also in the salt endocytosis giving another factor to
the cell viability measurement. Thereby, the MTT assay is valid as an endocytosis
which is a fundamental feature of most living cells. Also, the PBS washing step could
remove the surplus of extracts compounds located extracellularly and thus
contributing to the similarity between results of MTT and the other non-reduction
assays used. Moreover, MTT was highly and positively correlated with all other
assays in a significant manner (p < .05), indicating the application of this assay to
assess cell proliferation in bacaba and jenipapo extracts. Therefore, based on our
findings, MTT method was established with confidence to further anti-proliferative
effects in the following experiments with bacaba and jenipapo extracts in our lab.

Discussion
129
4.3.4. Characterization of phenolic compounds of bacaba extract by HPLC-DAD-MSn
The characterization of phenolic compounds is important as these compounds are
associated with a range of different health properties. HPLC with diode array and
mass spectrometric detection has been proven to be very useful for the
characterization of individual phenolic compounds. Ten polyphenols were detected
and characterized in bacaba extracts in the present study. Based on their UV spectral
data, most of these compounds were characterized as quercetin and rhamnetin
derivatives besides a range of further flavonoids. So far, Oenocarpus bacaba Mart.
extracts have not been systematically analyzed. Consequently, the present study
represents the first chemical investigation of this plant material. Due to the limited
availability of reference compounds, the similarity of spectral characteristics and of
the chromatographic behavior allow tentative peak assignment. For this purpose,
mass spectrometric analyses were also performed (92). Nine compounds were
tentatively identified based on the comparison with results previously described in the
literature. Although some compounds were not identified, they are relevant to
comprehensively characterize the so-called chromatographic fingerprint which is a
plant-specific characteristic. Taking together the outcome of the present study, it
becomes apparent that Bacaba is a potential source of pigments and natural
antioxidants which should be considered for future exploitation.
4.3.5. Chemopreventive effect of bacaba extract on MCF -7 cells
Diet-derived compounds have shown modulation of tumor growth through
modification of gene expression, post-translational events and apoptosis (221).
Unlimited cell proliferation and resistance to apoptosis is a typical hallmark of the
carcinogenic process as is the resistance to chemotherapeutic drugs. As a
consequence, researchers are engaged to investigate biofunctional properties of
foods as a strategy to cancer prevention. According to epidemiological evidence,
phytochemicals such as phenolic compounds may play an important role in cancer

Discussion
130
prevention (222). Their efficacy and mechanisms against cancer is a key target to
unfold the evidences shown by epidemiological studies and reinforce the relevant
role of diet and nutrition on the prevention of such disease.
The Brazilian biodiversity offers a great variety of fruit species endowed with an
infinite number of phytochemicals with potential preventive or therapeutic properties
for non-communicable diseases. Our study indicates that a phenolic extract from
bacaba shows antiproliferative properties on MCF-7 breast cancers cells in a dose-
dependent manner after 96 h of incubation (Figure 22).
These results led to the investigation of the mechanisms involved in cell death,
especially whether the effect of bacaba extracts on MCF-7 cells is due an apoptotic
effect. Apoptosis is a physiological and complex process of a regulated destruction of
the cell as a result of a cascade of events involving various families of proteins
influenced by the activity of many genes (223). Opposition to apoptosis or defects in
its regulation can lead to the proliferation and accumulation of immortal cells and
consequently be a sign of cancer. For that reason the selective induction of apoptosis
by bacaba phenolic extract in cancer cells is an important possibility to highlight the
potential effect of this fruit on cancer prevention (224). Indeed, the investigation of
apoptotic mechanisms of bioactive compounds in cancer cells can help to elucidate
the possible preventive role of these compounds evidenced by epidemiological
studies.
The antiproliferative activity and apoptotic induction of bacaba phenolics on MCF-7
cells were clearly demonstrated in this study. According to previous reports, caspase-
3 has been reported to initiate DNA fragmentation by proteolytically inactivating ICAD
(inhibitor of caspase-activated deoxyribonuclease), which releases the active
endonuclease CAD (caspase-activated deoxyribonuclease), allowing CAD to enter
the nucleus and degrade chromosomal DNA (225). Albeit MCF-7 cells are caspase-
3-deficient, some reports have shown that these cells undergo apoptosis even
without DNA fragmentation (226). However, in the current study a mild DNA

Discussion
131
fragmentation was observed after 72h of incubation with 500µg/mL of bacaba extract
corroborating the hypothesis that other caspases or even other endonucleases can
be involved on this event (Figure 23). For instance, e
227
ndonuclease G results in DNA
fragmentation in murine embryonic fibroblast cells following UV irradiation,
independently of caspase activation ( ).
There are two main signaling pathways with respect to apoptosis; the intrinsic or
mitochondrial pathway and the extrinsic or death receptor pathway. Apoptosis
triggered by activation of the mitochondria-dependent caspases pathway can be an
important mechanism of chemoprevention. Mitochondria can play a critical role
during apoptotic cell death by different mechanisms such as production of oxygen
free radicals, control of Ca2+ ions, and extrusion of apoptogenic molecules such as
cytochrome c or AIF (apoptosis inducing factor). The impairment of mitochondrial
function and the resulting collapse in the mitochondrial membrane potential (ΔΨm)
symbolizes a great stimulus to cell death being a hallmark of permeability transition
and many studies have shown that apoptosis is associated with the decrease of the
ΔΨm 228 ( , 229). Dissipation of ΔΨm
229
occurs early during apoptosis and leads to the
permeabilization of the mitochondrial membrane which facilitates the efflux of
cytochrome c and its interaction with APAF-1(Apoptotic protease activating factor 1)
and caspase-9 to form the apoptosome and initiate the caspase cascade,
consequently leading to the activation of caspase-3, -6, -7.( ).
The cell death receptor pathway, mediated particularly by active/cleaved caspase-8,
has an elementary role in the maintenance of tissue homeostasis and is initiated by
binding of cell death inducing ligands to death receptors and consequently, activation
of caspase-8, -3, -6, -7 (230).
The caspases are a family of aspartate-specific cysteine proteases which play an
important role in the apoptotic process. Caspases are synthesized as zymogens
(procaspases) that need to be cleaved at aspartate residues to become active.
Caspases can be classified according to their functionality as initiator and effector

Discussion
132
caspases. The initiator caspases, such as, caspase-8, -9 and 10, contain a long pro-
domain that is used to recruit enzymes to high molecular weight activation platforms
such as the apoptosome in the intrinsic mitochondrial pathway or death-induced
signaling complex in the death receptor pathway. In contrast, effector caspases, such
as caspase-3, -6 and -7 cleave cellular substrates e.g. PARP and lamin A/C (229,
231). In the current study, the activation of caspases -6, -8 and -9 was observed after
24 h of incubation with bacaba extracts (1-1000 µg/mL), however with different
efficiencies. The results for caspase-6 activation indicate a dose-dependent response
but in a different fashion than caspase-9, suggesting different kinetics of activation
between these two caspases (Figure 28). Fluorometric results also showed an
activation of caspase-8, however the level of activation was the same for all doses of
bacaba extract applied. Caspase-8 is an initiator caspase involved in the apoptotic
signals triggered by death receptors (232). But, recent studies have shown that
caspases-8 is not only activated in the death receptor pathway, but can also be
activated independently, e.g. by direct cleavage through other proteases (granzyme
B). Chung et al. (229) found caspase-8 activation in HeLa cells induced by the
flavonoid eupafolin without the participation of the death receptor signaling. While
testing caspase inhibitors the researchers observed that caspase-8 became active
after the activation of caspases -3 and -9 and therefore hypothesized that caspase-3
is required for the activation of caspase-8 during eupafolin-induced apoptosis. In the
death receptor-independent activation pathway it is suggested that caspase-8 act as
an executioner caspases. It was also suggested that caspases-8 activation is
mediated in a post-mitochondrial event by caspases-6 and -3 (233). Our observation
that caspase-8 was activated only to a low extent in a dose-independent manner
suggests that caspase-8 cleavage in MCF-7 cells is due to a cross talk between the
two apoptotic pathways and not directly related to an activation of the death-receptor
pathway. Since MCF-7 cells do not express caspase-3 due to a genetic defect (226,
234), the current results suggest that caspases 6- or even caspase-9 could activate
caspase-8 directly in a cross-talk between the intrinsic and extrinsic apoptotic
pathways (234, 235).

Discussion
133
Currently, caspase-6 is considered to be an executioner caspase that is activated
downstream of caspase-3 during apoptosis (236). However, recent evidence
suggests that caspase-6 can be the initiator caspase after treatment with resveratrol
(237). According to Ekert et al. (237, 236, 238, 239) the activation of caspase-6
occurs prior to the activation of caspase-3, -2 and 7 (238). Therefore, the authors
considered caspase-6 not only to be an executioner but also an initiator caspase
(238).
No difference on the activity of caspase-6 was observed for cells incubated with 200,
400 and 600µg/mL of bacaba extract. However, a significant decrease on caspase-6
activation occurred to the treatment with 800 and 1000µg/mL (p < .05). Probably,
under these concentrations caspase-6 is already degraded due to an advanced
apoptotic stage. A kinetic study (time dependent) could elucidate and confirm this
hypothesis.
Although our results depicted activation for caspase -6 and -8, the most important
activation, proportionally, is attributed to caspase-9 (Figure 28). Results indicate that
apoptosis induced by bacaba extract on MCF-cells was mainly mediated by
caspases-9 activation. Kinetic studies in a time-dependent manner would be helpful
to clarify the sequence of caspase activation events and apoptotic features triggered
by bacaba extracts.
Caspase -3 is recognized as the main executioner caspase responsible for the PARP
cleavage. However, as aforementioned, MCF-7 cells do not express caspase-3, a
result confirmed by western blotting (data not shown) (234). Therefore, as PARP
cleavage was observed after 48 h of incubation with bacaba extract, it was assumed
that another caspase could cleave PARP, in the absence of caspase – 3. Since in
cells incubated with 1000µg/mL of bacaba extract and the specific caspase-9
inhibitor Z-LEHD-VAD, no PARP cleavage was observed we propose that in the
absence of caspase -3, caspase -9 become the main responsible enzyme for the
cleavage of PARP (Figure 29). Albeit PARP is a recognized substrate for caspase-3,

Discussion
134
studies in vitro has shown that many caspases, including caspase-9 can cleave
PARP when added at high concentrations (239). Moreover, other studies have shown
that in the absence of caspase-3 another caspases may take over the role of this
caspase (235).
In summary, the induction of apoptosis in MCF-7 cells by bacaba extract is caspase-
3 independent and seems to be mediated in part by caspase-6 and caspase-9.
Apoptosis is accompanied by PARP cleavage, suggesting that in these caspase-3-
deficient cells caspase-9 may mediate this apoptotic hallmark.
These results, to the best of our knowledge are the first to report on the biofunctional
properties of bacaba and to characterize its effect on cell proliferation. They indicate
that bacaba extract exert their action on cell proliferation inhibition mainly through the
induction of apoptosis. Based on these findings we suggest that bacaba may be
considered as a potential chemopreventive fruit. With all the caution called for
concluding from in vitro cell line experiments with regard to the responses in in vivo
studies of cancer cells, the dietary bacaba phenolics may be claimed to be an
important preventive agent in cancer disease. Therefore, a deeper comprehension on
how bacaba compounds exert their anticancer effect is important to allow claims for
its consumption for cancer prevention to be made.

Summary
135
5. Summary
The Brazilian nutritional profile is currently characterized by the so-called "nutrition
transition process" i.e. the population presents nutritional status characteristics of
both developing and developed countries. Therefore, malnutrition is present not only
in the form of undernutrition but increasingly also presents as overweight and obesity.
Some studies suggest that this is not only a particular problem of urban societies but
also of rural communities.
Recently, Brazil has impressively advanced on issues which address nutrition,
agriculture and health within a sustainable framework. One of the recent initiatives
encompasses the Brazilian Food and Nutrition Security Policy, which could be
considered as the vanguard of this theme by covering different dimensions of
nutritional issues, as defined hereunder: “Food and Nutrition Security is the
achievement of the right of all people to access food regularly and permanently, with
quality and enough quantity, without compromising the access to other basic needs,
based on food practices to promote health, with respect to cultural differences and
being social, economic and environmentally sustainable”.
Since the Brazilian Food and Nutritional Policy is characterized by a broad view on
food and nutrition, different components related to food and nutrition have to be
considered. Therefore, the health side of the food, in a pluralistic vision has to be
taken into account. Thus, food and their consumers are unavoidably connected.
Beyond classical nutrients, much attention has recently been focused on bioactive
compounds and their preventive role on non-communicable diseases such as
diabetes, cardiovascular diseases and cancer. Therefore researchers are
increasingly interested to unfold the preventive biochemical processes of these
compounds.

Summary
136
Hence, the current research aimed to investigate health enhancing properties of
traditional Brazilian fruits within the Food and Nutrition Security definition of the
country. Given the interdisciplinary feature of the topic Food and Nutrition Security,
the work was performed in two stages. The first one encompasses a nutritional
survey with two rural communities in APA – Cantão, Tocantins State, Brazil and the
second part comprises experimental laboratory research.
The outcome from the nutrition survey showed a high level of food insecurity among
the families (84.2%). The nutritional profile of the study population expressed a high
prevalence of overweight for the adults (53.7%). Regression analysis showed that the
high Body Mass Index (BMI) is influenced by the consumption of an imbalanced diet
and the physical activity level. Furthermore, women had a higher prevalence of
overweight and obesity in comparison to men. Another observation is that rural
communities have a monotonous diet with very low consumption of fruits and
vegetables. Besides the negative effect on their body composition, this last result
points to the risk of developing micronutrient deficiencies, i.e. hidden hunger. Based
on the outcome and the demand presented by the participants in the nutrition survey,
two fruits available in the region were chosen to investigate their possible
biofunctional properties.
Different assays were performed with Bacaba (Oenocarpus bacaba Mart.) and
Jenipapo (Genipa americana L.) phenolic extracts. Extracts from both fruits showed
antioxidant and antiproliferative capacities. Since bacaba displayed higher activities
than Jenipapo, this fruit was chosen for a more detailed investigation of the
biochemical mechanisms involved. The results showed that bacaba phenolic extracts
induced apoptosis in MCF-7 breast cancer cells through the mitochondrial pathway.
Caspase-6, -8 and -9 were activated when compared to the untreated control in a
dose dependent manner (p<.05). However, caspase-9 showed the highest activation.
Since MCF-7 cells do not express caspase-3 and based on additional investigations
on PARP (Poly (ADP-ribose) polymerase) - cleavage, the experiments suggest that
caspase-9 plays an important role in the observed apoptotic effect. The laboratory

Summary
137
work thus emphasizes the potential healthy properties of traditional fruits from the
Brazilian biodiversity with high antioxidant activities.
Altogether, the results indicate the need of a better nutritional education with the
involved communities in order to promote healthy eating practices and to increase
the consumption of fruit and vegetables. Based on this, it is suggested for
government and policy makers to take action in rural communities.
Indeed, it is undeniable that the biodiversity available in Brazil is a huge treasure and
source of novel “superfruits”. Therefore, the current work reinforces the development
of research in this area in order of identify health enhancing neglected traditional
fruits and to promote their consumption, add value and generate income to small
farmers and traditional communities with not only the improvement of their economic
power, but also of their diets and health respecting their tradition and culture. Not to
mention the contribution to biodiversity preservation since plants that were merely
discarded could now have a multifactor value in line with the Brazilian Food and
Nutritional Security policy.

Zusammenfassung
138
6. Zusammenfassung
Derzeit ist das brazilianische Ernährungsprofil vom so genannten „nutrition transition
process“ geprägt, das heißt, die Landbevölkerung weist Ernährungscharakteristika
von Industrie- und Entwicklungsländern auf. Deshalb ist Fehlernährung in Brazilien
nicht nur als Unterernährung vorzufinden, sondern auch in Form von Übergewicht
und Adipositas. Manche Studien belegen, dass dies nicht nur ein Problem in Städten
sondern auch inländlichen Gebieten ist.
In letzter Zeit hat sich Brasilien in eindrucksvoller Weise auf verschiedenen Gebieten
wie z.B. Ernährung, Landwirtschaft und Gesundheit weiterentwickelt und diese in ein
Nachhaltigkeitskonzept integriert. Eine der neuesten Initiativen ist die brasilianische
Nahrungs- und Ernährungssicherheitsstrategie. Die Grundidee der Initiative ist
Vorreiter in diesem Themengebiet, indem sie verschiedene Dimensionen von
Ernährungsfragen verbindet und sind wie folgt definiert: “Die Nahrungs- und
Ernährungssicherheit ist das Erreichen des Rechts aller Menschen, regelmäßigen
und permanenten Zugang zu qualitativ hochwertiger Nahrung in ausreichender
Menge zu haben, ohne Gefährdung anderer grundlegender menschlicher
Bedürfnisse, basierend auf Ernährungsweisen, die unter Einbeziehung kultureller
Hintergründe und unter Berücksichtigung sozialer, ökonomischer und ökologischer
Faktoren die Gesundheit fördern“.
Die brasilianische Nahrungs- und Ernährungsinitiative beinhaltet eine holistische
Betrachtung von Lebensmittel und Ernährung. Aus diesem Grund müssen
verschiedene Aspekte, die mit Lebensmitteln und Ernährung zu tun haben,
ganzheitlich gesehen werden. Daraus folgt, dass Nahrung und ihre Konsumenten
unvermeidbar miteinander verbunden sind.
In der Wissenschaft wird derzeit bioaktiven Substanzen und ihrer präventiven Rolle
bei nicht übertragbaren Krankheiten, wie z.B. Diabetes, Herz-Kreislauferkrankungen
und Krebserkrankungen, viel Aufmerksamkeit geschenkt. Deshalb steigt das

Zusammenfassung
139
Interesse der Wissenschaftler, diesen Vorgang auf biochemischer Ebene zu
entschlüsseln.
Aus diesem Grund war es Ziel der vorliegenden Arbeit, die gesundheitsfördernden
Eigenschaften von traditionellen brasilianischen Früchten auf Basis der Nahrungs-
und Ernährungssicherheitsinitiative Brasiliens zu untersuchen. Da dieses Konzept
interdisziplinäre Aspekte aufweist, wurde die Studie in zwei Abschnitten durchgeführt.
Im ersten Teil wurde in zwei ländlichen Gebieten des APA-Cantão, Tocantins State,
Brasilien, eine Ernährungserhebung durchgeführt. Der zweite Teil beinhalte die
Untersuchung von traditionellen brasilianischen Früchten im Labor.
Die Fragebögen zur Ernährungssituation zeigten, dass bei den 84,2% der Familien
eine große Ernährungsunsicherheit herrscht. Der Ernährungsstatus der befragten
Bevölkerungsgruppe weist darauf hin, dass es eine sehr hohe Prävalenz (53,7%) von
Übergewicht bei den Erwachsenen existiert. Des Weiteren bestätigte die
Regressionsanalyse, dass ein hoher Body Mass Index (BMI) von Faktoren wie z.B.
einer unausgewogenen Ernährung und dem Grad der körperlichen Aktivität
beeinflusst wird. Darüber hinaus zeigten die Frauen im Vergleich zu den Männern
eine höhere Prävalenz für Übergewicht und Adipositas. Zusätzlich wurde beobachtet,
dass im ländlichen Gebiet die Bevölkerung eine recht einseitige Ernährungsweise
aufweist und Früchte sowie auch Gemüse sehr wenig konsumiert werden. Neben
den Einflüssen auf den Körperbau zeigt dieses Ergebnis eine hohe Gefahr des
Risikos für Mikronährstoffmangel (versteckter Hunger), auf. Auf Grundlage der
Ergebnisse und Wunsch der Teilnehmer der Studie wurden zwei Früchte aus der
Region ausgewählt, um sie auf potentiell biofunktionelle Eigenschaften hin zu
untersuchen.
Verschiedene biochemische Assays wurden mit phenolischen Extrakten aus Bacaba
(Oenocarpus bacaba Mart.) und Jenipapo (Genipa americana L.) durchgeführt. Beide
Fruchtextrakte zeigten sehr hohe antioxidative und antiproliferative Eigenschaften.
Da Bacaba eine höhere Aktivität aufwies als Jenipapo, wurde es für die weiteren

Zusammenfassung
140
Experimente ausgewählt. Die antioxidative Aktivität vom Bacaba-Extrakt wurde an
der MCF-7 Brustkrebs-Zelllinie untersucht. Die Ergebnisse zeigten, dass der
phenolischen Extrakt aus Bacaba eine pro-apoptotische Wirkung aufwies, die durch
eine Aktivierung des mitochondrialen Signalweges zu erklären ist. Im Gegensatz zur
Kontrollprobe hatte Bacaba eine dosis-abhängige Wirkung auf die Aktivierung von
den Caspasen -6, -8, und -9. Caspase-9 zeigte dabei die höchste Aktivierung. Die
Tatsache, dass MCF-7 Zellen nicht Caspase-3 exprimieren und die Ergebnisse
weiterer Untersuchungen an der PARP (poly(ADP-ribose)-Polymerase ) -Spaltung
deuten darauf hin, dass Caspase-9 eine wichtige Rolle bei der Apoptose spielt.
Insgesamt unterstreichen die Laborergebnisse die potentiellen
gesundheitsfördernden Eigenschaften und hohen antioxidativen Wirkungen der
traditionellen Früchte aus Brasilien.
Zusammenfassend deuten die Ergebnisse darauf hin, dass es wichtig ist, den
beteiligten Dörfern Ernährungsbildung anzubieten, um gesunde Ernährungsweisen
und einen höheren Konsum von Früchten und Gemüse zu fördern. Darauf basierend
sollten die Regierung und die Gesetzgeber neue Inititativen zur Förderung einer
gesunden Ernährung in den ländlichen Gebieten initiieren.
Es ist unbestreitbar, dass die verfügbare Artenvielfalt eine der größte Schätze
Brasiliens ist und eine Quelle vieler neuer „Superfrüchte“. In dieser Arbeit wurde
gezeigt, wie wichtig es ist, die Forschung in diesem Bereich mit dem Ziel zu
intensivieren, um vernachlässigte Früchte mit gesundheitsfördernden Eigenschaften
zu identifizieren und ihren Verzehr zu fördern. Dies würde neben der Möglichkeit für
Kleinbauern und traditionelle Gemeinschaften, zusätzliches Einkommen zu erzielen,
auch unter Berücksichtigung der Tradition und Kultur die Ernährungsweise und
Gesundheit fördern. Doch nicht nur der wirtschaftliche Vorteil, sondern auch der
Erhalt der biologischen Vielfalt im brasilianischen Regenwald wäre gewährleistet,
womit diese Früchte, gemäß der neuen brasilianischen Nahrungs- und
Ernährungssicherheitsinitiative, einen multifaktoriellen Wert für die Menschen dieser
Gebiete aufweisen würden.

Resumo
141
7. Resumo
O perfil nutricional brasileiro atualmente é caracterizado pelo processo conhecido
com transição nutricional, isto é, a população apresenta simultaneamente estado
nutriticional característico de países desenvolvidos e em desenvolvimento. Por tal
motivo, a má nutrição está presente não somente na forma de desnutrição, mas
também de sobrepeso e obesidade. Alguns estudos sugerem que este quadro pode
não ser apenas um problema particular de sociedades urbanas mas também de
comunidades rurais.
Recentemente, o Brasil tem avançado expressivamente nos assuntos relacionados
às questões nutricionais, agrícolas e de saúde, dentro do contexto da
sustentabilidade. Umas das iniciativas recentes abrange a Política Nacional de
Segurança Alimentar e Nutricional, a qual pode ser considerada na vanguarda deste
tema por abranger as diferentes dimensões da nutrição, como descrito a seguir: “A
segurança alimentar e nutricional consiste na realização do direito de todos ao
acesso regular e permanente a alimentos de qualidade, em quantidade suficiente,
sem comprometer o acesso a outras necessidades essenciais, tendo como base
práticas alimentares promotoras de saúde que respeitem a diversidade cultural e que
sejam ambiental, cultural, econômica e socialmente sustentáveis.”
Em virtude na Política Nacional de Segurança Alimentar e Nutricional possuir uma
visão abrangente da alimentação e nutrição, diferentes componentes envovidos com
este tema devem ser considerados. Desta forma, o aspecto de saúde deve ser visto
dentro de um contexto pluralístico. Estando o alimento e seus consumidores
inevitavelmente conectados.Além dos nutrientes clássicos, compostos bioativos, tais
como substâncias fenólicas, têm chamado a atenção por seu papel na prevenção de
doenças crônicas não transmissíveis, tais como diabetes, doenças cardiovasculares
e câncer. Assim, pesquisadores estão progressivamente interessados em desdobrar
os processos bioquímicos envolvidos no poder preventivo destas substâncias.

Resumo
142
Assim, a presente pesquisa tem como objetivo investigar propriedades de saúde em
frutas tradicionais brasileiras com base no conceito de segurança alimentar e
nutricional. Em virtude da característica interdisciplinar inerente à temática
segurança alimentar e nutricional, o trabalho foi desenvolvido em duas etapas e
considerou as diferentes dimensões da nutrição. A primeira etapa incluiu um
inquérito nutricional com duas comunidades rurais na APA – Cantão, Tocantins; e a
segunda etapa compreendeu um pesquisa experimental em laboratório.
Os resultados do inquérito nutricional demonstram elevado nível de insegurança
alimentar entre as famílias (84.2%). O perfil nutricional da população estudada
expressa a elevada prevalência de sobrepeso e obesidade (53.7%) em adultos. A
análise de regressão demonstrou que o Índice de Massa Corporal (IMC) é
influenciado pelo consumo de uma dieta desbalanceada e pelo nível de atividade
física. Aqueles que desenvolvem elevado nível de atividade física tiveram menores
valores de IMC. Ademais, é importante ressaltar que as mulheres tiveram elevada
prevalência de sobrepeso e obesidade em comparação aos homens. Outra
observação diz respeito à ingestão dietética das comunidades rurais que demonstra
uma dieta monótona com baixo consumo de frutas e verduras. Adicionalmente ao
estado nutricional encontrado, este último resultado chama a atenção para a
exposição ao risco de carências de micronutrientes (ex. fome oculta). Com base nos
resultados da presente pesquisa e na demanda apresentada pelos participantes do
inquérito nutricional, duas frutas disponíveis na região e sugeridas pelos
participantes foram escolhidas para trabalho experimental em laboratório com
objetivo de investigar suas possíveis propriedades funcionais.
Differentes ensaios químicos e bioquímicos foram realizados com extrato fenólico de
bacaba (Oenocarpus bacaba Mart.) e jenipapo (Genipa americana L.). Ambos
extratos tiveram expressiva atividade antioxidante e antiproliferativa de maneira
dose-dependente. Entretanto, como a bacaba demonstrou maior potencial
antioxidante e antiproliferativo que o jenipapo, esta fruta foi escolhida para
investigação mais detalhada no que tange os processos bioquímicos envolvidos na

Resumo
143
atividade antiproliverativa do extrato de bacaba na linha celular de câncer de mama
MCF-7. Os resultados demonstram que o extrato fenólico de bacaba induziu
apoptose por meio da via mitocondrial com ativação de caspases. Caspase-6, -8 e -9
foram significativamente ativadas em comparação ao controle não estimulado de
forma dose-dependente (p<.05). Entretanto, caspase-9 teve o maior nível de
ativação. Em virtude da linha de célula MCF-7 não expressar caspase-3 e com base
em investigação adicional quanto à clivagem da proteína PARP (polimerase poli (do
ADP-ribose)) , os experimentos sugerem que caspase-9 possui importante papel no
efeito apoptótico observado. A pesquisa laboratorial aqui relatada enfatiza o
potencial de saúde de frutas tradicionais da biodiversidade brasileira com elevados
níveis de atividade antioxidante.
De forma geral, os resultados apontam a necessidade de atividades de educação
nutricional com as comunidades envolvidas de forma a promover práticas
alimentares saudáveis e aumentar o consumo de frutas e verduras. Com base nos
dados obtidos, sugere-se às instituições governamentais e elaboradores e
executores de políticas públicas que ações sejam desenvolvidas com atenção às
comunidades rurais.
Ainda, é inegável que a biodiversidade disponível no Brasil é um grande tesouro e
fonte de novas “superfrutas”. Por tal motivo, este trabalho reforça o desenvolvimento
de pesquisa nesta área de forma a realçar as propriedades de saúde de frutas
negligenciadas, promover o consumo, agregar valor e gerar renda à pequenos
agricultores e comunidades tradicionais, não somente para aprimorar seu poder
econômico, mas também suas dietas e saúde, respeitando a tradição e a cultura
local. Cabe ainda mencionar a contribuição para a preservação da biodiversidade, já
que à espécies que seriam meramente descartadas pode ser atribuído um valor
plural (social, ecônomico, de saúde, nutricional etc.) em conssonância com a Política
Nacional de Segurança Alimentar e Nutricional brasileira.

References
144
8. References
1. Lajolo, F. M., Functional foods: Latin American perspectives. British journal of
nutrition 2002, 88, (SupplementS2), S145-S150.
2. Popkin, B. M.; Adair, L. S.; Ng, S. W., Global nutrition transition and the
pandemic of obesity in developing countries. Nutrition reviews 2012, 70, (1), 3-21.
3. Finco, M. V. A.; Doppler, W., Bioenergy and sustainable development: The
dilemma of food security and climate change in the Brazilian savannah. Energy for
sustainable development 2010, 14, (3), 194-199.
4. Ab'Saber, A. N., Os domínios morfoclimáticos da América do Sul. Primeira
aproximação. Geomorfologia 1977, 52, (121).
5. INPE Monitoramento da floresta.; São José dos Campos, 2004.
6. BRAZIL, Plano Amazônia Sustentável: Diretrizes para o desenvolvimento
sustentável da Amazônia Brasília In MMA (Brazilian Ministry of the Environment):
2008.
7. IBGE, Pesquisa de orçamentos familiares (POF) 2002-2003: análise da
disponibilidade domiciliar de alimentos e do estado nutricional no Brasil. In Brazilian
Institute of Geography and Statistics (IBGE): Rio de Janeiro, 2004; p 76.
8. Alencar, A.; Nepstad, N.; McGrath, D.; Moutinho, P.; Pacheco, P.; Dias, M. D.
C. V.; Filho, B. S., Desmatamento na Amazônia: indo além da emergência crônica.
Brazilian National Institute for Research in Amazonia (INPA): Manaus, 2004.
9. Margulis, S. Causes of Deforestation of the Brazilian Amazon; 2003.
10. Fearniside, P. M. A floresta Amazônia nas mudanças globais; Instituto
Nacional de Pesquisas Amazônicas (INPA): Manaus, 2003; p 134.
References
145
11. Fearniside, P. M., Soybean cultivation as a threat to the environment in Brazil.
Environmental conservation 2001, 28, 23-28.
12. INPE Monitoramento da floresta amazônica brasileira por satélite: relatório
2000-2001.; 2002.
13. IBGE, Indicadores de desenvolvimento sustentável: Brasil 2004. In IBGE: Rio
de Janeiro, 2004.
14. Lui, G. H.; Molina, S. M. G., Ocupação humana e transformação das
paisagens na Amazônia brasileira. Amazônica - Revista de antropologia 2009, 1, (1).
15. Guilhoto, J. J. M.; Ichiara, S. M.; Silveira, F. G.; Diniz, B. P. C.; Azzoni, C. R.;
Moreira, G. R. C., A importância da agricultura familiar no Brasil e em seus estados.
In ANPEC, 2007.
16. Nestel, P.; Bouis, H. E.; Meenakshi, J. V.; Pfeiffer, W., Biofortification of staple
food crops. The journal of nutrition 2006, 136, (4), 1064-1067.
17. Johns, T.; Eyzaguirre, P. B. Nutrition and the environment; Geneva, 2002.
18. WHO Preventing chronic diseases: a vital investiments.; Geneva, 2005; p 182.
19. Popkin, B. M., The nutrition transition in the developing world. Development
Policy Review 2003, 21, (5-6), 581-597.
20. Comissão Intergestora Tripartite (CIT) Diretrizes e Recomendações. Cuidado
Integral de Doenças Crônicas Não-Transmissíveis. Promoção da Saúde, Vigilância,
Prevenção e Assistência. In Brazilian Ministry of Health: Brasília, 2007.
21. Velásquez-Meléndez, G.; Gazzinelli, A.; Côrrea-Oliveira, R.; Pimenta, A. M.;
Kac, G., Prevalence of metabolic syndrome in a rural area of Brazil. Sao Paulo
Medical Journal 2007, 125, 155-162.

References
146
22. Sichieri, R.; Castro Joelma Ferreira, G.; Moura Aníbal, S., Fatores associados
ao padrão de consumo alimentar da população brasileira urbana. Cadernos de
saúde pública 2003.
23. Ames, B. N.; Shigenaga, M. K.; Hagen, T. M., Oxidants, antioxidants, and the
degenerative diseases of aging. Procedigs of the national academy of science USA
1993, (90), 7915-7922.
24. Liu, R. H., Health benefits of fruit and vegetables are from additive and
synergistic combinations of phytochemicals. American Journal of Clinical Nutrition
2003, 78, (3 Suppl), 517S-520S.
25. Daryani, A.; Basu, S.; Becker, W.; Larsson, A.; Riserus, U., Antioxidant intake,
oxidative stress and inflammation among immigrant women from the Middle East
living in Sweden: associations with cardiovascular risk factors. Nutrition, metabolism,
and cardiovascular diseases : NMCD 2007, 17, (10), 748-56.
26. Health Situation. In Health, S. S. o., Ed. Government of Tocantins State:
Palmas, 2004; p 89.
27. BRAZIL, Lei orgânica de Segurança Alimentar e Nutricional. Federal law n
11346, September 15th
28. BRAZIL, Federal decree nº 6.040, February 7
, 2006. In 2006.
th, 2007. Institui a Política
Nacional de Desenvolvimento Sustentável dos Povos e Comunidades Tradicionais.
In Diário Oficial da União; Poder executivo, February 8th
29. BRAZIL, Inter-ministerial Administrative Order n. 239, July 21
, 2007.: 2007.
st, 2009.
Estabelece orientações para a implementação do Plano Nacional de Promoção das
Cadeias de Produtos da Sociobiodiversidade, e dá outras providências. In Diário
Oficial da União, July 22nd, 2009.: Brasília, 2009.
References
147
30. Williams, M.; Pehu, E.; Ragasa, C. Health enhancing foods: opportunities for
strengthening the sector in developing countries; The International Bank for
Reconstruction and Development/The World Bank: Washington, DC, 2006.
31. Johns, T.; Sthapit, B. R., Biocultural diversity in the sustainability of
developing-country food systems. Food and nutrition bulletin 2004, 25, (2), 143-55.
32. Nutraingredients Functional foods in Japan.
http://www.nutraingredients.com/Research/Functional-foods-in-Japan (1st march),
33. Ohama, H.; Ikeda, H.; Moriyama, H., Health foods and foods with health
claims in Japan. Toxicology 2006, 221, (1), 95-111.
34. Scientific concepts of functional foods in Europe. Consensus document. The
british journal of nutrition 1999, 81 Suppl 1, S1-27.
35. Coppens, P.; da Silva, M. F.; Pettman, S., European regulations on
nutraceuticals, dietary supplements and functional foods: A framework based on
safety. Toxicology 2006, 221, (1), 59-74.
36. Siro, I.; Kapolna, E.; Kapolna, B.; Lugasi, A., Functional food. Product
development, marketing and consumer acceptance--a review. Appetite 2008, 51, (3),
456-67.
37. Palou, A.; Serra, F.; Pico, C., General aspects on the assessment of functional
foods in the European Union. European journal of clinical nutrition 2003, 57 Suppl 1,
S12-7.
38. Williams, G. R. G. a. C. M., Functional foods-concept to products. Wooodhead
Publishing Limited Abington Hall: Cambrige, England, 2003.
39. Lawrence, M.; Rayner, M., Functional foods and health claims: a public health
policy perspective. Public health nutrition 1998, 1, (2), 75-82.
References
148
40. Codex Alimentarius Commission. Appendix 1: Draft guidelines for use of
health and nutrition claims. . In Food and Agriculture Organization of the United
Nations, World Health Organization, CL1995/26-FL: 1995.
41. BRAZIL, Brazilian Health Surveillance Agency (ANVISA). Resolução n° 18,
April 30th, 1999. Aprova o regulamento técnico que estabelece as diretrizes básicas
para análise e comprovação de propriedades funcionais e ou de saúde alegadas em
rotulagem de alimentos, constante do anexo desta portaria. In Diário Oficial da
União; Poder executivo, de May 3rd
42. BRAZIL, Brazilian Health Surveillance Agency (ANVISA). Resolução n° 19,
April 30
,1999.: Brasília, 1999.
th, 1999. Regulamento técnico para procedimento de registro de alimentos
com alegações de propriedades funcionais e ou de saúde em sua rotulagem. In
Diário Oficial da União; Poder executivo, May 3rd
, 1999.: Brasília, 1999.
43. BRAZIL, Brazilian Health Surveillance Agency (ANVISA). Resolução RDC n°
2, January 7th, 2002. Aprova o regulamento técnico de substâncias bioativas e
probióticos isolados com alegação de propriedades funcional e ou de saúde. In
Diário Oficial da União; Poder executivo, January 9th
44. Jew, S.; Vanstone, C. A.; Antoine, J. M.; Jones, P. J., Generic and product-
specific health claim processes for functional foods across global jurisdictions. The
journal of nutrition 2008, 138, (6), 1228S-36S.
, 2002.: Brasília, 2002.
45. Silveira, T. F. V. d.; Vianna, C. M. d. M.; Mosegui, G. B. G., Brazilian
legislation for functional foods and the interface with the legislation for other food and
medicine classes: contradictions and omissions. Physis: revista de saúde coletiva
2009, 19, 1189-1202.
46. Stringheta, P. C.; Oliveira, T. T. d.; Gomes, R. C.; Amaral, M. d. P. H. d.;
Carvalho, A. F. d.; Vilela, M. A. P., Políticas de saúde e alegações de propriedades
funcionais e de saúde para alimentos no Brasil. Revista brasileira de ciências
farmacêuticas 2007, 43, 181-194.

References
149
47. Johns, T.; Smith, I. F.; Eyzaguirre, P. B., Understanding the links between
agriculture and health. In IFPRI (International Food Policy Research Institute):
Washington, 2006; Vol. Focus 13.
48. Bélanger, J.; Johns, T., Biological diversity, dietary diversity, and eye health in
developing country populations: establishing the evidence-base. Ecohealth 2008, 5,
(3), 244-256.
49. Sabbe, S.; Verbeke, W.; Deliza, R.; Matta, V.; Van Damme, P., Effect of a
health claim and personal characteristics on consumer acceptance of fruit juices with
different concentrations of açaí (Euterpe oleracea Mart.). Appetite 2009, 53, (1), 84-
92.
50. Pochettino, M. L.; Puentes, J. P.; Buet Costantino, F.; Arenas, P. M.; Ulibarri,
E. A.; Hurrell, J. A., Functional foods and nutraceuticals in a market of bolivian
immigrants in Buenos Aires (Argentina). Evidence-based complementary and
alternative medicine : eCAM 2012, 2012, 320193.
51. Yang, Y., Scientific substantiation of functional food health claims in China.
The journal of nutrition 2008, 138, (6), 1199S-205S.
52. Arai, S., Global view on functional foods: asian perspectives. The british
journal of nutrition 2002, 88 Suppl 2, S139-43.
53. Tuorila, H.; Lähteenmäki, L.; Pohjalainen, L.; Lotti, L., Food neophobia among
the finns and related responses to familiar and unfamiliar foods. Food quality and
preference 2001, 12, (1), 29-37.
54. Barcelos, M. D. d.; Aguiar, L. K.; Ferreira, G. C.; Vieira, L. M., Willingness to
try innovative food products: a comparison between british and brazilian consumers.
Brazilian administration review 2009, 6, (1), 50-61.
55. Butler, R. A.; Laurance, W. F., New strategies for conserving tropical forests.
Trends in ecology & evolution 2008, 23, (9), 469-72.

References
150
56. Blasa, M.; Gennari, L.; Angelino, D.; Ninfali, P., Fruit and vegetable
antioxidants in health. In Bioactive foods in promoting health - fruits and vegetables,
1st ed.; Watson, R. R.; Preedy, V. R., Eds. Academic press: Burlington, 2010; p 737.
57. Cheeseman, K. H.; Slater, T. F., An introduction to free radical biochemistry.
British medical bulletin 1993, 49, (3), 481-493.
58. Halliwell, B.; Gutteridge, J. M. C., Free Radicals in Biology and Medicine.
Oxford University Press: USA, 1999.
59. Duthie, G.; Crozier, A., Plant-derived phenolic antioxidants. Current opinion in
clinical nutrition and metabolic care 2000, (3), 447-451.
60. Ames, B. N.; Gold, L. S., Endogenous mutagens and the causes of aging and
cancer. Mutation research 1991, (250), 3-16.
61. Sun, J.; Chu, Y.-F.; Wu, X.; Liu, R. H., Antioxidant and antiproliferative
activities of common fruits. Journal of agriculture and food chemistry 2002, (50),
7449-7454.
62. Liu, R. H., Potential synergy of phytochemicals in cancer prevention.
Mechanism of action. Journal of nutrition 2004, pp 3479S-3485S.
63. Liu, R. H., Health benefits of fruit and vegetables are from additive and
synergistic combinations of phytochemicals. American journal of clinical nutrition
2003, pp 517S-520S.
64. Chu, Y.-F.; Sun, J.; Wu, X.; Liu, R. H., Antioxidant and antiproliferative
activities of common vegetables. Journal of agriculture and food chemistry 2002, pp
6910-6916.
65. Liu, M.; Li, X. Q.; Weber, C.; Lee, C. Y.; Brown, J.; Liu, R. H., Antioxidant and
Antiproliferative Activities of Raspberries. J of agriculture and food chemistry 2002,
pp 2926-2930.

References
151
66. Proteggente, A. R.; Pannala, A. S.; Paganga, G.; Van Buren, L.; Wagner, E.;
Wiseman, S.; Van De Put, F.; Dacombe, C.; Rice-Evans, C. A., The antioxidant
activity of regularly consumed fruit and vegetable reflects their phenolic and vitamin C
composition. Free radical research 2002, pp 217-233.
67. Dong, M.; He, X., Liu, R.H., Phytochemicals of black bean seed coats:
Isolation, structure elucidation, and their antiproliferative and antioxidative activities.
Journal of agriculture and food chemisty 2007, pp 6044-6051.
68. Eberhardt, M. V.; Lee, C. Y.; Liu, R. H., Antioxidant activity of fresh apples.
Nature 2000, pp 903-904.
69. Boudet, A.-M., Evolution and current status of research in phenolic
compounds. Phytochemistry 2007, pp 2722-2735.
70. Dragsted, L. O.; Strube, M.; Larsen, J. C., Cancer-protective factors in fruit and
vegetables: biochemical and biological background. Pharmacology & toxicology
1993, pp 116-35.
71. Rice-Evans, C.-A.; Miller, N. J.; Bolwell, P. G.; Bramley, P. M.; Pridham, J. B.,
The relative antioxidant activities of plant-derived polyphenolic flavonoids. Free
radical research 1995, pp 375-383.
72. Rice-Evans, C.; Miller, N.; Paganga, G., Antioxidant properties of phenolic
compounds. Trends in plant science 1997, 2, (4), 152-159.
73. Boivin, D.; Blanchette, M.; Barrette, S.; Moghrabi, A.; Baliveau, R., Inhibition of
cancer cell proliferation and suppression of TNF-induced activation of NFκB by edible
berry juice. Anticancer research 2007, 27, (2), 937-948.
74. Ray Sahelian, M. D., Index of herbs, supplements, and natural therapies. In
RAYSAHELIAN.COM: 2005

References
152
75. Ghasemzadeh, A.; Jaafar, H. Z. E.; Rahmat, A., Antioxidant activities, total
phenolics and flavonoids content in two varieties of Malaysia young Ginger (Zingiber
officinale Roscoe). Molecules 2010, 15, (6), 4324-4333.
76. Society, A. C., Cancer Facts & Figures 2007. American Social Society , Inc:
Atlanta, 2007.
77. Surh, Y.-J., Cancer chemoprevention with dietary phytochemicals. Nature
reviews.Cancer 2003, 3, (10), 768-780.
78. Seeram, N. P.; Adams, L. S.; Zhang, Y.; Lee, R.; Sand, D.; Scheuller, H. S.;
Heber, D., Blackberry, black raspberry, blueberry, cranberry, red raspberry, and
strawberry extracts inhibit growth and stimulate apoptosis of human cancer cells in
vitro. Journal of agricultural and food chemistry 2006, 54, (25), 9329-39.
79. He, X.; Liu, R. H., Cranberry phytochemicals: Isolation, structure elucidation,
and their antiproliferative and antioxidant activities. Journal of agricultural and food
chemistry 2006, 54, (19), 7069-74.
80. Liu, M.; Li, X. Q.; Weber, C.; Lee, C. Y.; Brown, J.; Liu, R. H., Antioxidant and
antiproliferative activities of raspberries. Journal of agricultural and food chemistry
2002, 50, (10), 2926-30.
81. Meyers, K. J.; Watkins, C. B.; Pritts, M. P.; Liu, R. H., Antioxidant and
antiproliferative activities of strawberries. Journal of agricultural and food chemistry
2003, 51, (23), 6887-92.
82. McCusker, J., How to measure and evaluate community health : a self-
teaching manual for rural health workers. Macmillan: London, 1990.
83. Segall-Corrêa, A. M.; Marin-Leon, L., Food Security in Brazil: the proposal and
application of the Brazilian Food Insecurity Scale from 2003 to 2009. Segurança
alimentar e nutricional 2009, 16, (2).

References
153
84. Pitanga, F. J.; Lessa, I., Anthropometric indexes of obesity as an instrument of
screening for high coronary risk in adults in the city of Salvador--Bahia. Arquivos
brasileiro de cardiologia 2005, 85, (1), 26-31.
85. Liu, C.; Xie, B.; Chou, C.-P.; Koprowski, C.; Zhou, D.; Palmer, P.; Sun, P.;
Guo, Q.; Duan, L.; Sun, X.; Anderson Johnson, C., Perceived stress, depression and
food consumption frequency in the college students of China seven cities. Physiology
& behavior 2007, 92, (4), 748-754.
86. Abadio Finco, F. D. B.; Finco, M. V. A., An Assessment of the Brazilian
Popular Restaurant Program as an Integrated Action for Food Security and Health
Promotion. In Food Security: quality management, issues and economic implications,
Jones, M. A.; Hernandez, F. E., Eds. Nova Science Pub Incorporated: Hauppauge,
2012.
87. Schofield, W. N., Predicting basal metabolic rate, new standards and review of
previous work. Human nutrition. Clinical nutrition 1985, 39 Suppl 1, 5-41.
88. FAO Human Energy Requirements. Report of a joint FAO/WHO/UNU. Expert
Consultation; Rome, 2004.
89. Nelson, M.; Black, A. E.; Morris, J. A.; Cole, T. J., Between- and within-subject
variation in nutrient intake from infancy to old age: estimating the number of days
required to rank dietary intakes with desired precision. American journal of clinical
nutrition 1989, 50, (1), 155-67.
90. Bhargava, A.; Guthrie, J. F., Unhealthy eating habits, physical exercise and
macronutrient intakes are predictors of anthropometric indicators in the women's
health trial: feasibility study in ninority Populations. The british journal of nutrition
2002, 88, (6), 719-28.
91. A.O.A.C., Official methods of analysis 16th ed.; A.O.A.C. International:
Gaitherburg, 2000; Vol. 2.
References
154
92. Kammerer, D.; Carle, R.; Schieber, A., Characterization of phenolic acids in
black carrots (Daucus carota ssp. sativus var. atrorubens Alef.) by high-performance
liquid chromatography/electrospray ionization mass spectrometry. Rapid
communications in mass spectrometry : RCM 2004, 18, (12), 1331-40.
93. Singleton, V. L.; Rossi, J. A. J., Colorimetry of total phenolics with
phosphomolybdic-phosphotungstic acid reagents. American journal of enology and
viticulture 1965, 16, 144-158.
94. Sariburun, E.; Şahin, S.; Demir, C.; Türkben, C.; Uylaşer, V., Phenolic content
and antioxidant activity of raspberry and blackberry cultivars. Journal of food science
2010, 75, (4), C328-C335.
95. Sellappan, S.; Akoh, C. C.; Krewer, G., Phenolic compounds and antioxidant
capacity of Georgia-Grown blueberries and blackberries. Journal of agricultural and
food chemistry 2002, 50, (8), 2432-2438.
96. Cao, G.; Prior, R. L., Measurement of oxygen radical absorbance capacity in
biological samples. Methods of enzymology 1999, 299, 50-62.
97. Re, R.; Pellegrini, N.; Proteggente, A.; Pannala, A.; Yang, M.; Rice-Evans, C.,
Antioxidant activity applying an improved ABTS radical cation decolorization assay.
Free radical biology & medicine 1999, 26, (9-10), 1231-7.
98. Benzie, I. F.; Strain, J. J., The ferric reducing ability of plasma (FRAP) as a
measure of "antioxidant power": the FRAP assay. Analytical biochemistry 1996,
(239), 70-76.
99. Benzie, I. F.; Strain, J. J., Ferric reducing/antioxidant power assay: Direct
measure of total antioxidant activity of biological fluids and modified version for
simultaneous measurement of total antioxidant power and ascorbic acid
concentration. In Methods of enzymology, Academic Press: 1999; Vol. Volume 299,
pp 15-27.

References
155
100. Al-Duais, M.; Müller, L.; Böhm, V.; Jetschke, G., Antioxidant capacity and total
phenoilcs of Cyphostemma digitatum before and after processing; use of different
assays. European food research and technology 2009, 228, (5), 813-821.
101. Al-Duais, M.; Mueller, L.; Boehm, V.; Jetschke, G., Antioxidant capacity and
total phenoilcs of Cyphostemma digitatum before and after processing; use of
different assays. Eur Food Res technol 2008, 228, 813-821.
102. Wolfe, K. L.; Liu, R. H., Cellular antioxidant activity (CAA) assay for assessing
antioxidants, foods, and dietary supplements. Journal of agricultural and food
chemistry 2007, 55, (22), 8896-8907.
103. Schütz, K.; Kammerer, D.; Carle, R.; Schieber, A., Characterization of phenolic
acids and flavonoids in dandelion (Taraxacum officinale WEB. ex WIGG.) root and
herb by high-performance liquid chromatography/electrospray ionization mass
spectrometry Rapid communications in mass spectrometry : RCM 2005, 19, 179-186.
104. Yoon, H.; Liu, R. H., Effect of selected phytochemicals and apple extracts on
NF-kappaB activation in human breast cancer MCF-7 cells. Journal of agricultural
and food chemistry 2007, 55, (8), 3167-73.
105. Gong, J. P.; Traganos, F.; Darzynkiewicz, Z., A Selective procedure for DNA
extraction from apoptotic cells applicable for gel electrophoresis and flow cytometry.
Analytical biochemistry 1994, 218, (2), 314-319.
106. Doppler, W., Contribution of the Farming Systems Approach to Regional Food
Security and Rural Infrastructure. LIT Verlag Münster-Hamburg: 1993; Vol. I.
107. DIEESE, Estatísticas do Meio Rural. In DIEESE (Statistics and
socioeconomics research department): São Paulo, 2006.
108. Tai, D. A., Family resources and their impact on living standard and food
security of farmers in the mountainous farming systems in northwest Vietnam.
Margraf Verlag: Weikersheim, 2004.

References
156
109. Marini, M.; Pieroni, O., Relación entre la familia y el entorno social. Tipología
de las familias agrícolas en una zona marginal (Calabria). In Cambio rural en Europa.
Colóquio de Montpellier., Research, A., Ed. Ministerio de Agricultura, Pesca y
Alimentacion.: Madrid, 1987; pp 205-247.
110. Berdegue, J.; Reardon, T.; Escobar, G., La cresciente importancia del empleo
y el ingresso rurales no agricolas. In Desarrollo de las economias rurales,
ECHEVERRIA, R. G., Ed. Banco Interamericano de Desarrollo – BID: Washington,
DC, 2001.
111. Reardon, T.; Vosti, S., Links between rural poverty and the environment in
developing countries: asset categories and investment poverty. . World development
1995, 23, (9), 1495-1506.
112. Kitchaicharoen, J., Farming & Rural System economics. Margraf Publishers:
Weikersheim, 2003; Vol. 47, p 172.
113. Kitchairaroen, J., Socio-economic assessement of the farm eesources and
living standards of different ethnic groups. A case from northern Thailand. Margraf
Verlag: Weikersheim, 2003; Vol. 47.
114. Abu Shaban, A., Socio-Economic Assessment of Using Treated Wastewater in
Irrigated Agriculture. Margraf Verlag: Weikersheim, 2007.
115. Greene, W. H., Econometric analysis. 6th ed.; 2008.
116. Hill, R. C.; Griffiths, W. E.; Lim, G. C., Principles of econometrics. 3rd ed.;
2008.
117. Lockey, A. S.; Handley, R.; Willett, K., 'Clearance' of cervical spine injury in the
obtunded patient. Injury 1998, 29, (7), 493-7.
118. Liu, R. H.; Finley, J., Potential cell culture models for antioxidant research.
Journal of agricultural and food chemistry 2005, 53, (10), 4311-4.

References
157
119. Wolfe, K. L.; Kang, X.; He, X.; Dong, M.; Zhang, Q.; Liu, R. H., Cellular
antioxidant activity of common fruits. Journal of agriculture and food chemistry 2008,
pp 8418-8426.
120. Fabre, N.; Rustan, I.; de Hoffmann, E.; Quetin-Leclercq, J., Determination of
flavone, flavonol, and flavanone aglycones by negative ion liquid chromatography
electrospray ion trap mass spectrometry. Journal of the american society for mass
spectrometry 2001, 12, (6), 707-715.
121. Markham, K. R.; Mabry, T. J., A procedure for the ultraviolet spectral detection
of ortho-dihydroxyl groups in flavonoids. Phytochemistry 1968, 7, (7), 1197-1200.
122. de Rijke, E.; Out, P.; Niessen, W. M. A.; Ariese, F.; Gooijer, C.; Brinkman, U.
A. T., Analytical separation and detection methods for flavonoids. Journal of
chromatography A 2006, 1112, (1-2), 31-63.
123. Moraes, S. L. d.; Tomaz, J. C.; Lopes, N. P., Liquid chromatography–tandem
mass spectrometric method for determination of the anti-inflammatory compound
vicenin-2 in the leaves of L. ericoides Mart. Biomedical chromatography: BMC 2007, 21, (9), 925-930.
124. Hong, Y. J.; Tomas-Barberan, F. A.; Kader, A. A.; Mitchell, A. E., The flavonoid
glycosides and procyanidin composition of deglet noor dates (Phoenix dactylifera).
Journal of agricultural and food chemistry 2006, 54, (6), 2405-2411.
125. Gil-Izquierdo, A.; Riquelme, M. T.; Porras, I.; Ferreres, F., Effect of the
rootstock and interstock grafted in Lemon Tree (Citrus limon (L.) Burm.) on the
flavonoid content of lemon Juice. Journal of agricultural and food chemistry 2003, 52,
(2), 324-331.
126. Caristi, C.; Bellocco, E.; Panzera, V.; Toscano, G.; Vadalà, R.; Leuzzi, U.,
Flavonoids detection by HPLC-DAD-MS-MS in lemon juices from sicilian cultivars.
Journal of agricultural and food chemistry 2003, 51, (12), 3528-3534.

References
158
127. Siciliano, T.; De Tommasi, N.; Morelli, I.; Braca, A., Study of flavonoids of
Sechium edule (Jacq) Swartz (Cucurbitaceae) different edible organs by liquid
chromatography photodiode array mass spectrometry. Journal of agricultural and
food chemistry 2004, 52, (21), 6510-6515.
128. Sánchez-Rabaneda, F.; Jáuregui, O.; Casals, I.; Andrés-Lacueva, C.;
Izquierdo-Pulido, M.; Lamuela-Raventós, R. M., Liquid chromatographic/electrospray
ionization tandem mass spectrometric study of the phenolic composition of cocoa
(Theobroma cacao). Journal of mass spectrometry 2003, 38, (1), 35-42.
129. Pacheco-Palencia, L. A.; Duncan, C. E.; Talcott, S. T., Phytochemical
composition and thermal stability of two commercial açai species, Euterpe oleracea
and Euterpe precatoria. Food chemistry 2009, 115, (4), 1199-1205.
130. Ferreres, F.; Ribeiro, V.; Izquierdo, A. G.; Rodrigues, M. Â.; Seabra, R. M.;
Andrade, P. B.; Valentão, P., Rumex induratus leaves: interesting dietary source of
potential bioactive compounds. Journal of agricultural and food chemistry 2006, 54,
(16), 5782-5789.
131. Han, J.; Ye, M.; Qiao, X.; Xu, M.; Wang, B.-r.; Guo, D.-A., Characterization of
phenolic compounds in the Chinese herbal drug Artemisia annua by liquid
chromatography coupled to electrospray ionization mass spectrometry. Journal of
pharmaceutical and biomedical analysis 2008, 47, (3), 516-525.
132. Qiao, X.; He, W.-n.; Xiang, C.; Han, J.; Wu, L.-j.; Guo, D.-a.; Ye, M.,
Qualitative and quantitative analyses of flavonoids in Spirodela polyrrhiza by High-
performance liquid chromatography coupled with mass spectrometry. Phytochemical
analysis 2011, n/a-n/a.
133. Ferreres, F.; Silva, B. M.; Andrade, P. B.; Seabra, R. M.; Ferreira, M. A.,
Approach to the study of C-glycosyl flavones by ion trap HPLC-PAD-ESI/MS/MS:
application to seeds of quince (Cydonia oblonga). Phytochemical analysis 2003, 14,
(6), 352-359.

References
159
134. Park, S. H.; Kim, H.; Rhyu, D. Y., Flavonoids from the stems of eastern
picklypear Opuntia humfusa, Cactaceae. Jounal of applied biological chemistry 2007, 50, (4), 254-258.
135. Seeram, N. P.; Lee, R.; Scheuller, H. S.; Heber, D., Identification of phenolic
compounds in strawberries by liquid chromatography electrospray ionization mass
spectroscopy. Food chemistry 2006, 97, (1), 1-11.
136. Kim, H.; Park, S. H., Metabolic profiling and fiscrimination of two cacti
cultivated in Korea using HPLC-ESI-MS and multivariate statistical analysis. Journal
of korean society of applied biological chemistry 2009, 52, (4), 346-352.
137. Lee, J.; Mitchell, A. E., Quercetin and isorhamnetin glycosides in onion (Allium
cepa L.): varietal comparison, physical distribution, coproduct evaluation, and long-
term storage stability. Journal of agricultural and food chemistry 2011, 59, (3), 857-
863.
138. Gariboldi, E.; Mascetti, D.; Galli, G.; Caballion, P.; Bosisio, E., LC-UV-
Electrospray-MS-MS mass spectrometry analysis of plant constituents inhibiting
xanthine oxidase. Pharmaceutical research 1998, 15, (6), 936-943.
139. Gutzeit, D.; Wray, V.; Winterhalter, P.; Jerz, G., Preparative isolation and
purification of flavonoids and protocatechuic acid from Sea Buckthorn juice
concentrate (Hippophaë rhamnoides L. ssp. rhamnoides) by high-speed counter-
current chromatography. Chromatographia 2007, 65, (1), 1-7.
140. Bastos, D. H. M.; Saldanha, L. A.; Catharino, R. R.; Sawaya, A. C. H. F.;
Cunha, I. B. S.; Carvalho, P. O.; Eberlin, M. N., Phenolic antioxidants identified by
ESI-MS from yerba maté (Ilex paraguariensis) and green tea (Camelia sinensis)
extracts. Molecules 2007, 12, 423-432.
141. Pawlowska, A. M.; Oleszek, W.; Braca, A., Quali-quantitative analyses of
flavonoids of Morus nigra L. and Morus alba L. (Moraceae) fruits. Journal of
agricultural and food chemistry 2008, 56, (9), 3377-3380.

References
160
142. Marín, A.; Ferreres, F.; Tomás-Barberán, F. A.; Gil, M. I., Characterization and
quantitation of antioxidant constituents of sweet pepper (Capsicum annuum L.).
Journal of agricultural and food chemistry 2004, 52, (12), 3861-3869.
143. Piao, X. L.; Mi, X. Y.; Tian, Y. Z.; Wu, Q.; Piao, H. S.; Zeng, Z.; Wang, D.;
Piao, X., Rapid identification and characterization of antioxidants from Ligularia
fischeri. Archives of pharmacal research 2009, 32, (12), 1689-94.
144. Shi, P.; He, Q.; Song, Y.; Qu, H.; Cheng, Y., Characterization and identification
of isomeric flavonoid O-diglycosides from genus Citrus in negative electrospray
ionization by ion trap mass spectrometry and time-of-flight mass spectrometry.
Analytica chimica acta 2007, 598, (1), 110-118.
145. Wang, H.; Feng, F., Identification of components in Zhi-Zi-Da-Huang decoction
by HPLC coupled with electrospray ionization tandem mass spectrometry,
photodiode array and fluorescence detectors. Journal of pharmaceutical and
biomedical analysis 2009, 49, (5), 1157-1165.
146. Amico, V.; Napoli, E. M.; Renda, A.; Ruberto, G.; Spatafora, C.; Tringali, C.,
Constituents of grape pomace from the Sicilian cultivar `Nerello Mascalese'. Food
chemistry 2004, 88, (4), 599-607.
147. Jerz, G.; Gutzeit, D.; Winterhalter, P., Characterization of acylated flavonoid
glycosides from Sea Buckthorn (Hippophaë rhamnoides) juice concentrate by
preparative HSCCC/ESI-MS-MS. In Flavor and health benefits of small fruits,
American Chemical Society: 2010; Vol. 1035, pp 253-265.
148. Hessler, J. A.; Budor, A.; Putchakayala, K.; Mecke, A.; Rieger, D.; Banaszak
Holl, M. M.; Orr, B. G.; Bielinska, A.; Beals, J.; Baker, J., Atomic force microscopy
study of early morphological changes during apoptosis. Langmuir 2005, 21, (20),
9280-9286.
149. Häcker, G., The morphology of apoptosis. Cell and tissue research 2000, 301,
(1), 5-17.

References
161
150. Patel, T.; Gores, G. J.; Kaufmann, S. H., The role of proteases during
apoptosis. The FASEB journal : official publication of the Federation of American
Societies for Experimental Biology 1996, 10, (5), 587-97.
151. Martin-Renedo, J.; Mauriz, J. L.; Jorquera, F.; Ruiz-Andres, O.; Gonzalez, P.;
Gonzalez-Gallego, J., Melatonin induces cell cycle arrest and apoptosis in
hepatocarcinoma HepG2 cell line. Journal of pineal research 2008, 45, (4), 532-40.
152. Hengartner, M. O., The biochemistry of apoptosis. Nature 2000, 407, (6805),
770-6.
153. Jänicke, R. U.; Sprengart, M. L.; Wati, M. R.; Porter, A. G., Caspase-3 Is
Required for DNA Fragmentation and Morphological Changes Associated with
Apoptosis. Journal of biological chemistry 1998, 273, (16), 9357-9360.
154. Blair, R. A., An Assessment of Agricultural Risk and Diversification on Farming
Familie’s Living Standard under Fuzzy Conditions: A case from Guyana. Margraf
Verlag: Weikersheim, 2007; Vol. 90.
155. Finco, M. V. A.; Finco, F. D. B. A., Biodiesel and the regional sustainable
development: impact on farm income and food security in northern Brazil. Segurança
alimentar e nutricional 2011, 18, 21-30.
156. Finco, M. V. A.; Doppler, W., Jatropha curcas and Ricinus communis in
Brazilian Cerrado: a farming and rural systems economics approach. Informe
GEPEC (Online) 2009, 13, 56-65.
157. IBGE Pesquisa nacional de amostra de domicílios (PNAD)/ National
Household Survey; Rio de Janeiro, 2004.
158. Doppler, W., Contribution of the farming systems approach to regional food
security and rural infrastructure. In Regional food security and rural infrastructure,
Thimm, H. U.; Hahn, H.; Reinhard, I.; Schulz, D., Eds. LIT Verlag: Münster-Hamburg,
1993; Vol. I.
References
162
159. Fine, E. J.; Feinman, R. D., Thermodynamics of weight loss diets. Nutrition &
metabolism 2004, 1, (1), 15.
160. Dos Anjos, L. A.; Ferreira, B. C.; de Vasconcellos, M. T.; Wahrlich, V., Energy
expenditure of adults in the city of Niterói, state of Rio de Janeiro: nutrition, physical
activity and health survey--PNAFS. Ciência e saúde coletiva 2008, 13, (6), 1775-84.
161. Velasquez-Melendez, G.; Gazzinelli, A.; Correa-Oliveira, R.; Pimenta, A. M.;
Kac, G., Prevalence of metabolic syndrome in a rural area of Brazil. São Paulo
medical journal 2007, 125, (3), 155-62.
162. Marinho, S. P.; Martins, I. S.; Perestrelo, J. P. P.; Oliveira, D. C. d., Obesidade
em adultos de segmentos pauperizados da sociedade. Revista de nutrição 2003, 16,
195-201.
163. Velasquez-Melendez, G.; Martins, I. S.; Cervato, A. M.; Fornes, N. S.; Marucci,
M. F.; Coelho, L. T., Relationship between stature, overweight and central obesity in
the adult population in Sao Paulo, Brazil. International journal of obesity and related
metabolic disorders : journal of the International Association for the Study of Obesity
1999, 23, (6), 639-44.
164. Han, T. S.; Feskens, E. J.; Lean, M. E.; Seidell, J. C., Associations of body
composition with type 2 diabetes mellitus. Diabetic medicine : a journal of the british
diabetic association 1998, 15, (2), 129-35.
165. Carey, V. J.; Walters, E. E.; Colditz, G. A.; Solomon, C. G.; Willett, W. C.;
Rosner, B. A.; Speizer, F. E.; Manson, J. E., Body fat distribution and risk of non-
insulin-dependent diabetes mellitus in women. The Nurses' Health Study. American
journal of epidemiology 1997, 145, (7), 614-9.
166. McKeigue, P. M.; Shah, B.; Marmot, M. G., Relation of central obesity and
insulin resistance with high diabetes prevalence and cardiovascular risk in South
Asians. Lancet 1991, 337, (8738), 382-6.

References
163
167. Hassapidou, M.; Fotiadou, E.; Maglara, E.; Papadopoulou, S. K., Energy
intake, diet composition, energy expenditure, and body fatness of adolescents in
northern Greece. Obesity 2006, 14, (5), 855-62.
168. Subar, A. F.; Kipnis, V.; Troiano, R. P.; Midthune, D.; Schoeller, D. A.;
Bingham, S.; Sharbaugh, C. O.; Trabulsi, J.; Runswick, S.; Ballard-Barbash, R.;
Sunshine, J.; Schatzkin, A., Using intake biomarkers to evaluate the extent of dietary
misreporting in a large sample of adults: the OPEN study. American journal of
epidemiology 2003, 158, (1), 1-13.
169. WHO Energy and protein requirements: Report of a joint FAO/WHO/UNU
expert consultation. Geneva, 1985.
170. Sanchez-Castillo, C. P.; Lara, J. J.; Villa, A. R.; Aguirre, J.; Escobar, M.;
Gutierrez, H.; Chavez, A.; James, W. P., Unusually high prevalence rates of obesity
in four Mexican rural communities. European journal of clinical nutrition 2001, 55,
(10), 833-40.
171. Hill, J. O., Understanding and addressing the epidemic of obesity: an energy
balance perspective. Endocrine reviews 2006, 27, (7), 750-61.
172. Yang, E. J.; Kerver, J. M.; Park, Y. K.; Kayitsinga, J.; Allison, D. B.; Song, W.
O., Carbohydrate intake and biomarkers of glycemic control among US adults: the
third National Health and Nutrition Examination Survey (NHANES III). American
journal of clinical nutrition 2003, 77, (6), 1426-33.
173. Wu, T.; Giovannucci, E.; Pischon, T.; Hankinson, S. E.; Ma, J.; Rifai, N.;
Rimm, E. B., Fructose, glycemic load, and quantity and quality of carbohydrate in
relation to plasma C-peptide concentrations in US women. American journal of
clinical nutrition 2004, 80, (4), 1043-9.
174. Flood, A.; Peters, U.; Jenkins, D. J.; Chatterjee, N.; Subar, A. F.; Church, T.
R.; Bresalier, R.; Weissfeld, J. L.; Hayes, R. B.; Schatzkin, A., Carbohydrate,
glycemic index, and glycemic load and colorectal adenomas in the Prostate, Lung,

References
164
Colorectal, and Ovarian Screening Study. American journal of clinical nutrition 2006, 84, (5) 1184-92.
175. Florencio, T. T.; Ferreira, H. S.; Cavalcante, J. C.; Luciano, S. M.; Sawaya, A.
L., Food consumed does not account for the higher prevalence of obesity among
stunted adults in a very-low-income population in the Northeast of Brazil (Maceio,
Alagoas). European journal of clinical nutrition 2003, 57, (11), 1437-1446.
176. Gazzaniga, J. M.; Burns, T. L., Relationship between diet composition and
body fatness, with adjustment for resting energy expenditure and physical activity, in
preadolescent children. American journal of clinical nutrition 1993, 58, (1), 21-8.
177. Miller, W. C.; Lindeman, A. K.; Wallace, J.; Niederpruem, M., Diet composition,
energy intake, and exercise in relation to body fat in men and women. American
journal of clinical nutrition 1990, 52, (3), 426-30.
178. Matos, A. C.; Ladeia, A. M., Assessment of cardiovascular risk factors in a
rural community in the Brazilian state of Bahia. Arquivos brasileiro de cardiologia
2003, 81, 297-302.
179. Willett, W. C., Dietary fat and obesity: an unconvincing relation. American
journal of clinical nutrition 1998, 68, (6), 1149-50.
180. Roberts, S. B.; Pi-Sunyer, F. X.; Dreher, M.; Hahn, R.; Hill, J. O.; Kleinman, R.
E.; Peters, J. C.; Ravussin, E.; Rolls, B. J.; Yetley, E.; Booth, S. L., Physiology of fat
replacement and fat reduction: effects of dietary fat and fat substitutes on energy
regulation. Nutrition reviews 1998, 56, (5 Pt 2), S29-41; discussion S41-9.
181. Sawaya, A. L.; Grillo, L. P.; Verreschi, I.; da Silva, A. C.; Roberts, S. B., Mild
stunting is associated with higher susceptibility to the effects of high fat diets: studies
in a shantytown population in São Paulo, Brazil. The journal of nutrition 1998, 128, (2
Suppl), 415S-420S.
References
165
182. Leite de Vasconcellos, M. T.; Portela, M. C., Body mass index and its
relationship to nutritional and socioeconomic variables: a linear regression approach
to a Brazilian adult sub-population. Cadernos de saúde pública 2001, 17, (6), 1425-
36.
183. Ludwig, D. S., The glycemic index: Physiological mechanisms relating to
obesity, diabetes, and cardiovascular disease. JAMA: The Journal of the american
medical association 2002, 287, (18), 2414-2423.
184. Newby, P. K.; Muller, D.; Hallfrisch, J.; Qiao, N.; Andres, R.; Tucker, K. L.,
Dietary patterns and changes in body mass index and waist circumference in adults.
American journal of clinical nutrition 2003, 77, (6), 1417-25.
185. Toeller, M.; Buyken, A. E.; Heitkamp, G.; Cathelineau, G.; Ferriss, B.; Michel,
G., Nutrient intakes as predictors of body weight in european people with type 1
diabetes. International journal of obesity and related metabolic disorders : journal of
the international association for the study of obesity 2001, 25, (12), 1815-22.
186. Bouche, C.; Rizkalla, S. W.; Luo, J.; Vidal, H.; Veronese, A.; Pacher, N.;
Fouquet, C.; Lang, V.; Slama, G., Five-week, low-glycemic index diet decreases total
fat mass and improves plasma lipid profile in moderately overweight nondiabetic
men. Diabetes care 2002, 25, (5), 822-8.
187. Heitmann, B. L.; Lissner, L.; Sorensen, T. I.; Bengtsson, C., Dietary fat intake
and weight gain in women genetically predisposed for obesity. American journal of
clinical nutrition 1995, 61, (6), 1213-7.
188. Gisela P.M. Barreto, M. T. B. a. A. Z. M., Bioactive compounds from several
tropical fruits and correlation by multivariate analysis to rree radical scavenger
activity. Journal of the brazilian chemical society 2009, 20, 1856-1861.
189. Abadio Finco, F. D. B.; Kammerer, D. R.; Carle, R.; Tseng, W.-H.; Böser, S.;
Graeve, L., Antioxidant Activity and Characterization of Phenolic Compounds from

References
166
Bacaba (Oenocarpus bacaba Mart.) Fruit by HPLC-DAD-MSn. Journal of agricultural
and food chemistry 2012.
190. Thaipong, K.; Boonprakob, U.; Crosby, K.; Cisneros-Zevallos, L.; Hawkins
Byrne, D., Comparison of ABTS, DPPH, FRAP, and ORAC assays for estimating
antioxidant activity from guava fruit extracts. Journal of food composition and analysis
2008, 19, (6-jul), 669-675.
191. Wu, X.; Beecher, G. R.; Holden, J. M.; Haytowitz, D. B.; Gebhardt, S. E.; Prior,
R. L., Lipophilic and hydrophilic antioxidant capacities of common foods in the United
States. Journal of agricultural and food chemistry 2004, 52, (12), 4026-4037.
192. Sariburun, E.; Sahin, S.; Demir, C.; Cihat, T.; Uylaser, V., Phenolic Content
and Antioxidant Activity of Raspberry and Blackberry Cultivar. Journal of Food
Science 2010, 74, 328-335.
193. Cevallos-Casals, B. A.; Cisneros-Zevallos, L., Stoichiometric and kinetic
studies of phenolic antioxidants from andean purple corn and red-fleshed
sweetpotato. Journal of agricultural and food chemistry 2003, 51, 3313−3319
194. Prior, R. L.; Wu, X.; Schaich, K., Standardized methods for the determination
of antioxidant capacity and phenolics in foods and dietary supplements. Journal of
agricultural and food chemistry 2005, 53, (10), 4290-302.
195. Benzie, I. F.; Strain, J. J., The ferric reducing ability of plasma (FRAP) as a
measure of "antioxidant power": the FRAP assay. Anal. Biochem. 1996, pp 70-76.
196. Ou, B.; Hampsch-Woodill, M.; Flanagan, J.; Deemer, E. K.; Prior, R. L.;
Huang, D., Novel fluorometric assay for hydroxyl radical prevention capacity using
fluorescein as the probe. Journal of agricultural and food chemistry 2002, 50, (10),
2772-2777.
197. Huang, D.; Ou, B.; Prior, R. L., The chemistry behind antioxidant capacity
assays. Journal of agricultural and food chemistry 2005, 53, (6), 1841-56.

References
167
198. Seeram, N. P.; Aviram, M.; Zhang, Y.; Henning, S. M.; Feng, L.; Dreher, M.;
Heber, D., Comparison of antioxidant potency of commonly consumed polyphenol-
rich beverages in the United States. Journal of agricultural and food chemistry 2008, 56, (4), 1415-22.
199. Blando, F.; Gerardi, C.; Nicoletti, I., Sour Cherry (Prunus cerasus L.)
anthocyanins as ingredients for functional foods. Journal of biomedicine and
biotechnology 2004, 5, 253-258.
200. Schauss, A. G., Açaí (Euterpe oleracea Mart.): A macro and nutrient rich palm
fruit from the Amazon Rain Forest with demonstrated bioactivities In Vitro and In
Vivo. In Bioactive foods in promoting health, Ronald Ross, W.; Victor, R. P., Eds.
Academic Press: San Diego, 2010; pp 479-490.
201. Khanavi, M.; Saghari, Z.; Mohammadirad, A.; Khademi, R.; Hadjiakhoondi, A.;
Abdollahi, M., Comparison of antioxidant activity and total phenols of some date
varieties. DARU - Journal of faculty of pharmacy, Tehran university of medical
sciences 2009, 17, (2), 104-108.
202. C. Vijaya Kumar Reddy, D. S., M. Raghunath, Antioxidant activity of fresh and
dry fruits commonly consumed in India. Food research international 2010, 43 285–
288.
203. Khanavi M, S. Z., Mohammadirad A., Khademi R., Hadjiakhoondi A., Abdollahi
M. , Comparison of antioxidant activity and total phenols of some date varieties
DARU 2009, Vol. 17, 104-108.
204. Percival, S. S.; Talcott, S. T.; Chin, S. T.; Mallak, A. C.; Lounds-Singleton, A.;
Pettit-Moore, J., Neoplastic transformation of BALB/3T3 cells and cell cycle of HL-60
Cells are inhibited by Mango (Magnifera indica L.) juice and mango juice extracts.
Journal of nutrition 2006, pp 1300-1304.

References
168
205. Song, W.; Derito, C. M.; Liu, M. K.; He, X.; Dong, M.; Liu, R. H., Cellular
antioxidant acitivity of common vegetables. Journal of agriculture and food chemistry
2010, pp 6621-6629.
206. Mosmann, T., Rapid colorimetric assay for cellular growth and survival:
application to proliferation and cytotoxicity assays. Journal of immunological methods
1983, pp 55-63.
207. Bruggisser, R.; Von Daeniken, K.; Jundt, G.; Schaffner, W.; Tullberg-Reinert,
H., Interference of plant extracts, phytoestrogens and antioxidants with the MTT
tetrazolium assay. Planta medica 2002, pp 445-448.
208. Liu, Y.; Peterson, D. A.; Kimura, H.; Schubert, D., Mechanism of Cellular 3-
(4,5-Dimethylthiazol-2-yl)-2,5-Diphenyltetrazolium Bromide (MTT) Reduction. J.
Neurochem. 1997, pp 581-593.
209. Bernhard, D.; Schwaiger, W.; Crazzolara, R.; Tinhofer, I.; Kofler, R.; Csordas,
A., Enhanced MTT-reducing activity under growth inhibition by resveratrol in CEM-
C7H2 lymphocytic leukemia cells. Cancer letters 2003, 195, (2), 193-199.
210. Berridge, M. V.; Tan, A. S., Characterization of the Cellular Reduction of 3-
(4,5-dimethylthiazol-2-yl)-2,5-diphenyltetrazolium bromide (MTT): Subcellular
Localization, Substrate Dependence, and Involvement of Mitochondrial Electron
Transport in MTT Reduction. Archives of biochemistry and biophysics 1993, 303, (2),
474-482.
211. Liu, Y.; Peterson, D. A.; Kimura, H.; Schubert, D., Mechanism of cellular 3-
(4,5-dimethylthiazol-2-yl)-2,5-diphenyltetrazolium bromide (MTT) reduction. Journal
of neurochemistry 1997, 69, (2), 581-593.
212. Pagliacci, M. C.; Smacchia, M.; Migliorati, G.; Grignani, F.; Riccardi, C.;
Nicoletti, I., Growth-inhibitory effects of the natural phyto-oestrogen genistein in MCF-
7 human breast cancer cells. European journal of cancer 1994, 30, (11), 1675-1682.

References
169
213. Pagliacci, M. C.; Spinozzi, F.; Migliorati, G.; Fumi, G.; Smacchia, M.; Grignani,
F.; Riccardi, C.; Nicoletti, I., Genistein inhibits tumour cell growth in vitro but
enhances mitochondrial reduction of tetrazolium salts: A further pitfall in the use of
the MTT assay for evaluating cell growth and survival. European journal of cancer
1993, 29, (11), 1573-1577.
214. Liu, W.; Dalgleish, A., MTT assays can underestimate cell numbers. Cancer
chemotherapy and pharmacology 2009, 64, (4), 861-862.
215. Sims, J.; Plattner, R., MTT assays cannot be utilized to study the effects of
STI571/Gleevec on the viability of solid tumor cell lines. Cancer chemotherapy and
pharmacology 2009, 64, (3), 629-633.
216. Hanauske, A. R., In vitro assays for antitumour activity: more pitfalls to come?
European journal of cancer 1993, 29A, (11), 1502-3.
217. Virág, L.; Kerékgyáró, C.; Fachet, J., A simple, rapid and sensitive fluorimetric
assay for the measurement of cell-mediated cytotoxicity. Journal of immunological
methods 1995, (185), 199-208.
218. Fernandes, I.; Faria, A.; Azevedo, J.; Soares, S.; Calhau, C. a. o.; De Freitas,
V.; Mateus, N., Influence of anthocyanins, derivative pigments and other catechol
and pyrogallol-type phenolics on breast cancer cell proliferation. Journal of
agricultural and food chemistry 2010, 58, (6), 3785-3792.
219. Johnson, J. L.; Bomser, J. A.; Scheerens, J. C.; Giusti, M. M., Effect of black
Raspberry (Rubus occidentalis L.) extract bariation conditioned by cultivar,
production site, and fruit maturity stage on colon cancer cell proliferation. Journal of
agricultural and food chemistry 2011, 59, (5), 1638-1645.
220. Felice, D. L.; Sun, J.; Liu, R. H., A modified methylene blue assay for accurate
cell counting. Journal of functional foods 2009, (I), 109-118.

References
170
221. Manson, M. M.; Farmer, P. B.; Gescher, A.; Steward, W. P., Innovative Agents
in Cancer PreventionTumor Prevention and Genetics III. In Senn, H.-J.; Morant, R.,
Eds. Springer Berlin Heidelberg: 2005; Vol. 166, pp 257-275.
222. Greenwald, P.; Clifford, C. K.; Milner, J. A., Diet and cancer prevention.
European journal of cancer 2001, 37, (8), 948-965.
223. Delhalle, S.; Duvoix, A.; Schnekenburger, M.; Morceau, F.; Dicato, M.;
Diederich, M., An introduction to the molecular mechanisms of apoptosis. Annals of
the New York academy of sciences 2003, 1010, (1), 1-8.
224. Ziedan, N. I.; Kadri, H.; Westwell, A. D., The development of pro-apoptotic
cancer therapeutics. Mini reviews in medicinal chemistry 2008, 8, (7), 711-8.
225. Enari, M.; Sakahira, H.; Yokoyama, H.; Okawa, K.; Iwamatsu, A.; Nagata, S.,
A caspase-activated DNase that degrades DNA during apoptosis, and its inhibitor
ICAD. Nature 1998, 391, (6662), 43-50.
226. Janicke, R. U.; Ng, P.; Sprengart, M. L.; Porter, A. G., Caspase-3 is required
for alpha-fodrin cleavage but dispensable for cleavage of other death substrates in
apoptosis. The Journal of biological chemistry 1998, 273, (25), 15540-5.
227. Li, L. Y.; Luo, X.; Wang, X., Endonuclease G is an apoptotic DNase when
released from mitochondria. Nature 2001, 412, (6842), 95-99.
228. Salvioli, S.; Barbi, C.; Dobrucki, J.; Moretti, L.; Pinti, M.; Pedrazzi, J.; Pazienza,
T. L.; Bobyleva, V.; Franceschi, C.; Cossarizza, A., Opposite role of changes in
mitochondrial membrane potential in different apoptotic processes. FEBS letters
2000, 469, (2-3), 186-90.
229. Chung, K.-S.; Choi, J.-H.; Back, N.-I.; Choi, M.-S.; Kang, E.-K.; Chung, H.-G.;
Jeong, T.-S.; Lee, K.-T., Eupafolin, a flavonoid isolated from Artemisia princeps,
induced apoptosis in human cervical adenocarcinoma HeLa cells. Molecular nutrition
& food research 2010, 54, (9), 1318-1328.

References
171
230. Chou, C.-C.; Yang, J.-S.; Lu, H.-F.; Ip, S.-W.; Lo, C.; Wu, C.-C.; Lin, J.-P.;
Tang, N.-Y.; Chung, J.-G.; Chou, M.-J.; Teng, Y.-H.; Chen, D.-R., Quercetin-
mediated cell cycle arrest and apoptosis involving activation of a caspase cascade
through the mitochondrial pathway in human breast cancer MCF-7 cells. Archives of
pharmacal research 2010, 33, (8), 1181-1191.
231. Hengartner, M. O., Nature 2000, 407, (null), 770.
232. Boyce, M.; Degterev, A.; Yuan, J., Caspases: an ancient cellular sword of
Damocles. Cell death and differentiation 2004, 11, (1), 29-37.
233. Sohn, D.; Schulze-Osthoff, K.; Janicke, R. U., Caspase-8 can be activated by
interchain proteolysis without receptor-triggered dimerization during drug-induced
apoptosis. The journal of biological chemistry 2005, 280, (7), 5267-73.
234. Jänicke, R., MCF-7 breast carcinoma cells do not express caspase-3. Breast
cancer research and treatment 2009, 117, (1), 219-221.
235. Mc Gee, M. M.; Hyland, E.; Campiani, G.; Ramunno, A.; Nacci, V.; Zisterer, D.
M., Caspase-3 is not essential for DNA fragmentation in MCF-7 cells during
apoptosis induced by the pyrrolo-1,5-benzoxazepine, PBOX-6. FEBS letters 2002, 515, (1-3), 66-70.
236. Loegering, D. A.; Ruchaud, S.; Earnshaw, W. C.; Kaufmann, S. H., Evaluation
of the role of caspase-6 in anticancer drug-induced apoptosis. Cell death and
differentiation 2005, 13, (2), 346-347.
237. Bernhard, D.; Tinhofer, I.; Tonko, M.; Hubl, H.; Ausserlechner, M. J.; Greil, R.;
Kofler, R.; Csordas, A., Resveratrol causes arrest in the S-phase prior to Fas-
independent apoptosis in CEM-C7H2 acute leukemia cells. Cell death and
differentiation 2000, 7, (9), 834-42.
238. Ekert, P. G.; Silke, J.; Vaux, D. L., Caspase inhibitors. Cell death and
differentiation 1999, 6, (11), 1081-6.

References
172
239. Bharti, A. C.; Takada, Y.; Aggarwal, B. B., PARP cleavage and caspase
activity to assess chemosensitivity. Methods in molecular medicine 2005, 111, 69-78.

Abbreviations
173
9. Abbreviations
% Per cent
< Is less than
= Is equal to
> Is higher than
∫ Integral
°C Degree Celsius
ΔΨm
χ2 Chi-square test
Mitochondrial membrane potential
µ Micro
µg Microgramm
µL Microliter
A Absorbance
AAPH 2,2`-azobis(2-amidino-propane)dihydrochloride
ABAP 2,2‘-azobis (2-amidipropane)
ABTS 2,2’-azinobis (3-ethyl-benzothiazoline-6-sulfonate)
Ac-VEID-AFC Acetyl-Val-glu-ile-asp-7-amino-4-trifluoromethylcoumarin
AIF Apoptosis inducing factor
AlCl3
ANOVA Analysis of variance
Aluminum chloride
AO Acridine orange
APA Environmental preservation area (Área de Preservação
Ambiental)
APAF-1 Apoptotic protease activating factor 1
APS Ammoiumpersulfate solution
Aubl. Jean Baptiste Christophore Fusée Aublet (botanist)
AUC Area under curve
BD Benton Dickson
BMI Body Mass Index
BMR Basic metabolic rate

Abbreviations
174
BSA Bovine serum albumine
CAA Cellular antioxidant capacity
CAD C
CAPS N-cyclohexyl-3-aminopropanesulfonic acid
aspase-activated deoxyribonuclease
CAQ Cellular antioxidant quality
Caspase Cysteine-aspartic proteases
CID Collision induced dissociation
cm centimeters
CNS National Health Board (Conselho Nacional de Saúde)
CNSAN National conference of food and nutrition security (Conferência
Nacional de Segurança Alimentar e Nutricional)
CO2
CTE Catechin equivalent
Carbon dioxide
cv. Cultivar
Cyn-3-glcEq Cyanidin-3-glucoside equivalent
DCFH-DA 2’-7’-dichlorofluorescein di-acetate
dd H2
DMEM Dulbecco’s modified Eagle’s medium
O double distilled water
DMSO Dimethylsulfoxid
DNA Deoxyribonucleic acid
DPPH 2,2-diphenyl-1-picrylhydrazyl
DTT Dithiothreitol
DW Dry weight
e.g. exempli gratia (for example)
EB Energy balance
EB Ethidium bromide
EBIA Brazilian scale of food and nutrition security (Escala Brasileira de
Insegurança Alimentar)
EC50
ECL Enhanced Chemiluminescence
half maximal effective concentration
EDTA Ethylene-Diamine-Tetraacetic Acid

Abbreviations
175
Eq. equation
ESI-MS electrospray ionization mass spectrometry
et al. et alii
FACS Fluorescence-activated cell sorting
FC Folin-Ciocalteau
FCS Fetal calf serum
FeSO4.7H2O ferrous sulfate heptahydrate
FFQ Food frequency questionnaire
FITC Fluorescein isothiocyanate
FITC-Z-LEHD-FMK Z-Leu-Glu(OMe)-His-Asp(OMe)-fluoromethyketone conjugated
do FITC
FNS Food and nutrition security
FNS Food and nutrition security
FOSHU Foods for specified health use
FRAP Ferric reducing ability of plasma assay
FSC Forward side scatter
FUFOSE European Commission Concerted Action on Functional Food
Science in Europe
FW Fresh weight
g Gramm
g Gravitational acceleration
GAE Gallic acid equivalent
GDP Gross domestic product
GIZ German agency for International cooperation
(Deutsche Gesellschaft für Internationale Zusammenarbeit
h hour
)
HAT Hydrogen atom transfer
HBSS Hank’s Balanced Salted Solution
HCL Hydrochloric acid
HeLa Cervical cancer cell line
HepG2 Human liver cancer cells

Abbreviations
176
HPLC High-performance liquid chromatography
i.e. id est (that is)
IC50
ICAD Inhibitor of
half maximal inhibitory concentration
ILSI International Life Science Institute
caspase-activated deoxyribonuclease
JC-1 5,5’ ,6,6’-tetrachloro-1,1’ , 3,3’ – tetraethylbenzimidazole
carbocyanide iodide
Kcal Kilocalorie
KDa KiloDalton
Kg Kilograms
Km Kilometers
L. Carl Linnaeus (botanist)
LC Liquid chromatography
Ln Natural logarithm
M Molar
m2
mA Milli-Ampère
Square meter
Mart. Carl Friedrich Philipp von Martius (botanist)
MB Methylene blue
MCF Michigan Cancer Foundation
mg Milligramm
min Minute
MJ Megajoule
mL Milliliter
mm Millimeters
mM Millimolar
MSn
MTT 3,-(4,5-dimethyl-2-thiazolyl)-2,5-diphenyl-2-tetrazolium bromide
Mass Spectrometry to the N-th Power
MUH 4-Methylumbelliferyl heptanoate
n Sample size (statistics)
Na2HPO4 Disodium hydrogen phosphate
Abbreviations
177
Na3VO4
NaF Sodium fluoride
Sodium ortho-vanadate
NaN3
NaNO
Sodium azide
2
NCD Non communicable Diseases
Sodium nitrite
nm Nanometer
nM Nanomolar
ORAC Oxygen radical absorbance capacity
p Significant probability
P/S Penicillin-/Streptomycin-Solution
PAL Physical activity level
PARP Poly (ADP-Ribose) polymerase
PBS Phosphate-buffered Saline
PCB Phosphate citrate buffer
Pers. Christian Hendrik Persoon (botanist)
pH potential hydrogen
PI Propidium iodide
PMSF Phenyl-methyl-sulfonyl fluoride
PNAD Brazilian national household survey (Pesquisa Nacional por
Amostra de Domicílios)
PNPSB National plan for promotion of sociobiodiversity product chains
(Plano Nacional das Cadeias de produtos da
Sociobiodiversidade)
PRONAF National Program for the Family Agriculture (Programa Nacional
de Agricultura Familiar)
PVDF Polyvinyliden-Difluorid
QE Quercetin Equivalent
R2
Rich. Louis Claude Richard (botanist)
Coefficient of determination
RP-HPLC Reversed phase high performance liquid chromatography
rpm Rounds per minute

Abbreviations
178
s Second
SD Standard deviation
SDS Sodiumdodecylsulfate
SDS-PAGE Sodiumdodecylsulfate-Polyacrylamide-Gelelectrophoresis
SE Standard error
see Standard error of estimate
SET Single electron transfer
SIT 571 Imatinib (4-[(4-methylpiperazin-1-yl)methyl]-N-(4-methyl-3-{[4-
(pyridin-3-yl)pyrimidin-2-yl]amino}phenyl)benzamide)
SPSS Statistical package for the social sciences
TACO Brazilian Food Composition Table (Tabela Brasileira de
Composição de Alimentos)
TB Trypan blue
TBS Tris-buffered Saline
TBST Tris-buffered Saline Tween-20
TE Trolox equivalent
TEAC Trolox equivalent antioxidant capacity assay
TEE Total energy expenditure
TNF-alpha Tumor necrosis factor-alpha
TPTZ 2,4,6-tris(2-pyridyl
Tris Base Tris(hydroxy)aminomethane
)-s-triazine
Tris-HCl Tris(hydroxy)aminomethane-Hydrochloride
Trolox 6-hydroxy-2, 5, 7, 8-tetramethylchromane-2-carboxylic acid
UV Ultraviolet
v Volume
WC Waist circumference
WHO World Health Organization
Z-IETD-AFC Z-Ile-Glu-Thr-Asp7-amido-4-trifluoromethylcoumarin

Curriculum vitae
179
10. Curriculum Vitae
Fernanda Abadio Finco4
___________________________________________________________________
Personal Data
Full Name: Fernanda Dias Bartolomeu Abadio Finco
Name in Bibliographic Citation: ABADIO, F.D.B;
ABADIO FINCO, F.D.B;
FINCO, F.D.B.A.
E-mail: [email protected];
Date of birth: 7th
Birthplace: Rio de Janeiro, Brazil
October, 1977
Citizenship: Brazilian
Marital Status: Married; no children.
4 The current Curriculum vitae is constantly updated and permanently available in the
Brazilian database of scientists (Lattes Platform) in the following website:
http://buscatextual.cnpq.br/buscatextual/visualizacv.do?id=N727032

Curriculum vitae
180
Education
Institute of Biological Chemistry and Nutrition (140c), University of
Hohenheim, Germany.
2007 - 2012 - PhD
2001 - 2003 - Master in Food Science and Technology
Federal Rural University of Rio de Janeiro, UFRRJ, Brazil.
1996 - 2000 - B.Sc. Nutrition
Federal University of Rio de Janeiro, UFRJ, Brasil.
Research Areas
Molecular nutrition, Functional foods, Traditional Foods, Food and nutrition security.
Professional Experience
Since 2003 - Federal University of Tocantins (UFT), Brazil.
Position: Lecturer (Professor Assistente IV)
Awards
2012 - Bunge Foundation, Category: Youth scientist in Food and Nutritional Security
2010 - Rosani Cunha Award, Brazilian Ministry of Social Development
2005 - I Scientific Initiation Meeting, Federal University of Tocantins (supervisor
degree).
1999 - XXI Scientific Initiation Meeting, Federal University of Rio de Janeiro (bachelor
student degree).

Curriculum vitae
181
Periodical Reviewer
Food Security ISSN: 1876-4517
African Journal of Agricultural Research ISSN:
Brazilian Journal of Food and Nutrition e-
1991- 637X
ISSN
African Journal of Business Management
: 2179-4448 1
ISSN:
1990-3839
Publications
Journal Articles
ABADIO FINCO, F.D.B.; KAMMERER, R. C.; TSENG, W.H.; BÖSER, S. GRAEVE,
L. Antioxidant activity and Characterization of phenolic compounds from bacaba
(Oenocarpus bacaba Mart.) fruit by HPLC-DAD-MSn
Jounal of Agricultural and Food
Chemistry, 60 (31), pp 7665–7673, 2012.
ABADIO FINCO, F.D.B. ; BOSER, S. ; Graeve, L. Antiproliferative activity of Bacaba
(Oenocarpus bacaba) and Jenipapo (Genipa americana L.) phenolic extracts: a
comparison of assays. Nutrition & Food Science, v. 43 n.2, 2012.
ABADIO FINCO, F.D.B. ; SILVA, I. G. ; OLIVEIRA, Renata Botelho. Physicochemical
characteristics and antioxidant activity of three native fruits from Brazilian Savannah
(Cerrado). Alimentos e Nutrição (UNESP. Marília), v. 23, n. 2 p. 1-4, 2012.
FINCO, M. V. A.; ABADIO FINCO, F.D.B. Biodiesel and the regional sustainable
development: impacts on farm income and food security in northern Brazil.
Segurança Alimentar e Nutricional, v. 18, p. 21-30, 2011.
FINCO, M. V. A.; ABADIO FINCO, F.D.B. The consumer willingness to pay for food
services: an analysis of the Popular Restaurant Program in northern Brazil. Teoria e
Evidencia Economica (UPF), v. 16, p. 350, 2011.

Curriculum vitae
182
ABADIO FINCO, F.D.B.; MOURA, L. L.; SILVA, I. G. Physical and chemical
properties of Honey from Apis Mellifera L. produced in South Tocantins State.
Ciência e Tecnologia de Alimentos (Impresso), v. 27, p. 49-52, 2010.
ABADIO FINCO, F.D.B; DELIZA, R.; ROSENTHAL, A.; SILVA, C. The Effect of
Extrinsic Product Attributes of Pineapple Juice on Consumer Intention to Purchase.
Journal of International Food & Agribusiness Marketing, v. 22, p. 125-142, 2010.
PAIXÃO, A. N.; ARAÚJO, A. F. V. ; ABADIO FINCO, F.D.B. ; RAMOS, F.
Caracterização da Demanda por alimentos Artesanais: Uma aplicação do Método de
Avaliação Contingente na valoração do selo de origem de Palmas - TO. Amazônia
(Banco da Amazônia), v. 3, p. 7-25, 2007.
FINCO, M.V.A.; ABADIO FINCO, F.D.B. . A disposição a pagar (DAP) por serviços
de alimentação: uma estimativa para os restaurantes populares de Palmas/TO.
Cadernos de Economia (UNOESC), v. 11, 2007.
Submitted articles
Abadio Finco, F.D.B.; Tseng, W-H.; Böser, S.; Kammerer, D. R.; Carle, R.; Graeve,
L.Determination of phenolic contents and antioxidant capacity of extracts from
Genipa americana L. (“Jenipapo”) fruit.
Book Chapter
ABADIO FINCO, F.D.B.; FINCO, M. V. A.; COELHO, A. F. S. An Assessment of the
Brazilian Popular Restaurant Program as an Integrated Action for Food Security and
Health Promotion. In: Maddox A. Jones; Francisco E. Hernandez. (Org.). Food
Security: Quality Management, Issues and Economic Implications. : Nova Publishers,
2012.
Curriculum vitae
183
FINCO, M.; ABADIO FINCO, F.D.B. Em busca do modelo de Gestão Social: uma
análise do Programa Popular de Restaurantes Solidários através do Método de
Valoração Contingente. II Encontro Nacional de Pesquisadores em Gestão Social.
2008.
FINCO, M. V. A ; CANÇADO, A.C.; ABADIO, F.D.B. Pesquisa de avaliação da II
Feira Estadual de Economia Solidária - PAFES/Tocantins - 2006. In: CANÇADO,
Airton Cardoso; PEREIRA, José Roberto; SILVA JÚNIOR, Jeová Torres.. (Org.).
Economia solidária, cooperativismo popular e autogestão: as experiências de
Palmas/TO.. Palmas: NeSol, 2007, p. 279-310.
Research Projects
2012 - 2013 - NoPa Project: EcoNutrition, Bilateral Cooperation project between
Universität Hohenheim and Federal University of Tocantins. Funding:
DAAD/CAPES/GIZ. Position: Coordinator.
2007 - 2012 - Community Based Nutrition Strategies: Assessing Savannah fruits as
a health promotion strategy in Tocantins, Brazil. University of Hohenheim and
Federal University of Tocantins. Funding: Eiselen Foundation Ulm, Germany and
ISFE, Switzerland.
2005 - 2007 - Evaluation of Solidary Restaurants Programme in Palmas city, Brazil
as an Integrated Action of Health and Food Security.Federal University of Tocantins.
Position: Coordinator Funding: CNPq (National Council of Scientific Research,
Brazil);
2004 - 2006 - Evaluation of local foods as a tool to design a culture-based menu for
the School Feeding Programme in Palmas – TO. Federal University of Tocantins,
Position: Coordinator. Funding: CNPq (National Council of Scientific Research,
Brazil).

Curriculum vitae
184
2004 - 2006 - Evaluation of components from local diet as a prevention tool to Non
Communicable diseases in Tocantins State. Federal University of Tocantins,
Position: Coordinator. Funding: Brazilian Ministry of Health.
2004 - 2005 - Nutritional and Sensory Evaluation of Foods Offered at Schools in
Palmas city, TO. Federal University of Tocantins, Position: Researcher.
2005 - 2006 - Physical and Chemical Properties of Honey from South Tocantins
State. Federal University of Tocantins, Position: Coordinator.
2004 - 2005 - Evaluation of Native Fruits from Brazilian Savannah as Alternative to
Novel Foods Development. Federal University of Tocantins, Position: Coordinator
2002 - 2003 – Sensory evaluation and consumer studies of food processed by
emergent methods (high hidrostatic pressure). EMBRAPA Food Tecnhology
(Brazilian Enterprise for Agricultural Research). Position: Master Student.
1998 - 2000 – Optimization of pineapple juice clarifying process (Ananas comosus, L.
Merr) by microfiltration and ultrafiltration and identification of clarified juices. Federal
Universtiy of Rio de Janeiro. Position: Bachelor Student.

185
Declaration of authorship
With this statement I declare, that I have independently completed the doctoral thesis
entitled: “Health enhancing traditional foods in Brazil: an interdisciplinary approach to food and nutritional security”. The resources are taken directly or
indirectly from external sources which are properly marked.
08.08.2012, Stuttgart- Hohenheim,
Signature