Embed Size (px)
Citation preview

Department of Health and Human Services Office of the Assistant Secretary for Planning and Evaluation
http://aspe.hhs.gov
ASPE RESEARCH BRIEF
HEALTH PLAN CHOICE AND PREMIUMS IN THE 2018 FEDERAL HEALTH INSURANCE EXCHANGE
October 30, 2017
This brief presents information on qualified health plans (QHPs) available in the Exchange for states that use the HealthCare.gov platform, including estimates for issuer participation, health plan options, premiums, and subsidies in the upcoming open enrollment period (OEP), and trends since the first OEP.
National estimates and summary tables are presented in each section of the text. State-specific estimates are in the Appendix.
Key Findings
Benchmark Premiums: The average monthly premium for the second-lowest cost silver plan (SLCSP),
also called the benchmark plan, for a 27-year-old increased by 37% from plan year 2017 (PY17) ($300) to PY18 ($411).
Premium Growth: For the first time, annual growth in the average monthly premium available to a 27-year-old for the SLCSP, at 37%, outpaced that of the lowest-cost plan (LCP), at 17%. For enrollees who are eligible to receive advance premium tax credits (APTCs), the larger increase for the benchmark plan
premium may result in these enrollees paying a lower portion of their premiums compared to prior plan years; especially if they select plans from metal levels other than silver.
Subsidies: The average APTC ($555) will increase by an estimated 45% from PY17 ($382) and by 114% from PY14 ($259). In PY14 through PY17, more than 80% of enrollees were in plans for which APTCs were paid, while approximately 60% were in plans to which cost-sharing reductions were paid.
Lowest-Cost Plan Available: The percentage of current enrollees with access to a plan for $200 or less decreased from 16% for PY17 to 6% to PY18. If enrollees were to stay within their current metal level,
only 2% will have access to coverage with premiums of $200 or less for PY18.
Issuer Participation: Issuer participation in the Exchange continues to decline with 132 total state
issuers in PY18, down from 167 in PY17. Eight states in PY18 will have only one issuer: Alaska, Delaware, Iowa, Mississippi, Nebraska, Oklahoma, South Carolina, and Wyoming.
Issuer and Plan Options: 29% of current enrollees will have only one issuer to choose from, up from 20% in PY17. The average number of qualified health plans (QHPs) available to enrollees is 25 for PY18, down from 30 in PY17. Alaska, Arizona, Iowa, and Mississippi enrollees will have the fewest
QHPs in PY18 (an average of 5 QHPs per county), while Florida will have the highest (an average of 55 QHPs per county).

ASPE Research Brief Page 2
ASPE Office of Health Policy October 2017
I. Issuer Participation Table 1 provides estimates of issuer participation across states in the HealthCare.gov Exchange for plan year 2014 (PY14) through PY18. For comparison purposes, estimates of total state issuers are provided
for states that have used the HealthCare.gov Exchange platform in at least one plan year, as well as for states that have used the HealthCare.gov Exchange platform during all plan years. The estimates treat states equally in averages and percentage distributions (i.e. they are unweighted). The bullets below compare differences between the upcoming plan year, PY18, and the prior plan year, PY17, in the first
section, and highlight trends across all plan years in the second section. See Tables 1A and 1B in the Appendix for state and county specific estimates. Differences between PY18 and PY17:
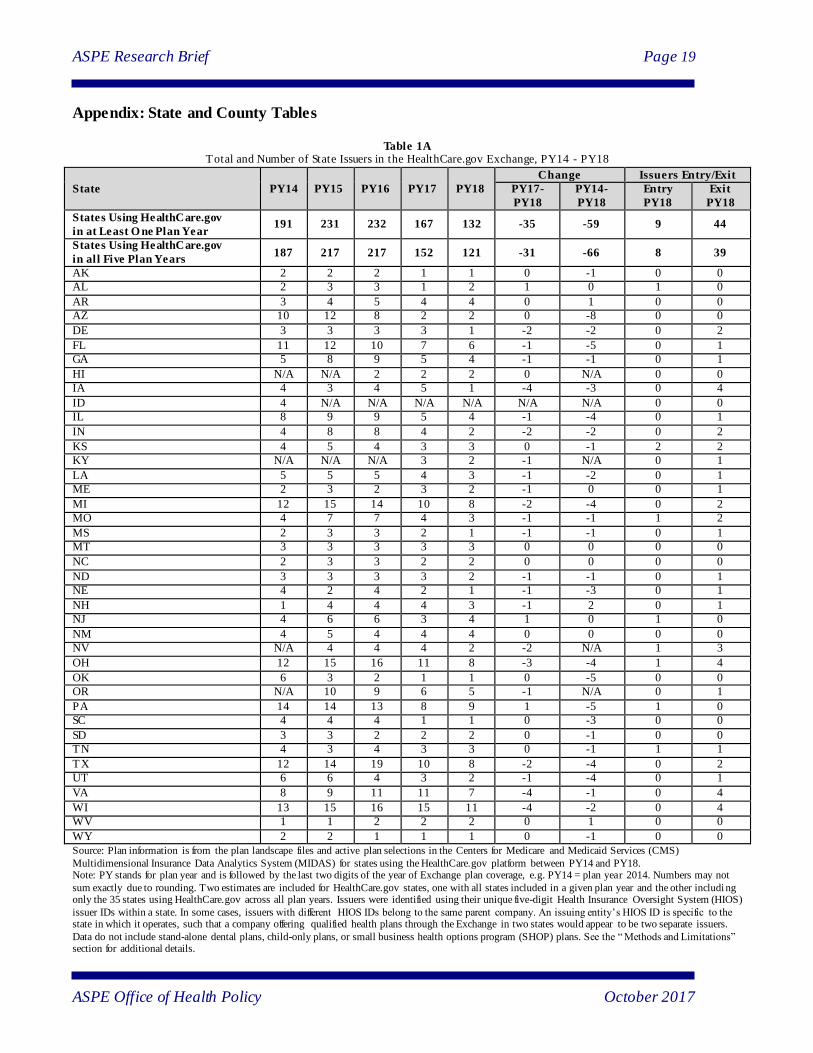
Issuer participation in the Exchange continues to decline, with 132 total state issuers in PY18, down from 167 in PY17.
The average number of state issuers is three for PY18, down one from PY17.
Eight HealthCare.gov states (21%) will have only one issuer in PY18: Alaska, Delaware, Iowa,
Mississippi, Nebraska, Oklahoma, South Carolina, and Wyoming; up from five (13%) in PY17. Trends across Plan Years:
The total number of state issuers for the 35 states that have used the HealthCare.gov platform during all plan years increased from PY14 (187) to PY15 (217), and has declined every year since PY16 (217), with 152 in PY17 and 121 for PY18.
The average number of state issuers was five in PY14, increased to six in PY15 and PY16, decreased to four in PY17, and will be three in PY18.
The percentage of states with six or more issuers was 31% in PY14, compared to only 18% of states in PY18.

ASPE Research Brief Page 3
ASPE Office of Health Policy October 2017
Table 1
Total and Average Number of Issuers Participating in HealthCare.gov Exchange States, PY14 - PY18
PY14 PY15 PY16 PY17 PY18
States Using HealthCare.gov in at Least One Plan Year
Number of States Included in Estimates 36 37 38 39 39
Total Number of Issuers in State 191 231 232 167 132
Average Number of Issuers in State 5 6 6 4 3
Percentage of States with 1 Issuer 6% 3% 3% 13% 21%
Percentage of States with 2-5 Issuers 64% 57% 61% 67% 62%
Percentage of States with 6+ Issuers 31% 41% 37% 21% 18%
States Using HealthCare.gov in all Five Plan Years
Number of States Included in Estimates 35 35 35 35 35
Total Number of State Issuers 187 217 217 152 121
Average Number of State Issuers 5 6 6 4 3
Percentage of States with 1 Issuer 6% 3% 3% 14% 23%
Percentage of States with 2-5 Issuers 63% 57% 60% 66% 57%
Percentage of States with 6+ Issuers 31% 40% 37% 20% 20% Source: Plan information is from the plan landscape files.
Note: PY stands for plan year and is followed by the last two digits of the year of Exchange plan coverage, e.g. PY14 = plan year 2014 .
Percentages may not sum exactly due to rounding. Averages and percentage distributions are unweighted, treating all Exchange stat es
equally regardless of enrollment . The average number of issuers per state was calculated by finding the total number of issuers offering
qualified health plans (QHPs) anywhere in each state, then dividing by the number of states. QHPs do not include catastrophic plans.
Issuers were identified using their unique five-digit Health Insurance Oversight System (HIOS) issuer IDs within a state. In some cases,
issuers with different HIOS IDs belong to the same parent company. An issuing entity’s HIOS ID is specific to the state in which it
operates, such that a company offering QHPs through the Exchange in two states would appear to be two separate issuers. Data do not
include stand-alone dental plans, child-only plans, or small business health options program (SHOP) plans. See the “Methods and
Limitations” section for additional details.

ASPE Research Brief Page 4
ASPE Office of Health Policy October 2017
II. Issuer and Plan Options Table 2 provides estimates of issuer and plan options for enrollees in the Exchange for plan year 2014 (PY14) through PY18 for all HealthCare.gov states. The bullets below compare differences between the
upcoming plan year, PY18, and the prior plan year, PY17, in the first section, and highlight trends across all plan years in the second section. See Table 2A in the Appendix for state and county specific estimates.
Differences between PY18 and PY17:
For PY18, 29% of current enrollees will have one issuer to choose from, up from 20% in PY17;
while less than half (45%) will have three or more, compared to 56% in PY17.
The average number of qualified health plans (QHPs) available to enrollees is 25 for PY18, down from 30 in PY17.
Trends across Plan Years:
The percentage of current enrollees with only one issuer to choose from increased from PY16
(2%) to PY17 (20%), and will have another increase for PY18 (29%).
The average number of QHPs available to enrollees has decreased every year since PY15 (55),
with 46 in PY16, 30 in PY17, and 25 in PY18.

ASPE Research Brief Page 5
ASPE Office of Health Policy October 2017
Table 2
Average Number of Issuer and Health Plan Options for Enrollees in the HealthCare.gov Exchange, PY14 - PY18
PY14 PY15 PY16 PY17 PY18
Issuers Options 4 5 5 3 3
Percentage with 1 Issuer 7% 3% 2% 20% 29%
Percentage with 2 Issuers 18% 10% 12% 23% 26%
Percentage with 3+ Issuers 75% 87% 86% 56% 45%
Plan Options 54 58 48 32 26
Catastrophic Plans 3 3 3 1 1
Qualified Health Plans 51 55 46 30 25
Bronze Plans 15 17 14 10 7
Silver Plans 18 22 19 14 12
Gold Plans 14 13 10 5 4
Platinum Plans 4 4 2 2 1 Source: Plan information is from the plan landscape files and active plan selections in the Centers for Medicare and Medicaid Services
(CMS) Multidimensional Insurance Data Analytics System (MIDAS) for states using the HealthCare.gov plat form between PY14 and
PY18.
Note: PY stands for plan year and is followed by the last two digits of the year of Exchange plan coverage, e.g. PY14 = plan year 2014.
Percentages may not sum exactly due to rounding. County averages and percentages were weighted by the number o f plan selections in
each county for the same plan year, except PY18 for which PY17 plan selections were used. The average number of issuers per s tate was
calculated by finding the total number of issuers offering qualified health plans (QHPs) anywhere in each state, then averaging over all
states weighted by plan selections in the state. QHPs do not include catastrophic plans. Issuers were identified using their unique five-digit Health Insurance Oversight System (HIOS) issuer IDs within a state. In some cases, issuers with different HIOS IDs belong to the same
parent company. An issuing entity’s HIOS ID is specific to the state in which it operates, such that a company offering QHPs through the
Exchange in two states would appear to be two separate issuers. Data do not include stand-alone dental plans, child-only plans, or small
business health options program (SHOP) plans. See the “Methods and Limitations” section for additional details.

ASPE Research Brief Page 6
ASPE Office of Health Policy October 2017
III. Average Premiums Tables 3 and 4 provide estimates of the average premium for the second-lowest cost silver plan (SLCSP), also called the benchmark plan, and the lowest-cost plan (LCP), available to a 27-year-old for
Exchange plans covering enrollees in plan year 2014 (PY14) through PY18 across all HealthCare.gov states. Figure 1 compares the annual growth between the SLCSP and the LCP across plan years. The bullets below compare differences between the upcoming plan year, PY18, and the prior plan year, PY17, in the first section; and highlight trends across all plan years in the second section. See Tables
3A, 3B, 4A and 4B in the Appendix for state and county specific estimates. States instructed issuers to take a variety of different approaches related to the treatment of cost-sharing reduction (CSR) payments for PY18. Many states required issuers to load an additional premium
increase onto silver plans to account for uncertainty associated with ongoing CSR litigation. In some states, premiums of silver plans may have increased in PY18 more than the premiums of non-silver plans and the premiums of gold plans may even be lower than the premiums of silver plans.
Differences between PY18 and PY17:
For the first time, in PY18, annual growth for the average monthly premium for the SLCSP, also
called the benchmark plan, (37%) outpaced growth for the LCP premium (17%) available to a 27-year-old (Figure 1). For enrollees who are eligible to receive advance premium tax credits (APTCs), the larger increase for the benchmark plan premium may result in these enrollees paying a lower portion of their premiums compared to prior plan years; especially if they select
plans from metal levels other than silver.
The average premium for the benchmark plan will increase by 37% in PY18 ($411) compared to PY17 ($300).
o Wyoming will have the highest average premium for the benchmark plan in PY18 ($710),
an increase of 72% from PY17 ($413).
o Indiana will have the lowest average premium for the benchmark plan in PY18 ($286), an increase of 26% from PY17 ($228).
o Iowa will have the highest percentage increase in the average premium for the benchmark
plan in PY18 ($585), an increase of 88% from PY17 ($310).
o Alaska will have the highest percentage decrease in the average premium for the benchmark plan in PY18 ($596), a decrease of 22% from PY17 ($760). The decrease is
likely associated with the Alaska Reinsurance Program approved earlier this year through a 1332 state innovation waiver and implemented in PY18.
The average monthly premium for the LCP will increase by 17% in PY18 ($291) compared to
PY17 ($248).

ASPE Research Brief Page 7
ASPE Office of Health Policy October 2017
Trends across Plan Years:
The average premium for the benchmark plan in PY18 ($411) will be 88% higher than in PY14
($218).
o Tennessee will have the highest percentage increase in the average premium for the benchmark plan in PY18 ($610) relative to the first plan year, PY14 ($161), an increase
of 278%.
o Indiana will have the lowest percentage increase in the average premium for the benchmark plan in PY18 ($286) relative to the first plan year, PY14 ($270), an increase
of 6%.
The average premium for the LCP in PY18 ($291) will be 77% higher than in PY14 ($164).
Figure 1 Annual Growth in the Second-Lowest Cost Silver Plan (SLCSP) and the Lowest-Cost Plan (LCP) Available to a 27-
Year-Old, PY15 - PY18
Source: Plan information is from the plan landscape files and active plan selections in the Centers for Medicare and Medicaid Services
(CMS) Multidimensional Insurance Data Analytics System (MIDAS) for states using the HealthCare.gov plat form between PY14 and
PY18.
Note: PY stands for plan year and is followed by the last two digits of the year of Exchange plan coverage, e.g. PY14 = plan year 2014.
The numbers in this table represent premiums before the application of advance premium tax credits. HealthCare.gov average premiums
are weighted by the number of Exchange plan selections in each county. The PY14 through PY17 average premiums are weighted by
current year plan selections and PY18 is weighted by PY17 plan selections. The approach identifies the second-lowest cost silver plan and
lowest-cost silver plan in each county based on the portion of the premium that covers essential health benefits. Catastrophic plans, which are not available to all consumers, were not considered in these calculations. Estimates include all states using the HealthCare.gov platform
in the specified plan year. See the “Methods and Limitations” section for details.
3%
8%
24%
37%
6%
12%
27%
17%
0%
5%
10%
15%
20%
25%
30%
35%
40%
PY15 PY16 PY17 PY18
SLCSP LCP

ASPE Research Brief Page 8
ASPE Office of Health Policy October 2017
Table 3
Average Monthly Premium for Second-Lowest Cost Silver Plan (SLCSP) for a 27-Year-Old in HealthCare.gov States, PY14 – PY18
SLCSP
Average Monthly Premium
for a 27-Year-Old
Annual
Percentage Change
Cumulative
Percentage Change
PY14 $218 - -
PY15 $224 3% 3%
PY16 $242 8% 11%
PY17 $300 24% 38%
PY18 $411 37% 88%
Source: Plan information is from the plan landscape files and active plan selections in the Centers for Medicare and Medicaid Services
(CMS) Multidimensional Insurance Data Analytics System (MIDAS) for states using the HealthCare.gov plat form between PY14 and
PY18.
Note: PY stands for plan year and is followed by the last two digits of the year of Exchange plan coverage, e.g. PY14 = plan year 2014.
The numbers in this table represent premiums before the application of advance premium tax credits. HealthCare.gov average pr emiums
are weighted by the number of Exchange plan selections in each county. The PY14 through PY17 average premiums are weighted by
current year plan selections and PY18 is weighted by PY17 plan selections. This analysis identifies the second-lowest cost silver plan in
each county based on the portion of the premium that covers essential health benefits. Estimates include all states using the
HealthCare.gov platform in the specified plan year. See the “Methods and Limitations” section for details.
Table 4
Average Monthly Premium for Lowest-Cost Plan (LCP) for a 27-Year-Old in HealthCare.gov States, PY14 – PY18
LCP
Average Monthly Premium
for a 27-Year-Old
Annual
Percentage Change
Cumulative
Percentage Change
PY14 $164 - -
PY15 $174 6% 6%
PY16 $196 12% 19%
PY17 $248 27% 51%
PY18 $291 17% 77%
Source: Plan information is from the plan landscape files and active plan selections in the Centers for Medicare and Medicaid Services
(CMS) Multidimensional Insurance Data Analytics System (MIDAS) for states using the HealthCare.gov plat form between PY14 and
PY18.
Note: PY stands for plan year and is followed by the last two digits of the year of Exchange plan coverage, e.g. PY14 = plan year 2014. The numbers in this table represent premiums before the application of advance premium tax credits. HealthCare .gov average premiums
are weighted by the number of Exchange plan selections in each county. The PY14 through PY17 average premiums are weighted by
current year plan selections and PY18 is weighted by PY17 plan selections. This analysis identifies the lowest-cost plan in each county
based on the portion of the premium that covers essential health benefits. Catastrophic plans, which are not available to all consumers, were
not considered in these calculations. Estimates include all states using the HealthCare.gov platform in the specified plan year. See the
“Methods and Limitations” section for details.

ASPE Research Brief Page 9
ASPE Office of Health Policy October 2017
IV. Subsidy Utilization and Costs
Table 5 provides estimates of the percentage of enrollees in Exchange plans to which advance premium tax credits (APTCs) and cost-sharing reductions (CSRs) were paid in plan year 2014 (PY14) through PY17 across all HealthCare.gov states. Table 6 contains estimates of APTCs in PY17 and PY18 for
specific household compositions that may be eligible to receive APTCs. Table 7 presents the average APTC for PY14 through PY17 and estimates the average APTC for PY18 for enrollees who selected plans during the PY17 Open Enrollment Period (OEP) using plans available in PY18. For all plan years, Table 7 uses the maximum APTC enrollees can receive. An enrollee will receive less than the maximum
APTC if he or she selects a plan with a premium less than the maximum APTC amount. The bullets below compare differences between the upcoming plan year, PY18, and the prior plan year, PY17, in the first section; and highlight trends across plan years in the second section. See Tables 5A and 6A in the Appendix for state and county specific estimates.
Differences between PY18 and PY17:
The estimated average APTC for current enrollees is $555 for PY18, a 45% increase from the
average in PY17 ($382).
A 27-year-old with a household income of $25,000 could receive an APTC of up to $273 for
PY18, a 73% increase from PY17 ($158) based on the average premium for the benchmark plan across all HealthCare.gov states.
A family of four with a household income of $60,000 could receive an APTC of up to $1,088 for
PY18, a 60% increase from PY17 ($678) based on the average premium for the benchmark plan across all HealthCare.gov states.
Trends across Plan Years:
The estimated average APTC for PY18 is $555, an increase of 114% since PY14 ($259).
The percentage of enrollees making plan selections with APTCs has remained relatively stable,
staying between 84% and 87% between PY14 and PY17.
The percentage of enrollees making plan selections with CSRs has remained relatively stable, at
approximately 60% between PY14 and PY17.

ASPE Research Brief Page 10
ASPE Office of Health Policy October 2017
Table 5
Percentage of HealthCare.gov Enrollees Receiving Subsidies, PY14 -PY17
Percentage of Plan Selections
with APTC
Percentage of Plan Selections
with CSR
PY14 84% 60%
PY15 87% 60%
PY16 85% 59%
PY17 84% 60%
Source: Financial assistance information is from active plan selections in the Centers for Medicare and Medicaid Services (CM S)
Multidimensional Insurance Data Analytics System (MIDAS) for states using the HealthCare.gov platform.
Note: PY stands for plan year and is followed by the last two digits of the year of Exchange plan coverage, e.g. PY14 = plan year 2 014.
Estimates based on plan selections made during the Open Enrollment Period for each specified plan year. See the “Methods and
Limitations” section for more details.
Table 6 Benchmark Premiums and Advance Premium Tax Credits (APTCs) for PY17 and PY18 and Percentage Increase in APTC in
HealthCare.gov States
27 Year-Old with a Household
Income of $25,000
Family of Four with a Household
Income of $60,000
PY17 Benchmark Before APTC $300 $1,085
PY17 APTC $158 $678
PY18 Benchmark Before APTC $411 $1,485
PY18 APTC $273 $1,088
Percentage Increase in APTC
PY17 to PY18 73% 60%
Source: Plan information is from the plan landscape files and active plan selections in the CMS Multidimensional Insurance Da ta Analytics
System (MIDAS) for states using the HealthCare.gov.
Note: PY stands for plan year and is followed by the last two digits of the year of Exchange plan coverage, e.g. PY14 = plan year 2014.
Averages for premiums are weighted by the county’s number of Exchange PY17 plan selections. In this exam ple, the family of four is one
40-year-old adult, one 38-year-old adult, and two children under the age of 21. All enrollees are assumed to not be tobacco users. For
households eligible for premium tax credits, after-tax-credit benchmark premiums are capped at a given percentage of household income.
The maximum percent of income paid toward the benchmark plan is adjusted annually to be a measure of the difference between p remium
growth and income growth. If the premium of the benchmark plan falls below the maximum applicable percentage of income amount for
which a household is responsible, then the household does not receive a tax credit and pays for the full premium for the plan selected.
After-tax benchmark premiums will differ slightly between PY17 and PY18 for identical family compositions and income amounts because
of changes in the applicable percentages and the Federal Poverty Level Guidelines. Alaska and Hawaii’s Federal poverty guidelines are higher than those for the continental United States; consequently, the after tax credit premium is lower for a given amount of income. Our
calculations of premiums after tax credits assume that all members of the family of four making $60,000 would be eligible for premium tax
credits. However, in states with higher Medicaid of Children’s Health Insurance Program (CHIP) thresholds, the children would be eligible
for Medicaid/CHIP and not eligible for premium tax credits. See the “Methods and Limitations” section for more details.

ASPE Research Brief Page 11
ASPE Office of Health Policy October 2017
Table 7
Average Advance Premium Tax Credit (APTC) in HealthCare.gov States, PY14 - PY18
Average APTC Annual Growth Cumulative Growth
PY14 $259 - -
PY15 $263 2% 2%
PY16 $289 10% 12%
PY17 $382 32% 47%
PY18 $555 45% 114%
Source: Plan information is from the plan landscape files and active plan selections in the Centers for Medicare and Medicaid Services
(CMS) Multidimensional Insurance Data Analytics System (MIDAS) for states using the HealthCare.gov p latform between PY14 and
PY18.
Note: PY stands for plan year and is followed by t he last two digits of the year of Exchange plan coverage, e.g. PY14 = plan year 2014. For PY14 through PY17, the estimates for average advance premium tax credit (APTC) are calculated using enrollees who made a plan
selection during each plan year’s Open Enrollment Period (OEP). For PY18, the average APTC is an estimate of the APTC for enrollees
who made a plan selection during the PY17 OEP using plans available in PY18 and the same methodology employed in previous years.
The PY18 estimates hold all PY17 enrollee characteristics unchanged and premiums are based on the same age and family composition as
in PY17. For PY18, only enrollees who could be linked to complete plan and premium data for PY18 and PY17 are included. Tobacco
users are excluded from all plan years. For all plan years, the estimates presented in this table use the maximum APTC enrollees can
receive. An enrollee will receive less than the maximum APTC if he or she selects a plan with a premium less than the maximum APTC
amount. See the “Methods and Limitations” section for more details.

ASPE Research Brief Page 12
ASPE Office of Health Policy October 2017
V. Lowest-Cost Plan Available
Tables 8 and 9 provide estimates of the lowest-cost plan (LCP) premium available to enrollees for plan year 2015 (PY15) through PY18 across all HealthCare.gov states. The estimates take enrollees who
made a plan selection in the prior Open Enrollment Period (OEP) and calculate the average premium for the LCP based on the plans available to these enrollees in the specified plan year, e.g. LCP available to PY14 enrollees in the PY15 OEP. The bullets below compare differences between the upcoming plan year, PY18, and the prior plan year, PY17, in the first section; and highlight trends across all plan years
in the second section. See Tables 8A, 8B, 9A, and 9B in the Appendix for state and county specific estimates. Differences between PY18 and PY17:
The percentage of enrollees with access to a plan for $200 or less decreased from 16% for PY17 to 6% for PY18.
If PY17 enrollees were to stay within their current metal level only 2% will have access to coverage with premiums of $200 or less for PY18.
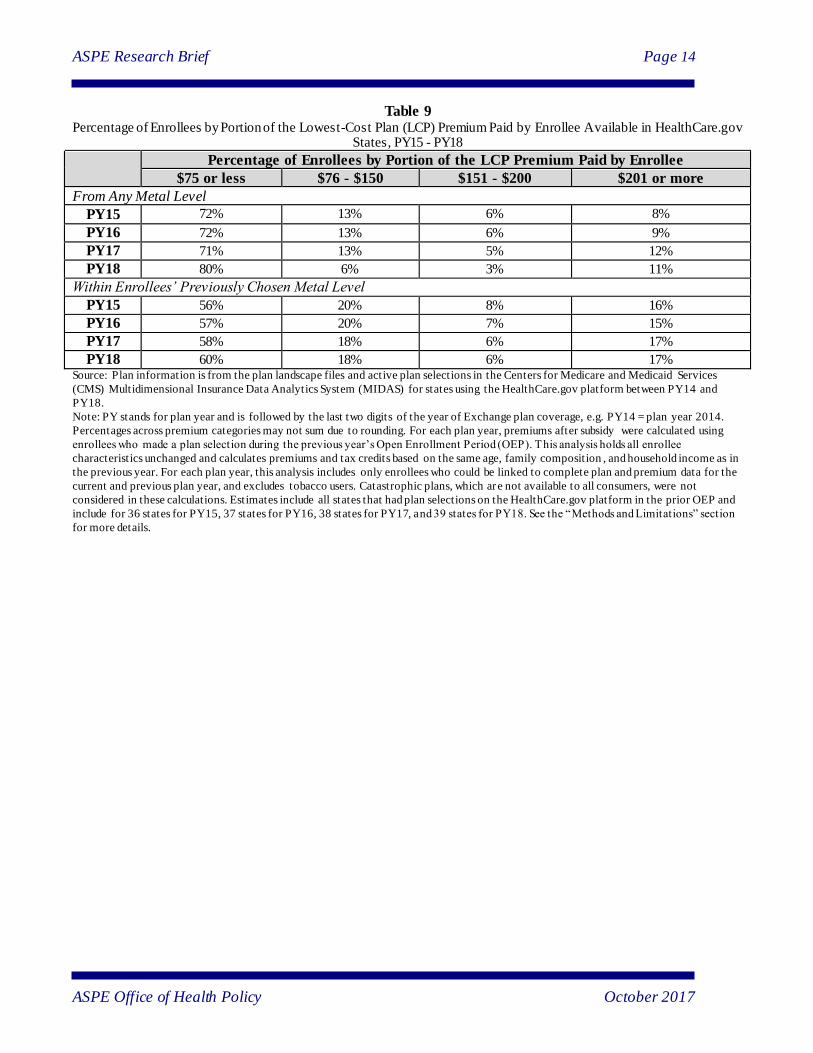
The percentage of enrollees with access to a plan for which they are responsible for paying less than $75 of the premium increased by 9 percentage points from PY17 (71%) to PY18 (80%).
Trends across Plan Years:
The percentage of enrollees with access to a plan for $200 or less decreased from 38% for PY15 to 6% for PY18.
The percentage of enrollees with access to coverage within their metal level with premiums of $200 or less decreased from 21% for PY15 to 2% for PY18.
The percentage of enrollees with access to a plan for which they are responsible for paying less than $75 of the premium increased by 8 percentage points from PY15 (72%) to PY18 (80%).

ASPE Research Brief Page 13
ASPE Office of Health Policy October 2017
Table 8 Percentage of Enrollees by Premium of the Lowest-Cost Plan (LCP) Available in HealthCare.gov States, PY15 - PY18
Percentage of Enrollees by LCP Premium
$200 or less $201 - $300 $301 - $400 $401 or more
From Any Metal Level
PY15 38% 28% 17% 17%
PY16 29% 31% 16% 24%
PY17 16% 28% 17% 39%
PY18 6% 25% 21% 48%
Within Enrollees’ Previously Chosen Metal Level
PY15 21% 31% 18% 30%
PY16 18% 31% 18% 33%
PY17 11% 24% 18% 47%
PY18 2% 12% 20% 66% Source: Plan information is from the plan landscape files and active plan selections in the Centers for Medicare and Medicaid Services
(CMS) Multidimensional Insurance Data Analytics System (MIDAS) for states using the HealthCare.gov platform between PY14 and
PY18.
Note: PY stands for plan year and is followed by the last two digits of the year of Exchange plan coverage, e.g. PY14 = plan year 2014.
Percentages across premium categories may not sum due to rounding. For each plan year, premiums were calculated using enrollees who
made a plan selection during the previous year’s Open Enrollment Period (OEP). The estimates hold all enrollee characteristic s unchanged
and premiums are based on the same age and family composition as in the previous year. For each plan year, only enrollees who could be linked to complete plan and premium data for the current and previous plan year are included, and tobacco users are excluded. Catastrophic
plans, which are not available to all consumers, were not considered in these calculations. Estimates include all states that had plan
selections on the HealthCare.gov platform in the prior OEP and include for 36 states for PY15, 37 states for PY16, 38 states for PY17, and
39 states for PY18. See the “Methods and Limitations” section for more details.
ASPE Research Brief Page 14
ASPE Office of Health Policy October 2017
Table 9 Percentage of Enrollees by Portion of the Lowest-Cost Plan (LCP) Premium Paid by Enrollee Available in HealthCare.gov
States, PY15 - PY18
Percentage of Enrollees by Portion of the LCP Premium Paid by Enrollee
$75 or less $76 - $150 $151 - $200 $201 or more
From Any Metal Level
PY15 72% 13% 6% 8%
PY16 72% 13% 6% 9%
PY17 71% 13% 5% 12%
PY18 80% 6% 3% 11%
Within Enrollees’ Previously Chosen Metal Level
PY15 56% 20% 8% 16%
PY16 57% 20% 7% 15%
PY17 58% 18% 6% 17%
PY18 60% 18% 6% 17% Source: Plan information is from the plan landscape files and active plan selections in the Centers for Medicare and Medicaid Services
(CMS) Multidimensional Insurance Data Analytics System (MIDAS) for states using the HealthCare.gov platform between PY14 and
PY18.
Note: PY stands for plan year and is followed by the last two digits of the year of Exchange plan coverage, e.g. PY14 = plan year 2014.
Percentages across premium categories may not sum due to rounding. For each plan year, premiums after subsidy were calculated using
enrollees who made a plan selection during the previous year’s Open Enrollment Period (OEP). This analysis holds all enrollee
characteristics unchanged and calculates premiums and tax credits based on the same age, family composition , and household income as in
the previous year. For each plan year, this analysis includes only enrollees who could be linked to complete plan and premium data for the
current and previous plan year, and excludes tobacco users. Catastrophic plans, which are not available to all consumers, were not
considered in these calculations. Estimates include all states that had plan selections on the HealthCare.gov platform in the prior OEP and
include for 36 states for PY15, 37 states for PY16, 38 states for PY17, and 39 states for PY18. See the “Methods and Limitations” section
for more details.

ASPE Research Brief Page 15
ASPE Office of Health Policy October 2017
VI. Methods and Limitations Data
County level data on issuers, plans, and premiums were obtained from the Federally-Facilitated Exchange (FFE) Qualified Health Plan (QHP) landscape files for plan year 2014 (PY14) through PY18; these files are publicly available on the HealthCare.gov website.
1 We used the individual and family
health plan files, which do not include stand-alone dental, child-only, and Small Business Health
Options Program (SHOP) plans. The landscape files are updated throughout the year to reflect changes in issuer participation and represent snapshots of issuers and plans on a specific date. We used the dated versions of the landscape files consistent with the most recently published ASPE Research Briefs on health plan choice and premiums in the health insurance Exchange.
2,3,4 There were between 36 and 39
states included in the landscape files for PY14 through PY18 as some states did not begin using the HealthCare.gov platform until after PY14, and one state stopped using the platform after PY14.
5 Except
where noted, we used all available states in each landscape file to calculate national estimates.
Individual level enrollment data were obtained from the Centers for Medicare and Medicaid Services (CMS) Multidimensional Insurance Data Analytics System (MIDAS). The enrollment data represent active QHP selections at a point in time, similar to the landscape files. We used the dated versions of MIDAS consistent with the most recently published ASPE Research Briefs on health plan choice and
premiums in the health insurance Exchange.6 Throughout this brief, we use the term “enrollees” to refer
to individuals with active Exchange individual market health plan selections in the MIDAS data; the term does not refer to “effectuated enrollees” – individuals who selected plans and paid the premium. As a result, estimates in this brief may differ from those calculated using effectuated enrollment.
Plan data not available in the landscape files or MIDAS were obtained from the CMS Health Insurance Marketplace Public Use Files (Marketplace PUFs).
7 The Benefits and Cost Sharing PUFs were used to
1 The FFM QHP landscape files can be downloaded at: https://www.healthcare.gov/health-and-dental-plan-datasets-for-
researchers-and-issuers/. 2 The 2016 ASPE Research Brief can be downloaded at: https://aspe.hhs.gov/pdf-report/health-plan-choice-and-premiums-
2016-health-insurance-marketplace. 3 The 2017 ASPE Research Brief can be downloaded at: https://aspe.hhs.gov/pdf-report/health-plan-choice-and-premiums-
2017-health-insurance-marketplace. 4 The landscape file dated versions used for each plan year in this brief were: PY14 (January 2014); PY15 (August 2015);
PY16 (July 29, 2016); PY17 (October 14, 2016); PY18 (October 23, 2017). 5 In total, there are 35 states included in the landscape files for all PYs (Alabama, Alaska, Arizona, Arkansas, Delaware,
Florida, Georgia, Illinois, Indiana, Iowa, Kansas, Louisiana, Maine, Michigan, Mississippi, Missouri, Montana, Nebraska, New Hampshire, New Jersey, New Mexico, North Carolina, North Dakota, Ohio, Oklahoma, Pennsylvania, South Carolina, South Dakota, Tennessee, Texas, Utah, Virginia, West Virginia, Wisconsin, and Wyoming), one state in only PY14 (Idaho),
two states in PY15-PY2018 (Nevada and Oregon), one state in PY16-PY18 (Hawaii), one state in PY17-PY18 (Kentucky), and ten states plus the District of Columbia without data in any landscape file PY (California, Colorado, Connecticut, District
of Columbia, Maryland, Massachusetts, Minnesota, New York, Rhode Island, Vermont, Washington). In total, each plan year landscape file contained the following number of states: 36 in PY14, 37 in PY15, 38 in PY16, and 39 in PY17 and PY18; with a total of 40 states included in at least one plan year landscape file. 6 The MIDAS enrollment file dated versions included in this brief are: 2014 (April 2014); 2015 (February 22, 2015); 2016
(February 2, 2016); 2017 (January 31, 2017). 7 The Marketplace PUFs are available at: https://www.cms.gov/cciio/resources/data-resources/marketplace-puf.html

ASPE Research Brief Page 16
ASPE Office of Health Policy October 2017
identify the percentage of premiums covering essential health benefits (EHBs) in PY14 and PY15, as they were absent from the landscape files for these years. Issuers Participations and Plan Options
To examine issuers and plans, we estimated the total and average number of issuers, health plans, and plan metal types across HealthCare.gov states. We estimated differences in issuer participation and plan choice for the upcoming plan year and previous plan years. Weighted and unweighted averages and
percentage distributions were calculated. Averages were weighted using county level plan selections in the MIDAS data for the same year as each of the plan year landscape files used, except for PY18, which was weighted using PY17 plan selections. Issuers were identified using their unique five-digit Health Insurance Oversight System (HIOS) issuer IDs. In some cases, issuers with different HIOS IDs belong
to the same parent company. An issuing entity’s HIOS ID is specific to the state in which it operates, such that a company offering QHPs through the Exchange in two states would appear to be two separate issuers.
Average Premiums To examine average premiums, we determined the second-lowest cost silver plan (SLCSP), also called the benchmark plan, for each county in each of the landscape files. Plans in the Exchange are required to
offer a comprehensive package of items and services, known as essential health benefits (EHBs). Exchange plans can also offer benefits beyond EHBs and each plan reports the percentage of premium related to EHB. Most plans have an EHB percentage of 100%; however, plans that cover benefits beyond EHB have EHB percentages smaller than 100%, reflecting the fact that a portion of the premium
pays for benefits beyond EHB. Benchmark plans are determined by ranking silver plans available to a consumer by the amount of premium related to EHB only. To estimate the benchmark plan available to consumers, we ranked each silver plan in a county by the EHB premium amount and identified the SLCSP available in that county. In some counties, the EHB premium amount for two silver plans is the
same and that amount is the lowest-cost silver plan available. From PY14-PY17, when this occurred, the silver plan identified as the benchmark was the silver plan with the next highest premium relative to the tied lowest-cost silver plans, if a next highest silver plan was available; otherwise, the tied lowest-cost silver plan was the benchmark. For PY18, when this occurred, the premium for the tied lowest-cost
silver plans will be used as the benchmark plan. This operational change resulted from a clarification in how to calculate advance premium tax credits (APTCs) released by Internal Revenue Service (IRS) (https://www.irs.gov/affordable-care-act/individuals-and-families/questions-and-answers-on-the-premium-tax-credit). Additionally, when a county only has a single silver plan it is used as the
benchmark. In this brief, the terms “SLCSP” and “benchmark plan” are used interchangeably to refer to the plan in a county most likely to be the benchmark plan for enrollees in that county; however, the plan may not be the actual benchmark plan for all individual consumers in a county.
We calculated the average premium and the annual and cumulative percentage change in these for the SLCSP and the lowest-cost plan (LCP) available to a 27-year-old for Exchange plans covering enrollees in plan year 2014 (PY14) through PY18 across all HealthCare.gov states.

ASPE Research Brief Page 17
ASPE Office of Health Policy October 2017
Subsidy Utilization and Cost
To examine subsidies, we calculated the percentage of MIDAS plan selections receiving financial assistance for APTCs and cost-sharing reductions (CSRs) in PY14 through PY17. Additionally, we
calculated the average benchmark plan premium and APTC for PY17 and PY18 under two scenarios for household compositions eligible for APTC: 1) a 27-year-old with household income of $25,000, and 2) a family of four with a household income of $60,000. Estimates of average before and after APTC premium, average APTC amount, and the percentage change in the average APTC amount were
calculated. Finally, we estimated the average maximum APTC for PY14 through PY18. For PY14-PY17, we estimated the average maximum APTC using plan selections made during each plan year’s Open Enrollment Period (OEP). For PY18, we estimated the average maximum APTC for enrollees who selected plans during the PY17 OEP using the benchmark plan available in PY18. See Lowest-Cost
Premiums Available below for details of how enrollees in PY17 were linked to PY18. Note, here we use the maximum APTC enrollees can receive. An enrollee will receive less than the maximum APTC if he or she selects a plan with a premium less than the maximum APTC amount.
APTCs were calculated using the maximum applicable amount determined annually by the IRS and based on household income. The maximum applicable amount is the amount of premium an APTC eligible consumer in the Exchange is expected to pay toward their benchmark premium. Individuals eligible to enroll in the Exchange with household incomes between 100%-400% of the Federal poverty
level (FPL) are APTC eligible unless they are disqualified based on other factors. The amount of APTC a consumer qualifies for was calculated by subtracting the maximum applicable amount from their benchmark plan EHB premium amount. However, APTC can only be applied to the portion of a plan’s premium that covers EHB. For example, if a consumer has a $200 APTC and selects a plan that costs
$200 before APTC and has an EHB amount of 95%, the tax credit will cover $190 of the plan premium and she will be responsible for covering the remaining $10. We included this factor in our APTC calculations. Although EHB premium amounts were used in determining the benchmark plan and APTCs, comparisons of premiums in this brief use the full premium amount, not just the EHB amount.
Lowest-Cost Plan Available To examine the LCP premiums available to enrollees, we estimated the percentage of current enrollees,
defined as individuals who made plan selections in the prior OEP, e.g. the premiums for the LCP (identified in PY18 landscape files) available to PY17 enrollees (from PY17 MIDAS plan selections) in PY18, who could obtain coverage for several premium dollar amount markers. We calculated estimates within and regardless of current enrollees’ current metal level for PY15 through PY18. For PY18, there
is a new metal level of coverage, expanded bronze, which has an actuarial value between 56 and 65 percent. For the purposes of this brief, this plan type is included in the standard bronze category. Estimates across all states and for each state are provided. Enrollee characteristics, including age, family composition, and household income were held constant when estimating premiums. We included only
enrollees who could be linked to complete plan and premium data in their current enrollment year and the prior plan year. Therefore, each plan year’s estimates exclude any states that had no plan selections on the HealthCare.gov platform in the prior OEP. The estimates include for 36 states for PY15, 37 states for PY16, 38 states for PY17, and 39 states for PY18. We excluded tobacco users as their premium rates
may be higher than standard, non-tobacco rates. For PY14 and PY15, we also excluded enrollees in

ASPE Research Brief Page 18
ASPE Office of Health Policy October 2017
Virginia plans covering treatment of morbid obesity. Catastrophic plans, which are not available to all consumers, were also excluded. Differences from Previous Briefs
Last year’s report included analyses on shopping for coverage and the financial benefits of shopping for and switching plans, plan metal level stratification for lowest cost plan premiums available, median estimates, income stratification for financial assistance and examples of maximum monthly premiums
for benchmark plan for a single adult. This year’s report does not include this information.
ASPE Research Brief Page 19
ASPE Office of Health Policy October 2017
Appendix: State and County Tables
Table 1A
Total and Number of State Issuers in the HealthCare.gov Exchange, PY14 - PY18
State PY14 PY15 PY16 PY17 PY18
Change Issuers Entry/Exit
PY17-
PY18
PY14-
PY18
Entry
PY18
Exit
PY18
States Using HealthCare.gov
in at Least O ne Plan Year 191 231 232 167 132 -35 -59 9 44
States Using HealthCare.gov
in all Five Plan Years 187 217 217 152 121 -31 -66 8 39
AK 2 2 2 1 1 0 -1 0 0
AL 2 3 3 1 2 1 0 1 0
AR 3 4 5 4 4 0 1 0 0
AZ 10 12 8 2 2 0 -8 0 0
DE 3 3 3 3 1 -2 -2 0 2
FL 11 12 10 7 6 -1 -5 0 1
GA 5 8 9 5 4 -1 -1 0 1
HI N/A N/A 2 2 2 0 N/A 0 0
IA 4 3 4 5 1 -4 -3 0 4
ID 4 N/A N/A N/A N/A N/A N/A 0 0
IL 8 9 9 5 4 -1 -4 0 1
IN 4 8 8 4 2 -2 -2 0 2
KS 4 5 4 3 3 0 -1 2 2
KY N/A N/A N/A 3 2 -1 N/A 0 1
LA 5 5 5 4 3 -1 -2 0 1
ME 2 3 2 3 2 -1 0 0 1
MI 12 15 14 10 8 -2 -4 0 2
MO 4 7 7 4 3 -1 -1 1 2
MS 2 3 3 2 1 -1 -1 0 1
MT 3 3 3 3 3 0 0 0 0
NC 2 3 3 2 2 0 0 0 0
ND 3 3 3 3 2 -1 -1 0 1
NE 4 2 4 2 1 -1 -3 0 1
NH 1 4 4 4 3 -1 2 0 1
NJ 4 6 6 3 4 1 0 1 0
NM 4 5 4 4 4 0 0 0 0
NV N/A 4 4 4 2 -2 N/A 1 3
OH 12 15 16 11 8 -3 -4 1 4
OK 6 3 2 1 1 0 -5 0 0
OR N/A 10 9 6 5 -1 N/A 0 1
PA 14 14 13 8 9 1 -5 1 0
SC 4 4 4 1 1 0 -3 0 0
SD 3 3 2 2 2 0 -1 0 0
TN 4 3 4 3 3 0 -1 1 1
TX 12 14 19 10 8 -2 -4 0 2
UT 6 6 4 3 2 -1 -4 0 1
VA 8 9 11 11 7 -4 -1 0 4
WI 13 15 16 15 11 -4 -2 0 4
WV 1 1 2 2 2 0 1 0 0
WY 2 2 1 1 1 0 -1 0 0
Source: Plan information is from the plan landscape files and active plan selections in the Centers for Medicare and Medicaid Services (CMS)
Multidimensional Insurance Data Analytics System (MIDAS) for states using the HealthCare.gov platform between PY14 and PY18. Note: PY stands for plan year and is followed by the last two digits of the year of Exchange plan coverage, e.g. PY14 = plan year 2014. Numbers may not
sum exactly due to rounding. Two estimates are included for HealthCare.gov states, one with all states included in a given plan year and the other includi ng only the 35 states using HealthCare.gov across all plan years. Issuers were identified using their unique five-digit Health Insurance Oversight System (HIOS)
issuer IDs within a state. In some cases, issuers with different HIOS IDs belong to the same parent company. An issuing entity’s HIOS ID is specific to the state in which it operates, such that a company offering qualified health plans through the Exchange in two states would appear to be two separate issuers.
Data do not include stand-alone dental plans, child-only plans, or small business health options program (SHOP) plans. See the “ Methods and Limitations” section for additional details.
ASPE Research Brief Page 20
ASPE Office of Health Policy October 2017
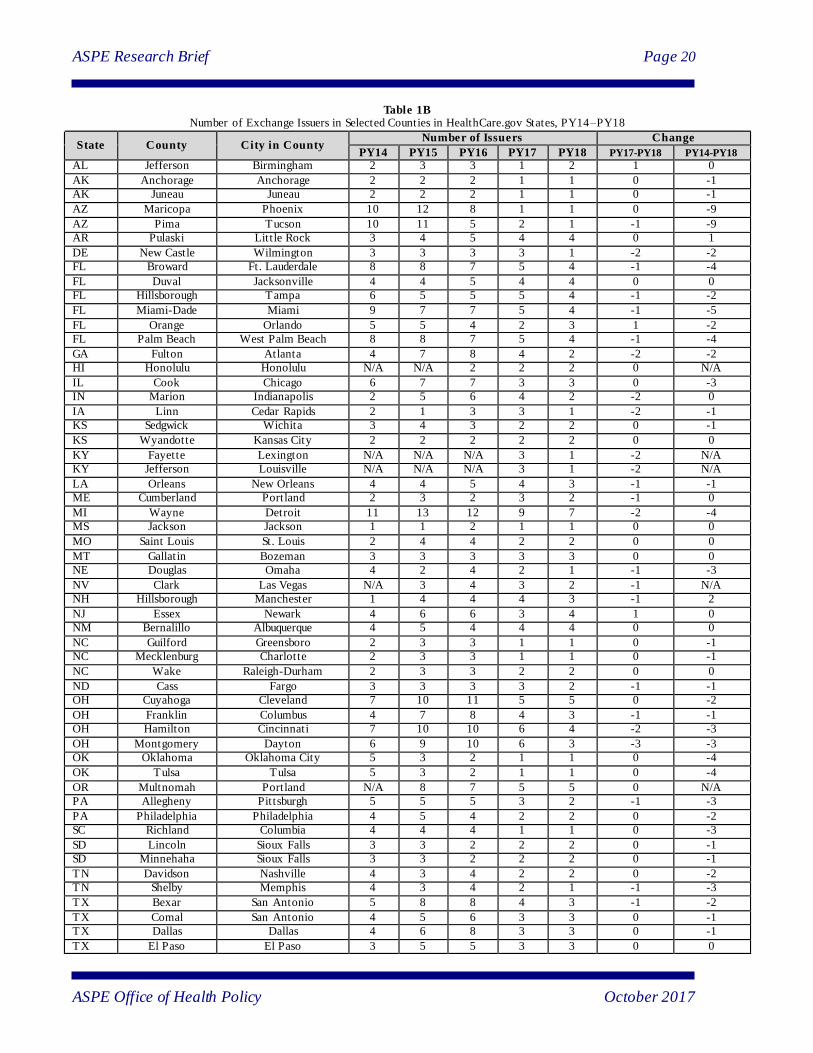
Table 1B Number of Exchange Issuers in Selected Counties in HealthCare.gov States, PY14–PY18
State County City in County Number of Issuers Change
PY14 PY15 PY16 PY17 PY18 PY17-PY18 PY14-PY18
AL Jefferson Birmingham 2 3 3 1 2 1 0
AK Anchorage Anchorage 2 2 2 1 1 0 -1
AK Juneau Juneau 2 2 2 1 1 0 -1
AZ Maricopa Phoenix 10 12 8 1 1 0 -9
AZ Pima Tucson 10 11 5 2 1 -1 -9
AR Pulaski Little Rock 3 4 5 4 4 0 1
DE New Castle Wilmington 3 3 3 3 1 -2 -2
FL Broward Ft. Lauderdale 8 8 7 5 4 -1 -4
FL Duval Jacksonville 4 4 5 4 4 0 0
FL Hillsborough Tampa 6 5 5 5 4 -1 -2
FL Miami-Dade Miami 9 7 7 5 4 -1 -5
FL Orange Orlando 5 5 4 2 3 1 -2
FL Palm Beach West Palm Beach 8 8 7 5 4 -1 -4
GA Fulton Atlanta 4 7 8 4 2 -2 -2
HI Honolulu Honolulu N/A N/A 2 2 2 0 N/A
IL Cook Chicago 6 7 7 3 3 0 -3
IN Marion Indianapolis 2 5 6 4 2 -2 0
IA Linn Cedar Rapids 2 1 3 3 1 -2 -1
KS Sedgwick Wichita 3 4 3 2 2 0 -1
KS Wyandotte Kansas City 2 2 2 2 2 0 0
KY Fayette Lexington N/A N/A N/A 3 1 -2 N/A
KY Jefferson Louisville N/A N/A N/A 3 1 -2 N/A
LA Orleans New Orleans 4 4 5 4 3 -1 -1
ME Cumberland Portland 2 3 2 3 2 -1 0
MI Wayne Detroit 11 13 12 9 7 -2 -4
MS Jackson Jackson 1 1 2 1 1 0 0
MO Saint Louis St. Louis 2 4 4 2 2 0 0
MT Gallatin Bozeman 3 3 3 3 3 0 0
NE Douglas Omaha 4 2 4 2 1 -1 -3
NV Clark Las Vegas N/A 3 4 3 2 -1 N/A
NH Hillsborough Manchester 1 4 4 4 3 -1 2
NJ Essex Newark 4 6 6 3 4 1 0
NM Bernalillo Albuquerque 4 5 4 4 4 0 0
NC Guilford Greensboro 2 3 3 1 1 0 -1
NC Mecklenburg Charlotte 2 3 3 1 1 0 -1
NC Wake Raleigh-Durham 2 3 3 2 2 0 0
ND Cass Fargo 3 3 3 3 2 -1 -1
OH Cuyahoga Cleveland 7 10 11 5 5 0 -2
OH Franklin Columbus 4 7 8 4 3 -1 -1
OH Hamilton Cincinnati 7 10 10 6 4 -2 -3
OH Montgomery Dayton 6 9 10 6 3 -3 -3
OK Oklahoma Oklahoma City 5 3 2 1 1 0 -4
OK Tulsa Tulsa 5 3 2 1 1 0 -4
OR Multnomah Portland N/A 8 7 5 5 0 N/A
PA Allegheny Pittsburgh 5 5 5 3 2 -1 -3
PA Philadelphia Philadelphia 4 5 4 2 2 0 -2
SC Richland Columbia 4 4 4 1 1 0 -3
SD Lincoln Sioux Falls 3 3 2 2 2 0 -1
SD Minnehaha Sioux Falls 3 3 2 2 2 0 -1
TN Davidson Nashville 4 3 4 2 2 0 -2
TN Shelby Memphis 4 3 4 2 1 -1 -3
TX Bexar San Antonio 5 8 8 4 3 -1 -2
TX Comal San Antonio 4 5 6 3 3 0 -1
TX Dallas Dallas 4 6 8 3 3 0 -1
TX El Paso El Paso 3 5 5 3 3 0 0

ASPE Research Brief Page 21
ASPE Office of Health Policy October 2017
TX Harris Houston 6 7 7 3 4 1 -2
TX Hidalgo McAllen 3 6 7 4 3 -1 0
TX Medina San Antonio 2 2 3 1 2 1 0
TX Travis Austin 7 8 8 3 4 1 -3
UT Salt Lake Salt Lake City 6 6 4 3 2 -1 -4
VA Henrico Richmond 4 3 4 4 1 -3 -3
WV Cabell Huntington 1 1 2 2 2 0 1
WV Wayne Huntington 1 1 2 2 2 0 1
WI Milwaukee Milwaukee 4 6 6 4 3 -1 -1
WY Laramie Cheyenne 2 2 1 1 1 0 -1
Source: Plan information is from the plan landscape files and active plan selections in the Centers for Medicare and Medicaid Services (CMS)
Multidimensional Insurance Data Analytics System (MIDAS) for states using the HealthCare.gov platform between PY14 and PY18. Note: PY stands for plan year and is followed by the last two digits of the year of Exchange plan coverage, e.g. PY14 = plan year 2014. Numbers may not
sum exactly due to rounding. Numbers may not sum exactly due to rounding. Issuers were identified using their unique five-digit Health Insurance Oversight System (HIOS) issuer IDs within a state. In some cases, issuers with different HIOS IDs belong to the same parent company. An issuing entity’s HIOS ID is
specific to the state in which it operates, such that a company offering qualified health plans (QHPs) through the Exchange in two states would appear to be two separate issuers. Data do not include stand-alone dental plans, child-only plans, or small business health options program (SHOP) plans. See the
“ Methods and Limitations” section for additional details.

ASPE Research Brief Page 22
ASPE Office of Health Policy October 2017
Table 2A
Average Number of Exchange Qualified Health Plans (QHPs) per County and per Issuer in County by State for HealthCare.gov States,
PY14-PY18
State
Average QHPs per County Average QHPs per Issuer in County
PY14 PY15 PY16 PY17 PY18 Change
PY14 PY15 PY16 PY17 PY18 Change
PY17-
PY18
PY14-
PY18
PY17-
PY18
PY14-
PY18
HealthCare.gov
States 51 55 46 30 25 -6 -26 12 12 10 10 10 -1 -2
AK 34 28 15 5 5 0 -29 17 14 8 5 5 0 -12
AL 7 18 13 6 7 1 0 6 8 6 6 6 0 0
AR 29 34 40 24 25 2 -3 11 9 8 6 7 0 -4
AZ 105 105 51 4 5 1 -100 11 10 8 4 5 1 -7
DE 19 24 28 19 6 -13 -13 6 8 9 6 6 0 0
FL 112 65 52 54 55 0 -58 19 11 10 14 15 1 -4
GA 32 58 48 32 16 -16 -15 11 11 8 12 10 -2 0
HI N/A N/A 20 22 21 -1 N/A N/A N/A 10 11 11 -1 N/A
IA 29 12 26 15 5 -10 -24 14 11 9 6 5 -1 -9
ID 30 N/A N/A N/A N/A N/A N/A 8 N/A N/A N/A N/A N/A N/A
IL 54 87 43 29 21 -9 -33 11 15 9 12 9 -3 -2
IN 25 49 61 45 25 -20 0 10 11 11 12 15 2 5
KS 28 28 26 13 11 -2 -17 11 10 10 7 5 -1 -6
KY N/A N/A N/A 12 11 -1 N/A N/A N/A N/A 6 11 5 N/A
LA 39 41 34 19 21 2 -18 11 11 8 6 7 1 -4
ME 17 25 21 25 15 -10 -2 9 8 10 8 8 -1 -1
MI 41 88 80 62 37 -26 -4 5 11 11 10 6 -4 1
MO 19 29 37 17 10 -7 -9 9 9 10 10 7 -3 -2
MS 16 31 23 18 5 -13 -11 11 13 9 13 5 -8 -6
MT 26 34 30 21 16 -5 -10 9 11 10 7 5 -2 -3
NC 22 35 24 10 9 -2 -13 14 14 10 9 8 -1 -6
ND 24 28 21 19 8 -11 -15 8 10 7 6 6 0 -2
NE 31 20 31 12 7 -5 -23 9 10 8 6 7 1 -1
NH 10 32 29 32 14 -18 4 10 8 7 8 5 -3 -5
NJ 26 46 54 19 19 0 -7 7 8 9 6 5 -1 -2
NM 38 50 25 20 15 -5 -24 10 10 6 5 4 -1 -6
NV N/A 42 49 26 12 -14 N/A N/A 13 13 8 6 -2 N/A
OH 40 70 73 45 32 -13 -8 8 9 9 11 10 -2 2
OK 47 38 22 13 6 -7 -42 12 16 11 13 6 -7 -6
OR N/A 75 58 29 20 -8 N/A N/A 10 9 7 5 -1 N/A
PA 35 43 32 13 14 1 -21 7 8 7 5 7 1 0
SC 26 54 56 25 23 -2 -3 7 15 22 25 23 -2 16
SD 32 36 19 17 17 0 -15 11 12 10 9 9 0 -2
TN 59 57 57 7 6 -1 -53 22 28 19 4 4 0 -17
TX 40 60 51 26 24 -2 -17 10 11 9 10 8 -2 -2
UT 76 89 59 22 23 1 -53 14 17 22 8 12 4 -3
VA 29 28 35 34 12 -22 -16 8 8 9 9 6 -2 -2
WI 66 84 60 45 31 -14 -36 17 16 11 12 11 -1 -6
WV 12 14 18 12 15 3 3 12 14 15 7 9 2 -3
WY 16 40 28 28 10 -18 -6 8 20 28 28 10 -18 2
Source: Plan information is from the plan landscape files and active plan selections in the Centers for Medicare and Medicaid Services (CMS) Multidimensional Insurance Data Analytics System (MIDAS) for states using the HealthCare.gov platform between PY14 and PY18.
Note: PY stands for plan year and is followed by the last two digits of the year of Exchange plan coverage, e.g. PY14 = plan year 2014. Numbers may not sum exactly due to rounding. Numbers may not sum exactly due to rounding. Averages were weighted using MIDAS plan selections in the county for the
same plan year as the plan landscape file, except PY18 for which PY17 plan selections were used. Issuers were identified using their unique five-digit Health Insurance Oversight System (HIOS) issuer IDs within a state. In some cases, issuers with different HIOS IDs belong to the same parent company. An issuing
entity’s HIOS ID is specific to the state in which it operates, such that a company offering qualified health plans through the Exchange in two states would appear to be two separate issuers. Data do not include stand-alone dental plans, child-only plans, or small business health options program (SHOP) plans.
See the “ Methods and Limitations” section for additional details.

ASPE Research Brief Page 23
ASPE Office of Health Policy October 2017
Table 3A Average Monthly Premium for the Second-Lowest Cost Silver Plan (SLCSP) for a 27-Year-Old by State for HealthCare.gov States,
PY14–PY18
State
SLCSP Average Monthly Premium for a 27-Year-O ld
PY14 PY15 PY16 PY17 PY18 Percentage Change
PY17–PY18 PY14–PY18
HealthCare.gov States $218 $224 $242 $300 $411 37% 88% AK $349 $449 $590 $760 $596 -22% 71%
AL $210 $216 $244 $384 $458 19% 118%
AR $241 $235 $244 $248 $298 21% 24%
AZ $164 $161 $196 $424 $425 0% 158%
DE $237 $247 $292 $347 $484 40% 104%
FL $218 $235 $238 $272 $382 41% 76%
GA $236 $228 $237 $270 $398 47% 68%
HI N/A N/A $213 $288 $378 31% N/A
IA $207 $217 $246 $310 $585 88% 182%
ID $199 N/A N/A N/A N/A N/A N/A
IL $186 $192 $208 $299 $399 34% 115%
IN $270 $268 $235 $228 $286 26% 6%
KS $196 $187 $217 $308 $425 38% 116%
KY N/A N/A N/A $237 $357 50% N/A
LA $252 $267 $290 $338 $389 15% 54%
ME $266 $263 $275 $316 $483 53% 82%
MI $207 $209 $213 $228 $313 37% 51%
MO $235 $233 $257 $305 $434 42% 84%
MS $313 $255 $230 $272 $445 64% 42%
MT $208 $196 $264 $381 $430 13% 107%
NC $244 $259 $319 $445 $514 15% 111%
ND $233 $248 $270 $288 $309 7% 33%
NE $205 $243 $272 $416 $629 51% 207%
NH $237 $205 $215 $219 $389 78% 64%
NJ $265 $259 $272 $286 $339 18% 28%
NM $183 $163 $174 $224 $340 52% 86%
NV N/A $217 $234 $248 $355 43% N/A
OH $216 $218 $222 $227 $312 38% 44%
OK $175 $185 $251 $425 $541 27% 209%
OR N/A $183 $225 $286 $343 20% N/A
PA $198 $193 $213 $325 $472 45% 138%
SC $222 $223 $247 $318 $428 34% 92%
SD $234 $216 $270 $374 $427 14% 82%
TN $161 $191 $236 $387 $610 58% 278%
TX $204 $211 $221 $262 $356 36% 75%
UT $206 $212 $245 $294 $522 77% 153%
VA $223 $230 $239 $264 $440 66% 98%
WI $246 $251 $262 $302 $468 55% 90%
WV $230 $248 $294 $387 $455 18% 98%
WY $344 $359 $380 $413 $710 72% 106%
Source: Plan information is from the plan landscape files and active plan selections in the CMS Multidimensional Insurance Data Analytics System (MIDAS) for states using the HealthCare.gov platform between plan years 2014 (PY14) and PY18.
Note: The numbers in this table represent premiums before the application of advance premium tax credits. HealthCare.gov average premiums are weighted by the number of Exchange plan selections in each county. The PY14 through PY17 are weight by current year plan selections and PY18 is weighted by
PY17 plan selections. This analysis identifies the second-lowest cost silver plan in each county based on the portion of the premium that covers essential health benefits. Estimates include all states using the HealthCare.gov platform in the specified plan year. See the “ Methods and Limitations” section for
details.

ASPE Research Brief Page 24
ASPE Office of Health Policy October 2017
Table 3B Second-Lowest Cost Silver Plan (SLCSP) Monthly Premium for a 27-Year-Old in Selected Count ies in HealthCare.gov States, PY14–
PY18
State County City in County
SLCSP Monthly Premium for a 27-Year-O ld
PY14 PY15 PY16 PY17 PY18 Percent Change
PY17–PY18 PY14–PY18
AL Jefferson Birmingham $211 $217 $236 $404 $447 11% 112%
AK Anchorage Anchorage $355 $449 $590 $741 $582 -21% 64%
AK Juneau Juneau $334 $449 $590 $760 $596 -22% 78%
AZ Maricopa Phoenix $161 $145 $170 $416 $421 1% 161%
AZ Pima Tucson $138 $147 $178 $286 $297 4% 115%
AR Pulaski Little Rock $251 $245 $254 $257 $310 20% 24%
DE New Castle Wilmington $237 $247 $292 $347 $484 40% 104%
FL Broward Ft. Lauderdale $199 $198 $239 $249 $349 40% 75%
FL Duval Jacksonville $210 $223 $220 $254 $376 48% 79%
FL Hillsborough Tampa $199 $240 $206 $258 $360 39% 81%
FL Miami-Dade Miami $221 $236 $216 $251 $363 44% 64%
FL Orange Orlando $225 $244 $256 $298 $385 29% 71%
FL Palm Beach West Palm Beach $220 $237 $235 $244 $349 43% 58%
GA Fulton Atlanta $205 $224 $210 $224 $345 54% 68%
HI Honolulu Honolulu N/A N/A $213 $288 $378 31% N/A
IL Cook Chicago $174 $177 $160 $255 $337 32% 94%
IN Marion Indianapolis $290 $277 $266 $235 $301 28% 4%
IA Linn Cedar Rapids $209 $202 $233 $247 $576 133% 176%
KS Sedgwick Wichita $184 $179 $203 $296 $397 34% 116%
KS Wyandotte Kansas City $213 $188 $240 $324 $468 45% 120%
KY Fayette Lexington N/A N/A N/A $205 $323 58% N/A
KY Jefferson Louisville N/A N/A N/A $188 $327 74% N/A
LA Orleans New Orleans $257 $243 $272 $306 $335 10% 30%
ME Cumberland Portland $242 $231 $236 $280 $421 51% 74%
MI Wayne Detroit $184 $188 $185 $194 $272 40% 48%
MS Jackson Jackson $332 $253 $228 $297 $486 64% 46%
MO Saint Louis St. Louis $216 $226 $235 $254 $381 50% 76%
MT Gallatin Bozeman $206 $195 $267 $399 $448 12% 118%
NE Douglas Omaha $222 $216 $256 $302 $617 104% 178%
NV Clark Las Vegas N/A $195 $214 $231 $315 36% N/A
NH Hillsborough Manchester $237 $202 $214 $219 $389 78% 64%
NJ Essex Newark $264 $259 $271 $289 $337 16% 28%
NM Bernalillo Albuquerque $159 $141 $153 $212 $329 55% 106%
NC Guilford Greensboro $228 $247 $292 $440 $519 18% 128%
NC Mecklenburg Charlotte $251 $268 $335 $469 $547 17% 118%
NC Wake Raleigh-Durham $222 $238 $294 $401 $456 14% 105%
ND Cass Fargo $222 $223 $249 $271 $244 -10% 10%
OH Cuyahoga Cleveland $204 $202 $189 $196 $262 34% 28%
OH Franklin Columbus $207 $200 $240 $247 $331 34% 60%
OH Hamilton Cincinnati $196 $208 $197 $195 $290 48% 48%
OH Montgomery Dayton $212 $226 $217 $209 $310 48% 46%
OK Oklahoma Oklahoma City $165 $179 $242 $404 $562 39% 240%
OK Tulsa Tulsa $183 $183 $247 $423 $520 23% 185%
OR Multnomah Portland N/A $175 $215 $256 $311 22% N/A
PA Allegheny Pittsburgh $139 $141 $156 $193 $293 52% 110%
PA Philadelphia Philadelphia $246 $219 $226 $343 $521 52% 112%
SC Richland Columbia $220 $226 $258 $331 $461 39% 109%
SD Lincoln Sioux Falls $217 $210 $253 $367 $372 1% 71%
SD Minnehaha Sioux Falls $217 $210 $253 $367 $372 1% 71%
TN Davidson Nashville $154 $188 $230 $344 $480 40% 211%
TN Shelby Memphis $159 $183 $229 $341 $671 97% 323%
TX Bexar San Antonio $196 $207 $186 $227 $305 34% 55%
TX Comal San Antonio $202 $195 $194 $232 $305 31% 51%
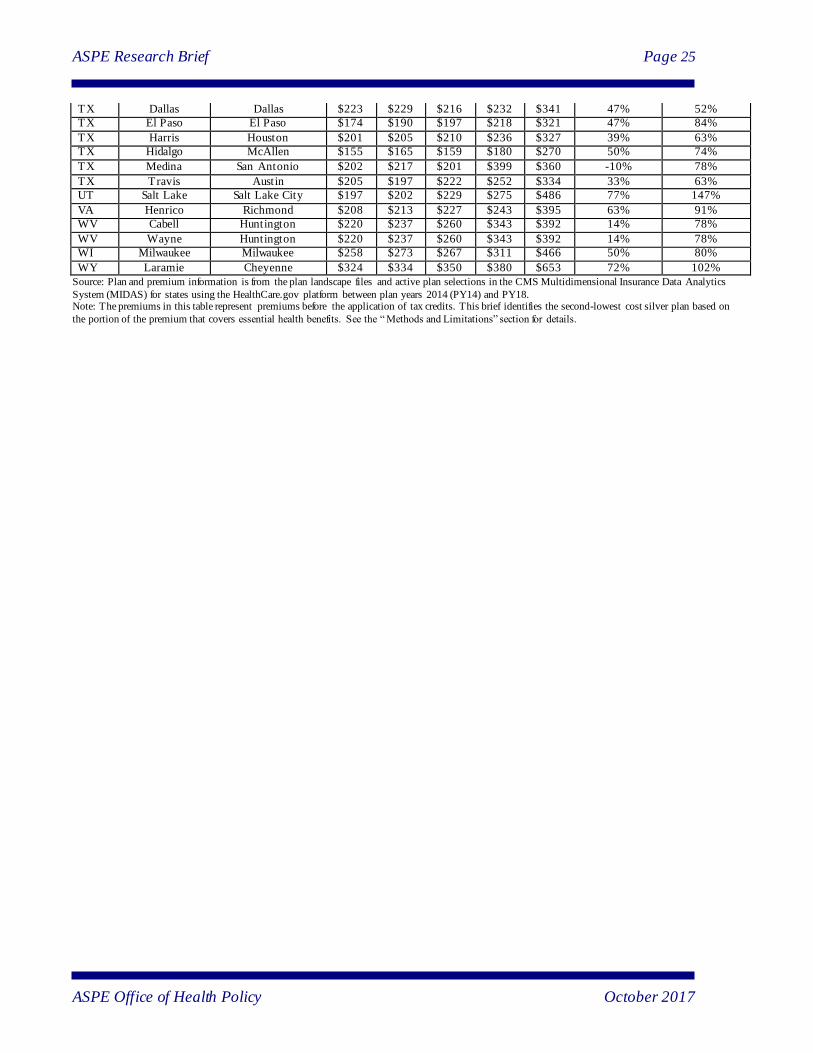
ASPE Research Brief Page 25
ASPE Office of Health Policy October 2017
TX Dallas Dallas $223 $229 $216 $232 $341 47% 52%
TX El Paso El Paso $174 $190 $197 $218 $321 47% 84%
TX Harris Houston $201 $205 $210 $236 $327 39% 63%
TX Hidalgo McAllen $155 $165 $159 $180 $270 50% 74%
TX Medina San Antonio $202 $217 $201 $399 $360 -10% 78%
TX Travis Austin $205 $197 $222 $252 $334 33% 63%
UT Salt Lake Salt Lake City $197 $202 $229 $275 $486 77% 147%
VA Henrico Richmond $208 $213 $227 $243 $395 63% 91%
WV Cabell Huntington $220 $237 $260 $343 $392 14% 78%
WV Wayne Huntington $220 $237 $260 $343 $392 14% 78%
WI Milwaukee Milwaukee $258 $273 $267 $311 $466 50% 80%
WY Laramie Cheyenne $324 $334 $350 $380 $653 72% 102%
Source: Plan and premium information is from the plan landscape files and active plan selections in the CMS Multidimensional Insurance Data Analytics
System (MIDAS) for states using the HealthCare.gov platform between plan years 2014 (PY14) and PY18. Note: The premiums in this table represent premiums before the application of tax credits. This brief identifies the second-lowest cost silver plan based on
the portion of the premium that covers essential health benefits. See the “ Methods and Limitations” section for details.

ASPE Research Brief Page 26
ASPE Office of Health Policy October 2017
Table 4A Average Monthly Premium for the Lowest-Cost Plan (LCP) for a 27-Year-Old by State for HealthCare.gov States, PY14–PY18
State
LCP Average Monthly Premium for a 27-Year-O ld
PY14 PY15 PY16 PY17 PY18 Percentage Change
PY17–PY18 PY14–PY18
HealthCare.gov States $164 $174 $196 $248 $291 17% 77% AK $254 $325 $475 $591 $443 -25% 75%
AL $163 $171 $208 $277 $290 5% 78%
AR $181 $188 $202 $225 $243 8% 35%
AZ $140 $131 $156 $356 $325 -9% 133%
DE $203 $196 $223 $298 $388 30% 91%
FL $164 $186 $202 $235 $256 9% 56%
GA $177 $181 $208 $233 $336 44% 90%
HI N/A N/A $163 $200 $275 37% N/A
IA $147 $162 $188 $253 $474 88% 222%
ID $152 N/A N/A N/A N/A N/A N/A
IL $133 $147 $166 $244 $283 16% 113%
IN $208 $215 $194 $216 $251 16% 20%
KS $130 $148 $178 $250 $304 21% 134%
KY N/A N/A N/A $203 $257 26% N/A
LA $177 $186 $205 $266 $301 13% 70%
ME $216 $209 $222 $268 $311 16% 43%
MI $149 $160 $164 $181 $204 13% 37%
MO $160 $177 $206 $251 $319 27% 99%
MS $230 $197 $215 $241 $380 58% 66%
MT $165 $167 $203 $272 $285 5% 72%
NC $188 $199 $254 $367 $381 4% 102%
ND $186 $196 $220 $218 $245 12% 32%
NE $159 $182 $215 $340 $466 37% 193%
NH $186 $156 $166 $181 $321 77% 72%
NJ $230 $229 $236 $245 $269 10% 17%
NM $141 $124 $139 $174 $222 28% 58%
NV N/A $179 $188 $198 $270 37% N/A
OH $175 $174 $178 $195 $235 20% 34%
OK $114 $126 $169 $301 $324 8% 183%
OR N/A $146 $172 $215 $248 15% N/A
PA $159 $160 $174 $267 $300 12% 89%
SC $174 $166 $231 $293 $299 2% 71%
SD $196 $181 $215 $295 $327 11% 67%
TN $119 $127 $174 $287 $337 17% 184%
TX $140 $160 $173 $215 $254 18% 81%
UT $155 $166 $187 $229 $284 24% 84%
VA $157 $166 $184 $220 $327 48% 108%
WI $195 $198 $207 $250 $342 37% 76%
WV $184 $201 $239 $326 $384 18% 108%
WY $288 $306 $332 $349 $476 36% 65%
Source: Plan information is from the plan landscape files and active plan selections in the Centers for Medicare and Medicaid Services (CMS) Multidimensional Insurance Data Analytics System (MIDAS) for states using the HealthCare.gov platform between PY14 and PY18.
Note: PY stands for plan year and is followed by the last two digits of the year of Exchange plan coverage, e.g. PY14 = plan year 2014. The numbers in this table represent premiums before the application of advance premium tax credits. HealthCare.gov average premiums are weighted by the number of
Exchange plan selections in each county. The PY14 through PY17 average premiums are weighted by current year plan selections and PY18 is weighted by PY17 plan selections. This analysis identifies the lowest-cost plan in each county based on the portion of the premium that covers essential health benefits.
Catastrophic plans, which are not available to all consumers, were not considered in these calculations. Estimates include al l states using the HealthCare.gov platform in the specified plan year. See the “ Methods and Limitations” section for details.

ASPE Research Brief Page 27
ASPE Office of Health Policy October 2017
Table 4B Lowest-Cost Plan (LCP) Monthly Premium for a 27-Year-Old in Selected Count ies in HealthCare.gov States, PY14–PY18
State County City in County
LCP Monthly Premium for a 27-Year-O ld
PY14 PY15 PY16 PY17 PY18 Percent Change
PY17–PY18 PY14–PY18
AL Jefferson Birmingham $170 $179 $200 $291 $305 5% 79%
AK Anchorage Anchorage $254 $325 $475 $576 $432 -25% 70%
AK Juneau Juneau $254 $325 $475 $591 $442 -25% 74%
AZ Maricopa Phoenix $139 $126 $132 $365 $332 -9% 139%
AZ Pima Tucson $119 $124 $148 $286 $235 -18% 97%
AR Pulaski Little Rock $190 $197 $209 $234 $253 8% 33%
DE New Castle Wilmington $203 $196 $223 $298 $388 30% 91%
FL Broward Ft. Lauderdale $128 $151 $178 $225 $234 4% 83%
FL Duval Jacksonville $137 $170 $203 $217 $267 23% 94%
FL Hillsborough Tampa $167 $192 $190 $235 $265 13% 58%
FL Miami-Dade Miami $163 $193 $199 $227 $243 7% 50%
FL Orange Orlando $182 $200 $220 $251 $258 3% 42%
FL Palm Beach West Palm Beach $147 $163 $193 $222 $250 13% 70%
GA Fulton Atlanta $166 $180 $198 $199 $305 53% 84%
HI Honolulu Honolulu N/A N/A $163 $200 $275 37% N/A
IL Cook Chicago $125 $139 $134 $221 $250 13% 100%
IN Marion Indianapolis $223 $222 $199 $235 $265 13% 19%
IA Linn Cedar Rapids $132 $150 $173 $198 $467 136% 253%
KS Sedgwick Wichita $121 $142 $175 $258 $282 9% 133%
KS Wyandotte Kansas City $127 $149 $180 $227 $339 49% 167%
KY Fayette Lexington N/A N/A N/A $180 $228 26% N/A
KY Jefferson Louisville N/A N/A N/A $165 $231 40% N/A
LA Orleans New Orleans $170 $166 $194 $239 $298 24% 75%
ME Cumberland Portland $192 $179 $200 $242 $276 14% 44%
MI Wayne Detroit $138 $148 $146 $158 $179 14% 30%
MS Jackson Jackson $277 $197 $216 $263 $415 58% 50%
MO Saint Louis St. Louis $147 $163 $186 $198 $231 17% 57%
MT Gallatin Bozeman $163 $168 $201 $283 $296 4% 82%
NE Douglas Omaha $162 $166 $199 $253 $436 72% 170%
NV Clark Las Vegas N/A $165 $174 $177 $239 35% N/A
NH Hillsborough Manchester $186 $154 $165 $181 $321 77% 72%
NJ Essex Newark $230 $229 $237 $249 $264 6% 15%
NM Bernalillo Albuquerque $126 $107 $122 $165 $212 29% 68%
NC Guilford Greensboro $167 $188 $238 $368 $388 5% 132%
NC Mecklenburg Charlotte $183 $200 $250 $387 $403 4% 120%
NC Wake Raleigh-Durham $161 $182 $221 $314 $347 10% 115%
ND Cass Fargo $175 $183 $205 $210 $208 -1% 19%
OH Cuyahoga Cleveland $152 $170 $172 $178 $200 12% 32%
OH Franklin Columbus $196 $160 $184 $200 $237 18% 21%
OH Hamilton Cincinnati $178 $153 $166 $172 $224 30% 25%
OH Montgomery Dayton $192 $166 $167 $184 $226 22% 18%
OK Oklahoma Oklahoma City $105 $121 $159 $286 $309 8% 193%
OK Tulsa Tulsa $123 $123 $163 $299 $324 8% 163%
OR Multnomah Portland N/A $144 $162 $192 $222 16% N/A
PA Allegheny Pittsburgh $119 $124 $137 $169 $199 18% 67%
PA Philadelphia Philadelphia $195 $179 $186 $249 $329 32% 69%
SC Richland Columbia $166 $165 $226 $304 $323 6% 95%
SD Lincoln Sioux Falls $196 $178 $200 $290 $284 -2% 45%
SD Minnehaha Sioux Falls $196 $178 $200 $290 $284 -2% 45%
TN Davidson Nashville $114 $125 $170 $262 $288 10% 153%
TN Shelby Memphis $117 $122 $160 $261 $358 37% 206%
TX Bexar San Antonio $138 $169 $160 $200 $210 5% 52%
TX Comal San Antonio $138 $169 $174 $212 $210 -1% 52%
TX Dallas Dallas $153 $175 $180 $195 $228 17% 49%

ASPE Research Brief Page 28
ASPE Office of Health Policy October 2017
TX El Paso El Paso $119 $139 $156 $199 $219 10% 84%
TX Harris Houston $138 $155 $164 $198 $221 12% 61%
TX Hidalgo McAllen $109 $128 $139 $164 $232 42% 113%
TX Medina San Antonio $138 $159 $174 $287 $321 12% 132%
TX Travis Austin $144 $159 $169 $205 $230 12% 59%
UT Salt Lake Salt Lake City $143 $157 $169 $214 $266 24% 86%
VA Henrico Richmond $139 $142 $168 $202 $269 33% 93%
WV Cabell Huntington $176 $192 $218 $307 $336 10% 91%
WV Wayne Huntington $176 $192 $218 $307 $336 10% 91%
WI Milwaukee Milwaukee $200 $214 $219 $266 $356 34% 78%
WY Laramie Cheyenne $271 $283 $306 $321 $438 36% 62%
Source: Plan and premium information is from the plan landscape files and active plan selections in the CMS Multidimensional Insurance Data Analytics System (MIDAS) for states using the HealthCare.gov platform between plan years 2014 (PY14) and PY18.
Note: The premiums in this table represent premiums before the application of tax credits. This brief identifies the second-lowest cost silver plan based on the portion of the premium that covers essential health benefits. Catastrophic plans, which are not available to all consumers, were not considered in these
calculations. See the “ Methods and Limitations” section for details.

ASPE Research Brief Page 29
ASPE Office of Health Policy October 2017
Table 5A Percentage of HealthCare.gov Enrollees Receiving Subsidies, PY14 -PY17
State Percentage of Plan Selections with APTC Percentage of Plan Selections with CSR
PY14 PY15 PY16 PY17 PY14 PY15 PY16 PY17
HealthCare.gov States 84% 87% 85% 84% 60% 60% 59% 60%
AK 86% 89% 86% 88% 56% 54% 42% 41%
AL 83% 89% 89% 90% 66% 71% 73% 73%
AR 88% 88% 87% 84% 58% 56% 55% 56%
AZ 75% 75% 74% 79% 51% 54% 51% 51%
DE 80% 83% 82% 81% 46% 45% 43% 45%
FL 90% 93% 91% 90% 69% 70% 71% 72%
GA 85% 89% 86% 87% 64% 67% 65% 69%
HI N/A N/A 81% 80% N/A N/A 61% 58%
IA 82% 85% 85% 86% 49% 48% 51% 52%
ID 89% N/A N/A N/A 66% N/A N/A N/A
IL 75% 78% 75% 79% 45% 46% 45% 47%
IN 87% 87% 81% 73% 55% 50% 45% 47%
KS 77% 80% 82% 84% 52% 55% 57% 55%
KY N/A N/A N/A 78% N/A N/A N/A 51%
LA 87% 89% 89% 86% 59% 57% 61% 55%
ME 88% 89% 87% 86% 57% 58% 56% 53%
MI 85% 88% 83% 81% 63% 55% 51% 49%
MO 84% 88% 87% 86% 57% 58% 57% 56%
MS 93% 93% 90% 89% 73% 76% 74% 76%
MT 84% 84% 83% 84% 50% 51% 45% 42%
NC 90% 92% 89% 90% 65% 65% 64% 65%
ND 82% 86% 85% 84% 36% 42% 45% 46%
NE 85% 87% 88% 91% 53% 50% 51% 55%
NH 76% 70% 66% 63% 45% 37% 35% 36%
NJ 82% 83% 80% 78% 52% 51% 50% 51%
NM 77% 74% 68% 71% 50% 47% 44% 46%
NV N/A 89% 87% 83% N/A 55% 58% 55%
OH 83% 84% 80% 75% 48% 44% 44% 45%
OK 77% 79% 84% 89% 59% 59% 60% 61%
OR N/A 77% 71% 73% N/A 47% 39% 39%
PA 79% 80% 76% 80% 61% 57% 51% 55%
SC 86% 88% 89% 88% 64% 63% 71% 70%
SD 88% 86% 88% 90% 62% 63% 60% 58%
TN 77% 82% 85% 85% 62% 62% 58% 57%
TX 82% 85% 84% 83% 59% 59% 57% 61%
UT 84% 88% 86% 86% 56% 60% 63% 60%
VA 80% 83% 82% 82% 55% 55% 56% 59%
WI 89% 89% 84% 81% 60% 58% 54% 51%

ASPE Research Brief Page 30
ASPE Office of Health Policy October 2017
WV 84% 86% 85% 84% 55% 54% 51% 50%
WY 91% 91% 90% 89% 54% 52% 54% 54%
Source: Financial assistance information is from active plan selections in the Centers for Medicare and Medicaid Services (CMS) Multidimensional Insurance Data Analytics System (MIDAS) for states using the HealthCare.gov platform.
Note: PY stands for plan year and is followed by the last two digits of the year of Exchange plan coverage, e.g. PY14 = plan year 2014. Estimates based on plan selections made during the Open Enrollment Period for each specified plan year. See the “ Methods and Limitations” section for more details.

ASPE Research Brief Page 31
ASPE Office of Health Policy October 2017
Table 6A
Benchmark Premiums and Advance Premium Tax Credits (APTCs) for PY17 and PY18 and Percentage Increase in APTC in HealthCare.go v States
State
27 Year-O ld with a Household Income of $25,000 Family of Four with Household Income of $60,000
PY17 PY18 APTC %
Increase
PY17 to
PY18
PY17 PY18 APTC %
Increase
PY17 to
PY18 Benchmark
Before APTC APTC
Benchmark
Before APTC APTC
Benchmark
Before APTC APTC
Benchmark
Before APTC APTC
HealthCare.gov States $300 $158 $411 $273 73% $1,085 $678 $1,485 $1,088 60%
AK $760 $656 $596 $496 -24% $2,751 $2,434 $2,159 $1,849 -24%
AL $384 $243 $458 $320 32% $1,391 $988 $1,657 $1,264 28%
AR $248 $89 $298 $161 81% $896 $431 $1,080 $688 60%
AZ $424 $281 $425 $286 2% $1,534 $1,126 $1,537 $1,141 1%
DE $347 $205 $484 $346 69% $1,257 $851 $1,754 $1,356 59%
FL $272 $130 $382 $245 88% $983 $579 $1,384 $991 71%
GA $270 $128 $398 $259 102% $979 $573 $1,440 $1,041 82%
HI $288 $155 $378 $246 59% $1,042 $634 $1,368 $962 52%
IA $310 $169 $585 $448 165% $1,124 $720 $2,117 $1,725 139%
IL $299 $147 $399 $261 78% $1,082 $641 $1,445 $1,050 64%
IN $228 $86 $286 $141 63% $826 $422 $1,037 $615 46%
KS $308 $167 $425 $287 72% $1,117 $713 $1,537 $1,145 61%
KY $237 $96 $357 $209 118% $858 $455 $1,291 $860 89%
LA $338 $197 $389 $252 28% $1,225 $822 $1,408 $1,016 24%
ME $316 $175 $483 $345 97% $1,144 $741 $1,748 $1,353 83%
MI $228 $86 $313 $176 103% $827 $421 $1,133 $740 76%
MO $305 $163 $434 $297 82% $1,104 $700 $1,571 $1,179 68%
MS $272 $128 $445 $289 125% $986 $573 $1,613 $1,149 101%
MT $381 $240 $430 $293 22% $1,380 $976 $1,558 $1,165 19%
NC $445 $304 $514 $377 24% $1,613 $1,209 $1,861 $1,469 21%
ND $288 $147 $309 $172 17% $1,044 $641 $1,119 $726 13%
NE $416 $274 $629 $492 79% $1,505 $1,102 $2,277 $1,885 71%
NH $219 $77 $389 $252 225% $792 $389 $1,409 $1,017 161%
NJ $286 $144 $339 $201 40% $1,036 $630 $1,227 $833 32%
NM $224 $82 $340 $203 147% $812 $406 $1,231 $838 107%
NV $248 $106 $355 $217 104% $897 $494 $1,284 $891 80%
OH $227 $83 $312 $167 101% $821 $409 $1,130 $709 73%
OK $425 $283 $541 $403 42% $1,538 $1,135 $1,957 $1,564 38%

ASPE Research Brief Page 32
ASPE Office of Health Policy October 2017
OR $286 $144 $343 $202 40% $1,036 $630 $1,240 $834 32%
PA $325 $183 $472 $334 82% $1,177 $773 $1,709 $1,315 70%
SC $318 $175 $428 $289 65% $1,153 $744 $1,548 $1,152 55%
SD $374 $233 $427 $290 24% $1,355 $952 $1,546 $1,154 21%
TN $387 $245 $610 $472 92% $1,401 $997 $2,208 $1,813 82%
TX $262 $120 $356 $219 82% $948 $544 $1,290 $896 65%
UT $294 $149 $522 $379 154% $950 $536 $1,685 $1,276 138%
VA $264 $122 $440 $302 147% $957 $552 $1,592 $1,197 117%
WI $302 $161 $468 $329 105% $1,094 $690 $1,695 $1,296 88%
WV $387 $245 $455 $309 26% $1,402 $997 $1,648 $1,224 23%
WY $413 $272 $710 $572 110% $1,496 $1,093 $2,569 $2,176 99%
Source: Plan information is from the plan landscape files and active plan selections in the CMS Multidimensional Insurance Data Analytics System (MIDAS) for states using the HealthCare.gov. Note: PY stands for plan year and is followed by the last two digits of the year of Exchange plan coverage, e.g. PY14 = plan year 2014. Averages for premiums are weighted by the county’s number
of Exchange PY17 plan selections. In this example, the family of four is one 40-year-old adult, one 38-year-old adult, and two children under the age of 21. All enrollees are assumed to not be tobacco
users. For households eligible for premium tax credits, after-tax-credit benchmark premiums are capped at a given percentage of household income. The maximum percent of income paid toward the
benchmark plan is adjusted annually to be a measure of the difference between premium growth and income growth. If the premium of the benchmark plan falls below the maximum applicable
percentage of income amount for which a household is responsible, then the household does not receive a tax credit and pays f or the full premium for the plan selected. After-tax benchmark premiums
will differ slightly between PY17 and PY18 for identical family compositions and income amounts because of changes in the applicable percentages and the Federal Poverty Level (FPL) Guidelines.
Alaska and Hawaii’s Federal poverty guidelines are higher than those for the continental United States; consequently, t he after tax credit premium is lower for a given amount of income. Our
calculations of premiums after tax credits assume that all members of the family of four making $60,000 would be eligible for premium tax credits. However, in states with higher Medicaid of
Children’s Health Insurance Program (CHIP) thresholds, the children would be eligible for Medicaid/CHIP and not eligible for premium tax credits.

ASPE Research Brief Page 33
ASPE Office of Health Policy October 2017
Table 8A
Percentage of Enrollees by Premium of the Lowest-Cost Plan (LCP) Available in HealthCare.gov States, PY15 - PY18
State
Percentage of Enrollees by Premium of the LCP
PY15 PY16 PY17 PY18
$200 or
less
$201 -
$300
$301 -
$400
$401 or
more
$200 or
less
$201 -
$300
$301 -
$400
$401 or
more
$200 or
less
$201 -
$300
$301 -
$400
$401 or
more
$200 or
less
$201 -
$300
$301 -
$400
$401 or
more
HealthCare.gov
States 38% 28% 17% 17% 29% 31% 16% 24% 16% 28% 17% 39% 6% 25% 21% 48%
AK 12% 0% 37% 51% 0% 13% 0% 87% 0% 0% 15% 85% 0% 0% 16% 84%
AL 36% 30% 15% 19% 15% 43% 13% 29% 9% 19% 29% 43% 8% 14% 31% 46%
AR 23% 33% 15% 28% 19% 34% 14% 33% 16% 35% 13% 36% 9% 33% 15% 44%
AZ 63% 17% 18% 2% 61% 16% 16% 7% 4% 26% 13% 58% 2% 22% 23% 53%
DE 25% 33% 16% 27% 17% 35% 14% 34% 17% 9% 26% 48% 0% 12% 15% 74%
FL 29% 33% 16% 21% 21% 37% 17% 26% 11% 36% 17% 36% 5% 32% 21% 41%
GA 39% 31% 14% 16% 26% 37% 15% 23% 19% 31% 18% 32% 0% 18% 26% 55%
HI N/A N/A N/A N/A N/A N/A N/A N/A 15% 37% 13% 35% 0% 22% 30% 49%
IA 46% 23% 18% 13% 28% 28% 14% 30% 14% 23% 19% 45% 0% 0% 6% 94%
ID 50% 20% 5% 25% N/A N/A N/A N/A N/A N/A N/A N/A N/A N/A N/A N/A
IL 50% 21% 22% 6% 41% 26% 18% 16% 12% 32% 17% 39% 4% 27% 21% 48%
IN 18% 36% 13% 32% 27% 31% 15% 28% 20% 33% 13% 34% 11% 27% 18% 43%
KS 55% 17% 20% 7% 38% 27% 13% 22% 15% 30% 18% 37% 0% 23% 29% 48%
KY N/A N/A N/A N/A N/A N/A N/A N/A N/A N/A N/A N/A 11% 32% 15% 42%
LA 32% 31% 15% 22% 18% 41% 14% 27% 9% 27% 24% 41% 0% 19% 31% 49%
ME 21% 27% 16% 37% 17% 30% 15% 38% 12% 22% 18% 48% 0% 21% 23% 55%
MI 45% 22% 19% 14% 43% 23% 17% 17% 37% 23% 15% 25% 24% 30% 14% 32%
MO 37% 26% 15% 21% 25% 33% 14% 27% 16% 29% 17% 38% 6% 25% 14% 55%
MS 27% 34% 16% 23% 19% 38% 15% 28% 9% 34% 20% 37% 0% 10% 15% 76%
MT 41% 21% 16% 22% 19% 36% 12% 32% 11% 18% 26% 45% 3% 21% 28% 48%
NC 22% 38% 14% 26% 12% 28% 22% 37% 2% 12% 18% 68% 0% 9% 19% 72%
ND 36% 29% 11% 25% 30% 34% 9% 27% 29% 35% 9% 27% 26% 28% 15% 31%
NE 44% 24% 13% 19% 24% 37% 11% 29% 11% 22% 17% 51% 0% 2% 17% 80%
NH 44% 20% 23% 13% 37% 23% 19% 20% 27% 28% 15% 30% 0% 12% 29% 59%
NJ 10% 36% 16% 37% 13% 32% 14% 41% 12% 31% 15% 42% 5% 25% 24% 46%
NM 55% 26% 17% 2% 47% 23% 22% 8% 32% 23% 18% 27% 9% 33% 13% 44%
NV N/A N/A N/A N/A 32% 28% 13% 27% 28% 29% 15% 28% 10% 31% 16% 43%
OH 39% 22% 17% 22% 36% 24% 15% 26% 28% 27% 14% 32% 15% 31% 12% 42%
OK 61% 22% 16% 1% 46% 22% 15% 17% 14% 13% 27% 46% 0% 18% 30% 52%
OR N/A N/A N/A N/A 35% 23% 15% 28% 19% 30% 14% 37% 11% 30% 17% 42%
PA 39% 27% 20% 13% 31% 32% 18% 19% 12% 25% 14% 49% 4% 16% 24% 57%
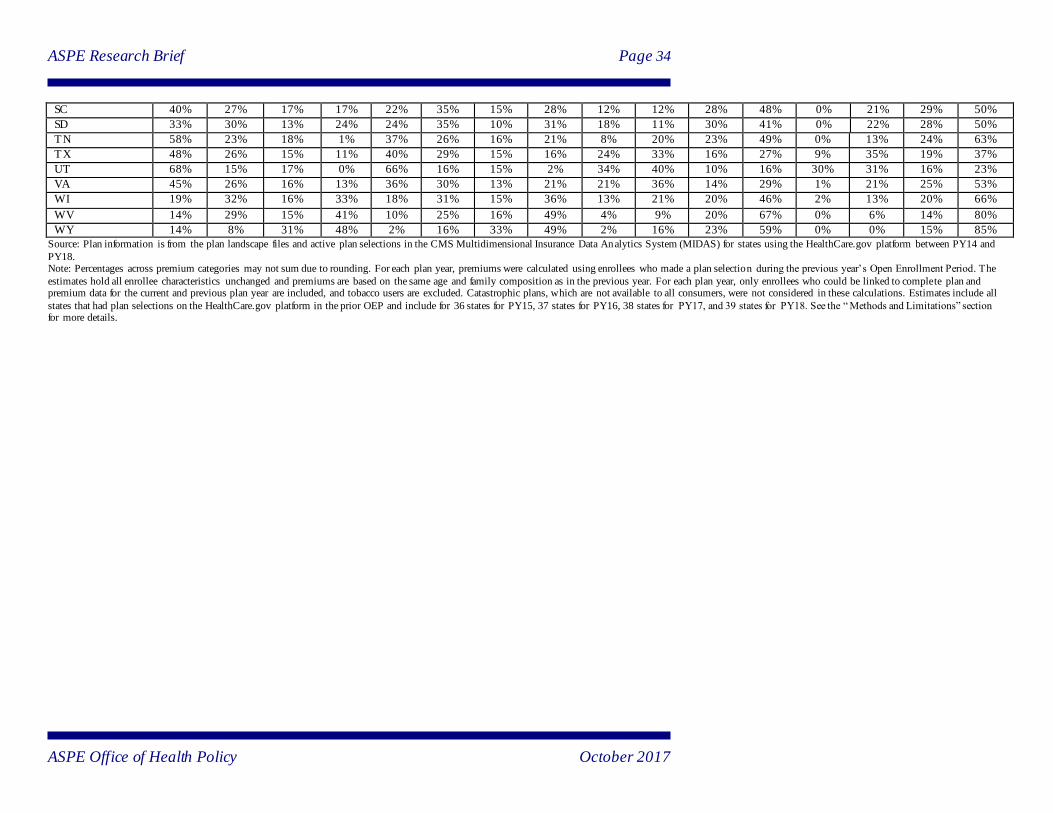
ASPE Research Brief Page 34
ASPE Office of Health Policy October 2017
SC 40% 27% 17% 17% 22% 35% 15% 28% 12% 12% 28% 48% 0% 21% 29% 50%
SD 33% 30% 13% 24% 24% 35% 10% 31% 18% 11% 30% 41% 0% 22% 28% 50%
TN 58% 23% 18% 1% 37% 26% 16% 21% 8% 20% 23% 49% 0% 13% 24% 63%
TX 48% 26% 15% 11% 40% 29% 15% 16% 24% 33% 16% 27% 9% 35% 19% 37%
UT 68% 15% 17% 0% 66% 16% 15% 2% 34% 40% 10% 16% 30% 31% 16% 23%
VA 45% 26% 16% 13% 36% 30% 13% 21% 21% 36% 14% 29% 1% 21% 25% 53%
WI 19% 32% 16% 33% 18% 31% 15% 36% 13% 21% 20% 46% 2% 13% 20% 66%
WV 14% 29% 15% 41% 10% 25% 16% 49% 4% 9% 20% 67% 0% 6% 14% 80%
WY 14% 8% 31% 48% 2% 16% 33% 49% 2% 16% 23% 59% 0% 0% 15% 85%
Source: Plan information is from the plan landscape files and active plan selections in the CMS Multidimensional Insurance Data Analytics System (MIDAS) for states using the HealthCare.gov platform between PY14 and
PY18. Note: Percentages across premium categories may not sum due to rounding. For each plan year, premiums were calculated using enrollees who made a plan selection during the previous year’s Open Enrollment Period. The
estimates hold all enrollee characteristics unchanged and premiums are based on the same age and family composition as in the previous year. For each plan year, only enrollees who could be linked to complete plan and premium data for the current and previous plan year are included, and tobacco users are excluded. Catastrophic plans, which are not available to all consumers, were not considered in these calculations. Estimates include all
states that had plan selections on the HealthCare.gov platform in the prior OEP and include for 36 states for PY15, 37 states for PY16, 38 states for PY17, and 39 states for PY18. See the “ Methods and Limitations” section for more details.

ASPE Research Brief Page 35
ASPE Office of Health Policy October 2017
Table 8B
Percentage of Enrollees by Premium of the Lowest -Cost Plan (LCP) Available Within Metal Level in HealthCare.gov States, PY15 - PY18
State
Percentage of Enrollees by Premium of the LCP Within Metal Level
PY15 PY16 PY17 PY18
$200 or
less
$201 -
$300
$301 -
$400
$401 or
more
$200 or
less
$201 -
$300
$301 -
$400
$401 or
more
$200 or
less
$201 -
$300
$301 -
$400
$401
or
more
$200
or less
$201 -
$300
$301 -
$400
$401
or
more
HealthCare.gov States 21% 31% 18% 30% 18% 31% 18% 33% 11% 24% 18% 47% 2% 12% 20% 66%
AK 4% 6% 19% 71% 0% 6% 7% 88% 0% 0% 8% 92% 0% 0% 9% 91%
AL 16% 39% 15% 31% 9% 40% 16% 35% 1% 9% 22% 68% 1% 9% 7% 83%
AR 12% 33% 16% 39% 13% 30% 16% 41% 13% 32% 14% 41% 3% 25% 23% 49%
AZ 51% 21% 18% 10% 48% 23% 13% 17% 3% 21% 14% 63% 2% 14% 19% 65%
DE 15% 25% 20% 41% 12% 17% 22% 49% 3% 16% 20% 60% 0% 3% 13% 84%
FL 15% 33% 19% 33% 12% 36% 18% 34% 10% 28% 20% 42% 1% 10% 22% 67%
GA 18% 36% 18% 27% 17% 34% 19% 30% 12% 31% 20% 37% 0% 9% 24% 67%
HI N/A N/A N/A N/A N/A N/A N/A N/A 9% 18% 26% 48% 0% 8% 20% 72%
IA 31% 29% 15% 25% 18% 28% 16% 38% 8% 22% 16% 53% 0% 0% 3% 97%
ID 40% 25% 5% 30% N/A N/A N/A N/A N/A N/A N/A N/A N/A N/A N/A N/A
IL 32% 28% 17% 22% 30% 27% 17% 26% 9% 26% 18% 46% 1% 11% 25% 63%
IN 13% 25% 20% 41% 19% 33% 15% 34% 18% 31% 14% 37% 6% 25% 21% 48%
KS 38% 26% 16% 20% 24% 33% 12% 31% 14% 16% 26% 44% 0% 10% 19% 70%
KY N/A N/A N/A N/A N/A N/A N/A N/A N/A N/A N/A N/A 3% 20% 22% 55%
LA 12% 32% 20% 36% 11% 30% 22% 38% 6% 12% 28% 54% 0% 9% 27% 64%
ME 13% 23% 17% 47% 14% 24% 18% 44% 10% 15% 20% 55% 0% 9% 13% 78%
MI 25% 31% 15% 29% 28% 28% 16% 28% 24% 27% 15% 34% 10% 26% 19% 44%
MO 21% 33% 15% 32% 17% 31% 18% 35% 12% 22% 20% 47% 2% 12% 17% 68%
MS 10% 35% 18% 37% 12% 37% 16% 34% 8% 25% 24% 43% 0% 9% 12% 79%
MT 24% 30% 16% 30% 11% 26% 21% 42% 7% 10% 25% 57% 2% 11% 18% 69%
NC 12% 29% 21% 37% 11% 13% 29% 47% 1% 12% 8% 80% 0% 2% 11% 87%
ND 27% 24% 16% 33% 29% 20% 18% 33% 22% 24% 18% 35% 12% 31% 17% 40%
NE 25% 34% 13% 27% 21% 29% 17% 34% 7% 18% 16% 59% 0% 1% 7% 92%
NH 24% 28% 20% 28% 19% 30% 18% 32% 17% 30% 16% 38% 0% 8% 20% 73%
NJ 8% 22% 22% 47% 9% 21% 22% 48% 10% 16% 23% 51% 1% 12% 29% 58%
NM 40% 25% 21% 14% 37% 24% 20% 19% 20% 28% 15% 37% 3% 16% 22% 60%
NV N/A N/A N/A N/A 20% 31% 15% 34% 19% 28% 16% 37% 3% 23% 23% 51%
OH 22% 29% 15% 33% 25% 27% 15% 34% 23% 26% 14% 36% 8% 23% 19% 50%

ASPE Research Brief Page 36
ASPE Office of Health Policy October 2017
OK 43% 26% 15% 16% 23% 29% 16% 31% 5% 13% 15% 67% 0% 8% 20% 72%
OR N/A N/A N/A N/A 20% 30% 13% 37% 12% 25% 16% 47% 9% 15% 22% 54%
PA 20% 35% 17% 28% 17% 35% 16% 32% 9% 15% 18% 58% 0% 8% 16% 76%
SC 18% 35% 16% 31% 13% 30% 19% 39% 9% 8% 29% 54% 0% 5% 14% 81%
SD 18% 35% 14% 33% 17% 30% 16% 37% 3% 17% 24% 56% 0% 10% 22% 68%
TN 31% 30% 17% 23% 16% 35% 15% 34% 6% 10% 23% 61% 0% 5% 11% 85%
TX 28% 34% 16% 22% 26% 33% 16% 25% 17% 31% 18% 34% 2% 19% 26% 53%
UT 48% 28% 12% 12% 38% 37% 11% 13% 23% 37% 14% 27% 8% 22% 12% 57%
VA 22% 35% 17% 27% 20% 34% 16% 30% 16% 29% 19% 36% 0% 10% 19% 71%
WI 12% 29% 17% 43% 12% 27% 17% 44% 9% 16% 22% 53% 0% 5% 13% 82%
WV 9% 23% 18% 51% 8% 12% 21% 59% 2% 8% 14% 76% 0% 3% 10% 88%
WY 5% 11% 22% 62% 1% 17% 21% 61% 0% 16% 11% 72% 0% 0% 4% 96%
Source: Plan information is from the plan landscape files and active plan selections in the CMS Multidimensional Insurance Data Analytics System (MIDAS) for states using the HealthCare.gov platform between PY14 and
PY18. Note: Percentages across premium categories may not sum due to rounding. For each plan year, premiums were calculated using enrollees who made a plan selection during the previous year’s Open Enrollment Period. The
estimates hold all enrollee characteristics unchanged and premiums are based on the same age and family composition as in the previous year. For each plan year, only enrollees who could be linked to complete plan and premium data for the current and previous plan year are included, and tobacco users are excluded. Catastrophic plans, which are not available to all consumers, were not considered in these calculations. Estimates include all
states that had plan selections on the HealthCare.gov platform in the prior OEP and include for 36 states for PY15, 37 states for PY16, 38 states for PY17, and 39 states for PY18. See the “ Methods and Limitations” section for more details.

ASPE Research Brief Page 37
ASPE Office of Health Policy October 2017
Table 9A
Percentage of Enrollees by Portion of the Lowest -Cost Plan (LCP) Paid by Enrollee Available in HealthCare.gov States, PY15 - PY18
State
Percentage of Enrollees by Portion of the LCP Paid by Enrollee
PY15 PY16 PY17 PY18
$75 or less
$76 - $150
$151 - $200
$201 or more
$75 or less
$76 - $150
$151 - $200
$201 or more
$75 or less
$76 - $150
$151 - $200
$201 or more
$75 or less
$76 - $150
$151 - $200
$201 or more
HealthCare.gov
States 72% 13% 6% 8% 72% 13% 6% 9% 71% 13% 5% 12% 80% 6% 3% 11%
AK 78% 6% 4% 12% 70% 11% 4% 15% 79% 6% 2% 13% 68% 13% 4% 15%
AL 72% 11% 8% 9% 76% 11% 4% 9% 89% 3% 2% 6% 92% 2% 1% 5%
AR 70% 15% 5% 10% 66% 18% 5% 11% 52% 25% 8% 14% 67% 16% 5% 13%
AZ 59% 26% 7% 8% 57% 23% 10% 10% 66% 10% 4% 20% 65% 12% 4% 20%
DE 61% 19% 6% 15% 66% 16% 4% 15% 55% 18% 9% 18% 66% 13% 3% 18%
FL 81% 9% 4% 7% 80% 10% 3% 7% 80% 10% 3% 7% 90% 2% 1% 6%
GA 76% 11% 6% 7% 77% 11% 4% 8% 76% 12% 4% 8% 78% 9% 2% 11%
HI N/A N/A N/A N/A N/A N/A N/A N/A 71% 12% 4% 13% 69% 9% 3% 18%
IA 61% 22% 8% 8% 66% 17% 8% 9% 65% 17% 7% 12% 78% 8% 2% 12%
ID 70% 25% 5% 0% N/A N/A N/A N/A N/A N/A N/A N/A N/A N/A N/A N/A
IL 57% 22% 12% 9% 54% 23% 10% 12% 53% 20% 7% 21% 73% 7% 3% 16%
IN 71% 14% 4% 11% 64% 17% 7% 12% 48% 24% 9% 19% 40% 22% 11% 27%
KS 63% 19% 10% 8% 62% 17% 9% 12% 69% 13% 5% 14% 81% 6% 1% 12%
KY N/A N/A N/A N/A N/A N/A N/A N/A N/A N/A N/A N/A 68% 9% 6% 17%
LA 80% 8% 5% 7% 82% 8% 3% 8% 81% 8% 3% 8% 74% 10% 3% 13%
ME 71% 14% 5% 10% 65% 17% 6% 12% 60% 18% 7% 14% 87% 2% 0% 10%
MI 74% 13% 7% 6% 69% 17% 7% 7% 65% 18% 8% 9% 80% 7% 4% 9%
MO 74% 11% 7% 8% 75% 11% 5% 9% 73% 12% 4% 10% 80% 6% 3% 11%
MS 85% 7% 3% 5% 82% 9% 3% 6% 81% 10% 3% 7% 82% 7% 2% 9%
MT 57% 20% 12% 10% 71% 13% 3% 12% 77% 8% 4% 11% 79% 6% 2% 12%
NC 81% 9% 3% 7% 81% 9% 3% 7% 82% 7% 2% 8% 87% 5% 1% 7%
ND 61% 21% 6% 12% 61% 21% 5% 12% 71% 16% 4% 9% 59% 21% 8% 12%
NE 72% 13% 7% 8% 69% 16% 4% 11% 77% 10% 4% 9% 88% 5% 1% 7%
NH 57% 18% 11% 14% 53% 18% 11% 18% 42% 22% 11% 25% 51% 13% 4% 32%
NJ 53% 21% 7% 20% 53% 21% 7% 20% 54% 18% 9% 19% 61% 13% 6% 19%
NM 59% 26% 8% 7% 64% 19% 8% 8% 56% 18% 10% 16% 72% 5% 5% 18%
NV N/A N/A N/A N/A 69% 17% 6% 8% 70% 15% 5% 9% 77% 9% 3% 11%
OH 64% 17% 9% 10% 57% 21% 10% 12% 51% 24% 9% 16% 62% 13% 7% 19%
OK 74% 16% 5% 6% 76% 8% 9% 8% 84% 3% 3% 10% 91% 1% 0% 8%
OR N/A N/A N/A N/A 58% 18% 11% 13% 56% 17% 7% 20% 60% 15% 5% 20%
PA 63% 17% 9% 11% 62% 16% 8% 13% 59% 14% 7% 19% 80% 4% 2% 15%
SC 78% 9% 6% 7% 77% 11% 4% 8% 68% 14% 7% 11% 88% 3% 1% 8%

ASPE Research Brief Page 38
ASPE Office of Health Policy October 2017
SD 66% 18% 7% 9% 70% 15% 4% 10% 79% 10% 4% 8% 76% 13% 3% 8%
TN 74% 15% 5% 6% 70% 12% 9% 10% 81% 6% 3% 11% 88% 1% 0% 11%
TX 73% 12% 8% 7% 73% 12% 6% 8% 73% 12% 4% 10% 81% 5% 3% 11%
UT 71% 17% 8% 4% 77% 13% 6% 4% 76% 14% 3% 8% 89% 1% 3% 7%
VA 74% 10% 8% 8% 70% 13% 7% 10% 67% 15% 4% 13% 80% 5% 1% 14%
WI 71% 14% 5% 9% 69% 15% 5% 10% 63% 15% 7% 15% 77% 6% 2% 15%
WV 62% 17% 6% 15% 60% 18% 6% 16% 63% 15% 6% 16% 59% 16% 6% 19%
WY 68% 16% 5% 11% 60% 19% 6% 15% 68% 15% 5% 12% 90% 1% 0% 8%
Source: Plan information is from the plan landscape files and active plan selections in the CMS Multidimensional Insurance Data Analytics System (MIDAS) for states using the HealthCare.gov platform between PY14 and
PY18. Note: Percentages across premium categories may not sum due to rounding. For each plan year, premiums after subsidy were calculated using enrollees who made a plan selection during the previous year’s Open Enrollment
Period. This analysis holds all enrollee characteristics unchanged and calculates premiums and tax credits based on the same age, family composition, and household income as in the previous year. For each plan year, this analysis includes only enrollees who could be linked to complete plan and premium data for the current and previous plan year, and excludes tobacco users. Catastrophic plans, which are not available to al l consumers, were
not considered in these calculations. Estimates include all states that had plan selections on the HealthCare.gov platform in the prior OEP and include for 36 states for PY15, 37 states for PY16, 38 states for PY17, and 39 states for PY18. See the “ Methods and Limitations” section for more details.

ASPE Research Brief Page 39
ASPE Office of Health Policy October 2017
Table 9B
Percentage of Current Enrollees by Portion of the Lowest-cost Plan Paid by Enrollee Available Within Metal Level in HealthCare.gov States, PY15 - PY18
State
Percentage of Current Enrollees by Portion of the Lowest-cost Plan Paid by Enrollee Within Metal Level
PY15 PY16 PY17 PY18
$75 or less
$76 - $150
$151 - $200
$201 or more
$75 or less
$76 - $150
$151 - $200
$201 or more
$75 or less
$76 - $150
$151 - $200
$201 or more
$75 or less
$76 - $150
$151 - $200
$201 or more
HealthCare.gov
States 56% 20% 8% 16% 57% 20% 7% 15% 58% 18% 6% 17% 60% 18% 6% 17%
AK 64% 12% 5% 19% 52% 18% 7% 23% 59% 16% 5% 21% 48% 21% 8% 23%
AL 55% 19% 8% 18% 64% 18% 5% 13% 73% 11% 4% 12% 72% 13% 5% 11%
AR 44% 28% 9% 19% 41% 30% 9% 20% 36% 32% 10% 22% 49% 26% 8% 17%
AZ 47% 25% 9% 19% 45% 25% 10% 19% 53% 16% 5% 26% 43% 23% 8% 26%
DE 32% 27% 10% 31% 32% 26% 10% 32% 34% 25% 10% 31% 39% 24% 8% 28%
FL 67% 15% 6% 13% 69% 15% 5% 12% 72% 13% 4% 11% 72% 14% 3% 10%
GA 59% 17% 7% 17% 65% 17% 6% 12% 68% 15% 5% 12% 66% 17% 4% 13%
HI N/A N/A N/A N/A N/A N/A N/A N/A 47% 19% 9% 25% 40% 21% 9% 30%
IA 43% 29% 12% 17% 48% 24% 10% 18% 44% 27% 10% 19% 38% 28% 10% 24%
ID 65% 20% 5% 10% N/A N/A N/A N/A N/A N/A N/A N/A N/A N/A N/A N/A
IL 40% 28% 12% 20% 36% 30% 12% 22% 37% 26% 9% 28% 49% 20% 7% 24%
IN 53% 22% 7% 17% 52% 23% 8% 17% 41% 27% 10% 22% 27% 28% 12% 33%
KS 51% 22% 10% 17% 49% 22% 8% 21% 52% 21% 8% 20% 54% 21% 6% 18%
KY N/A N/A N/A N/A N/A N/A N/A N/A N/A N/A N/A N/A 34% 28% 10% 28%
LA 63% 15% 7% 14% 67% 15% 5% 13% 66% 14% 5% 14% 57% 19% 6% 18%
ME 52% 21% 8% 19% 48% 25% 8% 19% 38% 27% 11% 24% 59% 18% 6% 17%
MI 55% 22% 8% 15% 51% 25% 9% 15% 45% 28% 10% 17% 56% 20% 7% 16%
MO 59% 18% 8% 15% 62% 17% 6% 14% 59% 19% 7% 16% 66% 14% 5% 15%
MS 66% 17% 6% 12% 72% 14% 4% 10% 71% 15% 4% 9% 79% 9% 2% 9%
MT 45% 24% 11% 21% 52% 20% 6% 21% 63% 14% 6% 17% 58% 17% 6% 18%
NC 63% 18% 6% 13% 65% 17% 6% 12% 65% 16% 5% 14% 60% 19% 7% 13%
ND 32% 31% 12% 25% 35% 29% 11% 25% 45% 24% 9% 22% 31% 31% 12% 26%
NE 57% 22% 8% 14% 54% 24% 8% 15% 62% 19% 6% 13% 65% 17% 6% 12%
NH 43% 20% 11% 26% 38% 23% 11% 29% 28% 27% 11% 34% 34% 20% 7% 39%
NJ 35% 24% 10% 31% 35% 24% 10% 31% 38% 22% 10% 30% 36% 24% 9% 31%
NM 38% 33% 13% 16% 57% 19% 10% 14% 42% 24% 10% 24% 41% 22% 9% 29%
NV N/A N/A N/A N/A 49% 27% 9% 15% 49% 27% 8% 16% 54% 23% 6% 17%
OH 42% 27% 10% 21% 39% 30% 11% 21% 41% 28% 11% 21% 37% 27% 9% 27%
OK 60% 20% 8% 13% 59% 18% 8% 15% 63% 15% 5% 17% 84% 6% 2% 9%
OR N/A N/A N/A N/A 38% 26% 12% 24% 33% 25% 11% 31% 34% 24% 11% 31%
PA 47% 21% 9% 23% 46% 22% 9% 23% 44% 19% 8% 29% 55% 16% 6% 23%
SC 62% 18% 7% 14% 58% 20% 6% 16% 55% 21% 7% 16% 51% 25% 7% 17%

ASPE Research Brief Page 40
ASPE Office of Health Policy October 2017
SD 48% 24% 8% 19% 51% 23% 8% 18% 58% 20% 7% 15% 50% 26% 9% 15%
TN 56% 20% 8% 16% 49% 24% 9% 18% 68% 13% 5% 15% 80% 5% 1% 13%
TX 59% 20% 8% 14% 61% 19% 7% 13% 64% 17% 6% 14% 63% 17% 5% 16%
UT 53% 27% 8% 12% 63% 21% 6% 10% 51% 25% 7% 16% 67% 16% 5% 12%
VA 56% 19% 8% 17% 54% 21% 8% 17% 56% 20% 6% 18% 60% 18% 4% 18%
WI 56% 20% 8% 17% 54% 21% 8% 17% 47% 21% 9% 22% 56% 16% 6% 21%
WV 41% 23% 9% 26% 27% 30% 11% 31% 43% 21% 9% 27% 34% 26% 10% 31%
WY 47% 24% 9% 21% 46% 25% 9% 20% 48% 24% 8% 19% 51% 23% 8% 18%
Source: Plan information is from the plan landscape files and active plan selections in the CMS Multidimensional Insurance Data Analytics System (MIDAS) for states using the HealthCare.gov platform between PY14 and
PY18. Note: Percentages across premium categories may not sum due to rounding. For each plan year, premiums after subsidy were calculated using enrollees who made a plan selection during the previous year’s Open Enrollment
Period. This analysis holds all enrollee characteristics unchanged and calculates premiums and tax credits based on the same age, family composition, and household income as in the previous year. For each plan year, this analysis includes only enrollees who could be linked to complete plan and premium data for the current and previous plan year, and excludes tobacco users. Catastrophic plans, which are not available to all consumers, were
not considered in these calculations. Estimates include all states that had plan selections on the HealthCare.gov platform in the prior OEP and include for 36 states for PY15, 37 states for PY16, 38 states for PY17, and 39 states for PY18. See the “ Methods and Limitations” section for more details.