Embed Size (px)
Citation preview

1
HEALTH PRIORITIES REGION 3
EVELYN B. YUMIACO, MD Angeles University Foundation
2
Table of Contents
I. Executive Summary 3
II. Regional Profile 4
A. Population Size 5
B. Age and Sex Distribution 5
C. Health Indicators 5
D. Health Concerns 9
E. Health Facilities 12
F. Health Care Financing 18
G. Providers of Health Products 18
H. Academic Institution 19
III. Methodology 21
IV. Research Priorities 24
V. References 25
VI. Annexes 26
A. Demographic Characteristics
B. Summary of Regional Consultation
C. Questionnaire on Provincial/City Survey
D. Questionnaire on Hospital Survey
E. Questionnaire on University Survey
F. Key Informants
G. Group Output during the Workshop
3
EXECUTIVE SUMMARY Introduction
Region III also known as Central Luzon is composed of seven provinces, namely: Aurora, Bataan, Nueva Ecija, Pampanga, Tarlac and Zambales. There are twelve cities, namely: Angeles, Balanga, Olongapo, Cabanatuan, Gapan, Palayan, San Jose, San Fernando, San Jose Del Monte, Munoz, Malolos and Tarlac. It has 118 municipalities, 21 congressional district and 3,102 barangays.
According to the 2000 census, Central Luzon has an estimated population of 8,200,151, males slightly outnumbering the females with 58.34% of the population belonging to the 0-24 year old age bracket. The poverty incidence is 20.9% which is the lowest among the regions excluding the NCR. Among the provinces, Nueva Ecija has the highest number of poor families at 31% followed by Tarlac, Pampanga, Zambales and Bulacan at 24%, 18%, 12% and 7% respectively. Bataan and Aurora has the least number of poor families at 4%.
There was a decreased in the crude birth rate, infant mortality rate and maternal death from 1998 to 2004. However, the health conditions in the provinces differ with Zambales having the highest infant mortality rate (18.63/1000) and Angeles City the lowest (2.37/1000).
The leading causes of morbidity have not changed much since 1998 to 2004. The
rate of acute respiratory tract infection, diarrhea and bronchitis decreased from 1998 to 2003 but they still maintained their position as the top three leading cause of morbidity. The rate of Influenza, Parasitism and TB at number 7, 8 and 10 respectively also went down in 2003. Other disease conditions in the top ten whose rate increased from 1998 to 2003 were pneumonia, hypertension, and skin disease at number 4, 5 and 6, respectively and urinary tract infection at number 9.
From 1998 to 2004 the top five leading causes of mortality were still the same, namely: heart disease, cancer, pneumonia, cardiovascular disease and TB. COPD went up to number 6 followed by diabetes, hypertension, kidney disease and accidents.
Region 3 has a total of 208 hospitals of which 71 were controlled by the government. It has three retained hospitals (PJGM, JRMC, JBLMRH), one mental ward (Mariveles mental ward), one extension (Talavera Extension Hospital), 5 provincial hospitals (Bulacan, Nueva Ecija,Pampanga, Tarlac and Zambales), 26 district hospitals, 250 rural health units, 1356 Barangay Health Stations, and 33 birthing stations (DOH Annual report 2001). There were 137 privately-owned hospitals, 29% are primary, 56% are secondary and 12% are tertiary hospitals (DOH 2002) . The hospital bed population ratio is 1 bed per 1,197 population (DOH 2000).
Philhealth has a total membership of 6,312,770 with an estimated coverage of 45% among the indigent population. Bulacan and Pampanga has the highest population coverage by Philhealth and 86% of government and privately owned hospitals were accredited by Philhealth . Methodology
The health situation in Region 3 was evaluated from September to October 2005, Documents from government agencies were reviewed followed by a survey conducted among provincial and city health officers to identify health priorities. Consultations with the health officers, directors and representatives of agencies were also done to elaborate on the health priorities identified in the survey. Two other surveys were conducted among Hospitals
4
and universities. The hospital survey aimed to identify the top ten causes of mortality and morbidity in the different hospitals, problems encountered, services offered, equipments available and research capability of the institution. The survey among universities was also aimed to identify the research capability of the institutions. All problems identified in the surveys and consultations were collated and classified according to the broad research and development area. This was presented for validation and ranking through a regional consultation and prioritization workshop done in November 8, 2005 attended by 32 participants from Government, Non government organizations and the academe. Research Priority Areas
The top 10 priority areas identified were: 1. TB, 2. Dengue, 3. Healthy Lifestyle (nutritional practice), 4. Research and Research Ethics, 5. Degenerative Diseases (malignancy), 6. Environmental Health Risk and Occupational Health, 7. Health Information System, 8. Mental Health, Behavioral Diseases and Autism, 9. Health Care Delivery, and 10. Family planning Regional Profile
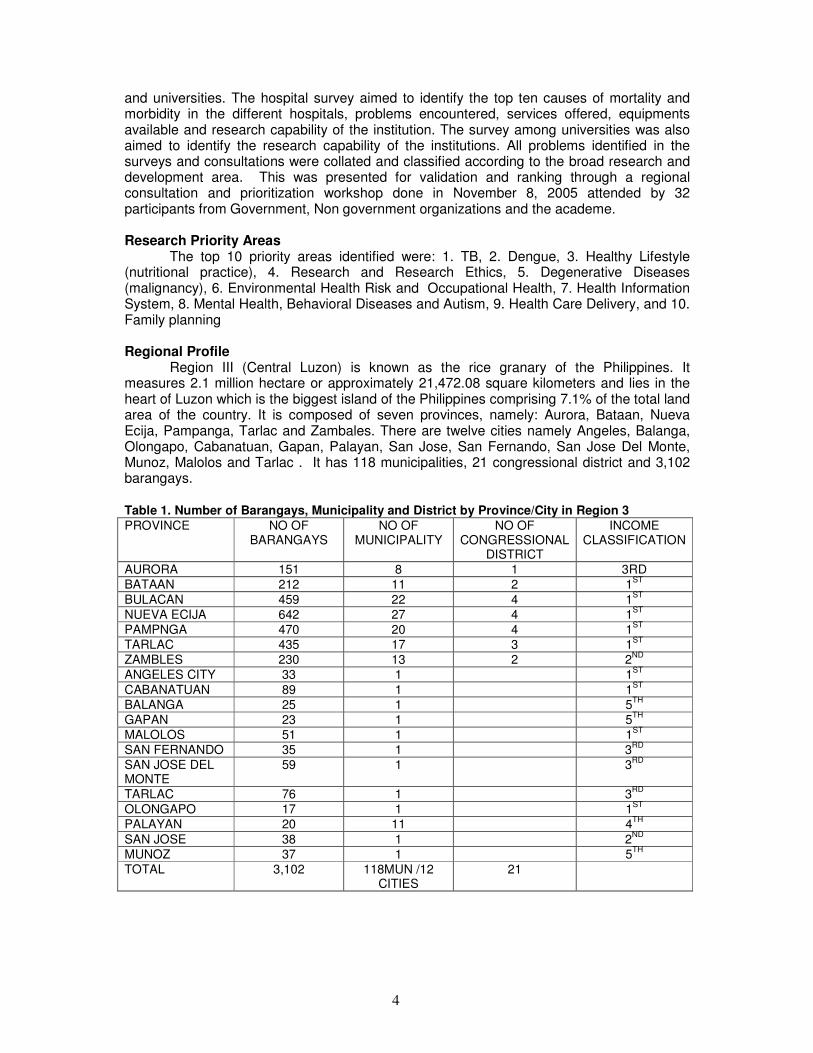
Region III (Central Luzon) is known as the rice granary of the Philippines. It measures 2.1 million hectare or approximately 21,472.08 square kilometers and lies in the heart of Luzon which is the biggest island of the Philippines comprising 7.1% of the total land area of the country. It is composed of seven provinces, namely: Aurora, Bataan, Nueva Ecija, Pampanga, Tarlac and Zambales. There are twelve cities namely Angeles, Balanga, Olongapo, Cabanatuan, Gapan, Palayan, San Jose, San Fernando, San Jose Del Monte, Munoz, Malolos and Tarlac . It has 118 municipalities, 21 congressional district and 3,102 barangays.
Table 1. Number of Barangays, Municipality and District by Province/City in Region 3 PROVINCE NO OF
BARANGAYS NO OF
MUNICIPALITY NO OF
CONGRESSIONAL DISTRICT
INCOME CLASSIFICATION
AURORA 151 8 1 3RD
BATAAN 212 11 2 1ST
BULACAN 459 22 4 1ST
NUEVA ECIJA 642 27 4 1ST
PAMPNGA 470 20 4 1ST
TARLAC 435 17 3 1ST
ZAMBLES 230 13 2 2ND
ANGELES CITY 33 1 1ST
CABANATUAN 89 1 1ST
BALANGA 25 1 5TH
GAPAN 23 1 5TH
MALOLOS 51 1 1ST
SAN FERNANDO 35 1 3RD
SAN JOSE DEL MONTE
59 1 3RD
TARLAC 76 1 3RD
OLONGAPO 17 1 1ST
PALAYAN 20 11 4TH
SAN JOSE 38 1 2ND
MUNOZ 37 1 5TH
TOTAL
3,102
118MUN /12 CITIES
21
5
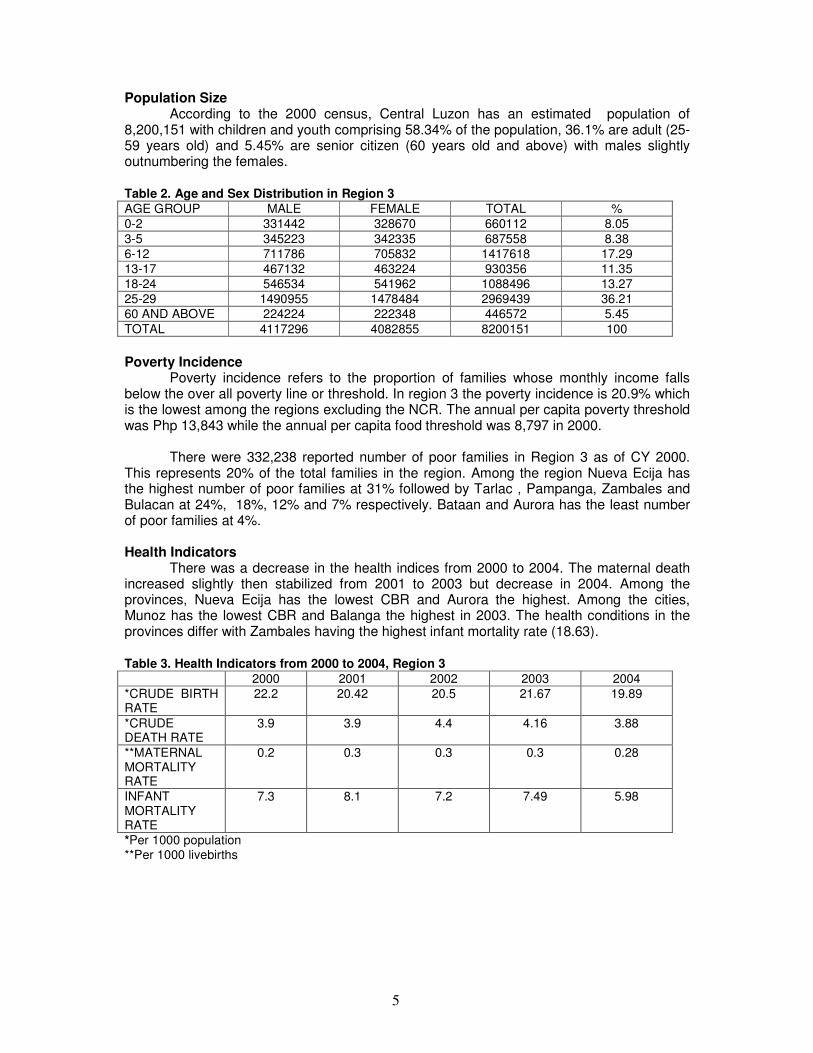
Population Size According to the 2000 census, Central Luzon has an estimated population of
8,200,151 with children and youth comprising 58.34% of the population, 36.1% are adult (25-59 years old) and 5.45% are senior citizen (60 years old and above) with males slightly outnumbering the females.
Table 2. Age and Sex Distribution in Region 3 AGE GROUP MALE FEMALE TOTAL %
0-2 331442 328670 660112 8.05
3-5 345223 342335 687558 8.38
6-12 711786 705832 1417618 17.29
13-17 467132 463224 930356 11.35
18-24 546534 541962 1088496 13.27
25-29 1490955 1478484 2969439 36.21
60 AND ABOVE 224224 222348 446572 5.45
TOTAL 4117296 4082855 8200151 100
Poverty Incidence
Poverty incidence refers to the proportion of families whose monthly income falls below the over all poverty line or threshold. In region 3 the poverty incidence is 20.9% which is the lowest among the regions excluding the NCR. The annual per capita poverty threshold was Php 13,843 while the annual per capita food threshold was 8,797 in 2000.
There were 332,238 reported number of poor families in Region 3 as of CY 2000. This represents 20% of the total families in the region. Among the region Nueva Ecija has the highest number of poor families at 31% followed by Tarlac , Pampanga, Zambales and Bulacan at 24%, 18%, 12% and 7% respectively. Bataan and Aurora has the least number of poor families at 4%. Health Indicators
There was a decrease in the health indices from 2000 to 2004. The maternal death increased slightly then stabilized from 2001 to 2003 but decrease in 2004. Among the provinces, Nueva Ecija has the lowest CBR and Aurora the highest. Among the cities, Munoz has the lowest CBR and Balanga the highest in 2003. The health conditions in the provinces differ with Zambales having the highest infant mortality rate (18.63).
Table 3. Health Indicators from 2000 to 2004, Region 3 2000 2001 2002 2003 2004
*CRUDE BIRTH RATE
22.2 20.42 20.5 21.67 19.89
*CRUDE DEATH RATE
3.9 3.9 4.4 4.16 3.88
**MATERNAL MORTALITY RATE
0.2 0.3 0.3 0.3 0.28
INFANT MORTALITY RATE
7.3 8.1 7.2 7.49 5.98
*Per 1000 population **Per 1000 livebirths
6
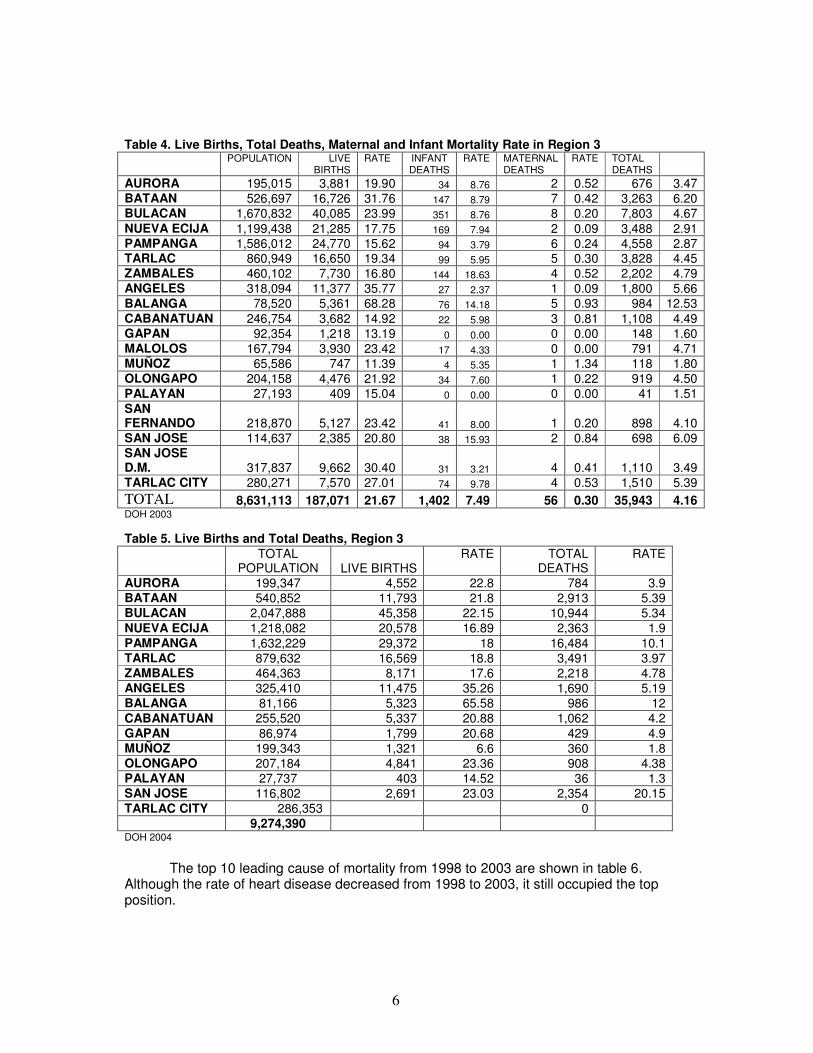
Table 4. Live Births, Total Deaths, Maternal and Infant Mortality Rate in Region 3
POPULATION LIVE
BIRTHS RATE INFANT
DEATHS RATE MATERNAL
DEATHS RATE TOTAL
DEATHS
AURORA 195,015 3,881 19.90 34 8.76 2 0.52 676 3.47 BATAAN 526,697 16,726 31.76 147 8.79 7 0.42 3,263 6.20 BULACAN 1,670,832 40,085 23.99 351 8.76 8 0.20 7,803 4.67
NUEVA ECIJA 1,199,438 21,285 17.75 169 7.94 2 0.09 3,488 2.91 PAMPANGA 1,586,012 24,770 15.62 94 3.79 6 0.24 4,558 2.87 TARLAC 860,949 16,650 19.34 99 5.95 5 0.30 3,828 4.45 ZAMBALES 460,102 7,730 16.80 144 18.63 4 0.52 2,202 4.79 ANGELES 318,094 11,377 35.77 27 2.37 1 0.09 1,800 5.66
BALANGA 78,520 5,361 68.28 76 14.18 5 0.93 984 12.53
CABANATUAN 246,754 3,682 14.92 22 5.98 3 0.81 1,108 4.49 GAPAN 92,354 1,218 13.19 0 0.00 0 0.00 148 1.60 MALOLOS 167,794 3,930 23.42 17 4.33 0 0.00 791 4.71 MUÑOZ 65,586 747 11.39 4 5.35 1 1.34 118 1.80 OLONGAPO 204,158 4,476 21.92 34 7.60 1 0.22 919 4.50
PALAYAN 27,193 409 15.04 0 0.00 0 0.00 41 1.51
SAN FERNANDO 218,870 5,127 23.42 41 8.00 1 0.20 898 4.10 SAN JOSE 114,637 2,385 20.80 38 15.93 2 0.84 698 6.09 SAN JOSE D.M. 317,837 9,662 30.40 31 3.21 4 0.41 1,110 3.49 TARLAC CITY 280,271 7,570 27.01 74 9.78 4 0.53 1,510 5.39
TOTAL 8,631,113 187,071 21.67 1,402 7.49 56 0.30 35,943 4.16 DOH 2003
Table 5. Live Births and Total Deaths, Region 3
TOTAL
POPULATION LIVE BIRTHS RATE TOTAL
DEATHS RATE
AURORA 199,347 4,552 22.8 784 3.9 BATAAN 540,852 11,793 21.8 2,913 5.39 BULACAN 2,047,888 45,358 22.15 10,944 5.34
NUEVA ECIJA 1,218,082 20,578 16.89 2,363 1.9
PAMPANGA 1,632,229 29,372 18 16,484 10.1 TARLAC 879,632 16,569 18.8 3,491 3.97 ZAMBALES 464,363 8,171 17.6 2,218 4.78 ANGELES 325,410 11,475 35.26 1,690 5.19 BALANGA 81,166 5,323 65.58 986 12
CABANATUAN 255,520 5,337 20.88 1,062 4.2
GAPAN 86,974 1,799 20.68 429 4.9 MUÑOZ 199,343 1,321 6.6 360 1.8 OLONGAPO 207,184 4,841 23.36 908 4.38 PALAYAN 27,737 403 14.52 36 1.3 SAN JOSE 116,802 2,691 23.03 2,354 20.15
TARLAC CITY 286,353 0
9,274,390 DOH 2004
The top 10 leading cause of mortality from 1998 to 2003 are shown in table 6.
Although the rate of heart disease decreased from 1998 to 2003, it still occupied the top position.
7
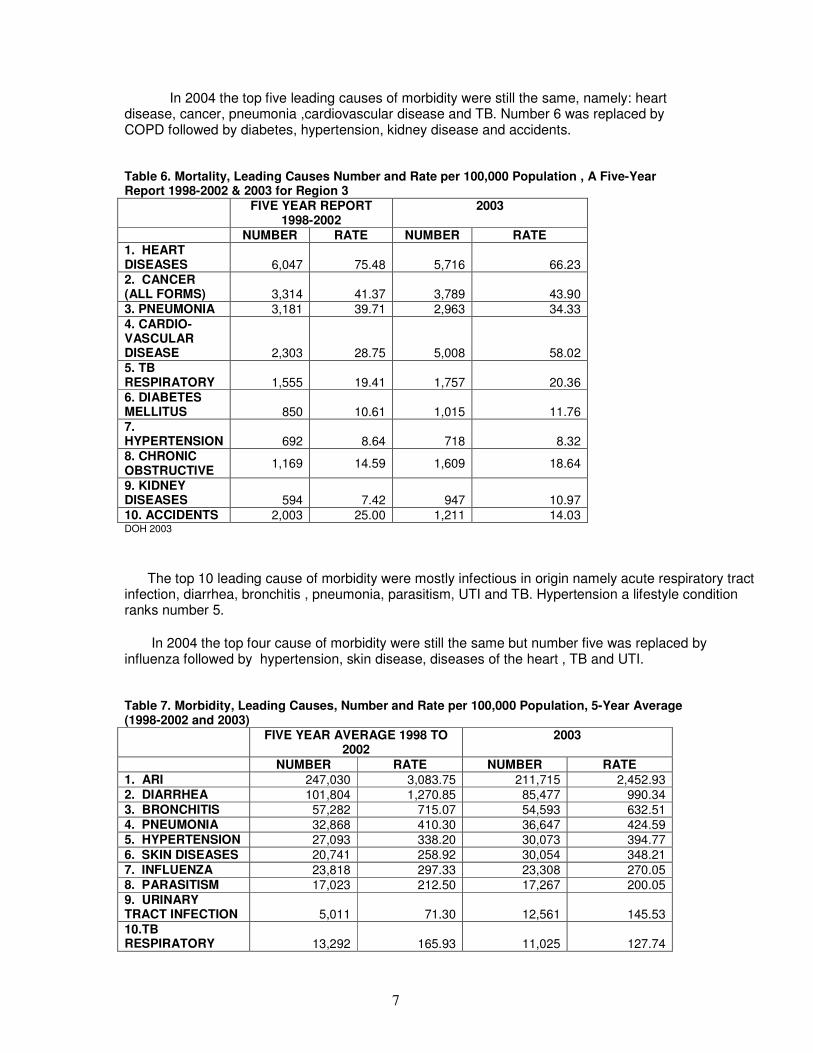
In 2004 the top five leading causes of morbidity were still the same, namely: heart disease, cancer, pneumonia ,cardiovascular disease and TB. Number 6 was replaced by COPD followed by diabetes, hypertension, kidney disease and accidents.
Table 6. Mortality, Leading Causes Number and Rate per 100,000 Population , A Five-Year Report 1998-2002 & 2003 for Region 3
FIVE YEAR REPORT 1998-2002
2003
NUMBER RATE NUMBER RATE 1. HEART DISEASES 6,047 75.48 5,716 66.23 2. CANCER (ALL FORMS) 3,314 41.37 3,789 43.90 3. PNEUMONIA 3,181 39.71 2,963 34.33
4. CARDIO-VASCULAR DISEASE 2,303 28.75 5,008 58.02 5. TB RESPIRATORY 1,555 19.41 1,757 20.36 6. DIABETES MELLITUS 850 10.61 1,015 11.76 7. HYPERTENSION 692 8.64 718 8.32 8. CHRONIC OBSTRUCTIVE
1,169 14.59 1,609 18.64
9. KIDNEY DISEASES 594 7.42 947 10.97 10. ACCIDENTS 2,003 25.00 1,211 14.03 DOH 2003
The top 10 leading cause of morbidity were mostly infectious in origin namely acute respiratory tract infection, diarrhea, bronchitis , pneumonia, parasitism, UTI and TB. Hypertension a lifestyle condition ranks number 5.
In 2004 the top four cause of morbidity were still the same but number five was replaced by influenza followed by hypertension, skin disease, diseases of the heart , TB and UTI. Table 7. Morbidity, Leading Causes, Number and Rate per 100,000 Population, 5-Year Average (1998-2002 and 2003)
FIVE YEAR AVERAGE 1998 TO 2002
2003
NUMBER RATE NUMBER RATE 1. ARI 247,030 3,083.75 211,715 2,452.93 2. DIARRHEA 101,804 1,270.85 85,477 990.34 3. BRONCHITIS 57,282 715.07 54,593 632.51 4. PNEUMONIA 32,868 410.30 36,647 424.59 5. HYPERTENSION 27,093 338.20 30,073 394.77
6. SKIN DISEASES 20,741 258.92 30,054 348.21
7. INFLUENZA 23,818 297.33 23,308 270.05 8. PARASITISM 17,023 212.50 17,267 200.05 9. URINARY TRACT INFECTION 5,011 71.30 12,561 145.53
10.TB RESPIRATORY 13,292 165.93 11,025 127.74
8
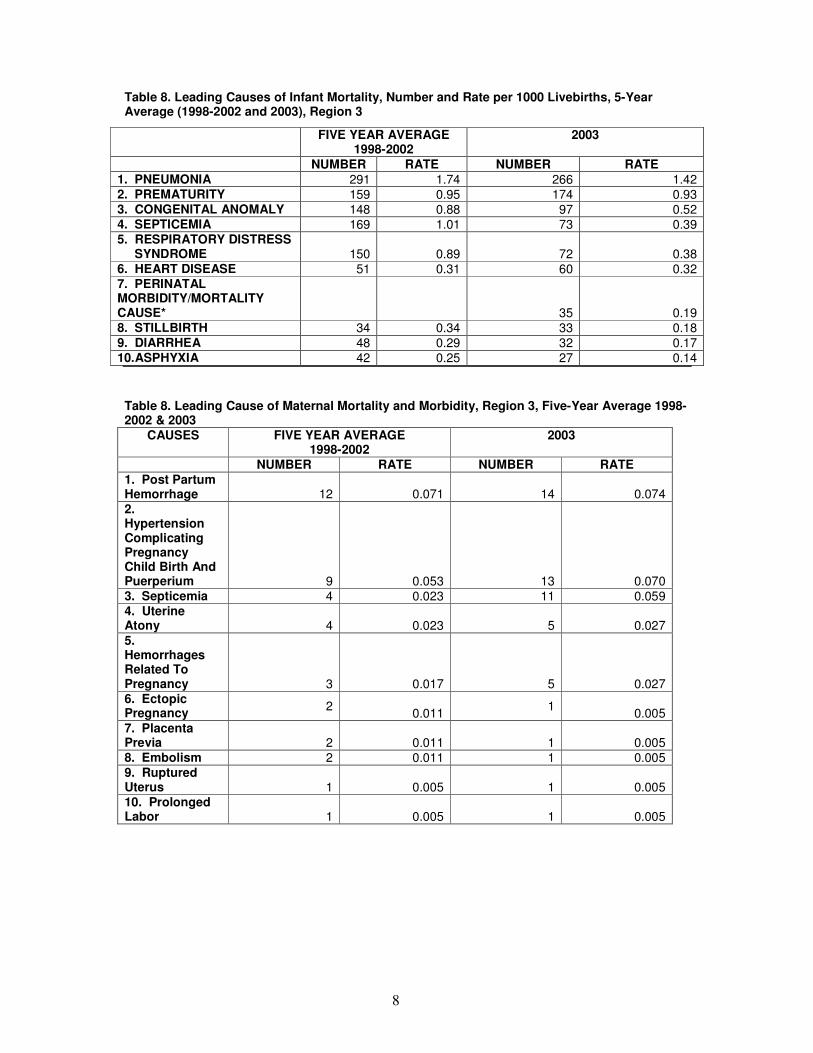
Table 8. Leading Causes of Infant Mortality, Number and Rate per 1000 Livebirths, 5-Year Average (1998-2002 and 2003), Region 3
Table 8. Leading Cause of Maternal Mortality and Morbidity, Region 3, Five-Year Average 1998- 2002 & 2003
CAUSES FIVE YEAR AVERAGE 1998-2002
2003
NUMBER RATE NUMBER RATE 1. Post Partum Hemorrhage 12 0.071 14 0.074
2. Hypertension Complicating Pregnancy Child Birth And Puerperium 9 0.053 13 0.070 3. Septicemia 4 0.023 11 0.059 4. Uterine Atony 4 0.023 5 0.027
5. Hemorrhages Related To Pregnancy 3 0.017 5 0.027 6. Ectopic Pregnancy 2
0.011 1
0.005 7. Placenta Previa 2 0.011 1 0.005 8. Embolism 2 0.011 1 0.005 9. Ruptured Uterus 1 0.005 1 0.005 10. Prolonged Labor 1 0.005 1 0.005
FIVE YEAR AVERAGE 1998-2002
2003
NUMBER RATE NUMBER RATE 1. PNEUMONIA 291 1.74 266 1.42 2. PREMATURITY 159 0.95 174 0.93 3. CONGENITAL ANOMALY 148 0.88 97 0.52 4. SEPTICEMIA 169 1.01 73 0.39 5. RESPIRATORY DISTRESS SYNDROME 150 0.89 72 0.38 6. HEART DISEASE 51 0.31 60 0.32 7. PERINATAL MORBIDITY/MORTALITY CAUSE* 35 0.19 8. STILLBIRTH 34 0.34 33 0.18 9. DIARRHEA 48 0.29 32 0.17 10.ASPHYXIA 42 0.25 27 0.14
9
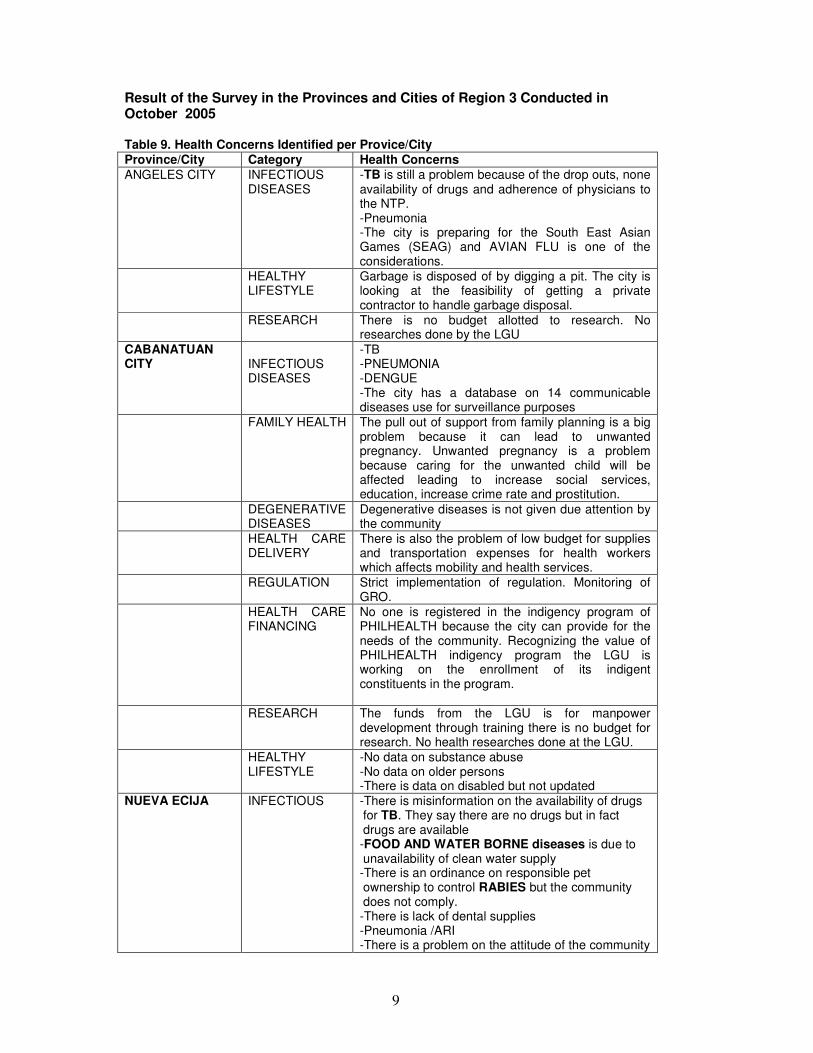
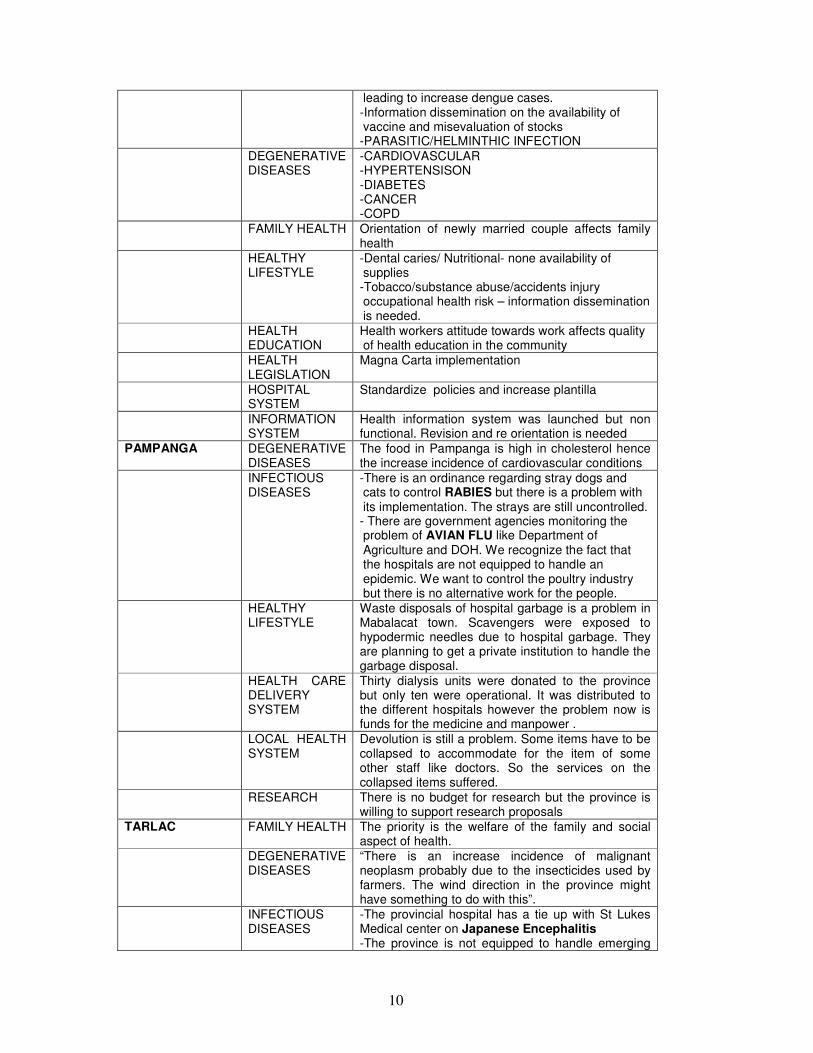
Result of the Survey in the Provinces and Cities of Region 3 Conducted in October 2005 Table 9. Health Concerns Identified per Provice/City Province/City Category Health Concerns ANGELES CITY INFECTIOUS
DISEASES -TB is still a problem because of the drop outs, none availability of drugs and adherence of physicians to the NTP. -Pneumonia -The city is preparing for the South East Asian Games (SEAG) and AVIAN FLU is one of the considerations.
HEALTHY LIFESTYLE
Garbage is disposed of by digging a pit. The city is looking at the feasibility of getting a private contractor to handle garbage disposal.
RESEARCH There is no budget allotted to research. No researches done by the LGU
CABANATUAN CITY
INFECTIOUS DISEASES
-TB -PNEUMONIA -DENGUE -The city has a database on 14 communicable diseases use for surveillance purposes
FAMILY HEALTH The pull out of support from family planning is a big problem because it can lead to unwanted pregnancy. Unwanted pregnancy is a problem because caring for the unwanted child will be affected leading to increase social services, education, increase crime rate and prostitution.
DEGENERATIVE DISEASES
Degenerative diseases is not given due attention by the community
HEALTH CARE DELIVERY
There is also the problem of low budget for supplies and transportation expenses for health workers which affects mobility and health services.
REGULATION Strict implementation of regulation. Monitoring of GRO.
HEALTH CARE FINANCING
No one is registered in the indigency program of PHILHEALTH because the city can provide for the needs of the community. Recognizing the value of PHILHEALTH indigency program the LGU is working on the enrollment of its indigent constituents in the program.
RESEARCH The funds from the LGU is for manpower development through training there is no budget for research. No health researches done at the LGU.
HEALTHY LIFESTYLE
-No data on substance abuse -No data on older persons -There is data on disabled but not updated
NUEVA ECIJA
INFECTIOUS
-There is misinformation on the availability of drugs for TB. They say there are no drugs but in fact drugs are available -FOOD AND WATER BORNE diseases is due to unavailability of clean water supply -There is an ordinance on responsible pet ownership to control RABIES but the community does not comply. -There is lack of dental supplies -Pneumonia /ARI -There is a problem on the attitude of the community
10
leading to increase dengue cases. -Information dissemination on the availability of vaccine and misevaluation of stocks -PARASITIC/HELMINTHIC INFECTION
DEGENERATIVE DISEASES
-CARDIOVASCULAR -HYPERTENSISON -DIABETES -CANCER -COPD
FAMILY HEALTH Orientation of newly married couple affects family health
HEALTHY LIFESTYLE
-Dental caries/ Nutritional- none availability of supplies -Tobacco/substance abuse/accidents injury occupational health risk – information dissemination is needed.
HEALTH EDUCATION
Health workers attitude towards work affects quality of health education in the community
HEALTH LEGISLATION
Magna Carta implementation
HOSPITAL SYSTEM
Standardize policies and increase plantilla
INFORMATION SYSTEM
Health information system was launched but non functional. Revision and re orientation is needed
PAMPANGA
DEGENERATIVE DISEASES
The food in Pampanga is high in cholesterol hence the increase incidence of cardiovascular conditions
INFECTIOUS DISEASES
-There is an ordinance regarding stray dogs and cats to control RABIES but there is a problem with its implementation. The strays are still uncontrolled. - There are government agencies monitoring the problem of AVIAN FLU like Department of Agriculture and DOH. We recognize the fact that the hospitals are not equipped to handle an epidemic. We want to control the poultry industry but there is no alternative work for the people.
HEALTHY LIFESTYLE
Waste disposals of hospital garbage is a problem in Mabalacat town. Scavengers were exposed to hypodermic needles due to hospital garbage. They are planning to get a private institution to handle the garbage disposal.
HEALTH CARE DELIVERY SYSTEM
Thirty dialysis units were donated to the province but only ten were operational. It was distributed to the different hospitals however the problem now is funds for the medicine and manpower .
LOCAL HEALTH SYSTEM
Devolution is still a problem. Some items have to be collapsed to accommodate for the item of some other staff like doctors. So the services on the collapsed items suffered.
RESEARCH There is no budget for research but the province is willing to support research proposals
TARLAC
FAMILY HEALTH The priority is the welfare of the family and social aspect of health.
DEGENERATIVE DISEASES
“There is an increase incidence of malignant neoplasm probably due to the insecticides used by farmers. The wind direction in the province might have something to do with this”.
INFECTIOUS DISEASES
-The provincial hospital has a tie up with St Lukes Medical center on Japanese Encephalitis -The province is not equipped to handle emerging
11
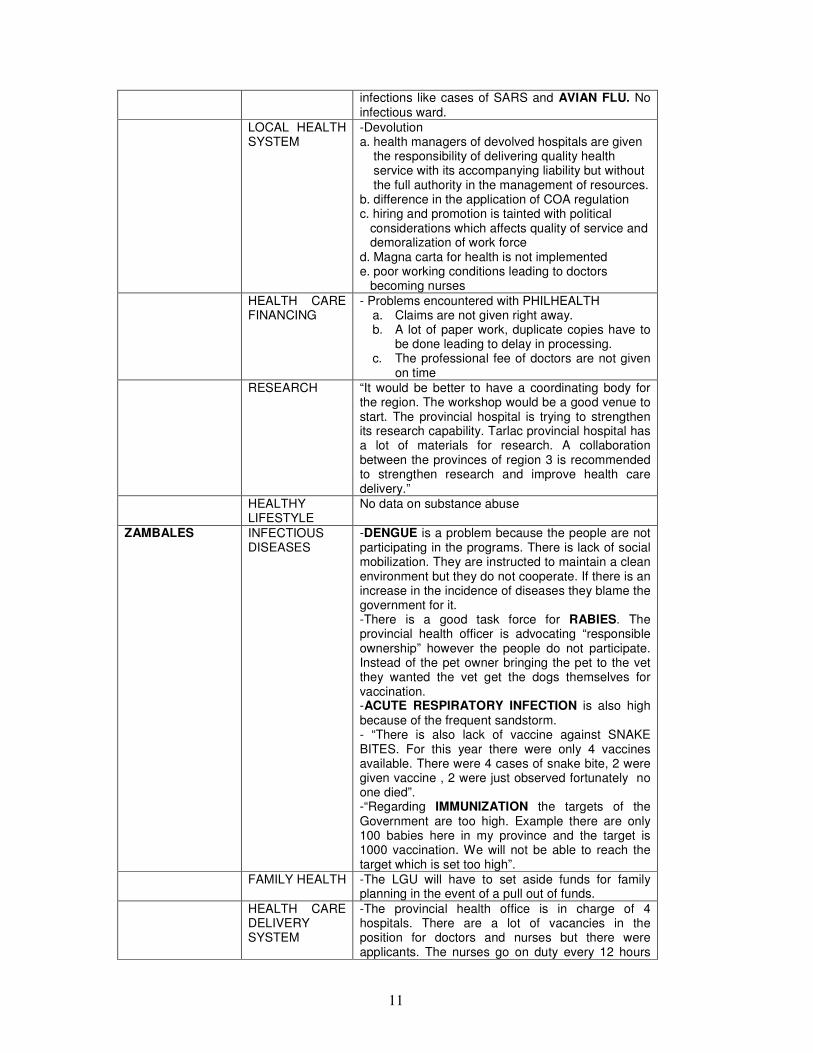
infections like cases of SARS and AVIAN FLU. No infectious ward.
LOCAL HEALTH SYSTEM
-Devolution a. health managers of devolved hospitals are given the responsibility of delivering quality health service with its accompanying liability but without the full authority in the management of resources. b. difference in the application of COA regulation c. hiring and promotion is tainted with political considerations which affects quality of service and demoralization of work force d. Magna carta for health is not implemented e. poor working conditions leading to doctors becoming nurses
HEALTH CARE FINANCING
- Problems encountered with PHILHEALTH a. Claims are not given right away. b. A lot of paper work, duplicate copies have to
be done leading to delay in processing. c. The professional fee of doctors are not given
on time RESEARCH “It would be better to have a coordinating body for
the region. The workshop would be a good venue to start. The provincial hospital is trying to strengthen its research capability. Tarlac provincial hospital has a lot of materials for research. A collaboration between the provinces of region 3 is recommended to strengthen research and improve health care delivery.”
HEALTHY LIFESTYLE
No data on substance abuse
ZAMBALES
INFECTIOUS DISEASES
-DENGUE is a problem because the people are not participating in the programs. There is lack of social mobilization. They are instructed to maintain a clean environment but they do not cooperate. If there is an increase in the incidence of diseases they blame the government for it. -There is a good task force for RABIES. The provincial health officer is advocating “responsible ownership” however the people do not participate. Instead of the pet owner bringing the pet to the vet they wanted the vet get the dogs themselves for vaccination. -ACUTE RESPIRATORY INFECTION is also high because of the frequent sandstorm. - “There is also lack of vaccine against SNAKE BITES. For this year there were only 4 vaccines available. There were 4 cases of snake bite, 2 were given vaccine , 2 were just observed fortunately no one died”. -“Regarding IMMUNIZATION the targets of the Government are too high. Example there are only 100 babies here in my province and the target is 1000 vaccination. We will not be able to reach the target which is set too high”.
FAMILY HEALTH -The LGU will have to set aside funds for family planning in the event of a pull out of funds.
HEALTH CARE DELIVERY SYSTEM
-The provincial health office is in charge of 4 hospitals. There are a lot of vacancies in the position for doctors and nurses but there were applicants. The nurses go on duty every 12 hours
12
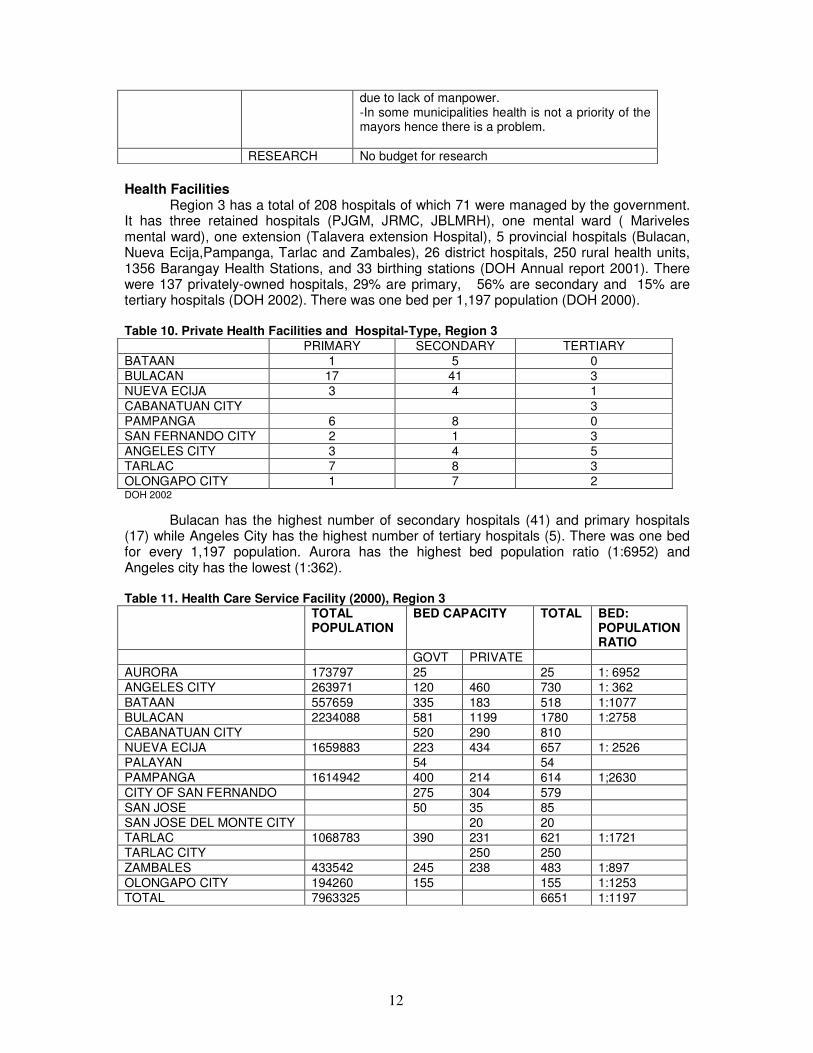
due to lack of manpower. -In some municipalities health is not a priority of the mayors hence there is a problem.
RESEARCH No budget for research
Health Facilities
Region 3 has a total of 208 hospitals of which 71 were managed by the government. It has three retained hospitals (PJGM, JRMC, JBLMRH), one mental ward ( Mariveles mental ward), one extension (Talavera extension Hospital), 5 provincial hospitals (Bulacan, Nueva Ecija,Pampanga, Tarlac and Zambales), 26 district hospitals, 250 rural health units, 1356 Barangay Health Stations, and 33 birthing stations (DOH Annual report 2001). There were 137 privately-owned hospitals, 29% are primary, 56% are secondary and 15% are tertiary hospitals (DOH 2002). There was one bed per 1,197 population (DOH 2000). Table 10. Private Health Facilities and Hospital-Type, Region 3 PRIMARY SECONDARY TERTIARY
BATAAN 1 5 0
BULACAN 17 41 3
NUEVA ECIJA 3 4 1
CABANATUAN CITY 3
PAMPANGA 6 8 0
SAN FERNANDO CITY 2 1 3
ANGELES CITY 3 4 5
TARLAC 7 8 3
OLONGAPO CITY 1 7 2 DOH 2002
Bulacan has the highest number of secondary hospitals (41) and primary hospitals (17) while Angeles City has the highest number of tertiary hospitals (5). There was one bed for every 1,197 population. Aurora has the highest bed population ratio (1:6952) and Angeles city has the lowest (1:362). Table 11. Health Care Service Facility (2000), Region 3 TOTAL
POPULATION
BED CAPACITY TOTAL BED: POPULATION RATIO
GOVT PRIVATE
AURORA 173797 25 25 1: 6952
ANGELES CITY 263971 120 460 730 1: 362
BATAAN 557659 335 183 518 1:1077
BULACAN 2234088 581 1199 1780 1:2758
CABANATUAN CITY 520 290 810
NUEVA ECIJA 1659883 223 434 657 1: 2526
PALAYAN 54 54
PAMPANGA 1614942 400 214 614 1;2630
CITY OF SAN FERNANDO 275 304 579
SAN JOSE 50 35 85
SAN JOSE DEL MONTE CITY 20 20
TARLAC 1068783 390 231 621 1:1721
TARLAC CITY 250 250
ZAMBALES 433542 245 238 483 1:897
OLONGAPO CITY 194260 155 155 1:1253
TOTAL 7963325 6651 1:1197
13
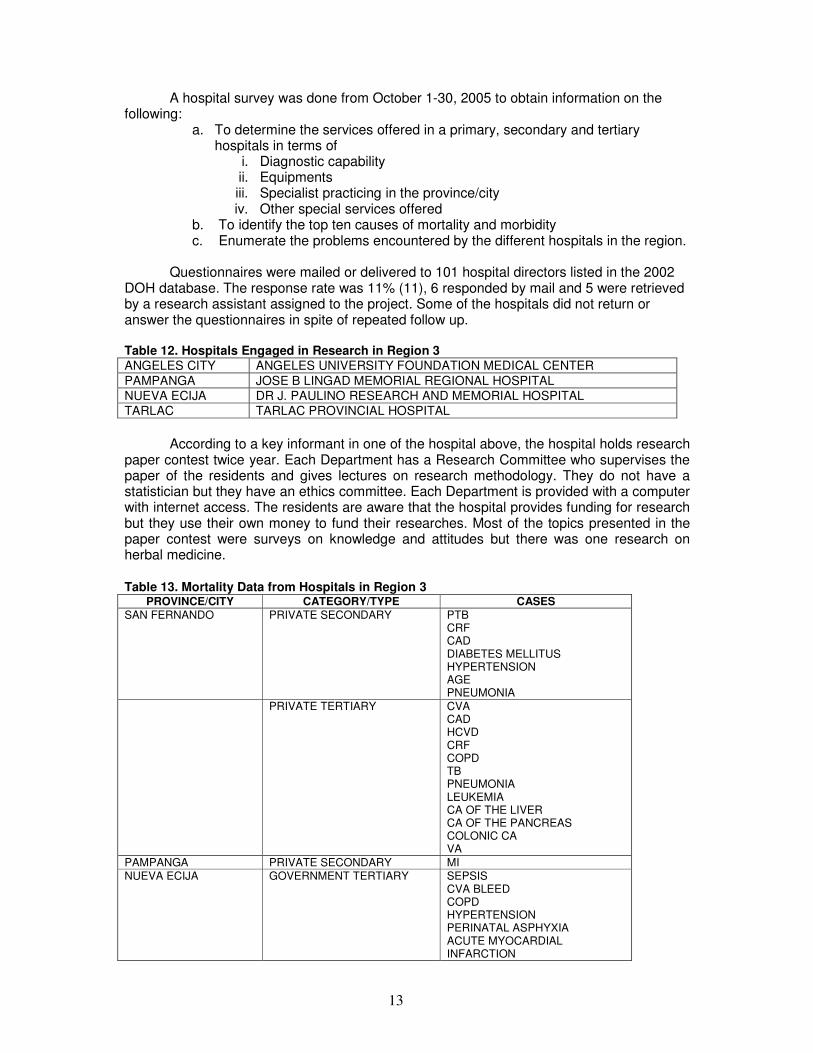
A hospital survey was done from October 1-30, 2005 to obtain information on the following:
a. To determine the services offered in a primary, secondary and tertiary hospitals in terms of
i. Diagnostic capability ii. Equipments iii. Specialist practicing in the province/city iv. Other special services offered
b. To identify the top ten causes of mortality and morbidity c. Enumerate the problems encountered by the different hospitals in the region.
Questionnaires were mailed or delivered to 101 hospital directors listed in the 2002 DOH database. The response rate was 11% (11), 6 responded by mail and 5 were retrieved by a research assistant assigned to the project. Some of the hospitals did not return or answer the questionnaires in spite of repeated follow up. Table 12. Hospitals Engaged in Research in Region 3 ANGELES CITY ANGELES UNIVERSITY FOUNDATION MEDICAL CENTER
PAMPANGA JOSE B LINGAD MEMORIAL REGIONAL HOSPITAL
NUEVA ECIJA DR J. PAULINO RESEARCH AND MEMORIAL HOSPITAL
TARLAC TARLAC PROVINCIAL HOSPITAL
According to a key informant in one of the hospital above, the hospital holds research
paper contest twice year. Each Department has a Research Committee who supervises the paper of the residents and gives lectures on research methodology. They do not have a statistician but they have an ethics committee. Each Department is provided with a computer with internet access. The residents are aware that the hospital provides funding for research but they use their own money to fund their researches. Most of the topics presented in the paper contest were surveys on knowledge and attitudes but there was one research on herbal medicine.
Table 13. Mortality Data from Hospitals in Region 3
PROVINCE/CITY CATEGORY/TYPE CASES SAN FERNANDO PRIVATE SECONDARY PTB
CRF CAD DIABETES MELLITUS HYPERTENSION AGE PNEUMONIA
PRIVATE TERTIARY CVA CAD HCVD CRF COPD TB PNEUMONIA LEUKEMIA CA OF THE LIVER CA OF THE PANCREAS COLONIC CA VA
PAMPANGA PRIVATE SECONDARY MI NUEVA ECIJA GOVERNMENT TERTIARY SEPSIS
CVA BLEED COPD HYPERTENSION PERINATAL ASPHYXIA ACUTE MYOCARDIAL INFARCTION
14
PTB BRONCHOPNEUMONIA
PRIVATE SECONDARY SEVERE PNEUMONIA UPPER GI BLEED PREMATURITY
TARLAC PRIVATE SECONDARY PTB CVA BLEED HYPERTENSION ASTHMA POISONING RENAL FAILURE MYOCARDIAL INFARCTION HCVD PNEUMONIA DIABETES MELLITUS
ZAMBALES
GOVERNMENT TERTIARY HEART DISEASE PHYSICAL INJURIES PNEUMONIA PTB/COPD PREMATURITY/RDS CANCER OF BREAST/LUNGS AND CERVICAL
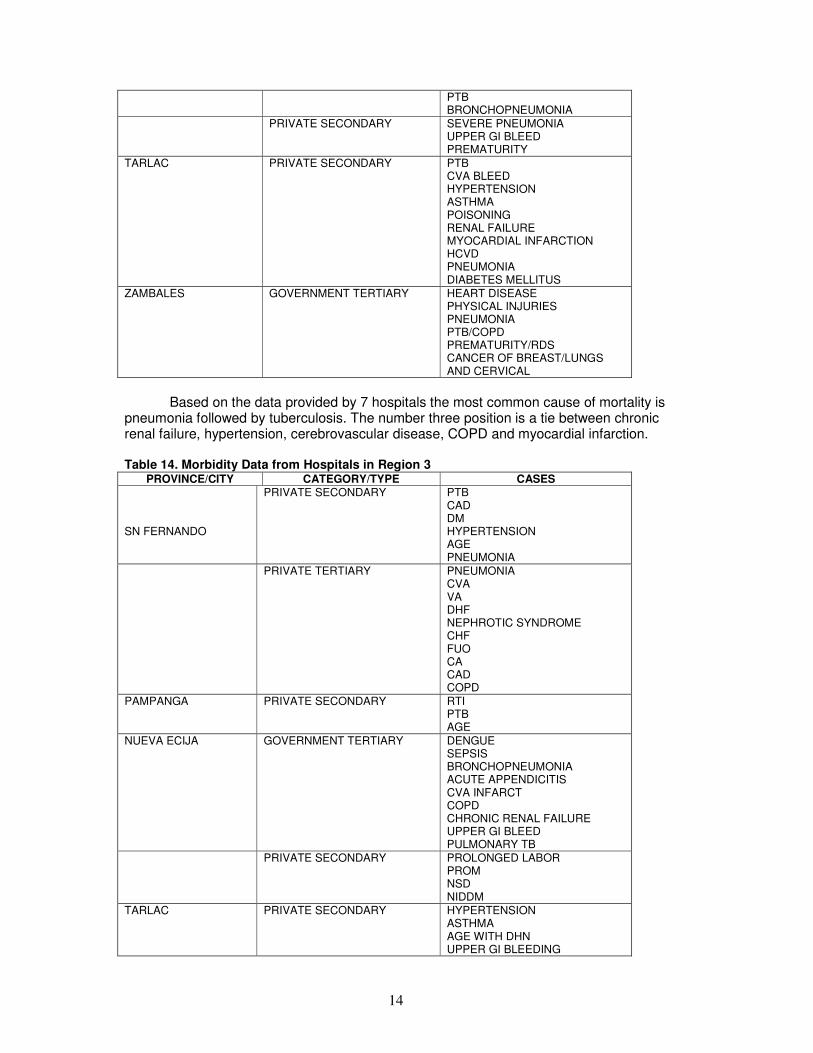
Based on the data provided by 7 hospitals the most common cause of mortality is
pneumonia followed by tuberculosis. The number three position is a tie between chronic renal failure, hypertension, cerebrovascular disease, COPD and myocardial infarction. Table 14. Morbidity Data from Hospitals in Region 3
PROVINCE/CITY CATEGORY/TYPE CASES SN FERNANDO
PRIVATE SECONDARY PTB CAD DM HYPERTENSION AGE PNEUMONIA
PRIVATE TERTIARY PNEUMONIA CVA VA DHF NEPHROTIC SYNDROME CHF FUO CA CAD COPD
PAMPANGA PRIVATE SECONDARY RTI PTB AGE
NUEVA ECIJA GOVERNMENT TERTIARY DENGUE SEPSIS BRONCHOPNEUMONIA ACUTE APPENDICITIS CVA INFARCT COPD CHRONIC RENAL FAILURE UPPER GI BLEED PULMONARY TB
PRIVATE SECONDARY PROLONGED LABOR PROM NSD NIDDM
TARLAC PRIVATE SECONDARY HYPERTENSION ASTHMA AGE WITH DHN UPPER GI BLEEDING
15
CANCER TYPHOID FEVER DENGUE FEVER ACUTE PYELONEPHRITIS PETIC ULCER DISEASE
ZAMBALES AGE HEART DISEASE PNEUMONIA PTB RESPIRATORY INFECTION
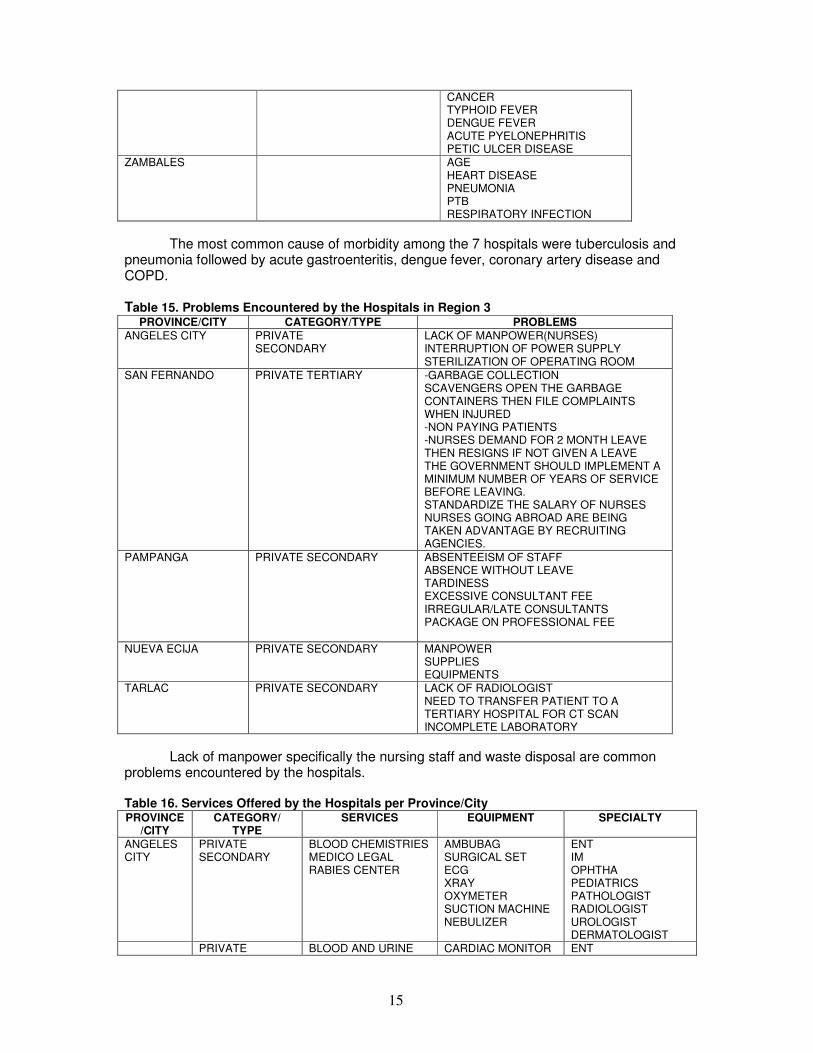
The most common cause of morbidity among the 7 hospitals were tuberculosis and pneumonia followed by acute gastroenteritis, dengue fever, coronary artery disease and COPD. Table 15. Problems Encountered by the Hospitals in Region 3
PROVINCE/CITY CATEGORY/TYPE PROBLEMS ANGELES CITY PRIVATE
SECONDARY LACK OF MANPOWER(NURSES) INTERRUPTION OF POWER SUPPLY STERILIZATION OF OPERATING ROOM
SAN FERNANDO PRIVATE TERTIARY -GARBAGE COLLECTION SCAVENGERS OPEN THE GARBAGE CONTAINERS THEN FILE COMPLAINTS WHEN INJURED -NON PAYING PATIENTS -NURSES DEMAND FOR 2 MONTH LEAVE THEN RESIGNS IF NOT GIVEN A LEAVE THE GOVERNMENT SHOULD IMPLEMENT A MINIMUM NUMBER OF YEARS OF SERVICE BEFORE LEAVING. STANDARDIZE THE SALARY OF NURSES NURSES GOING ABROAD ARE BEING TAKEN ADVANTAGE BY RECRUITING AGENCIES.
PAMPANGA PRIVATE SECONDARY ABSENTEEISM OF STAFF ABSENCE WITHOUT LEAVE TARDINESS EXCESSIVE CONSULTANT FEE IRREGULAR/LATE CONSULTANTS PACKAGE ON PROFESSIONAL FEE
NUEVA ECIJA PRIVATE SECONDARY MANPOWER SUPPLIES EQUIPMENTS
TARLAC PRIVATE SECONDARY LACK OF RADIOLOGIST NEED TO TRANSFER PATIENT TO A TERTIARY HOSPITAL FOR CT SCAN INCOMPLETE LABORATORY
Lack of manpower specifically the nursing staff and waste disposal are common problems encountered by the hospitals.
Table 16. Services Offered by the Hospitals per Province/City PROVINCE
/CITY CATEGORY/
TYPE SERVICES EQUIPMENT SPECIALTY
ANGELES CITY
PRIVATE SECONDARY
BLOOD CHEMISTRIES MEDICO LEGAL RABIES CENTER
AMBUBAG SURGICAL SET ECG XRAY OXYMETER SUCTION MACHINE NEBULIZER
ENT IM OPHTHA PEDIATRICS PATHOLOGIST RADIOLOGIST UROLOGIST DERMATOLOGIST
PRIVATE BLOOD AND URINE CARDIAC MONITOR ENT
16
TERTIARY CHEMISTRIES CULTURE ER, DR, OR, NICU,ICU NURSERY DIALYSIS TRAUMA CENTER CANCER CLINIC PHYSICAL REHAB CENTER MEDICO LEGAL AMBULANCE AUTOPSY
AMBUBAG SURGICAL SET INTUBATIONSET DEFIBRILLATOR INCUBATOR PORTABLE X RAY 2 D ECHO ECG TREADMILL CT SCAN MRI ULTRASOUND PULMONARY FUNCTION TEST MAMOGRAPHY BLOOD GAS VENTILATOR SUCTION MACHINE OXYMETER NEBULIZER FETAL MONITOR CATH LAB
IM (ALL SPECIALTY) OB GYNE OPHTHA PEDIATRICS (ALL SPECIALTY) PATHOLOGIST RADIOLOGIST SURGERY (ALL SPECIALTY) PSYCHIATRY OCCUPATIONAL MEDICINE DERMATOLOGIST ANESTHESIOLOGIST
SAN FERNANDO
PRIVATE TERTIARY
BLOOD CHEMISTRIES ER, DR, OR, NICU,ICU NURSERY DIALYSIS AMBULANCE
CARDIAC MONITOR AMBUBAG SURGICAL SET INTUBATIONSET DEFIBRILLATOR INCUBATOR 2D ECHO CT SCAN X RAY VENTILATOR SUCTION MACHINE OXYMETER NEBULIZER FETAL MONITOR
ENT IM (ALL SPECIALTY) OB GYNE OPHTHA PEDIATRICS (ALL SPECIALTY EXCEPT ENDO, NEPHRO, NEURO) PATHOLOGIST RADIOLOGIST SURGERY (ALL SPECIALTY) PSYCHIATRY DERMATOLOGIST ANESTHESIOLOGIST PHYSICAL THERAPY AND REHAB
PAMPANGA
PRIVATE SECONDARY
ER,NURSERY, DR, OR, LABORATORY AMBULANCE
CARDIAC MONITOR AMBUBAG SURGICAL SET INTUBATION SET DEFIBRILLATOR INCUBATOR ECG ULTRASOUND X RAY VENTILATOR SUCTION MACHINE OXYMETER NEBULIZER FETAL MONITOR
IM (NEPHRO AND PULMO) OB GYNE PEDIATRICS PATHOLOGIST RADIOLOGIST SURGERY ( GENERAL SURGERY, URO, ORTHO) ANESTHESIOLOGIST
NUEVA ECIJA
PRIVATE SECONDARY
ER,NURSERY, DR, OR, LABORATORY AMBULANCE
CARDIAC MONITOR AMBUBAG SURGICAL SET INTUBATIONSET DEFIBRILLATOR INCUBATOR ECG ULTRASOUND X RAY SUCTION MACHINE OXYMETER NEBULIZER FETAL MONITOR
ENT IM OB GYNE PEDIATRICS PATHOLOGIST RADIOLOGIST SURGERY ( GENERAL SURGERY) ANESTHESIOLOGIST
TERTIARY GOVERNMENT
LABORATORY ER, DR, OR, NICU,ICU
CARDIAC MONITOR AMBUBAG
ENT IM (ALL SPECIALTY)
17
NURSERY DIALYSIS TRAUMA CENTER CANCER CLINIC RABIES CENTER POISON CENTER TB DOT CENTER MEDICO LEGAL AMBULANCE AUTOPSY
SURGICAL SET INTUBATIONSET DEFIBRILLATOR INCUBATOR PORTABLE X RAY ECG TREADMILL CT SCAN ULTRASOUND PULMONARY FUNCTION TEST MAMOGRAPHY VENTILATOR SUCTION MACHINE OXYMETER NEBULIZER FETAL MONITOR CATH LAB
OB GYNE OPHTHA PEDIATRICS (ALL SPECIALTY) PATHOLOGIST RADIOLOGIST SURGERY PSYCHIATRY OCCUPATIONAL MEDICINE ANESTHESIOLOGIST
TARLAC PRIVATE SECONDARY
ER, DR, OR BLOOD AND URINE CHEM MEDICO LEGAL AMBULANCE
AMBUBAG SURGICAL SET INTUBATIONSET DEFIBRILLATOR INCUBATOR PORTABLE X RAY ECG X RAY SUCTION MACHINE OXYMETER NEBULIZER FETAL MONITOR
ENT IM (GASTRO) OB GYNE PEDIATRICS PATHOLOGIST RADIOLOGIST SURGERY (UROLOGY AND GENERAL SURGERY) ANESTHESIOLOGIST
ZAMBALES GOVERNMENT TERTIARY
ER, NURSERY, ICU, DR, OR LABORATORY AMBULANCE
CARDIAC MONITOR AMBUBAG SURGICAL SET INTUBATIONSET INCUBATOR ECG CT SCAN ULTRAOUND X RAY SUCTION MACHINE NEBULIZER FETAL MONITOR
ENT IM (PULMO) OB GYNE PEDIATRICS PATHOLOGIST SURGERY (UROLOGY AND ORTHOPEDIC) ANESTHESIOLOGIST
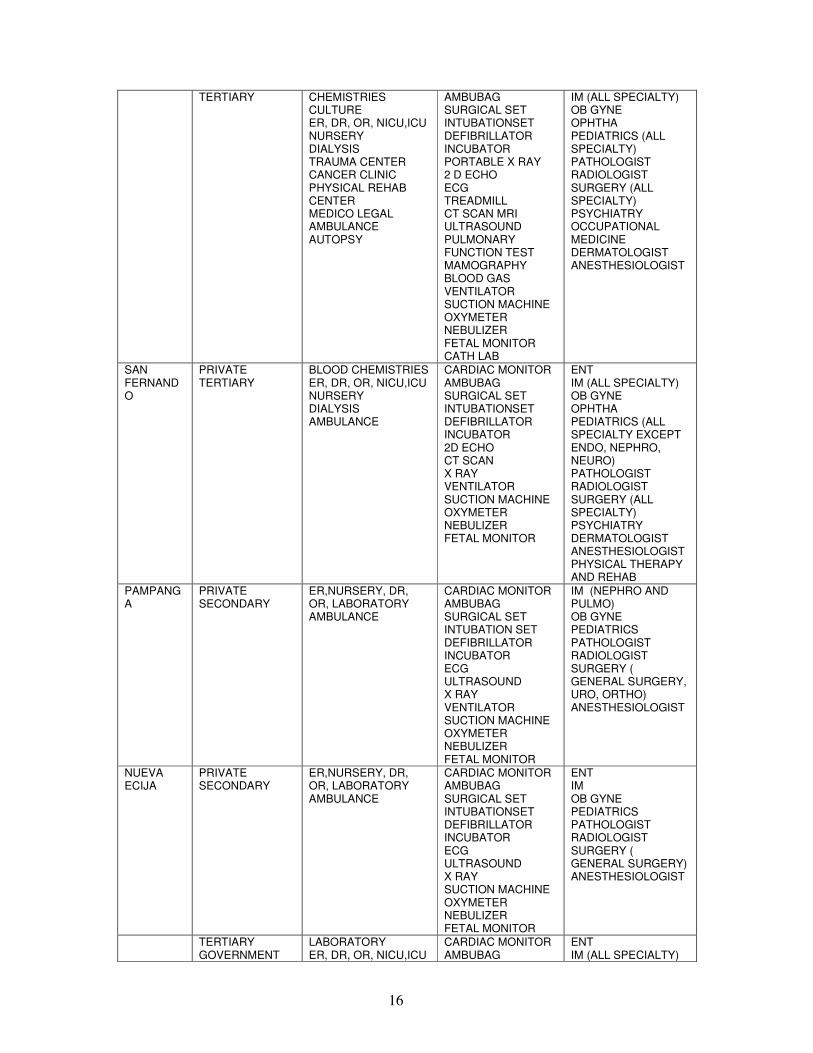
According to hospital representatives who answered the questionnaires, the tertiary
hospitals in Angeles city and Nueva Ecija were offering a complete line up of almost all the medical and surgical specialty services as well as a trauma , cancer, physical rehabilitation , rabies and TB DOT center. Only four tertiary training hospitals were engaged in research activities one private and three government institutions.
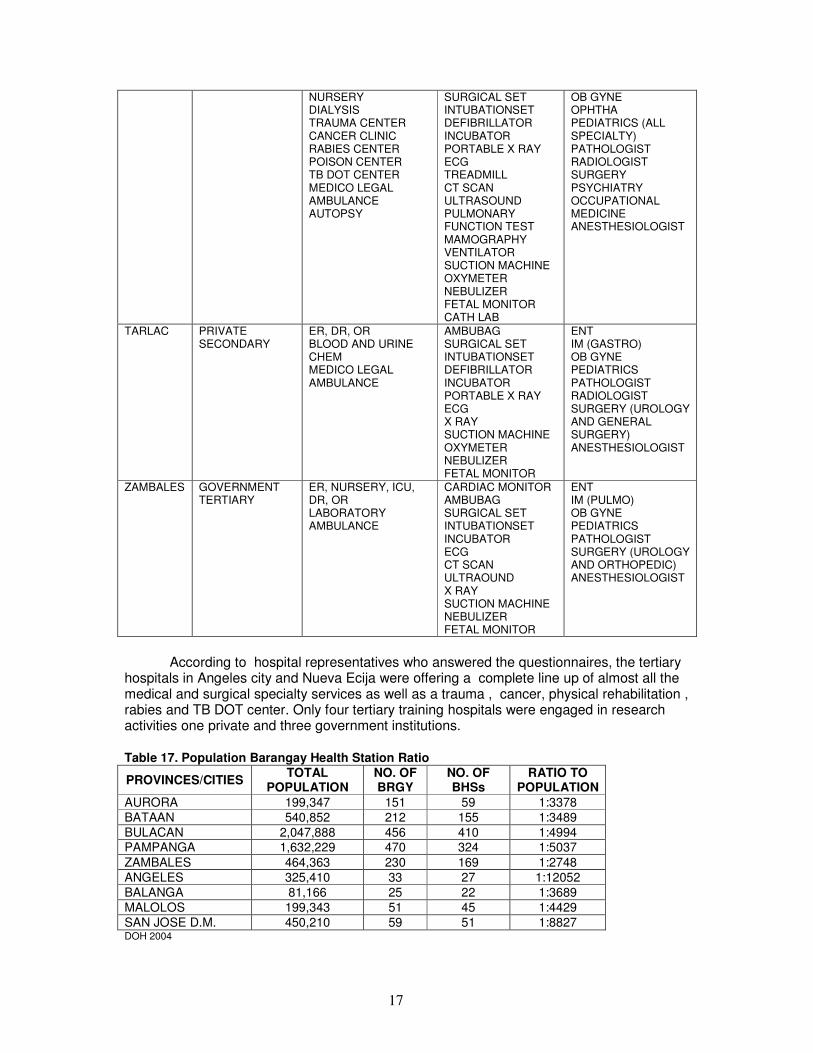
Table 17. Population Barangay Health Station Ratio
PROVINCES/CITIES TOTAL
POPULATION NO. OF BRGY
NO. OF BHSs
RATIO TO POPULATION
AURORA 199,347 151 59 1:3378
BATAAN 540,852 212 155 1:3489
BULACAN 2,047,888 456 410 1:4994 PAMPANGA 1,632,229 470 324 1:5037
ZAMBALES 464,363 230 169 1:2748
ANGELES 325,410 33 27 1:12052
BALANGA 81,166 25 22 1:3689
MALOLOS 199,343 51 45 1:4429
SAN JOSE D.M. 450,210 59 51 1:8827 DOH 2004
18
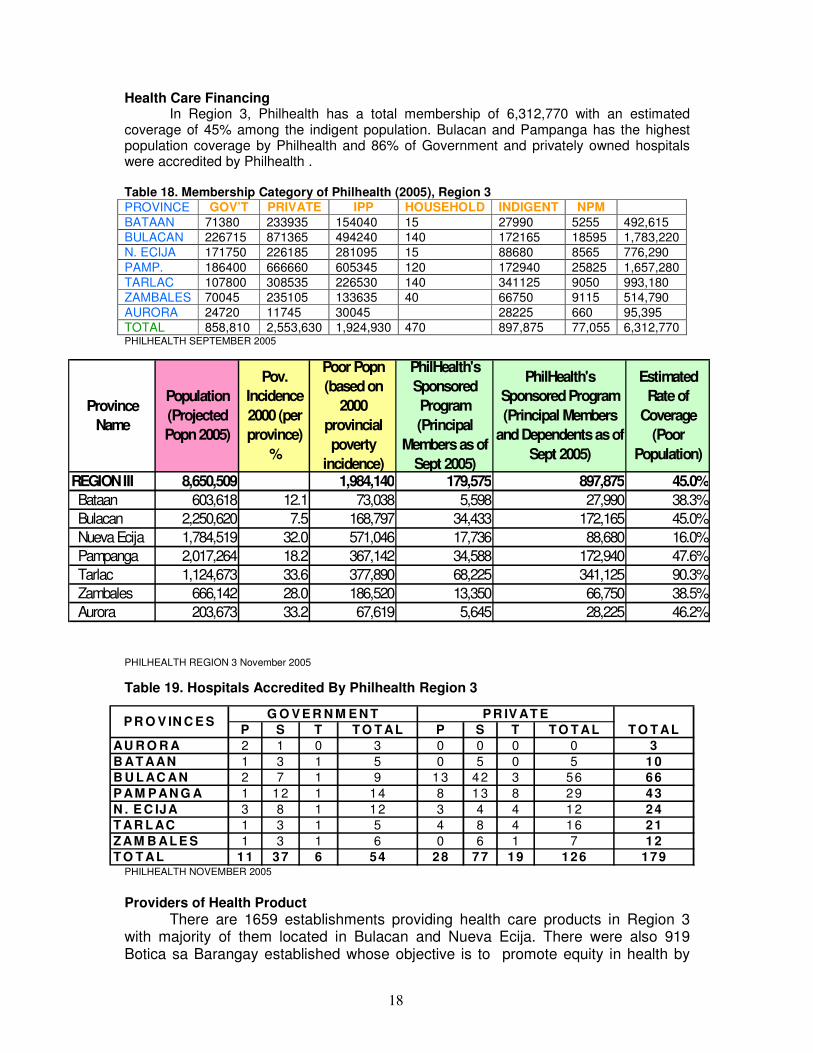
Health Care Financing In Region 3, Philhealth has a total membership of 6,312,770 with an estimated
coverage of 45% among the indigent population. Bulacan and Pampanga has the highest population coverage by Philhealth and 86% of Government and privately owned hospitals were accredited by Philhealth . Table 18. Membership Category of Philhealth (2005), Region 3 PROVINCE GOV’T PRIVATE IPP HOUSEHOLD INDIGENT NPM BATAAN 71380 233935 154040 15 27990 5255 492,615
BULACAN 226715 871365 494240 140 172165 18595 1,783,220
N. ECIJA 171750 226185 281095 15 88680 8565 776,290
PAMP. 186400 666660 605345 120 172940 25825 1,657,280
TARLAC 107800 308535 226530 140 341125 9050 993,180
ZAMBALES 70045 235105 133635 40 66750 9115 514,790
AURORA 24720 11745 30045 28225 660 95,395
TOTAL 858,810 2,553,630 1,924,930 470 897,875 77,055 6,312,770 PHILHEALTH SEPTEMBER 2005
PHILHEALTH REGION 3 November 2005
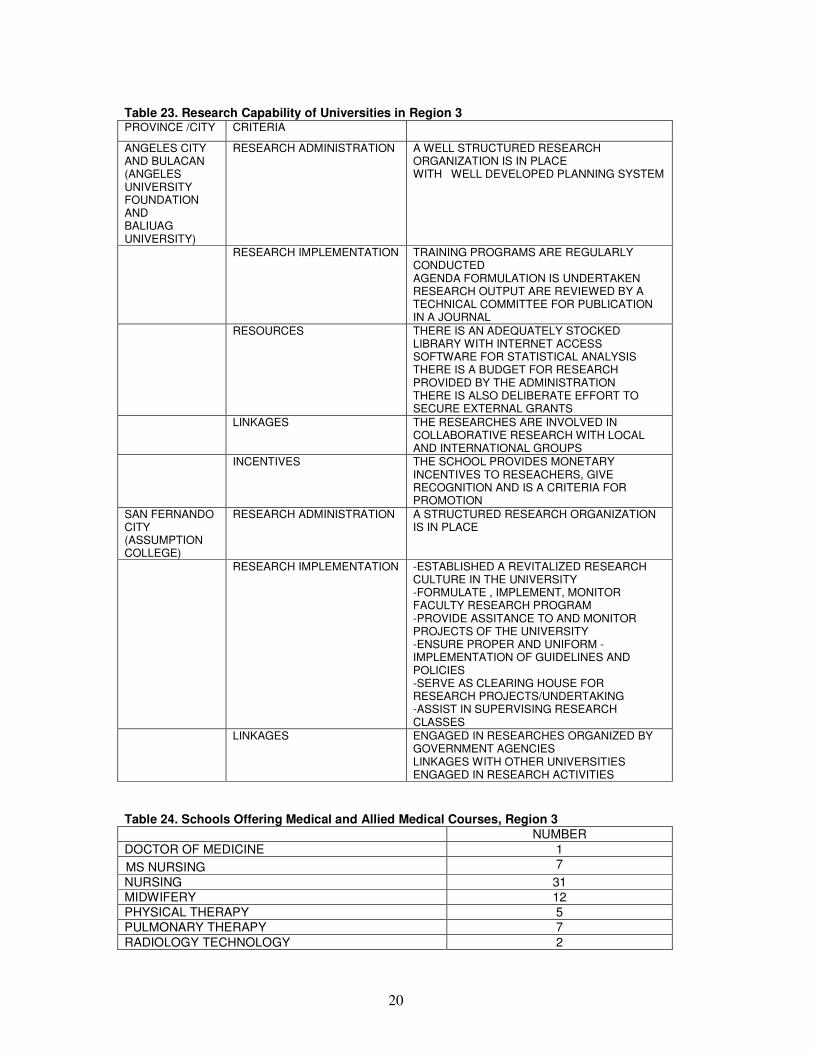
Table 19. Hospitals Accredited By Philhealth Region 3
PHILHEALTH NOVEMBER 2005
Providers of Health Product
There are 1659 establishments providing health care products in Region 3 with majority of them located in Bulacan and Nueva Ecija. There were also 919 Botica sa Barangay established whose objective is to promote equity in health by
P S T T O T AL P S T T O T ALAU R O R A 2 1 0 3 0 0 0 0 3B AT AAN 1 3 1 5 0 5 0 5 10B U L AC AN 2 7 1 9 13 42 3 56 66P AM P AN G A 1 12 1 14 8 13 8 29 43N . E C IJA 3 8 1 12 3 4 4 12 24T AR L AC 1 3 1 5 4 8 4 16 21ZAM B ALE S 1 3 1 6 0 6 1 7 12T O T AL 11 37 6 54 28 77 19 126 179
T O T ALG O V E R N M E N T
P R O V IN C E SP R IV AT E
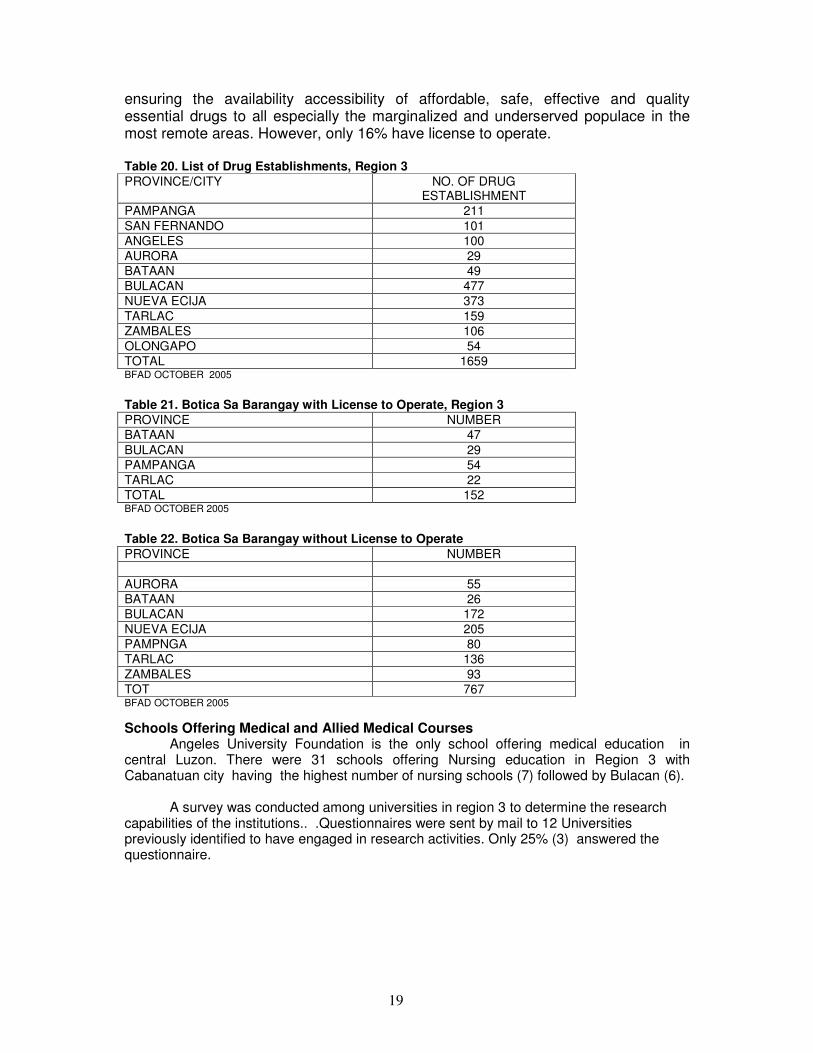
REGION III 8,650,509 1,984,140 179,575 897,875 45.0% Bataan 603,618 12.1 73,038 5,598 27,990 38.3%
Bulacan 2,250,620 7.5 168,797 34,433 172,165 45.0%
Nueva Ecija 1,784,519 32.0 571,046 17,736 88,680 16.0%
Pampanga 2,017,264 18.2 367,142 34,588 172,940 47.6%
Tarlac 1,124,673 33.6 377,890 68,225 341,125 90.3%
Zambales 666,142 28.0 186,520 13,350 66,750 38.5%
Aurora 203,673 33.2 67,619 5,645 28,225 46.2%
PhilHealth's Sponsored Program (Principal
Members as of Sept 2005)
PhilHealth's Sponsored Program (Principal Members
and Dependents as of Sept 2005)
Estimated Rate of
Coverage (Poor
Population)
Province Name
Population (Projected Popn 2005)
Pov. Incidence 2000 (per province)
%
Poor Popn (based on
2000 provincial poverty
incidence)
19
ensuring the availability accessibility of affordable, safe, effective and quality essential drugs to all especially the marginalized and underserved populace in the most remote areas. However, only 16% have license to operate.
Table 20. List of Drug Establishments, Region 3 PROVINCE/CITY NO. OF DRUG
ESTABLISHMENT
PAMPANGA 211
SAN FERNANDO 101
ANGELES 100
AURORA 29
BATAAN 49
BULACAN 477
NUEVA ECIJA 373
TARLAC 159
ZAMBALES 106
OLONGAPO 54
TOTAL 1659 BFAD OCTOBER 2005
Table 21. Botica Sa Barangay with License to Operate, Region 3 PROVINCE NUMBER
BATAAN 47
BULACAN 29
PAMPANGA 54
TARLAC 22
TOTAL 152 BFAD OCTOBER 2005
Table 22. Botica Sa Barangay without License to Operate PROVINCE NUMBER
AURORA 55
BATAAN 26
BULACAN 172
NUEVA ECIJA 205
PAMPNGA 80
TARLAC 136
ZAMBALES 93
TOT 767 BFAD OCTOBER 2005
Schools Offering Medical and Allied Medical Courses Angeles University Foundation is the only school offering medical education in
central Luzon. There were 31 schools offering Nursing education in Region 3 with Cabanatuan city having the highest number of nursing schools (7) followed by Bulacan (6).
A survey was conducted among universities in region 3 to determine the research capabilities of the institutions.. .Questionnaires were sent by mail to 12 Universities previously identified to have engaged in research activities. Only 25% (3) answered the questionnaire.
20
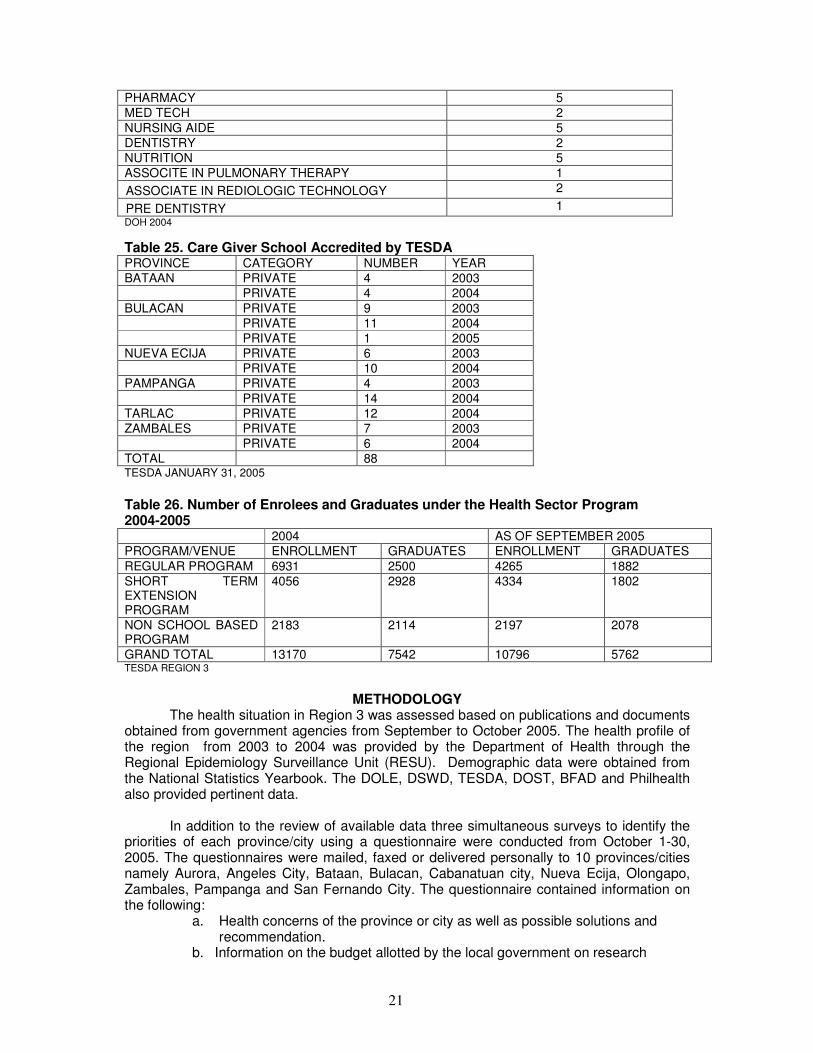
Table 23. Research Capability of Universities in Region 3 PROVINCE /CITY CRITERIA
ANGELES CITY AND BULACAN (ANGELES UNIVERSITY FOUNDATION AND BALIUAG UNIVERSITY)
RESEARCH ADMINISTRATION A WELL STRUCTURED RESEARCH ORGANIZATION IS IN PLACE WITH WELL DEVELOPED PLANNING SYSTEM
RESEARCH IMPLEMENTATION TRAINING PROGRAMS ARE REGULARLY CONDUCTED AGENDA FORMULATION IS UNDERTAKEN RESEARCH OUTPUT ARE REVIEWED BY A TECHNICAL COMMITTEE FOR PUBLICATION IN A JOURNAL
RESOURCES THERE IS AN ADEQUATELY STOCKED LIBRARY WITH INTERNET ACCESS SOFTWARE FOR STATISTICAL ANALYSIS THERE IS A BUDGET FOR RESEARCH PROVIDED BY THE ADMINISTRATION THERE IS ALSO DELIBERATE EFFORT TO SECURE EXTERNAL GRANTS
LINKAGES THE RESEARCHES ARE INVOLVED IN COLLABORATIVE RESEARCH WITH LOCAL AND INTERNATIONAL GROUPS
INCENTIVES THE SCHOOL PROVIDES MONETARY INCENTIVES TO RESEACHERS, GIVE RECOGNITION AND IS A CRITERIA FOR PROMOTION
SAN FERNANDO CITY (ASSUMPTION COLLEGE)
RESEARCH ADMINISTRATION A STRUCTURED RESEARCH ORGANIZATION IS IN PLACE
RESEARCH IMPLEMENTATION -ESTABLISHED A REVITALIZED RESEARCH CULTURE IN THE UNIVERSITY -FORMULATE , IMPLEMENT, MONITOR FACULTY RESEARCH PROGRAM -PROVIDE ASSITANCE TO AND MONITOR PROJECTS OF THE UNIVERSITY -ENSURE PROPER AND UNIFORM -IMPLEMENTATION OF GUIDELINES AND POLICIES -SERVE AS CLEARING HOUSE FOR RESEARCH PROJECTS/UNDERTAKING -ASSIST IN SUPERVISING RESEARCH CLASSES
LINKAGES ENGAGED IN RESEARCHES ORGANIZED BY GOVERNMENT AGENCIES LINKAGES WITH OTHER UNIVERSITIES ENGAGED IN RESEARCH ACTIVITIES
Table 24. Schools Offering Medical and Allied Medical Courses, Region 3 NUMBER
DOCTOR OF MEDICINE 1
MS NURSING 7
NURSING 31
MIDWIFERY 12
PHYSICAL THERAPY 5
PULMONARY THERAPY 7
RADIOLOGY TECHNOLOGY 2
21
PHARMACY 5
MED TECH 2
NURSING AIDE 5
DENTISTRY 2
NUTRITION 5
ASSOCITE IN PULMONARY THERAPY 1
ASSOCIATE IN REDIOLOGIC TECHNOLOGY 2
PRE DENTISTRY 1
DOH 2004
Table 25. Care Giver School Accredited by TESDA PROVINCE CATEGORY NUMBER YEAR
BATAAN PRIVATE 4 2003
PRIVATE 4 2004
BULACAN PRIVATE 9 2003
PRIVATE 11 2004
PRIVATE 1 2005
NUEVA ECIJA PRIVATE 6 2003
PRIVATE 10 2004
PAMPANGA PRIVATE 4 2003
PRIVATE 14 2004
TARLAC PRIVATE 12 2004
ZAMBALES PRIVATE 7 2003
PRIVATE 6 2004
TOTAL 88 TESDA JANUARY 31, 2005
Table 26. Number of Enrolees and Graduates under the Health Sector Program 2004-2005 2004 AS OF SEPTEMBER 2005
PROGRAM/VENUE ENROLLMENT GRADUATES ENROLLMENT GRADUATES
REGULAR PROGRAM 6931 2500 4265 1882
SHORT TERM EXTENSION PROGRAM
4056 2928 4334 1802
NON SCHOOL BASED PROGRAM
2183 2114 2197 2078
GRAND TOTAL 13170 7542 10796 5762 TESDA REGION 3
METHODOLOGY The health situation in Region 3 was assessed based on publications and documents
obtained from government agencies from September to October 2005. The health profile of the region from 2003 to 2004 was provided by the Department of Health through the Regional Epidemiology Surveillance Unit (RESU). Demographic data were obtained from the National Statistics Yearbook. The DOLE, DSWD, TESDA, DOST, BFAD and Philhealth also provided pertinent data.
In addition to the review of available data three simultaneous surveys to identify the
priorities of each province/city using a questionnaire were conducted from October 1-30, 2005. The questionnaires were mailed, faxed or delivered personally to 10 provinces/cities namely Aurora, Angeles City, Bataan, Bulacan, Cabanatuan city, Nueva Ecija, Olongapo, Zambales, Pampanga and San Fernando City. The questionnaire contained information on the following:
a. Health concerns of the province or city as well as possible solutions and recommendation. b. Information on the budget allotted by the local government on research
22
c. Funding agencies or linkages d. Ongoing researches
On the same months as above, consultations were also done from Provincial and City health officers, as well as Directors or representatives of some agencies to elaborate on the priorities identified in the survey. However, only six provinces / cities were covered due to financial and time constraints. Some of the key informant identified were not accessible through telephone or were not available during the time of visit.
Two other surveys were also conducted among hospitals and universities. The
hospital survey aimed to identify the top ten mortality and morbidity in the different hospitals, problems encountered as well as services offered, equipments available and research capability. The survey among universities also aimed to assess their research capability of the institutions.
All problems identified in the survey and consultations were collated and classified according to broad research and development area. These were presented during the plenary session of the regional consultation workshop in November 8, 2005. The objectives of the workshop were as follows:
•to validate the research priority areas in Region 3 •to rank the priority areas identified in Region 3 •to determine the types of research for the areas identified in Region 3 All government agencies involved in health care, Provincial and city health officers,
key informants, Hospital directors in secondary and tertiary hospitals who responded to the survey as well as those who did not answer the survey were invited. Representatives of Universities who were previously identified to have engaged in research activities were also invited, non-government organization, professional societies, heads of the different health related Departments of the Angeles University Foundation as well as the Director of the Center for Research and Development (CRD- AUF) were invited. There were 32 participants from various sectors (PCHRD, regional and zonal facilitators were excluded), namely: PHILHEALTH, DENR, NEDA, DOST, DOH, CHED, POPCOM, local government (Angeles City, San Fernando City, Tarlac), hospital representatives (Bataan, Pampanga, Angeles City), academe, professional society, and NGO who attended the workshop.
All participants were provided with a profile of Region 3 which included the summary
of health concerns in the region identified through surveys and consultations, demographic characteristics, poverty incidence, health services, health indices, mortality and morbidity data .An overview on the Philippine National Health Research System and the objectives and rationale for a unified research agenda was presented followed by the health situation, Philhealth coverage and programs of DOST in Region 3. The summary of health concerns gathered from the survey and consultations were presented for validation and ranking in the workshop. The criteria for prioritization were emphasized during the presentation, namely:
a. Urgency/magnitude of the issue to the Region b. Feasibility based on existing capability c. Impact on the greater number of population/cost to health care d. Impact of research on the health issue concerned e. Areas neglected or not well funded.
After the presentation, the participants were divided into two groups facilitated by faculty members of the AUF College of Medicine whose function were as follows:
1. To guide the participants on how to accomplish the research prioritization form for presentation in the plenary
2. To guide the participants on the health concerns to be validated 3. To encourage all the participants to contribute in the discussion
23
Each participant was provided a copy of all the priority health concerns identified in
the region through consultation and survey. The main task of the group was to determine whether a health problem will be included as a research priority for the region or not using the criteria provided. All their concerns were entertained and noted. After the discussion the health concerns identified were ranked as to importance and presented by the two groups in the plenary. During the plenary each group presented their own ranking with an explanation why it was included in the top ten and the reason for its rank. After the presentation of the two groups the ranked areas were again presented by the facilitator for final ranking.
During the plenary, local health system which was originally ranked number 4 was
replaced by research and was brought down to number 12. According to one participant improving the research capability of the Institutions is a higher priority. Autism was merged with mental health disorders in number 8. Herbal medicine was ranked 11 however some members of the plenary suggested that it should be elevated to number 6 instead of Environmental health risk which was only localized in Bulacan. Other members pointed out that occupational health risk is combined with environmental risk which is also a very important issue hence herbal medicine remained in number 11. Health information system was merged with documentation in number 4.
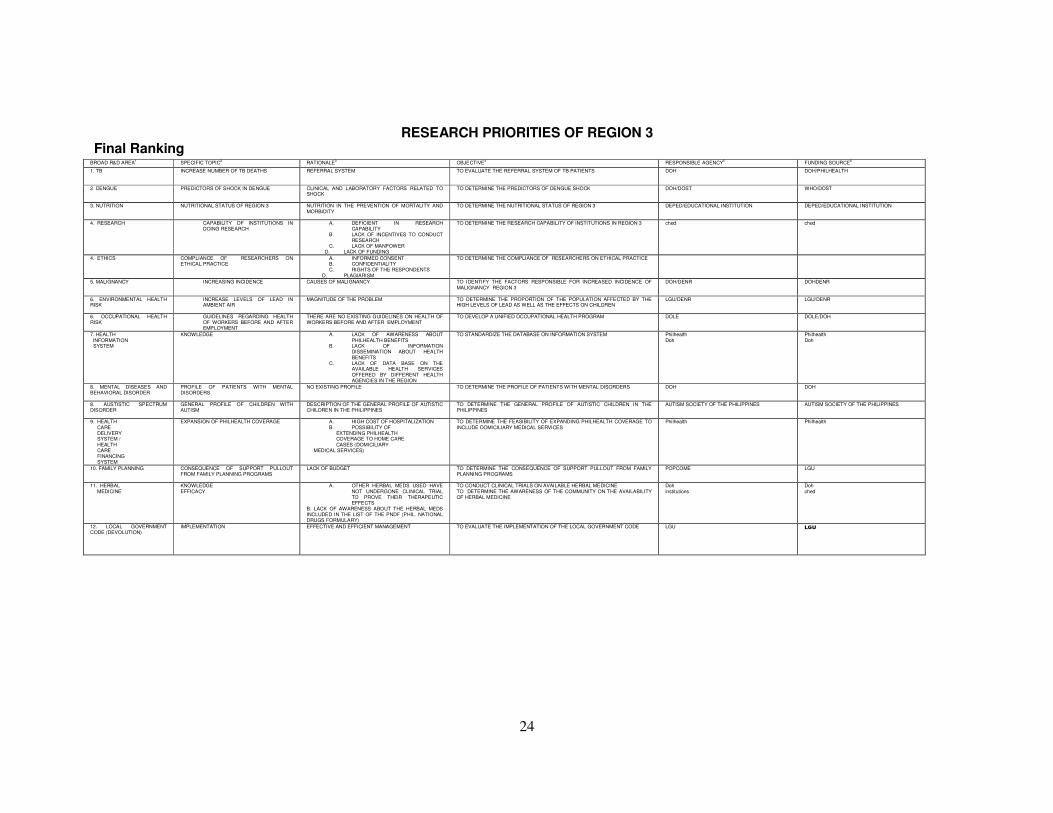
The top 10 priority areas identified were: 1. TB, 2. Dengue, 3. Healthy Lifestyle
(nutritional practice), 4. Research and Research Ethics, 5. Degenerative Diseases (malignancy), 6. Environmental Health Risk and Occupational Health, 7. Health Information System, 8. Mental Health, Behavioral Diseases and Autism, 9. Health Care Delivery, and 10. Family planning
24
RESEARCH PRIORITIES OF REGION 3 Final Ranking
BROAD R&D AREA1 SPECIFIC TOPIC
2 RATIONALE
3 OBJECTIVE
4 RESPONSIBLE AGENCY
5 FUNDING SOURCE
6
1. TB INCREASE NUMBER OF TB DEATHS REFERRAL SYSTEM TO EVALUATE THE REFERRAL SYSTEM OF TB PATIENTS DOH DOH/PHILHEALTH
2. DENGUE PREDICTORS OF SHOCK IN DENGUE CLINICAL AND LABORATORY FACTORS RELATED TO SHOCK
TO DETERMINE THE PREDICTORS OF DENGUE SHOCK DOH/DOST WHO/DOST
3. NUTRITION NUTRITIONAL STATUS OF REGION 3 NUTRITION IN THE PREVENTION OF MORTALITY AND MORBIDITY
TO DETERMINE THE NUTRITIONAL STATUS OF REGION 3 DEPED/EDUCATIONAL INSTITUTION DEPED/EDUCATIONAL INSTITUTION
4. RESEARCH
CAPABILITY OF INSTITUTIONS IN DOING RESEARCH
A. DEFICIENT IN RESEARCH CAPABILITY
B. LACK OF INCENTIVES TO CONDUCT RESEARCH
C. LACK OF MANPOWER D. LACK OF FUNDING
TO DETERMINE THE RESEARCH CAPABILITY OF INSTITUTIONS IN REGION 3 ched
ched
4. ETHICS
COMPLIANCE OF RESEARCHERS ON ETHICAL PRACTICE
A. INFORMED CONSENT B. CONFIDENTIALITY C. RIGHTS OF THE RESPONDENTS
D. PLAGIARISM
TO DETERMINE THE COMPLIANCE OF RESEARCHERS ON ETHICAL PRACTICE
5. MALIGNANCY INCREASING INCIDENCE CAUSES OF MALIGNANCY TO IDENTIFY THE FACTORS RESPONSIBLE FOR INCREASED INCIDENCE OF MALIGNANCY REGION 3
DOH/DENR DOHDENR
6. ENVIRONMENTAL HEALTH RISK
INCREASE LEVELS OF LEAD IN AMBIENT AIR
MAGNITUDE OF THE PROBLEM TO DETERMINE THE PROPORTION OF THE POPULATION AFFECTED BY THE HIGH LEVELS OF LEAD AS WELL AS THE EFFECTS ON CHILDREN
LGU/DENR LGU/DENR
6. OCCUPATIONAL HEALTH RISK
GUIDELINES REGARDING HEALTH OF WORKERS BEFORE AND AFTER EMPLOYMENT
THERE ARE NO EXISTING GUIDELINES ON HEALTH OF WORKERS BEFORE AND AFTER EMPLOYMENT
TO DEVELOP A UNIFIED OCCUPATIONAL HEALTH PROGRAM DOLE DOLE/DOH
7. HEALTH INFORMATION SYSTEM
KNOWLEDGE A. LACK OF AWARENESS ABOUT PHILHEALTH BENEFITS
B. LACK OF INFORMATION DISSEMINATION ABOUT HEALTH BENEFITS
C. LACK OF DATA BASE ON THE AVAILABLE HEALTH SERVICES OFFERED BY DIFFERENT HEALTH AGENCIES IN THE REGION
TO STANDARDIZE THE DATABASE ON INFORMATION SYSTEM Philhealth Doh
Philhealth Doh
8. MENTAL DISEASES AND BEHAVIORAL DISORDER
PROFILE OF PATIENTS WITH MENTAL DISORDERS
NO EXISTING PROFILE TO DETERMINE THE PROFILE OF PATIENTS WITH MENTAL DISORDERS DOH DOH
8. AUSTISTIC SPECTRUM DISORDER
GENERAL PROFILE OF CHILDREN WITH AUTISM
DESCRIPTION OF THE GENERAL PROFILE OF AUTISTIC CHILDREN IN THE PHILIPPINES
TO DETERMINE THE GENERAL PROFILE OF AUTISTIC CHILDREN IN THE PHILIPPINES
AUTISM SOCIETY OF THE PHILIPPINES AUTISM SOCIETY OF THE PHILIPPINES
9. HEALTH CARE DELIVERY SYSTEM / HEALTH CARE FINANCING SYSTEM
EXPANSION OF PHILHEALTH COVERAGE A. HIGH COST OF HOSPITALIZATION B. POSSIBILITY OF EXTENDING PHILHEALTH COVERAGE TO HOME CARE CASES (DOMICILIARY
MEDICAL SERVICES)
TO DETERMINE THE FEASIBILITY OF EXPANDING PHILHEALTH COVERAGE TO INCLUDE DOMICILIARY MEDICAL SERVICES
Philhealth Philhealth
10. FAMILY PLANNING CONSEQUENCE OF SUPPORT PULLOUT FROM FAMILY PLANNING PROGRAMS
LACK OF BUDGET TO DETERMINE THE CONSEQUENCE OF SUPPORT PULLOUT FROM FAMILY PLANNING PROGRAMS
POPCOME LGU
11. HERBAL MEDICINE
KNOWLEDGE EFFICACY
A. OTHER HERBAL MEDS USED HAVE NOT UNDERGONE CLINICAL TRIAL TO PROVE THEIR THERAPEUTIC EFFECTS
B. LACK OF AWARENESS ABOUT THE HERBAL MEDS INCLUDED IN THE LIST OF THE PNDF (PHIL. NATIONAL DRUGS FORMULARY)
TO CONDUCT CLINICAL TRIALS ON AVAILABLE HERBAL MEDICINE TO DETERMINE THE AWARENESS OF THE COMMUNITY ON THE AVAILABILITY OF HERBAL MEDICINE
Doh institutions
Doh ched
12. LOCAL GOVERNMENT CODE (DEVOLUTION)
IMPLEMENTATION EFFECTIVE AND EFFICIENT MANAGEMENT TO EVALUATE THE IMPLEMENTATION OF THE LOCAL GOVERNMENT CODE LGU LGU
25
References
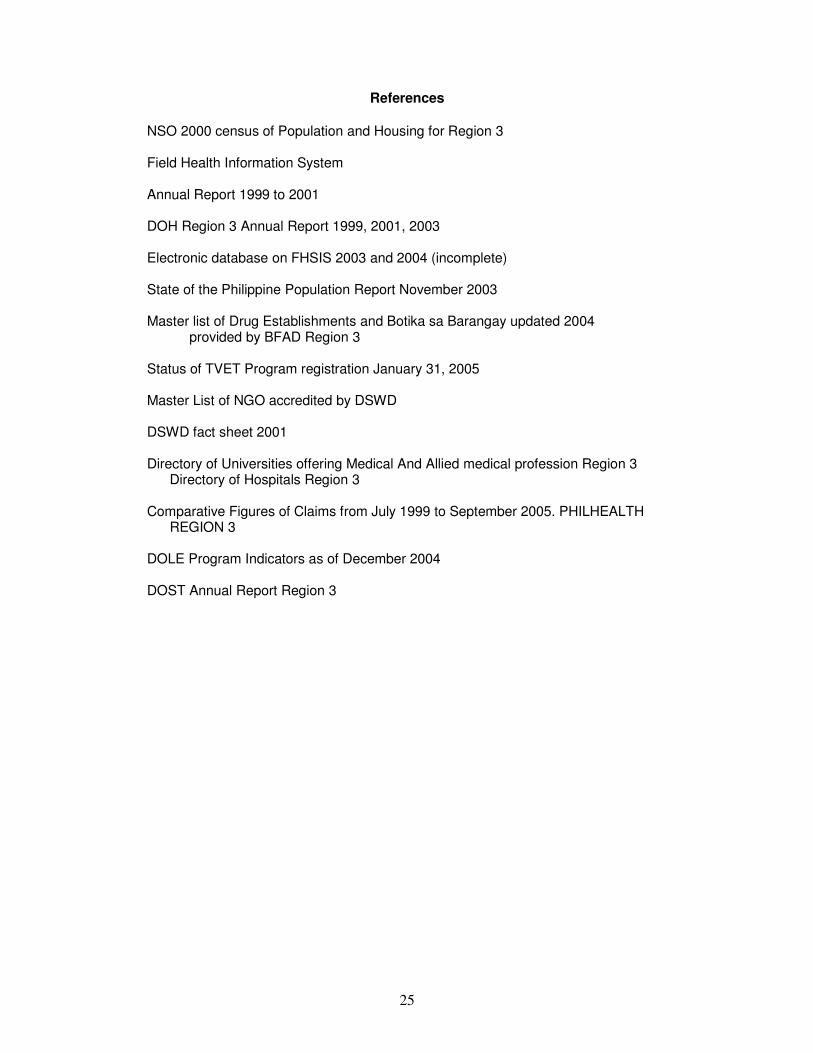
NSO 2000 census of Population and Housing for Region 3 Field Health Information System Annual Report 1999 to 2001 DOH Region 3 Annual Report 1999, 2001, 2003 Electronic database on FHSIS 2003 and 2004 (incomplete) State of the Philippine Population Report November 2003 Master list of Drug Establishments and Botika sa Barangay updated 2004 provided by BFAD Region 3 Status of TVET Program registration January 31, 2005 Master List of NGO accredited by DSWD DSWD fact sheet 2001 Directory of Universities offering Medical And Allied medical profession Region 3
Directory of Hospitals Region 3
Comparative Figures of Claims from July 1999 to September 2005. PHILHEALTH REGION 3
DOLE Program Indicators as of December 2004 DOST Annual Report Region 3

26
ANNEXES
Demographic Characteristics by Province and City in Region 3 ANGELES CITY
POPULATION CHARACTERISTICS The total population of Angeles city as of May 1, 2000 was 267,788 persons. This
represented an increase of 33,777 persons over the figure in the 1995 census of population with September 1, 1995 as the reference date.
The annual growth rate recorded during the 1995 to 2000 period was 2.93 % . This was 3.14 percentage points higher than the annual growth rate during the 1990 to 1995 period. If the current population growth rate continues, the population is expected to double in 24 years. Table 1. Population Distribution of Top 10 Barangays of Angeles City, 2000 NUMBER PERCENT
ANGELES CITY 267788 100
BALIBAGO 31731 11.85
CUTCUT 22462 8.39
MALABANIAS 19169 7.16
PULUNG CACUTUD 17167 6.41
SANTO DOMINGO 14139 5.28
NINOY AQUINO 12511 4.67
PULUNGBULU 12009 4.48
LOURDES NORTH WEST 11429 4.27
PANDAN 10545 3.94
PULUNG MARAGUL 9738 3.64
The number of households went up to 56,575 in 2000, an increase of 9,723 households over the 1995 census. However, the average household size slightly decrease from 4.98 persons in 1995 to 4.72 persons in 2000.
Females outnumbered males with a sex ratio of 99 males for every 100 female. Males dominated the age group 0-14 years and 40 to 44 years while females dominated the rest of the age groups. The median age is 23 years old which means that the population is below 23 years.
The dependency ratio is 60 which means that every 100 person in the working age group (15-64) had to support 55 young dependents and five old dependents. Young dependents comprised 34.5%, old dependents comprised 3.2% and the working group is 62.3%. Married persons made up 46.72% of the household population while 42.41 % were reported to be single. The remaining 10.87 % were either with other marital arrangements, widowed, separated, divorced or with unknown marital status.The proportion of single individual was higher for males (52.19%) than females (47.81%). The proportion of widowed was higher in female 80.44%.
Among the household population five years and older 34.5% attended/graduated from high school, 34.42 % attended/finished elementary, 12.17% were college undergraduates, 5.11% were academic degree holders and 0.09% with post baccalaureate courses. Females dominated higher levels of education at 52.21% for academic degree holders and 51.66% with post secondary courses. Most of the households were headed by
27
males 83.3% with the largest proportion of household heads age 30-39 years (28.49%) followed by age 40-49 (24.69%).
Females were more likely to head smaller households while males larger ones. The
household size with the highest proportion of household headed by males was four persons(20.31%) while that of females was three persons(19.26%)
Majority of the population in Angeles city were Filipino (96.66%) And about 0.56% were either Chinese, Americans, British and others.
Of the total population 1811 persons have disabilities. Low vision was the most common disability (22.53%) followed by loss of one or both arms/hands (14.74) mental retardation (11.26) and partial blindness (97.95). The proportion of low vision is higher in females (59.07%) and the proportion of those with oral defect is higher among males( 61.43%).
Majority of the household population were literate (95.68%) with more females than males(95.74% vs 95.62)The highest proportion of literate persons are in the 30-34 year age group. (97.82%)
About 10.92% of women 15-49 years old got married at the age of 20 years, 10.25% at 18 years and 9.31% at 19 years. The average age at first marriage is 21 years.Of the total ever married women 15-49 years old 21.58 % had two children 18.72 had three children and 18.02 had no children. The average number of children born to an ever married woman is 2.41.
The number of overseas workers decreased from 3821 in 1995 to 3608 in 2000. There was a higher proportion of male over seas workers than female overseas workers (57.18 vs 42.82) the highest proportion of overseas worker is the age group 45 years and over.(23.64). About 16% of the overseas worker attended /completed elementary 35.17 % reached high school, 21.81% were college undergraduates, 35.17 % reached high school, 21.81% college undergraduate 10.78% were academic degree holder and 0.14% with post baccalaureate courses. Among the academic degree holders, the proportion was higher in male (65.81%) than female. The same is true for those with post secondary courses (61.97%). HOUSEHOLD CHARACTERISTICS
Electricity was the most common type of fuel used for lighting household (93.83%) while 1.91% used kerosene. The remaining used either liquefied petroleum gas, oil or other types of fuel or lighting.
More than 2/3 of the household got water from own use faucet connected to a community water system for drinking/cooking. Other sources were shared faucet also connected to a community water system (12.02) shared tube/piped deep well (9.19) and own use tubed/piped deep well 95.37). The same is true for main source of water for laundry and or bathing.
About 79.6% use LPG for cooking this proportion was higher than 10 years ago by 25.7 percentage points. The proportion of households that use wood for cooking decreased by 9.95 percentage points. About 74% of the households had an exclusive use of water sealed sewer/septic tank. Water sealed sewer shared with other households at 9.49% and water sealed depository used exclusively by the household 8.82%, 0.46% had an open pit type of toilet facility.
28
The usual manner of garbage disposal is garbage collection by truck 83.03% Dumping in individual pit 6.95% and burning 6.8% The remaining household either had their garbage buried, fed to the animals, composted or used other types of garbage disposal. Most household had television set (83%) radio cassette (82.55). 50.41% had refrigerator/freezer , 45. 56 had washing machine and 36.81 had video cassette recorder.
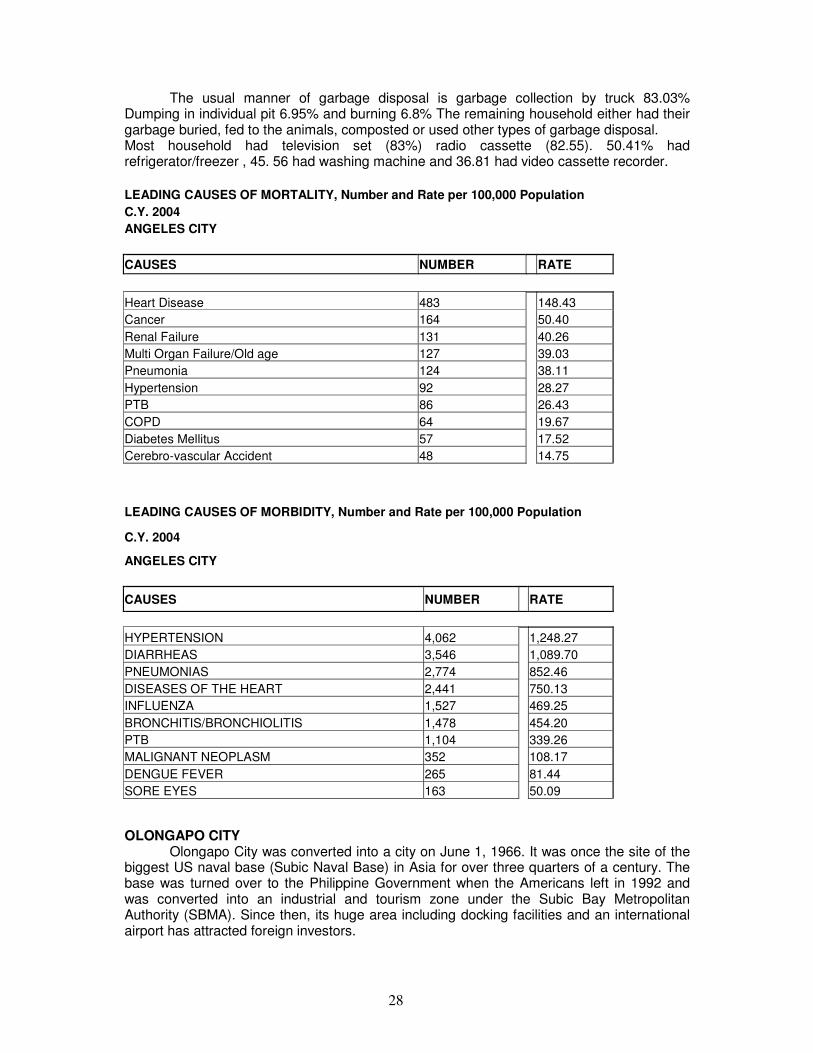
LEADING CAUSES OF MORTALITY, Number and Rate per 100,000 Population C.Y. 2004 ANGELES CITY
CAUSES NUMBER RATE
Heart Disease 483 148.43
Cancer 164 50.40
Renal Failure 131 40.26
Multi Organ Failure/Old age 127 39.03
Pneumonia 124 38.11
Hypertension 92 28.27
PTB 86 26.43
COPD 64 19.67
Diabetes Mellitus 57 17.52
Cerebro-vascular Accident 48 14.75
LEADING CAUSES OF MORBIDITY, Number and Rate per 100,000 Population
C.Y. 2004
ANGELES CITY
CAUSES NUMBER RATE
HYPERTENSION 4,062 1,248.27
DIARRHEAS 3,546 1,089.70
PNEUMONIAS 2,774 852.46
DISEASES OF THE HEART 2,441 750.13
INFLUENZA 1,527 469.25
BRONCHITIS/BRONCHIOLITIS 1,478 454.20
PTB 1,104 339.26
MALIGNANT NEOPLASM 352 108.17
DENGUE FEVER 265 81.44
SORE EYES 163 50.09
OLONGAPO CITY Olongapo City was converted into a city on June 1, 1966. It was once the site of the
biggest US naval base (Subic Naval Base) in Asia for over three quarters of a century. The base was turned over to the Philippine Government when the Americans left in 1992 and was converted into an industrial and tourism zone under the Subic Bay Metropolitan Authority (SBMA). Since then, its huge area including docking facilities and an international airport has attracted foreign investors.
29
POPULATION CHARACTERISTICS Based on the census of population and housing, the total population of Olongapo
City as of may 1, 200 was 194,260 persons. This represented an increase of 14506 persons over the figure in the 1995 census of population with September 1, 1995 as the reference date.
The average annual population growth rate recorded during the 1995 to 2000 period was 1.68 %. This was 3.03 percentage points higher than the annual growth rate recorded during the 1990 to 1995 period.
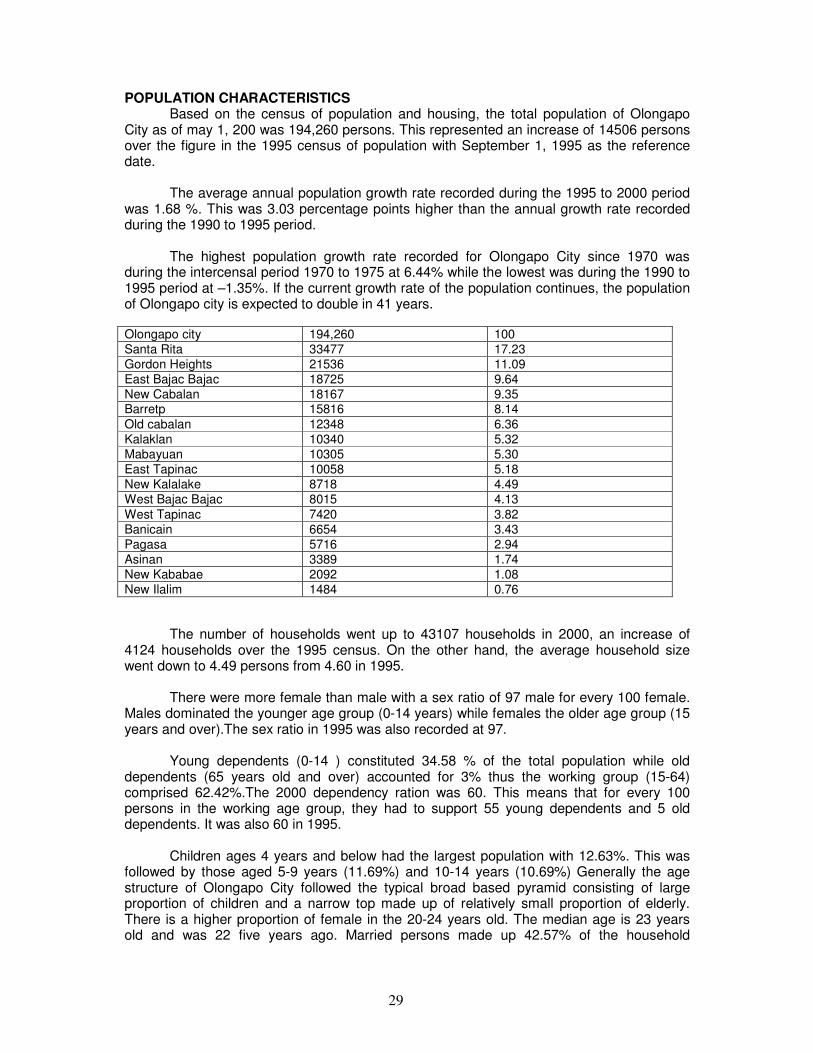
The highest population growth rate recorded for Olongapo City since 1970 was during the intercensal period 1970 to 1975 at 6.44% while the lowest was during the 1990 to 1995 period at –1.35%. If the current growth rate of the population continues, the population of Olongapo city is expected to double in 41 years.
Olongapo city 194,260 100
Santa Rita 33477 17.23
Gordon Heights 21536 11.09
East Bajac Bajac 18725 9.64
New Cabalan 18167 9.35 Barretp 15816 8.14
Old cabalan 12348 6.36
Kalaklan 10340 5.32
Mabayuan 10305 5.30
East Tapinac 10058 5.18
New Kalalake 8718 4.49
West Bajac Bajac 8015 4.13
West Tapinac 7420 3.82
Banicain 6654 3.43
Pagasa 5716 2.94
Asinan 3389 1.74
New Kababae 2092 1.08
New Ilalim 1484 0.76
The number of households went up to 43107 households in 2000, an increase of 4124 households over the 1995 census. On the other hand, the average household size went down to 4.49 persons from 4.60 in 1995.
There were more female than male with a sex ratio of 97 male for every 100 female. Males dominated the younger age group (0-14 years) while females the older age group (15 years and over).The sex ratio in 1995 was also recorded at 97.
Young dependents (0-14 ) constituted 34.58 % of the total population while old dependents (65 years old and over) accounted for 3% thus the working group (15-64) comprised 62.42%.The 2000 dependency ration was 60. This means that for every 100 persons in the working age group, they had to support 55 young dependents and 5 old dependents. It was also 60 in 1995.
Children ages 4 years and below had the largest population with 12.63%. This was followed by those aged 5-9 years (11.69%) and 10-14 years (10.69%) Generally the age structure of Olongapo City followed the typical broad based pyramid consisting of large proportion of children and a narrow top made up of relatively small proportion of elderly. There is a higher proportion of female in the 20-24 years old. The median age is 23 years old and was 22 five years ago. Married persons made up 42.57% of the household

30
population while 42.3% were reported single. The remaining 14.3% were either with their marital arrangements, widowed or separated.
Among single persons the proportion was higher for males 51.18% than female
48.82%. In contrast the proportion of widowed was higher for female (81.35) than for male (18.65).
Among the household population aged 5 years and above 38.47% attended/completed high school 28.7% elementary 12.9% were college undergraduates and 4.98% were academic degree holders.
Majority of the households were headed by male (80.7) The largest proportion of household heads were 30-39 years (27.72) followed by those 40-49 years(25.04) Females were more likely to head a smaller household while male larger ones. The household size with the largest proportion of household headed b ales was four persons (21.33) while two persons for the females (20.44).
Majority of the people were Filipinos (94.49). The remaining 2.87% were either Bahraini, Americans, British, Chinese.
Of the total population in Olongapo City 2,145 persons (1.1) had disability. Low vision constituted the highest proportion of persons with disability (42.24) followed by mental illness (10.07) mental retardation (9.18) and partial blindness (5.45).
Among persons with low vision the proportion was higher for females (58.94) than males (41.06). On the contrary the proportion of those with mental illness was higher for males (57.41) than female (42.59).
Of the household population 10 years and over 98.74% were literate. Literacy rate for males (98.71) and females (98.76) posted almost the same proportion.
The proportion of literate people was in the age group 20-24 years (99.58) and 25-29 (99.49).
There were 33.29 ever married women 15-49 years old in Olongapo City about 10-50% of the m got married at the age of 20 years, 8.98% at 18 years 8.2% at 19 years. The average age at first marriage was recorded at 22 years.
Of the total ever married women 15 to 49 years old 22.95% had two children, 19.65% had one child and 15.82% had three children. The average number of children to an ever married woman was two.
The number of overseas workers decreased from 3,872 in 1995 to 3468 in 2000. There was a higher proportion of males 968.28) than females (31.72) among overseas workers. The highest proportion of overseas workers were 45 years and above (26.1).
More than one in three (35.58) overseas workers attended or completed high school 21.97% were college undergraduates and 11.68% were academic degree holders. HOUSEHOLD CHARACTERISTICS Electricity was the common fuel (90.24) used for lighting by households. About 6.57% used kerosene and the remaining 3.19% used other types of fuel for lighting by households.
31
Households got water from own use faucet connected to a community water system (66.17). Other sources were shared faucet also connected to a community water system (17.33), spring ,lake, river, rain (7.26) and tube/pipe deep well shared with other households.
About 75.65% of household used LPG for cooking. This proportion was higher by 18.51% points than the figure ten years ago. On the contrary, the proportion of households that used kerosene (11.54), electricity (4.73), wood (4.49), all decreased after ten years.
Three out of four households had an exclusive use of water sealed sewers/septic tank. 74.14% household that had water sealed sewer/septic tank shared with other households (12.58) and water sealed other depository used exclusively by the household (4.75) followed. About 0.67 % of households still had no toilet facility at all.
The most common manner of garbage disposal was by truck collection (86.45) Burning (7.54) and feeding to animals (2.86) followed. The remaining 3.14% of household either had their garbage buried , fed to animals, composted, dumped in individual pit or used other types of garbage disposal.
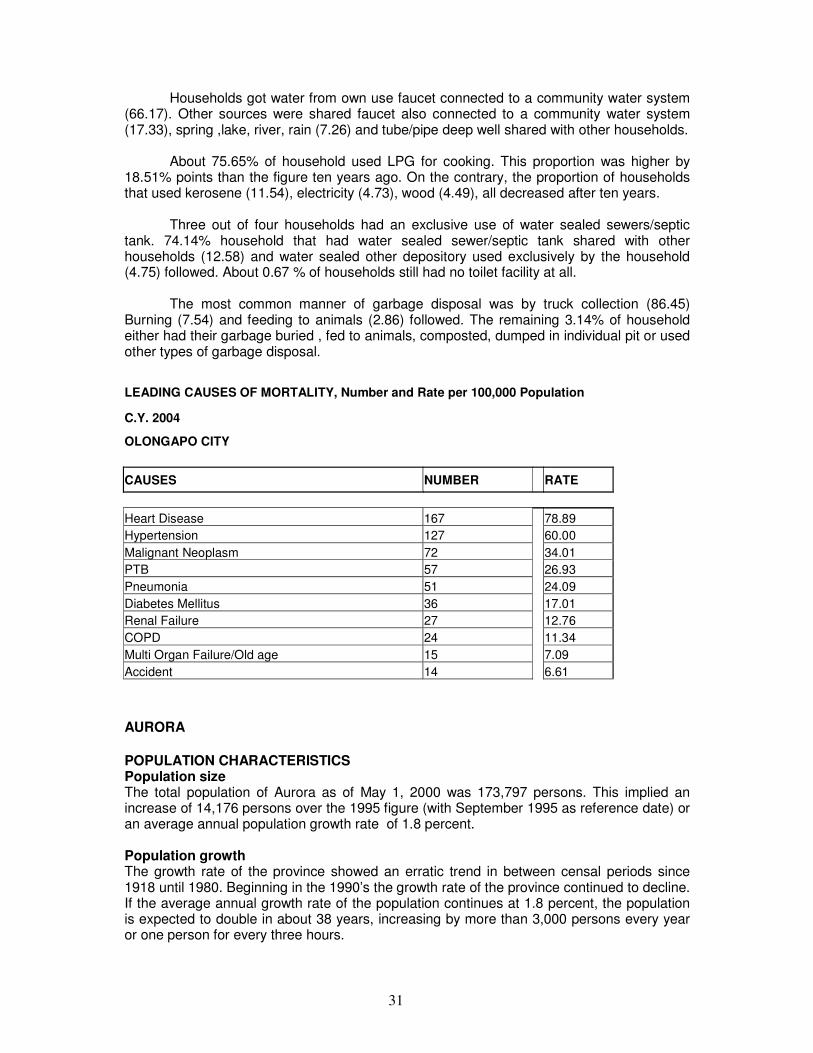
LEADING CAUSES OF MORTALITY, Number and Rate per 100,000 Population
C.Y. 2004
OLONGAPO CITY
CAUSES NUMBER RATE
Heart Disease 167 78.89
Hypertension 127 60.00
Malignant Neoplasm 72 34.01
PTB 57 26.93
Pneumonia 51 24.09
Diabetes Mellitus 36 17.01
Renal Failure 27 12.76
COPD 24 11.34
Multi Organ Failure/Old age 15 7.09
Accident 14 6.61
AURORA
POPULATION CHARACTERISTICS Population size The total population of Aurora as of May 1, 2000 was 173,797 persons. This implied an increase of 14,176 persons over the 1995 figure (with September 1995 as reference date) or an average annual population growth rate of 1.8 percent. Population growth The growth rate of the province showed an erratic trend in between censal periods since 1918 until 1980. Beginning in the 1990’s the growth rate of the province continued to decline. If the average annual growth rate of the population continues at 1.8 percent, the population is expected to double in about 38 years, increasing by more than 3,000 persons every year or one person for every three hours.
32
Population distribution by Municipality, Aurora , 2000 Municipality Number Percent Aurora 173,797 100
Baler 29,923 17.2
Casiguran 21,459 12.4
Dilasag 14,676 8.4
Dinalungan 9,711 5.6
Dingalan 20,157 11.6
Dipaculao 23,064 13.3
Maria Aurora 33,551 19.3
San Luis 21,256 12.2 Household size
The number of household in the province rose to 35,024 household registering an increase of 3,684 households as compared to the 1995 figure. The average household size in 2000 slightly decline to five persons from 5.1 persons in 1995.
Age sex composition
There are more male than female with a sex ratio of 107 males for every 100 females slightly lower than the sex ration reported in 1995 at 108. There were more males than female in the age bracket of 0 to 64. as the age advance from 65 onwards, the females dominated the male. The overall dependency ratio is 79.8. The population of each age group decreases with increase in age resulting in a pyramidal form. Children under five years old made up 13.7% of the total population of the province lower than the percentage for the age group 5-9 years (14.2%).
Marital status
There are more married than single individuals at 48.5%. The proportion of married individuals was lower than the 1995 figure (50.9%). The proportion of widowed individuals slightly increased to 4.07 % in 2000 from 3.97% in 1995. Those who were either divorced/separated, with other marital arrangements, or unknown marital status comprised 9.2%. Among the single individuals, a higher percentage were male (56.4%) than female (43.6%). On the other hand, more female are widowed (74%) compared to male (26%). Highest grade completed
Nearly half (46.9%) of the household population five years old and over attended or completed elementary education. This is lower than the 1995 figure of 49.4%. Those who reached or completed secondary education constitute 29.7% which is higher by 2.3% as compared to the 1995 figure. Those who had post baccalaureate courses were 0.3% and those who had not completed any grade made up 4.9% lower by 2% points from that of the 1995 figures Household head
Majority of the households were headed by males (89.1%) percent wit only 10.9% headed by female. Among males, headship rate peaked at 30-39 years (31.3%) while headship rate for female was highest at 50-59 yeas (24.5%).
HOUSEHOLD CHARACTERISTICS Electricity was the common source of lighting (60%) while 36% used kerosene and
3% used other source of fuel. Tubed /pipe shallow well was the source of water supply for drinking and/or cooking (27.9%). The proportion of household whose water for drinking or cooking came from own use and shared faucet, community water system were recorded at
33
18.1% and 19.6% respectively , while 6.8% from spring, lake, river, rain, etc. Wood is utilized as fuel for cooking by 40.9%, liquefied petroleum gas (LPG) at 38.3%, and 18% used other fuel. The improper disposal of human waste leads to a public health hazard. About 30% of the households had own water sealed sewer/septic tank type toilet facility and 6.1% still had no toilet. Burning was the usual manner of garbage disposal by households (80.4%) The rest either dispose their garbage through picked up by garbage truck, dumping in individual pit, burying or other types of garbage disposal. Majority own a radio/radio cassette (65.8%) an increase of 9.3% points over the 1990 figure.
LEADING CAUSES OF MORTALITY, Number and Rate per 100,000 Population
C.Y. 2004
AURORA
CAUSES NUMBER RATE
Victim of Flood of Cataclismic Nature 124 62.20
Heart Disease 71 35.62
Chronic Degenerative Disease 58 29.09
Cancer 49 24.58
PTB 41 20.57
Pneumonia 33 16.55
Accident 28 14.05
CVD 27 13.54
Myocardial Infarction 23 11.54
Bleeding Peptic Ulcer 23 11.54
Congestive Heart Failure 23 11.54
COPD 22 11.04
LEADING CAUSES OF MORBIDITY, Number and Rate per 100,000 Population
C.Y. 2004
AURORA
CAUSES NUMBER RATE
ARI 13,479 6,761.58
HYPERTENSION 969 486.09
INFLUENZA 782 392.28
DIARRHEAS 775 388.77
PNEUMONIAS 758 380.24
WOUNDS 383 192.13
BRONCHIAL ASTHMA 293 146.98
ANEMIA 224 112.37
BRONCHITIS/BRONCHIOLITIS 215 107.85
SKIN DISEASES 171 85.78
34
BATAAN
The province is divided into two by a pass that separates the northern mountains dominated by Mt Natib at 1253 meters and the southern Mariveles mountains at 1388 meters which include Mt Samat. Population size Bataan has a total population of 557659 persons as of May 2000. This was up by 66,200 persons over the 1995 census of population results.The population translated to an average annual growth rate of 2.74 % 0.02 percentage points higher than the 2.72% growth rate during the 1990 to 1995 period. If the growth rate continues at 2.74% the population is expected to double in about 25 years.
BATAAN 557659 100
ABUCAY 31801 5.7
BAGAC 22353 4.01
BALANGA 71088 12.75
DINALUPIHAN 76145 13.65
HERMOSA 46254 8.29
LIMAY 46620 8.36
MARIVELES 85779 15.38
MORONG 21273 3.81
ORANI 52501 9.41
ORION 44067 7.9
PILAR 32368 5.8
SAMAL 27410 4.92
Household size There was an increase in the number of households from 98499 in 1995 to 113 674
in 2000. with the average household size at 4.9 persons. The overall dependency ratio is at 62 which means that for every 100 persons in the working age group 15-64 years there were 62 dependents that is 57 young dependents (0-14 years ) and 5 old dependents (65 years and above). The working age group comprises 61.6% of the population 0-14 years constituted 34.9% and 65 years and above 3.5%.
Age and sex composition
In 2000 males slightly outnumber females registering a sex ration of 100.87 males for every 100 females. The age structure followed he usual pyramid shape where children aged 4 yeas and below dominated the province with 12.19 % share to the total population and those aged 5-9 years followed at 11.63 %.
Marital status
Of the 423,747 household population 10 years old and over 42.75 % were single and 47.23% were married. Both registered a decrease from the 1995 figures (44.87% single and 48.36% married). The widowed, divorced/separated and those in other marital arrangements made up 3.83 % 1.25 % and 4.4 %. Higher proportion of males among single persons (52.84) and among those in other marital arrangements (50.31) were reported. On the other hand, females dominated the married (50.32), widowed (78.85), and divorced /separated (67.21). Highest grade completed
Of the household population five years and over 37.17 % attended or completed elementary education and 34 % high school. Those who were college undergraduates comprise 9.36% while 4.89% constituted the academic degree holders.
35
Types of disability
About 8074 persons or 1.45% of the population had disability. Low vision was the most common type of disability (46.07). Other types were mental illness (10.24), partial blindness (7.27), mental retardation (6.17), and quadriplegic (5.93).
Household head
The average number of children ever born was 2.66. The proportion of ever married women who were still childless by the end of their reproductive life (45 to 49) was 1.24%. The average age at first marriage was 22.About 12.65 % of women 15-49 years old got married before they reached the legal age of marriage (18) 72.64 % 18-29 years and 4.83% 30 years and over. The number of overseas workers in this province in 2000 was 11097 persons. This registered an increase of 666 persons from the number reported in 1995 (10431). Majority (73.15%) were males. The highest percentage of overseas workers belongs to the age group 45 years and over. 22.63% followed by those aged 30-34 years (16.3) and 35 to 39 years (15.69)
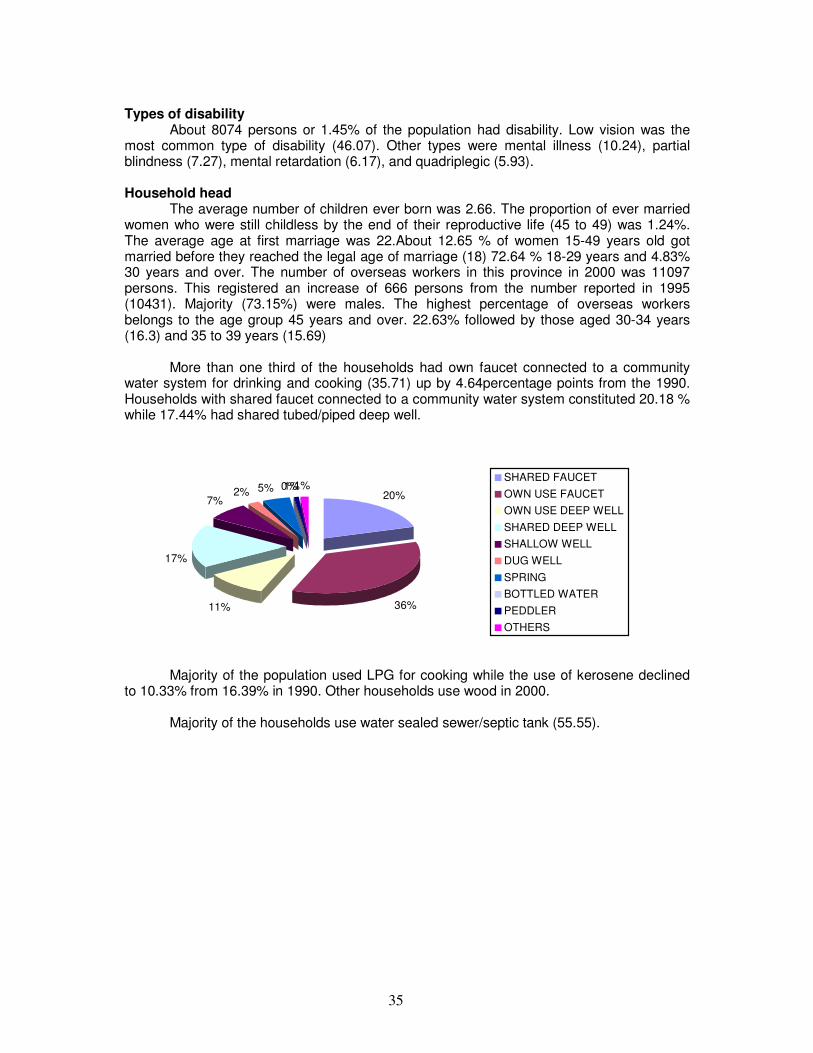
More than one third of the households had own faucet connected to a community water system for drinking and cooking (35.71) up by 4.64percentage points from the 1990. Households with shared faucet connected to a community water system constituted 20.18 % while 17.44% had shared tubed/piped deep well.
20%
36%11%
17%
7%2% 5% 0%1%1%
SHARED FAUCET
OWN USE FAUCET
OWN USE DEEP WELL
SHARED DEEP WELL
SHALLOW WELL
DUG WELL
SPRING
BOTTLED WATER
PEDDLER
OTHERS
Majority of the population used LPG for cooking while the use of kerosene declined
to 10.33% from 16.39% in 1990. Other households use wood in 2000.
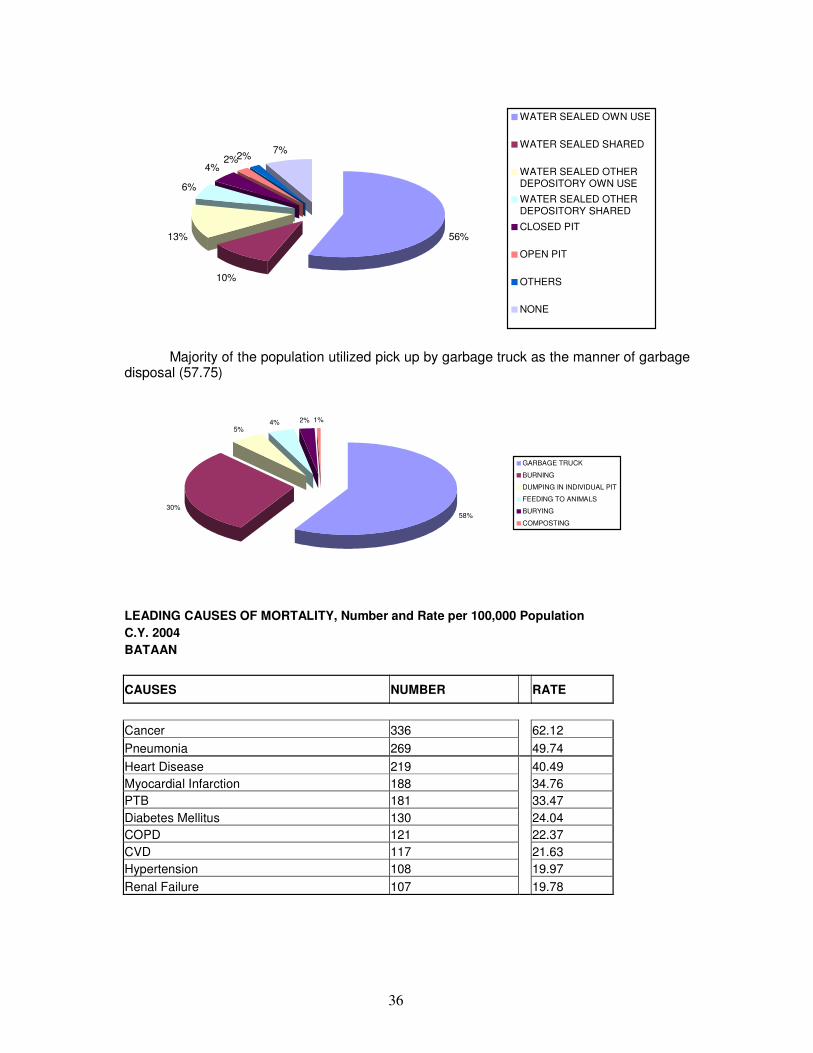
Majority of the households use water sealed sewer/septic tank (55.55).
36
56%
10%
13%
6%
4%2%2%
7%
WATER SEALED OWN USE
WATER SEALED SHARED
WATER SEALED OTHERDEPOSITORY OWN USE
WATER SEALED OTHERDEPOSITORY SHARED
CLOSED PIT
OPEN PIT
OTHERS
NONE
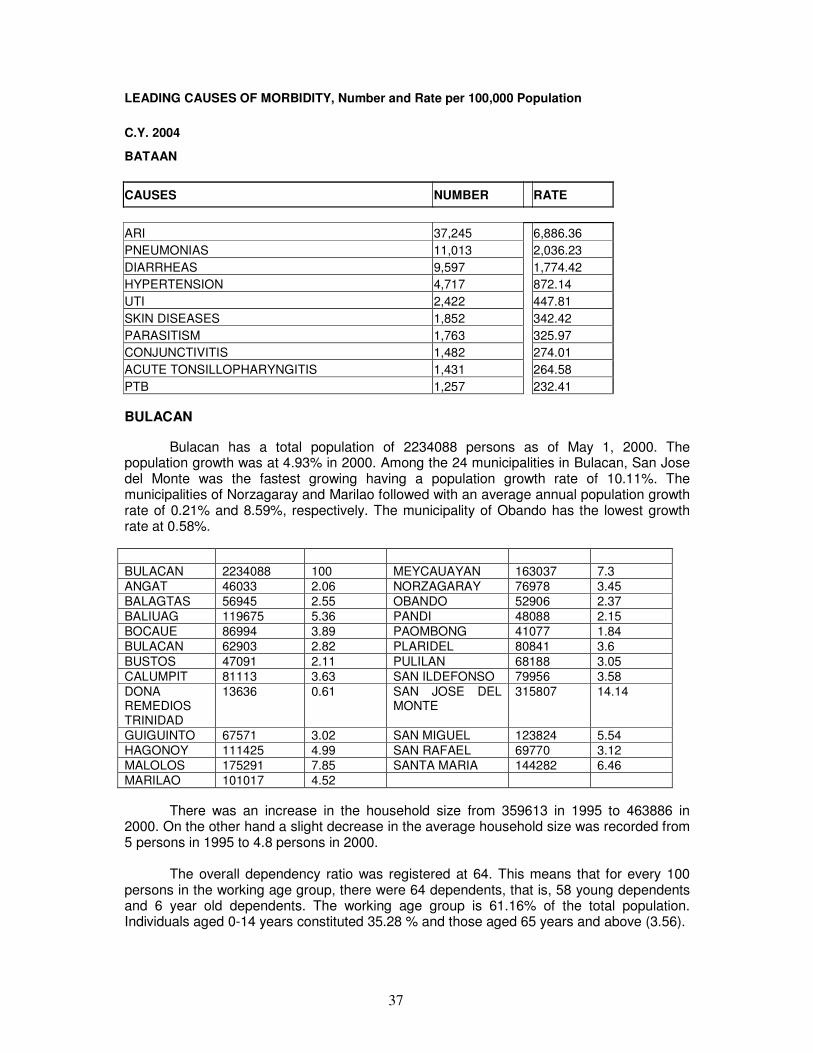
Majority of the population utilized pick up by garbage truck as the manner of garbage
disposal (57.75)
58%30%
5%4% 2% 1%
GARBAGE TRUCK
BURNING
DUMPING IN INDIVIDUAL PIT
FEEDING TO ANIMALS
BURYING
COMPOSTING
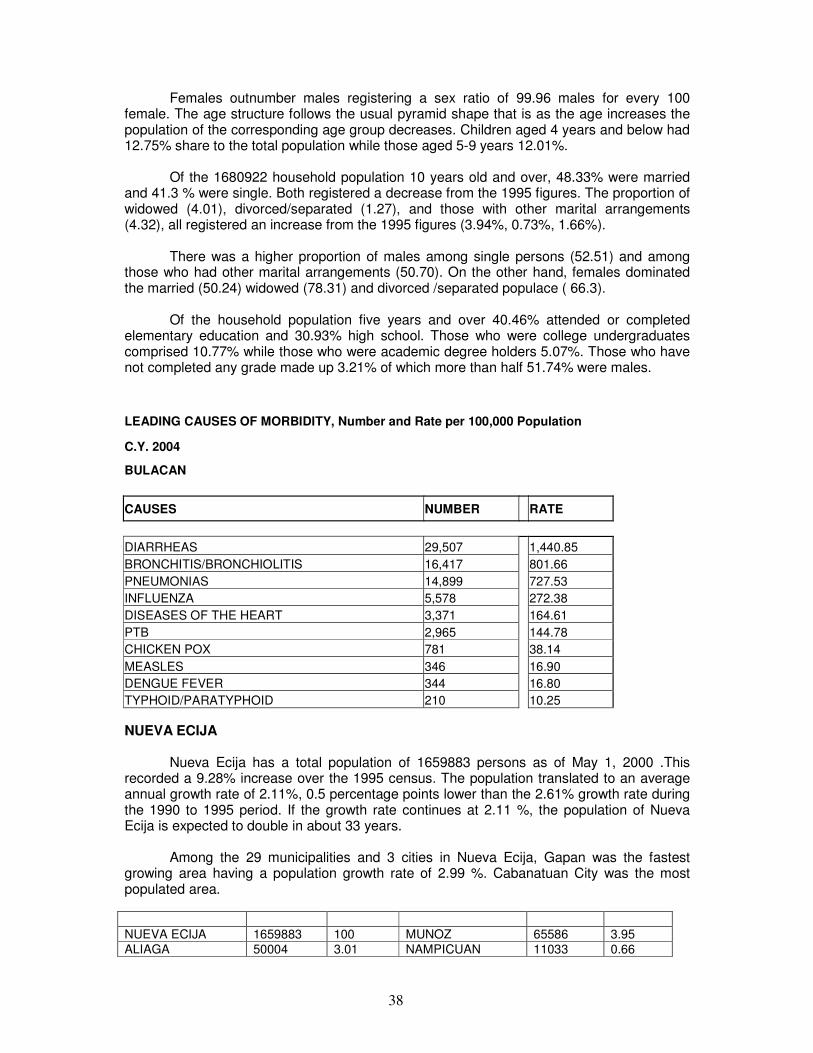
LEADING CAUSES OF MORTALITY, Number and Rate per 100,000 Population C.Y. 2004 BATAAN
CAUSES NUMBER RATE
Cancer 336 62.12
Pneumonia 269 49.74
Heart Disease 219 40.49
Myocardial Infarction 188 34.76
PTB 181 33.47
Diabetes Mellitus 130 24.04
COPD 121 22.37
CVD 117 21.63
Hypertension 108 19.97
Renal Failure 107 19.78
37
LEADING CAUSES OF MORBIDITY, Number and Rate per 100,000 Population
C.Y. 2004
BATAAN
CAUSES NUMBER RATE
ARI 37,245 6,886.36
PNEUMONIAS 11,013 2,036.23
DIARRHEAS 9,597 1,774.42
HYPERTENSION 4,717 872.14
UTI 2,422 447.81
SKIN DISEASES 1,852 342.42
PARASITISM 1,763 325.97
CONJUNCTIVITIS 1,482 274.01
ACUTE TONSILLOPHARYNGITIS 1,431 264.58
PTB 1,257 232.41
BULACAN
Bulacan has a total population of 2234088 persons as of May 1, 2000. The population growth was at 4.93% in 2000. Among the 24 municipalities in Bulacan, San Jose del Monte was the fastest growing having a population growth rate of 10.11%. The municipalities of Norzagaray and Marilao followed with an average annual population growth rate of 0.21% and 8.59%, respectively. The municipality of Obando has the lowest growth rate at 0.58%.
BULACAN 2234088 100 MEYCAUAYAN 163037 7.3
ANGAT 46033 2.06 NORZAGARAY 76978 3.45
BALAGTAS 56945 2.55 OBANDO 52906 2.37
BALIUAG 119675 5.36 PANDI 48088 2.15
BOCAUE 86994 3.89 PAOMBONG 41077 1.84
BULACAN 62903 2.82 PLARIDEL 80841 3.6
BUSTOS 47091 2.11 PULILAN 68188 3.05
CALUMPIT 81113 3.63 SAN ILDEFONSO 79956 3.58
DONA REMEDIOS TRINIDAD
13636 0.61 SAN JOSE DEL MONTE
315807 14.14
GUIGUINTO 67571 3.02 SAN MIGUEL 123824 5.54
HAGONOY 111425 4.99 SAN RAFAEL 69770 3.12
MALOLOS 175291 7.85 SANTA MARIA 144282 6.46
MARILAO 101017 4.52
There was an increase in the household size from 359613 in 1995 to 463886 in 2000. On the other hand a slight decrease in the average household size was recorded from 5 persons in 1995 to 4.8 persons in 2000.
The overall dependency ratio was registered at 64. This means that for every 100 persons in the working age group, there were 64 dependents, that is, 58 young dependents and 6 year old dependents. The working age group is 61.16% of the total population. Individuals aged 0-14 years constituted 35.28 % and those aged 65 years and above (3.56).
38
Females outnumber males registering a sex ratio of 99.96 males for every 100 female. The age structure follows the usual pyramid shape that is as the age increases the population of the corresponding age group decreases. Children aged 4 years and below had 12.75% share to the total population while those aged 5-9 years 12.01%.
Of the 1680922 household population 10 years old and over, 48.33% were married and 41.3 % were single. Both registered a decrease from the 1995 figures. The proportion of widowed (4.01), divorced/separated (1.27), and those with other marital arrangements (4.32), all registered an increase from the 1995 figures (3.94%, 0.73%, 1.66%).
There was a higher proportion of males among single persons (52.51) and among those who had other marital arrangements (50.70). On the other hand, females dominated the married (50.24) widowed (78.31) and divorced /separated populace ( 66.3).
Of the household population five years and over 40.46% attended or completed elementary education and 30.93% high school. Those who were college undergraduates comprised 10.77% while those who were academic degree holders 5.07%. Those who have not completed any grade made up 3.21% of which more than half 51.74% were males.
LEADING CAUSES OF MORBIDITY, Number and Rate per 100,000 Population
C.Y. 2004
BULACAN
CAUSES NUMBER RATE
DIARRHEAS 29,507 1,440.85
BRONCHITIS/BRONCHIOLITIS 16,417 801.66
PNEUMONIAS 14,899 727.53
INFLUENZA 5,578 272.38
DISEASES OF THE HEART 3,371 164.61
PTB 2,965 144.78
CHICKEN POX 781 38.14
MEASLES 346 16.90
DENGUE FEVER 344 16.80
TYPHOID/PARATYPHOID 210 10.25
NUEVA ECIJA
Nueva Ecija has a total population of 1659883 persons as of May 1, 2000 .This recorded a 9.28% increase over the 1995 census. The population translated to an average annual growth rate of 2.11%, 0.5 percentage points lower than the 2.61% growth rate during the 1990 to 1995 period. If the growth rate continues at 2.11 %, the population of Nueva Ecija is expected to double in about 33 years.
Among the 29 municipalities and 3 cities in Nueva Ecija, Gapan was the fastest growing area having a population growth rate of 2.99 %. Cabanatuan City was the most populated area.
NUEVA ECIJA 1659883 100 MUNOZ 65586 3.95
ALIAGA 50004 3.01 NAMPICUAN 11033 0.66
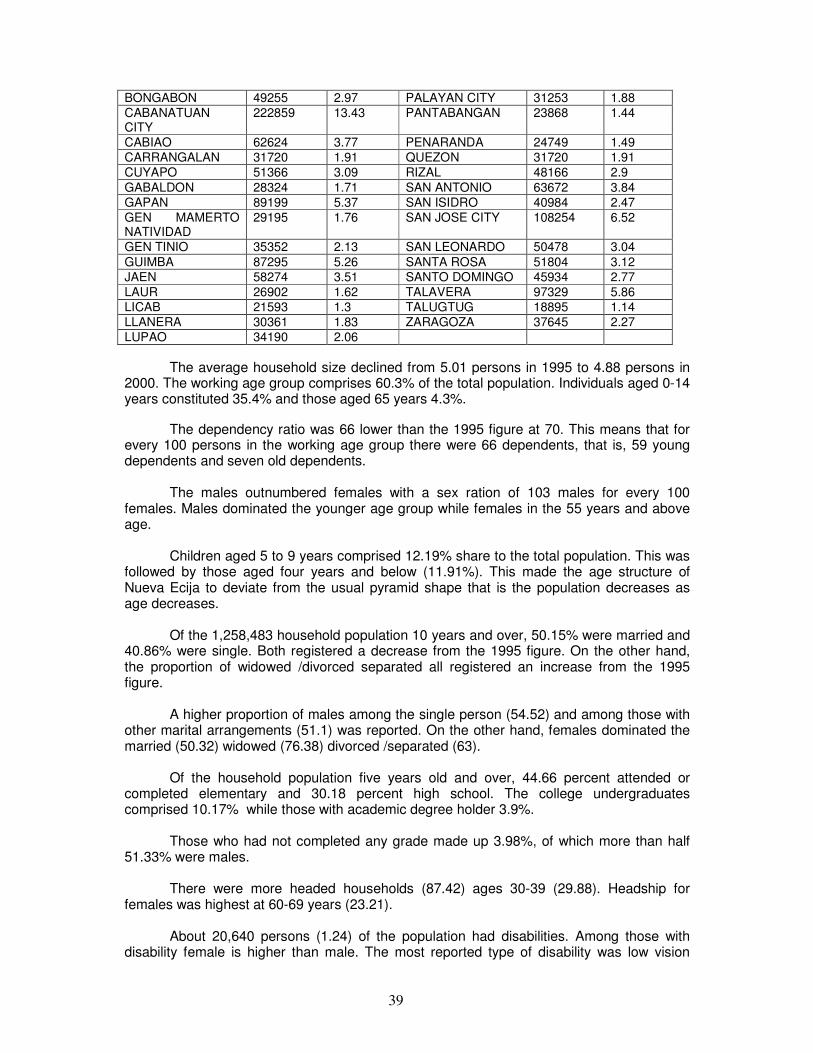
39
BONGABON 49255 2.97 PALAYAN CITY 31253 1.88
CABANATUAN CITY
222859 13.43 PANTABANGAN 23868 1.44
CABIAO 62624 3.77 PENARANDA 24749 1.49
CARRANGALAN 31720 1.91 QUEZON 31720 1.91
CUYAPO 51366 3.09 RIZAL 48166 2.9
GABALDON 28324 1.71 SAN ANTONIO 63672 3.84
GAPAN 89199 5.37 SAN ISIDRO 40984 2.47
GEN MAMERTO NATIVIDAD
29195 1.76 SAN JOSE CITY 108254 6.52
GEN TINIO 35352 2.13 SAN LEONARDO 50478 3.04
GUIMBA 87295 5.26 SANTA ROSA 51804 3.12
JAEN 58274 3.51 SANTO DOMINGO 45934 2.77
LAUR 26902 1.62 TALAVERA 97329 5.86
LICAB 21593 1.3 TALUGTUG 18895 1.14
LLANERA 30361 1.83 ZARAGOZA 37645 2.27
LUPAO 34190 2.06
The average household size declined from 5.01 persons in 1995 to 4.88 persons in 2000. The working age group comprises 60.3% of the total population. Individuals aged 0-14 years constituted 35.4% and those aged 65 years 4.3%.
The dependency ratio was 66 lower than the 1995 figure at 70. This means that for every 100 persons in the working age group there were 66 dependents, that is, 59 young dependents and seven old dependents.
The males outnumbered females with a sex ration of 103 males for every 100 females. Males dominated the younger age group while females in the 55 years and above age.
Children aged 5 to 9 years comprised 12.19% share to the total population. This was followed by those aged four years and below (11.91%). This made the age structure of Nueva Ecija to deviate from the usual pyramid shape that is the population decreases as age decreases.
Of the 1,258,483 household population 10 years and over, 50.15% were married and 40.86% were single. Both registered a decrease from the 1995 figure. On the other hand, the proportion of widowed /divorced separated all registered an increase from the 1995 figure.
A higher proportion of males among the single person (54.52) and among those with other marital arrangements (51.1) was reported. On the other hand, females dominated the married (50.32) widowed (76.38) divorced /separated (63).
Of the household population five years old and over, 44.66 percent attended or completed elementary and 30.18 percent high school. The college undergraduates comprised 10.17% while those with academic degree holder 3.9%.
Those who had not completed any grade made up 3.98%, of which more than half 51.33% were males.
There were more headed households (87.42) ages 30-39 (29.88). Headship for females was highest at 60-69 years (23.21).
About 20,640 persons (1.24) of the population had disabilities. Among those with
disability female is higher than male. The most reported type of disability was low vision
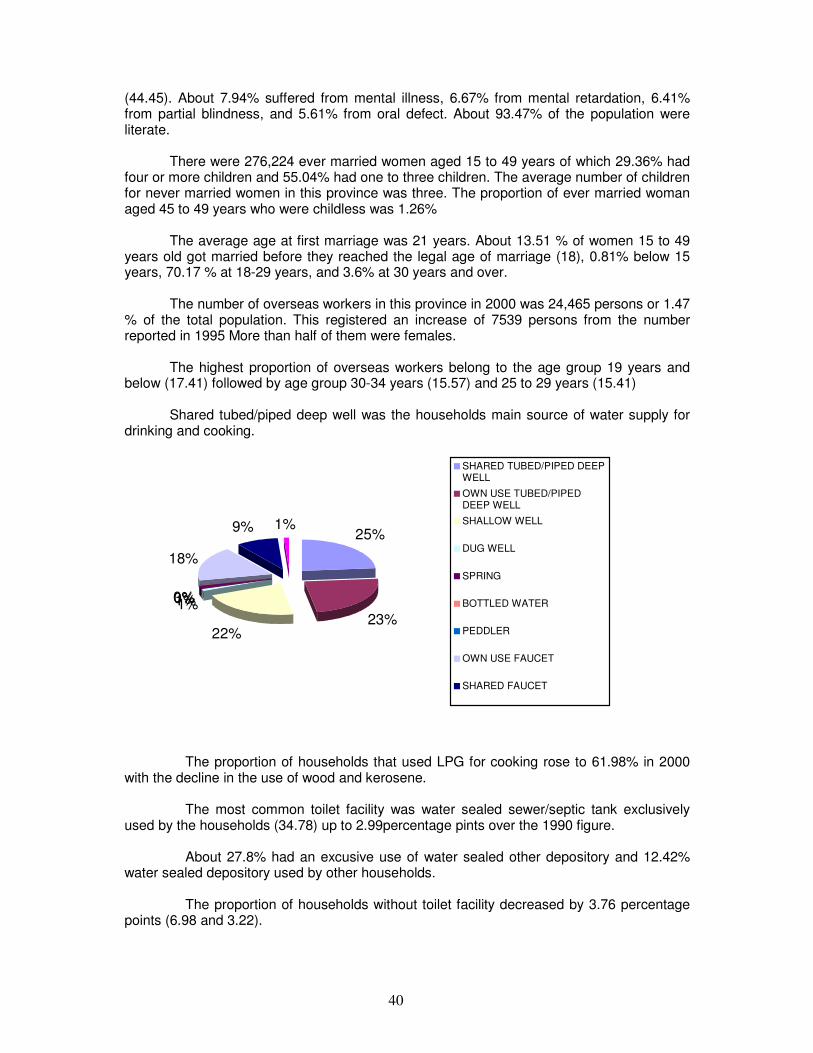
40
(44.45). About 7.94% suffered from mental illness, 6.67% from mental retardation, 6.41% from partial blindness, and 5.61% from oral defect. About 93.47% of the population were literate.
There were 276,224 ever married women aged 15 to 49 years of which 29.36% had four or more children and 55.04% had one to three children. The average number of children for never married women in this province was three. The proportion of ever married woman aged 45 to 49 years who were childless was 1.26%
The average age at first marriage was 21 years. About 13.51 % of women 15 to 49 years old got married before they reached the legal age of marriage (18), 0.81% below 15 years, 70.17 % at 18-29 years, and 3.6% at 30 years and over.
The number of overseas workers in this province in 2000 was 24,465 persons or 1.47 % of the total population. This registered an increase of 7539 persons from the number reported in 1995 More than half of them were females.
The highest proportion of overseas workers belong to the age group 19 years and below (17.41) followed by age group 30-34 years (15.57) and 25 to 29 years (15.41)
Shared tubed/piped deep well was the households main source of water supply for drinking and cooking.
25%
23%22%
1%1%0%0%
18%
9% 1%
SHARED TUBED/PIPED DEEPWELL
OWN USE TUBED/PIPEDDEEP WELL
SHALLOW WELL
DUG WELL
SPRING
BOTTLED WATER
PEDDLER
OWN USE FAUCET
SHARED FAUCET
The proportion of households that used LPG for cooking rose to 61.98% in 2000 with the decline in the use of wood and kerosene. The most common toilet facility was water sealed sewer/septic tank exclusively used by the households (34.78) up to 2.99percentage pints over the 1990 figure. About 27.8% had an excusive use of water sealed other depository and 12.42% water sealed depository used by other households. The proportion of households without toilet facility decreased by 3.76 percentage points (6.98 and 3.22).

41
7%
36%
28%
12%
10%3%1% 3%
WATER SEALEDSEWER/SEPTIC TANKSHARED
WATER SEALED USEDECLUSIVELY
WATER SELAED OTHERDEOPISTORY
WATER SEALED OTHERDEPOSITORY SHARED
CLOSED PIT
Majority of the households dispose their garbage through burning.
15%
35%41%
7% 2%0%DUMPING IN PIT
GARBAGE TRUCK
COMPOSTING
BURYING
FEEDING TO ANIMALS
OTHERS
LEADING CAUSES OF MORTALITY, Number and Rate per 100,000 Population C.Y. 2004 NUEVA ECIJA
CAUSES NUMBER RATE
CVD 596 48.93
Heart Disease 507 41.62
Cancer 306 25.12
Pneumonia 284 23.32
PTB 144 11.82
COPD 121 9.93
Accident 108 8.87
Diabetes Mellitus 75 6.16
Renal Failure 33 2.71
Septicemia 31 2.54
LEADING CAUSES OF MORBIDITY, Number and Rate per 100,000 Population
C.Y. 2004
NUEVA ECIJA
CAUSES NUMBER RATE

42
ARI 27,382 2,247.96
DIARRHEAS 4,447 365.08
HYPERTENSION 4,111 337.50
BRONCHITIS/BRONCHIOLITIS 3,306 271.41
PNEUMONIAS 2,053 168.54
PARASITISM 1,560 128.07
SKIN DISEASES 1,105 90.72
INFLUENZA 1,000 82.10
UTI 933 76.60
ACCIDENTS 690 56.65
LEADING CAUSES OF MORTALITY, Number and Rate per 100,000 Population C.Y. 2004 CABANATUAN CITY
CAUSES NUMBER RATE
Cancer 183 71.62
Heart Disease 156 61.05
Hypertension 142 55.57
Diabetes Mellitus 120 46.96
Myocardial Infarction 107 41.88
PTB 84 32.87
Malnutrition 73 28.57
Pneumonia 64 25.05
COPD 54 21.13
LEADING CAUSES OF MORTALITY, Number and Rate per 100,000 Population C.Y. 2004 GAPAN CITY
CAUSES NUMBER RATE
Pneumonia 56 64.39
Heart Disease 35 40.24
Cancer 30 34.49
Victim of Flood of Cataclismic Nature 15 17.25
Hypertension 14 16.10
PTB 13 14.95
Accident 8 9.20
Diabetes Mellitus 7 8.05
Asphyxia 6 6.90
Renal Failure 3 3.45
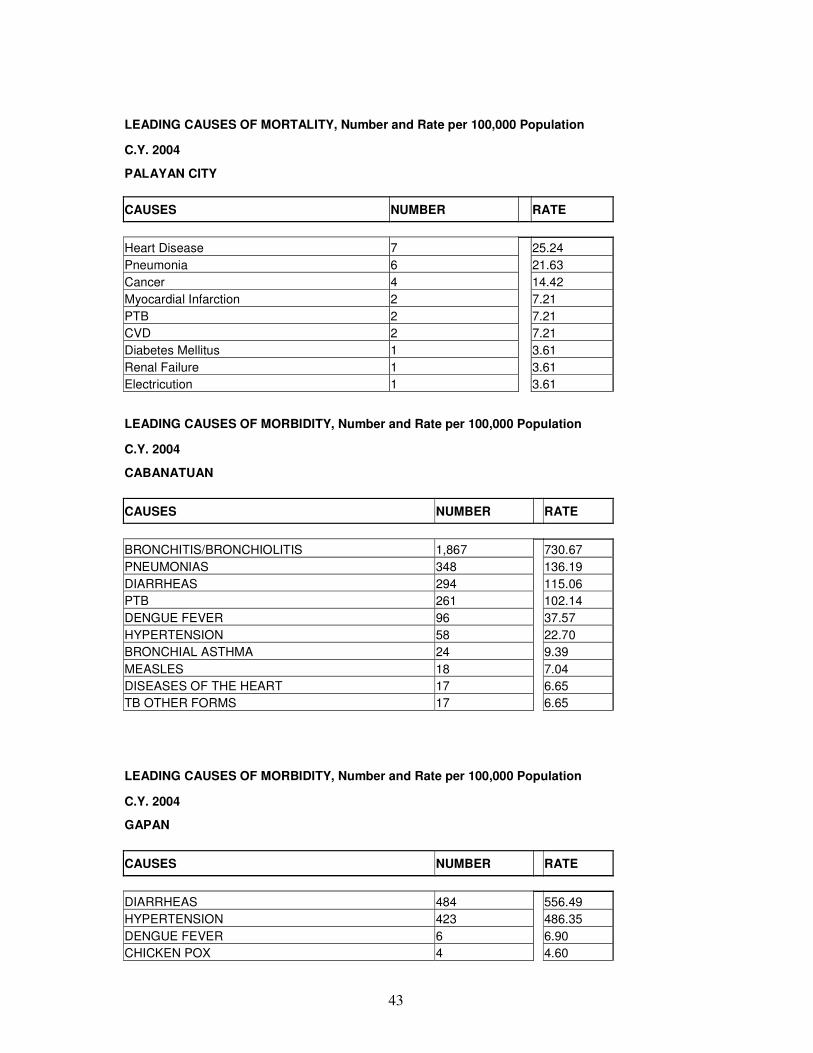
43
LEADING CAUSES OF MORTALITY, Number and Rate per 100,000 Population
C.Y. 2004
PALAYAN CITY
CAUSES NUMBER RATE
Heart Disease 7 25.24
Pneumonia 6 21.63
Cancer 4 14.42
Myocardial Infarction 2 7.21
PTB 2 7.21
CVD 2 7.21
Diabetes Mellitus 1 3.61
Renal Failure 1 3.61
Electricution 1 3.61
LEADING CAUSES OF MORBIDITY, Number and Rate per 100,000 Population
C.Y. 2004
CABANATUAN
CAUSES NUMBER RATE
BRONCHITIS/BRONCHIOLITIS 1,867 730.67
PNEUMONIAS 348 136.19
DIARRHEAS 294 115.06
PTB 261 102.14
DENGUE FEVER 96 37.57
HYPERTENSION 58 22.70
BRONCHIAL ASTHMA 24 9.39
MEASLES 18 7.04
DISEASES OF THE HEART 17 6.65
TB OTHER FORMS 17 6.65
LEADING CAUSES OF MORBIDITY, Number and Rate per 100,000 Population
C.Y. 2004
GAPAN
CAUSES NUMBER RATE
DIARRHEAS 484 556.49
HYPERTENSION 423 486.35
DENGUE FEVER 6 6.90
CHICKEN POX 4 4.60
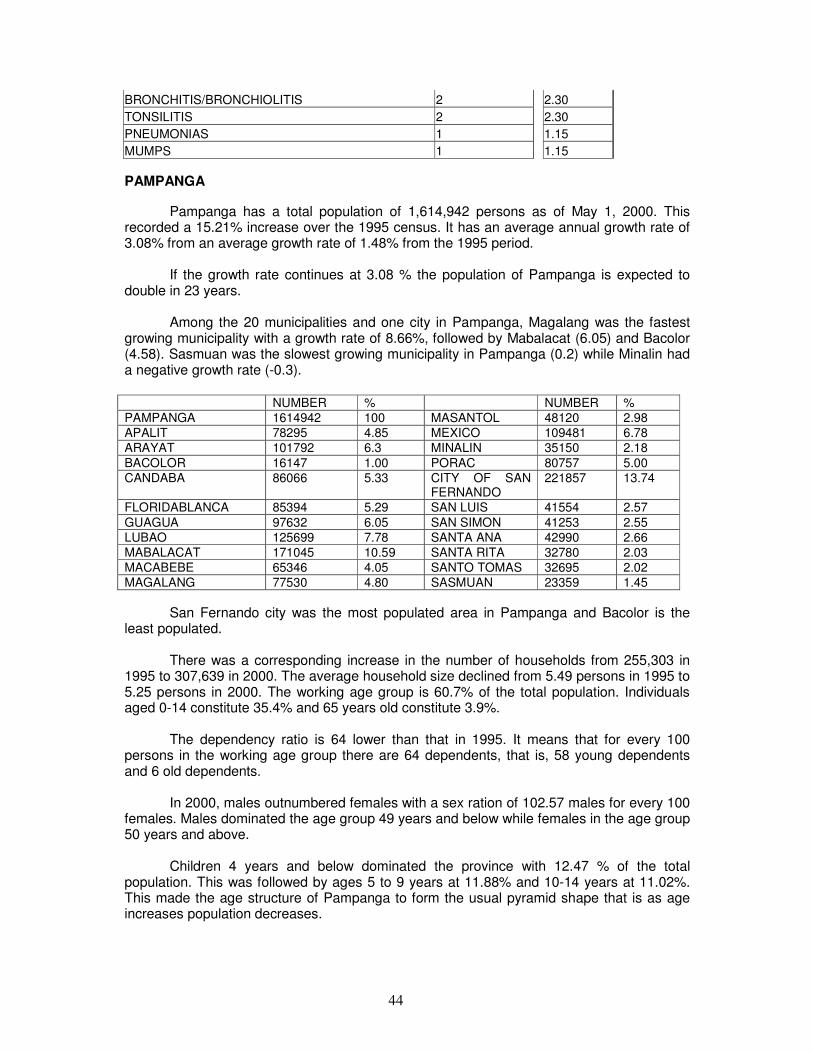
44
BRONCHITIS/BRONCHIOLITIS 2 2.30
TONSILITIS 2 2.30
PNEUMONIAS 1 1.15
MUMPS 1 1.15
PAMPANGA
Pampanga has a total population of 1,614,942 persons as of May 1, 2000. This recorded a 15.21% increase over the 1995 census. It has an average annual growth rate of 3.08% from an average growth rate of 1.48% from the 1995 period.
If the growth rate continues at 3.08 % the population of Pampanga is expected to double in 23 years.
Among the 20 municipalities and one city in Pampanga, Magalang was the fastest growing municipality with a growth rate of 8.66%, followed by Mabalacat (6.05) and Bacolor (4.58). Sasmuan was the slowest growing municipality in Pampanga (0.2) while Minalin had a negative growth rate (-0.3).
NUMBER % NUMBER %
PAMPANGA 1614942 100 MASANTOL 48120 2.98
APALIT 78295 4.85 MEXICO 109481 6.78
ARAYAT 101792 6.3 MINALIN 35150 2.18
BACOLOR 16147 1.00 PORAC 80757 5.00
CANDABA
86066 5.33 CITY OF SAN FERNANDO
221857 13.74
FLORIDABLANCA 85394 5.29 SAN LUIS 41554 2.57
GUAGUA 97632 6.05 SAN SIMON 41253 2.55
LUBAO 125699 7.78 SANTA ANA 42990 2.66
MABALACAT 171045 10.59 SANTA RITA 32780 2.03
MACABEBE 65346 4.05 SANTO TOMAS 32695 2.02
MAGALANG 77530 4.80 SASMUAN 23359 1.45
San Fernando city was the most populated area in Pampanga and Bacolor is the least populated.
There was a corresponding increase in the number of households from 255,303 in 1995 to 307,639 in 2000. The average household size declined from 5.49 persons in 1995 to 5.25 persons in 2000. The working age group is 60.7% of the total population. Individuals aged 0-14 constitute 35.4% and 65 years old constitute 3.9%.
The dependency ratio is 64 lower than that in 1995. It means that for every 100 persons in the working age group there are 64 dependents, that is, 58 young dependents and 6 old dependents.
In 2000, males outnumbered females with a sex ration of 102.57 males for every 100 females. Males dominated the age group 49 years and below while females in the age group 50 years and above.
Children 4 years and below dominated the province with 12.47 % of the total population. This was followed by ages 5 to 9 years at 11.88% and 10-14 years at 11.02%. This made the age structure of Pampanga to form the usual pyramid shape that is as age increases population decreases.
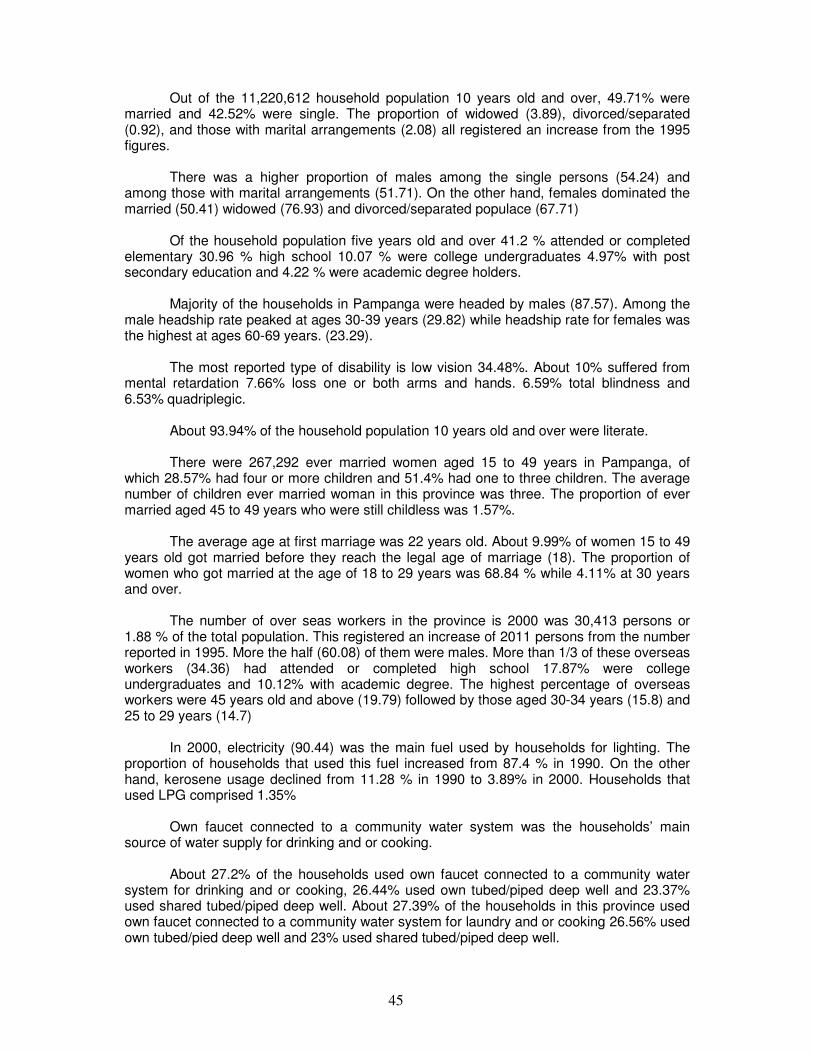
45
Out of the 11,220,612 household population 10 years old and over, 49.71% were married and 42.52% were single. The proportion of widowed (3.89), divorced/separated (0.92), and those with marital arrangements (2.08) all registered an increase from the 1995 figures.
There was a higher proportion of males among the single persons (54.24) and among those with marital arrangements (51.71). On the other hand, females dominated the married (50.41) widowed (76.93) and divorced/separated populace (67.71)
Of the household population five years old and over 41.2 % attended or completed elementary 30.96 % high school 10.07 % were college undergraduates 4.97% with post secondary education and 4.22 % were academic degree holders.
Majority of the households in Pampanga were headed by males (87.57). Among the male headship rate peaked at ages 30-39 years (29.82) while headship rate for females was the highest at ages 60-69 years. (23.29).
The most reported type of disability is low vision 34.48%. About 10% suffered from mental retardation 7.66% loss one or both arms and hands. 6.59% total blindness and 6.53% quadriplegic.
About 93.94% of the household population 10 years old and over were literate.
There were 267,292 ever married women aged 15 to 49 years in Pampanga, of which 28.57% had four or more children and 51.4% had one to three children. The average number of children ever married woman in this province was three. The proportion of ever married aged 45 to 49 years who were still childless was 1.57%.
The average age at first marriage was 22 years old. About 9.99% of women 15 to 49 years old got married before they reach the legal age of marriage (18). The proportion of women who got married at the age of 18 to 29 years was 68.84 % while 4.11% at 30 years and over.
The number of over seas workers in the province is 2000 was 30,413 persons or 1.88 % of the total population. This registered an increase of 2011 persons from the number reported in 1995. More the half (60.08) of them were males. More than 1/3 of these overseas workers (34.36) had attended or completed high school 17.87% were college undergraduates and 10.12% with academic degree. The highest percentage of overseas workers were 45 years old and above (19.79) followed by those aged 30-34 years (15.8) and 25 to 29 years (14.7)
In 2000, electricity (90.44) was the main fuel used by households for lighting. The proportion of households that used this fuel increased from 87.4 % in 1990. On the other hand, kerosene usage declined from 11.28 % in 1990 to 3.89% in 2000. Households that used LPG comprised 1.35%
Own faucet connected to a community water system was the households’ main source of water supply for drinking and or cooking.
About 27.2% of the households used own faucet connected to a community water system for drinking and or cooking, 26.44% used own tubed/piped deep well and 23.37% used shared tubed/piped deep well. About 27.39% of the households in this province used own faucet connected to a community water system for laundry and or cooking 26.56% used own tubed/pied deep well and 23% used shared tubed/piped deep well.
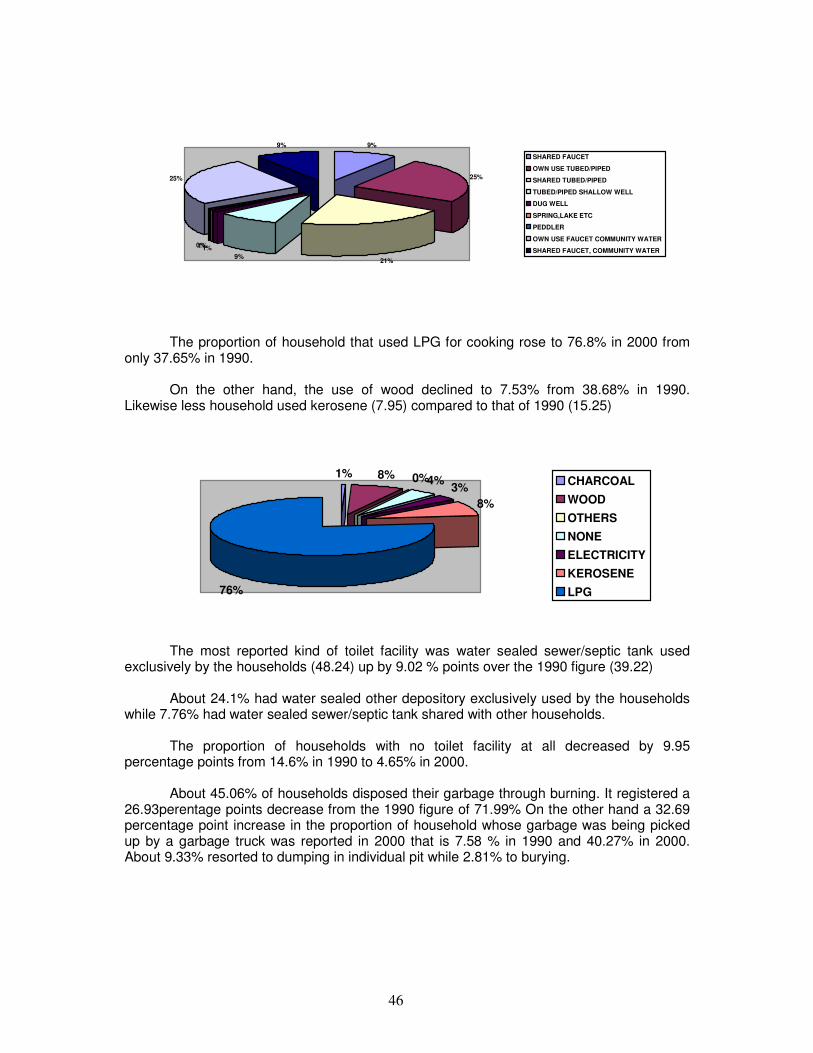
46
9%
25%
21%9%
1%1%0%
25%
9%
SHARED FAUCET
OWN USE TUBED/PIPED
SHARED TUBED/PIPED
TUBED/PIPED SHALLOW WELL
DUG WELL
SPRING,LAKE ETC
PEDDLER
OWN USE FAUCET COMMUNITY WATER
SHARED FAUCET, COMMUNITY WATER
The proportion of household that used LPG for cooking rose to 76.8% in 2000 from only 37.65% in 1990.
On the other hand, the use of wood declined to 7.53% from 38.68% in 1990. Likewise less household used kerosene (7.95) compared to that of 1990 (15.25)
1% 8% 0%4%3%
8%
76%
CHARCOAL
WOOD
OTHERS
NONE
ELECTRICITY
KEROSENE
LPG
The most reported kind of toilet facility was water sealed sewer/septic tank used
exclusively by the households (48.24) up by 9.02 % points over the 1990 figure (39.22)
About 24.1% had water sealed other depository exclusively used by the households while 7.76% had water sealed sewer/septic tank shared with other households.
The proportion of households with no toilet facility at all decreased by 9.95 percentage points from 14.6% in 1990 to 4.65% in 2000.
About 45.06% of households disposed their garbage through burning. It registered a 26.93perentage points decrease from the 1990 figure of 71.99% On the other hand a 32.69 percentage point increase in the proportion of household whose garbage was being picked up by a garbage truck was reported in 2000 that is 7.58 % in 1990 and 40.27% in 2000. About 9.33% resorted to dumping in individual pit while 2.81% to burying.

47
40%
9%
45%
2% 3%0%1%
PICKED UP BY GARBAGETRUCK
DUMPING IN INIVIDUAL PIT
BURNING
COMPOSTING
BURYING
FEEDING TO ANIMALS
LEADING CAUSES OF MORTALITY, Number and Rate per 100,000 Population C.Y. 2004 PAMPANGA
CAUSES NUMBER RATE
Heart Disease 2,175 133.25
Cancer 795 48.71
Pneumonia 341 20.89
Renal Failure 221 13.54
Diabetes Mellitus 200 12.25
PTB 190 11.64
Accident 140 8.58
COPD 61 3.74
Septicemia 53 3.25
Asphyxia 43 2.63
LEADING CAUSES OF MORBIDITY, Number and Rate per 100,000 Population
C.Y. 2004
PAMPANGA
CAUSES NUMBER RATE
ARI 27,536 1,687.02
DIARRHEAS 16,416 1,005.74
HYPERTENSION 16,048 983.20
PNEUMONIAS 10,180 623.69
BRONCHITIS/BRONCHIOLITIS 3,434 210.39
SKIN DISEASES 3,222 197.40
INFLUENZA 2,454 150.35
PTB 2,281 139.75
DISEASES OF THE HEART 1,731 106.05
CHICKEN POX 735 45.03
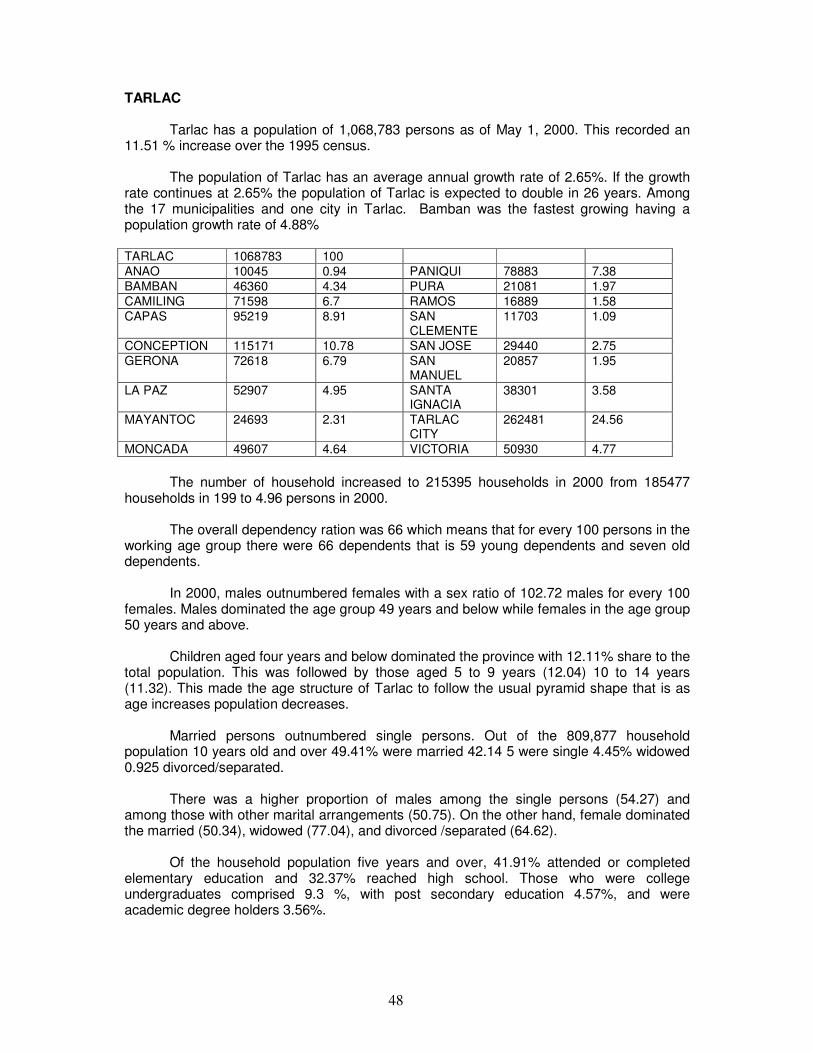
48
TARLAC
Tarlac has a population of 1,068,783 persons as of May 1, 2000. This recorded an 11.51 % increase over the 1995 census.
The population of Tarlac has an average annual growth rate of 2.65%. If the growth rate continues at 2.65% the population of Tarlac is expected to double in 26 years. Among the 17 municipalities and one city in Tarlac. Bamban was the fastest growing having a population growth rate of 4.88% TARLAC 1068783 100
ANAO 10045 0.94 PANIQUI 78883 7.38
BAMBAN 46360 4.34 PURA 21081 1.97
CAMILING 71598 6.7 RAMOS 16889 1.58
CAPAS 95219 8.91 SAN CLEMENTE
11703 1.09
CONCEPTION 115171 10.78 SAN JOSE 29440 2.75
GERONA 72618 6.79 SAN MANUEL
20857 1.95
LA PAZ 52907 4.95 SANTA IGNACIA
38301 3.58
MAYANTOC 24693 2.31 TARLAC CITY
262481 24.56
MONCADA 49607 4.64 VICTORIA 50930 4.77
The number of household increased to 215395 households in 2000 from 185477
households in 199 to 4.96 persons in 2000.
The overall dependency ration was 66 which means that for every 100 persons in the working age group there were 66 dependents that is 59 young dependents and seven old dependents.
In 2000, males outnumbered females with a sex ratio of 102.72 males for every 100 females. Males dominated the age group 49 years and below while females in the age group 50 years and above.
Children aged four years and below dominated the province with 12.11% share to the total population. This was followed by those aged 5 to 9 years (12.04) 10 to 14 years (11.32). This made the age structure of Tarlac to follow the usual pyramid shape that is as age increases population decreases.
Married persons outnumbered single persons. Out of the 809,877 household population 10 years old and over 49.41% were married 42.14 5 were single 4.45% widowed 0.925 divorced/separated.
There was a higher proportion of males among the single persons (54.27) and among those with other marital arrangements (50.75). On the other hand, female dominated the married (50.34), widowed (77.04), and divorced /separated (64.62).
Of the household population five years and over, 41.91% attended or completed elementary education and 32.37% reached high school. Those who were college undergraduates comprised 9.3 %, with post secondary education 4.57%, and were academic degree holders 3.56%.
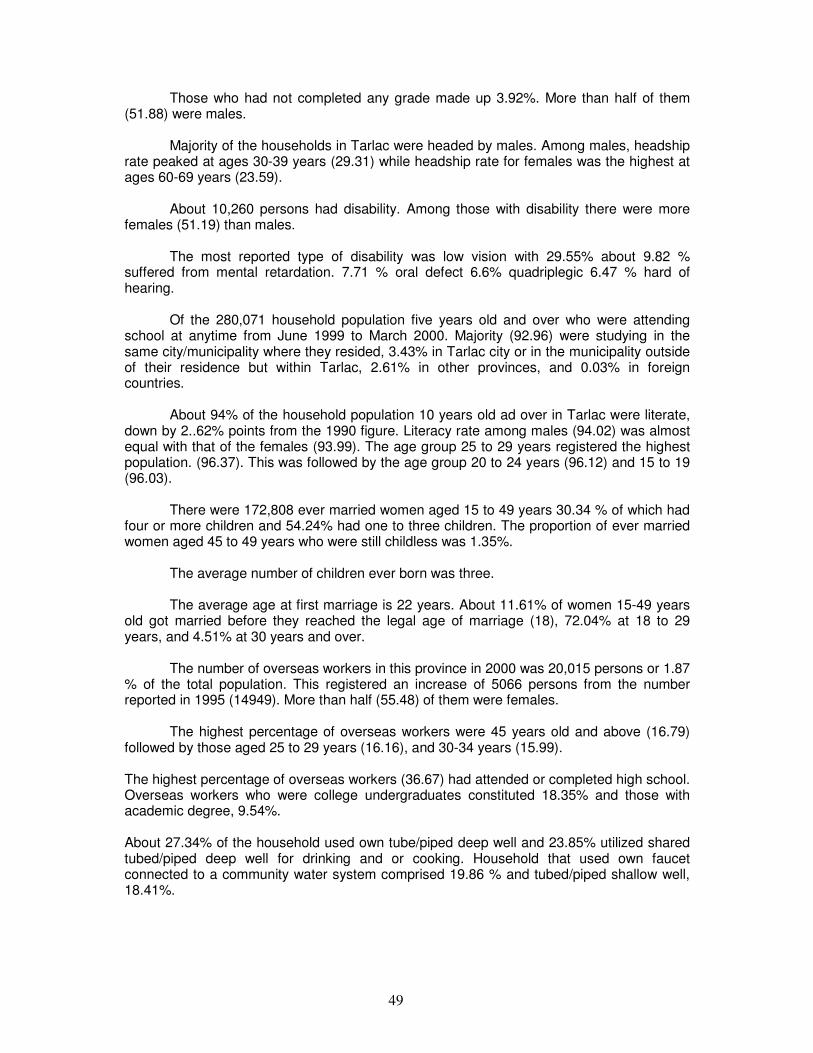
49
Those who had not completed any grade made up 3.92%. More than half of them (51.88) were males.
Majority of the households in Tarlac were headed by males. Among males, headship rate peaked at ages 30-39 years (29.31) while headship rate for females was the highest at ages 60-69 years (23.59).
About 10,260 persons had disability. Among those with disability there were more females (51.19) than males.
The most reported type of disability was low vision with 29.55% about 9.82 % suffered from mental retardation. 7.71 % oral defect 6.6% quadriplegic 6.47 % hard of hearing.
Of the 280,071 household population five years old and over who were attending school at anytime from June 1999 to March 2000. Majority (92.96) were studying in the same city/municipality where they resided, 3.43% in Tarlac city or in the municipality outside of their residence but within Tarlac, 2.61% in other provinces, and 0.03% in foreign countries.
About 94% of the household population 10 years old ad over in Tarlac were literate, down by 2..62% points from the 1990 figure. Literacy rate among males (94.02) was almost equal with that of the females (93.99). The age group 25 to 29 years registered the highest population. (96.37). This was followed by the age group 20 to 24 years (96.12) and 15 to 19 (96.03).
There were 172,808 ever married women aged 15 to 49 years 30.34 % of which had four or more children and 54.24% had one to three children. The proportion of ever married women aged 45 to 49 years who were still childless was 1.35%.
The average number of children ever born was three.
The average age at first marriage is 22 years. About 11.61% of women 15-49 years old got married before they reached the legal age of marriage (18), 72.04% at 18 to 29 years, and 4.51% at 30 years and over.
The number of overseas workers in this province in 2000 was 20,015 persons or 1.87 % of the total population. This registered an increase of 5066 persons from the number reported in 1995 (14949). More than half (55.48) of them were females.
The highest percentage of overseas workers were 45 years old and above (16.79) followed by those aged 25 to 29 years (16.16), and 30-34 years (15.99). The highest percentage of overseas workers (36.67) had attended or completed high school. Overseas workers who were college undergraduates constituted 18.35% and those with academic degree, 9.54%. About 27.34% of the household used own tube/piped deep well and 23.85% utilized shared tubed/piped deep well for drinking and or cooking. Household that used own faucet connected to a community water system comprised 19.86 % and tubed/piped shallow well, 18.41%.
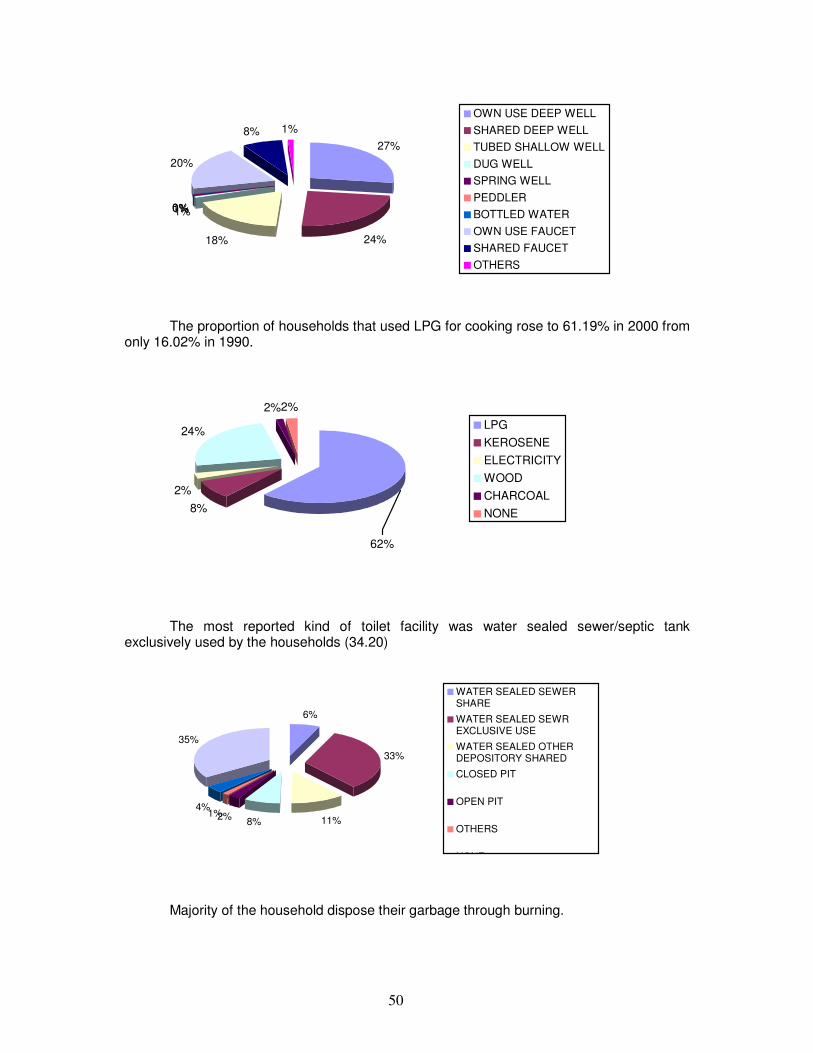
50
27%
24%18%
1%1%0%0%
20%
8% 1%
OWN USE DEEP WELL
SHARED DEEP WELL
TUBED SHALLOW WELL
DUG WELL
SPRING WELL
PEDDLER
BOTTLED WATER
OWN USE FAUCET
SHARED FAUCET
OTHERS
The proportion of households that used LPG for cooking rose to 61.19% in 2000 from only 16.02% in 1990.
8%
2%
24%
2%2%
62%
LPG
KEROSENE
ELECTRICITY
WOOD
CHARCOAL
NONE
The most reported kind of toilet facility was water sealed sewer/septic tank exclusively used by the households (34.20)
6%
33%
11%8%2%1%
4%
35%
WATER SEALED SEWERSHARE
WATER SEALED SEWREXCLUSIVE USE
WATER SEALED OTHERDEPOSITORY SHARED
CLOSED PIT
OPEN PIT
OTHERS
NONE
Majority of the household dispose their garbage through burning.
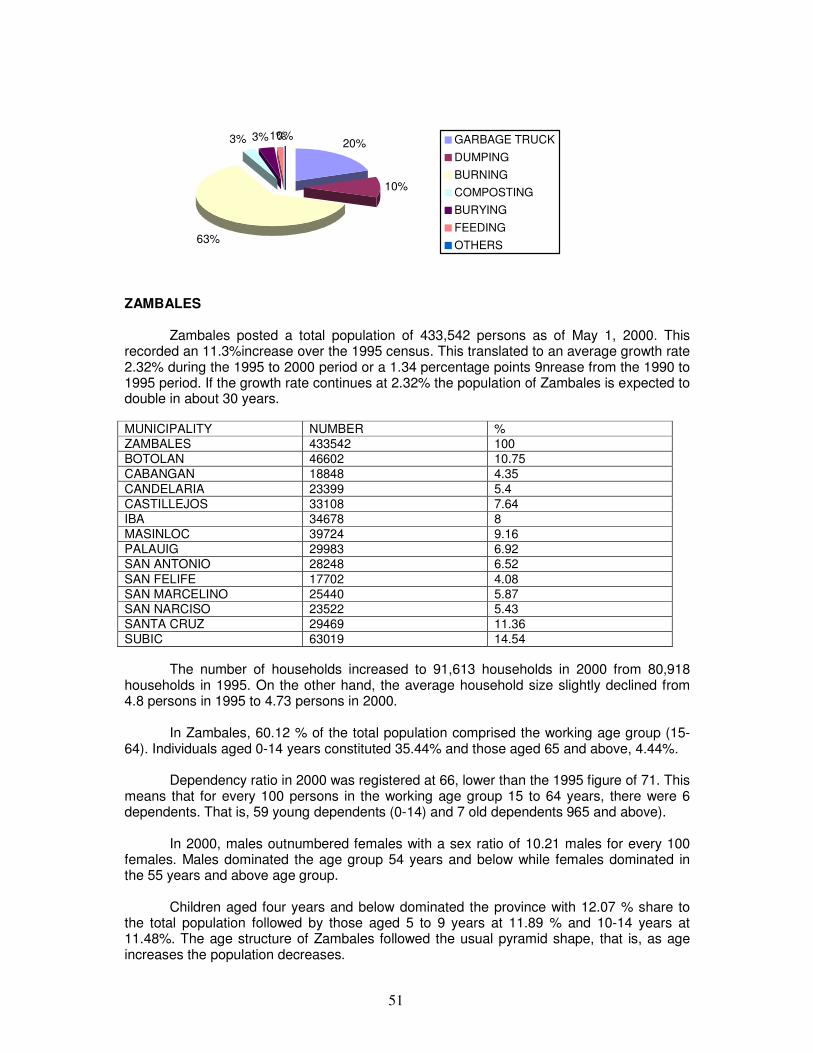
51
20%
10%
63%
3% 3%1%0% GARBAGE TRUCK
DUMPING
BURNING
COMPOSTING
BURYING
FEEDING
OTHERS
ZAMBALES
Zambales posted a total population of 433,542 persons as of May 1, 2000. This recorded an 11.3%increase over the 1995 census. This translated to an average growth rate 2.32% during the 1995 to 2000 period or a 1.34 percentage points 9nrease from the 1990 to 1995 period. If the growth rate continues at 2.32% the population of Zambales is expected to double in about 30 years.
MUNICIPALITY NUMBER %
ZAMBALES 433542 100
BOTOLAN 46602 10.75
CABANGAN 18848 4.35
CANDELARIA 23399 5.4
CASTILLEJOS 33108 7.64
IBA 34678 8
MASINLOC 39724 9.16
PALAUIG 29983 6.92
SAN ANTONIO 28248 6.52
SAN FELIFE 17702 4.08
SAN MARCELINO 25440 5.87 SAN NARCISO 23522 5.43
SANTA CRUZ 29469 11.36
SUBIC 63019 14.54
The number of households increased to 91,613 households in 2000 from 80,918 households in 1995. On the other hand, the average household size slightly declined from 4.8 persons in 1995 to 4.73 persons in 2000.
In Zambales, 60.12 % of the total population comprised the working age group (15-64). Individuals aged 0-14 years constituted 35.44% and those aged 65 and above, 4.44%.
Dependency ratio in 2000 was registered at 66, lower than the 1995 figure of 71. This means that for every 100 persons in the working age group 15 to 64 years, there were 6 dependents. That is, 59 young dependents (0-14) and 7 old dependents 965 and above).
In 2000, males outnumbered females with a sex ratio of 10.21 males for every 100 females. Males dominated the age group 54 years and below while females dominated in the 55 years and above age group.
Children aged four years and below dominated the province with 12.07 % share to the total population followed by those aged 5 to 9 years at 11.89 % and 10-14 years at 11.48%. The age structure of Zambales followed the usual pyramid shape, that is, as age increases the population decreases.
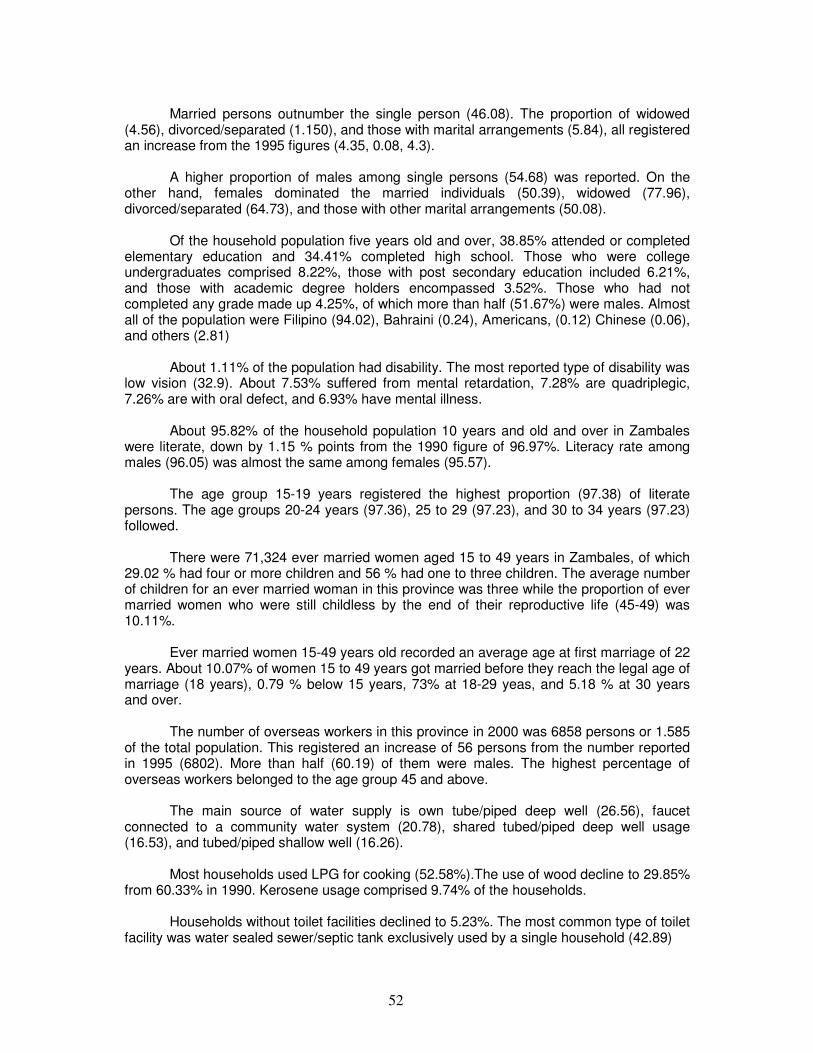
52
Married persons outnumber the single person (46.08). The proportion of widowed
(4.56), divorced/separated (1.150), and those with marital arrangements (5.84), all registered an increase from the 1995 figures (4.35, 0.08, 4.3).
A higher proportion of males among single persons (54.68) was reported. On the other hand, females dominated the married individuals (50.39), widowed (77.96), divorced/separated (64.73), and those with other marital arrangements (50.08).
Of the household population five years old and over, 38.85% attended or completed elementary education and 34.41% completed high school. Those who were college undergraduates comprised 8.22%, those with post secondary education included 6.21%, and those with academic degree holders encompassed 3.52%. Those who had not completed any grade made up 4.25%, of which more than half (51.67%) were males. Almost all of the population were Filipino (94.02), Bahraini (0.24), Americans, (0.12) Chinese (0.06), and others (2.81)
About 1.11% of the population had disability. The most reported type of disability was low vision (32.9). About 7.53% suffered from mental retardation, 7.28% are quadriplegic, 7.26% are with oral defect, and 6.93% have mental illness.
About 95.82% of the household population 10 years and old and over in Zambales were literate, down by 1.15 % points from the 1990 figure of 96.97%. Literacy rate among males (96.05) was almost the same among females (95.57).
The age group 15-19 years registered the highest proportion (97.38) of literate persons. The age groups 20-24 years (97.36), 25 to 29 (97.23), and 30 to 34 years (97.23) followed.
There were 71,324 ever married women aged 15 to 49 years in Zambales, of which 29.02 % had four or more children and 56 % had one to three children. The average number of children for an ever married woman in this province was three while the proportion of ever married women who were still childless by the end of their reproductive life (45-49) was 10.11%.
Ever married women 15-49 years old recorded an average age at first marriage of 22 years. About 10.07% of women 15 to 49 years got married before they reach the legal age of marriage (18 years), 0.79 % below 15 years, 73% at 18-29 yeas, and 5.18 % at 30 years and over.
The number of overseas workers in this province in 2000 was 6858 persons or 1.585 of the total population. This registered an increase of 56 persons from the number reported in 1995 (6802). More than half (60.19) of them were males. The highest percentage of overseas workers belonged to the age group 45 and above.
The main source of water supply is own tube/piped deep well (26.56), faucet connected to a community water system (20.78), shared tubed/piped deep well usage (16.53), and tubed/piped shallow well (16.26).
Most households used LPG for cooking (52.58%).The use of wood decline to 29.85% from 60.33% in 1990. Kerosene usage comprised 9.74% of the households.
Households without toilet facilities declined to 5.23%. The most common type of toilet facility was water sealed sewer/septic tank exclusively used by a single household (42.89)
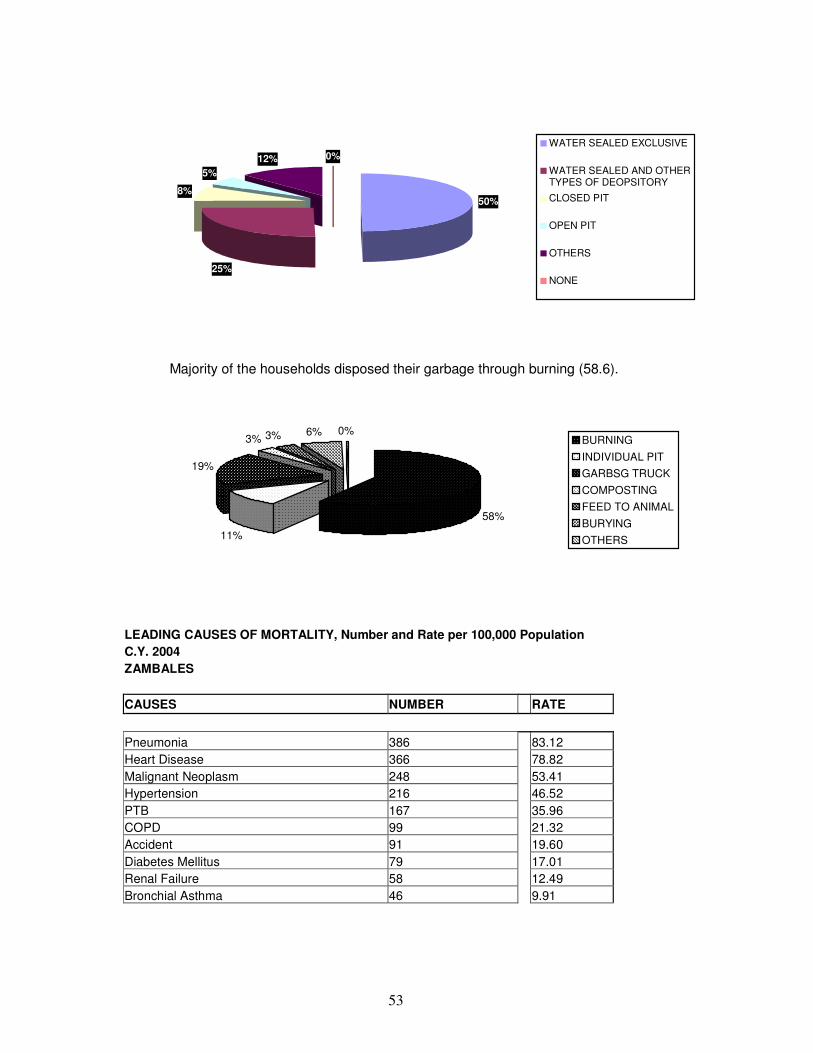
53
50%
25%
8%
5%12% 0%
WATER SEALED EXCLUSIVE
WATER SEALED AND OTHERTYPES OF DEOPSITORY
CLOSED PIT
OPEN PIT
OTHERS
NONE
Majority of the households disposed their garbage through burning (58.6).
58%
11%
19%
3% 3% 6% 0%BURNING
INDIVIDUAL PIT
GARBSG TRUCK
COMPOSTING
FEED TO ANIMAL
BURYING
OTHERS
LEADING CAUSES OF MORTALITY, Number and Rate per 100,000 Population C.Y. 2004 ZAMBALES
CAUSES NUMBER RATE
Pneumonia 386 83.12
Heart Disease 366 78.82
Malignant Neoplasm 248 53.41
Hypertension 216 46.52
PTB 167 35.96
COPD 99 21.32
Accident 91 19.60
Diabetes Mellitus 79 17.01
Renal Failure 58 12.49
Bronchial Asthma 46 9.91
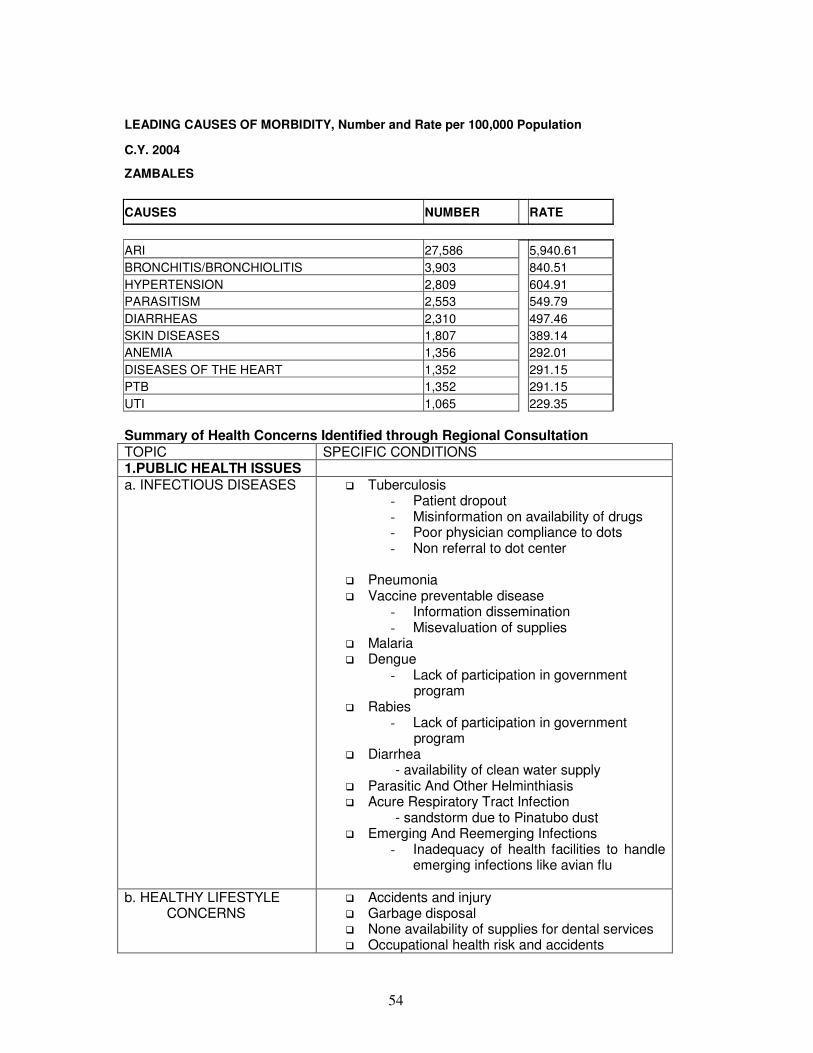
54
LEADING CAUSES OF MORBIDITY, Number and Rate per 100,000 Population
C.Y. 2004
ZAMBALES
CAUSES NUMBER RATE
ARI 27,586 5,940.61
BRONCHITIS/BRONCHIOLITIS 3,903 840.51
HYPERTENSION 2,809 604.91
PARASITISM 2,553 549.79
DIARRHEAS 2,310 497.46
SKIN DISEASES 1,807 389.14
ANEMIA 1,356 292.01
DISEASES OF THE HEART 1,352 291.15
PTB 1,352 291.15
UTI 1,065 229.35
Summary of Health Concerns Identified through Regional Consultation TOPIC SPECIFIC CONDITIONS 1.PUBLIC HEALTH ISSUES a. INFECTIOUS DISEASES � Tuberculosis
- Patient dropout - Misinformation on availability of drugs - Poor physician compliance to dots - Non referral to dot center
� Pneumonia � Vaccine preventable disease
- Information dissemination - Misevaluation of supplies
� Malaria � Dengue
- Lack of participation in government program
� Rabies - Lack of participation in government program
� Diarrhea - availability of clean water supply � Parasitic And Other Helminthiasis � Acure Respiratory Tract Infection - sandstorm due to Pinatubo dust � Emerging And Reemerging Infections
- Inadequacy of health facilities to handle emerging infections like avian flu
b. HEALTHY LIFESTYLE CONCERNS
� Accidents and injury � Garbage disposal � None availability of supplies for dental services � Occupational health risk and accidents

55
� Toxic waste in resettlement areas � Effect of malaria insecticide on community � Smoking
c. FAMILY HEALTH AND HEALTH OF SPECIAL POPULATIONS
� Mother and new born - Education - Family planning practice - Contraceptive prevalence - Unmet needs
� Pull out of support for family planning programs � Adolescent and youth
- No data on substance abuse - Factory workers health conditions needs
evaluation d. DEGENERATIVE DISEASES
� Cardiovascular - Diet - Not given due attention by the
community � Hypertension � Malignant Neoplasm
- Insecticide Use � Diabetes Mellitus � Pulmonary Diseases
- Chronic Obstructive Pulmonary Disease � Kidney Disease � Cerebro Vascular Accident � Git Disease
- PUD 2. HEALTH CARE DELIVERY SYSTEM
� Low budget for supplies and transportation expense affects mobility
� Lack of manpower due to exodus of nurses and doctors taking up Nursing
� Health is not a priority of some municipalities
3. HEALTH REGULATORY SYSTEM
� Stronger regulation on food and drugs � No data on counterfeit and fake drugs � Increased number of unlicensed Botika Sa
Barangay � Strict implementation of existing laws on
smoking, responsible pet ownership, workers 4. QUALITY OF HEALTH EDUCATION
� Attitude of health care providers
6. HEALTH POLICIES/LEGISLATION
� Drug policy has to be updated � No strong government policy to support Health
Research And Development � Implementation of Magna Carta
7. HEALTH CARE FINANCING SYSTEM
� Slow release of claims � Delay in processing due to paper work (several
copies required) � Non-payment of Doctor’s Professional Fee � Senior Citizen and Indigent not aware of
Philhealth benefit
8.HOSPITAL SYSTEM � Shortage of nurses
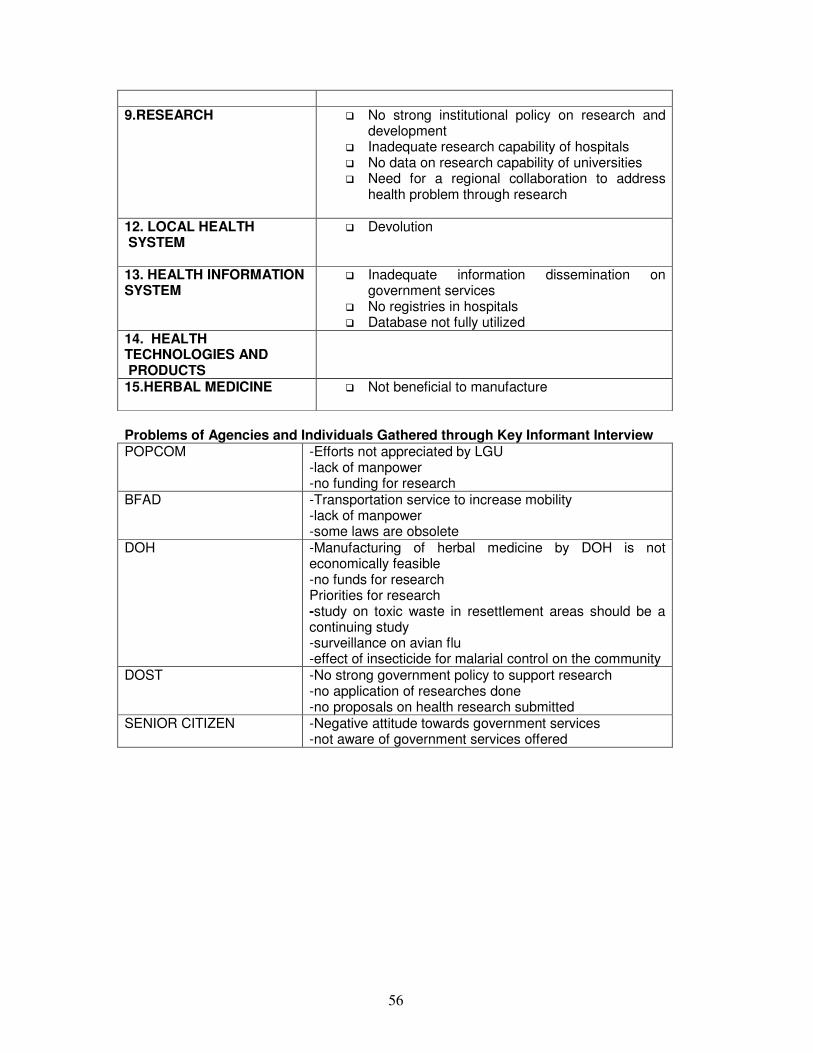
56
9.RESEARCH
� No strong institutional policy on research and development
� Inadequate research capability of hospitals � No data on research capability of universities � Need for a regional collaboration to address
health problem through research
12. LOCAL HEALTH SYSTEM
� Devolution
13. HEALTH INFORMATION SYSTEM
� Inadequate information dissemination on government services
� No registries in hospitals � Database not fully utilized
14. HEALTH TECHNOLOGIES AND PRODUCTS
15.HERBAL MEDICINE
� Not beneficial to manufacture
Problems of Agencies and Individuals Gathered through Key Informant Interview POPCOM -Efforts not appreciated by LGU
-lack of manpower -no funding for research
BFAD -Transportation service to increase mobility -lack of manpower -some laws are obsolete
DOH -Manufacturing of herbal medicine by DOH is not economically feasible -no funds for research Priorities for research -study on toxic waste in resettlement areas should be a continuing study -surveillance on avian flu -effect of insecticide for malarial control on the community
DOST -No strong government policy to support research -no application of researches done -no proposals on health research submitted
SENIOR CITIZEN -Negative attitude towards government services -not aware of government services offered
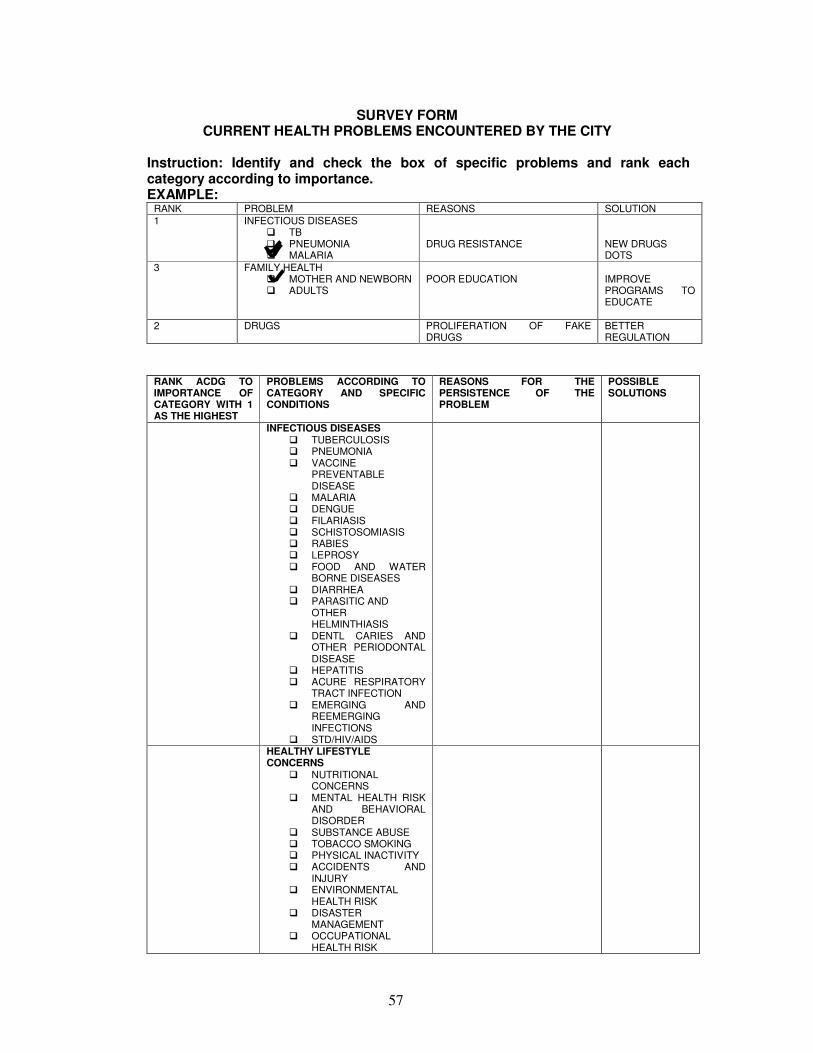
57
SURVEY FORM CURRENT HEALTH PROBLEMS ENCOUNTERED BY THE CITY
Instruction: Identify and check the box of specific problems and rank each category according to importance. EXAMPLE:
RANK PROBLEM REASONS SOLUTION
1 INFECTIOUS DISEASES � TB � PNEUMONIA � MALARIA
DRUG RESISTANCE
NEW DRUGS DOTS
3 FAMILY HEALTH � MOTHER AND NEWBORN � ADULTS
POOR EDUCATION
IMPROVE PROGRAMS TO EDUCATE
2 DRUGS PROLIFERATION OF FAKE DRUGS
BETTER REGULATION
RANK ACDG TO IMPORTANCE OF CATEGORY WITH 1 AS THE HIGHEST
PROBLEMS ACCORDING TO CATEGORY AND SPECIFIC CONDITIONS
REASONS FOR THE PERSISTENCE OF THE PROBLEM
POSSIBLE SOLUTIONS
INFECTIOUS DISEASES � TUBERCULOSIS � PNEUMONIA � VACCINE
PREVENTABLE DISEASE
� MALARIA � DENGUE � FILARIASIS � SCHISTOSOMIASIS � RABIES � LEPROSY � FOOD AND WATER
BORNE DISEASES � DIARRHEA � PARASITIC AND
OTHER HELMINTHIASIS
� DENTL CARIES AND OTHER PERIODONTAL DISEASE
� HEPATITIS � ACURE RESPIRATORY
TRACT INFECTION � EMERGING AND
REEMERGING INFECTIONS
� STD/HIV/AIDS
HEALTHY LIFESTYLE CONCERNS
� NUTRITIONAL CONCERNS
� MENTAL HEALTH RISK AND BEHAVIORAL DISORDER
� SUBSTANCE ABUSE � TOBACCO SMOKING � PHYSICAL INACTIVITY � ACCIDENTS AND
INJURY � ENVIRONMENTAL
HEALTH RISK � DISASTER
MANAGEMENT � OCCUPATIONAL
HEALTH RISK
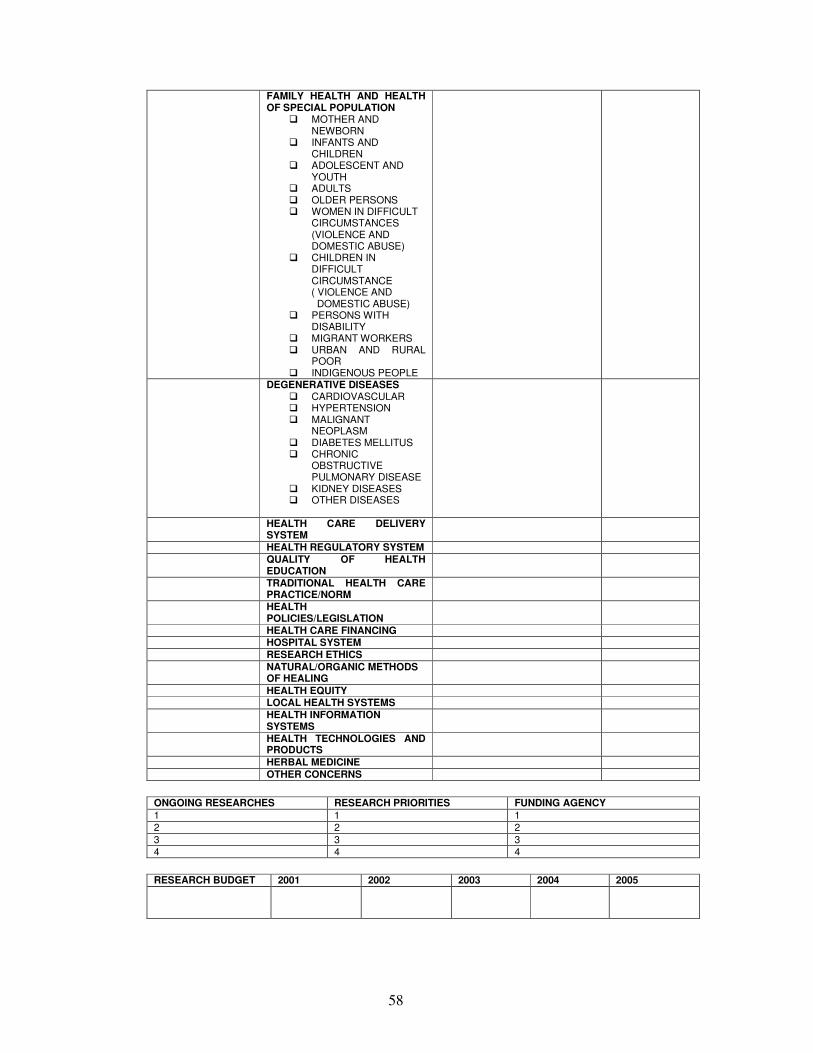
58
FAMILY HEALTH AND HEALTH OF SPECIAL POPULATION
� MOTHER AND NEWBORN
� INFANTS AND CHILDREN
� ADOLESCENT AND YOUTH
� ADULTS � OLDER PERSONS � WOMEN IN DIFFICULT
CIRCUMSTANCES (VIOLENCE AND DOMESTIC ABUSE)
� CHILDREN IN DIFFICULT CIRCUMSTANCE
( VIOLENCE AND DOMESTIC ABUSE) � PERSONS WITH
DISABILITY � MIGRANT WORKERS � URBAN AND RURAL
POOR � INDIGENOUS PEOPLE
DEGENERATIVE DISEASES � CARDIOVASCULAR � HYPERTENSION � MALIGNANT
NEOPLASM � DIABETES MELLITUS � CHRONIC
OBSTRUCTIVE PULMONARY DISEASE
� KIDNEY DISEASES � OTHER DISEASES
HEALTH CARE DELIVERY SYSTEM
HEALTH REGULATORY SYSTEM
QUALITY OF HEALTH EDUCATION
TRADITIONAL HEALTH CARE PRACTICE/NORM
HEALTH POLICIES/LEGISLATION
HEALTH CARE FINANCING HOSPITAL SYSTEM
RESEARCH ETHICS
NATURAL/ORGANIC METHODS OF HEALING
HEALTH EQUITY
LOCAL HEALTH SYSTEMS
HEALTH INFORMATION SYSTEMS
HEALTH TECHNOLOGIES AND PRODUCTS
HERBAL MEDICINE
OTHER CONCERNS
ONGOING RESEARCHES RESEARCH PRIORITIES FUNDING AGENCY 1 1 1
2 2 2
3 3 3
4 4 4
RESEARCH BUDGET 2001 2002 2003 2004 2005
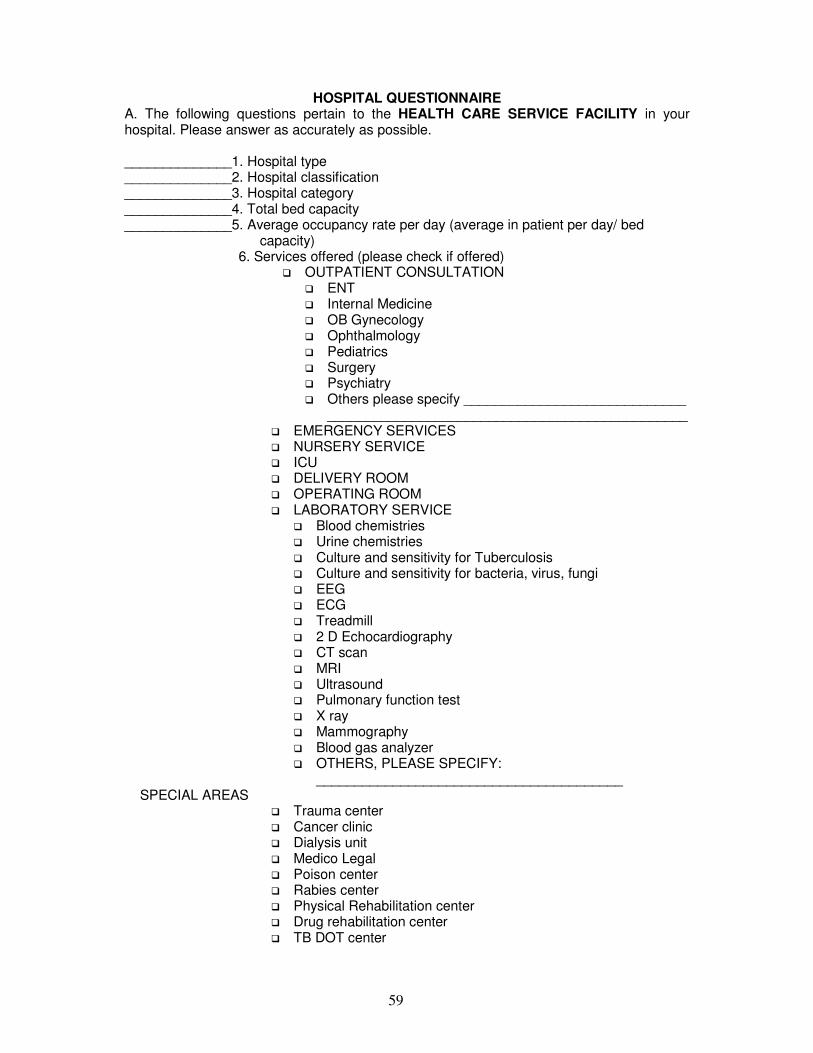
59
HOSPITAL QUESTIONNAIRE A. The following questions pertain to the HEALTH CARE SERVICE FACILITY in your hospital. Please answer as accurately as possible. ______________1. Hospital type ______________2. Hospital classification ______________3. Hospital category ______________4. Total bed capacity ______________5. Average occupancy rate per day (average in patient per day/ bed
capacity) 6. Services offered (please check if offered)
� OUTPATIENT CONSULTATION � ENT � Internal Medicine � OB Gynecology � Ophthalmology � Pediatrics � Surgery � Psychiatry � Others please specify _____________________________
_______________________________________________ � EMERGENCY SERVICES � NURSERY SERVICE � ICU � DELIVERY ROOM � OPERATING ROOM � LABORATORY SERVICE
� Blood chemistries � Urine chemistries � Culture and sensitivity for Tuberculosis � Culture and sensitivity for bacteria, virus, fungi � EEG � ECG � Treadmill � 2 D Echocardiography � CT scan � MRI � Ultrasound � Pulmonary function test � X ray � Mammography � Blood gas analyzer � OTHERS, PLEASE SPECIFY:
________________________________________ SPECIAL AREAS
� Trauma center � Cancer clinic � Dialysis unit � Medico Legal � Poison center � Rabies center � Physical Rehabilitation center � Drug rehabilitation center � TB DOT center
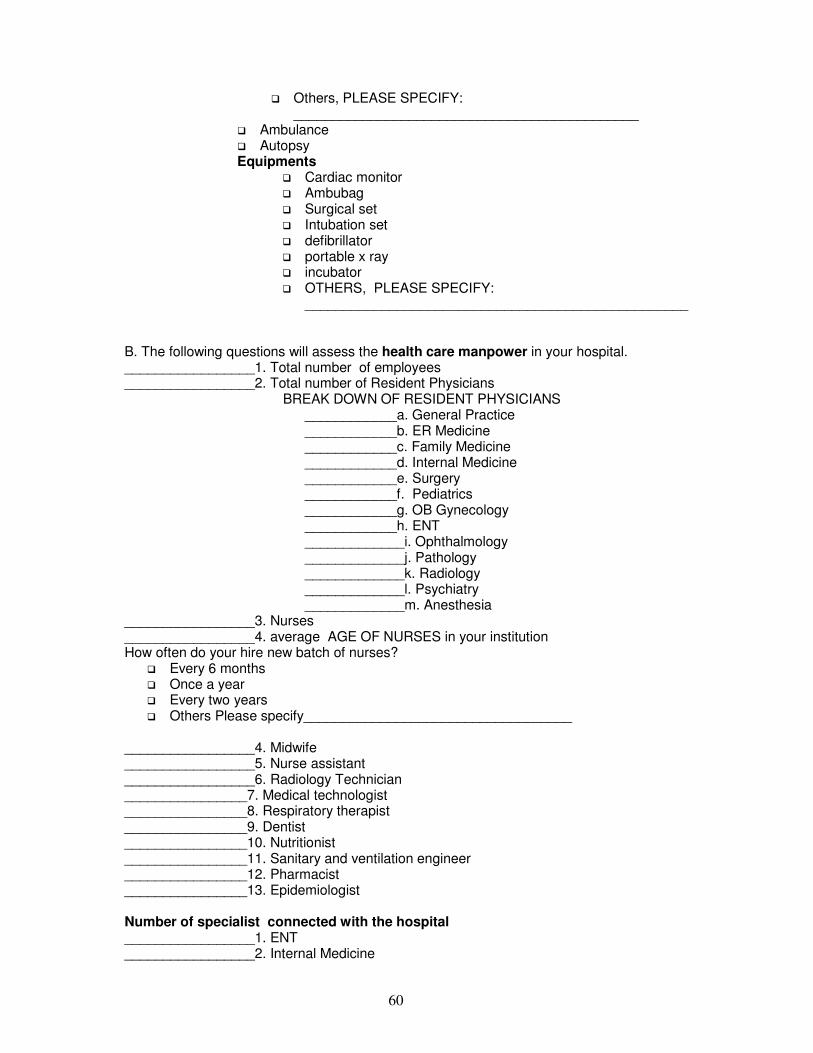
60
� Others, PLEASE SPECIFY: _____________________________________________
� Ambulance � Autopsy Equipments
� Cardiac monitor � Ambubag � Surgical set � Intubation set � defibrillator � portable x ray � incubator � OTHERS, PLEASE SPECIFY:
__________________________________________________
B. The following questions will assess the health care manpower in your hospital. _________________1. Total number of employees _________________2. Total number of Resident Physicians BREAK DOWN OF RESIDENT PHYSICIANS
____________a. General Practice ____________b. ER Medicine ____________c. Family Medicine ____________d. Internal Medicine ____________e. Surgery ____________f. Pediatrics ____________g. OB Gynecology ____________h. ENT _____________i. Ophthalmology _____________j. Pathology _____________k. Radiology _____________l. Psychiatry _____________m. Anesthesia
_________________3. Nurses _________________4. average AGE OF NURSES in your institution How often do your hire new batch of nurses?
� Every 6 months � Once a year � Every two years � Others Please specify___________________________________
_________________4. Midwife _________________5. Nurse assistant _________________6. Radiology Technician ________________7. Medical technologist ________________8. Respiratory therapist ________________9. Dentist ________________10. Nutritionist ________________11. Sanitary and ventilation engineer ________________12. Pharmacist ________________13. Epidemiologist Number of specialist connected with the hospital _________________1. ENT _________________2. Internal Medicine
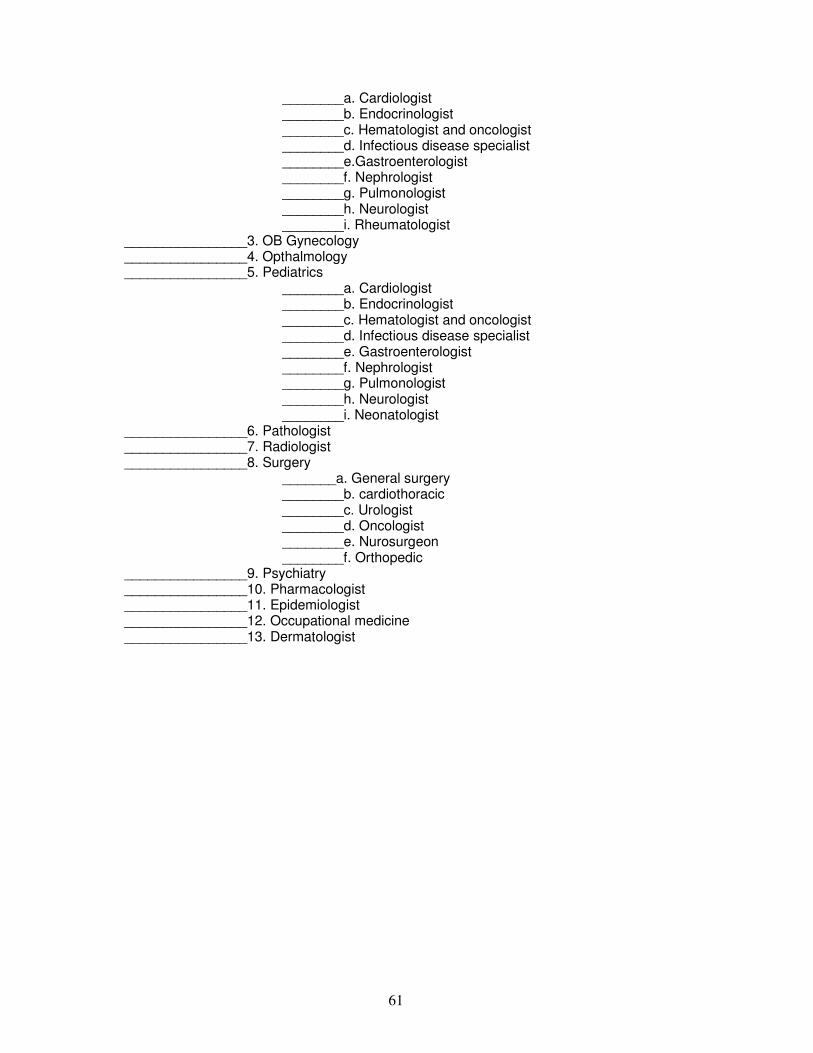
61
________a. Cardiologist ________b. Endocrinologist ________c. Hematologist and oncologist ________d. Infectious disease specialist ________e.Gastroenterologist ________f. Nephrologist ________g. Pulmonologist ________h. Neurologist ________i. Rheumatologist
________________3. OB Gynecology ________________4. Opthalmology ________________5. Pediatrics
________a. Cardiologist ________b. Endocrinologist ________c. Hematologist and oncologist ________d. Infectious disease specialist ________e. Gastroenterologist ________f. Nephrologist ________g. Pulmonologist ________h. Neurologist ________i. Neonatologist
________________6. Pathologist ________________7. Radiologist ________________8. Surgery
_______a. General surgery ________b. cardiothoracic ________c. Urologist ________d. Oncologist ________e. Nurosurgeon ________f. Orthopedic
________________9. Psychiatry ________________10. Pharmacologist ________________11. Epidemiologist ________________12. Occupational medicine ________________13. Dermatologist

62
SURVEY FOR UNIVERSITIES For training hospital and other institutions engaged in research, please answer the following questions as accurately as possible (adopted from the PCHRD Assessment for the Research Capability of Universities, 2004) Assessment Form The evaluation is subdivided into sections. The evaluation form consists of series of statements delineating traits or conditions which pertain to the aspect being evaluated. Each statement will be scored in a scale of 0 to 5, with 0 being the least desirable condition and 5 the most desirable. A rating of “3” is considered “good”. After each section, space is provided for comments or remarks that the rater may wish to make. This feature should be particularly helpful to the self-evaluation committee. The user of this form must rate all statements without exception. Below is the rating scale which should be used:
0 the provision or condition does not exist. 1 – Poor: the provision or condition is limited and functioning poorly 2 – Fair: the provision or condition is limited and functioning minimally 3 – Good: the provision or condition is met and functioning adequately 4 – Very Good: the provision or condition is moderately extensive and
functioning well 5 – Excellent: the provision or condition is very extensive and functioning
perfectly
Assessment Form Rating (0 to 5)
I. Research Administration _____ 1. There is a well-structured research organization _____ 2. The staffing pattern of the research unit is adequate. 3. The research unit has the following committees: ______ a. technical review ______ b. ethics ______ c. training ______ d. publication ______ e. finance ______4. A well-developed planning system for research is in place. ______5. The research unit and its program are evaluated annually. ______6. There is a systematic process of evaluating and approving of research projects and proposals. _____ 7. The ethical standards conforms with the National Guidelines for Biomedical Research ______8. There are adequate policies in research approved by the Board of Trustees/Regents/LGU ______9. The Board of Trustees/Regents/LGU allocates sufficient budget for research annually.
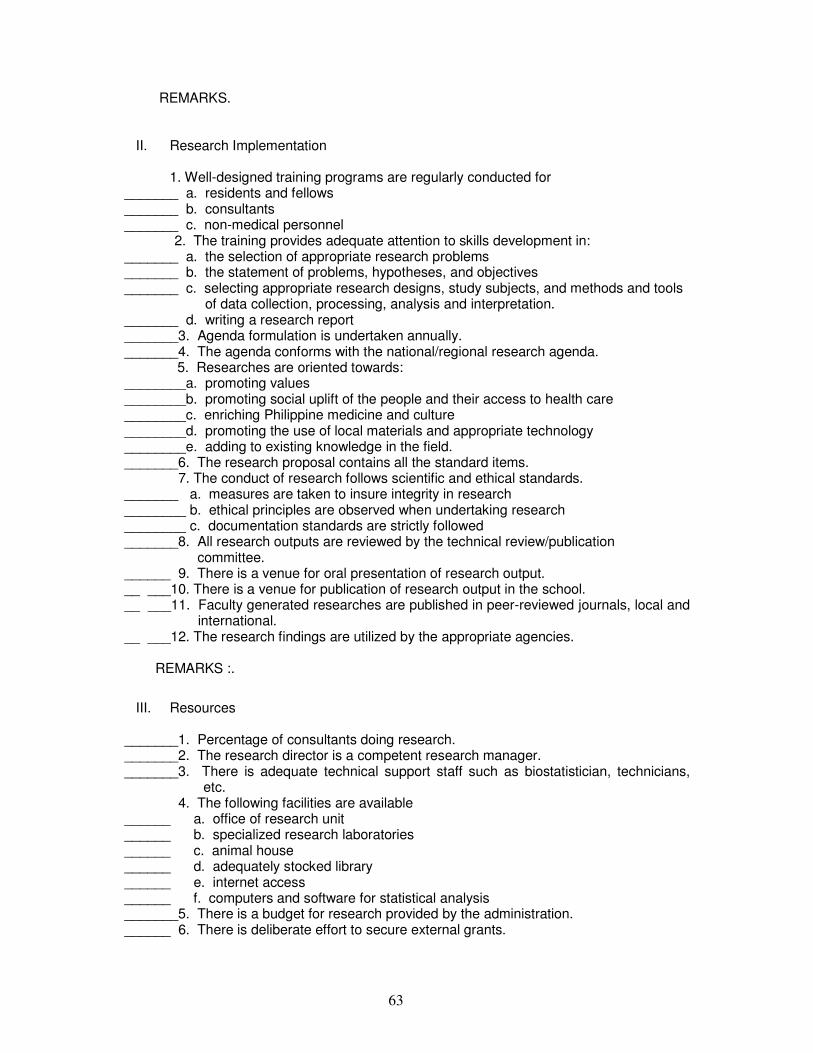
63
REMARKS.
II. Research Implementation
1. Well-designed training programs are regularly conducted for _______ a. residents and fellows _______ b. consultants _______ c. non-medical personnel 2. The training provides adequate attention to skills development in: _______ a. the selection of appropriate research problems _______ b. the statement of problems, hypotheses, and objectives _______ c. selecting appropriate research designs, study subjects, and methods and tools of data collection, processing, analysis and interpretation. _______ d. writing a research report _______3. Agenda formulation is undertaken annually. _______4. The agenda conforms with the national/regional research agenda.
5. Researches are oriented towards: ________a. promoting values ________b. promoting social uplift of the people and their access to health care ________c. enriching Philippine medicine and culture ________d. promoting the use of local materials and appropriate technology ________e. adding to existing knowledge in the field. _______6. The research proposal contains all the standard items. 7. The conduct of research follows scientific and ethical standards. _______ a. measures are taken to insure integrity in research ________ b. ethical principles are observed when undertaking research ________ c. documentation standards are strictly followed _______8. All research outputs are reviewed by the technical review/publication committee. ______ 9. There is a venue for oral presentation of research output. __ ___10. There is a venue for publication of research output in the school. __ ___11. Faculty generated researches are published in peer-reviewed journals, local and
international. __ ___12. The research findings are utilized by the appropriate agencies. REMARKS :.
III. Resources
_______1. Percentage of consultants doing research. _______2. The research director is a competent research manager. _______3. There is adequate technical support staff such as biostatistician, technicians,
etc. 4. The following facilities are available ______ a. office of research unit ______ b. specialized research laboratories ______ c. animal house ______ d. adequately stocked library ______ e. internet access ______ f. computers and software for statistical analysis _______5. There is a budget for research provided by the administration. ______ 6. There is deliberate effort to secure external grants.
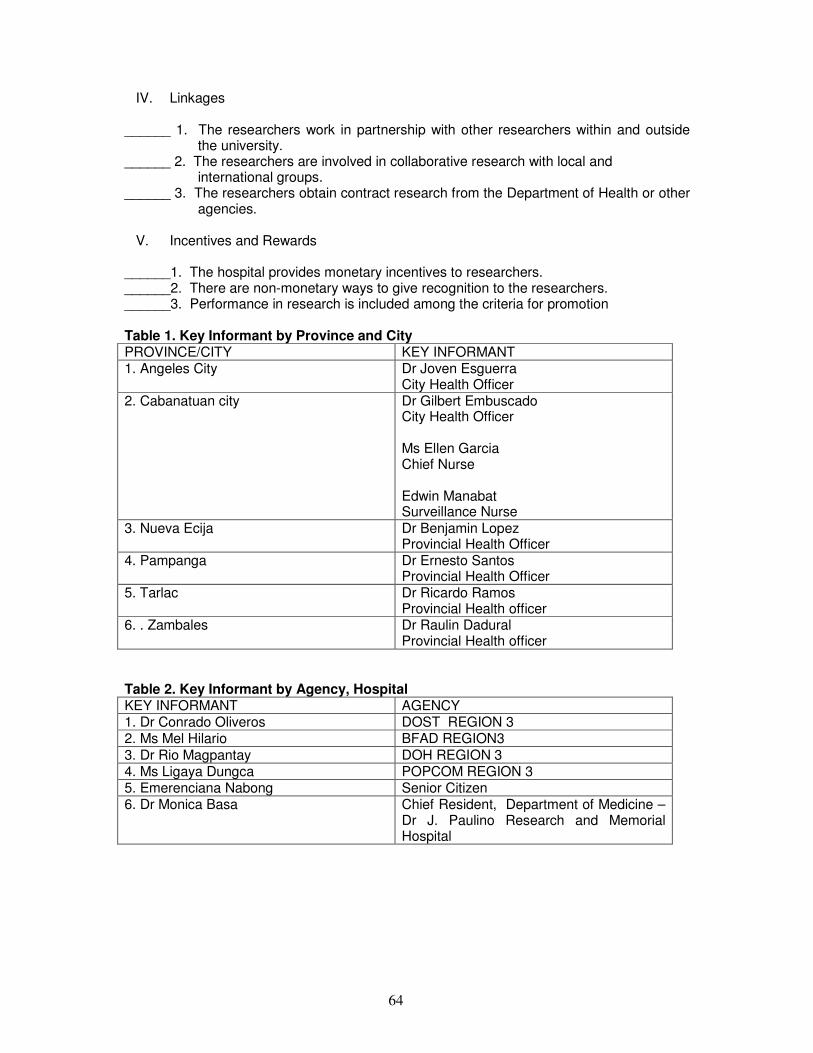
64
IV. Linkages ______ 1. The researchers work in partnership with other researchers within and outside
the university. ______ 2. The researchers are involved in collaborative research with local and
international groups. ______ 3. The researchers obtain contract research from the Department of Health or other
agencies.
V. Incentives and Rewards ______1. The hospital provides monetary incentives to researchers. ______2. There are non-monetary ways to give recognition to the researchers. ______3. Performance in research is included among the criteria for promotion Table 1. Key Informant by Province and City PROVINCE/CITY KEY INFORMANT 1. Angeles City
Dr Joven Esguerra City Health Officer
2. Cabanatuan city Dr Gilbert Embuscado City Health Officer Ms Ellen Garcia Chief Nurse Edwin Manabat Surveillance Nurse
3. Nueva Ecija Dr Benjamin Lopez Provincial Health Officer
4. Pampanga Dr Ernesto Santos Provincial Health Officer
5. Tarlac Dr Ricardo Ramos Provincial Health officer
6. . Zambales Dr Raulin Dadural Provincial Health officer
Table 2. Key Informant by Agency, Hospital KEY INFORMANT AGENCY 1. Dr Conrado Oliveros DOST REGION 3 2. Ms Mel Hilario BFAD REGION3
3. Dr Rio Magpantay DOH REGION 3 4. Ms Ligaya Dungca POPCOM REGION 3 5. Emerenciana Nabong Senior Citizen 6. Dr Monica Basa Chief Resident, Department of Medicine –
Dr J. Paulino Research and Memorial Hospital
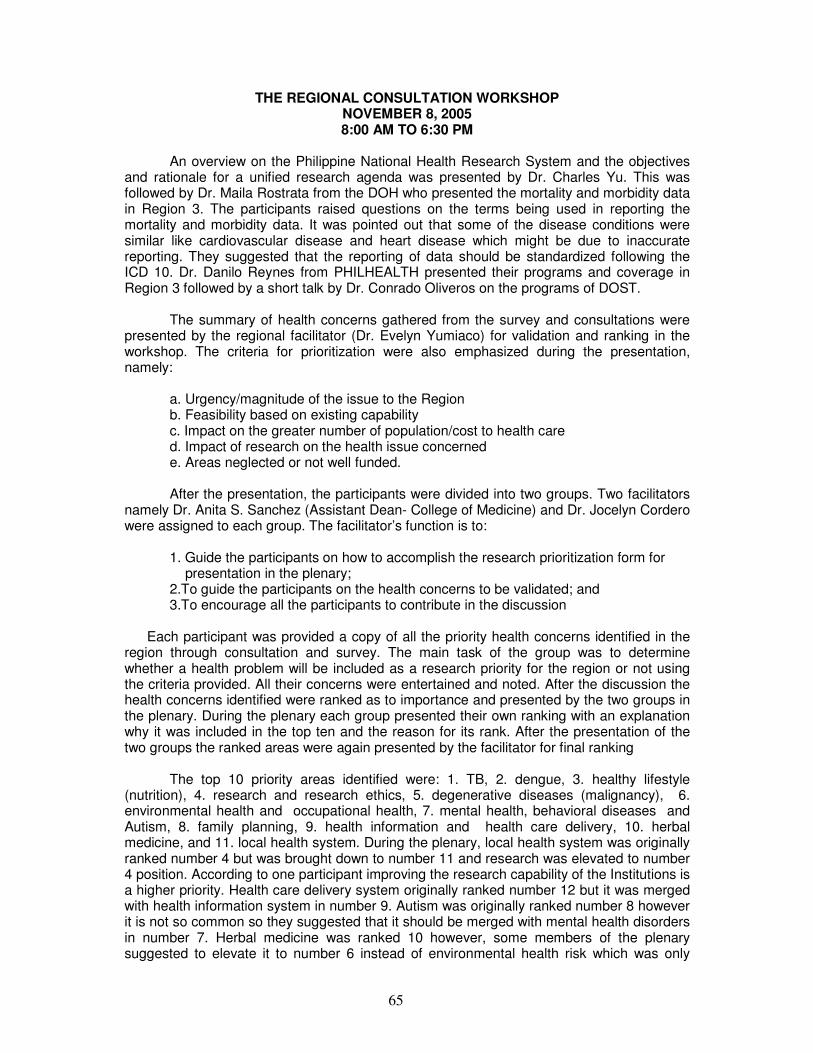
65
THE REGIONAL CONSULTATION WORKSHOP NOVEMBER 8, 2005 8:00 AM TO 6:30 PM
An overview on the Philippine National Health Research System and the objectives
and rationale for a unified research agenda was presented by Dr. Charles Yu. This was followed by Dr. Maila Rostrata from the DOH who presented the mortality and morbidity data in Region 3. The participants raised questions on the terms being used in reporting the mortality and morbidity data. It was pointed out that some of the disease conditions were similar like cardiovascular disease and heart disease which might be due to inaccurate reporting. They suggested that the reporting of data should be standardized following the ICD 10. Dr. Danilo Reynes from PHILHEALTH presented their programs and coverage in Region 3 followed by a short talk by Dr. Conrado Oliveros on the programs of DOST.
The summary of health concerns gathered from the survey and consultations were
presented by the regional facilitator (Dr. Evelyn Yumiaco) for validation and ranking in the workshop. The criteria for prioritization were also emphasized during the presentation, namely:
a. Urgency/magnitude of the issue to the Region b. Feasibility based on existing capability c. Impact on the greater number of population/cost to health care d. Impact of research on the health issue concerned e. Areas neglected or not well funded.
After the presentation, the participants were divided into two groups. Two facilitators
namely Dr. Anita S. Sanchez (Assistant Dean- College of Medicine) and Dr. Jocelyn Cordero were assigned to each group. The facilitator’s function is to:
1. Guide the participants on how to accomplish the research prioritization form for presentation in the plenary; 2.To guide the participants on the health concerns to be validated; and 3.To encourage all the participants to contribute in the discussion
Each participant was provided a copy of all the priority health concerns identified in the
region through consultation and survey. The main task of the group was to determine whether a health problem will be included as a research priority for the region or not using the criteria provided. All their concerns were entertained and noted. After the discussion the health concerns identified were ranked as to importance and presented by the two groups in the plenary. During the plenary each group presented their own ranking with an explanation why it was included in the top ten and the reason for its rank. After the presentation of the two groups the ranked areas were again presented by the facilitator for final ranking
The top 10 priority areas identified were: 1. TB, 2. dengue, 3. healthy lifestyle (nutrition), 4. research and research ethics, 5. degenerative diseases (malignancy), 6. environmental health and occupational health, 7. mental health, behavioral diseases and Autism, 8. family planning, 9. health information and health care delivery, 10. herbal medicine, and 11. local health system. During the plenary, local health system was originally ranked number 4 but was brought down to number 11 and research was elevated to number 4 position. According to one participant improving the research capability of the Institutions is a higher priority. Health care delivery system originally ranked number 12 but it was merged with health information system in number 9. Autism was originally ranked number 8 however it is not so common so they suggested that it should be merged with mental health disorders in number 7. Herbal medicine was ranked 10 however, some members of the plenary suggested to elevate it to number 6 instead of environmental health risk which was only
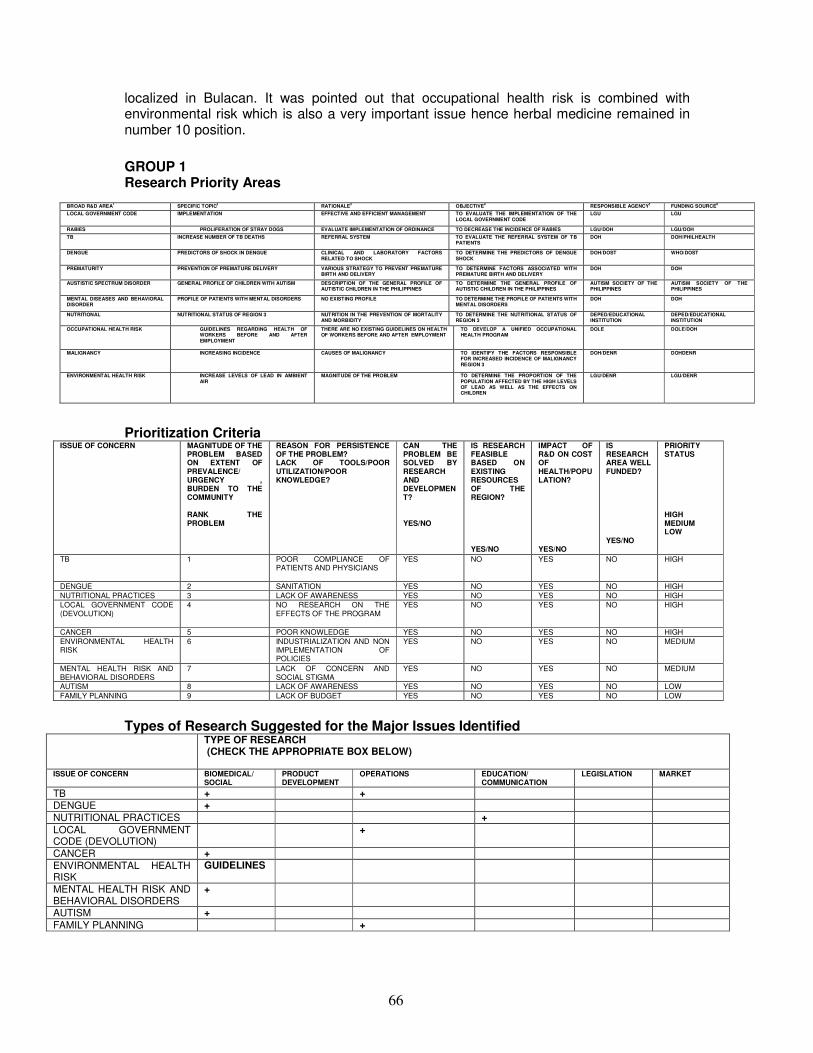
66
localized in Bulacan. It was pointed out that occupational health risk is combined with environmental risk which is also a very important issue hence herbal medicine remained in number 10 position.
GROUP 1 Research Priority Areas
Prioritization Criteria ISSUE OF CONCERN MAGNITUDE OF THE
PROBLEM BASED ON EXTENT OF PREVALENCE/ URGENCY , BURDEN TO THE COMMUNITY RANK THE PROBLEM
REASON FOR PERSISTENCE OF THE PROBLEM? LACK OF TOOLS/POOR UTILIZATION/POOR KNOWLEDGE?
CAN THE PROBLEM BE SOLVED BY RESEARCH AND DEVELOPMENT? YES/NO
IS RESEARCH FEASIBLE BASED ON EXISTING RESOURCES OF THE REGION? YES/NO
IMPACT OF R&D ON COST OF HEALTH/POPULATION? YES/NO
IS RESEARCH AREA WELL FUNDED? YES/NO
PRIORITY STATUS HIGH MEDIUM LOW
TB 1 POOR COMPLIANCE OF PATIENTS AND PHYSICIANS
YES NO YES NO HIGH
DENGUE 2 SANITATION YES NO YES NO HIGH
NUTRITIONAL PRACTICES 3 LACK OF AWARENESS YES NO YES NO HIGH
LOCAL GOVERNMENT CODE (DEVOLUTION)
4 NO RESEARCH ON THE EFFECTS OF THE PROGRAM
YES NO YES NO HIGH
CANCER 5 POOR KNOWLEDGE YES NO YES NO HIGH
ENVIRONMENTAL HEALTH RISK
6 INDUSTRIALIZATION AND NON IMPLEMENTATION OF POLICIES
YES NO YES NO MEDIUM
MENTAL HEALTH RISK AND BEHAVIORAL DISORDERS
7 LACK OF CONCERN AND SOCIAL STIGMA
YES NO YES NO MEDIUM
AUTISM 8 LACK OF AWARENESS YES NO YES NO LOW
FAMILY PLANNING 9 LACK OF BUDGET YES NO YES NO LOW
Types of Research Suggested for the Major Issues Identified TYPE OF RESEARCH
(CHECK THE APPROPRIATE BOX BELOW)
ISSUE OF CONCERN BIOMEDICAL/ SOCIAL
PRODUCT DEVELOPMENT
OPERATIONS EDUCATION/ COMMUNICATION
LEGISLATION MARKET
TB + + DENGUE + NUTRITIONAL PRACTICES + LOCAL GOVERNMENT CODE (DEVOLUTION)
+
CANCER + ENVIRONMENTAL HEALTH RISK
GUIDELINES
MENTAL HEALTH RISK AND BEHAVIORAL DISORDERS
+
AUTISM + FAMILY PLANNING +
BROAD R&D AREA1 SPECIFIC TOPIC2 RATIONALE3 OBJECTIVE4 RESPONSIBLE AGENCY5 FUNDING SOURCE6
LOCAL GOVERNMENT CODE IMPLEMENTATION EFFECTIVE AND EFFICIENT MANAGEMENT TO EVALUATE THE IMPLEMENTATION OF THE LOCAL GOVERNMENT CODE
LGU LGU
RABIES PROLIFERATION OF STRAY DOGS EVALUATE IMPLEMENTATION OF ORDINANCE TO DECREASE THE INCIDENCE OF RABIES LGU/DOH LGU/DOH
TB INCREASE NUMBER OF TB DEATHS REFERRAL SYSTEM TO EVALUATE THE REFERRAL SYSTEM OF TB PATIENTS
DOH DOH/PHILHEALTH
DENGUE PREDICTORS OF SHOCK IN DENGUE CLINICAL AND LABORATORY FACTORS RELATED TO SHOCK
TO DETERMINE THE PREDICTORS OF DENGUE SHOCK
DOH/DOST WHO/DOST
PREMATURITY PREVENTION OF PREMATURE DELIVERY VARIOUS STRATEGY TO PREVENT PREMATURE BIRTH AND DELIVERY
TO DETERMINE FACTORS ASSOCIATED WITH PREMATURE BIRTH AND DELIVERY
DOH DOH
AUSTISTIC SPECTRUM DISORDER GENERAL PROFILE OF CHILDREN WITH AUTISM DESCRIPTION OF THE GENERAL PROFILE OF AUTISTIC CHILDREN IN THE PHILIPPINES
TO DETERMINE THE GENERAL PROFILE OF AUTISTIC CHILDREN IN THE PHILIPPINES
AUTISM SOCIETY OF THE PHILIPPINES
AUTISM SOCIETY OF THE PHILIPPINES
MENTAL DISEASES AND BEHAVIORAL DISORDER
PROFILE OF PATIENTS WITH MENTAL DISORDERS NO EXISTING PROFILE TO DETERMINE THE PROFILE OF PATIENTS WITH MENTAL DISORDERS
DOH DOH
NUTRITIONAL NUTRITIONAL STATUS OF REGION 3 NUTRITION IN THE PREVENTION OF MORTALITY AND MORBIDITY
TO DETERMINE THE NUTRITIONAL STATUS OF REGION 3
DEPED/EDUCATIONAL INSTITUTION
DEPED/EDUCATIONAL INSTITUTION
OCCUPATIONAL HEALTH RISK GUIDELINES REGARDING HEALTH OF WORKERS BEFORE AND AFTER EMPLOYMENT
THERE ARE NO EXISTING GUIDELINES ON HEALTH OF WORKERS BEFORE AND AFTER EMPLOYMENT
TO DEVELOP A UNIFIED OCCUPATIONAL HEALTH PROGRAM
DOLE DOLE/DOH
MALIGNANCY INCREASING INCIDENCE CAUSES OF MALIGNANCY TO IDENTIFY THE FACTORS RESPONSIBLE FOR INCREASED INCIDENCE OF MALIGNANCY REGION 3
DOH/DENR DOHDENR
ENVIRONMENTAL HEALTH RISK INCREASE LEVELS OF LEAD IN AMBIENT AIR
MAGNITUDE OF THE PROBLEM TO DETERMINE THE PROPORTION OF THE POPULATION AFFECTED BY THE HIGH LEVELS OF LEAD AS WELL AS THE EFFECTS ON CHILDREN
LGU/DENR LGU/DENR
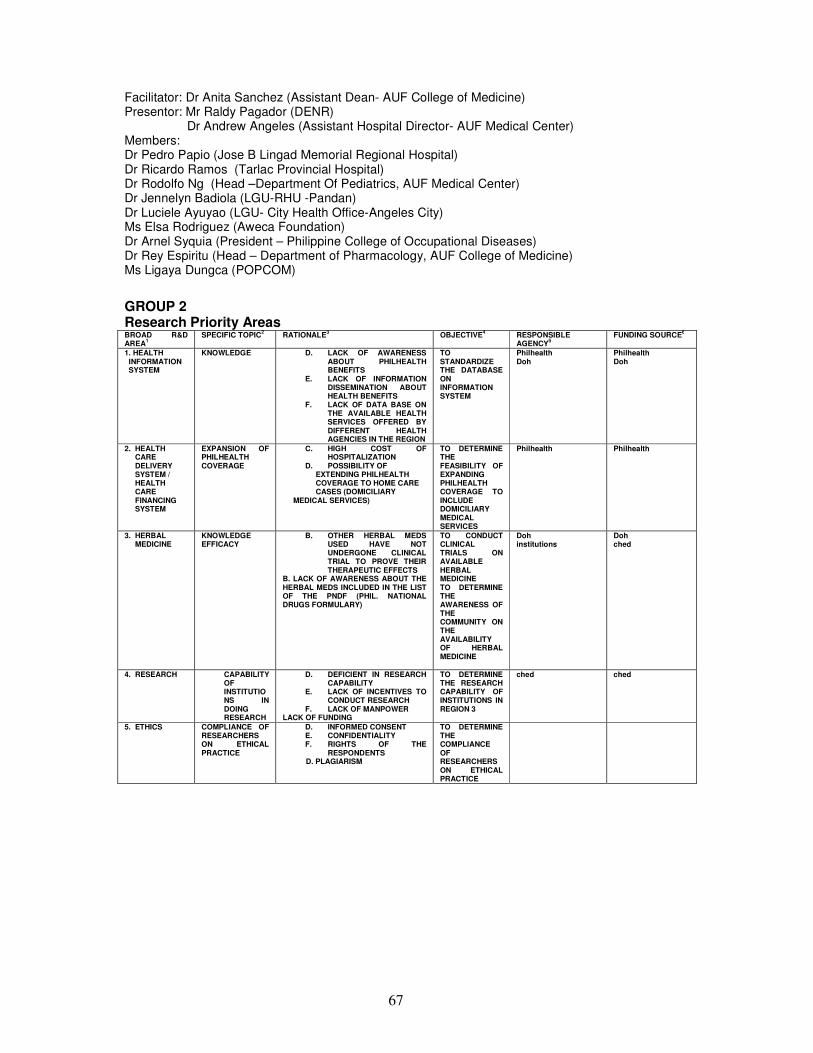
67
Facilitator: Dr Anita Sanchez (Assistant Dean- AUF College of Medicine) Presentor: Mr Raldy Pagador (DENR)
Dr Andrew Angeles (Assistant Hospital Director- AUF Medical Center) Members: Dr Pedro Papio (Jose B Lingad Memorial Regional Hospital) Dr Ricardo Ramos (Tarlac Provincial Hospital) Dr Rodolfo Ng (Head –Department Of Pediatrics, AUF Medical Center) Dr Jennelyn Badiola (LGU-RHU -Pandan) Dr Luciele Ayuyao (LGU- City Health Office-Angeles City) Ms Elsa Rodriguez (Aweca Foundation) Dr Arnel Syquia (President – Philippine College of Occupational Diseases) Dr Rey Espiritu (Head – Department of Pharmacology, AUF College of Medicine) Ms Ligaya Dungca (POPCOM)
GROUP 2 Research Priority Areas
BROAD R&D AREA1
SPECIFIC TOPIC2 RATIONALE3 OBJECTIVE4 RESPONSIBLE AGENCY5
FUNDING SOURCE6
1. HEALTH INFORMATION SYSTEM
KNOWLEDGE D. LACK OF AWARENESS ABOUT PHILHEALTH BENEFITS
E. LACK OF INFORMATION DISSEMINATION ABOUT HEALTH BENEFITS
F. LACK OF DATA BASE ON THE AVAILABLE HEALTH SERVICES OFFERED BY DIFFERENT HEALTH AGENCIES IN THE REGION
TO STANDARDIZE THE DATABASE ON INFORMATION SYSTEM
Philhealth Doh
Philhealth Doh
2. HEALTH CARE DELIVERY SYSTEM / HEALTH CARE FINANCING SYSTEM
EXPANSION OF PHILHEALTH COVERAGE
C. HIGH COST OF HOSPITALIZATION
D. POSSIBILITY OF EXTENDING PHILHEALTH COVERAGE TO HOME CARE CASES (DOMICILIARY
MEDICAL SERVICES)
TO DETERMINE THE FEASIBILITY OF EXPANDING PHILHEALTH COVERAGE TO INCLUDE DOMICILIARY MEDICAL SERVICES
Philhealth Philhealth
3. HERBAL MEDICINE
KNOWLEDGE EFFICACY
B. OTHER HERBAL MEDS USED HAVE NOT UNDERGONE CLINICAL TRIAL TO PROVE THEIR THERAPEUTIC EFFECTS
B. LACK OF AWARENESS ABOUT THE HERBAL MEDS INCLUDED IN THE LIST OF THE PNDF (PHIL. NATIONAL DRUGS FORMULARY)
TO CONDUCT CLINICAL TRIALS ON AVAILABLE HERBAL MEDICINE TO DETERMINE THE AWARENESS OF THE COMMUNITY ON THE AVAILABILITY OF HERBAL MEDICINE
Doh institutions
Doh ched
4. RESEARCH
CAPABILITY OF INSTITUTIONS IN DOING RESEARCH
D. DEFICIENT IN RESEARCH CAPABILITY
E. LACK OF INCENTIVES TO CONDUCT RESEARCH
F. LACK OF MANPOWER LACK OF FUNDING
TO DETERMINE THE RESEARCH CAPABILITY OF INSTITUTIONS IN REGION 3
ched
ched
5. ETHICS
COMPLIANCE OF RESEARCHERS ON ETHICAL PRACTICE
D. INFORMED CONSENT E. CONFIDENTIALITY F. RIGHTS OF THE
RESPONDENTS D. PLAGIARISM
TO DETERMINE THE COMPLIANCE OF RESEARCHERS ON ETHICAL PRACTICE
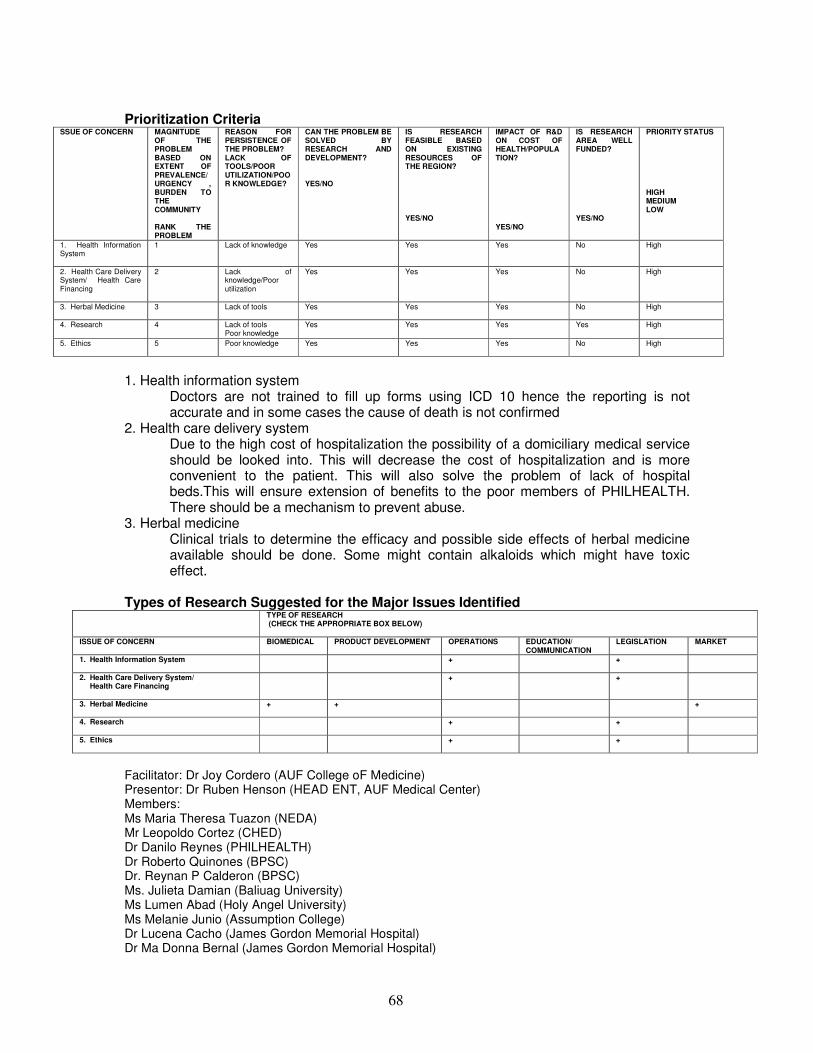
68
Prioritization Criteria SSUE OF CONCERN MAGNITUDE
OF THE PROBLEM BASED ON EXTENT OF PREVALENCE/ URGENCY , BURDEN TO THE COMMUNITY RANK THE PROBLEM
REASON FOR PERSISTENCE OF THE PROBLEM? LACK OF TOOLS/POOR UTILIZATION/POOR KNOWLEDGE?
CAN THE PROBLEM BE SOLVED BY RESEARCH AND DEVELOPMENT? YES/NO
IS RESEARCH FEASIBLE BASED ON EXISTING RESOURCES OF THE REGION? YES/NO
IMPACT OF R&D ON COST OF HEALTH/POPULATION? YES/NO
IS RESEARCH AREA WELL FUNDED? YES/NO
PRIORITY STATUS HIGH MEDIUM LOW
1. Health Information System
1 Lack of knowledge Yes Yes Yes No High
2. Health Care Delivery System/ Health Care Financing
2 Lack of knowledge/Poor utilization
Yes Yes Yes No High
3. Herbal Medicine
3 Lack of tools
Yes Yes Yes No High
4. Research
4 Lack of tools Poor knowledge
Yes Yes Yes Yes High
5. Ethics
5 Poor knowledge Yes Yes Yes No High
1. Health information system
Doctors are not trained to fill up forms using ICD 10 hence the reporting is not accurate and in some cases the cause of death is not confirmed
2. Health care delivery system Due to the high cost of hospitalization the possibility of a domiciliary medical service should be looked into. This will decrease the cost of hospitalization and is more convenient to the patient. This will also solve the problem of lack of hospital beds.This will ensure extension of benefits to the poor members of PHILHEALTH. There should be a mechanism to prevent abuse.
3. Herbal medicine Clinical trials to determine the efficacy and possible side effects of herbal medicine available should be done. Some might contain alkaloids which might have toxic effect.
Types of Research Suggested for the Major Issues Identified
TYPE OF RESEARCH (CHECK THE APPROPRIATE BOX BELOW)
ISSUE OF CONCERN BIOMEDICAL PRODUCT DEVELOPMENT OPERATIONS EDUCATION/ COMMUNICATION
LEGISLATION MARKET
1. Health Information System
+ +
2. Health Care Delivery System/ Health Care Financing
+ +
3. Herbal Medicine
+ + +
4. Research
+ +
5. Ethics
+ +
Facilitator: Dr Joy Cordero (AUF College oF Medicine) Presentor: Dr Ruben Henson (HEAD ENT, AUF Medical Center) Members: Ms Maria Theresa Tuazon (NEDA) Mr Leopoldo Cortez (CHED) Dr Danilo Reynes (PHILHEALTH) Dr Roberto Quinones (BPSC) Dr. Reynan P Calderon (BPSC) Ms. Julieta Damian (Baliuag University) Ms Lumen Abad (Holy Angel University) Ms Melanie Junio (Assumption College) Dr Lucena Cacho (James Gordon Memorial Hospital) Dr Ma Donna Bernal (James Gordon Memorial Hospital)
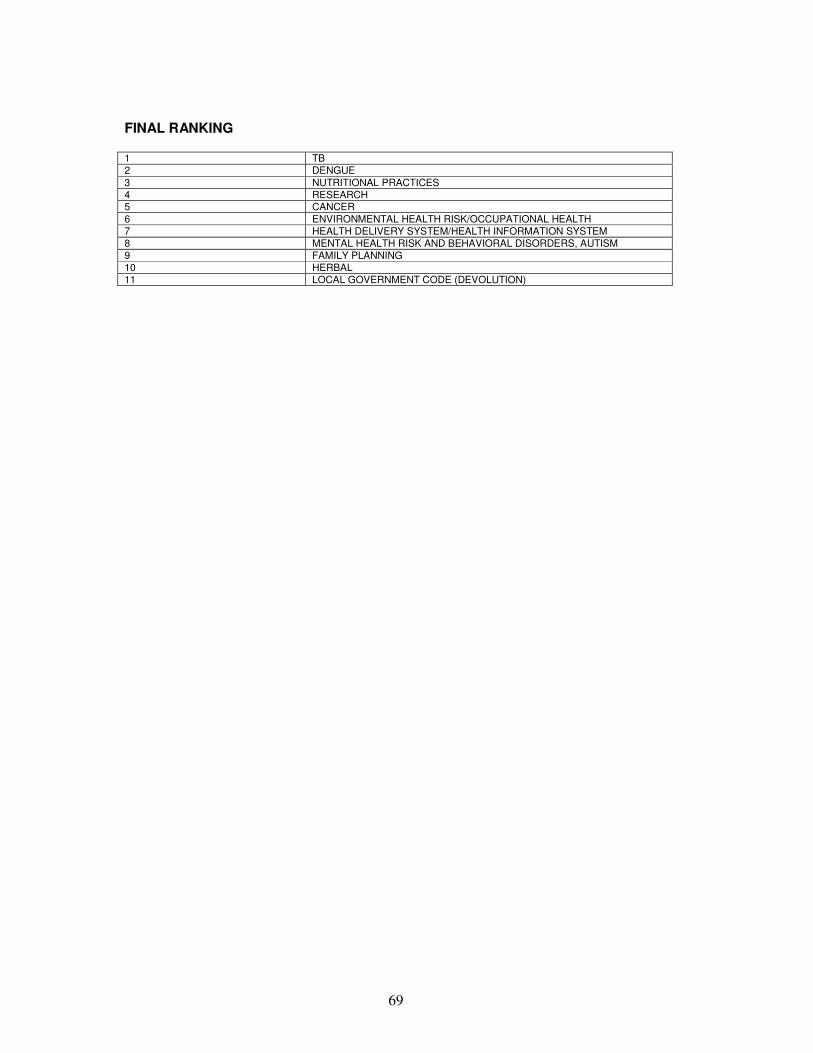
69
FINAL RANKING 1 TB
2 DENGUE
3 NUTRITIONAL PRACTICES
4 RESEARCH 5 CANCER
6 ENVIRONMENTAL HEALTH RISK/OCCUPATIONAL HEALTH
7 HEALTH DELIVERY SYSTEM/HEALTH INFORMATION SYSTEM
8 MENTAL HEALTH RISK AND BEHAVIORAL DISORDERS, AUTISM
9 FAMILY PLANNING
10 HERBAL
11 LOCAL GOVERNMENT CODE (DEVOLUTION)