Embed Size (px)
Citation preview
Health Quality Ontario The provincial advisor on the quality of health care in Ontario
May 2015
Primary Care Patient Experience
Survey: Support Guide
Page 1 of 29
Introduction The Primary Care Patient Experience Survey Support Guide is a handbook for practices planning to survey patients in a primary care setting. This guide will give you an understanding of the development of the survey, information to get started, details on routine survey processes, as well as methods to plan the survey, carry it out, and use the results to inform ongoing improvement efforts in your practice. Throughout this guide, we use the term ‘practice’ as broadly inclusive, representing any type of practice or team, regardless of the composition of health care providers. The first two sections provide a rationale and background on why it is important to collect and use patient experiences to inform quality improvement efforts. The remaining four sections provide information on the process of surveying and data collection. This guide is divided into the following sections:
1. The importance of understanding patient experiences
2. About the Primary Care Patient Experience Survey and Guide
3. Getting ready to survey your patients
4. Conducting the survey
5. Using your survey results for improvement We want to make it simple and easy to survey patients, so that you can use their experiences to improve their care, while at the same time improving physician and staff experiences. If you have any feedback on the current state of the survey or its support materials, please contact: [email protected]
Page 2 of 29
TABLE OF CONTENTS You can read through the entire Support Guide or you may click on a particular line in the table of
contents to be taken directly to that section.
Introduction................................................................................................................................................... 1
Table of Contents ......................................................................................................................................... 2
1. The Importance of Understanding Patient Experiences ......................................................................... 3
1.1 Why should I survey patients about their experiences? .......................................................... 3
1.2 Patient Experience Surveying in Ontario ................................................................................. 3
1.3 How was the Primary Care Patient Experience Survey developed? ........................................ 4
1.4 What is the advantage of using the Primary Care Patient Experience Survey rather than
creating my own?..................................................................................................................... 5
1.5 How does the survey support my Quality Improvement Plans? ............................................... 5
2. Primary Care Patient Experience Survey ................................................................................................ 7
2.1 About the Survey ..................................................................................................................... 7
2.2 Can I survey my patients on just a few questions that I am interested in? ............................. 7
2.3 How do I ensure patient confidentiality/privacy? ..................................................................... 7
3. Getting ready to survey your patients ...................................................................................................... 8
3.1 How to get everyone on board: Communication is key ........................................................... 8
3.2 How to promote the survey to your patients? ........................................................................... 9
3.3 How frequently do you need to survey?.................................................................................... 9
3.4 How many patients do you need to survey? .........................................................................10
4. Conducting the Survey: ..........................................................................................................................14
4.1. Online Survey Information .....................................................................................................14
4.2 Paper Survey Information ......................................................................................................14
4.3 How to enter and display your data .......................................................................................14
4.3.1 How to enter the data ...........................................................................................................15
5. How to Use Your Survey Results for improvement ...............................................................................16
5.1 Interpreting your data ............................................................................................................16
5.1.1 How do I use quantitative data results? ..............................................................................16
5.1.2 How do I use Qualitative Data? ..........................................................................................17
5.2 How do I use Change Ideas? ................................................................................................18
5.3 Moving from Choosing change Ideas to Testing Ideas .........................................................20
5.4 What Resources Are available? ............................................................................................21
5.5 Provincial Resources & initiatives ...........................................................................................23
Appendices ................................................................................................................................................25

Page 3 of 29
1. THE IMPORTANCE OF UNDERSTANDING PATIENT EXPERIENCES
1.1 WHY SHOULD I SURVEY PATIENTS ABOUT THEIR EXPERIENCES?
Recognizing that patients are experts about their own experiences over the entire journey of care. Understanding patient experiences are key to understanding the quality of care in your practice.
Measuring patient experiences on a regular basis provides a systematic and objective way to get insight into which processes in the practice are working well for them, and which can be improved.
By collecting data, establishing a baseline and analyzing this information, the practice can improve and redesign processes (e.g., methods to improve access or booking appointments), monitor progress over time, and improve patient experiences.
Focusing on robust activities that improve patient experiences (e.g., care coordination and patient engagement) may impact both satisfaction and health outcomes.
1.2 PATIENT EXPERIENCE SURVEYING IN ONTARIO
While surveys that measure primary care patient experiences do exist in Ontario, there is no standardized, practice-based tool that allows primary care practices to measure and monitor the experiences of their patients in order to make improvements to the quality of care delivery.
Although there are many surveys in use in Ontario, Health Quality Ontario (HQO) recognizes the value of using a standardized tool, and the necessity to develop a common survey as a support for primary care providers and practices focused on improving patient experiences. The use of a common survey enables practices to have confidence in the results and, if they choose, compare their performance to that of their peers and establish shared benchmarks.
The Primary Care Patient Experience Survey was developed by Health Quality Ontario in collaboration with the Association of Family Health Teams of Ontario, the Association of Ontario Health Centres, the Ontario College of Family Physicians, and the Ontario Medical Association. Patients, family physicians, nurse practitioners, and primary care teams also contributed to the development of the survey.
The Primary Care Patient Experience Survey and this Support Guide are designed to help primary care practices achieve the goal of improving access to care and the care experiences of their patients.
Page 4 of 29
1.3 HOW WAS THE PRIMARY CARE PATIENT EXPERIENCE SURVEY DEVELOPED?
A rigorous methodology was employed through the Primary Care Patient Experience Survey development process. A core principle was that the tool would focus on specific areas of the patient’s experience in enough detail to inform local quality improvement. Below is a summary of the key steps taken in the development of the survey:
1 Reviewed existing literature and Ontario-based activities: This review included an extensive environmental scan of published and non-published relevant literature, grey literature and Quality Improvement Plan (QIP) documents on patient experience.
2 Conducted a review of other survey instruments in order to identify key survey dimensions and survey questions: A cross-walk of survey questions from a variety of sources was created to identify common questions. Consultation with primary care stakeholders identified which questions would provide primary care practices with meaningful data to drive improvement and which questions have system-level data available.
3 Drafted an initial version of the Primary Care Patient Experience Survey: A draft of the
Primary Care Patient Experience Survey was developed based on literature reviews, existing surveys and through consultations with key stakeholders (i.e., stakeholder engagement sessions and key informant interviews).
4 Conducted a psychometric test of the initial version of the survey to assess clarity, generalizability and validity and to ensure that the questions worked as intended: The initial survey was psychometrically tested using a panel of 800 Ontarians who had visited their primary care physician in the past year. The survey demonstrated strong psychometric properties and reliability.
5 Finalized draft survey for stakeholder testing: Following psychometric testing, a panel
of stakeholders reviewed the results and survey questions to finalize the survey for testing. This was an iterative and inclusive process.
6 Conducted testing of the draft survey: A diverse set of Ontario’s primary care practices
tested the draft survey in order to confirm its strengths and weaknesses. An Advisory Committee, comprised of primary care stakeholders (listed on page 4) finalized the Primary Care Patient Experience Survey based on the results of this testing in preparation for the pilot test of the survey.
7 Pilot Test: The Survey and Support Guide underwent pilot testing with 20 practices to
assess the feasibility of administering the survey and the use of the support materials. The purpose of the pilot test was to ensure applicability of the survey’s content, processes, and supports, and feasibility of practice-level administration to make any improvements prior to the final release of the survey.
The pilot test included interviews with staff from all practices participating in the pilot; interviews with patients who completed the Primary Care Patient Experience Survey; a web survey of practice staff to augment interview findings; site visits to observe the survey administration process; and review of aggregate survey data collected from patients. For a copy of the summary report please contact [email protected].
Page 5 of 29
1.4 WHAT IS THE ADVANTAGE OF USING THE PRIMARY CARE PATIENT EXPERIENCE SURVEY RATHER THAN CREATING MY OWN?
While designing your own survey may seem like a good idea, rigorous survey development can take a lot of time and work, and can lead to many challenges. Completion of a comprehensive literature review and evaluation of alternative tools is time consuming and complex. Survey questions have to be developed, validated and tested (for purpose, clarity, consistency). Finally, team members, including patients, need to feel confident that the instrument developed will measure the right things and will be used in a way that will lead to improvement.
The questions in the Primary Care Patient Experience Survey have already been tested and validated to make sure that the questions work as intended and that the majority of respondents understand the questions and respond accordingly.
There are also several questions in the Primary Care Patient Experience Survey that align directly to the measures in primary care Quality Improvement Plans (QIPs). For more information see section 1.5.
1.5 HOW DOES THE SURVEY SUPPORT MY QUALITY IMPROVEMENT PLANS?
System-wide quality improvement is the goal of all health care sectors and Quality Improvement Plans (QIPs) are a key enabler of this vision.1 A QIP is a formal, documented set of quality commitments aligned with system and provincial priorities that a health care organization makes to its patients, staff and community to improve quality through focused targets and actions.
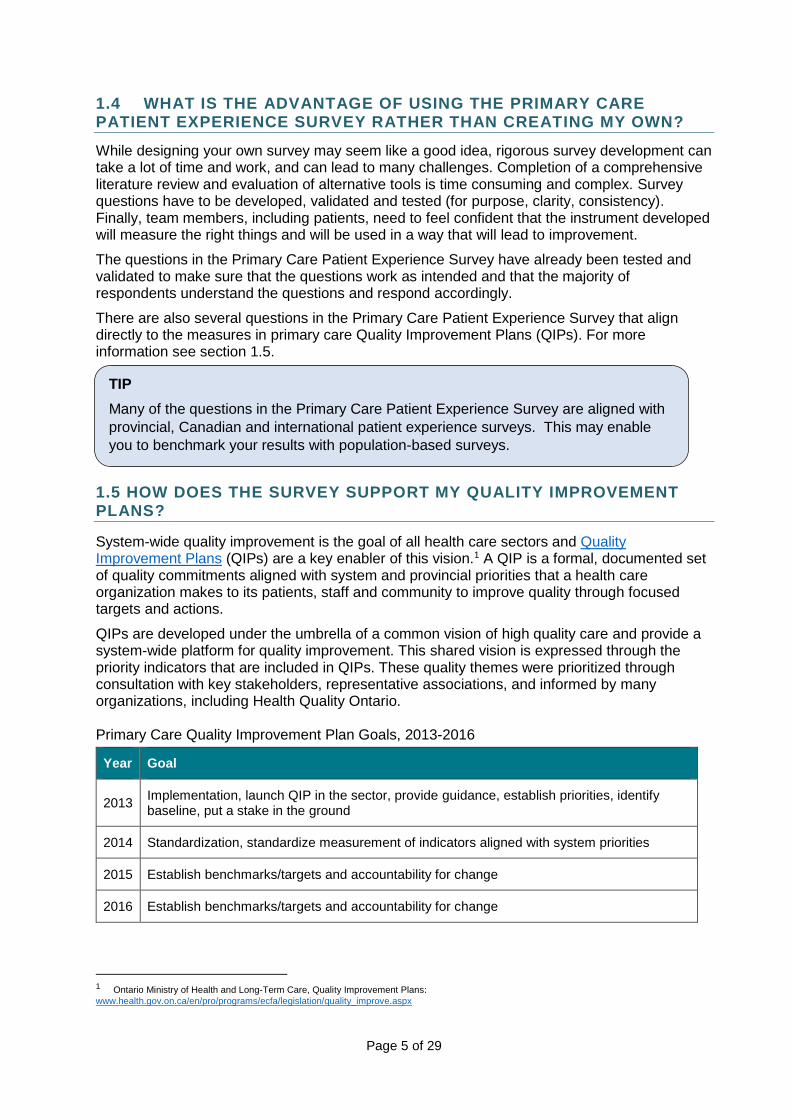
QIPs are developed under the umbrella of a common vision of high quality care and provide a system-wide platform for quality improvement. This shared vision is expressed through the priority indicators that are included in QIPs. These quality themes were prioritized through consultation with key stakeholders, representative associations, and informed by many organizations, including Health Quality Ontario. Primary Care Quality Improvement Plan Goals, 2013-2016
Year Goal
2013 Implementation, launch QIP in the sector, provide guidance, establish priorities, identify baseline, put a stake in the ground
2014 Standardization, standardize measurement of indicators aligned with system priorities
2015 Establish benchmarks/targets and accountability for change
2016 Establish benchmarks/targets and accountability for change
1 Ontario Ministry of Health and Long-Term Care, Quality Improvement Plans:
www.health.gov.on.ca/en/pro/programs/ecfa/legislation/quality_improve.aspx
TIP
Many of the questions in the Primary Care Patient Experience Survey are aligned with
provincial, Canadian and international patient experience surveys. This may enable
you to benchmark your results with population-based surveys.

Page 6 of 29
The Primary Care Patient Experience Survey offers a level of detail that can inform your organization’s QIP. There are several questions that align directly with primary care performance measures, including:
Survey question (Section 5) QIP priority indicator
Q6.b The last time you were sick or were concerned you had a health problem, how many days did it take from when you first tried to see your doctor or nurse practitioner to when you actually SAW him/her or someone else in their office?
Percent of patients/clients able to see a doctor or nurse practitioner on the same day or next day, when needed the last time they were sick.
Q7.a When you see your doctor or nurse practitioner, how often do they or someone else in the office give you an opportunity to ask questions about recommended treatment?
Percent of patients who stated that when they see the doctor or nurse practitioner, they or someone else in the office (always/often) give them an opportunity to ask questions about recommended treatment.
Q7.b When you see your doctor or nurse practitioner, how often do they or someone else in the office involve you as much as you want to be in decisions about your care and treatment?
Percent of patients who stated that when they see the doctor or nurse practitioner, they or someone else in the office (always/often) involve them as much as they want to be in decisions about their care and treatment.
Q7.c When you see your doctor or nurse practitioner, how often do they or someone else in the office spend enough time with you?
Percent of patients who stated that when they see the doctor or nurse practitioner, they or someone else in the office (always/often) spend enough time with them.
Page 7 of 29
2. PRIMARY CARE PATIENT EXPERIENCE SURVEY
2.1 ABOUT THE SURVEY
The survey contains questions aligned with the Quality Improvement Plans.
The survey captures the overall experience of the patient’s most recent visit, and the patient’s general experiences over the last year.
Testing has confirmed that in most cases, the survey can be completed in 10-15 minutes.
2.2 CAN I SURVEY MY PATIENTS ON JUST A FEW QUESTIONS THAT I
AM INTERESTED IN?
We have not tested a modular approach in which you survey patients only on selected questions. This method may change the reliability and validity of the tool, so it isn’t possible to say with certainty whether it would be appropriate to use it in this manner. Practices may also miss key aspects of their patient’s experiences by pre-selecting only few questions.
If you have a specific question(s) related to your practice that you want to add to the questionnaire, you may do so. For example, if your team would like to work on improvements to a specific area such as improving the front-end office processes, asking those specific questions in addition to the QIP queries might be useful to the practice.
2.3 HOW DO I ENSURE PATIENT CONFIDENTIALITY/PRIVACY?
Privacy and confidentiality are essential and play a key role in health care provider-patient relationships by establishing trust and contributing to a more patient-centred health system.
It is essential to assure patients of the confidentiality of these documents by keeping the following rule in mind: When collecting survey data, ensure no patient identifiers are evident and provide a secure drop box to received completed surveys. This is to ensure that patients are able to be as honest as possible without fear of any repercussions.
When collecting the survey please reassure the patient about the confidentiality of the collection process.
Demonstrate appreciation and respect for your patients’ contributions by sharing their feedback (ideally displaying results openly in your practice) and taking action to improve the experience of care.
Some steps to ensure confidentiality are:
Provide a private space to fill out the survey
Ensure the drop box is marked ‘Confidential’
Ensure the survey itself contains no identifying information
Tools & Resources
Personal Health Information Protection Act, 2004: http://www.e-laws.gov.on.ca/html/statutes/english/elaws_statutes_04p03_e.htm
The College of Physicians and Surgeons of Ontario, Confidentiality of Personal Health Information: http://www.cpso.on.ca/policies-publications/policy/confidentiality-of-personal-health-
information
Page 8 of 29
3. GETTING READY TO SURVEY YOUR PATIENTS
The goal of conducting the Primary Care Patient Experience Survey is to improve patient experiences. The survey will help practices develop a better understanding of their patients’ experience of care and identify opportunities to improve the quality of care they deliver. Your chances of success are improved if your staff and providers are all in agreement that this is important and that it will improve the experience of your patients, staff and the practice overall.
3.1 HOW TO GET EVERYONE ON BOARD: COMMUNICATION IS KEY
To get everyone in your practice on board, start by determining how you will communicate with your staff about what you are trying to achieve through patient surveying. Here are a few points to consider when communicating with your practice:
Have a meeting with all practice staff, preferably at the same time (e.g., at a staff meeting).
Make sure everyone understands the purpose of the survey and, if they are going to be involved, what it will mean for them (e.g., that it is to be used only for improvement - not for staff evaluation, judgment or performance measurement).
Have staff complete the survey themselves to ensure an understanding of content and flow of questions.
Ensure everyone understands how the survey will be used and what types of improvement projects might result from the findings.
Emphasize that while getting started with surveying there may be an increased workload to staff, but the long-term benefits of surveying will provide value to the practice. Ongoing communication with staff and recognizing the impact of the survey is important.
Be specific about identifying and assigning roles and responsibilities.
This is work that is being done across the province in primary care and there is a potential to compare data with other practices across the system.
Reinforce the importance of the patient experience survey to your practice by establishing a space in your practice to display information. Start by putting up an information sheet/poster about the survey process before surveying begins and when surveying, then add to it as data becomes available and actions are taken as a result of that data.
Explain the short-term and long-term benefit to staff and patients.
o Example of short-term benefits (within one year): Addressing specific practice concerns as they come up (e.g. staff training, office hours, signs to direct patient to the office).
o Example of long-terms benefits (over a few years): Strengthening patients’ relationships with the staff and providers and improving health outcomes by addressing patient concerns and building confidence and mutual respect.
Tools & Resources
See Appendix B for sample office poster.
Page 9 of 29
3.2 HOW TO PROMOTE THE SURVEY TO YOUR PATIENTS?
It is recommended that you promote the survey to your patients before administering it to ensure they are aware and informed. Several techniques you can employ include:
Posters and other in-office visuals should be used to introduce (or reinforce) the survey, its importance, and how it will be used.
Information for patients, including a short explanation of the survey and its purpose should be posted prominently in the practice.
Email and electronic or printed newsletters.
Communicate to your patients on an ongoing basis:
Foster a feedback loop with patients and staff.
o “We heard what you said, therefore we are introducing X or Y”, or “X% of you told us Y”. This will encourage the patients to fill-out the entire survey and it will also increase the number of participants taking the survey.
If you cannot address an issue raised in the survey, recognize its value and consider a mechanism to ensure that the feedback was heard but cannot be addressed at this time (e.g., via poster, email, newsletter).
Reassure patients that their feedback will be confidential.
3.3 HOW FREQUENTLY DO YOU NEED TO SURVEY?
A survey schedule should be used to make sure a comprehensive view of all patient experiences are captured by the survey.
When planning to survey patients, it is important to consider: o How many patients do we need to survey? o How frequently do we want to survey? o When do we know we have enough data for our baseline?
For example, in order to reach 100 completed surveys it would be necessary to schedule: o Year-round rolling surveys:
2-3 completed surveys each week 8-10 completed surveys each month
o One week per month: 8-10 completed surveys o One week per quarter: 25-30 completed surveys
Being responsive, even to a small amount of feedback will encourage patients to participate, as they can tell their voices are being heard.
Change is frequent within a practice (e.g. new providers, new staff, and new patients). A year-round, rolling approach keeps staff and health care providers up-to-date with changes in the practice, what is working well and what is being worked on.
There is always room for improvement; therefore it is necessary to survey patients on an ongoing basis.
TIP
We recommend a year-round rolling approach in which all patients would have the opportunity to complete the survey.
Page 10 of 29
The more often you survey, the sooner you will see evidence of change in your data. If a year-round, rolling approach is perceived as too onerous, our recommendation is to identify one week per month to conduct the survey (less ideal is one week every quarter).
It is important to have a survey schedule in order to capture the complete picture of the practice throughout the year. For example, the effect of the seasons and other variables such as conferences, vacations, etc.
It is easier for staff to implement the survey throughout the year, rather than dedicating a few busy weeks per year to conducting the survey.
It is not recommended that the survey be implemented for a short period within a year (e.g., for just one month), due to the fact that: o The results may not be representative of your patient population o The results could be influenced by seasonal variance, vacation, etc. o It may be too time consuming to do all the surveys in such a short period
3.4 HOW MANY PATIENTS DO YOU NEED TO SURVEY?
Determining sample size is important because samples that are too large require time and resources without adding to the learning, while samples that are too small may not provide enough data to inform quality improvement decisions. The sample should represent the variety of patients from your practice population.
There are two periods during which it is important to consider sample size: when gathering data and when testing quality improvement ideas. 1. Gathering Data: Collect baseline data to determine your starting point. Once you identify
areas for improvement, baseline data will allow you to monitor your progress toward the improvements you want to see.
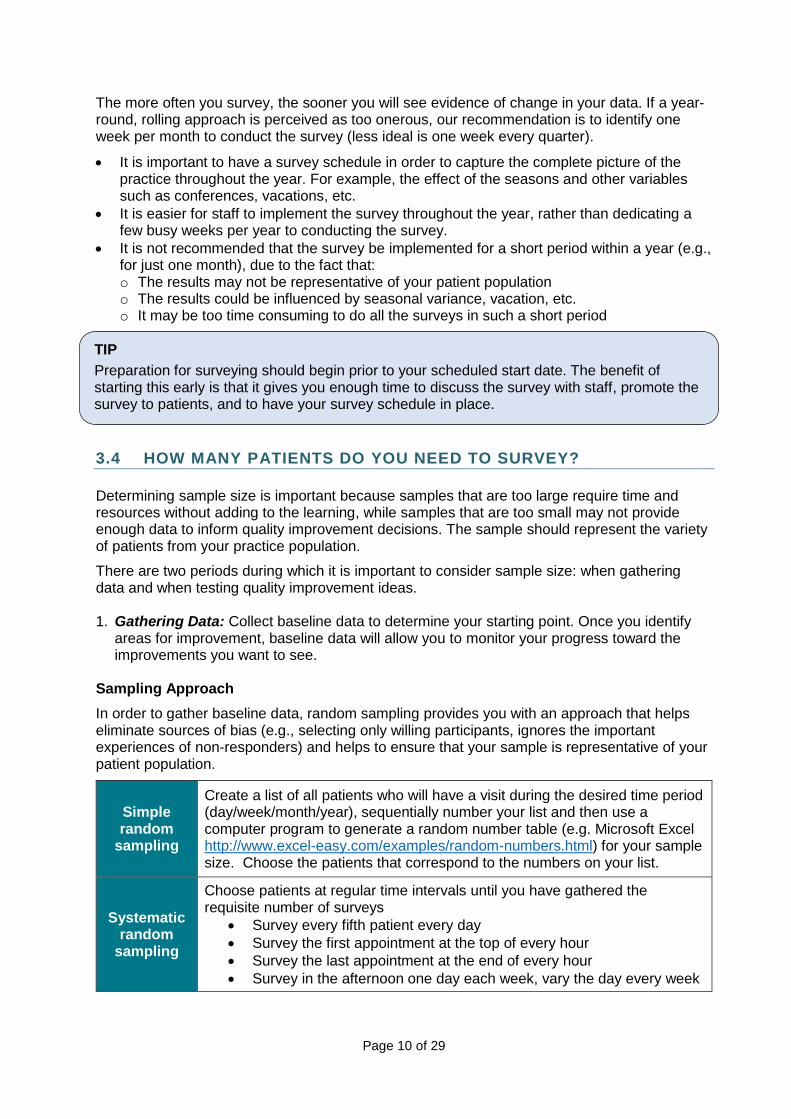
Sampling Approach
In order to gather baseline data, random sampling provides you with an approach that helps eliminate sources of bias (e.g., selecting only willing participants, ignores the important experiences of non-responders) and helps to ensure that your sample is representative of your patient population.
Simple random
sampling
Create a list of all patients who will have a visit during the desired time period (day/week/month/year), sequentially number your list and then use a computer program to generate a random number table (e.g. Microsoft Excel http://www.excel-easy.com/examples/random-numbers.html) for your sample size. Choose the patients that correspond to the numbers on your list.
Systematic random
sampling
Choose patients at regular time intervals until you have gathered the requisite number of surveys
Survey every fifth patient every day
Survey the first appointment at the top of every hour
Survey the last appointment at the end of every hour
Survey in the afternoon one day each week, vary the day every week
TIP
Preparation for surveying should begin prior to your scheduled start date. The benefit of starting this early is that it gives you enough time to discuss the survey with staff, promote the survey to patients, and to have your survey schedule in place.
Page 11 of 29
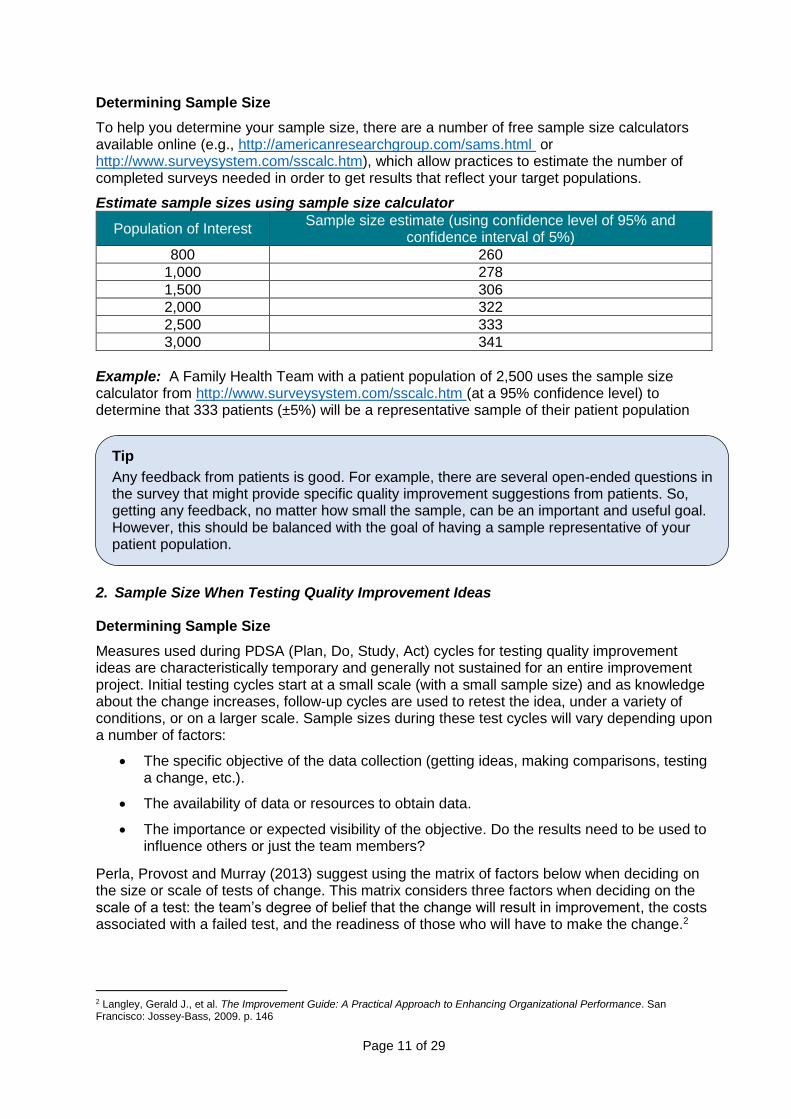
Determining Sample Size
To help you determine your sample size, there are a number of free sample size calculators available online (e.g., http://americanresearchgroup.com/sams.html or http://www.surveysystem.com/sscalc.htm), which allow practices to estimate the number of completed surveys needed in order to get results that reflect your target populations.
Estimate sample sizes using sample size calculator
Population of Interest Sample size estimate (using confidence level of 95% and
confidence interval of 5%)
800 260
1,000 278
1,500 306
2,000 322
2,500 333
3,000 341
Example: A Family Health Team with a patient population of 2,500 uses the sample size calculator from http://www.surveysystem.com/sscalc.htm (at a 95% confidence level) to determine that 333 patients (±5%) will be a representative sample of their patient population
2. Sample Size When Testing Quality Improvement Ideas Determining Sample Size
Measures used during PDSA (Plan, Do, Study, Act) cycles for testing quality improvement ideas are characteristically temporary and generally not sustained for an entire improvement project. Initial testing cycles start at a small scale (with a small sample size) and as knowledge about the change increases, follow-up cycles are used to retest the idea, under a variety of conditions, or on a larger scale. Sample sizes during these test cycles will vary depending upon a number of factors:
The specific objective of the data collection (getting ideas, making comparisons, testing a change, etc.).
The availability of data or resources to obtain data.
The importance or expected visibility of the objective. Do the results need to be used to influence others or just the team members?
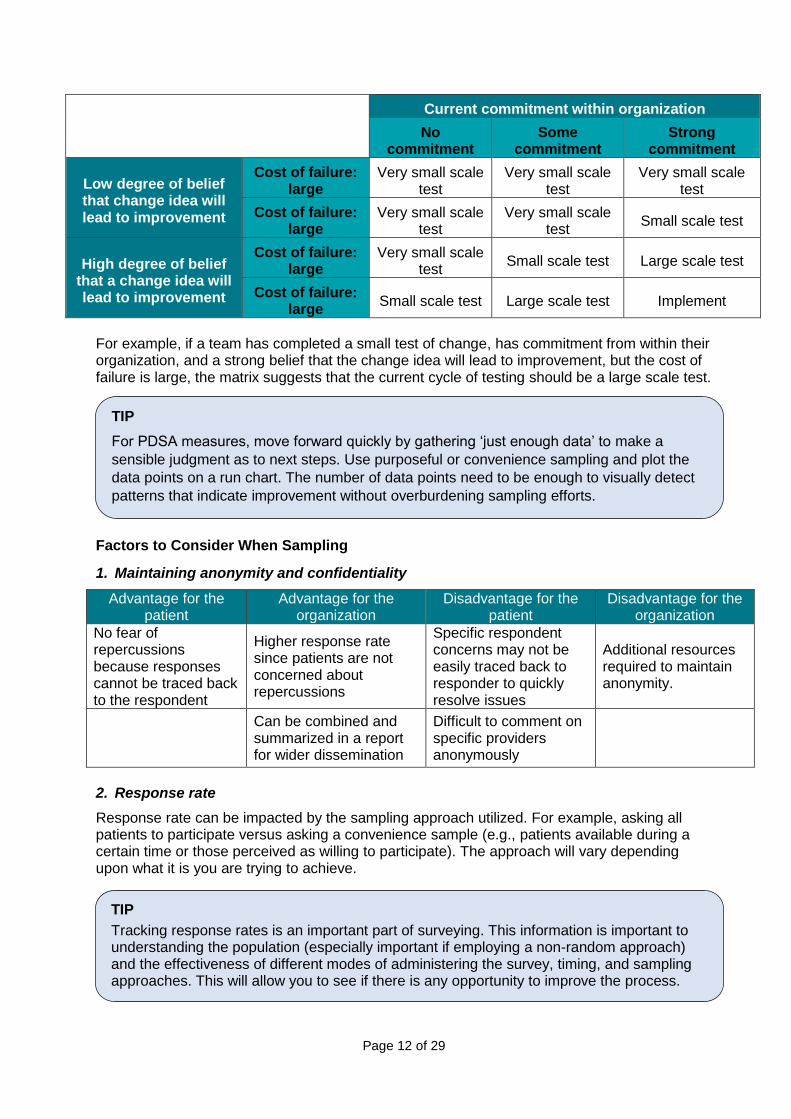
Perla, Provost and Murray (2013) suggest using the matrix of factors below when deciding on the size or scale of tests of change. This matrix considers three factors when deciding on the scale of a test: the team’s degree of belief that the change will result in improvement, the costs associated with a failed test, and the readiness of those who will have to make the change.2
2 Langley, Gerald J., et al. The Improvement Guide: A Practical Approach to Enhancing Organizational Performance. San Francisco: Jossey-Bass, 2009. p. 146
Tip
Any feedback from patients is good. For example, there are several open-ended questions in the survey that might provide specific quality improvement suggestions from patients. So, getting any feedback, no matter how small the sample, can be an important and useful goal. However, this should be balanced with the goal of having a sample representative of your patient population.
Non
Page 12 of 29
Current commitment within organization
No commitment
Some commitment
Strong commitment
Low degree of belief that change idea will lead to improvement
Cost of failure: large
Very small scale test
Very small scale test
Very small scale test
Cost of failure: large
Very small scale test
Very small scale test
Small scale test
High degree of belief that a change idea will lead to improvement
Cost of failure: large
Very small scale test
Small scale test Large scale test
Cost of failure: large
Small scale test Large scale test Implement
For example, if a team has completed a small test of change, has commitment from within their organization, and a strong belief that the change idea will lead to improvement, but the cost of failure is large, the matrix suggests that the current cycle of testing should be a large scale test. Factors to Consider When Sampling
1. Maintaining anonymity and confidentiality
Advantage for the patient
Advantage for the organization
Disadvantage for the patient
Disadvantage for the organization
No fear of repercussions because responses cannot be traced back to the respondent
Higher response rate since patients are not concerned about repercussions
Specific respondent concerns may not be easily traced back to responder to quickly resolve issues
Additional resources required to maintain anonymity.
Can be combined and summarized in a report for wider dissemination
Difficult to comment on specific providers anonymously
2. Response rate
Response rate can be impacted by the sampling approach utilized. For example, asking all patients to participate versus asking a convenience sample (e.g., patients available during a certain time or those perceived as willing to participate). The approach will vary depending upon what it is you are trying to achieve.
TIP
For PDSA measures, move forward quickly by gathering ‘just enough data’ to make a
sensible judgment as to next steps. Use purposeful or convenience sampling and plot the
data points on a run chart. The number of data points need to be enough to visually detect
patterns that indicate improvement without overburdening sampling efforts.
TIP
Tracking response rates is an important part of surveying. This information is important to understanding the population (especially important if employing a non-random approach) and the effectiveness of different modes of administering the survey, timing, and sampling approaches. This will allow you to see if there is any opportunity to improve the process.
Page 13 of 29
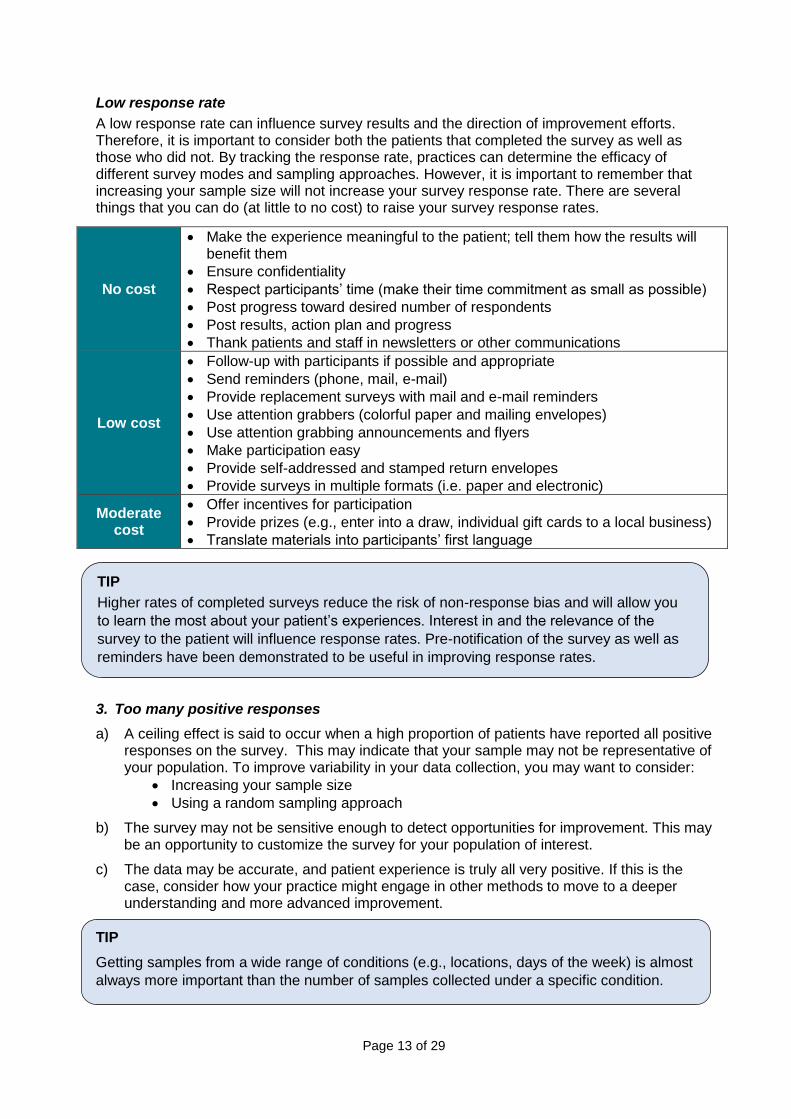
Low response rate
A low response rate can influence survey results and the direction of improvement efforts. Therefore, it is important to consider both the patients that completed the survey as well as those who did not. By tracking the response rate, practices can determine the efficacy of different survey modes and sampling approaches. However, it is important to remember that increasing your sample size will not increase your survey response rate. There are several things that you can do (at little to no cost) to raise your survey response rates.
No cost
Make the experience meaningful to the patient; tell them how the results will benefit them
Ensure confidentiality
Respect participants’ time (make their time commitment as small as possible)
Post progress toward desired number of respondents
Post results, action plan and progress
Thank patients and staff in newsletters or other communications
Low cost
Follow-up with participants if possible and appropriate
Send reminders (phone, mail, e-mail)
Provide replacement surveys with mail and e-mail reminders
Use attention grabbers (colorful paper and mailing envelopes)
Use attention grabbing announcements and flyers
Make participation easy
Provide self-addressed and stamped return envelopes
Provide surveys in multiple formats (i.e. paper and electronic)
Moderate cost
Offer incentives for participation
Provide prizes (e.g., enter into a draw, individual gift cards to a local business)
Translate materials into participants’ first language
3. Too many positive responses
a) A ceiling effect is said to occur when a high proportion of patients have reported all positive responses on the survey. This may indicate that your sample may not be representative of your population. To improve variability in your data collection, you may want to consider:
Increasing your sample size
Using a random sampling approach
b) The survey may not be sensitive enough to detect opportunities for improvement. This may be an opportunity to customize the survey for your population of interest.
c) The data may be accurate, and patient experience is truly all very positive. If this is the case, consider how your practice might engage in other methods to move to a deeper understanding and more advanced improvement.
TIP
Higher rates of completed surveys reduce the risk of non-response bias and will allow you
to learn the most about your patient’s experiences. Interest in and the relevance of the
survey to the patient will influence response rates. Pre-notification of the survey as well as
reminders have been demonstrated to be useful in improving response rates.
TIP
Getting samples from a wide range of conditions (e.g., locations, days of the week) is almost
always more important than the number of samples collected under a specific condition.
Page 14 of 29
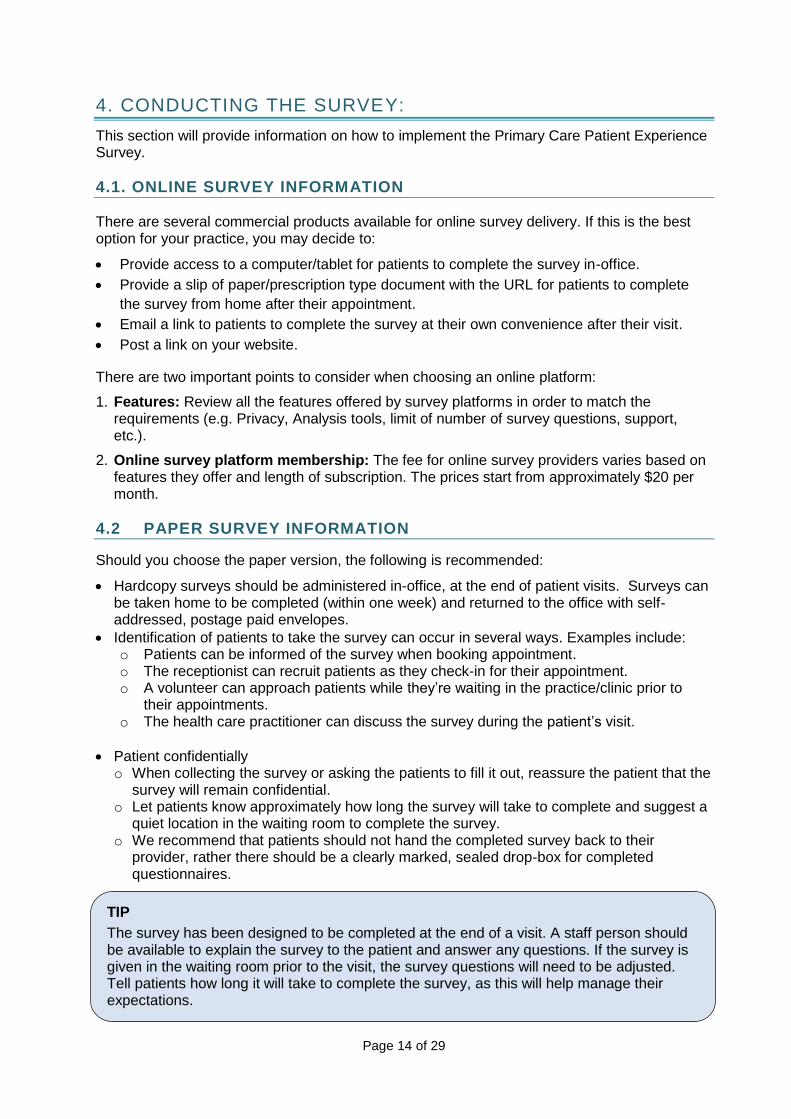
4. CONDUCTING THE SURVEY:
This section will provide information on how to implement the Primary Care Patient Experience Survey.
4.1. ONLINE SURVEY INFORMATION
There are several commercial products available for online survey delivery. If this is the best option for your practice, you may decide to:
Provide access to a computer/tablet for patients to complete the survey in-office.
Provide a slip of paper/prescription type document with the URL for patients to complete
the survey from home after their appointment.
Email a link to patients to complete the survey at their own convenience after their visit.
Post a link on your website.
There are two important points to consider when choosing an online platform:
1. Features: Review all the features offered by survey platforms in order to match the requirements (e.g. Privacy, Analysis tools, limit of number of survey questions, support, etc.).
2. Online survey platform membership: The fee for online survey providers varies based on features they offer and length of subscription. The prices start from approximately $20 per month.
4.2 PAPER SURVEY INFORMATION
Should you choose the paper version, the following is recommended:
Hardcopy surveys should be administered in-office, at the end of patient visits. Surveys can be taken home to be completed (within one week) and returned to the office with self-addressed, postage paid envelopes.
Identification of patients to take the survey can occur in several ways. Examples include: o Patients can be informed of the survey when booking appointment. o The receptionist can recruit patients as they check-in for their appointment. o A volunteer can approach patients while they’re waiting in the practice/clinic prior to
their appointments. o The health care practitioner can discuss the survey during the patient’s visit.
Patient confidentially o When collecting the survey or asking the patients to fill it out, reassure the patient that the
survey will remain confidential. o Let patients know approximately how long the survey will take to complete and suggest a
quiet location in the waiting room to complete the survey. o We recommend that patients should not hand the completed survey back to their
provider, rather there should be a clearly marked, sealed drop-box for completed questionnaires.
4.3 HOW TO ENTER AND DISPLAY YOUR DATA
TIP
The survey has been designed to be completed at the end of a visit. A staff person should be available to explain the survey to the patient and answer any questions. If the survey is given in the waiting room prior to the visit, the survey questions will need to be adjusted. Tell patients how long it will take to complete the survey, as this will help manage their expectations.

Page 15 of 29
4.3. HOW TO ENTER THE DATA
You may choose to enter data in one of two ways:
1. Import data through an online survey platform into a database, such as Microsoft Excel.
2. Enter data into your own database. When entering data, it is recommended that at least 75% of the questions be answered for it to be included in the analysis. However, qualitative feedback and comments often provide valuable insights.

Page 16 of 29
5. HOW TO USE YOUR SURVEY RESULTS FOR IMPROVEMENT
The data collected from the Primary Care Patient Experience Survey can help you identify areas in which your practice is performing well and where there may be room for improvement.
5.1 INTERPRETING YOUR DATA
The Primary Care Patient Experience Survey asks patients to rate their experiences on a scale and asks qualitative questions that encourage patient feedback, allowing those being surveyed to express their ideas in their own words.
5.1.1 HOW DO I USE QUANTITATIVE DATA RESULTS?
Consider how the team in this example interpreted the results of Question 2, which asks patients to rate their experience contacting the office. The team noted that contacting the office was a common source of concern among patients. The table below summarizes their data:
Question 2 Poor Fair Good Very Good Excellent
a. The length of time it took between making your appointment and the visit you just had
30 15 30 15 10
b. Your overall experience accessing the office/clinic
– 20 60 20 –
For Question 2a, approximately 55% of the respondents felt the time between making the appointment and the actual visit was good, very good or excellent, while 45% of respondents felt it was only fair or poor. The team decided to probe for reasons why 45% of patients reported less than positive experiences. They didn’t want to jump to conclusions and used quality improvement tools to help them understand some of the root causes of the problem.
TIP
Identify survey questions that receive low scores and prioritize improving those areas (i.e., connect them to your strategic goals or propose them as an area of focus for the Board). Benchmark results against:
Your previous survey results
Your peers
Industry standard
Best practices
“Bright spots” in primary care
TIP: Digging Deeper
A Fishbone Diagram is a tool to help your team create a common understanding of potential sources that contribute to the problem in question.
“5 Whys” is a simple brainstorming and problem-solving tool that can help teams move beyond the “usual” or “surface” answers to identify root causes of a problem.
Process Mapping helps identify and eliminate non-essential steps in a process.
Page 17 of 29
Using Run Charts
A run chart is a simple, graphical display of your data, plotted over time. Improvements occur over time and a run chart is a practical way of displaying and analyzing quantitative data. Run charts have several benefits:
They allow you to see how a system or process is performing.
They can help to determine if changes resulted in improvement.
They help to determine if the gains made by your improvement were sustained.
Baseline data from your survey should be used to determine the median on a run chart. The median is a horizontal line across the run chart where half the data points are above and half the data points are below the line. Establishing a baseline median can be used to determine if changes are having the desired effect. Annotations on run charts can be used to “tell the story” of changes made. For more information on run charts you can go to Creating Run Charts on the Quality Compass, or for examples of run charts, visit HQO’s website.
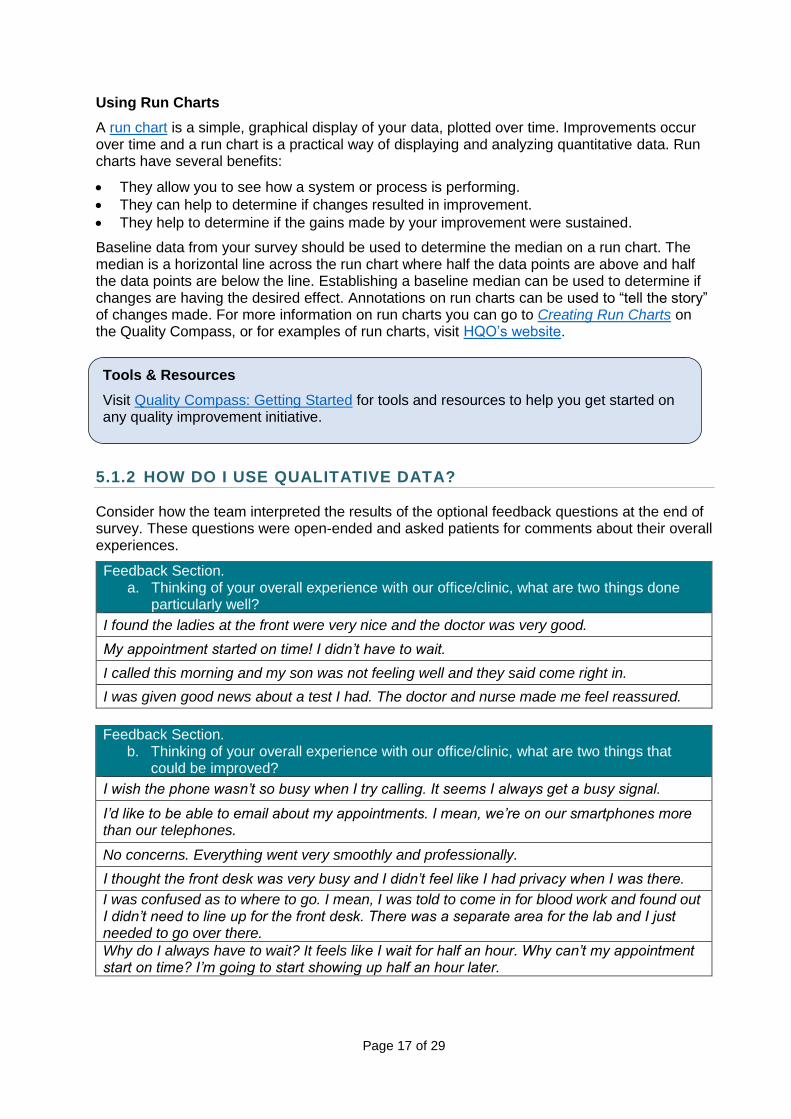
5.1.2 HOW DO I USE QUALITATIVE DATA?
Consider how the team interpreted the results of the optional feedback questions at the end of survey. These questions were open-ended and asked patients for comments about their overall experiences.
Feedback Section. a. Thinking of your overall experience with our office/clinic, what are two things done
particularly well?
I found the ladies at the front were very nice and the doctor was very good.
My appointment started on time! I didn’t have to wait.
I called this morning and my son was not feeling well and they said come right in.
I was given good news about a test I had. The doctor and nurse made me feel reassured.
Feedback Section. b. Thinking of your overall experience with our office/clinic, what are two things that
could be improved?
I wish the phone wasn’t so busy when I try calling. It seems I always get a busy signal.
I’d like to be able to email about my appointments. I mean, we’re on our smartphones more than our telephones.
No concerns. Everything went very smoothly and professionally.
I thought the front desk was very busy and I didn’t feel like I had privacy when I was there.
I was confused as to where to go. I mean, I was told to come in for blood work and found out I didn’t need to line up for the front desk. There was a separate area for the lab and I just needed to go over there.
Why do I always have to wait? It feels like I wait for half an hour. Why can’t my appointment start on time? I’m going to start showing up half an hour later.
Tools & Resources
Visit Quality Compass: Getting Started for tools and resources to help you get started on any quality improvement initiative.
Page 18 of 29
As you can see, there was a variety of comments and concerns, so the team decided to group comments into themes. These themes helped the team identify areas for improvement. It was important for the team not to jump to conclusions. For example, someone commented that the phone was always busy and they couldn’t get through easily. Before adding more telephone lines, the team worked to understand the root cause of that process by asking themselves the following questions:
Is there a particular day of the week when wait times may be longer?
Is there an improvement to test that could reduce waiting on that day?
Would some signage help patients understand where to go?
Are there some groups of patients that need to be communicated with differently?
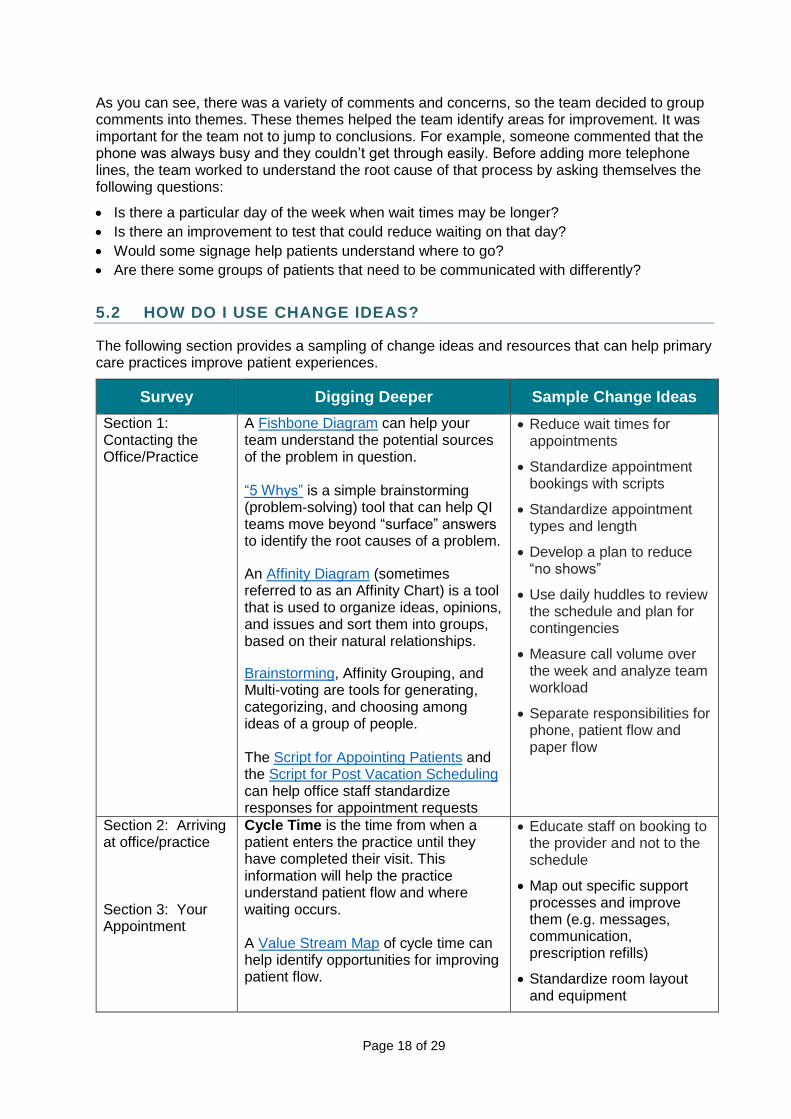
5.2 HOW DO I USE CHANGE IDEAS?
The following section provides a sampling of change ideas and resources that can help primary care practices improve patient experiences.
Survey Digging Deeper Sample Change Ideas
Section 1: Contacting the Office/Practice
A Fishbone Diagram can help your team understand the potential sources of the problem in question. “5 Whys” is a simple brainstorming (problem-solving) tool that can help QI teams move beyond “surface” answers to identify the root causes of a problem.
An Affinity Diagram (sometimes referred to as an Affinity Chart) is a tool that is used to organize ideas, opinions, and issues and sort them into groups, based on their natural relationships.
Brainstorming, Affinity Grouping, and Multi-voting are tools for generating, categorizing, and choosing among ideas of a group of people. The Script for Appointing Patients and the Script for Post Vacation Scheduling can help office staff standardize responses for appointment requests
Reduce wait times for appointments
Standardize appointment bookings with scripts
Standardize appointment types and length
Develop a plan to reduce “no shows”
Use daily huddles to review the schedule and plan for contingencies
Measure call volume over the week and analyze team workload
Separate responsibilities for phone, patient flow and paper flow
Section 2: Arriving at office/practice Section 3: Your Appointment
Cycle Time is the time from when a patient enters the practice until they have completed their visit. This information will help the practice understand patient flow and where waiting occurs. A Value Stream Map of cycle time can help identify opportunities for improving patient flow.
Educate staff on booking to the provider and not to the schedule
Map out specific support processes and improve them (e.g. messages, communication, prescription refills)
Standardize room layout and equipment
Page 19 of 29
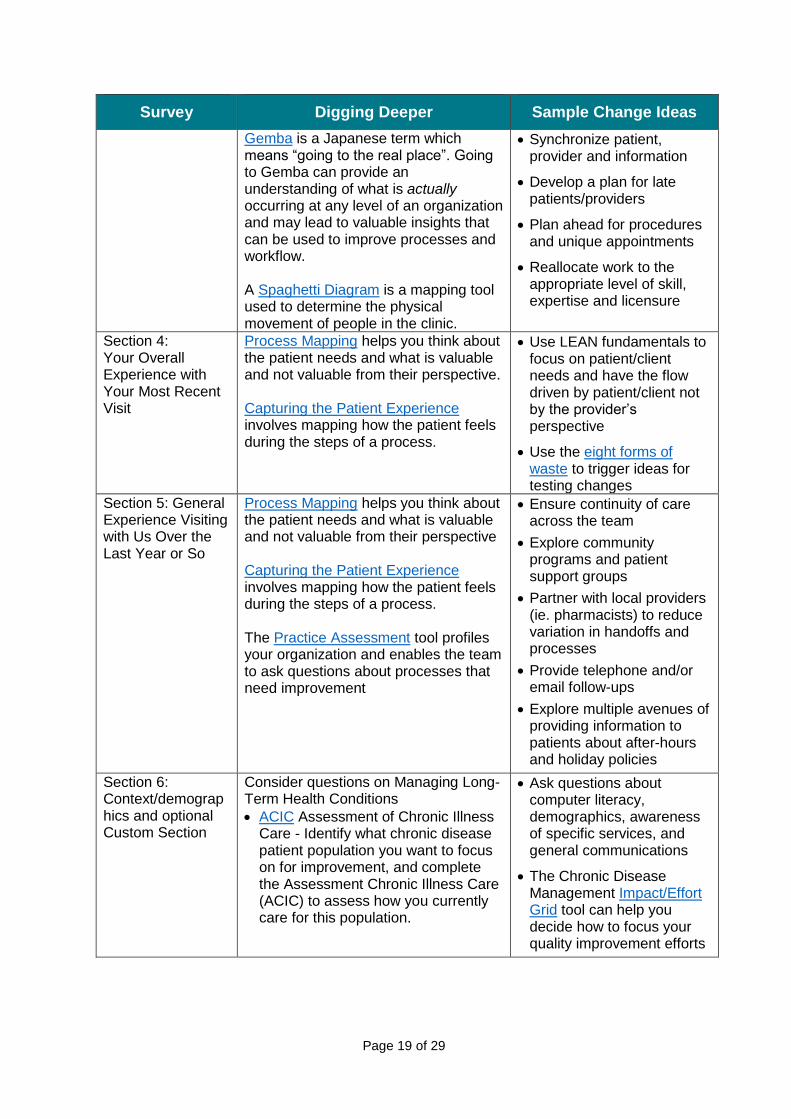
Survey Digging Deeper Sample Change Ideas
Gemba is a Japanese term which means “going to the real place”. Going to Gemba can provide an understanding of what is actually occurring at any level of an organization and may lead to valuable insights that can be used to improve processes and workflow. A Spaghetti Diagram is a mapping tool used to determine the physical movement of people in the clinic.
Synchronize patient, provider and information
Develop a plan for late patients/providers
Plan ahead for procedures and unique appointments
Reallocate work to the appropriate level of skill, expertise and licensure
Section 4: Your Overall Experience with Your Most Recent Visit
Process Mapping helps you think about the patient needs and what is valuable and not valuable from their perspective. Capturing the Patient Experience involves mapping how the patient feels during the steps of a process.
Use LEAN fundamentals to focus on patient/client needs and have the flow driven by patient/client not by the provider’s perspective
Use the eight forms of waste to trigger ideas for testing changes
Section 5: General Experience Visiting with Us Over the Last Year or So
Process Mapping helps you think about the patient needs and what is valuable and not valuable from their perspective Capturing the Patient Experience involves mapping how the patient feels during the steps of a process. The Practice Assessment tool profiles your organization and enables the team to ask questions about processes that need improvement
Ensure continuity of care across the team
Explore community programs and patient support groups
Partner with local providers (ie. pharmacists) to reduce variation in handoffs and processes
Provide telephone and/or email follow-ups
Explore multiple avenues of providing information to patients about after-hours and holiday policies
Section 6: Context/demographics and optional Custom Section
Consider questions on Managing Long-Term Health Conditions
ACIC Assessment of Chronic Illness Care - Identify what chronic disease patient population you want to focus on for improvement, and complete the Assessment Chronic Illness Care (ACIC) to assess how you currently care for this population.
Ask questions about computer literacy, demographics, awareness of specific services, and general communications
The Chronic Disease Management Impact/Effort Grid tool can help you decide how to focus your quality improvement efforts
Page 20 of 29
Tools and Resources
For effective change ideas and concepts, download Health Quality Ontario’s Primary Care Advanced Access & Efficiency Workbook or refer to online modules at machealth.ca
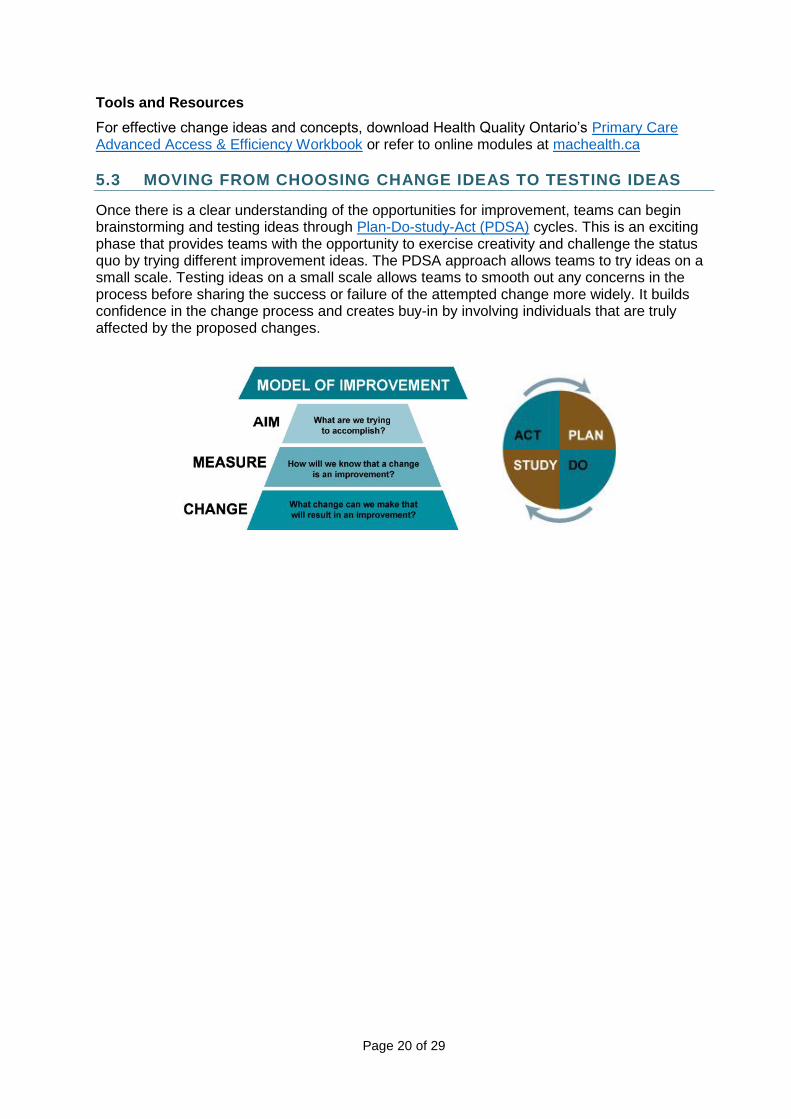
5.3 MOVING FROM CHOOSING CHANGE IDEAS TO TESTING IDEAS
Once there is a clear understanding of the opportunities for improvement, teams can begin brainstorming and testing ideas through Plan-Do-study-Act (PDSA) cycles. This is an exciting phase that provides teams with the opportunity to exercise creativity and challenge the status quo by trying different improvement ideas. The PDSA approach allows teams to try ideas on a small scale. Testing ideas on a small scale allows teams to smooth out any concerns in the process before sharing the success or failure of the attempted change more widely. It builds confidence in the change process and creates buy-in by involving individuals that are truly affected by the proposed changes.
Page 21 of 29
5.4 WHAT RESOURCES ARE AVAILABLE?
Below is an overview of the resources created by Health Quality Ontario to support primary care providers and organizations as they work to improve the patient experiences.
Advanced Access and Efficiency in Primary Care
As part of its work to foster quality improvement capacity in Ontario’s health system, HQO offers Advanced Access and Efficiency support to all primary care practices and providers. The core principle of this initiative is that patients calling to schedule a visit are offered an appointment with their primary care provider on the same day, or on a day of their choice. By following Advanced Access and Efficiency principles, primary care teams learn how to implement change concepts and evidence-informed care that will enable them to improve the patient experience for Ontarians.
Benefits Options for Participation
Reducing wait times
Improved office efficiency and patient flow
Improved patient, provider and staff experiences
Improved provider access contributing to organizational targets in annual Quality Improvement Plans (QIPs)
Improved provider access that contributes to achievement of Health Link performance targets
A comprehensive curriculum of seven MainPro accredited e-Learning Modules (www.machealth.ca)
A suite of quality improvement tools and resources including the Advanced Access and Efficiency in Primary Care Workbook
Membership in a community of practice focused on improving access to primary care
Opportunity to register for the AAE Newsletter
In order to engage in the Advanced Access and Efficiency in Primary Care initiative and learn more about how it can help you, please contact our Quality Improvement Specialists at: [email protected] or click here to enroll in the online program
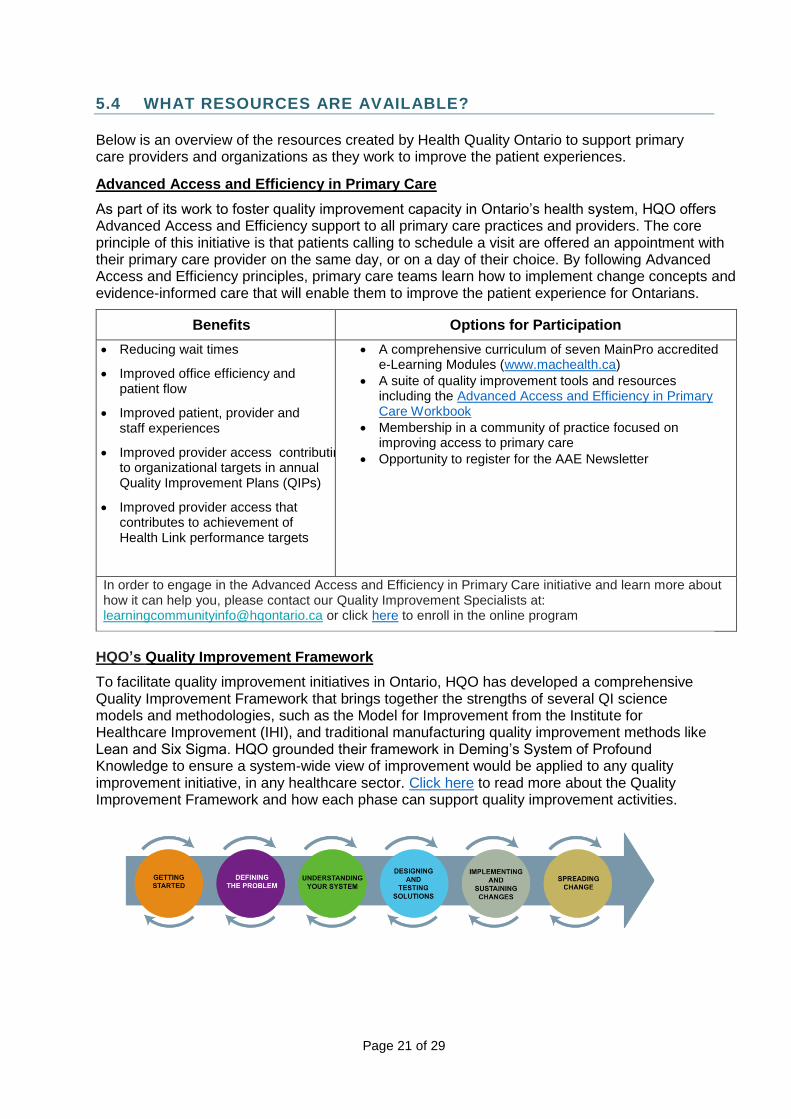
HQO’s Quality Improvement Framework
To facilitate quality improvement initiatives in Ontario, HQO has developed a comprehensive Quality Improvement Framework that brings together the strengths of several QI science models and methodologies, such as the Model for Improvement from the Institute for Healthcare Improvement (IHI), and traditional manufacturing quality improvement methods like Lean and Six Sigma. HQO grounded their framework in Deming’s System of Profound Knowledge to ensure a system-wide view of improvement would be applied to any quality improvement initiative, in any healthcare sector. Click here to read more about the Quality Improvement Framework and how each phase can support quality improvement activities.
Page 22 of 29
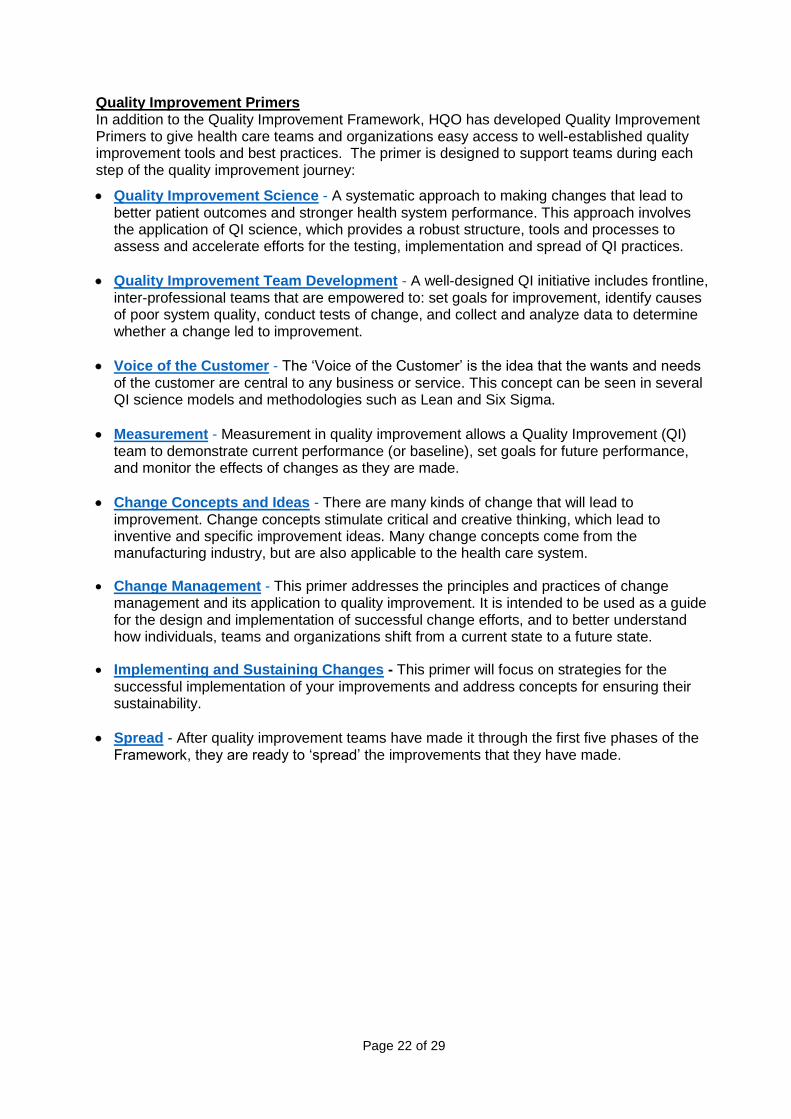
Quality Improvement Primers In addition to the Quality Improvement Framework, HQO has developed Quality Improvement Primers to give health care teams and organizations easy access to well-established quality improvement tools and best practices. The primer is designed to support teams during each step of the quality improvement journey:
Quality Improvement Science - A systematic approach to making changes that lead to better patient outcomes and stronger health system performance. This approach involves the application of QI science, which provides a robust structure, tools and processes to assess and accelerate efforts for the testing, implementation and spread of QI practices.
Quality Improvement Team Development - A well-designed QI initiative includes frontline, inter-professional teams that are empowered to: set goals for improvement, identify causes of poor system quality, conduct tests of change, and collect and analyze data to determine whether a change led to improvement.
Voice of the Customer - The ‘Voice of the Customer’ is the idea that the wants and needs of the customer are central to any business or service. This concept can be seen in several QI science models and methodologies such as Lean and Six Sigma.
Measurement - Measurement in quality improvement allows a Quality Improvement (QI) team to demonstrate current performance (or baseline), set goals for future performance, and monitor the effects of changes as they are made.
Change Concepts and Ideas - There are many kinds of change that will lead to improvement. Change concepts stimulate critical and creative thinking, which lead to inventive and specific improvement ideas. Many change concepts come from the manufacturing industry, but are also applicable to the health care system.
Change Management - This primer addresses the principles and practices of change management and its application to quality improvement. It is intended to be used as a guide for the design and implementation of successful change efforts, and to better understand how individuals, teams and organizations shift from a current state to a future state.
Implementing and Sustaining Changes - This primer will focus on strategies for the successful implementation of your improvements and address concepts for ensuring their sustainability.
Spread - After quality improvement teams have made it through the first five phases of the Framework, they are ready to ‘spread’ the improvements that they have made.
Page 23 of 29
Additional Resources
Primary Care Practice Report &
Portal
Primary care providers work hard to improve the quality of care they deliver to their patients. However, providers often do not have readily accessible data to inform their quality improvement efforts. The Primary Care Practice Report uses administrative health databases to give providers customized data about their specific practices. It contains detailed, practice-level information that providers can use to compare their performance to other practices and identify opportunities for quality improvement.
Primary Care Performance Measurement
In order to determine what aspects of primary care performance are the most informative to measure, HQO has collaborated with health system leadership to identify meaningful indicators and develop supports for their measurement, analysis and reporting.
Patient Experience
Measurement
The Patient Experience Measurement Committee supports patient experience measurement and public reporting across all sectors. The Patient Experience Measurement Committee will: catalogue existing patient experience measurement activities, identify perceived gaps in measurement, work with sector leaders to propose solutions, and convene working groups to focus on particular sectors.
The Common Quality Agenda
The Common Quality Agenda is a partnership-driven initiative designed to help the system focus on an evolving set of key performance measures and guide quality improvement activities. It identifies areas that will fuel transformative change, establishes performance measurement and reporting as mechanisms for ongoing improvement and fosters a collaborative, system-wide approach to improvement.
Quality Compass
Quality Compass is an online archive of best practices, change ideas linked with indicators, and useful tools and resources that support the adoption of best practices. Resources on Access and Efficiency are currently available.
5.5 PROVINCIAL RESOURCES & INITIATIVES
Quality Improvement Plans (QIPs)
A Quality Improvement Plan (QIP) is an organization-owned plan that establishes a platform for quality improvement that can be used to harmonize efforts to improve quality of care across the health system. Ontario has now had close to four years of experience with QIPs, which started in the hospital sector and, over the course of the last few years, extended to inter-professional primary care organizations, Community Care Access Centres (CCACs), and Long-Term Care (LTC) Homes. The Ministry of Health & Long-Term Care’s QIP website contains QIP guidance documents for all sectors, indicator technical specifications, and FAQs.
Improving Access to
Care
Primary care providers face the challenge of balancing supply and demand to meet their patients’ needs and provide continuous, timely care. HQO has developed tools and resources to help providers streamline operations and ensure same day/next day access to care. Accredited eLearning modules are hosted on the machealth site, and can help providers meet the access targets they set in their annual QIPs
Health Links
Health Links are groups of providers that coordinate services for people who live in the local area. The Health Links are accountable to the LHINs for improving the health outcomes and experiences of the patients served in their areas. With improved coordination and information sharing, patients receive faster care, spend less time waiting for services and are supported by a team of health care providers at all levels of the health care system. HQO supports Health Links by providing support for measurement, evidence-informed change ideas, and building capacity for change and improvement. To learn more about these supports, please click here.
Improving and Driving Excellence
Across Sectors (IDEAS)
IDEAS is a province-wide initiative to enhance Ontario’s health system performance by increasing quality improvement, leadership and change management capacity across all health care sectors. IDEAS consists of two accredited learning programs (an Introductory and an Advanced program), online resources, and an active alumni program to build and sustain a vibrant QI culture and community within Ontario’s health system. Visit the IDEAS website to learn more.
Page 24 of 29
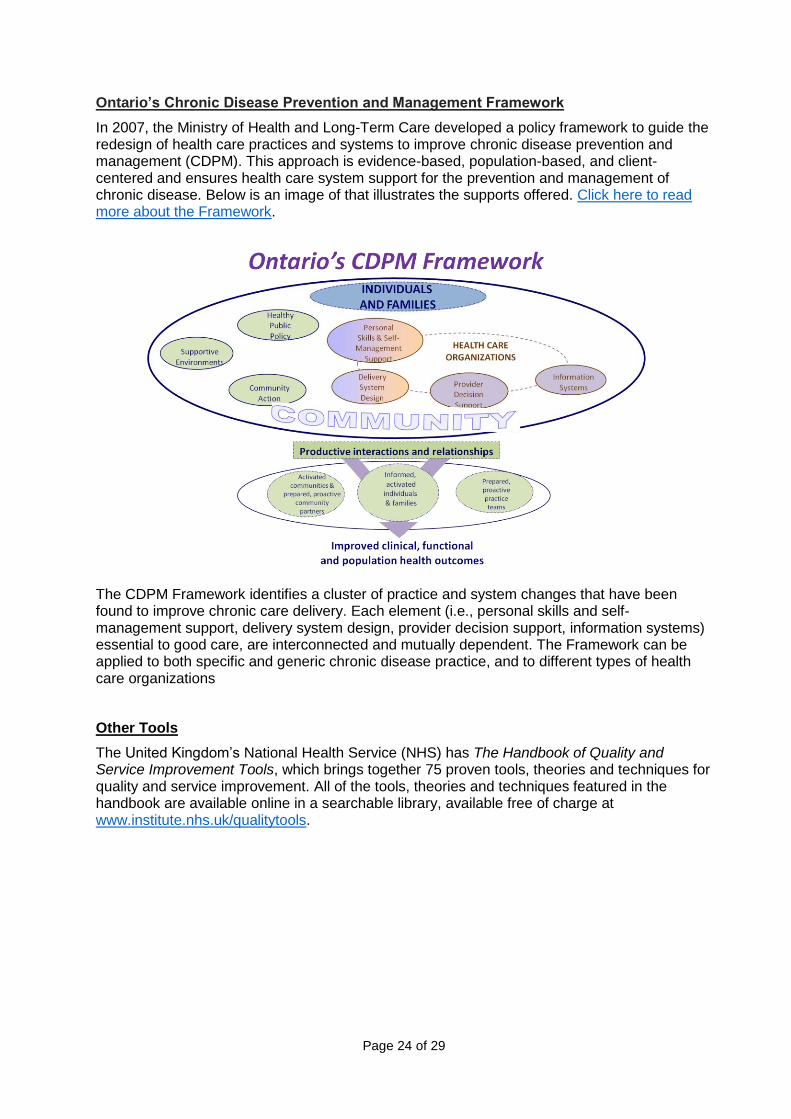
Ontario’s Chronic Disease Prevention and Management Framework
In 2007, the Ministry of Health and Long-Term Care developed a policy framework to guide the redesign of health care practices and systems to improve chronic disease prevention and management (CDPM). This approach is evidence-based, population-based, and client-centered and ensures health care system support for the prevention and management of chronic disease. Below is an image of that illustrates the supports offered. Click here to read more about the Framework.
The CDPM Framework identifies a cluster of practice and system changes that have been found to improve chronic care delivery. Each element (i.e., personal skills and self-management support, delivery system design, provider decision support, information systems) essential to good care, are interconnected and mutually dependent. The Framework can be applied to both specific and generic chronic disease practice, and to different types of health care organizations
Other Tools
The United Kingdom’s National Health Service (NHS) has The Handbook of Quality and Service Improvement Tools, which brings together 75 proven tools, theories and techniques for quality and service improvement. All of the tools, theories and techniques featured in the handbook are available online in a searchable library, available free of charge at www.institute.nhs.uk/qualitytools.

Page 25 of 29
APPENDICES
Appendix A: Staff Information Sheet
Appendix B: Sample Information Poster
Appendix C: Sample Preparation Checklist
Page 26 of 29
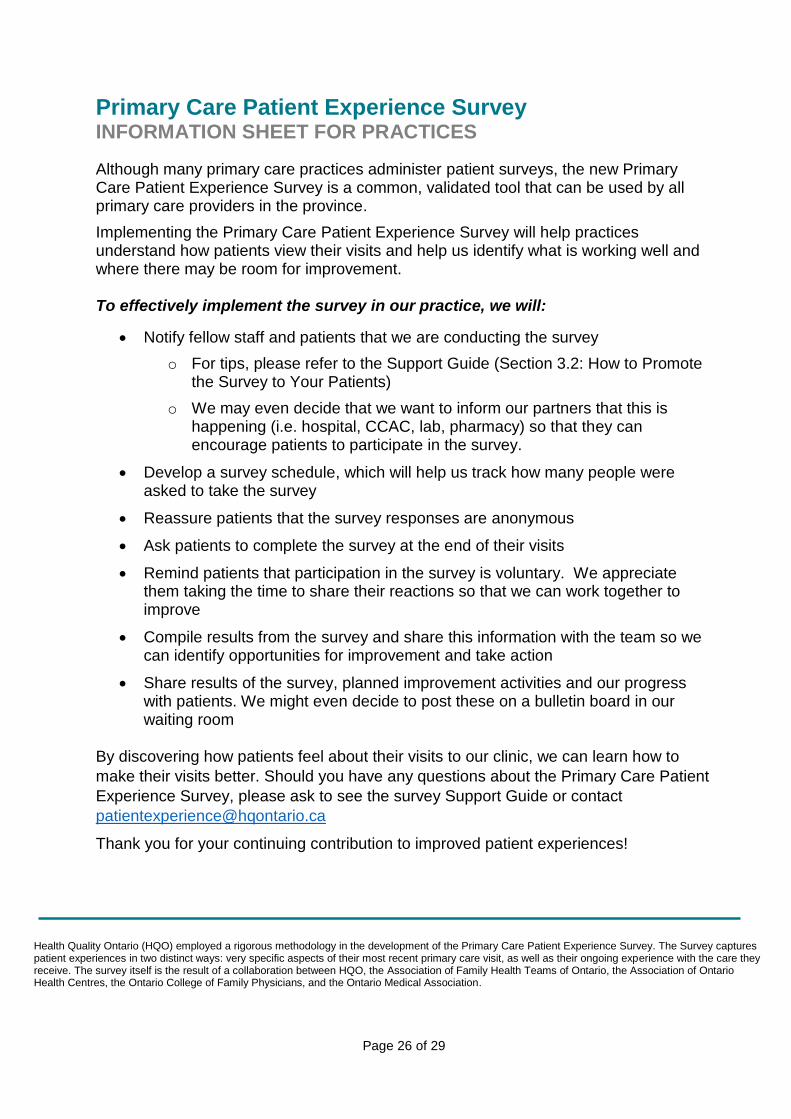
Primary Care Patient Experience Survey INFORMATION SHEET FOR PRACTICES
Although many primary care practices administer patient surveys, the new Primary Care Patient Experience Survey is a common, validated tool that can be used by all primary care providers in the province.
Implementing the Primary Care Patient Experience Survey will help practices understand how patients view their visits and help us identify what is working well and where there may be room for improvement.
To effectively implement the survey in our practice, we will:
Notify fellow staff and patients that we are conducting the survey
o For tips, please refer to the Support Guide (Section 3.2: How to Promote the Survey to Your Patients)
o We may even decide that we want to inform our partners that this is happening (i.e. hospital, CCAC, lab, pharmacy) so that they can encourage patients to participate in the survey.
Develop a survey schedule, which will help us track how many people were asked to take the survey
Reassure patients that the survey responses are anonymous
Ask patients to complete the survey at the end of their visits
Remind patients that participation in the survey is voluntary. We appreciate them taking the time to share their reactions so that we can work together to improve
Compile results from the survey and share this information with the team so we can identify opportunities for improvement and take action
Share results of the survey, planned improvement activities and our progress with patients. We might even decide to post these on a bulletin board in our waiting room
By discovering how patients feel about their visits to our clinic, we can learn how to
make their visits better. Should you have any questions about the Primary Care Patient
Experience Survey, please ask to see the survey Support Guide or contact
Thank you for your continuing contribution to improved patient experiences!
Health Quality Ontario (HQO) employed a rigorous methodology in the development of the Primary Care Patient Experience Survey. The Survey captures patient experiences in two distinct ways: very specific aspects of their most recent primary care visit, as well as their ongoing experience with the care they receive. The survey itself is the result of a collaboration between HQO, the Association of Family Health Teams of Ontario, the Association of Ontario Health Centres, the Ontario College of Family Physicians, and the Ontario Medical Association.
Page 27 of 29
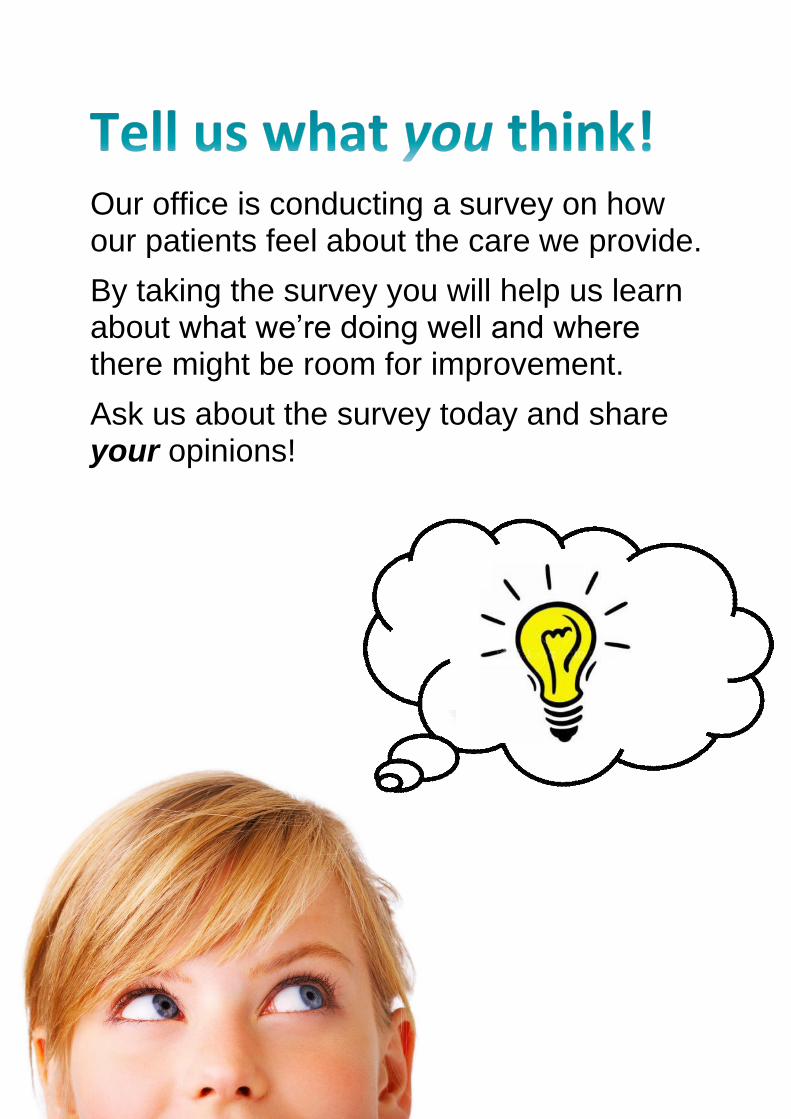
Our office is conducting a survey on how our patients feel about the care we provide.
By taking the survey you will help us learn about what we’re doing well and where there might be room for improvement.
Ask us about the survey today and share your opinions!
Page 28 of 29
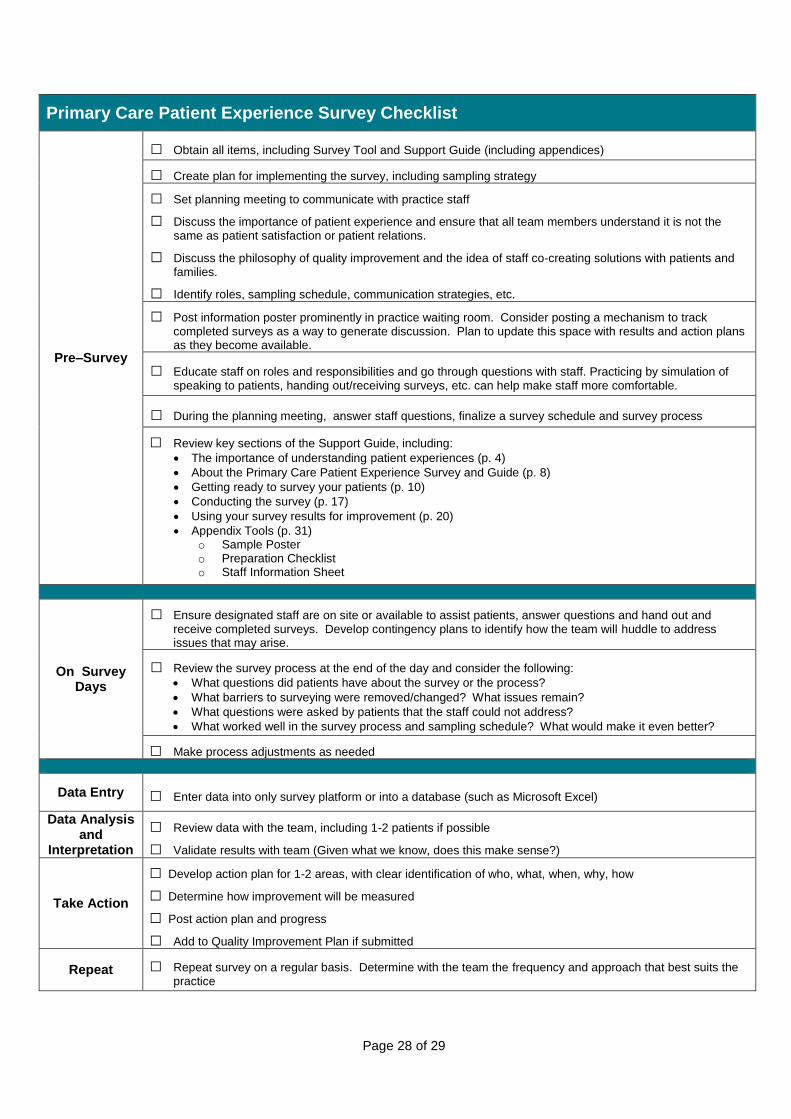
Primary Care Patient Experience Survey Checklist
Pre–Survey
□ Obtain all items, including Survey Tool and Support Guide (including appendices)
□ Create plan for implementing the survey, including sampling strategy
□ Set planning meeting to communicate with practice staff
□ Discuss the importance of patient experience and ensure that all team members understand it is not the same as patient satisfaction or patient relations.
□ Discuss the philosophy of quality improvement and the idea of staff co-creating solutions with patients and families.
□ Identify roles, sampling schedule, communication strategies, etc.
□ Post information poster prominently in practice waiting room. Consider posting a mechanism to track completed surveys as a way to generate discussion. Plan to update this space with results and action plans as they become available.
□ Educate staff on roles and responsibilities and go through questions with staff. Practicing by simulation of speaking to patients, handing out/receiving surveys, etc. can help make staff more comfortable.
□ During the planning meeting, answer staff questions, finalize a survey schedule and survey process
□ Review key sections of the Support Guide, including:
The importance of understanding patient experiences (p. 4)
About the Primary Care Patient Experience Survey and Guide (p. 8)
Getting ready to survey your patients (p. 10)
Conducting the survey (p. 17)
Using your survey results for improvement (p. 20)
Appendix Tools (p. 31) o Sample Poster o Preparation Checklist o Staff Information Sheet
On Survey Days
□ Ensure designated staff are on site or available to assist patients, answer questions and hand out and receive completed surveys. Develop contingency plans to identify how the team will huddle to address issues that may arise.
□ Review the survey process at the end of the day and consider the following:
What questions did patients have about the survey or the process?
What barriers to surveying were removed/changed? What issues remain?
What questions were asked by patients that the staff could not address?
What worked well in the survey process and sampling schedule? What would make it even better?
□ Make process adjustments as needed
Data Entry □ Enter data into only survey platform or into a database (such as Microsoft Excel)
Data Analysis and
Interpretation
□ Review data with the team, including 1-2 patients if possible
□ Validate results with team (Given what we know, does this make sense?)
Take Action
□ Develop action plan for 1-2 areas, with clear identification of who, what, when, why, how
□ Determine how improvement will be measured
□ Post action plan and progress
□ Add to Quality Improvement Plan if submitted
Repeat □ Repeat survey on a regular basis. Determine with the team the frequency and approach that best suits the practice

Page 29 of 29
www.hqontario.ca
The Primary Care Patient Experience Survey was developed by Health Quality Ontario in collaboration with Ontario primary care stakeholders. Anyone may copy or
distribute this survey for personal or informational use. By using the survey or any content thereof, you agree that HQO does not make any warranties of accuracy,
completeness, and/or adequacy of the questions/information contained in the survey for any purpose whatsoever, and/or that any of the materials contained within the
survey is free from copyright claims or other restrictions or limitations of any intellectual property rights. HQO expressly disclaims any and all liability for any damages
caused by using the survey or any content thereof regardless of whether it was due to inaccuracies, incompleteness, inadequacies, errors, and/or omissions in the
survey or any content thereof. If you have any questions about the survey or its use, please email us at: [email protected]