Embed Size (px)
Citation preview

Validity of a stationary cycling protocol for tracking changes in uphill cycling time-trial performanceby Owen Frederic Murphy
A thesis submitted in partial fulfillment of the requirements for the degree of Master of Science inHealth and Human DevelopmentMontana State University© Copyright by Owen Frederic Murphy (2001)
Abstract:The ability to accurately quantify and predict endurance performance is imperative when assessing theeffects of training interventions, dietary regimes, equipment modifications, and/or alterations in athleteposition or technique. Due to the invasive nature and excessive costs of traditional physiological andbiomechanical determinants of endurance performance, performance-based determinants ofperformance have received considerable attention.
The purpose of the present study was to determine the reliability and validity of a scaling-derived cycleergometer protocol (SDP) for tracking changes in uphill time-trial (TT) cycling performance. Phase I ofthe study assessed the reliability of the Scaling Derived Protocol (SDP) via the administration of threeSDP protocols within a ten-day time period. Phase II of the study determined the ability of the SDP totrack longitudinal changes in uphill time-trial performance. Local competitive cyclists participated ineither two or three testing periods separated by a minimum of ten weeks (May, July, September 2001).Each testing period consisted of an outdoor uphill TT (5-km, 8% grade) followed within ten days by alaboratory-based SDP. Longitudinal inter-trial changes in average TT speed (m/s) were compared withlongitudinal inter-trial changes in SDP time-to-exhaustion (TTE, min) and relative SDP maximalpower output (Wmax, watts kg^-1).
There were no significant Phase I inter-trial differences for time-to-exhaustion, maximum poweroutput, maximum heart rate, and relative VO2max. Intraclass correlation coefficients were high for allvariables, ranging from R = 0.933 to 0.992. Single-score reliability was also high, with correlationcoefficients ranging from R(k=i)= 0.823 to 0.977.
High correlations were also observed between Phase II inter-trial changes in average TT speed andrelative WMax (r = 0.70 to 0.94). Correlations between inter-trial changes in average TT speed andTTE were generally lower and more variable (r = 0.26 to 0.87). These results suggest that changes inrelative SDP Wmax can reliably, validly, and practically track changes in uphill TT performance.

VALIDITY OF A STATIONARY CYCLING PROTOCOL FOR TRACKING
CHANGES IN UPHILL CYCLING TIME-TRIAL PERFORMANCE
by
Owen Frederic Murphy
A thesis submitted in partial fulfillment o f the requirements for the degree
of
Master o f Science
in
Health and Human Development
MONTANA STATE UNIVERSITY Bozeman, Montana
November 2001

ii
APPROVAL
o f a thesis submitted by
Owen Frederic Murphy
This thesis has been read by each member o f the thesis committee and has been found to be satisfactory regarding content, English usage, format, citations, bibliographic style, and consistency, and is ready for submission to the College o f Graduate Studies.
Dr. Deborah King
Approved for the Department o f Health and Human Development
Dr. Ellen Kreighbaum(Signature) Date
Approved for the College o f Graduate Studies

iii
STATEMENT OF PERMISSION TO USE
In presenting this thesis in partial fulfillment for the requirements for a master’s
degree at Montana State University, I agree that the Library shall make it available to
borrowers under rules o f the Library.
IfI have indicated my intention to copyright this thesis by including a copyright
notice page, copying is allowable only for scholarly purposes, consistent with “fair use”
as prescribed in the U.S. Copyright Law. Requests for permission for extended quotation
from or reproduction o f this thesis in whole or parts may be granted only by the copyright
holder.
Signature
Date

ACKNOWLEDGEMENTS
I wish to express my appreciation to Drs. Deborah King and Dan Heil for their
time, expertise, and inspiration. Thanks also to the poor saps who unwittingly
volunteered to take part in my study - may you never have to do another max test again!
My family and friends were very supportive throughout this process and I am indebted to
them all. I am especially grateful for the patience and unconditional love o f Natalie and
Isabelle, thank you both.
TABLE OF CONTENTS
LIST OF TABLES......................................................................................................................viiLIST OF FIGURES................................................................................................................... viiiABSTRACT.................................................................................................................................. ix
1. INTRODUCTION....................................................................................................................I
Historical Background........................................... ................................................................. 2Statement o f Purpose..............................................................................................................4Significance o f Study...............................................................................................................4Hypotheses................................................................................................................................. 5Limitations.....................Delimitations.................Operational Definitions
2. REVIEW OF LITERATURE................................................................................................ 8
Introduction...............................................................................................................................8Physiological Determinants o f Endurance Performance.....................................................9
Maximal Oxygen Uptake................................................................................................9Lactate Threshold...........................................................................................................11Economy o f Movement................................................................................................. 13
Performance-Based Protocols as Determinants o f Endurance Performance.................. 15Time-to-Exhaustion at a Fixed Submaximal Workload........................................... 16Time to Completion o f a Fixed Workload or Distance............................................. 17Measures o f Power........................................................................................................ 18
Summary.................................................................................................................................. 21
3. METHODOLOGY........ r..................................................................................................... 22
Introduction............................................................................................................................ 22Phase 1 ..................................................................................................................................... 23
Subjects........................................................................................................................... 23Scaling Derived Protocol..............................................................................................24SDP Subject Procedure.......................................... 25
Phase II.................................................................................................................................... 27Subjects........ .................................................................................................................. 27Field Testing................................................................................ 28Laboratory Testing.................................................................................................. 28
-J O
s ^

TABLE OF CONTENTS - CONTINUED
vi
Instrumentation....................................................................................................................... 30Scaling Derived Protocol..............................................................................................30Oxygen Consumption........................................................................................ 31Heart Rate........................................................................................................................ 31
Statistical Analysis................................................................................................................. 32Phase 1..............................................................................................................................32Phase II.............................................................................................................................32
4. RESULTS..............................................................;..........................................»....................33
Phase 1 ......................................................................................................................................33Phase II.....................................................................................................................................36
5. DISCUSSION........................................................................................................................ 41
Phase 1 ......................................................................................................................................41Phase II.....................................................................................................................................42
6. CONCLUSION..................................................................................................................... 47
Implications for Further Research.......................................................................................47
REFERENCES.................................................................................................................. 49
APPENDICES.............................................................................................................................59
Appendix A: Subject Consent Form....................................................... 60Appendix B: SDP Test Protocol...............................................................................................64Appendix C: Phase II Data...................................... 66Appendix D: Journal Manuscript..............................................................................................69

V ll
LIST OF TABLES
Table Page
1. Subject Characteristics, Phase I (n = 21). Repeated measures reportedas Mean ± SD.......................................................................................................... ............23
2. Subject Characteristics, Phase II (n = 13). Repeated measures reportedas Mean ± SD........................ 27
3: Phase I SDP trial Means ± SD and reliability data for all subjects (n = 21)............... 33
4 . Phase I SDP trial Means ± SD and reliability data for subjects with priormaximal testing experience (n = 9)...................................................................................34
5. Phase I SDP trial Means ± SD and reliability data for subjects with noprior maximal testing experience ( n - 12)...................................................................... 35
6. Phase II uphill time-trial and laboratory-based SDP results for all subjects............... 36
6. Air temperature, relative humidity, and wind speeds encountered duringthe three uphill time-trials (May, July, September 2001).................................................37
8. Phase II correlations between average TT speed (m/s) and SDPperformance variables.............................................. 37
9. Phase II correlations between inter-trail changes in average TTspeed (m/s) and SDP performance variables.................................................................... 38
viii
LIST OF FIGURES
Figure Page
1. Topographical view o f the uphill time-trial course (Lewis and ClarkCaverns State Park, MT)..................................................................................................... 29
2. Uphill time-trial course profile.......................................... .................................................29
3. Scatterplot depicting the relationship between Trial I and Trial 2changes in uphill average time-trial speed and WmaxZitic..............................................39
4. Scatterplot depicting the relationship between Trial 2 and Trial 3changes in uphill average time-trial speed and WmaxZitic....... ...................................... 39
5. Scatterplot depicting the relationship between Trial I and Trial 3changes in uphill average time-trial speed and WmaxZiiic...................... .......................... 40
6. Scatterplot depicting the relationship between Trial I, Trial 2, andTrial 3 changes in uphill average time-trial speed and WmaxZitic.................................40

ABSTRACT
The ability to accurately quantify and predict endurance performance is
imperative when assessing the effects o f training interventions, dietary regimes,
equipment modifications, and/or alterations in athlete position or technique. Due to the
invasive nature and excessive costs o f traditional physiological and biomechanical
determinants o f endurance performance, performance-based determinants o f performance
have received considerable attention.
The purpose o f the present study was to determine the reliability and validity o f a
scaling-derived cycle ergometer protocol (SDP) for tracking changes in uphill time-trial
(TT) cycling performance. Phase I o f the study assessed the reliability o f the Scaling
Derived Protocol (SDP) via the administration o f three SDP protocols within a ten-day
time period. Phase II o f the study determined the ability o f the SDP to track longitudinal
changes in uphill time-trial performance. Local competitive cyclists participated in either
two or three testing periods separated by a minimum often weeks (May, July, September
2001). Each testing period consisted o f an outdoor uphill TT (5-km, 8% grade) followed
within ten days by a laboratory-based SDP. Longitudinal inter-trial changes in average
TT speed (m/s) were compared with longitudinal inter-trial changes in SDP time-to-
exhaustion (TTE, min) and relative SDP maximal power output (WMax, watts kg'1).
There were no significant Phase I inter-trial differences for time-to-exhaustion,
maximum power output, maximum heart rate, and relative VOiMAx- Intraclass
correlation coefficients were high for all variables, ranging from R = 0.933 to 0.992.
Single-score reliability was also high, with correlation coefficients ranging from
R05-D = 0.823 to 0.977.
High correlations were also observed between Phase II inter-trial changes in
average TT speed and relative WMax (r = 0.70 to 0.94). Correlations between inter-trial
changes in average TT speed and TTE were generally lower and more variable (r = 0.26
to 0.87). These results suggest that changes in relative SDP Wmax can reliably, validly,
and practically track changes in uphill TT performance.

.1
CHAPTER ONE
INTRODUCTION
The year 2000 saw the rise to dominance some o f the world’s greatest cyclists.
Johan Museeuw celebrated his third victory at Paris-Roubaix, soloing the last 40-km in a
stunning display o f brute strength and courage. Lance Armstrong won his second
consecutive Tour de France, dominating the high-mountain stages and individual time-
trials. Leontien Zijlaard was the revelation o f the Sidney Olympic Games, winning an
unprecedented three gold medals in women’s road and track cycling events. Finally,
Miguel Martinez became the first mountain biker in history to achieve the overall World
Cup, Olympic gold, and the World Championships in the same year.
Such incredible performances (time and time again) beg the question: What sets
these champions apart? Are they gifted with extraordinary lung capacities, lactate
thresholds, or blood hematocrits? Do they possess the ideal strength-to-weight ratio?
Have they developed superior technique or economy o f movement? Do they command a
greater strength o f mind, will to suffer, or desire to win?
In truth, all o f these factors contribute to successful endurance performance -
cycling or other. Sport scientists today, however, are searching for a single, easily
quantifiable determinant o f performance that could be used to identify, track, and train
the best endurance athletes in the world. More importantly, perhaps, coaches at the
grassroots level are in need o f a practical and affordable method with which to identify

2
youth talent in a variety o f endurance-based sports. Only then will it be possible to
nurture the youths o f today into the champions o f tomorrow.
Historical Background
In 1923, Hill and Lupton were the first sport scientists to note that the world’s
best endurance athletes also happened to possess the world’s highest V 0 2max values
when expressed relative to their body mass. It was subsequently proposed (and widely
accepted) that relative V O2Max could be used as a primary determinant o f endurance
performance (Astrand and Rodahf 1986; Costill, 1967; Foster, 1978; Hagberg and Coyle,
1983; Saltin and Astrand, 1967). More recently, physiologists have also proposed blood
lactate transition thresholds (Farrell et al., 1979; Kumagai et al., 1982; Powers et al.,
1983; Yoshida et al., 1987) and economy o f movement (Basset and Howley, 2000;
Costill and Winrow, 1970; Daniels, 1974; Dengel et al., 1989) as viable determinants o f
endurance performance.
Despite their strong association with successful endurance performance, however,
physiological determinants (V O2max, lactate threshold, and economy o f movement) are
inherently expensive, invasive, and unavailable to the general public. “Indeed, few
coaches and athletes have the ready access to laboratory facilities capable o f measuring
V O 2MAx, as such a test requires expensive equipment, skilled personnel, and is time-
consuming” (Hawley and Noakes, 1992, pp. 79). Given these drawbacks, physiological
determinants o f endurance performance are rendered impractical means with which to
screen youth talent and/or repeatedly monitor an endurance athlete’s progress.

3
Fortunately, several contemporary cycling-related studies have indicated the .
importance o f average or peak muscular power as a valid and relatively affordable
determinant o f endurance performance. In such investigations, power-measuring devices
(e.g. Computrainer™, SRM™, Tune Power Tap™) are used to measure a cyclist’s power
output in watts. The results have been stunning. For instance, Palmer et al. (1996),
observed a correlation o f r = -0.999 between average power output and both 20-km and
40-km cycling time-trial performance! Bishop et al. (1998) and Coyle et al. (1991)
reported correlations o f r = -0.81 and r = -0.88, respectively, between average power
output and actual 40-km time-trial performance. In a study of sub-elite male cyclists,
Balmer et al. (2000) found a correlation o f r = -0.99 (p< 0.001) between peak power
output (PPO) and 16 .1-km time-trial performance. Lastly, Bishop et al. (1998), Lindsay
et al. (1996), and Schabort et al. (2000) observed high correlations (r = -0.81 to -0.91)
between PPO and 20-km to 40-km cycling time-trial performance.
In an effort to improve upon the validity, reliability, and theoretical foundation of
PPO protocols, Heil et al. (2000) introduced a scaling derived protocol (SDP) based on
the energy requirements o f uphill cycling as influenced by body mass. Preliminary
results indicate that SDP performance (time-to-exhaustion) correlates extremely well
with actual uphill time-trial performance (r = 0.97 to 0.98), as does relative SDP peak
power output (watts kg"1; r = 0.92 to 0.97). The SDP is easy to administer and completely
objective because gravity affects all cyclists in the same manner, regardless o f age,
gender, or technique. In addition, the design o f the SDP allows it to serve as a V
02max test for cyclists when appropriate.
4
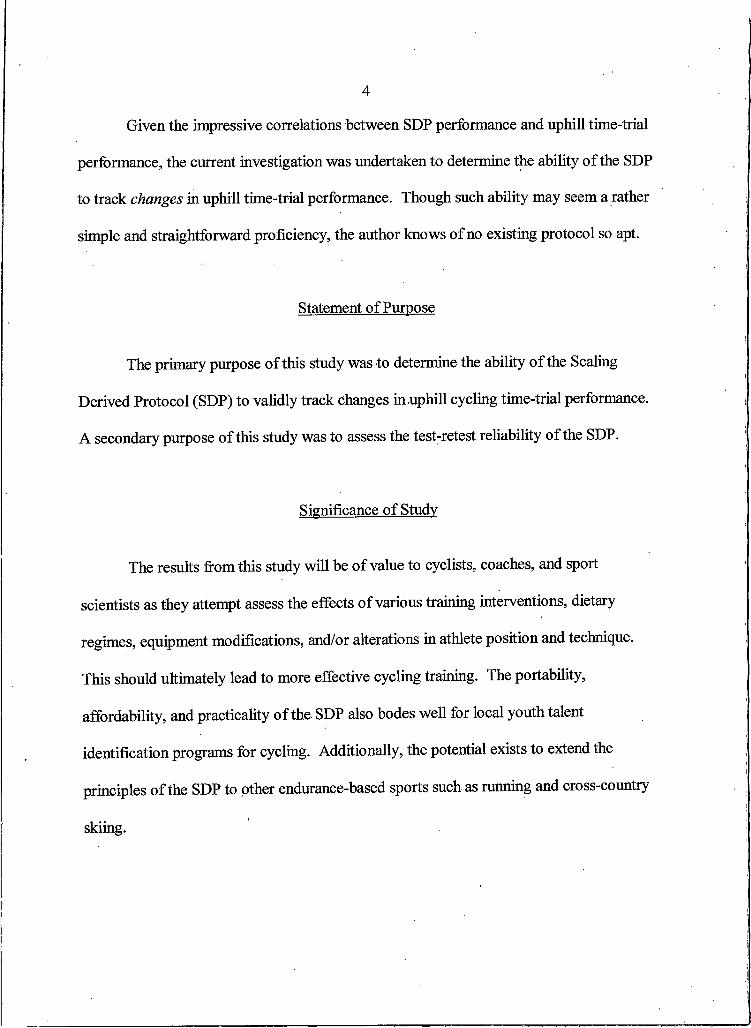
Given the impressive correlations between SDP performance and uphill time-trial
performance, the current investigation was undertaken to determine the ability o f the SDP
to track changes in uphill time-trial performance. Though such ability may seem a rather
simple and straightforward proficiency, the author knows o f no existing protocol so apt.
Statement o f Purpose
The primary purpose o f this study was to determine the ability o f the Scaling
Derived Protocol (SDP) to validly track changes in uphill cycling time-trial performance.
A secondary purpose o f this study was to assess the test-retest reliability o f the SDP.
Significance o f Study
The results from this study will be o f value to cyclists, coaches, and sport
scientists as they attempt assess the effects o f various training interventions, dietary
regimes, equipment modifications, and/or alterations in athlete position and technique.
This should ultimately lead to more effective cycling training. The portability,
affordability, and practicality o f the SDP also bodes well for local youth talent
identification programs for cycling. Additionally, the potential exists to extend the
principles o f the SDP to other endurance-based sports such as running and cross-country
skiing.

5
Hypotheses
1. Phase I: The Scaling Derived Protocol (SDP) is a reliable measure o f cycling
performance, Intraclass correlation coefficients (ICC) were assessed via the
administration o f three SDP protocols to local cyclists within a 10-day period.
Ho: ICC <0.80
Ha: ICC >0.80
2. Phase II: The Scaling Derived Protocol (SDP) is a valid means o f tracking
changes in uphill cycling time-trial performance (TT).
H0: p = 0 (No correlation exists between changes in SDP performance
and changes in TT performance)
Ha: p^O (Correlation exists between changes in SDP performance and
TT performance)

6
Limitations
1) Phase II: The time-trial course was three miles long and featured a 500-meter
section o f level grade approximately two-thirds o f the way to the finish.
Considering the available course options in the Bozeman area, however, the
chosen venue was the most suitable to the purposes o f this study.
2) Phase II: Weather conditions (namely wind and air temperature) varied between
each o f the three uphill time trials (May, July, and, September 2001).
3) Phase II: Weight categories (and consequent SDP resistance levels) were fixed for
the entire study period, regardless o f fluctuations in subjects’ weight.
Delimitations
1) Phase I/II: The scope o f this study was delimited to competitive and recreational
cyclists in the Bozeman, Montana area.
2) Phase II: Due to health-related contraindications to maximal intensity exercise,
this study was delimited to “low and moderate risk individuals” (as defined by
ACSM5s Guidelines for Exercise Testing and Prescription, 6th ed., 2000). In the
the current study, “moderate risk individuals” refers to several male subjects over
the age o f 45 years.

7
Cadence:
Onerational Definitions
The rate o f pedaling, measured in revolutions per minute o f one foot, e.g. pedal frequency or pedaling rate (Borysewicz, 1985).
Change-score: An index o f Phase II inter-trial change calculated by subtracting the performance score o f one trial (pre) from that o f another (post); the absolute difference between trials.
Computrainer™: A commercially available stationary trainer that allows the application o f variable resistance (in watts) to the rear wheel o f a bicycle.
Economy o f Movement:
The oxygen cost o f exercising at a standard, submaximal velocity or power output.
EndurancePerformance:
The ability to maintain a relatively high intensity o f exercise (>80% max) for extended periods o f time (>1 hour).
Lactate Threshold: The balance point between lactate entry and removal from the blood.
Maximal Oxygen Consumption:
The highest rate at which ambient oxygen can be taken up and utilized by the body during maximal intensity exercise.
Power Output:. Watts produced per kilogram o f body mass on a cycle ergometer; measured at the crank, rear hub, or tire/trainer interface.
Singe-ScoreReliability:
The reliability o f a performance protocol given only one test administration.
Time-Trial: A race against the clock in which individual riders start at set intervals and cannot give aid or receive it from others on the course.

8
CHAPTER TWO
REVIEW OF LITERATURE
Introduction
The ability to accurately quantify and predict endurance performance has become
an increasingly important focus in recent decades. Ever since Hill and Lupton (1923)
demonstrated a positive correlation between maximal oxygen uptake (V 0 2max) and
middle-distance running performance, researchers have sought to identify additional
physiological and biomechanical factors associated with success in endurance events.
Commonly referred to as “determinants o f endurance performance”, these factors are
used to evaluate the effects o f training strategies (Hickson et al., 1988; Lindsay et al.,
1996; Westgarth-Taylor et al., 1997; Weston, et al., 1997), nutritional interventions
(Coggan and Coyle, 1987; El-Sayed et al., 1997; Palmer et al., 1998), alterations in body
position or bicycle geometry (Heil, 1997; Heil et al., 1997; Heil et al., 1995), and
equipment changes (MacRae et al., 2000), as well as predict the performance capacity o f
endurance athletes (Balmer et al., 2000; Hawley and Noakes, 1992; Heil et al., 2000;
Kuipers et al., 1985; Miller and Manfredi, 1987).
However, due to the inability o f a single physiological or biomechanical factor to
determine and/or predict endurance performance in homogeneous populations, a number
o f researchers have proposed the use o f performance-based laboratory protocols. This
review will examine the most common physiological and performance-based

9
determinants o f endurance performance, with particular respect to the validity and/or
practicality o f each. Other factors related to endurance performance, such as
biomechanics, psychological preparation, and nutritional status will not be discussed.
Physiological Determinants o f Endurance Performance
Maximal oxygen consumption (V O zmax) has traditionally been used as the
criterion measure o f endurance performance (Astrand and Rodahl, 1986; Bassett and
Howley, 2000; Costill, 1967; Coyle et al., 1988; Craig, et al., 1993; Foster, 1978;
Hagberg and Coyle, 1983; Hill and Lupton, 1923; Noakes, 1988; Saltin and Astrand,
1967; Sleivert and Rowlands, 1996). However, several investigators have recently
suggested that physiological parameters measured during submaximal exercise may
provide better predictors o f endurance performance than V OiMAx- These parameters
include blood lactate transition thresholds (Barlow et al., 1985; Coyle, et al., 1991; Craig,
et al., 1993; Farrell, et al. 1979; Hagberg and Coyle, 1983; Hopkins and McKenzie, 1994;
Jacobs, 1986; Loftin and Warren, 1994; Miller and Manfredi, 1987; Powers et al., 1983;
Schabort et al., 2000; Sjodin, 1981; Yoshida et al., 1987) and economy o f movement
(Conley and Krahenbahl51980; Costill et al., 1985; Powers et al.,1983; Schabort et al.,
2000) .
Maximal Oxygen Uptake
Maximal oxygen uptake (V O zmax) is considered a primary determinant of
endurance performance, generally because it sets the upper limit for steady-state oxygen

10
consumption (Astrand and RodaM5 1986; Costill5 1967; Craig5 et al., 1993; Evans et al.5
1995; Foster5 1978; Hill and Lupton5 1923). It is defined as the Mghest rate at wMch
ambient oxygen can be taken up and utilized by the body during maximal intensity
exercise. Provided the absence o f pulmonary disease, V Ozmax is the best indicator o f an
individual’s cardiovascular fitness level (Brooks et al, 1996).
Support for the use o f V 0 2max as a determinant o f endurance performance is
based on the fact that most endurance atMetes have relatively Mgh V 0 2max values
(Costill et al., 1973; Coyle, et al., 1988, 1991; Saltin and Astrand5 1967; Sleivert and
Rowlands, 1996), and relatively strong correlations have been reported between V 0 2Max
And endurance performance (Costill, 1967; Farrell et al., 1979; Foster et al., 1978;
Sleivert and Rowlands, 1996). In contrast, a number o f researchers have found that
VO2MAx is inadequate at predicting endurance performance within a homogeneous group
o f well-trained endurance atMetes (CoMey and KrahenbuM5 1980; Coyle et al., 1988,
Hagberg et al., 1979; Lindsey et al., 1996). “TMs [paradox] seems to indicate that a Mgh
VO2MAX capacity is necessary to compete in endurance events, but V O2MAx alone cannot
be used to discriminate between MgMy trained endurance atMetes o f similar V 0 2Max”
(Barlow et al., 1985, pp. 194). In such cases, lactate threshold, economy, and/or
performance during specific laboratory protocols have proven better indicators of
endurance performance than VO2MAx (Allen et al., 1985; Bishop et al, 1998; Concom et
al., 1982; Conley and KrahenbuM, 1980; Craig et al., 1993; Farrell et al., 1979; Heil et
al., 2000; Weltman et al., 1990).

11
Lactate Threshold
Lactate threshold (LT) and/or anaerobic threshold is defined as the balance point
between lactate entry and removal from the blood. It is often represented by an athlete’s
V O2 (ml/kg/min) at LT5 or their corresponding power output on a cycle ergometer (e.g.
300 watts). The use o f LT as a determinant o f endurance performance is supported by
the following observations: I) during endurance competition most athletes perform at
some percentage o f their V 0 2max rather than at their absolute maximum (Costill and
Fox, 1969; Coyle et al., 1988; Farrell et al., 1979); 2) athletes with a relatively higher LT
exhibit superior endurance performance (Coyle et al., 1988; Farrell et al., 1979; Schabort
et al., 2000; Sjodin and Jacobs, 1982); 3) a delayed LT should result in decreased
glycogen depletion and increased time-to-exhaustion since elevated lactate levels are
associated with increased glycogen utilization (a recognized limitation to endurance
performance), (Costill et al., 1971a, 1971b; Coyle, 1988). Moreover, in studies that have
correlated LT and V O2MAX with endurance performance, LT has been more strongly
related, both in trained subjects (Farrell et al., 1979; Kumagai et al., 1982; Powers et al.,
1983) and untrained subjects (Yoshida et al., 1987).
However, the concept and application o f lactate and/or anaerobic thresholds are
the targets o f considerable debate. Despite 60 years o f blood lactate research, there is
still a great deal o f controversy surrounding the explanation o f lactate and/or anaerobic
thresholds and the methods used to identify them. In fact, points o f contention probably
outnumber points o f agreement (Bourdon, 2000).

12
The principal point o f contention involves the method by which blood lactate
transition thresholds are defined - fixed blood lactate concentrations or individualized
lactate thresholds. Fixed blood lactate concentrations ranging from 2 to 4 mmol/L have
been used by a number o f investigators in order to minimize problems associated with
detecting inflections in the blood lactate response curve (Allen et al, 1985; Hagberg et al,
1986; Heck et al., 1985; Kindermann et al., 1979; Sjodin, 1983). However, fixed blood
lactate concentrations may be influenced by an individual’s nutritional and training
status. For example, V O2 obtained at the onset o f blood lactate accumulation was
significantly lower after a high carbohydrate diet than after a low carbohydrate diet
(Yoshida, 1984).
Stegmann et al. (1981) reported that steady state blood lactate concentrations can
vary widely among athletes, thus lending additional support to the use o f individualized
lactate thresholds. However, the detection o f inflection points in individualized blood
lactate curves is a complicated and controversial matter in and o f its own. Several
interpretational methods exist, including log-log transformations (Beaver, et al, 1985),
rates o f metabolite accumulation (Thoden, 1991), tangential techniques (Cheng et al.,
1992), and subjective visual inspections (Yoshida et al., 1985), but none has proven
overly superior.
A second major point o f contention surrounding the concept o f “lactate threshold”
addresses the protocol(s) used to elicit blood lactate responses, collect blood samples, and
analyze lactate concentrations. “Protocol-related factors such as the sampling site,
workload duration, continuous versus discontinuous exercise bouts, and choice of

13
ergometer can all affect the measurement o f blood lactate response to incremental
exercise” (Bourdon, 2000, pp. 56). The longer the workload duration, for instance, the
lower the LT (Heck et al., 1985; McLellan 1987). In contrast, the longer the rest breaks
during a discontinuous protocol, the higher the LT (Heck et al., 1985; Foster et al., 1995).
A complete summary o f the exercise protocols and sampling/analysis methods used to
evaluate blood lactate concentrations is beyond the scope o f this paper, but suffice it to
say that a significant number o f procedural, physiological, and environmental factors
exist with the potential to alter the blood lactate-exercise intensity relationship.
Economy o f Movement
There is a distinct linear relationship between submaximal power output and V O2
for each individual. However, considerable variation exists in just how much oxygen is
required to exercise at a given intensity or power output. Several researchers have
proposed this V O2 discrepancy can be attributed to inter-individual differences in
economy o f movement (Basset and Howley, 2000; Costill and Winrow, 1970; Daniels,
1974).
Economy o f movement is defined as the oxygen cost (ml/kg/min) o f exercising at
a standard submaximal velocity or power output (Bassett and Howley, 2000; Farrell et
al., 1979; Powers et al., 1983; Schabort et al., 2000). Intuitively, better economy results
in better performance: a more economical athlete uses less oxygen at a standard velocity
and theoretically is able to move faster and/or conserve more energy than a less
economical athlete (Sleivert and Rowlands, 1996).

14
Research concerning the use o f economy as a determinant o f endurance
performance first appeared in the literature during the early 1970s. Costill and Winrow
(1970) suggested that variations in the performance o f two middle-aged ultramarathon
runners with similar V O2Max values could be attributed to individual differences in
economy. Several years later, Daniels (1974) reported that economy o f movement was
responsible for nearly identical 2-mile run times (10:31 and 10:35) among two champion
male runners with significantly different V O2Max values ( > 10 ml/kg/min). In each case,
the more economical runner was able to perform at a lower percentage o f his or her
relative VO2MAX, thus decreasing the power o f V O2MAxto predict overall performance.
Additionally, Conley and Krahenbahl (1980) observed a correlation o f r = 0.82
between economy o f movement and 10-km running performance in a study o f highly
trained male distance runners with similar V O2MAx values. These data were later used by
Basset and Howley (1997) to explain how running economy could account for a large
portion o f the variability in distance running performance. In other sports, Dengel et al.
(1989) reported that the strongest predictor o f triathlon performance was a combined
measure o f swimming, cycling, and running economy.
In direct contrast to the above researchers, Farrell et al. (1979) and Powers et al.
(1983) reported a significant lack o f correlation between economy and endurance
performance. Working independently, Farrell and Powers reported poor correlations (r =
0.49 to 0.59) between running economy and distance running performance in
homogeneous well-trained populations. “The failure to show a significant relationship
between running economy and running performance... suggests that in some populations
15
the individual differences in running economy at a standardized speed is not great, and
that running economy may be o f limited value in differentiating distance running
performance” (Powers et al., 1983, pp. 182).
Noakes (1998) is another prominent physiologist hesitant to endorse economy of
movement as a primary determinant o f endurance performance. In rebuttal to the
aforementioned claims presented by Basset and Howley (1997), Noakes cites large
discrepancies in their study population - individual performances differed by 18 minutes
(38%) in a 16-kmrace, and by 9 minutes (20%) in a 10-kmrace! However, ..in studies
o f athletes whose performances are more similar, neither V Oimax nor economy is a good
predictor o f running performance” (Noakes, 1998, pp.1392).
Performance-Based Protocols as Determinants o f Endurance Performance
The primary purpose o f performance-based protocols is to simulate the demands
o f real world competition in a controlled environment. Ideally, these protocols should be
reliable, valid, and sensitive to small changes in an athlete’s fitness level. These qualities
are especially important when performing repeated measurements over a period o f time,
or when laboratory data is applied to the field to predict actual performance (Bahner,
Davison, and Bird, 2000).
Traditional performance-based endurance protocols include time-to-exhaustion at
a fixed workload or percentage o f V 02max (Acevedo and Goldfarb, 1989; Billat et al.,
1988; Bnmham et al., 1995; Coggan and Coyle, 1987; Coyle et al., 1988; Hickson et al.,
1988; Jeukendrup et al., 1996; McLellah et al., 1995), time to completion o f a fixed

16
workload or distance (Acevedo and Goldfarb, 1989; Coyle et al., 1991; Farrell et al,
1979; Foster et al., 1993; Hickey et al., 1992; Jeukendrup et al., 1996; Lindsay et al.,
1996; Loftin and Warren, 1994; Nichols et al., 1997; Palmer et al., 1995; Schabort et al.,
1998; Williams and Cavanagh, 1987), average power output or power output at lactate
threshold (Bishop, 1997; Bishop et al., 1998; Coyle et al., 1991; Davison et al., 2000;
Hopkins and McKenzie, 1994; Nichols et al., 1997; Palmer et al., 1996; Smith et al.,
1999), and peak power achieved during exercise (Balmer et al., 2000; Bishop et al., 1998;
Hawley and Noakes, 1992; Lindsay et al., 1996; Morgan et al., 1989; Noakes, 1990; Scott
and Houmard, 1994; Schabort et al., 2000).
Time-to-F.xhaustion at a Fixed Submaximal Workload
A continuous protocol at a submaximal workload until volitional exhaustion is the
classical and most common determinants o f endurance performance (Jeukendrup et al.,
1996). This type o f protocol is usually performed at exercise intensities ranging from
60% to 90% o f V Ozmax, and has reportedly correlated well with endurance performance
(Acevedo and Goldfarb, 1989; Billat et al., 1988; Bumham et al., 1995; Coggan and
Coyle, 1987; Coyle et al., 1988; Hickson et al., 1988). However, a growing number o f
researchers have indicated this genre o f protocol to be highly variable and unreliable
(Jeukendrup et al., 1996; Krebs and Powers, 1989; McLellan et al., 1995).
For example, Krebs and Powers (1989) and McLellan et al. (1995) independently
determined coefficients o f variation (CV) ranging from 2.8% to 55.9% in untrained
subjects cycling to fatigue at 80% VO2Max, indicating the irreproducibility o f

17
submaximal tests to exhaustion. Jeukendmp et al. (1996) reported a CV ranging from
17-40% in well-trained cyclists riding to fatigue at approximately 85% V Oimax-
Additionally, Billat et al (1994) reported a CV o f 25% when “sub-elite” subjects were
asked to run to exhaustion at their relative lactate threshold.
The poor reproducibility o f time-to-exhaustion (TTE) protocols is widely
attributed to psychological factors. “Because [TTE] tests have an ‘open end’,
psychological factors that might influence performance, such as motivation, monotony,
and boredom, are more pronounced than in the time trial oriented approach where the
‘endpoint is known’” (Jeukendmp et al., 1996, p. 269). TTE protocols are further
criticized because they are time-consuming and fail to mimic normal competitive
situations (Schabort et al., 1996).
Time to Completion o f a Fixed Workload or Distance
In comparison to TTE protocols, endurance performance protocols in which .
athletes are asked to complete a fixed amount o f work or distance in the shortest possible
time are more reliable (Bishop, 1997; Hickey et al., 1992; Jeukendmp et al., 1996;
Palmer et al., 1995; Schabort et al., 1996). Palmer et al. (1995) and Hickey et al. (1992),
determined a CV ranging from only 1.0% to 3.1% for cyclists performing 20 to 40-km
and 5 to 40-mile time-trials, respectively. Similarly, Bishop (1997) and Jeukendmp et al.
(1996) determined a CV o f 2.7% and 3.4%, respectively, when subjects were asked to
complete as much work as possible in 60 minutes o f cycling.

18
As well as being reliable, protocols o f fixed duration or workload have also
correlated well with actual endurance performance (Coyle et al., 1991; Palmer et al.,
1992). In a study of elite male cyclists, Coyle et al. (1991) reported a correlation of
r = 0.93 between time to completion o f a 40-km laboratory time-trial and actual 40-km
time-trial performance. Likewise, Palmer et al. (1995) reported a correlation o f r = 0.98
between 20-km and 40-km laboratory time-trials and actual road racing performance.
Similar to TTE protocols, however, fixed duration/workload protocols are
inherently time-consuming. For example, a 40-km time-trial may take up to 1.5 hours to
complete for a sub-elite cyclist. This fact alone renders fixed duration/workload
protocols impractical for situations that necessitate the testing o f multiple subjects. Also,
due to their time-consuming nature, prolonged fixed duration/workload protocols suffer
the same negative psychological factors that affect TTE protocols (Hickey et al., 1992).
Measures o f Power
Of all the existing determinants o f endurance performance, none have proven so
overwhelmingly reliable and valid as measures o f power output (watts' kg *). Power is, in
essence, a manifestation o f all possible physiological and biomechanical determinants o f
endurance performance. By definition, power is the capacity to perform a given amount
o f work in the shortest possible amount o f time. Although power-measuring devices used
to be relatively expensive, recent advances in technology have made the quantification o f
power (in watts, W) much more feasible for coaches and athletes alike.

19
It is important to note the existence o f two different methods o f quantifying power
output: I) average power output and 2) peak power output. The first studies to explore
the relationship between power and endurance performance relied on measures of
average power output (Bishop et ah, 1998; Coyle et ah, 1991; Davison et ah, 2000;
Hopkins and McKenzie, 1994; Nichols et ah, 1997; Palmer et ah, 1996; Smith et ah,
1999). Incredibly, Palmer et ah (1996) observed a near perfect correlation (r = -0.999, p
< 0.001) between average power output and both 20-km and 40-km cycling time-trial
performance. Bishop et ah (1998) and Coyle et ah (1991) reported correlations o f
r = -0.81 and r = -0.88, respectively, between average power output during a one-hour
laboratory time-trial and actual 40-km time-trial performance among experienced male
and female cyclists and triathletes. Finally, Nichols et ah (1997) and Smith et ah (1999)
independently reported correlations o f r = -0.77 to -0.91 between power output at LT and
13.5-km to 20-km cycling time-trial performance.
More recent studies o f power have involved the measurement o f peak power
output (PPO) (Balmer et ah, 2000; Bishop et ah, 1998; Hawley and Noakes,. 1992; Heil et
ah, 2000; Lindsay et ah, 1996; Morgan et ah, 1989; Noakes, 1990; Scott and Houmard,
1994; Schabort et ah, 2000). In a study o f sub-elite male cyclists, Balmer et ah (2000)
reported a correlation o f r = -0.99 (p< 0.001) between PPO and 16.1-km time-trial
performance. Bishop et ah (1998), Lindsay et ah (1996), and Schabort et ah (2000) also
observed high correlations (r = -0.81 to -0.91) between PPO and 20-km to 40-km cycling
time-trial performance. In runners, the peak treadmill velocity achieved during an
incremental test to exhaustion (a reciprocal measure ofPPO) has proven to be a strong
20
indicator o f endurance performance as well (Morgan et a l, 1989; Noakes, 1990; Scott
and Houmard, 1994).
A new PPO protocol has been proposed by Heil et al. (2000). Based on the
external power demand (Wd, W) o f steep uphill cycling, Heil and coworkers developed a
scaling derived cycling protocol (SDP) that correlates extremely well with actual uphill
cycling time-trial performance (r = 0.97 to 0.98). The SDP “...utilizes findings from both
correlational and body mass scaling studies in cycling to derive an ergometer test
protocol that [can] accurately predict uphill cycling time-trial performance” (Heil et al.,
2000, p. 3).
In general, Wd for outdoor cycling is considered to be the vector sum of rolling
resistance (Rr), aerodynamic drag (Rd), and gravitational resistance (Re) (Bassett et al.,
1999, di Prampero et al., 1979, Olds et al., 1995). During steep uphill cycling, however,
Rr and Rn are considered negligible and Re is the primary resistance (WD K Re). As
such, the SDP is completely objective (gravity affects all cyclists in the same manner,
regardless o f age, gender, or technique). The SDP is also easy to administer, practical,
and cost-effective (necessary equipment < $1000) for coaches and athletes outside the
sports science laboratory environment. In addition, the design o f the SDP as an
incremental test to volitional exhaustion makes it possible for the SDP to serve as a
V Ozmax test for cyclists when appropriate.

21
Summary
Average and peak power output are the most valid determinants o f endurance
cycling performance. Consequently, the need to measure physiological variables such as
V Ozmax, LT, and economy o f movement is questionable: few coaches and athletes have
the ready access to laboratory facilities capable o f measuring V 0 2max, or the finances.
Additionally, the affordability and availability o f power-measuring devices has made
performance protocols like the SDP increasingly attractive.
The SDP is a relatively new laboratory cycling protocol based the external power
demand o f steep uphill cycling. The SDP is a practical and cost-effective measure o f
peak power output and, therefore, uphill cycling time-trial performance. SDP time-to-
exhaustion (r = 0.97 to 0.98) and Wmax (watts per kilogram, r = 0.92 to 0.97) are highly
correlated with actual uphill time trial performance, indicating that a laboratory protocol
o f relatively short duration (10-12 minutes) can predict exercise performance o f much
longer duration (15-60 minutes). Therefore, the SDP may serve as an effective marker
for tracking changes in actual time-trial performance.
22
CHAPTER THREE
METHODOLOGY
Introduction
This investigation was conducted in two phases. Phase I o f the study assessed the
reliability o f the Scaling Derived Protocol (SDP); Pfiase II o f the study determined the
ability o f the SDP to track changes in uphill time-trial performance. In this chapter, the
subject characteristics, data collection techniques, and required instrumentation are
presented. Included in this chapter is a brief review o f the rationale behind the SDP.
Finally, the statistical procedures for the stated hypotheses o f this study are documented.
The subjects recruited for both phases o f the study consisted o f a heterogeneous
mix o f male and female cyclists o f varying age, athletic ability, and cycling experience.
All subjects were informed o f the nature o f the investigation and written consent was
obtained in accordance with the guidelines set forth by the Montana State University
Human Subjects Committee (see Appendix A). Subjects were instructed to prepare for
each o f the laboratory and field tests as they would for a true competition. Subjects used
their own racing bicycle mounted on a commercially available stationary trainer
(Computrainer™ Pro, Model 8001, Racermate Inc., Seattle WA., USA) for all laboratory-
based SDP tests.

23
Phase I
Subjects
Twenty-three cyclists from Montana State University and the local Bozeman
community volunteered participation for Phase I o f the study. Two subjects resigned due
to general fatigue and acute knee pain, respectively. Physical characteristics and cycling
experience o f the remaining subjects (n = 21) are presented in Table I.
Table I. Subject Characteristics, Phase I (n=21). Repeated measures reported as Mean ± SD.
Subject ID# Gender Age(yrs)
Body Mass (kg)
Height(m)
CompetitionLevel*
I F 29 59.3 (0.6) 1.66 22 F 27 50.8 (0.4) 1.57 23 F 23 71.5(1.0) 1.73 24 F 21 59.3 (0.2) 1.63 35 F 27 62.0 (0.5) 1.65 26 M 21 66.8 (0.3) 1.78 I7 M 26 81.5 (0.8) 1.84 38 M 25 79.5 (1.0) 1.87 29 M 36 80.5(1.8) 1.85 I10 M 21 71.3 (0.3) 1.77 I11 M 24 86.8(0.1) 1.72 312 M 24 71.8(0.5) 1.76 313 M 28 77.3 (0.5) 1.82 214 M 21 84.0 (0.0) 1.85 315 M 26 71.3 (0.7) 1.74 I16 M 33 78.0 (0.2) 1.88 I17 M 20 76.8(0.1) 1.80 218 M 29 80.0(1.0) 1.89 I19 M 31 80.0 (0.6) 1.85 220 M 34 80.0 (0.6) 1.87 I21 M 21 77.8 (0.2) 1.87 I
Ave (SD) 26 (4.7) 73.6 (9.3) 1.78 (0.09)♦Competition Level is reflective of the classification systems used by the United States Cycling Federation (USCF) and the National Collegiate Cycling Association (NCCA): I = USCF Category 1-2 and/or NCCA Category A; 2 = USCF Category 3 and/or NCCA Category B; 3 = USCF Category 4 and/or NCCA C D.

24
Scaling Derived Protocol
Upon arrival at the laboratory, bicycle rear tire pressure was standardized at 100
p.s.i. using a track pump with tire gauge (Specialized, USA). Each subject’s bicycle was
fitted to a Computrainer™ stationary trainer (Computrainer™ Pro, Model 8001,
Racermate Inc., Seattle WA., USA) and calibrated according to the manufacturer’s
recommended procedure (see Instrumentation, Pg. 29, for a complete description o f the
calibration process). Subject age was recorded to the nearest year, subject height
(barefoot) was measured to the nearest centimeter, and subject mass (with cycling
clothes, minus shoes) was measured to the nearest 0.25 kilogram. When anthropometric
measurements were complete, subjects were permitted a subjectively adequate warm-up
period (10-30 minutes).
The power output (in watts, W) for each stage o f the SDP was based on research
previously conducted in this laboratory. In brief review, Heil (1998) determined that the
external power demand (Wd) o f uphill cycling scales with body mass (Mb) to the +0.89
power (e.g. Wd « Mb0'89). Thus, the relative energetic cost o f uphill cycling at a given
speed and grade is less for heavier cyclists than for lighter cyclists. Assuming that the net
external power demand o f uphill cycling is equivalent to a cyclist’s metabolic power
supply (Heil, 1998), Heil et al. (2000) modified the standard formula for power (Power =
[average acceleration * mass] * average speed) to reflect the scaling relationship between
body mass and uphill power demand:
Power = [g * Mb0'89 * sin0)] * s

25
where “g” is the constant o f gravitational acceleration (9.81 m/s/s), “6” is the average
inclination angle o f the road surface, and “s” is the average forward ground speed of the
cyclist.
Using this equation, the power required for each cyclist to ride up a 5° slope (0) at
6.72 m/s (s) was calculated and designated as Stage 5 o f the SDP. Stage I o f the SDP
was then calculated as 20% o f the Stage 5 power output value, Stage 2 as 40%, Stage 3 as
60%, Stage 4 as 80%, Stage 5 as 100%, and each stage thereafter increased by 10% (see
Appendix B for a complete outline o f the first 14 stages for subjects weighing 40-100
kg). Due to wattage limitations imposed by the Computrainer™, it was necessary to
approximate SDP power output to the nearest ± 10W. End measures o f the SDP included
time-to-exhaustion (TTE, min), maximum power output (WMax, W/kg), and maximum
oxygen uptake (V Ozmax, ml/kg/min).
SDP Subject Procedure
The subjects were allowed to select their own pedal cadence throughout the first
five stages o f the protocol, with the stipulation that their chosen pedal cadence be held
constant (± 2 rpm) within a given stage. When the subjects reached Stage 6, however,
the investigator fixed the cadence for the remainder o f the test based upon the observed
cadence at that moment. The subjects remained seated during the entire protocol and
were verbally encouraged to continue until volitional exhaustion, or until the investigator
noted a drop in cadence o f > 5 RPM for > 5 seconds. Time to completion (e.g. time-to-
exhaustion) o f the SDP test was recorded to the nearest second.

26
Maximal power output (WMax) and maximal oxygen uptake (VO2Max) were also
determined during the SDP test. Wmax was defined as the power output corresponding to
the final completed stage o f the SDP5 plus a fraction o f the power output maintained in
the final incomplete stage (Kuipers et al., 1985):
Wmax- (Wcom + 1/60) * AW
where Wcom is the power output o f the final completed SDP stage, t is the amount o f time
(sec) completed in the final uncompleted stage, and AW is the power output o f the final
incomplete stage. Maximum oxygen consumption was calculated as the average o f the
three highest consecutive VO2 measures during the SDP. The measurement o f V O2MAx
was considered successful if two o f the following three criteria were met: I) A maximal
heart rate within 10 beats o f each subject’s age predicted maximum heart rate (e.g. 220-
age); 2) A maximum respiratory exchange ratio o f > 1.10 before the last successful V O2
measurement; 3) A plateau o f V O2 evidenced by a change <2.1 ml/kg/min with an
increase in power output.
In order to determine the test-retest reliability o f the SDP, each subject performed
three maximal SDP tests within a ten-day period. The tests were conducted at the same
time o f day and separated by a minimum o f 48 hours. Subjects were asked to maintain
their normal diet and training load throughout the 10-day testing period.

27
Phase II
Subjects
Eighteen cyclists from Montana State University and the local Bozeman
community volunteered participation for Phase II o f the study. Three subjects resigned
due to schedule conflicts or lack o f motivation; two more cyclists moved away from the
area prior to completion o f the study. Physical characteristics and cycling experience o f
the remaining subjects (n = 13) are presented in Table 2. In order to determine the ability
o f the SDP to predict and track uphill time-trial performance over time, each subject
participated in at least two o f three matched field and laboratory tests.
Table 2. Subject Characteristics, Phase II (n=13). Repeated measures reported as Mean ± SD.
SubjectID#
TrialsCompleted Gender Age
(yrs)Body Mass
(kg)Height
(m)Competition
Level*I 1,2,3 F 29 56.3 (0.9) 1.60 22 1,2 F 27 54.3 (0.4) 1.63 23 1,2,3 M 29 74.5(1.9) 1.65 24 1,2,3 M 29 69.0(1.0) 1.75 I5 1,3 M 24 70.3 (1.8) 1.76 36 1,2,3 M 48 77.0 (0.1) 1.78 37 1,2 M 29 80.0 (0.7) 1.89 I8 1,2 M 37 83.3 (2.1) 1.78 I9 1,2,3 M 44 81.8(0.6) 1.85 I10 1,2,3 M 24 81.0 (2.8) 1.78 311 1,3 M 33 78.8 (0.5) 1.88 I12 1,2,3 M 53 73.8 (0.9) 1.78 I13 2,3 M 36 81.0 (0.7) 1.88 I
Ave (SD) 34 (9.2) 73.8 (9.3) 1.77 (0.09)•Competition Level is reflective of the classification systems used by the United States Cycling Federation (USCF) and the National Collegiate Cycling Association (NCCA): I = USCF Category 1-2 and/or NCCA Category A; 2 = USCF Category 3 and/or NCCA Category B; 3 = USCF Category 4 and/or NCCA C-D.
28
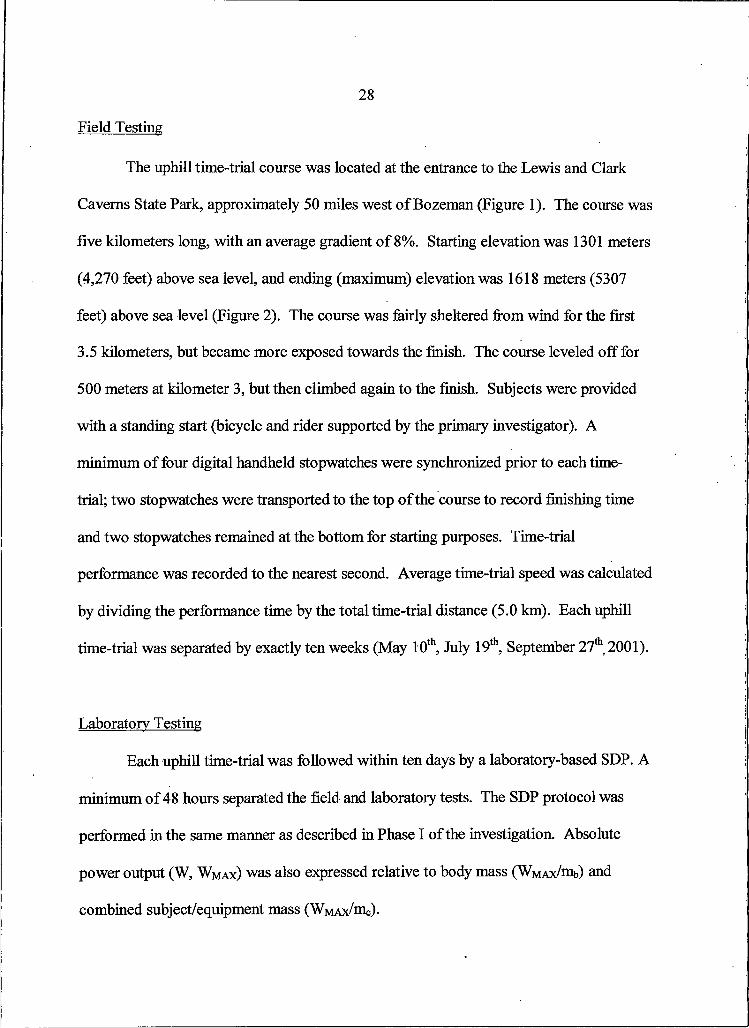
Field Testing
The uphill time-trial course was located at the entrance to the Lewis and Clark
Caverns State Park, approximately 50 miles west o f Bozeman (Figure I). The course was
five kilometers long, with an average gradient o f 8%. Starting elevation was 1301 meters
(4,270 feet) above sea level, and ending (maximum) elevation was 1618 meters (5307
feet) above sea level (Figure 2). The course was fairly sheltered from wind for the first
3.5 kilometers, but became more exposed towards the finish. The course leveled off for
500 meters at kilometer 3, but then climbed again to the finish. Subjects were provided
with a standing start (bicycle and rider supported by the primary investigator). A
minimum o f four digital handheld stopwatches were synchronized prior to each time-
trial; two stopwatches were transported to the top o f the course to record finishing time
and two stopwatches remained at the bottom for starting purposes. Time-trial
performance was recorded to the nearest second. Average time-trial speed was calculated
by dividing the performance time by the total time-trial distance (5.0 km). Each uphill
time-trial was separated by exactly ten weeks (May 10th, July 19th, September 27th, 2001).
Laboratory Testing
Each uphill time-trial was followed within ten days by a laboratory-based SDP. A
minimum o f 48 hours separated the field and laboratory tests. The SDP protocol was
performed in the same manner as described in Phase I o f the investigation. Absolute
power output (W, WMax) was also expressed relative to body mass (WMAx/mb) and
combined subject/equipment mass (WmAxZmc).

29
Figure I. Topographical view o f the uphill time-trial course (Lewis and Clark Caverns State Park, MT).
Figure 2. Uphill time-trial course profile.

30
Instrumentation
Scaling Derived Protocol
For the laboratory-based SDP, each subject’s bicycle was fitted to a
Computrainer™ stationary trainer (Computrainer™ Pro, Model 8001, Racermate Inc.,
Seattle WA., USA) that supported the mass o f the bicycle and rider at the rear wheel axle.
A commercially available plastic riser was placed under the front wheel to level the
bicycle. An adjustable roller unit was used to apply resistance to the rear wheel. The
resistance applied to the roller unit was, in turn, controlled by an electromagnetic “load
generator” via a handlebar-mounted keypad. Real-time measures o f power output at the
rear wheel, along with pedal cadence recorded by a crank arm sensor, were displayed on
the keypad.
The following steps were required to calibrate the Computrainer™ in accordance
with the guidelines established by the manufacturer: I) adjust the trainer stand to fit each
bicycle, 2) clean the rear tire o f dust and debris, 3) warm-up the rear tire for several
minutes, and 4) perform a “roll down calibration”. The “roll down” test estimates the
rolling resistance between the rear tire and the adjustable roller (which can vary
depending on tire pressure, tire temperature, and the amount o f pressure between the tire
and roller) so that the total resistance applied to the rear wheel is as accurate as possible.
The resistance applied to the rear wheel is independent o f pedal cadence. The total power
output (W) resisted at the rear wheel was controlled by the handlebar-mounted keypad in
IOW increments. The Computrainer™ was calibrated prior to each SDP administration.

31
Oxygen Consumption
Oxygen consumption for each test was measured by standard open-circuit
spirometry using a two-way, low resistance breathing valve. A SensorMedics 2900
metabolic cart (SensorMedics Corporation, Yorba Linda, CA., USA) was employed to
continuously monitor expired gases; V O2 was calculated over 20-second intervals. Prior
to testing, the gas analyzers were calibrated with primary gas standards o f known
concentrations (26% O2, N2 balance; 4% CO2, 16% O2, N2 balance), and the
SensorMedics ’ ventilatory measures were confirmed with a calibrated 3-liter syringe
(Model D, SensorMedics Coiporation, Yorba Linda, CA., USA). All information was
processed via an IBM computer using ProTrac software (Sensor Medics Corporation,
Yorba Linda, CA., USA).
Heart Rate
Heart rate data during each test was measured with a Polar Accurex Plus
telemetry-based heart rate monitor (Polar Electro Inc., Woodbury, NY., USA). Heart rate
was averaged every five seconds and downloaded to an adjacent computer via the serial
port interface provided by the manufacturer. Maximal heart rate was determined as the
highest five-second average heart rate during the SDP test.

32
Statistical Analysis
Phase I
SDP reliability was assessed via the calculation o f intraclass correlation
coefficients (ICC) from corresponding repeated-measures ANOVA: (ICC) = [(MSs -
MSw) / MSs], where MSs is the mean square between subjects and MSw is the mean
square within subjects. According to Vincent (1995), an ICC > 0.90 is considered high,
an ICC o f 0.80 to 0.89 is considered moderate, and an ICC < 0.80 is questionable.
Single-score reliability (Rjc=O was calculated to determine the reliability o f the SDP given
only one test administration: (Rjc=O = [MSs - MSw/ (MSs + (KZK5-I)(MSw)], where K is
the number o f repeated measures administered and K5 is the number o f repeated
measures for which R is estimated. The standard error o f measurement (SEM) and
coefficient o f variation (CV) were also calculated as additional means o f reliability:
SEM = [SDV(I-ICC)], where SD is the sample standard deviation; CV = [SD / sample
mean]. Repeated-measures ANOVA was performed with Statistix™ computer software
(Version 4.0 Analytical Software, St. Paul, MN).
Phase II
Multiple Pearson product-moment correlation coefficients (r) were used to
determine the relationship between changes in SDP performance and uphill time-trial
performance. Changes were calculated between Trials 1-2, 2-3,1-3 for all dependent
variables. Phase II statistical analyses were performed using Statistica™ computer
software (version 5.5, StatSoft, Inc., Tulsa, OK). The level o f significance was preset at
a = 0.05 for all tests, Phase I and II.

33
CHAPTER FOUR
RESULTS
Phase I
There were no significant differences between trials for time-to-exhaustion,
maximum power output, maximum heart rate, and relative V 02max- Intraclass
correlation coefficients were high for all variables, ranging from R = 0.933 to 0.992.
Single-score reliability was also high, with correlation coefficients ranging from
R(I5=I) = 0.823 to 0.977. Reliability data are presented in Table 3.
Table 3. Phase I SDP trial Means ± SD (range) and reliability data for all subjects (n = 21).
TTE W max H R max V O 2MAX
Trial I 11.1 ± 1.3 min (8.4-13.5)
339.6 ± 56.6 W (231.5-423.5)
190.4 ± 6.2 bpm (180-202)
63.3 ± 6.3 ml/kg/min (49.3-75.71)
Trial 2 11.4 ± 1.1 min (8.8-13.1)
351.5 ± 48.7 W (237.0-410.0)
189.6 ± 6.2 bpm (181-202)
63.6 ±5.9 ml/kg/min (47.61-72.75)
Trial 3 11.3 ± 1.2 min (8.8-13.6)
347.3 ± 51.6 W (238.0-427.5)
189.0 ± 6.7 bpm (181-204)
63.0 ± 5.7 ml/kg/min (48.31-72.66)
ICC 0.933 0.967 0.936 0.992
Rtk=!) 0.823 0.908 0.829 0.977
CV ±1.49% ±1.74% ±0.36% ±0.48%
SEM ±0.04 min ±1.09 W ±0.18 bpm ±1.53 ml/kg/min
TTE = laboratory protocol time-to-exhaustion; Wmax = maximum power output; HRmax = maximum heart rate; V 0 2Max = relative maximum oxygen consumption; ICC = intraclass correlation coefficient; = single-score reliability; CV = coefficient of variation; SEM = standard error of measurement.

34
In order to assess potential “learning effects” o f prior maximal testing experience
on SDP reliability, the primary data set was divided into two subsets (subjects with prior
maximal testing experience (n = 9) vs. subjects with no prior maximal testing experience
(n = 12)). There were no significant differences between trials for time-to-exhaustion,
maximum power output, maximum heart rate, and relative V 02max for subjects with
prior maximal testing experience. All variables were reliable with intraclass correlation
coefficients ranging from R = 0.947 to 0.982. Single-score reliability was also high, with
correlation coefficients ranging from R<k=i) = 0.826 to 0.949. Reliability data for subjects
with prior maximal testing experience are presented in Table 4.
Table 4. Phase I SDP trial Means ± SD (range) and reliability data for subjects with priormaximal testing experience (n = 9).
TTE W max H R max VO2MAX
Trial I 10.7 ±1.5 min (8.4-13.3)
336.8 ± 60.0 W (231.5-391.0)
192.1 ± 6.0 bpm (184-202)
63.0 ± 6.8 ml/kg/min (50.38-71.33)
Trial 2 11.2 ± 1.5 min (8.8-13.1)
375.9 ± 50.0 W (237.0-398.0)
192.4 ± 6.3 bpm (185-202)
63.5 ± 5.7 ml/kg/min (54.4-71.3)
Trial 3 11.2 ± 1.4 min (8.8-12.8)
349.9 ± 47.6 W (238.0-405.0)
192.3 ± 7.5 bpm (183-204)
65.6 ± 5.7 ml/kg/min (53.6-71.5)
ICC 0.947 0.935 0.969 0.982
R(k=i) 0.856 0.826 0.913 0.949
CV ±2.46% ±3.05% ±0.09% ±0.75%
SEM ±0.03 min ±0.66 W ±0.03 bpm ±0.02 ml/kg/min
TTE = laboratory protocol time-to-exhaustion; Wmax = relative maximum power output; HRmax = maximum heart rate; VO2max = relative maximum oxygen consumption; ICC = intraclass correlation coefficient; R(k=1) = single-score reliability; CV = coefficient of variation; SEM = standard error of measurement.

35
There were no significant differences between trials for time-to-exhaustion,
maximum power output, maximum heart rate, and relative V 02max for subjects with no
prior maximal testing experience. All variables were reliable with intraclass correlation
coefficients ranging from R = 0.879 to 0.995. Single-score reliability was also high with
correlation coefficients ranging from R<k=i) = 0.709 to 0.986. Reliability data for subjects
with no prior maximal testing experience are presented in Table 5.
Table 5. Phase I SDP trial Means ± SD (Range) and reliability data for subjects with no ________ prior maximal testing experience (n = 12).________________________________
TTE W max H R max V O 2MAX
Trial I 11.3 ± 1.0 min (9.5-13.5)
341.7 ± 56.6 W (245.0-423.5)
189.1 ± 6.2 bpm (180-198)
63.5 ± 6.1 ml/kg/m in (49.3-75.7)
Trial 2 11.5 ± 0.8 min (10.0-13.0)
346.7 ± 49.6 W (270.0-410.0)
187.5 ± 5.5 bpm (181-198)
63.6 ± 6.2 ml/kg/min (47.6-72.8)
Trial 3 11.4 ± 1.0 min (9.7-13.6)
345.4 ± 56.4 W (245.0-427.0)
186.5 ± 5.1 bpm (181-195)
63.3 ± 5.9 ml/kg/min (48.3-72.7)
IC C 0.995 0.991 0.879 0.982
R(k=i) 0.986 0.973 0.709 0.947
C V ±1.0% ±0.8% ±0.9% ±0.3%
SEM ±0.07 min ±5.37 W ±2.15 bpm ±0.10 ml/kg/min
TTE = SDP time-to-exhaustion; Wmax = relative maximum power output; HRmax = maximum heart rate; VO2MAx = relative maximum oxygen consumption; ICC = intraclass correlation coefficient; R0f0 = single-score reliability; CV = coefficient of variation; SEM = standard error of measurement.
36
Phase II
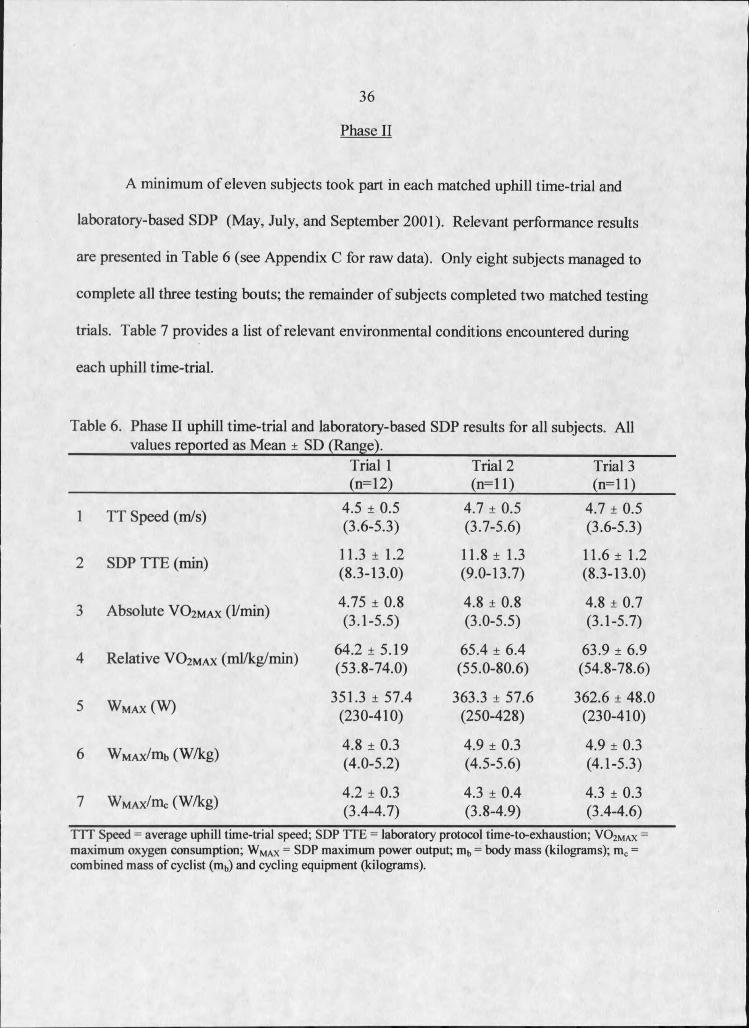
A minimum o f eleven subjects took part in each matched uphill time-trial and
laboratory-based SDP (May, July, and September 2001). Relevant performance results
are presented in Table 6 (see Appendix C for raw data). Only eight subjects managed to
complete all three testing bouts; the remainder o f subjects completed two matched testing
trials. Table 7 provides a list o f relevant environmental conditions encountered during
each uphill time-trial.
Table 6. Phase II uphill time-trial and laboratory-based SDP results for all subjects. All ________ values reported as Mean ± SD (Range).__________________________________
Trial I (n=12)
Trial 2 (n = lI)
Trial 3 (n = ll)
I TT Speed (m/s) 4.5 ± 0.5 (3.6-5.3)
4.7 ± 0.5 (3.7-5.6)
4.7 ± 0.5 (3.6-5.3)
2 SDP TTE (min) 11.3 ± 1.2 (8.3-13.0)
11.8 ± 1.3 (9.0-13.7)
11.6 ± 1.2 (8.3-13.0)
3 Absolute VO2Max (1/min) 4.75 ± 0.8 (3.1-5.5)
4.8 ± 0.8 (3.0-5.5)
4.8 ± 0.7 (3.1-5.7)
4 Relative VO2Max (ml/kg/min) 64.2 ±5.19 (53.8-74.0)
65.4 ± 6.4 (55.0-80.6)
63.9 ± 6.9 (54.8-78.6)
5 Wmax (W)351.3 ± 57.4
(230-410)363.3 ± 57.6
(250-428)362.6 ± 48.0
(230-410)
6 WMAxZmb (W/kg) 4.8 ± 0.3 (4.0-5.2)
4.9 ± 0.3 (4.5-5.6)
4.9 ± 0.3 (4.1-5.3)
I Wmax/hIc (W/kg)4.2 ± 0.3 (3.4-4.7)
4.3 ± 0.4 (3.8-4.9)
4.3 ± 0.3 (3.4-4.6)
TTT Speed = average uphill time-trial speed; SDP TTE = laboratory protocol time-to-exhaustion; VO2Max = maximum oxygen consumption; Wmax = SDP maximum power output; mb = body mass (kilograms); mc = combined mass of cyclist (mb) and cycling equipment (kilograms).

37
Table 7. Air temperature, relative humidity, and wind speeds encountered during the three________ uphill time-trials (May, July, September 2001).______________________________
Air Relative Wind Speed Ranges_______________ Temperature_______ Humidity__________Minimum_________ Maximum
Time-trial #1 68° F 31.0% 0-4 MPH 7-15 MPH
Time-trial #2 75° F 26.0% 0-6 MPH 10-14 MPH
Time-trial #3 72° F 12.5% 0-5 MPH 15-20 MPH
Minimum wind speeds were encountered during the first sheltered two-thirds of the time trial course. Maximum wind speeds were encountered at the more exposed summit-finish of the time-trial course.
The correlations between average time-trial speed and SDP time-to-exhaustion
were very high for all trials (r = 0.85 to 0.90), as were the correlations between average
time-trial speed and WwAxZmc (r = 0.83 to 0.92). Significant correlations were also
observed between average time-trial speed and WwAxZmb (r = 0.75 to 0.90) and relative
V O2wax (r = 0.63 to 0.73). Table 8 contains zero-order correlations between matched
uphill time-trial and SDP performance measurements.
Table 8, Phase II correlations between average TT speed (mZs) and SDP performance variables.Trial I Trial 2 Trial 3
(n = 12) (n = 11) (n= 11)I SDP TTE (min) 0.86' 0.90* 0.85*2 Absolute VO2MAx (IZmin) 0.55 0.70* 0.80*
3 Relative V 0 2Wax (mlZkgZmin) 0.73* 0.75* 0.63*
4 WWax (W) 0.53 0.68* 0.76*
5 WmAxZmb (WZkg) 0.75* 0.90* 0.77*
6 WwAxZmc (WZkg) 0.84* 0.92* 0.83*♦Values differ significantly from zero, P < 0 .0 5 . TTE = laboratory protocol time-to-exhaustion; VO2maX = maximum oxygen consumption; Wmax = SDP maximum power output; mb = body mass (kilograms); mc = combined mass of cyclist (mb) and cycling equipment (kilograms).

38
The correlation between change in average time-trial speed and change in SDP
time-to-exhaustion varied from r = 0.26 to 0.87, but the correlation between average
time-trial speed and Wmax/hIc was consistently high (r = 0.71 to 0.90), as was the
correlation between average time-trial speed and WmAxZhic (r = 0.70 to 0.90).
Interestingly, change-scores involving Trial I (1-2 and 1-3) were consistently lower than
change-scores not involving Trial I (2-3). Table 9 contains zero-order correlations
among inter-trial changes in uphill time-trial and SDP performance variables.
Table 9. Phase II correlations between inter-trial changes in average TT speed (m/s) and SDP ________ performance variables.______________________________________________________
Trials 1-2 Trials 2-3 Trials 1-3 Trials 1-2-3I SDP TTE (min) 0.57 0.87* 0.26 0.54*2 Absolute V02max (IZmin) 0.23 0.56 0.60 0.54*3 Relative VO2Max (ml/kg/min) 0.47 0.72* 0.66 0.67*4 Wmax (W) 0.70' 0.85* 0.48 0.63*5 WMAxZmb (WZkg) 0.73* 0.90* 0.71* 0.75*6 WmaxZihc (WZkg) 0.74* 0.90* 0.70* 0.75*
♦Values differ significantly from zero, f<0.05. TTE = laboratory protocol time-to-exhaustion; VO2maX = maximum oxygen consumption; Wmax = SDP maximum power output; mb = body mass (kilograms); mc = combined mass of cyclist (mb) and cycling equipment (kilograms).
Scatterplots depicting the relationships between inter-trial change in average time-
trial speed and WmAxZmc are provided in Figures 3-6. Notice that WmaxZhic was sensitive to
both positive and negative changes in uphill time-trial performance (as were WMax and
WMAxZmb). Also, the y-intercepts o f the least-squares derived linear regressions for average
time-trial speed are all very close to zero.

39
-0.3 -0.2 -0.1 0.0 0.1 0.2 0.3 0.4 0.5
Change in SDP WMAx/mc(W /kg)
Figure 3. Scatterplot depicts the relationship between Trial I and Trial 2 changes (T2-T1) in uphill average time-trial speed (m/s)and Wmax/hIc (W/kg). Solid line is least-squares derived linear regression: speed (m/s) = 0.001 + 0.522 x WMAxZmc (W/kg), r2 = 0.55.
Change in SDP W maxZh ic (W/kg)
Figure 4. Scatterplot depicts the relationship between Trial 2 and Trial 3 changes (T3-T2) in uphill average time-trial speed (nVs)and WMAxZmc (W/kg). Solid line is least-squares derived linear regression: speed (m/s) = 0.066 + 0.928 x WmaxZhic (W/kg), r2 = 0.81.

40
Change in SDP WMAx/nic(W /kg)
Figure 5. Scatterplot depicts the relationship between Trial I and Trial 3 changes (T3-T1) in uphill average time-trial speed (nVs)and WmaxZitic (W/kg). Solid line is least-squares derived linear regression: speed (m/s) = 0.066 + 0.928 x WmaxZiitc (W/kg), r2 = 0.81.
Change in SDP WMAx/mr (W /kg)
Figure 5. Scatterplot depicts relationship between changes for all trials (1-2, 2-3, 1-3) in uphill average time-trial speed (m/s) and WMax (W/kg). Solid line is least-squares derived linear regression: speed (m/s) = 0.005 + 0.727 x Wmax/iHc (W/kg), r1 = 0.56.

41
CHAPTER FIVE
DISCUSSION
Phase I
Although Heil and colleagues (2001) reported significant correlations between
SDP performance and uphill time-trial performance (r = 0.97 to 0.98), the reliability o f
the SDP had yet to be established. Therefore, Phase I o f the present study was
undertaken to assess the intraclass reliability o f the primary SDP performance measures.
Results indicate that all SDP performance (TTE and W max) and physiological (H R Max,
and relative V OzMAx) measures were highly reliable, with intraclass correlation
coefficients ranging from R = 0.933 to 0.992.
No learning or other test order effects were detected during the three different
SDP trials. The intraclass correlation coefficients for SDP performance for subjects with
no prior maximal testing experience (n = 12) were actually equal to or higher than the
intraclass correlation coefficients for subjects with prior maximal testing experience
(n = 9). Additionally, single-score reliability for all subjects (n = 21) was very high for
TTE (Rk=i = 0.823), W max (Rk=i = 0.908), and V O zmax (Rk=i = 0.977).
The inter-trial CV for W max (1.74%) is in agreement with previously reported CV
values for peak power output (PPO). For instance, Balmer, Davison, and Bird (2000)
reported a CV o f 1.32% for PPO during a 16.1-km laboratory time-trial, and Lindsay et ■
al. (1996) reported a CV o f 1.30% for PPO during a 40-km laboratory time-trials. In
42
addition, the CV for SDP TTE (1.49%) was considerably lower than the CV for TTE
determined by Krebs and Powers (1989) (5.2-55.9%) and McLellan et al. (1995)
(2.8-31%) when studying untrained subjects cycling to fatigue at 80% V 0 2max, as well
as that by Jeukendrup et al. (1996) (17%-40%) for well-trained subjects cycling to fatigue
at 85% V O2MAX- The CV for SDP TTE was also marginally lower than the CV reported
for TTC by Jeukendrup et al. (1996) (3.35%) and Bishop (1997) (2.7%) during fixed
duration protocols o f sixty minutes.
Phase II
In support o f Heil et al. (2000), Phase II results served to re-validate the SDP as
an accurate means to predict uphill time-trial performance. TTE and WmaxZuic were
highly correlated with average uphill time-trial speed (r = 0.85 to 0.90 and r = 0.83 to
0.92, respectively) for all three testing periods (May, July, and September 2001), as were
WMAxZnib (r = 0.75 to 0.90) and relative V O2MAx (r = 0.63 to 0.73). Once again, these
values compare favorably with those previously reported in the literature (Balmer et
al.,2000; Bishop et al., 1998; Hawley and Noakes, 1992; Lindsay et al., 1996; Schabort et
al., 2000).
However, the primary purpose o f the present study was to determine the ability o f
the SDP to track changes in uphill time-trial performance. Change-score correlations
between average time-trial speed and WMAxZnib and W maxZuic were significant for all
three testing periods (r = 0.70-0.90 and r = 0.71-0.90, respectively), explaining 50% to
80% o f the variance o f inter-trial changes in average time-trial speed. Notably, change-

43
score correlations associated with Trial I uphill time-trial data (Trial 1-2, 1-3) were
consistently lower than change-score correlations associated with Trials 2-3. This is
likely due to the fact that several o f the subjects rode the Trial I uphill time-trial “blind”
(with no prior reconnaissance), resulting in inter-trial learning effects. Also, Trial 3
environmental conditions (wind speed in particular) likely had an affect on change-score
correlations for Trials 1-3. Despite these circumstances, however, correlations for
change-scores between Trials 1-2 and 1-3 were still relatively favorable, (though not as
high as correlations for change-scores between Trials 2-3). Furthermore, absolute and
relative measures o f Wmax were sensitive to both positive and negative changes
(increases and decreases) in average uphill time-trial speed, as depicted in Figures 3-6.
In contrast, Lindsay et al. (1996) failed to note significant change-score
correlations between WMAx/mb and flat 40-km time-trial performance before and after a
four-week period o f high-intensity interval training (despite significant improvements in
both dependent variables). The reason for these results is likely due to the design o f the
incremental test employed by Lindsay and coworkers. The protocol commenced at a
work rate equivalent to 3.33 W/kg body mass (mb) for 150 seconds, then increased by 50
W for another 150 seconds. Following stage two, the exercise intensity was increased by
25 W every 150 seconds until volitional exhaustion - regardless o f body mass and/or the
theoretical energy demands o f flat 40-km time-trial cycling.
Whereas the SDP was specifically designed to simulate the external power
demand (Wd) o f uphill cycling as influenced by body mass (e.g. Wd K Mb0'89, Heil,
1998), the protocol used by Lindsay et al. failed to accurately simulate the power demand

44
o f flat 40-km cycling (WD « Mb0'32; Swain, 1994). It is not surprising, therefore, that
changes in PPO failed to correlate with changes in 40-km time-trial performance.
Despite the high correlations observed in the present study between changes in
SDP Wmax and average time-trial speed, correlations between changes in SDP time-to-
exhaustion and average time-trial speed were low to moderate (r = 0.26 to .87),
explaining only 7% to 75% o f the inter-trial variance. This discrepancy between two
seemingly analogous measures o f SDP performance can be explained by taking a closer
look at the theoretical and structural design o f the SDP.
The SDP was primarily designed to simulate the energy demand o f uphill cycling
as influenced by body mass. Stage 5 o f the SDP is accordingly designated as the
estimated power demand required for a person o f a given body mass to propel a bicycle
up a 8.7% (5°) incline at 6.72 m/s (15 MPH). This particular speed and grade were
chosen to approximate a sub-lactate threshold power output in moderately trained
collegiate cyclists (Heil et al, 2000).
At this point it is important to recognize a secondary purpose o f the SDP: to serve
as a valid and reliable V O2Max test for cyclists when appropriate. As such, the remaining
SDP stages were designed to fit within the eight to twelve minute time period considered
ideal for the determination o f maximal cardiopulmonary capacity (Buchfuhrer et al.,
1983). Stage I was arbitrarily calculated as 20% o f the Stage 5 value. Stage 2 as 40%,
Stage 3 as 60%, etc. Stages 6 and above increase by 10% increments o f Stage 5.
Therefore, it is easy to understand why TTE is not as sensitive to changes in
uphill time-trial performance as WmAxZmc. Whereas WMAxZmc is theoretically derived to

45
correlate highly with uphill time-trial performance, TTE is bound by the time limitations
for the proper assessment o f V O2Max- Though unconfirmed, this trait is likely inherent to
all PPO protocols designed with the secondary purpose to assess V 0 2max; measures o f
Wmax will always correlate more strongly with performance than measures o f TTE or
TTC. A second factor potentially responsible for the low to moderate change-score
correlations associated with TTE is the relatively lower reliability o f TTE (when
compared to WMax, Phase I).
There are several benefits o f modeling the SDP after an uphill time-trial as
opposed to a flat time-trial. In addition to significantly simplifying the underlying
calculations o f contributing factors to the overall energy demand o f cycling (see Heil et
al., 2000, Appendix), an uphill time-trial simulation may also be more relevant and valid
for the prediction o f overall professional cycling success.
Hills determine the outcome o f a road race more than any other element. It is a
basic function o f time: even on circuit courses containing equal-length segments o f
positive and negative elevation gain, cyclists’ overall time will be greater on the uphills
(Kyle, 1988; Swain, 1997). Though larger cyclists may descend faster than smaller,
climbing-proficient cyclists, they cannot make up the time lost going uphill (Swain,
1994). Additionally, the relative power-to-drag advantage o f large cyclists on the flats
(Swain, 1994) is effectively negated by the ability o f smaller cyclists to remain tucked
within the sheltering draft o f the peloton (thus reducing their air resistance by as much as
40%, (McCole et al., 1990)). And once the road begins to climb again, the increased
grade and slower speeds play conveniently to the talents o f climbers. For these reasons.

46
victors o f the predominantly hilly grand tours (Tour de France, Giro dTtalia, and the
Vuelta a Espana) tend to be smaller, climbing-proficient cyclists (Swain, 1994).
Consequently, a laboratory protocol capable o f predicting and/or tracking changes in
uphill time-trial performance may also predict cycling success on a higher level.

47
CHAPTER SIX
CONCLUSION
The SDP appears to be a reliable and valid means for predicting and tracking
uphill time-trial cycling performance. Phase I results indicate that the primary measures
o f SDP performance, WmaxZiuc and TTE, were highly reproducible. WMAxZiuc had an
intraclass correlation coefficient o f R = 0.933 and a single-score reliability o f Rk=i =
0.986. TTE had an intraclass correlation coefficients o f R = 0.992 and a single-score
reliability OfRk=I = 0.973. The correlations o f variation for WmaxZiuc and TTE were
1.74% and 1.49%, respectively.
Phase II results indicate that WmaxZiuc is a valid measure for tracking changes in
uphill time-trial performance. Change-score correlations for WmaxZiuc and average uphill
time-trial speed were consistently high (r = 0.74 to 0.90). SDP TTE, however, appears
less able to track changes in average uphill time-trial speed (r = 0.26 to 0.87). This is
likely due to the structural design o f the SDP stages (resistance levels).
Implications for Further Research
Given the practicality, affordability, and promising ability o f the SDP to predict
and track changes in uphill time-trial performance in a heterogeneous group o f cyclists
(with respect to gender, age, and competitive experience) it would be o f benefit for future
studies to validate the SDP in more homogeneous populations: more highly trained adults

48
and non-trained to highly trained youth populations. The latter would be especially
important for youth cycling talent identification programs. Also, considering the variable
and inhospitable environmental conditions encountered during Phase II o f the present
study (welcome to Bozeman, MT), it would be advisable for future researchers to
conduct a similarly designed study in a more climatically moderate location.

49
REFERENCES

50
Acevedo, E.O., and Goldfarb, A.H. (1989). Increased training intensity effects on plasma lactate, ventilatory threshold, and endurance. Medicine and Science in Snorts and Exercise. 2 ItSh 563-568.
Allen, W.K., Seals, D.R., Hurley, B.F., Ehsani, A.A., and Hagberg J.M. (1985). Lactate threshold and distance running performance in young and older endurance athletes. Journal o f Applied Physiology. 58. 1281-1284.
Astrand, P.O. and Rodahl, K. (1986). Textbook o f Work Physiology. 3rd edition. New York: McGraw-Hill.
Aunola, S., and Rusko, H. (1986). Aerobic and anaerobic thresholds determined from venous lactate or from ventilation and gas exchange in relation to muscle fiber composition. International Journal o f Sports Medicine. 7. 161-166.
Balmer, J., Davison, R.C., and Bird, S.R. (2000). Peak power predicts performance power during an outdoor 16.1-km cycling time trial. Medicine and Science in Sports and Exercise. 3218). 1485-1490.
Barlow, K., Weltman, A., Schurrer, R., and Henritze, J. (1985). Prediction o f maximal effort bicycle ergometer endurance performance. International Journal o f Sports Medicine. 6(41 190-196.
Bassett, D.R. and Howley, E.T. (2000). Limiting factors for maximum oxygen uptake and determinants o f endurance performance. Medicine and Science in Sports Exercise. 32m. 70-84.
Basset, D.R. and Howley, E.T. (1997). Maximal oxygen uptake: “classical” versus “contemporary” viewpoints. Medicine and Science in Sports Exercise. 29. 591-603.
Bassett, D.R., Kyle, C.R., Passfield, L., Broker, J.P., and Burke, E.R. (1999). Comparing cycling world hour records, 1967-1996: modeling with empirical data. Medicine and Science in Sports Exercise. 3 1. 1665-1676.
Beaver, W.L., Wasserman, K., and Whipp, B.J. (1985). Improved detection o f lactate threshold during exercise using a log-log transformation. Journal o f Applied Physiology. 59, 1936-1940.
Bilodeau B., Rundell K.W., Roy B., and Boulay M.R. (1996). Kinematics o f crosscountry ski racing. Medicine and Science in Sports and Exercise. 28m . 128-138.
Billat, V. Renoux, J.C., Pinoteau, J., Petit, B., and Koralsztein, J.P. (1994). Reproducibility o f running time to exhaustion at VOzmax in subelite runners. Medicine and Science in Sports and Exercise. 26(2). 254-257.

51
Bishop, D. (1997). Reliability o f a I-hour endurance performance test in trained female cyclists. Medicine and Science in Sports and Exercise. 29. 554-559.
Bishop, D. Jenkins, D.G., and MacKinnon, L.T. (1998). The relationship between plasma lactate parameters, WpeaIc, and 1-h cycling performance in women. Medicine and Science in Sports and Exercise. 30. 1270-1275.
Borysewicz, E. (1985). Bicycle Road Racing: Complete Program for Training and Competition. Brattleboro, VT: Vitesse Press, pp. 270.
Bourdon, P. (2000). Blood Lactate Transition Thresholds: Concepts and Controversies.In: Physiological Tests for Ehte Athletes. Champaign, IL: Human Kinetics.
Brooks, G A ., Fahey, T.D., and White, T.P. (1996). Exercise Physiology: Human Bioenergetics and Its Applications. 2nd edition. CA: Mayfield Publishing Company.
Buchfurher, M.J., Hansen, J.E., Robinson, T.E., Sue, D.Y., Wasserman, K. and Whipp, B.J. (1983). Optimizing the exercise protocol for cardiopulmonary assessment. Journal o f Applied Physiology. 55. 558-564.
Burke, E.R. (1995). Serious Cycling. Champaign, IL: Human Kinetics.
Burnham, T.R., Fox, S., and Wilcox, A. (1995). The reproducibility o f cycling time to volitional fatigue. Medicine and Science in Sports and Exercise. 27. S15.
Cheng, B., Kuipers, H., Snyder, A., et al. (1992). A new approach for the determination o f ventilatory and lactate thresholds. International Journal o f Sports Medicine. 13. 518- 522.
Coggan, A.R. and Coyle E.F. (1987). Reversal o f fatigue during prolonged exercise by carbohrdrate infusion or ingestion. Journal o f Applied Physiology. 63. 2388-2395.
Conconi, F., Ferrara, M., Ziglio, P.G. Droghetti, P., and Codeca, L. (1982).Determination o f the anaerobic threshold by a noninvasive field test in runners. Journal o f Applied Physiology. 52. 869-873.
Conley, D.L, and Krahenbahl, G.S. (1980). Running economy and distance running performance o f highly trained athletes. Medicine and Science in Sports and Exercise. 12. 357-360
Costill, D.L. (1967). The relationship between selected physiological variables and distance running performance. Journal o f Sports and Physical Fitness. 7, 61-66.

52
Costill, D.L. and Fox, E. (1969). Energetics o f marathon running. Medicine and Science in Sports and Exercise. I. 81-86.
Costill, D.L. Bowers, R., Braham, G., and Sparks, K. (1971a). Muscle glycogen utilization during prolonged exercise on successive days. Journal o f Applied Physiology, 3L 834-838.
Costill, D.L., Kovaleski, J., Porter, D., Kirwan, J., Fielding, R., and King, D. (1985). Energy expenditure during front crawl swimming: predicting success in middle distance events. International Journal o f Sports Medicine. 6. 266-270.
Costill, D.L., Sparks, K., Gregor, R. and Turner, C. (1971b). Muscle glycogen utilization during exhaustive exercise. Journal o f Applied Physiology. 31. 353-356.
Costill, D.L., Thomason, H., and Roberts, E. (1973). Fractional utilization o f the aerobic capacity during distance running. Medicine and Science in Sports and Exercise. 5. 248- 252.
Coyle, E.F. Coggan, A.R., Hopper, M.K., and Wlaters, T.J. (1988). Determinants o f endurance in well-trained cyclists. Journal o f Applied Physiology. 5 4 .18-23.
Coyle, E.F., Feltner, M.E., Kautz, S.A., Hamilton, M.T., Montain, S.J., Baylor, A.M., Abraham, L.D., and Petrek, G.W. (1991). Physiological and biomechanical factors associated with elite endurance cycling performance. Medicine and Science in Sports and Exercise. 23 (TL 93-107.
Craig, N.P., Norton, K.I., Bourdon, P.C., Woolford, S.M., Stanef T., Squires, B., Olds, T.S., Conyers, R.A.J., and Walsh, C.B.V. (1993). Aerobic and anaerobic indices contributing to track endurance cycling performance. European Journal o f Apphed Physiology, 67. 150-158.
Daniels, J. (1974). Physiological characteristics o f champion male athletes. Research Quarterly for Exercise and Sport. 45. 342-348.
Davis, H.A., Basset, J., Hughes, P., et al. (1983). Anaerobic threshold and lactate tumpoint. European Journal o f Applied Physiology. 50. 383-392.
Davison, R.C., Swan, D., Coleman, D., and Bird, S. (2000). Correlates o f simulated hill climb cycling performance. Journal o f Sports Sciences. 18 . 105-110.
Dengel, D.R., Flynn, M.G., and Costill, D.L. (1989). Determinants o f success during triathlon competition. Research Quarterly for Exercise and Sport. 60. 234-238.

53
Dillman, CJ. (1975). Kinematic analysis o f running. Exercise and Snort Science Reviews. 3. 193-218.
di Prampero5 P.E., Cortilli5 G., Mognoni5 P.5 Saibene5 F. (1979). Equation o f motion o f a cyclist. Journal o f Applied Physiology. 47. 201-206
El-Sayed5 M.S., Balmer5 J.5 and Rattu5 A.J.M. (1997). Carbohydrate ingestion improves endurance performance during I hour simulated cycling time trial. Journal o f Sports Science. 15. 223-230.
Farrell5 P A . , Wilmore5 J.H., Coyle5 E.F., Billing, J.E., and Costill5 D.L. (1979). Plasma lactate accumulation and distance running performance. Medicine and Science in Sports and Exercise. 11. 338-344.
Foster5 C.5 Costill5 D.L., Daniels, J.T., and Fink5 W.J. (1978). Skeletal muscle enzyme activity, fiber composition, and VOimax in relation to distance running performance. European Journal o f Applied Physiology. 39. 73-80.
Foster5 C., Green5 M A 5 Snyder5 A.C., and Thompson5 N.N. (1993). Physiological responses during simulated competition. Medicine and Science in Sports and Exercise. (25)1. 877-882.
Hagberg5 J.M. and Coyle5 E.F. (1983). Physiological determinants o f endurance performance as studied in competitive racewalkers. Medicine and Science in Sports and Exercise. 15.. 287-289.
Hagberg5 J.M., Mullin5 J.P., Bahrkre5 M., and Limburg5 J. (1979). Physiological profiles and selected psychological characteristics o f national class American cyclists. Sports Medicine. 19. 341-346.
Hawley, J.A., and Noakes5 T.D. (1992). Peak power output predicts maximal oxygen uptake and performance time in trained cyclists. European Journal o f Applied Physiology. 65. 79-83.
Heck5 H., Mader5 A., Hess5 G., et al. (1985). Justification o f the 4 mmol/1 lactate threshold. International Journal o f Sports Medicine. 6 . 117-130.
Heil5 D.P. (1997). The pressor response to submaximal cycle ergometry while using aerodynamic handlebars. International Journal o f Sports Medicine. 18(1). 1-7.
Heil5 D.P. (1998). Scaling o f submaximal oxygen uptake with body mass and combined mass during uphill treadmill bicycling. Journal o f Applied Physiology. 85. 1376-1383.

54
Heil, D .PD errick, T.R., and Whittlesey, S. (1997). The relationship between preferred and optimal positioning during submaximal cycle ergometry. European Journal of Applied Physiology, 75. 160-165.
Heil, D.P., Murphy O.F., Mattingly, A.R., and Higginson, B.K. (2000). Prediction of uphill time-trial bicycling performance with a scaling derived protocol. European Tnnmal o f Applied Physiology. 85, 374-382.
Heil, D.P., Wilcox, A., and Quinn, C. (1995). The effect o f seat-tube angle variation on cardiorespiratory responses during submaximal bicycling. Medicine and Science in Sports and Exercise. 27(51 730-735.
Hickey, M.S., Costill, D.L., McConell, G.K., Widrick, J.J., and Tanaka, H. (1992). Day to day variation in time trial cycling performance. International Journal o f Sports Medicine. 13. 467-470.
Hickson, R.C., Dvorak, B.A., Gorostiaga, E.M., Kurowski, T.T., and Foster, C. (1988). Potential for strength and endurance training to amplify endurance performance. Journal o f Applied Physiology. 6 5 .2285-2290.
Hill, A.V. and Lupton, H. (1923). Muscular exercise, lactic acid, and the supply and utilization o f oxygen. Quarterly Journal o f Medicine. 1 6 .135-171.
Hopkins, S.R. and McKenzie, D.C. (1994). The laboratory assessment o f endurance performance in cyclists. Canadian Journal o f Applied Physiology. 19. 266-274.
Hopkins, W.G., Hawley, J.A., and Burke, L.M. (1999). Design and analysis o f research on sport performance enhancement. Medicine and Science in Sports and Exercise. 31. 472-485.
Jacobs, I. (1986). Blood lactate: implications for training and sport performance. Journal o f Sports Medicine. 3 . 10-25.
Jeukendrup, A., Saris, W.H.M., Boruns, F., and Kester, A.D.M. (1996). A new validated endurance performance test. Medicine and Science in Sports and Exercise. 28. 266-270.
Kautz, S.A., Feltner, M.E., Coyle, E.F., and Baylor, A.M. (1991). The pedaling technique o f elite endurance cyclists: changes with increasing workload at constant cadence. International Journal o f Sports Biomechanics. 7. 29-53.
Kindermann, W., Simon, G., and Keul, J. (1979). The significance o f the aerobic- anaerobic transition for the determination o f work load intensities during training. European Journal o f Applied Physiology. 42. 25-34.

55
Krebs, P.S. and Powers, S.K. (1989). Reliability o f laboratory performance tests. Medicine and Science in Sports and Exercise. 31. S10,1989.
Kuipers, H., Verstappen, F.T.J, Keizer, P., Geurten, P., and Van Krannenburg, G. (1985). Variability o f aerobic performance in the laboratory and its physiologic correlates. International Journal o f Sports Medicine. 6. 197-201.
Kumagai, S., Tanaka, K., Matsmura, Y., Matsuzaka, A., Hirakoba, K., and Yasuda, H. (1982). Relationships o f the anaerobic threshold with the 5 km, 10 km, and 10 mile races. European Journal o f Applied Physiology. 42. 13-23.
Kyle, C R. (1988). The mechanics and aerodynamics o f cycling. In: Medical and Scientific Aspects o f Cycling. Burke, E.R. and Newsome, M.M (Eds.). Champaign, IL: Human Kinetics, 235-251.
Lindsay, F.H., Hawley, LA., Myburgh, K.H., Schomer, H.H., and Noakes, T.D. (1996). Improved athletic performance in highly trained cyclists after interval training. Medicine and Science in Sports and Exercise. 28. 1427-1434.
Loftin, M. and Warren, B. (1994). Comparison o f a simulated 16.1-km time trial, V02max and related factors in cyclists with different ventilatory thresholds. International Journal o f Sports Medicine. 15(8). 498-503.
MacRae, H.S.H., Hise, K.J., and Allen, P.J. (2000). Effects o f front and dual suspension mountain bike systems on uphill cycling performance. Medicine and Science in Sports and Exercise. 29(1 IL 1505-1512.
McLellan, T.M., Cheung, S.S., and Jacobs, I. (1995). Variability o f time to exhaustion during submaximal exercise. Canadian Journal o f Applied Physiology, 20. 39-51.Miller F.R. and Manfredi, T.G. (1987). Physiological and anthropbmetrical predictors of 15 kilometer time trial cycling performance time. Research Quarterly for Sport and Exercise. 5 8 .250-254.
McCole, S.D., Claney, K. Conte, J.C., Anderson, R., and Hagberg, J.M. (1990). Energy expenditure during bicycling. Journal o f Applied Physiology, 68. 748-753.
Morgan, D.W., Baldini, F.D., Martin, P.E., and Kohrt, W.M. (1989). Ten kilometer performance and predicted velocity at VOzmax among well-trained male runners. Medicine and Science in Sport and Exercise. 18. 78-83.
Nichols, J.F., Phares, S.L., and Buono, M.J. (1997). Relationship between blood lactate response to exercise and endurance performance in competitive female master cyclists. International Journal o f Sports Medicine. 18. 458-463.

56
Noakes5 T.D. (1988). Implications o f exercise testing for prediction o f athletic performance: a contemporary perspective. Medicine and Science in Sport and Exercise. 20, 319-330.
Noakes5 T.D., Myburgh5 K.H., and Schall5 R. (1990). Peak treadmill velocity during the VOapeak test predicts running performance. Journal o f Sport Science. 8. 25-45.
Olds5 T.S., Norton5 K.I., Lowe5 E.L.A., Olive, S5 Reay5 F., and Ly5 S. (1995). Modeling road cycling performance. Journal o f Applied Physiology, 78. 1596-1611.
Palmer, G.S., Clancy, M.C., Hawley, A., Rodger51.M., Burke5 L.M., and Noakes5 T.D. (1998). Carbohydrate ingestion immediately before exercise does not improve 20-km time trial performance in well trained cyclists. International Journal o f Sports Medicine. 19,415-418.
Palmer, G.S., Dennis5 S.C., Noakes5 T.D., and Hawley, LA. (1996). Assessment o f the reproducibility o f performance testing on an air-braked cycle ergometer. International Journal o f Sports Medicine. 17, 293-298.
Powers S.K., Dodd5 S., Deason5 R., Byrd5 R., and McKnight5 T. (1983). Ventilatory threshold, running economy, and distance running performance o f trained athletes. Research Quarterly for Sport and Exercise. 54. 179-182.
Rundell K.W. and McCarthy, J.R. (1996). Effect o f kinematic variables on performance in women during a cross-country ski race. Medicine and Science in Sports and Exercise. 28(111.1413-1417.
Saltin B. and Astrand5 P.O. (1967). Maximal oxygen uptake in athletes. Journal of Applied Physiology. 23. 353-358.
Schabort5 E.J., Hawley, J.A., Hopkins5 W.G., Mujika5 L5 and Noakes5 T.D. (1998). A new reliable laboratory test o f endurance performance for road cyclists. Medicine and Science in Sports and Exercise. 30(121.1744-1750.
Scott, B.K. and Houmard5 J.A. (1994). Peak running velocity is highly related to distance running performance. International Journal o f Sports Medicine. 15. 504-507.
Sjodin5 B. (1981). Onset o f blood lactate accumulation and marathon running performance. International Journal o f Sports Medicine. 2. 23-26.
Skinner J.S., and McLellan5 T.M. (1980). The transition from aerobic to anaerobic metabolism. Research Quarterly for Exercise and Snort. 5 1 .234-248.

57
Sleivert, G.G, and Rowlands, D.S. (1996). Physical and physiological factors associated with success in the triathlon. International Journal o f Sports Medicine. 22(1). 8-18.
Smith, J.C., Dangelmaier, B.S., and Hill, D.W. (1999). Critical power is related to cycling time trial performance. International Journal o f Sports Medicine. 20. 374-378.
Swain, D. P. (1994). The influence o f body mass in endurance bicycling. Medicine and Science in Sports and Exercise. 2611T 58-63.
Swain, D.P. (1997). A model for optimizing cycling performance by varying power output on hill and in wind. Medicine and Science in Sports and Exercise. 2918'). 1104- 1108.
Thoden, J. (1991). Testing aerobic power, In: Physiological Testing o f the High- Performance Athlete. 2nd edition., Champaign, IL: Human Kinetics
Van Handel, PJ., Baldwin, C., Puhl, I., Katz, A., Dantine, S., and Bradley, P.W. (1988). Measurement and interpretation o f physiological parameters associates with cycling performance. Burke, E.R. and Newsom, M.M. (eds.) Medical and Scientific Aspects o f Cycling. Champaign, IL: Human Kinetics Publishers, 47-72.
Van Ingen Schenau G.J., de Groot G., and Hollander A.P. (1983). Some technical, physiological and anthropometrical aspects o f speed skating. European Journal o f Applied Physiology and Occupational Physiology. 5013L 343-354.
Vincent, WJ. (1995). Statistics in Kinesiology. Champaign, IL: Human Kinetics, p. 179.
Weltman, J., Snead, D., and Stein, P. (1990) Reliability and validity o f a continuous incremental treadmill protocol for the determination o f lactate threshold, fixed blood lactate concentrations, and VO2Max- International Journal o f Sports Medicine, 11, 26-32.
Westgarth-Taylor, C., Hawley, LA., Rickard, S., Myburgh, K.H., and Noakes, T.D. (1997). Metabolic and performance adaptations to interval training. European Journal o f Applied Physiology. 75. 298-304.
Weston, A R ., Myburgh, K.H., Lindsay, F.H., Dennis, S.C., Noakes, T.D., and Hawley, LA. (1997). Skeletal muscle buffering and endurance performance after high-intensity interval training by well-trained cyclists. European Journal o f Applied Physiology, 75, 7- 13.
Williams K.R., and Cavanagh, P.R. (1987). Relationship between distance running mechanics, running economy, and performance. Journal o f Applied Physiology, 63(3), 1236-1245.

Yoshida5 T. (1984). Effect o f dietary modifications on lactate threshold and onset o f blood lactate accumulation during incremental exercise. European .Toumal o f Applied Physiology, 53. 200-205.
Yoshida5 T., Chida5 M., Ichioka5 M., and Suda5 Y. (1987). Blood lactate parameters related to aerobic capacity and endurance performance. European Journal o f Applied Physiology, 56, 7-11.
58

APPENDICES

60
APPENDIX A
SUBJECT CONSENT FORM

61
SUBJECT CONSENT FORM FOR PARTICIPATION IN HUMAN RESEARCHMONTANA STATE UNIVERSITY
PROJECT TITLE: Reliability and validity o f a test protocol to predict and track uphillcycling time-trial performance (Spring/Summer 2001)
FUNDING: This study is NOT a funded project.
PRINCIPLE Daniel P. Heil, PhD.INVESTIGATOR: Assistant Professor, Exercise Physiology
Department o f Health and Human Development Romney 103, Montana State University Bozeman, MT. 59715-3540
PROJECT Owen F. MurphyDIRECTOR: Master’s Degree Candidate
Department o f Health and Human Development
PURPOSE OF THE STUDY: This investigation will be conducted in two parts. Part I o f the study will assess the reliability o f a laboratory-based test protocol (SDP) to predict a cyclist’s uphill cycling time-trial performance capability. Part II o f the study will subsequently determine the relationship between SDP performance and uphill time-trial performance. Please read and initial only the section(s) o f this Informed Consent Document that apply to you (Part I, II, or both).
Part I. The purpose o f this phase o f the investigation is to assess the test-retest----- reliability o f a laboratory-based protocol called the SDP (Scaling Derived
Protocol). This new protocol, based upon a previously published algorithm by the principle investigator, requires that each subject use their own road racing bicycle mounted on a stationary trainer (CompuTrainer™).
Part II. The purpose o f this phase o f the investigation is to determine if the----- laboratory-based SDP test can reliably predict and track the actual uphill time-
trial performance capability o f a cyclist over a period o f seven months.
Each subject is presented with this Informed Consent Document - the purpose o f the document should be explained prior to your signing. Once signed, medical clearance will be obtained using a standard medical form (i.e. Physical Activity Readiness Questionnaire, or PAR-Q). If any questions arise concerning your medical history, medical clearance (in writing) may also be obtained from your physician. This procedure is in compliance with policies formulated by the American College o f Sports Medicine1.
1 American College o f Sports Medicine (2000). ACSM’s Guidelines fo r Exercise Testing and Prescription (5th ed). Williams & Wilkins, Philadelphia, PA.

62
STUDY OUTLINE:
Part I. You (the subject) will be required to make three visits to the Movement Science Laboratory (Romney Building, Room 2) at Montana State University (Bozeman) within a two-week period. The visits will last approximately 1.5 hours each, and will be scheduled 24-48 hours AFTER your last hard workout. It is important that you prepare for each lab visit as you would for a true cycling competition.
Before arriving at the lab, you should refrain from ingesting any medications, including caffeine or aspirin, for at least 2 hours. If any medications were taken (such as cold or allergy medicine) please inform the investigator PRIOR to any testing - we will gladly reschedule your visit. You should arrive at the lab prepared to engage in 12-15 o f vigorous (maximal) exercise using your own road bicycle. Therefore, all subjects must bring their own bicycle, as well as cleats and appropriate exercise clothing.
One o f the main purposes o f your lab visits is to measure your maximal oxygen consumption (VOzwAx). This test determines your body’s maximal capability to uptake, transport, and then utilize oxygen in the working muscles while cycling on a stationary trainer. After measuring body weight and height, you will be allowed to warm up on your bicycle at a self-selected speed and grade for approximately 10-15 minutes (or until you feel comfortable with the testing environment). The test itself will start out easy, and gradually increase in difficulty every 1-2 minutes while you maintain a steady cadence between 80 and 90 RPM. The test will end when you literally cannot maintain the cadence any longer (approximately 10-15 minutes).The effort put forth at the highest intensity o f exercise during the test is comparable to that o f an 800-meter running race. The goal o f the test is fo r you to last as long as you possibly can into the protocol before you reach the point where you must stop.
During the exercise test you will be breathing through a mouthpiece (similar to a snorkel mouthpiece) so that the amount o f oxygen you are consuming can be measured. At the same time, you will be wearing a heart rate monitor strap around your chest to measure heart rate via telemetry. You may also be asked to provide a rating o f your perceived exertion (RPE) on a scale o f 0 to 10 (resting to maximal intensity exercise) during the test.
Part II. If you haven’t already done so, please read and initial the study outline for Part I. All o f the laboratory testing involved in Part II o f this investigation will be identical to that described above. In addition to performing a total o f four bimonthly SDP tests, you (the subject) will be required to perform four corresponding outdoor uphill time trials. The corresponding laboratory and field tests will be scheduled to take place in the months o f March, May, July, and September 2001, with a maximum

63
o f 5 days separating the indoor and outdoor tests. Outdoor time trial dates will be scheduled 30 days in advance, with an alternative date arranged in the event o f inclement weather.
The time trial course is 3.0 miles long, with an average gradient o f 8%. Starting elevation is 4,270 feet, and maximum elevation is 5307 feet. The time trial course is located at the entrance to the Lewis and Clark Cavern State Park, approximately 50 miles west o f Bozeman. Carpools to the test site will be arranged.
POTENTIAL RISKS: You should be aware that maximal exercise intensity (as experienced during the laboratory and field tests) may cause extreme fatigue immediately after the tests, and possibly during the next day. Maximal intensity exercise also involves a chance o f precipitating a cardiac event (such as abnormal heart rhythms), or even death. However, the possibility o f such an occurrence is slight (less than I in 10, 000) since you are in good physical condition with no known symptoms o f heart disease, and since the tests will be administered by trained personnel. The measuring devices used for the laboratory tests (heart rate monitor and mouthpiece) may feel somewhat restricting and/or uncomfortable during testing, but all possible adjustments will be made to achieve the greatest amount o f comfort for you. All possible precautions will be taken to ensure your safety make you feel comfortable before any testing takes place.
BENEFITS: A copy o f each o f your laboratory test results (VC>2max) will be provided for you. In addition, you may also request a copy o f the results for the entire investigation (call the project director listed on the front page).
CONFIDENTIALITY: The data and personal information obtained from this study will be regarded as privileged and confidential. They will not be released except upon your written request/consent. Your right to privacy will be maintained in any ensuing analysis and/or presentation o f the data by using coded identifications for each subject’s data.
FREEDOM OF CONSENT: You may withdraw consent in writing, by telephone, or in person with either the principle investigator, Dr. Dan Heil, or the project director, Owen Murphy. Participation is completely voluntary. In the event o f any physical injury occurring in connection with the conduct o f this research, Montana State University will not provide any medical treatment or special compensation. We will, however, advise and assist the participant in receiving medical treatment. In addition, Montana State University will not be held responsible for injury or accidents the may occur when traveling to and from the laboratory and field test sites.
You are encouraged to express any questions, doubts, or concerns regarding this study. The investigators will attempt to answer all questions to the best o f their ability. The investigators fully intend to conduct the study with your best interest, safety, and comfort in mind.

64
APPENDIX B
SDP TEST PROTOCOL

SDP stages (in watts) in 5.0 kg body mass increments. See text for details regarding the protocols derivation and administration.
Minute 1:00- 2:00- 4:00- 6:00- 8:00- 9:00- 10:00- 11:00- 12:00- 13:00- 14:00- 15:00- 16:00-
Body Mass0-0:59 1:59 3:59 5:59 7:59 8:59 9:59 10:59 11:59 12:59 13:59 14:59 15:59 16:59
(kg)Stage I 2 3 4 5 6 7 8 9 10 11 12 13 14
40 - 44.9 32 64 97 129 161 177 193 209 225 241 258 274 290 306
45 - 49.9 36 71 107 142 178 196 213 231 249 267 284 302 320 338
50 - 54.9 39 77 117 155 194 214 233 253 272 291 311 330 350 369
55 - 59.9 42 84 126 168 211 232 253 274 295 316 337 358 379 400
60 - 64.9 45 91 136 181 227 250 272 295 318 340 363 386 408 431
65 - 69.9 49 97 146 194 243 267 292 316 340 364 389 413 437 462
70 - 74.9 52 104 155 207 259 205 311 337 362 388 414 440 466 492
75 - 79.9 55 HO 165 220 275 302 330 357 385 412 440 467 495 522
80 - 84.9 58 116 174 232 291 320 349 378 407 436 465 494 523 552
85 - 89.9 61 122 184 245 308 337 368 398 428 459 490 520 551 582
90 - 94.9 64 129 193 257 321 354 386 418 450 482 515 547 579 611
95 - 99.9 67 135 202 270 337 371 404 438 472 506 540 573 607 640
100- 104.9 71 141 211 282 352 388 423 458 493 529 564 599 634 670
105 - 109.9 74 147 221 294 368 404 441 478 515 552 588 625 662 699

66
APPENDIX C
PHASE II DATA

67
Table 10. Phase II, Trial I uphill time-trial and SDP performance measures (May 2001).
ID# TT Time (min)
TT Speed (m/s)
SDPTTE(min)
VO2max(1/min)
VOlMAX(ml/kg/mi
n)
W m a x
(W)W M Ax/ntt,
(W/kg) WmaxZhic
(W/kg)
I 22.13 3.64 8.33 3.07 53.80 230.00 4.02 3.372 18.33 4.39 11 4.76 65.18 340.00 4.64 4.083 15.18 5.3 12.7 5.18 73.98 354.00 5.06 4.434 17.08 4.71 11.7 4.69 65.50 354.00 4.95 4.345 18.6 4.33 11 3.56 64.70 250.00 4.59 3.956 18.4 4.37 11.15 5.12 66.41 364.50 4.73 4.067 15.98 5.03 13 5.38 67.21 410.00 5.16 4.638 18.58 4.33 11.67 5.49 64.78 400.00 4.72 4.229 17.37 4.63 11 5.35 65.20 380.00 4.62 4.1210 20 4.02 11 4.96 59.80 380.00 4.58 4.0411 16.97 4.74 12 5.20 66.69 410.00 5.24 4.6512 16.65 4.83 11.17 4.23 57.21 343.00 4.65 4.15
Ave 17.94 4.53 11.31 4.57 64.21 351.29 4.75 4.17(SD) (1.86) (0.45) (1.16) (0.76) (5.19) (57.42) (0.33) (0.34)
TT Time = uphill time-trial time to completion; TT speed = average uphill time-trial speed; SDP TTE = laboratory protocol time-to-exhaustion; VO2Max = maximum oxygen consumption; Wmax = SDP maximum power output; mb = body mass (kilograms); mc = combined mass of cyclist (mb) and cycling equipment (kilograms).
Table 11. Phase II, Trial 2 uphill time-trial and SDP performance measures (July 2001).
ID# TT Time (min)
TT Speed (m/s)
SDP TTE (min)
VO2max(1/min)
V O 2MAX(ml/kg/mi
n)
W m a x
(W)WMAxZmb
(W/kg) W viAx Zmc
(W/kg)
I 21.5 3.74 9.00 3.03 55.01 250.00 4.50 3.762 18.32 4.39 12.00 4.84 65.37 360.00 4.88 4.303 14.47 5.56 13.67 5.51 80.58 382.00 5.58 4.875 17.93 4.49 12.00 3.67 67.89 270.00 5.00 4.306 18.62 4.32 10.57 5.13 66.64 347.00 4.51 3.87
7 15.6 5.16 13.58 5.21 65.11 427.50 5.31 4.788 16.7 4.82 12.33 5.23 63.83 420.00 5.14 4.589 16.05 5.01 12.00 5.51 67.89 410.00 5.06 4.5111 19.62 4.1 11 .0 0 4.99 60.87 380.00 4.62 4.0812 16.97 4.74 11.67 4.45 59.36 353.30 4.74 4.2313 15.73 5.11 12.33 5.31 66.39 397.00 4.93 4.44
Ave 17.41 4.68 11.83 4.81 65.36 363.35 4.93 4.34(SD) (2.04) (0.53) (1.32) (0.80) (6.43) (57.62) (0.33) (0.35)
TT Time = uphill time-trial time to completion; TT speed = average uphill time-trial speed; SDP TTE = laboratory protocol time-to-exhaustion; VO2max = maximum oxygen consumption; Wmax = SDP maximum power output; mb = body mass (kilograms); mc = combined mass of cyclist (mb) and cycling equipment (kilograms).

68
Table 12. Phase II, Trial 3 uphill time-trial and SDP performance measures (September 2001).
ID# TTTime(min)
TT Speed (m/s)
SDPTTE(min)
VO2MAX (1/m in)
V O 2MAX(ml/kg/mi
n)
W max(W)
WMAx/m b(W/kg) W maxZh ic
(W/kg)
I 22.13 3.64 8.33 3.07 54.84 230.00 4.11 3.432 19.95 4.04 11.40 4.47 58.09 346.70 4.52 4.003 15.1 5.33 13.00 5.34 78.59 360.00 5.27 4.604 16.77 4.8 12.08 4.81 69.71 362.50 5.25 4.596 17.48 4.6 11.17 5.01 65.11 365.00 4.72 4.067 15.92 5.06 11.90 4.58 56.58 387.00 4.76 4.299 15.63 5.15 12.00 5.73 69.87 410.00 5.02 4.4710 17.77 4.53 11.33 5.05 64.69 390.00 5.05 4.4211 17.15 4.69 12.33 5.08 64.31 396.67 5.02 4.4612 16.92 4.86 11.83 4.46 61.05 356.67 4.90 4.3613 15.95 5.05 11.78 4.91 60.21 383.50 4.71 4.24
Ave 17.34 4.70 11.56 4.77 63.91 362.55 4.85 4.26(SD) (2.06) (0.50) (1.18) (0.68) (6.92) (48.04) (0.34) (0-34)

69
APPENDIX D
JOURNAL MANUSCRIPT
(for submission to Medicine and Science in Sports and Exercise)

70
ABSTRACT
The ability to accurately quantify and predict endurance performance is imperative when
assessing the effect o f training interventions, dietary regimes, equipment modifications,
and/or altercations in athlete position or technique. Due to the invasive nature and
excessive costs o f traditional physiological and biomechanical determinants o f endurance
performance (V Ozmax, lactate threshold, etc.), performance-based determinants of
performance have received considerable attention. Purpose: To determine the ability o f
a previously validated (Heil et al., 2000) scaling-derived cycle ergometer protocol (SDP)
to track changes in uphill time-trial (TT) cycling performance. Methods: Local
competitive cyclists participated in either two (n = 6) or three (n = 7) testing periods
separated by a minimum o f ten weeks (May, July, September 2001). Each testing period
consisted o f an outdoor uphill TT (5-km, 8% grade) followed within ten days by a
laboratory-based SDP. Longitudinal inter-trial changes in average TT speed (m/s) were
compared with longitudinal inter-trial changes in SDP time-to-exhaustion (TTE, min) and
relative SDP maximal power output (WMax, wattskg"1). Results: Very high correlations
were observed between inter-trial changes in average TT speed and relative Wmax (r =
0.70-0.94). Correlations between inter-trial changes in average TT speed and TTE were
generally lower and more variable (r = 0.26-0.87). Conclusions: These results suggest
that changes in relative SDP Wmax can validly and practically track changes in uphill TT
performance. These results should be o f benefit to cyclists, coaches, and sport scientists
as they attempt to maximize endurance performance. This should ultimately lead to more
effective cycling and youth talent identification programs for cycling.

71
Introduction
The sport o f professional cycling is more competitive now than ever. Financial
stakes are higher, race profiles are more demanding, and the difference between w inning
and losing is often decided by the smallest o f margins. As a result, today’s top cyclists
and coaches are embracing a more scientific approach towards racing and training,
including the regular use o f laboratory-based performance testing.
According to MacDougall, Wenger, and Green (1991), performance testing o f
athletes serves a number o f important functions: I) it indicates the athlete’s strengths and
weaknesses, providing baseline data for individual training prescriptions; 2) it provides
valuable feedback, allowing one to assess the effectiveness o f a particular training
program, diet, or piece o f equipment; 3) it provides information regarding the health
status o f the athlete; 4) it is an educational process by which the athlete learns to better
understand his or her body and the demands o f the sport. As such, legitimate
performance tests must be reliable, valid, and sensitive to small changes in an athlete’s
fitness level (Balmer, Davison, and Bird, 2000). Ideally, performance tests should also
be affordable, available to the general public, and easy to administer.
The classical and most common endurance performance test employs a
continuous submaximal workload (60-90% o f V Ozmax) until volitional exhaustion
(Jeukendrup et a l, 1996). Despite reasonable correlations between time-to-exhaustion
(TTE) and actual endurance performance (Acevedo and Goldfarb, 1989; Billat et al.,
1988; Burnham et al., 1995; Coggan and Coyle, 1987; Coyle et al., 1988; Hickson et al.,

72
'1988), the test-retest reliability o f such protocols is suspect (Jeukendrup et ah, 1996;
Krebs and Powers, 1989; McLellan et al., 1995). For instance, Krebs and Powers (1989)
and McLellan et al. (1995) independently determined coefficients o f variation (CV)
ranging from 2.8% to 55.9% in untrained subjects cycling to fatigue at 80% V 0 2max,
indicating the poor reliability o f submaximal tests to exhaustion.
Performance protocols in which athletes are asked to complete a fixed amount o f
work or distance in the shortest possible time are more reliable than protocols o f
indeterminate length (Bishop, 1997; Hickey et al., 1992; Jeukendrup et al., 1996; Palmer
et al., 1995; Schabort et al., 1996), as well as more valid. In a study o f elite male cyclists,
Coyle et al. (1991) reported a correlation o f r = 0.93 between time to completion (TTC)
o f a 40-km laboratory time-trial and actual 40-km time-trial performance. Likewise,
Palmer et al. (1995) reported a correlation o f r = 0.98 between TTC o f 20-km and 40-km
laboratory time-trials and actual road racing performance.
Remarkably, when fixed duration/workload protocols are quantified in terms of
power output (instead o f time to completion), correlations with cycling performance grow
stronger. For instance. Palmer et al. (1996), observed a correlation o f -0.999 between
average power output (in watts, W) and both 20-km and 40-km cycling time-trial
performance. Similarly, Balmer et al. (2000) reported a strong correlation (r = -0.99, P<
0.001) between peak power output (W) and 16.1-km time-trial performance.
To their detriment, however, fixed duration/workload protocols are inherently
time-consuming. For example, a 40-km time-trial requires approximately 50 minutes to
complete for an elite cyclist and up to 90 minutes to complete for a sub-elite cyclist.

73
Therefore, the use o f fixed duration/workload protocols to accurately predict and/or track
changes in actual cycling performance is both questionable and undesirable.
In an attempt to improve upon the reliability, validity, and practicality o f previous
cycling performance protocols, Heil et al. (2000) introduced the Scaling Derived Protocol
(SDP). Utilizing principles o f allometrics, the SDP was designed as an incremental test
to volitional exhaustion based on the energy demand o f uphill cycling as influenced by
body mass. Preliminary results indicate SDP time-to-exhaustion (TTE, min) correlates
extremely well with actual uphill time-trial performance (r = 0.97 to 0.98), as does
relative peak power output (W/kg; r = 0.92 to 0.97). The SDP is easy to administer, less
time-consuming than previous protocols (average TTE <15 min), and requires only
minimal (and affordable) equipment. Also, the design o f the SDP conveniently allows it
to double as a V 0 2max test for cyclists when appropriate.
Given the high validity and sound theoretical basis o f the SDP, the purpose o f the
present study was to determine the ability o f the SDP to accurately predict and/or track
changes in actual endurance cycling performance. Such a protocol would be o f
considerable value to cyclists and coaches as they attempt to maximize cycling
performance. Also, the practicality and relative affordability o f the SDP could ultimately
lead to more effective training and youth talent identification programs for cycling.
Therefore, the purpose o f the present study was to determine the ability o f the SDP to
predict and/or track changes in uphill time-trial cycling performance.

74
Methods
Subjects. Eighteen cyclists from Montana State University and the local
Bozeman community volunteered participation for the study. All subjects were informed
o f the nature o f the investigation and written consent was obtained in accordance with the
guidelines set forth by the Montana State University Human Subjects Committee. Three
subjects resigned from the study due to schedule conflicts or lack o f motivation; two
more cyclists moved away from the area prior to completion o f the study. Physical
characteristics and cycling experience o f the remaining subjects (n = 13) are presented in
Table I . In order to determine the ability o f the SDP to predict and track uphill time-trial
performance over time, each subject participated in at least two o f three matched field
and laboratory tests.
cINSERT TABLE 1>
Field Testing. The uphill time-trial course was located at the entrance to the
Lewis and Clark Caverns State Park, approximately 50 miles west o f Bozeman. The
course was 3.0 miles long, with an average gradient o f 8%. Starting elevation was 1301
meters (4,270 feet) above sea level, and ending (maximum) elevation was 1618 meters
(5307 feet) above sea level. Subjects were provided with a standing start (bicycle and
rider supported by the primary investigator). A minimum of four digital handheld
stopwatches were synchronized prior to each time-trial; two stopwatches were

75
transported to the top o f the course to record finishing time and two stopwatches
remained at the bottom for starting purposes. Time-trial performance was recorded to the
nearest second. Average time-trial speed was calculated by dividing the performance
time by the total time-trial distance (5.0 km). Each uphill time-trial was separated by
exactly ten weeks (May 10th, July 19th, September 27th, 2001).
Scaling Derived Protocol (SDP). Each uphill time-trial was followed within ten
days by a laboratory-based SDP (a minimum o f 48 hours separated the field and
laboratory tests). Upon arrival at the laboratory, bicycle rear tire pressure was
standardized at 100 p.s.i. using a track pump with tire gauge (Specialized, USA). Each
subject’s bicycle was fitted to a Computrainer™ stationary trainer (Computrainer™ Pro,
Model 8001, Racermate Inc., Seattle WA., USA) and calibrated according to the
manufacturer’s recommended procedure (see Instrumentation). Subject age was recorded
to the nearest year, subject height (barefoot) was measured to the nearest centimeter, and
subject mass (with cycling clothes, minus shoes) was measured to the nearest 0.25
kilogram. Once anthropometric measurements were complete, subjects were permitted a
subjectively adequate warm-up period (10-30 minutes).
The power output (in watts, W) for each stage o f the SDP was based on research
previously conducted in this laboratory. In brief review, Heil (1998) determined that the
external power demand (Wd) o f uphill cycling scales with body mass (Mb) to the +0.89
power (e.g. Wd <* Mb0"89). Thus, the relative energetic cost o f uphill cycling at a given
speed and grade is less for heavier cyclists than for lighter cyclists. Assuming that the net
external power demand o f uphill cycling is equivalent to a cyclist’s metabolic power

76
supply (Hell, 1998), Heil et al. (2000) modified the standard formula for power (Power =
[average acceleration * mass] * average speed) to reflect the scaling relationship between
body mass and uphill power demand:
Power = [g *Mb0"89 * sinO)] * s
where “g” is the constant o f gravitational acceleration (9i81 m/s/s), “0” is the average
inclination angle o f the road surface, and “s” is the average forward ground speed o f the
cyclist.
Using this equation, the power required for each cyclist to ride up a 5° slope (0) at
6.72 m/s (s) was calculated and designated as Stage 5 o f the SDP. Stage I o f the SDP
was then calculated as 20% o f the Stage 5 power output value, Stage 2 as 40%, Stage 3 as
60%, Stage 4 as 80%, Stage 5 as 100%, and each stage thereafter increased by 10% (see
Appendix B for a complete outline o f the first 14 stages for subjects weighing 40-100
kg). Due to wattage limitations imposed by the Computrainer™, it was necessary to
approximate SDP power output to the nearest ±10 W. End measures o f the SDP included
time-to-exhaustion (TIE, min), absolute maximum power output (WMax, W kg'1),
maximum power output relative to body mass (WMAx/nib), maximum power output
relative to combined body/equipment mass (WMAx/nic), and maximum oxygen uptake (V
O2MAX, ml/kg/min).
SDP Subject Procedure. The subjects were allowed to select their own pedal
cadence throughout the first five stages o f the protocol, with the stipulation that their
chosen pedal cadence be held constant (+ 2 rpm) within a given stage. When the subjects

77
reached Stage 6, however, the investigator fixed the cadence for the remainder of the test
based upon the observed cadence at that moment. The subjects remained seated during
the entire protocol and were verbally encouraged to continue until volitional exhaustion,
or until the investigator noted a drop in cadence o f > 5 RPM for > 5 seconds. Time to
completion (e. g. time-to-exhaustion) o f the SDP test was recorded to the nearest second.
Maximal power output (Wmax) and maximal oxygen uptake (V O2Max) were also
determined during the SDP test. Wmax was defined as the power output corresponding to
the final completed stage o f the SDP, plus a fraction o f the power output maintained in
the final incomplete stage (Kuipers et al., 1985):
Wmax ; (Wcom + 1/60) * AW
where Wcom is the power output o f the final completed SDP stage, t is the amount o f time
(sec) completed in the final uncompleted stage, and AW is the power output o f the final
incomplete stage. Maximum oxygen consumption was calculated as the average of the
three highest consecutive VO2 measures during the SDP. The measurement o f V O2MAx
was considered successful if two o f the following three criteria were met: I) A maximal
heart rate within 10 beats o f each subject’s age predicted maximum heart rate (e.g. 220-
age); 2) A maximum respiratory exchange ratio o f > 1.10 before the last successful V O2
measurement; 3) A plateau o f VO2 evidenced by a change < 2.1 ml/kg/min with an
increase in power output.

78
Instrumentation
Scaling Derived Protocol (SDP). For the laboratory-based SDP, each subject’s
bicycle was fitted to a Computrainer™ stationary trainer (Computrainer™ Pro, Model
8001, Racermate Inc., Seattle WA., USA) that supported the mass o f the bicycle and rider
at the rear wheel axle. An adjustable roller unit was used to apply resistance to the rear
wheel. The resistance applied to the roller unit was, in turn, controlled by an
electromagnetic “load generator” via a handlebar-mounted keypad.. Real-time measures
o f power output (W) at the rear wheel, along with pedal cadence recorded by a crank arm
sensor, were displayed on the keypad.
The following steps were required to calibrate the Computrainer™ in accordance
with the guidelines established by the manufacturer: I) adjust the trainer stand to fit each
bicycle, 2) clean the rear tire o f dust and debris, 3) warm-up the rear tire for several
minutes, and 4) perform a “roll down calibration”. The “roll down calibration” estimates
the rolling resistance between the rear tire and the adjustable roller (which can vary
depending on tire pressure, tire temperature, and the amount o f pressure between the tire
and roller) so that the total resistance applied to the rear wheel is as accurate as possible.
The resistance applied to the rear wheel is independent o f pedal cadence.
Oxygen Consumption. Oxygen consumption for each SDP protocol was
measured by standard open-circuit spirometry using a two-way breathing valve. A
SensorMedics 2900 metabolic cart (SensorMedics Corporation, Yorba Linda, CA., USA)
was used to continuously monitor expired gases; V O2 was calculated over 20-second

intervals. Prior to testing, the gas analyzers were calibrated with primary gas standards o f
known concentrations (26% O2, N2 balance; 4% CO2, 16% O2, N2 balance), and the
SensorMedics ’ ventilatory measures were confirmed with a calibrated 3-liter syringe
(Model D, SensqrMedics Corporation, Yorba Linda, CA., USA). AU information was
processed via an IBM computer using ProTrac software (SensoMedics Corporation,
YorbaLinda, CA., USA).
Heart Rate. Heart rate data during each test were measured with a Polar Accurex
Plus telemetry-based heart rate monitor (Polar Electro Inc., Woodbury, NY., USA).
Heart rate was averaged every five seconds and downloaded to an adjacent computer via
the serial port interface provided by the manufacturer. Maximal heart rate was
determined as the highest five-second average heart rate during the SDP test.
Statistical Analysis
Multiple Pearson product-moment correlation coefficients (r) were used to
determine the relationship between changes in SDP performance and uphill time-trial
performance. Changes were calculated between Trials 1-2, 2-3, 1-3 for all dependent
variables. Phase II statistical analyses were performed using Statistica™ computer
software (version 5.5, StatSoft, Inc., Tulsa, OK). The level o f significance was preset at
a = 0.05 for all tests. Phase I and II.
79

8 0
Results
A minimum o f eleven subjects took part in each matched uphill time-trial and
laboratory-based SDP (May, July, and September 2001). Relevant performance results
are presented in Table 2. Eight subjects managed to complete all three testing bouts; the
remainder o f subjects (n = 3) completed at least two matched testing trials. Table 3
provides a list o f relevant environmental conditions encountered during each uphill time-
trial.
CINSERT TABLE 2, TABLE 3>
The correlations between average time-trial speed and SDP time-to-exhaustion
were very high for all trials (r = 0.85 to 0.90), as were the correlations between average
time-trial speed and Wmax/hIc (r = 0.83 to 0.92). Significant correlations were also
observed between average time-trial speed and WMAx/fUb (r = 0.75 to 0.90) and relative V
O2MAx (r = 0.63 to 0.73). Table 4 contains zero-order correlations between matched
uphill time-trial and SDP performance measurements.
CINSERT TABLE 4>
The correlation between average time-trial speed and SDP time-to-exhaustion
varied from r = 0.26 to 0.87, but the correlation between average time-trial speed and

81
Wmax/hic was consistently high (r = 0.71 to 0.90), as was the correlation between average
time-trial speed and W maxZhic (r = 0.70 to 0.90). Tables 5 contains zero-order
correlations among inter-trial changes in uphill time-trial and SDP performance variables
(Trials 1-2, 2-3,1-3, 1-2-3, respectively). Scatterplots depicting the relationships
between inter-trial change in average time-trial speed and WwAxZmc are provided in
Figures 1-4.
<INSERT TABLE 5>
<INSERT FIGURE I, FIGURE 2, FIGURE 3, FIGURE 4>
Discussion
This study demonstrated that a laboratory-based cycling protocol can be used to
predict andZor track changes in uphill time-trial performance. In support o f Heil et al.
(2000), SDP TTE and WwAxZmc were highly correlated (r = 0.85 to 0.90 and r = 0.83 to
0.92) with average uphill time-trial speed for all three testing periods (May, July, and
September 2001), as were moderate correlations for WwAxZmj, (r = 0.75 to 0.90) and
relative VO2MAx (r = 0.63 to 0.73). Once again, these values compare favorably with
those previously reported in the literature (Balmer et al.,2000; Bishop et al., 1998;
Hawley and Noakes, 1992; Lindsay et al., 1996; Schabort et al., 2000).

82
However, the primary purpose o f the present study was to determine the ability o f
the SDP to track changes in uphill time-trial performance. Change-score correlations
between average time-trial speed and WMAx/mb and Wmax/hIc were significant for all
three testing periods (r = 0.70-0.90 and r = 0.71-0.90, respectively), explaining 50% to
80% o f the variance o f inter-trial changes in average time-trial speed. Notably, change-
score correlations associated with Trial I uphill time-trial data (Trial 1-2, 1-3) were
consistently lower than change-score correlations associated with Trials 2-3. This is
likely due to the fact that several o f the subjects rode the Trial I uphill time-trial “blind”
(with no prior reconnaissance), resulting in inter-trial learning effects. Also, Trial 3
environmental conditions (wind speed in particular) likely had an affect on change-score
correlations for Trials 1-3. Despite these circumstances, however, correlations for
change-scores between Trials 1-2 and 1-3 were still relatively favorable, (though not as
high as correlations for change-scores between Trials 2-3). Furthermore, absolute and
relative measures o f Wmax were sensitive to both positive and negative changes
(increases and decreases) in average uphill time-trial speed, as depicted in Figures 3-6.
In contrast, Lindsay et al. (1996) failed to note significant change-score
correlations between WwAxZmb and flat 40-km time-trial performance before and after a
four-week period o f high-intensity interval training (despite significant improvements in
both dependent variables). The reason for these results is likely due to the design o f the
incremental test employed by Lindsay and coworkers. The protocol commenced at a
work rate equivalent to 3.33 WZkg body mass (mb) for 150 seconds, then increased by 50
W for another 150 seconds. Following stage two, the exercise intensity was increased by

83
25 W every 150 seconds until volitional exhaustion - regardless o f body mass and/or the
theoretical energy demands o f flat 40-km time-trial cycling.
Whereas the SDP was specifically designed to simulate the external power
demand (Wd) o f uphill cycling as influenced by body mass (e.g. Wd = Mb0"89, Heil,
1998), the protocol used by Lindsay et al. failed to accurately simulate the power demand
o f flat 40-km cycling (Wd « Mb0"32; Swain, 1994). It is not surprising, therefore, that
changes in PPO failed to correlate with changes in 40-km time-trial performance.
Despite the high correlations observed in the present study between changes in
SDP Wmax and average time-trial speed, correlations between changes in SDP time-to-
exhaustion and average time-trial speed were low to moderate (r = 0.26 to .87),
explaining only 7% to 75% o f the inter-trial variance. This discrepancy between two
seemingly analogous measures o f SDP performance can be explained by taking a closer
look at the theoretical and structural design o f the SDP.
The SDP was primarily designed to simulate the energy demand o f uphill cycling
as influenced by body mass. Stage 5 o f the SDP is accordingly designated as the
estimated power demand required for a person o f a given body mass to propel a bicycle
up a 8.7% (5°) incline at 6.72 m/s (15 MPH). This particular speed and grade were
chosen to approximate a sub-lactate threshold power output in moderately trained
collegiate cyclists (Heil et al, 2000).
At this point it is important to recognize a secondary purpose o f the SDP: to serve
as a valid and reliable V Ozmax test for cyclists when appropriate. As such, the remaining
SDP stages were designed to fit within the eight to twelve minute time period considered

84
ideal for the determination o f maximal cardiopulmonary capacity (Buchfuhrer et al.,
1983). Stage I was arbitrarily calculated as 20% o f the Stage 5 value. Stage 2 as 40%,
Stage 3 as 60%, etc. Stages 6 and above increase by 10% increments o f Stage 5.
Therefore, it is easy to understand why TTE is not as sensitive to changes in
uphill time-trial performance as Wmax/iUc. Whereas WMAx/mc is theoretically derived to
correlate highly with uphill time-trial performance, TTE is bound by the time limitations
for the proper assessment o f V Oimax- Though unconfirmed, this trait is likely inherent to
all PPO protocols designed with the secondary purpose to assess V 02max; measures o f
Wmax will always correlate more strongly with performance than measures o f TTE or
TTC. A second factor potentially responsible for the low to moderate change-score
correlations associated with TTE is the relatively lower reliability o f TTE (when
compared to Wmax, Phase I).
There are several benefits o f modeling the SDP after an uphill time-trial as
opposed to a flat time-trial. In addition to significantly simplifying the underlying
calculations o f contributing factors to the overall energy demand o f cycling (see Heil et
al., 2000, Appendix), an uphill time-trial simulation may also be more relevant and valid
for the prediction o f overall professional cycling success.
Hills determine the outcome o f a road race more than any other element. It is a
basic function o f time: even on circuit courses containing equal-length segments o f
positive and negative elevation gain, cyclists’ overall time will be greater on the uphills
(Kyle, 1988; Swain, 1997). Though larger cyclists may descend faster than smaller,
climbing-proficient cyclists, they cannot make up the time lost going uphill (Swain,
85
1994). Additionally, the relative power-to-drag advantage o f large cyclists on the flats
(Swain, 1994) is effectively negated by the ability o f smaller cyclists to remain tucked
within the sheltering draft o f the peloton (thus reducing their air resistance by as much as
40%, (McCole et al., 1990)). And once the road begins to climb again, the increased
grade and slower speeds play conveniently to the talents o f climbers. For these reasons,
victors o f the predominantly hilly grand tours (Tour de France, Giro dltalia, and the
Vuelta a Espana) tend to be smaller, climbing-proficient cyclists (Swain, 1994).
Consequently, a laboratory protocol capable o f predicting and/or tracking changes in
uphill time-trial performance may also predict cycling success on a higher level.

86
Table I. Subject Characteristics, Phase II (n = 13). Repeated measures reported as x ± SD.Subject
ID#Trials
Completed Gender Age(yrs)
Body Mass (kg)
Height(m)
CompetitionLevel*
I 1,2,3 F 29 56.3 (0.9) 1.60 22 1,2 F 27 54.3 (0.4) 1.63 23 1,2,3 M 29 74.5 (1.9) 1.65 24 1,2,3 M 29 69.0(1.0) 1.75 I5 1,3 M 24 70.3 (1.8) 1.76 36 1,2,3 M 48 77.0 (0.1) 1.78 37 1,2 M 29 80.0 (0.7) 1.89 I8 1,2 M 37 83.3 (2.1) 1.78 I9 1,2,3 M 44 81.8(0.6) 1.85 I10 1,2,3 M 24 81.0 (2.8) 1.78 311 1,3 M 33 78.8 (0.5) 1.88 I12 1,2,3 M 53 73.8 (0.9) 1.78 I13 2,3 M 36 81.0 (0.7) 1.88 I
Ave (SD) 34 (9.2) 73.8 (9.3) 1.77 (0.09)♦Competition Level is reflective of the classification systems used by the United States Cycling Federation (USCF) and the National Collegiate Cycling Association (NCCA): I = USCF Category 1-2 and/or NCCA Category A; 2 = USCF Category 3 and/or NCCA Category B; 3 = USCF Category 4 and/or NCCA C D.
Table 2. Phase II uphill time-trial and laboratory-based SDP results for all subjects. All ________ values reported Mean ± SD (Range).
Trial I (n=12)
Trial 2 (n=l I)
Trial 3 (n = lI)
I TT Speed (m/s)4.5 ± 0.5 (3.6-5.3)
4.7 ± 0.5 (3.7-5.6)
4.7 ± 0.5 (3.6-5.3)
2 SDP TTE (min)11.3 ± 1.2 (8.3-13.0)
11.8 ± 1.3 (9.0-13.7)
11.6 ± 1.2 (8.3-13.0)
3 Absolute VO2MAX (Fmin)4.75 ± 0.8 (3.1-5.5)
4.8 ± 0.8 (3.0-5.5)
4.8 ± 0.7 (3.I-5.7)
4 Relative VO2Max (mFkg/min)64.2 ± 5.19 (53.8-74.0)
65.4 ± 6.4 (55.0-80.6)
63.9 ± 6.9 (54.8-78.6)
5 Wmax (W)351.3 ± 57.4
(230-410)363.3 ± 57.6
(250-428)362.6 ± 48.0
(230-410)
6 WMAxZmb (W/kg)4.8 ± 0.3 (4.0-5.2)
4.9 ± 0.3 (4.5-5.6)
4.9 ± 0.3 (4.1-5.3)
7 WMAxZmc (W/kg)4.2 ± 0.3 (3.4-4.7)
4.3 ± 0.4 (3.8-4.9)
4.3 ± 0.3 (3.4-4.6)
TTT Speed = average uphill time-trial speed; SDP TTE = laboratory protocol time-to-exhaustion; V O 2maX = maximum oxygen consumption; Wmax = SDP maximum power output; n^ = body mass (kilograms); mc — combined mass of cyclist (mb) and cycling equipment (kilograms).

87
Table 3. Air temperature, relative humidity, and wind ranges encountered during the three________ uphill time-trials.__________________________________________________ _____
Air Relative Wind Speed Ranges______________ Temperature_______ Humidity__________ Minimum_________ Maximum
Time-trial #1 68° F 31.0% 0-4 MPH 7-15 MPH
Time-trial #2 75° F 26.0% 0-6 MPH 10-14 MPH
Time-trial #3 72° F 12.5% 0-5 MPH 15-20 MPH
Minimum wind speeds were encountered during the first sheltered two-thirds of the time trial course. Maximum wind speeds were encountered at the more exposed summit-finish of the time-trial course.
Table 4. Correlations between average TT speed (m/s) and SDP performance variables.Trial I Trial 2 Trial 3
I SDP TTE (min) 0.86' 0.90* 0.85*
2 Absolute VO2MAx (Vmin) 0.55 0.70* 0.80*
3 Relative VO2Max (ml/kg/min) 0.73* 0.75* 0.63*
4 Wmax (W) 0.53 0.68* 0.76*
5 WMAx/mb (W/kg) 0.75* 0.90* 0.77*
6 WMAxZmc (W/kg) 0.84* 0.92* 0.83*•Values differ significantly from zero, A D .05. TTE = laboratory protocol time-to-exhaustion; VOjmax = maximum oxygen consumption; Wmax = SDP maximum power output; mb = body mass (kilograms); mc = combined mass of cyclist (mb) and cycling equipment (kilograms).
Table 5. Correlations between inter-trial changes in average TT speed (m/s) and SDPperformance variables.
Trials 1-2 Trials 2-3 Trials 1-3 Trials 1-2-3
I SDP TTE (min) 0.57 0.87* 0.26 0.54*
2 Absolute VO2Max (Vmin) 0.23 0.56 0.60 0.54*
3 Relative VO2MAx (ml/kg/min)
0.47 0.72* 0.66 0.67*
4 Wmax (W) 0.70* 0.85* 0.48 0.63*
5 WMAxZmb (W/kg) 0.73* 0.90* 0.71* 0.75*
6 WMAxZmc (W/kg) 0.74* 0.90* 0.70* 0.75*•Values differ significantly from zero, PO.OS. TTE = laboratory protocol time-to-exhaustion; VO2max = maximum oxygen consumption; Wmax = SDP maximum power output; mb = body mass (kilograms); mc = combined mass of cyclist (mb) and cycling equipment (kilograms).

88
H 0.2
i> 0.1
< 0.0
5 - 0.1
-0.3 -0.2 -0.1 0.0 0.1 0.2 0.3 0.4 0.5
Change in SDP W MAx/mcfW/kg)
Figure 3. Scatterplot depicts the relationship between Trial I and Trial 2 changes (T2-T1) in uphill average time-trial speed (m/s)and WmAxZmc (W/kg). Solid line is least-squares derived linear regression: speed (m/s) = 0.001 + 0.522 x WmaxZhic (W/kg), r2 = 0.55.
i 0.4
V 0.2
i o.o
Change in SDP WMAxZmc(WZkg)
Figure 4. Scatterplot depicts the relationship between Trial 2 and Trial 3 changes (T3-T2) in uphill average time-trial speed (mZs)and W maxZhic (W/kg). Solid line is least-squares derived linear regression: speed (m/s) = 0.066 + 0.928 x W maxZhic (W/kg), r2 = 0.81.

89
-0.2 -0.1 0.0 0.1 0.2 0.3 0.4
Change in SDP W maxZh ic (W /kg)
Figure 5. Scatterplot depicts the relationship between Trial I and Trial 3 changes (T3-T1) in uphill average time-trial speed (mZs)and Wmax/hIc (W/kg). Solid line is least-squares derived linear regression: speed (m/s) = 0.066 + 0.928 x Wmax/hic (W/kg), r2 = 0.81.
" 0.0
-0.4 -0.3 -0.2 -0.1 0.0 0.1 0.2 0.3 0.4 0.5
Change in SDP WMAx/mc(W /kg)
Figure 5. Scatterplot depicts relationship between changes for all trials (1-2, 2-3, 1-3) in uphill average time-trial speed (m/s) and W max (W/kg). Solid line is least-squares derived linear regression: speed (m/s) = 0.005 + 0.727 x Wmax/hIc (W/kg), r2 = 0.56.

MONTANA STATE UNIVERSITY - BOZEMAN