Embed Size (px)
Citation preview

Healthcare Global Enterprises (HCG)
1
Loremipsumdolorsitamet, consectetueradipiscingelit, seddiamnonummynibheuismodtinciduntutlaoreetdolore magna aliquameratvolutpat. Utwisienim ad minim veniam, quisnostrudexercitationullamcorpersuscipitlobortisnislutaliquip ex eacommodoconsequat.Duisautemveleumiriure dolor in hendrerit in vulputatevelitessemolestieconsequat, velillumdoloreeufeugiatnulla
Loremipsumdolorsitamet, consectetueradipiscingelit,
seddiamnonummynibheuismodtinciduntutlaoreetdolore magna aliquameratvolutpat. Utwisienim ad minim veniam,
quisnostrudexercitationullamcorpersuscipitlobortisnislutaliquip ex eacommodoconsequat. Duisautemveleumiriure dolor in hendrerit in vulputatevelitessemolestieconsequat,
velillumdoloreeufeugiatnullafacilisis at veroeros et accumsan et iustoodiodignissim qui blanditpraesentluptatumzzrildelenitaugueduisdoloretefeugaitnullafacilisi. et iustoodiodignissim qui
Initiating Coverage
Healthcare Global Enterprises
14 December-2020

Healthcare Global Enterprises (HCG)
2
Industry LTP Recommendation Base Case Fair Value Bull Case Fair Value Time Horizon
Healthcare Rs 158.65 Buy in the Rs.155-161 band and add on dips to Rs 136-140 band Rs 180 Rs 198 2 quarters
Our Take Healthcare Global Enterprises (HCG) is the largest provider of cancer care in India under the “HCG” brand. It owns and operates comprehensive cancer diagnosis and treatment services (through radiation therapy, medical oncology and surgery). Aggressive expansion in the last few years and cap on cancer drug margins have hit financials (lower margins/RoCE, high debt) and stock price has corrected around 50% from its all-time high. Having doubled bed capacity over the last five years, we expect HCG’s capex phase to ease from FY21. Only two new centers to be opened in the next 12 months and that will keep capital expenditure in check. Large part of bed expansion is done and we expect incremental losses to be offset by earlier hospitals turning positive. The long term story in private healthcare remains exciting, due to low penetration in the country and favourable change in demographics. For the near term, we remain positive on hospitals in the listed healthcare space on the back of strong traction in organized healthcare space, medical insurance, better occupancy, improving balance sheet and operating margin. In FY20, HCG launched oncology services in Bhavnagar, which has led to significant improvements in profitability. Further, multi-specialty center in Rajkot achieved break-even EBITDA in Q3FY20. In the past 36 months, HCG launched 7 new cancer care facilities across the country, reaching out to more cancer patients across metros as well as Tier-I & Tier-II cities. The pressure on margins and RoCE due to losses in new hospitals, regulatory challenges and higher debt have led to the stock trading at a significant discount to its historical highs but we believe this should reverse as the business turns around. Its investment in other businesses such as Strand Lifesciences (Bioinformatics) also dragged down overall return ratios. We believe, valuations are factoring in most of the negatives and see meaningful re-rating once operating leverage benefits play out. View & Valuation HCG, with its integrated, one-stop-solution and focused model, is well poised to capture the growing potential with a pan-India focus. Equity infusion by CVC Capital is positive and removes a major overhang of high leverage. Moderation in capex and improvement in return ratios are triggers which may lead to re-rating for the stock, we expect profitability to improve from FY22.
HDFC Scrip Code HEAGLOEQNR
BSE Code 539787
NSE Code HCG
Bloomberg Code HCG: IN
CMP Dec 11, 2020 158.65
Equity Capital (Rs cr) 125.26
Face Value (Rs) 10
Equity Share O/S (cr) 12.53
Market Cap (Rs cr) 1987
Book Value (Rs) 43
Avg. 52 Wk Volumes 313148
52 Week High 160.85
52 Week Low 62.05
Share holding Pattern % (Sep, 2020)
Promoters 66.9
Institutions 18.6
Non Institutions 14.5
Total 100.0
Fundamental Research Analyst Kushal Rughani [email protected]

Healthcare Global Enterprises (HCG)
3
In the near term, profitability is likely to remain muted, due to lower occupancy, led by the lockdown and also some of new centers are in the ramp-up phase. We forecast 10% revenue and 15% EBITDA CAGR and 500bps RoCE expansion over FY20-23E. We believe the stock discounts most of the negatives at 12.7x FY22E EV/EBITDA and successful execution could drive earnings growth and significant re-rating. We feel investors can buy HCG at the LTP and add on dips to Rs 136-140 band (11.2x FY22E EV/EBITDA) for base case target of Rs 180 (14.5x FY22E EV/EBITDA) and bull case target of 198 (15.8x FY22E EV/EBITDA) over the next two quarters.
Financial Summary
Particulars (Rs cr) Q2 FY21 Q2 FY20 YoY (%) Q1 FY21 QoQ (%) FY19 FY20 FY21E FY22E FY23E
Total Revenues 248 279 -11.1 193.5 28.2 979 1,096 1,052 1,277 1,434
EBITDA 30 46 -34.2 19 54.6 125 172 144 220 259
Depreciation 40 35 14.5 39 0.5 85 148 161 174 185
Other Income 5 -3 -232.4 1 350.0 7 7 9 10 12
Interest Cost 27 35 -21.4 37.4 -27.3 70 138 115 97 91
Tax 5 2 211.8 11 -51.8 -3 6 -25 -5 -3
APAT -22 -22 0.5 -39.8 -44.0 -25 -107 -94 -26 14
EPS (Rs) -2.8 -12.0 -7.5 -2.1 1.2
RoE (%) -5.0 -24.8 -16.2 -3.4 2.0
P/E (x) -56 -13.2 -21 -77 137
EV/EBITDA 21.5 15.6 18.7 12.7 10.4 (Source: Company, HDFC sec)
Q2 FY21 result highlights Consolidated revenues declined 11% yoy primarily due to the lockdown impact. However, decent recovery has been observed on a sequential basis. Hospital business revenue declined 9% yoy and Milann (infertility) revenues were down 41% yoy. Karnataka cluster declined 12.8%. Gujarat cluster revenue fell 9.3%. However, occupancies have improved materially on qoq basis to 41.4% vs. 32.4% and we expect the performance to gradually improve in the coming quarters with strong growth from Q4FY21 onwards. We believe Gujarat and Maharashtra clusters would be the key growth drivers over FY20-23E. Maharashtra and East India cluster witnessed positive growth of 11% yoy and 2.5% yoy respectively.
Healthcare Global Enterprises (HCG)
4
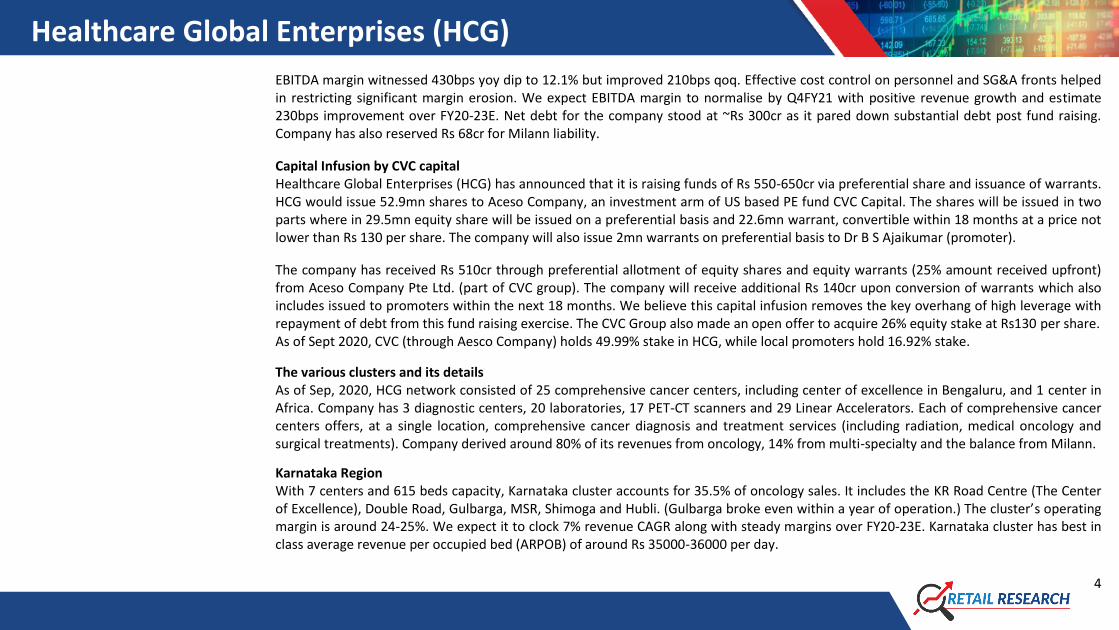
EBITDA margin witnessed 430bps yoy dip to 12.1% but improved 210bps qoq. Effective cost control on personnel and SG&A fronts helped in restricting significant margin erosion. We expect EBITDA margin to normalise by Q4FY21 with positive revenue growth and estimate 230bps improvement over FY20-23E. Net debt for the company stood at ~Rs 300cr as it pared down substantial debt post fund raising. Company has also reserved Rs 68cr for Milann liability.
Capital Infusion by CVC capital Healthcare Global Enterprises (HCG) has announced that it is raising funds of Rs 550-650cr via preferential share and issuance of warrants. HCG would issue 52.9mn shares to Aceso Company, an investment arm of US based PE fund CVC Capital. The shares will be issued in two parts where in 29.5mn equity share will be issued on a preferential basis and 22.6mn warrant, convertible within 18 months at a price not lower than Rs 130 per share. The company will also issue 2mn warrants on preferential basis to Dr B S Ajaikumar (promoter).
The company has received Rs 510cr through preferential allotment of equity shares and equity warrants (25% amount received upfront) from Aceso Company Pte Ltd. (part of CVC group). The company will receive additional Rs 140cr upon conversion of warrants which also includes issued to promoters within the next 18 months. We believe this capital infusion removes the key overhang of high leverage with repayment of debt from this fund raising exercise. The CVC Group also made an open offer to acquire 26% equity stake at Rs130 per share. As of Sept 2020, CVC (through Aesco Company) holds 49.99% stake in HCG, while local promoters hold 16.92% stake.
The various clusters and its details As of Sep, 2020, HCG network consisted of 25 comprehensive cancer centers, including center of excellence in Bengaluru, and 1 center in Africa. Company has 3 diagnostic centers, 20 laboratories, 17 PET-CT scanners and 29 Linear Accelerators. Each of comprehensive cancer centers offers, at a single location, comprehensive cancer diagnosis and treatment services (including radiation, medical oncology and surgical treatments). Company derived around 80% of its revenues from oncology, 14% from multi-specialty and the balance from Milann.
Karnataka Region With 7 centers and 615 beds capacity, Karnataka cluster accounts for 35.5% of oncology sales. It includes the KR Road Centre (The Center of Excellence), Double Road, Gulbarga, MSR, Shimoga and Hubli. (Gulbarga broke even within a year of operation.) The cluster’s operating margin is around 24-25%. We expect it to clock 7% revenue CAGR along with steady margins over FY20-23E. Karnataka cluster has best in class average revenue per occupied bed (ARPOB) of around Rs 35000-36000 per day.

Healthcare Global Enterprises (HCG)
5
Established in 2006, the KR Road Center at Bengaluru is the Centre of Excellence. It utilises the latest technology in oncology such as LINACs, tomotherapy radiology, PET-CT scanners, daVinci robotic surgery systems, etc. Gujarat Cluster This cluster has five centers with 508 beds, accounting for 30% of oncology revenue, and clocked 18% revenue CAGR over FY17-20. The company introduced tomotherapy at its Ahmedabad center, the first of its kind in Gujarat. Tomotherapy combines an advanced form of intensity modulated radiation therapy (IMRT), with the accuracy of computed tomography (CT) scanning technology, all in one machine. This cluster’s operating margins are 13-15%. (Operating margins of multidisciplinary hospitals at Bhavnagar and Ahmedabad are lower than those of CCCs.). Rajkot center was launched in FY19, had ramped up to achieve breakeven in Q3FY20. The Bhavnagar center which was expanded to provide radiation treatment and offers comprehensive cancer care services in FY19 achieve strong scaling-up with good profitability. We expect 10% revenue CAGR over FY20-23, driven by better occupancy and ramp-up at the new centres. Company enjoys strong ARPOB (Average Revenue Per Occupied bed) of around Rs 34000-35000 in Gujarat. East India Region This cluster has three fully-operational centres, one in Cuttack (Odisha), one in Ranchi (Jharkhand) and in Kolkata, which had got operational in Q4 FY19. This cluster accounts for around 8% of oncology revenues. Both units (Cuttack and Ranchi) are mature and enjoy healthy margins. Margin improvement was driven by patient and procedure mix. ARPOB in this region is lowest amongst all clusters; it’s at around Rs 17,500. As a comprehensive cancer center, including offering of Bone-Marrow Transplant (BMT) procedures, this is the only private comprehensive cancer care centers in the region to provide access to advanced cancer care. Maharashtra Cluster HCG had launched Phase II with addition of over 92 beds in Nashik in FY19 and is now one of the largest private cancer care hospital in a non-metro region with advanced technology and comprehensive offerings. The centers in Borivali, Mumbai and in Nagpur, both among the largest new centers launched in the last few years, continues to ramp up in volumes and revenues. The cluster contributed to ~14% of oncology revenues and ARPOB stands at around Rs 27000-28000 per day.

Healthcare Global Enterprises (HCG)
6
South Mumbai center was fully operationalised in FY20, and is one of the most advanced new cancer centers with substantial investment in radiation technology upfront. South Mumbai center is focused on advanced and high-quality care targeting higher-economic segment located in attractive micro-markets within Mumbai. Partnership Model The company has a clinical-engagement programme. It follows a multidisciplinary approach to cancer care across the HCG network, where specialists from various disciplines collaborate to provide the best course of treatment.
To expand its network, HCG enters into various types of partnership arrangements, mostly limited-liability, with other specialist physicians and hospitals. Here, the partners are minority owners. HCG follows an asset-light investment model by leasing space for hospitals. These arrangements include setting up joint-venture companies and revenue- or profit-sharing arrangements where HCG pays a percentage of the revenue or profit from the centers, and/or pays a fixed fee to the partners. Apart from this, in order to cater to growing demand, the company is also exploring opportunity to establish a network of speciality cancer centres in Africa. In addition, it is periodically and selectively evaluating partnering opportunities in countries in the Middle East and South and Southeast Asia. HCG assesses its partners based on a number of factors, including expertise and reputation, patient base, ethical and value systems, access to land or buildings to establish cancer centers and financial and technical capability. Owing to an exclusive agreement with vendors, HCG procures equipment on a three years deferred payment basis. They procure high value medical equipment through vendor finance arrangements which allows them to match capex with cash flows. As per the management, a new HCG centre requires around Rs 60 crore of capex of which 50-60% account for equipment costs, which are leased by the vendor and paid by the center after three years of equipment purchase. The partnership arrangement allows HCG to leverage its partners’ positions and reputations in local communities. These arrangements help reduce the time taken to establish and ramp up the centers as it benefits from established clinical practice and its partners’ patients. Besides, these arrangements facilitate stronger operations in each market it serves. Several partners are surgical oncologists or hospitals in markets where HCG operates.

Healthcare Global Enterprises (HCG)
7
Few of its hospitals and model Cluster wise details (FY20)
Cluster Beds and Centers Avg Occupancy (%) ARPOB (Rs) Revenues (Rs cr) EBITDA Margin (%)
Karnataka 615 beds, 7 Centers 46 36400 365 24
Gujarat 508 beds, 5 Centers 48 35400 304 15
Maharashtra 368 beds, 4 Centers 39 27900 139 NA
Andhra Pradesh 177 beds, 3 Centers 37 32800 78 22
East India 288 beds, 3 Centers 47 17500 83 13
Oncology focus HCG’s CCCs provide complete diagnosis and treatment. Each of them offers, at a single location, comprehensive cancer diagnosis and treatment (including radiation, medical oncology and surgery). The freestanding diagnostic centers and day-care chemotherapy center offer respectively diagnosis and medical oncology services. Karnataka, Gujarat and East India are key clusters for the company. HCG operates most of its CCCs on a lease/rental basis, investing only in medical equipment.
Location Type
Ahmedabad Joint-Venture
Nashik Profit-Sharing
Bengaluru Revenue-Sharing
Cuttack Fee for service and rent paid to partner
Hubli Revenue-Sharing
Chennai Revenue-Sharing
Nagpur Limited-Liability-Partnership (LLP)
Mumbai Limited-Liability-Partnership (LLP)

Healthcare Global Enterprises (HCG)
8
India's drug pricing authority (NPPA) capped margins on 42 anti-cancer drugs at 30% in March 2019. HCG derived 25% of its revenues from its pharmacy (mainly chemotherapy drugs), where margins are higher than corporate average. This is therefore likely to impact blended margins adversely. HCG expects to recoup some of the impact through pricing adjustments in other services but is unlikely to be able to make up for the full impact. Heavy capex phase is drawing to an end HCG has more than doubled its capacity over the last five years and we believe its capex phase is entering the final stage now. Over the next two years, HCG will incur growth capex of Rs 120cr on two additional units (Kochi and Gurugram). HCG has also invested around Rs 25cr in other areas such as Strand Lifesciences, a bioinformatics company (38.2% stake) – adding to the pressure on the balance sheet.
In comparison, HCG incurred capex of Rs 1000cr over FY15-20. This should drop to Rs 100cr in FY21 and Rs 125cr in FY22, including maintenance capex. The only other outlay would be Rs 68cr towards buying out its partner’s stake in Milann, which was completed recently. Fertility Segment (Milann) In 2013, HCG acquired 50.1% equity interest in BACC Healthcare, a fertility center founded by Dr Kamini Rao, with 25 years track record of treating infertility. Led by a team of qualified and experienced fertility specialists, BACC operates such centers under the Milann brand, offering comprehensive reproductive services, including assisted reproduction and fertility preservation, and following a multi-disciplinary and technology focused approach to diagnosis and treatment. Recently, HCG announced the acquisition of the balance stake in BACC for Rs 68.3cr and now HCG holds 100% stake in BACC Healthcare.
Milann continues to be one of the leading IVF brands in India with strong focus on clinical excellence, training and education as well as one of the largest number of successful pregnancies and babies delivered in the last two decades. During the last two years, Milann fertility centers registered 5,481 and 5,688 new patients and performed 2,195 and 2,045 IVF procedures, respectively.
Milann offers solutions to infertility with procedures like IVF, endoscopy and ultra-sound. It follows a technology focused approach in diagnosis and treatment. Milann fertility centers also offer training programmes for fertility specialists and embryologists.
Fertility is growing segment in the Indian healthcare industry due to people’s changing lifestyles. Milann centres contributed ~Rs 70cr to overall revenues which grew by 9% in FY20.

Healthcare Global Enterprises (HCG)
9
Strand Life Sciences – Speciality Diagnostic Company Strand Life Sciences Private Limited is an integrated speciality diagnostics company with end to end capabilities in precision medicine through proprietary analytics, clinical research, access to HCG biorepository, genomic technologies, assay development and validation and a network of laboratories offering a broad menu of tests. HCG had entered into a business transfer agreement, with Strand Life Sciences in January 2018, providing for a business combination of its Triesta Sciences business unit (“Triesta Sciences”), with Strand Life Sciences. Pursuant to the business transfer agreement, the company has transferred its Triesta unit on slump sale basis for 38.2 % stake in Strand Life Sciences. Strand is a Joint Venture of the Company. Strand is a leader in offering bioinformatics solutions and offers proprietary data analytical engines for research and clinical applications for genomic testing. Strand also provides hospital laboratory management services by way of establishing and operating laboratory within the hospital.
Shift from unorganised to organised players We believe structural drivers and strong business models are in place to propel mid-teens overall growth. However, private players in the sector will witness faster growth over next 5 years. The healthcare sector has one of the least penetration of organised players. As organised players become more customer‐centric, outcomes‐driven and prevention‐focused and customers become more brand conscious, organised players will gain market share steadily and grow faster than the overall sector. RoCE expansion for the sector Organised healthcare chain has put up substantial capital expenditure over the past 4-5 years. We believe the aggressive investment phase in the healthcare sector is now coming to an end and most players are now looking to sweat their land banks through brownfield expansion. Over the next 5 years, overall quantum will fall to nearly half, thereby improving asset turnover. As players look to sweat their infrastructure and focus on business mix, the sector’s EBITDA margin will inch up steadily. The net result of improved asset turnover and EBITDA margin will be a directional improvement in the sector’s RoCE. Medical Tourism Apart from the steps taken by the government to ensure inclusive healthcare, medical tourism too can step up the sector’s growth. Given the state‐of‐the‐art private tertiary/quaternary facilities in India and the rising credibility of India’s medical fraternity, people from the world over are travelling to India to benefit from the cost arbitrage (~30‐50% cheaper). Majority of the people being from Russia, Sri Lanka, US, UK, South East Asia and others. During past five years, medical tourism has posted healthy 15-18% cagr and we expect growth

Healthcare Global Enterprises (HCG)
10
momentum to accelerate further and it is expected to post ~20% CAGR over the next five years. Especially in the Oncology where there is vast difference in pricing, people around the globe come to India for the treatment. Medical tourism has seen a setback post Covid 19 pandemic due to travel restrictions. Once these are lifted, we could see these revenues coming back at a faster speed for some time. On an industry wide basis, medical tourism (which accounted for ~10% of India Hospitals segment revenues in FY20) declined to less than 1% for most players in H1FY21. Single specialty hospitals preferred over multi‐specialty for faster scale up/breakeven Over the past decade, growth capital has steadily flocked to more efficacious models that seek to breakeven sooner as well as provide better clinical outcomes for patients. Single specialty hospitals have trumped multi‐specialty hospitals due to numerous inherent advantages. These models are able to scale up better and utilise capital more efficiently due to lower capital requirement and superior therapeutic focus. They avail advantage of economies of scale. They are also able to offer best‐in‐class clinical tertiary/quaternary protocols to patients due to the vast knowledge repository that they are able to create over time on a specific specialty. We like HCG’s single specialty model which focuses on addressing high potential therapies like oncology and fertility. The company’s recent ventures have turned profitable within 18 months.
Government Policies on Indian Healthcare Sector The government has made tremendous capital investment for advanced diagnostic facilities for its citizens. Pradhan Mantri Jan Arogya Yojana (PMJAY) was launched in Sep-2018, aiming to provide health insurance worth Rs 5,00,000 (US$ 7120) to over 100 million families every year, and is already implemented in several states. Under the Ayushman Bharat-Pradhan Mantri Jan Arogya Yojana (PMJAY), nearly 1.5 lakh primary health centers will be transformed as health and wellness centers by 2022. These centers will be equipped to provide treatment and care for several diseases such as high blood pressure, diabetes, cancer, and old age-related illnesses. The program has been allocated Rs 6,429 core (US$ 920mn) under Union Budget 2020-21.
Healthcare in India: Under‐Served, Under‐Consumed India’s demographic, economic and cultural factors render it a perfect ecosystem for a large and quickly growing goldmine for healthcare producers and providers. It is the second most populous country in the world and predicted to become the most populous in the future. With bulk of the populace living in sub‐optimal sanitation conditions, without safe drinking water and in a largely tropical climate, communicable diseases will keep driving demand. Moreover, demand is expected to burgeon as high number of citizen age, income levels

Healthcare Global Enterprises (HCG)
11
rise, non‐communicable lifestyle ailments increase, healthcare awareness improves, health insurance penetration deepens, medical tourism increases and a number of drug‐resistant diseases develop. Advocacy of healthcare as a basic human right is on the rise in India and a potent consumption driver. The cancer treatment cost mainly depends upon the type of cancer across the globe. India is the country where treatment packages are reasonable in comparison. The government’s expenditure on the health sector has grown to 1.6% of the GDP in FY20 from 1.3% in FY16. Govt. has a target to increase its public health spending to 2.5% of GDP by FY25 and healthcare’s share of GDP is expected to rise by 19.7% by 2027. The patterns of cancer are dominated by a high burden of tobacco-related head and neck cancers, particularly oral cancer, in men and of cervical cancer in women in India. These cancer types are associated with lower socioeconomic status. Moreover, the burden of cancer types, such as breast cancer and colorectal cancer, associated with overweight and obesity, lower levels of physical activity and sedentary lifestyles is increasing and these cancer types are associated with higher socioeconomic status. The stages of diagnosis in India are generally more delayed compared to other countries, with only 20-30% of cancers being diagnosed in early stages (I & II) – less than half of what is seen in countries like the US, UK and China. Limited awareness and lack of healthcare facilities / infrastructure are the major contributors to relatively late stage diagnosis and low reported incidences. As a result, cancer related mortality rates in India are much higher than in developed countries as well as most upper / low middle income countries. Company Background HCG was founded in 1998 by a group of oncologists led by Dr. B S Ajaikumar – one of the leading oncologists in the country, with close to 40 years of experience in the field of cancer care. Healthcare Global is a niche healthcare provider with a primary focus on oncology and some presence in the fertility segment. The company operates 23 comprehensive oncology centers and is the leading oncology chain in India with 2000+ operational beds. HCG has expanded its cancer care centers across the country through a “Hub and Spoke” model – its center of excellence (COE) in Bengaluru serves as the Hub to its other cancer centers. Karnataka, Gujarat, Maharashtra and East India are the key clusters for the company. It has also expanded to new geographies that have ramped up well. HCG also operates four multispecialty hospitals and has

Healthcare Global Enterprises (HCG)
12
50.1% stake in Milann, a fertility clinic chain run by Dr. Kamini Rao (a leading gynecologist). Recently, HCG acquired the balance stake and now owns 100% in Milann. Company derived around 80% of its revenues from oncology, 14% from multi-specialty and the balance from Milann.
Board of Directors of the Company on Nov 27, 2020 has approved appointment of Mr. Meghraj Arvindrao Gore as CEO and KMP of the Company, effective from Feb 01, 2021. Mr. Gore in his previous role, served as Chief Executive Officer – Southern Region of Apollo Hospitals Enterprise Limited, and was responsible for overall business portfolio of the largest region with 15 facilities in the states of Tamil Nadu & Andhra Pradesh. Key Concerns Cancer care business is highly capital intensive and new cancer centers require a long gestation period to break even, as a result of which the
company might not be able to realise profit corresponding to the amount spent in a timely manner. HCG’s one of the most profitable region is its Center of excellence-Bangalore cluster. Any adverse economic, regulatory or other development in this
region can impact overall profitability of the company Any adverse government policy intervention (viz. price caps, mandatory participation in govt. schemes etc.) Any execution hiccups that may lead to slower than expected ramp up in new hospitals Govt. policies related to price curb in the medicine/surgeries/treatments. As on FY20, its debt: equity was at ~3x however capital infusion by CVC Capital has provided liquidity and thus leverage has got reduced
significantly. Company is dependent upon its existing promoters, partners and senior management team. Loss of any of them would be a risk. Given the higher capex intensity of Cancer care centers vs. tertiary care hospitals, HCG’s return ratios could remain subdued for some more years. Milann and Strand Lifesciences are currently a drag on the overall performance of the company. Timely decision on turning around or restructuring
these businesses may be necessary to ensure overall consistent growth of HCG.
Peer Comparison
Company CMP Mcap (Rs cr) Revenues (Rs cr) Operating Profit (Rs cr) PAT (Rs cr) RoE (%) EV/EBITDA (x) P/B (x)
Apollo Hospitals* 2360 32840 13472 1940 594 15.8 18.5 8.2
Narayana Hrudayalaya* 387 7914 3472 508 171 15.2 16.8 5.5
HCG 159 1987 1277 220 -26 -3.4 12.7 2.7
Fortis Healthcare* 152 11490 5070 784 229 3.8 16.3 1.5 Source: Company, HDFC sec Research, *Bloomberg Consensus FY22E Consolidated
Healthcare Global Enterprises (HCG)
13
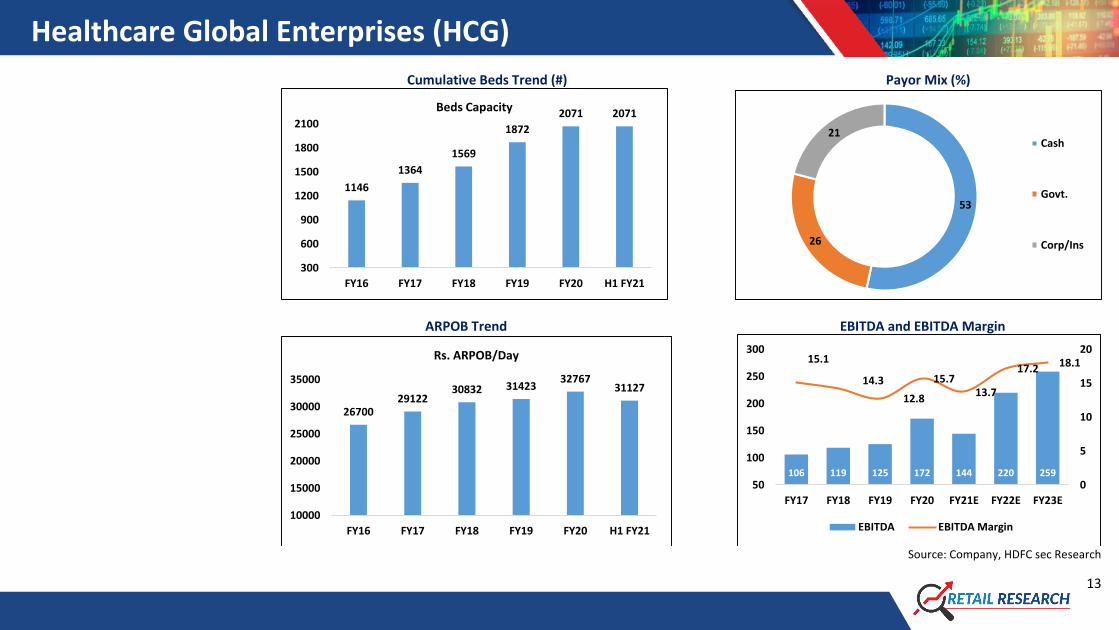
Cumulative Beds Trend (#) Payor Mix (%)
ARPOB Trend EBITDA and EBITDA Margin
Source: Company, HDFC sec Research
1146
1364
1569
1872
2071 2071
300
600
900
1200
1500
1800
2100
FY16 FY17 FY18 FY19 FY20 H1 FY21
Beds Capacity
53
26
21Cash
Govt.
Corp/Ins
2670029122
30832 3142332767
31127
10000
15000
20000
25000
30000
35000
FY16 FY17 FY18 FY19 FY20 H1 FY21
Rs. ARPOB/Day
106 119 125 172 144 220 259
15.1
14.3
12.8
15.713.7
17.2 18.1
0
5
10
15
20
50
100
150
200
250
300
FY17 FY18 FY19 FY20 FY21E FY22E FY23E
EBITDA EBITDA Margin

Healthcare Global Enterprises (HCG)
14
Income Statement (Consolidated)
Balance Sheet (Rs Cr) FY18 FY19 FY20 FY21E FY22E FY23E
As at March FY18 FY19 FY20 FY21E FY22E FY23E
Total Revenues 831 979 1096 1052 1277 1434
SOURCE OF FUNDS
Growth (%) 18.7 17.8 12 -4 21.5 12.3
Share Capital 87 88 89 125 125 125
Operating Expenses 712 853 923 907 1057 1175
Reserves 428 389 293 660 614 604
EBITDA 119 125 172 144 220 259
Shareholders' Funds 515 477 381 785 740 729
Growth (%) 12 5.6 37.5 -16.3 52.5 17.8
Long Term Debt 372 517 1139 934 859 769
EBITDA Margin (%) 14.3 12.8 15.7 13.7 17.2 18.1
Net Deferred Taxes 4 4 7 6 8 9
Depreciation 71 85 148 161 174 185
Long Term Provisions & Others 130 63 112 76 84 91
EBIT 47 40 24 -17 46 74
Minority Interest 64 46 39 29 29 29
Other Income 13 7 7 9 10 12
Total Source of Funds 1085 1106 1677 1829 1720 1626
Interest expenses 42 70 137.6 115 97 91
APPLICATION OF FUNDS
PBT 18 -22 -109 -120 -43 -7
Net Block 892 1013 1583 1501 1437 1332
Tax 10 -3 6 -25 -5 -3
Goodwill 109 109 109 109 109 109
Share of Profit/Loss of Ass. 0 6 19 18 20 25
Deferred Tax Assets 44 82 108 113 121 129
PAT 17 -25 -107 -94 -26 14
Long Term Loans & Advances 178 175 149 168 181 197
Growth (%) -24.8 - 329.4 -11.3 -72.7 -
Total Non-Current Assets 1224 1380 1950 1891 1848 1768
EPS 2 -2.8 -12 -7.5 -2.1 1.2
Inventories 24 27 23 29 32 35
Trade Receivables 128 157 186 184 217 236
Short term Loans & Advances 3 14 5 6 8 9
Cash & Equivalnts 29 21 32 225 144 134
Other Current Assets 36 54 57 61 64 67
Total Current Assets 220 273 304 506 465 481
Short-Term Borrowings 2 50 115 100 88 80
Trade Payables 142 153 154 149 170 193
Other Current Liabs & Provisions 209 337 298 308 325 338
Short-Term Provisions 6 7 9 10 11 12
Total Current Liabilities 359 547 577 568 594 623
Net Current Assets -139 -275 -273 -62 -129 -141
Total Application of Funds 1085 1106 1677 1829 1720 1626
Healthcare Global Enterprises (HCG)
15
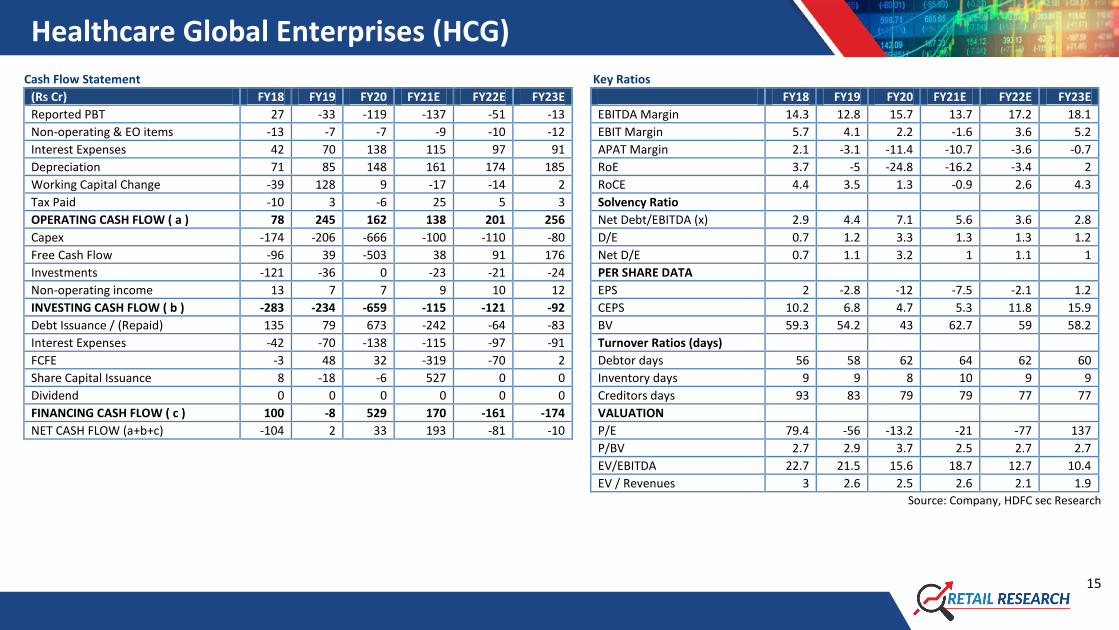
Cash Flow Statement
Key Ratios (Rs Cr) FY18 FY19 FY20 FY21E FY22E FY23E
FY18 FY19 FY20 FY21E FY22E FY23E
Reported PBT 27 -33 -119 -137 -51 -13
EBITDA Margin 14.3 12.8 15.7 13.7 17.2 18.1
Non-operating & EO items -13 -7 -7 -9 -10 -12
EBIT Margin 5.7 4.1 2.2 -1.6 3.6 5.2
Interest Expenses 42 70 138 115 97 91
APAT Margin 2.1 -3.1 -11.4 -10.7 -3.6 -0.7
Depreciation 71 85 148 161 174 185
RoE 3.7 -5 -24.8 -16.2 -3.4 2
Working Capital Change -39 128 9 -17 -14 2
RoCE 4.4 3.5 1.3 -0.9 2.6 4.3
Tax Paid -10 3 -6 25 5 3
Solvency Ratio
OPERATING CASH FLOW ( a ) 78 245 162 138 201 256
Net Debt/EBITDA (x) 2.9 4.4 7.1 5.6 3.6 2.8
Capex -174 -206 -666 -100 -110 -80
D/E 0.7 1.2 3.3 1.3 1.3 1.2
Free Cash Flow -96 39 -503 38 91 176
Net D/E 0.7 1.1 3.2 1 1.1 1
Investments -121 -36 0 -23 -21 -24
PER SHARE DATA
Non-operating income 13 7 7 9 10 12
EPS 2 -2.8 -12 -7.5 -2.1 1.2
INVESTING CASH FLOW ( b ) -283 -234 -659 -115 -121 -92
CEPS 10.2 6.8 4.7 5.3 11.8 15.9
Debt Issuance / (Repaid) 135 79 673 -242 -64 -83
BV 59.3 54.2 43 62.7 59 58.2
Interest Expenses -42 -70 -138 -115 -97 -91
Turnover Ratios (days)
FCFE -3 48 32 -319 -70 2
Debtor days 56 58 62 64 62 60
Share Capital Issuance 8 -18 -6 527 0 0
Inventory days 9 9 8 10 9 9
Dividend 0 0 0 0 0 0
Creditors days 93 83 79 79 77 77
FINANCING CASH FLOW ( c ) 100 -8 529 170 -161 -174
VALUATION
NET CASH FLOW (a+b+c) -104 2 33 193 -81 -10
P/E 79.4 -56 -13.2 -21 -77 137
P/BV 2.7 2.9 3.7 2.5 2.7 2.7
EV/EBITDA 22.7 21.5 15.6 18.7 12.7 10.4
EV / Revenues 3 2.6 2.5 2.6 2.1 1.9
Source: Company, HDFC sec Research
Healthcare Global Enterprises (HCG)
16
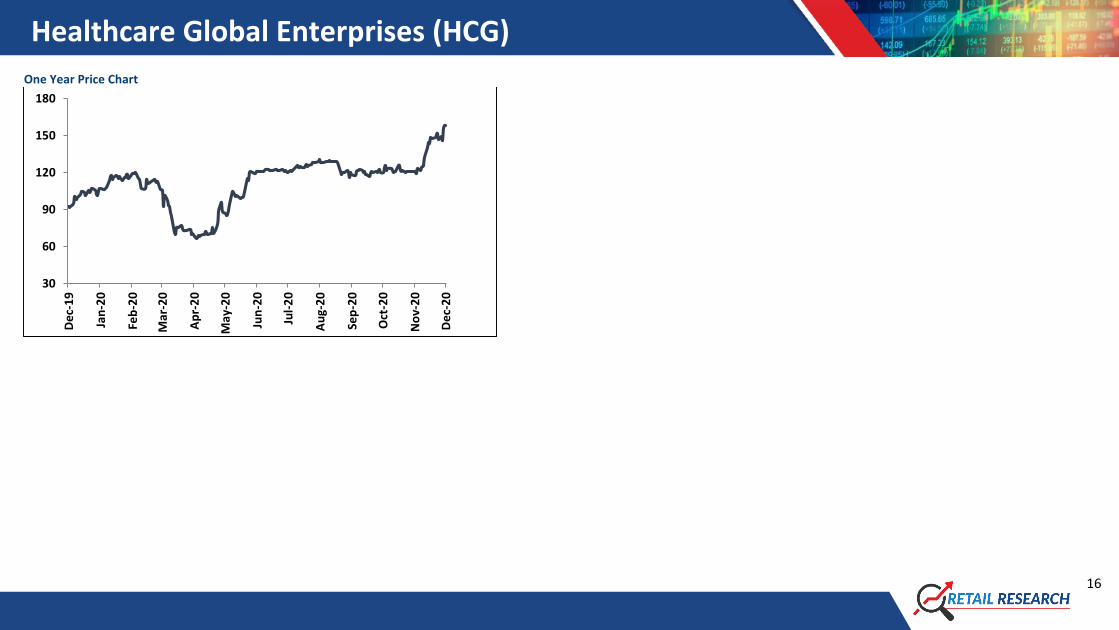
One Year Price Chart
30
60
90
120
150
180
De
c-1
9
Jan
-20
Feb
-20
Mar
-20
Ap
r-2
0
May
-20
Jun
-20
Jul-
20
Au
g-2
0
Sep
-20
Oct
-20
No
v-2
0
De
c-2
0

Healthcare Global Enterprises (HCG)
17
Disclosure:
I, Kushal Rughani, MBA author and the name subscribed to this report, hereby certify that all of the views expressed in this research report accurately reflect our views about the subject issuer(s) or securities. HSL has no material adverse disciplinary history as on the date of publication of this report. We also
certify that no part of our compensation was, is, or will be directly or indirectly related to the specific recommendation(s) or view(s) in this report.
Research Analyst or his/her relative or HDFC Securities Ltd. does not have any financial interest in the subject company. Also Research Analyst or his relative or HDFC Securities Ltd. or its Associate may have beneficial ownership of 1% or more in the subject company at the end of the month immediately
preceding the date of publication of the Research Report. Further Research Analyst or his relative or HDFC Securities Ltd. or its associate does not have any material conflict of interest.
Any holding in stock - No
HDFC Securities Limited (HSL) is a SEBI Registered Research Analyst having registration no. INH000002475.
Disclaimer:
This report has been prepared by HDFC Securities Ltd and is solely for information of the recipient only. The report must not be used as a singular basis of any investment decision. The views herein are of a general nature and do not consider the risk appetite or the particular circumstances of an individual
investor; readers are requested to take professional advice before investing. Nothing in this document should be construed as investment advice. Each recipient of this document should make such investigations as they deem necessary to arrive at an independent evaluation of an investment in securities of
the companies referred to in this document (including merits and risks) and should consult their own advisors to determine merits and risks of such investment. The information and opinions contained herein have been compiled or arrived at, based upon information obtained in good faith from sources
believed to be reliable. Such information has not been independently verified and no guaranty, representation of warranty, express or implied, is made as to its accuracy, completeness or correctness. All such information and opinions are subject to change without notice. Descriptions of any company or
companies or their securities mentioned herein are not intended to be complete. HSL is not obliged to update this report for such changes. HSL has the right to make changes and modifications at any time.
This report is not directed to, or intended for display, downloading, printing, reproducing or for distribution to or use by, any person or entity who is a citizen or resident or located in any locality, state, country or other jurisdiction where such distribution, publication, reproduction, availability or use would be
contrary to law or regulation or what would subject HSL or its affiliates to any registration or licensing requirement within such jurisdiction. If this report is inadvertently sent or has reached any person in such country, especially, United States of America, the same should be ignored and brought to the
attention of the sender. This document may not be reproduced, distributed or published in whole or in part, directly or indirectly, for any purposes or in any manner.
Foreign currencies denominated securities, wherever mentioned, are subject to exchange rate fluctuations, which could have an adverse effect on their value or price, or the income derived from them. In addition, investors in securities such as ADRs, the values of which are influenced by foreign currencies
effectively assume currency risk. It should not be considered to be taken as an offer to sell or a solicitation to buy any security.
This document is not, and should not, be construed as an offer or solicitation of an offer, to buy or sell any securities or other financial instruments. This report should not be construed as an invitation or solicitation to do business with HSL. HSL may from time to time solicit from, or perform broking, or other
services for, any company mentioned in this mail and/or its attachments.
HSL and its affiliated company(ies), their directors and employees may; (a) from time to time, have a long or short position in, and buy or sell the securities of the company(ies) mentioned herein or (b) be engaged in any other transaction involving such securities and earn brokerage or other compensation or
act as a market maker in the financial instruments of the company(ies) discussed herein or act as an advisor or lender/borrower to such company(ies) or may have any other potential conflict of interests with respect to any recommendation and other related information and opinions.
HSL, its directors, analysts or employees do not take any responsibility, financial or otherwise, of the losses or the damages sustained due to the investments made or any action taken on basis of this report, including but not restricted to, fluctuation in the prices of shares and bonds, changes in the currency
rates, diminution in the NAVs, reduction in the dividend or income, etc.
HSL and other group companies, its directors, associates, employees may have various positions in any of the stocks, securities and financial instruments dealt in the report, or may make sell or purchase or other deals in these securities from time to time or may deal in other securities of the companies /
organizations described in this report.
HSL or its associates might have managed or co-managed public offering of securities for the subject company or might have been mandated by the subject company for any other assignment in the past twelve months.
HSL or its associates might have received any compensation from the companies mentioned in the report during the period preceding twelve months from t date of this report for services in respect of managing or co-managing public offerings, corporate finance, investment banking or merchant banking,
brokerage services or other advisory service in a merger or specific transaction in the normal course of business.
HSL or its analysts did not receive any compensation or other benefits from the companies mentioned in the report or third party in connection with preparation of the research report. Accordingly, neither HSL nor Research Analysts have any material conflict of interest at the time of publication of this
report. Compensation of our Research Analysts is not based on any specific merchant banking, investment banking or brokerage service transactions. HSL may have issued other reports that are inconsistent with and reach different conclusion from the information presented in this report.
Research entity has not been engaged in market making activity for the subject company. Research analyst has not served as an officer, director or employee of the subject company. We have not received any compensation/benefits from the subject company or third party in connection with the Research
Report.
HDFC securities Limited, I Think Techno Campus, Building - B, "Alpha", Office Floor 8, Near Kanjurmarg Station, Opp. Crompton Greaves, Kanjurmarg (East), Mumbai 400 042 Phone: (022) 3075 3400 Fax: (022) 2496 5066 Compliance Officer: Binkle R. Oza Email:
[email protected] Phone: (022) 3045 3600
SEBI Registration No.: INZ000186937 (NSE, BSE, MSEI, MCX) |NSE Trading Member Code: 11094 | BSE Clearing Number: 393 | MSEI Trading Member Code: 30000 | MCX Member Code: 56015 | IN-DP-372-2018 (CDSL, NSDL) | CDSL DP ID: 12086700 | NSDL DP ID: IN304279 | AMFI
RegNo.ARN -13549 | PFRDA Reg. No - POP 11092018 | IRDA Corporate Agent Licence No.CA0062 | Research Analyst Reg. No. INH000002475 | Investment Adviser: INA000011538 | CIN-U67120MH2000PLC152193
Mutual Funds Investments are subject to market risk. Please read the offer and scheme related documents carefully before investing.